
Assessing the Performance of State Water Utilities in Nigeria: Towards Achieving the Sustainable Development Goal on Drinking Water

School of Architecture, Building, and Civil Engineering, Loughborough University, Loughborough LE11 3TU, UK
*
Author to whom correspondence should be addressed.
Sustainability 2024, 16(1), 59; https://doi.org/10.3390/su16010059
Submission received: 26 October 2023
/
Revised: 11 December 2023
/
Accepted: 15 December 2023
/
Published: 20 December 2023
(This article belongs to the Special Issue Sustainable Water Resources Management and Water Supply)
Abstract
:The Millennium Development Goals (MDGs) on drinking water were reported to have been achieved five years earlier than the target date of 2015 in all the continents, except Africa and Oceania. This study assessed the performance of selected state water utilities in Nigeria in Africa over a period of years to determine improvements, if any, in their service coverage and demand gap in meeting the ambitious SDG target 6.1, which aims to achieve sustainable drinking water for all by 2030. Employing the key performance indicator (KPI) methodology, encompassing operational and maintenance efficiency, investment efficiency, and financial sustainability, this research unveils a widening disparity between water supply and demand gap. Alarming is the revelation that the revenue from water sales falls short of covering operation and maintenance costs, rendering these utilities financially unsustainable. This underperformance of state water utilities signals a formidable barrier to Nigeria’s prospects of attaining the Sustainable Development Goal (SDG) target 6.1, thereby jeopardizing the nation’s ability to ensure universal and affordable access to safe drinking water by 2030.
1. Introduction
Water infrastructure operations and maintenance (O&M) pose a significant challenge in the water supply sector, affecting both high-income countries (HICs) and low- and middle-income countries (LMICs). In LMICs, there is the additional hurdle of expanding and sustaining piped water supply to the increasing population. State water utilities (SWUs) encounter difficulties in maintaining aging pipe networks amidst increasing financial constraints, leading to issues related to service quality and reliability [1]. The public is increasingly concerned about the declining performance of LMIC SWUs in delivering water supply [2,3,4,5], prompting a closer examination and a heightened interest in reforming their operations [6,7,8].
The global Millennium Development Goals (MDGs) pertaining to water accessibility were achieved five years ahead of the 2015 deadline across all continents, with the exception of Africa and Oceania. This made the United Nations unanimously adopt the 2030 Agenda for Sustainable Development in September 2015, known as the Sustainable Development Goals (SDGs) [9,10]. However, as we approach the midpoint of the SDGs’ implementation, it becomes increasingly apparent that the specific SDG targets 6.1 and 6.2, focused on ensuring access to safe drinking water, are unlikely to be realized for Africa, including Nigeria, by the year 2030 [11].
The data reveal a significant gap in access to safe drinking water estimated at 39%, with even lower figures for safely managed sanitation (27%) and basic hygiene (37%) in Africa [12,13]. Achieving SDG targets for drinking water and sanitation in Africa, particularly Nigeria, demands more effective collaboration from all stakeholders. The key challenges include maintaining the current coverage levels against the rapid urbanization and addressing the backlog of rural areas lacking safe drinking water and basic sanitation. Nigeria, being among the nine countries contributing to half of the world’s population between 2010 and 2050, plays a crucial role in this scenario [14].
This study aims to evaluate the historical performance of SWUs in Nigeria, in terms of their operation and maintenance (O&M) and service coverage, with a focus on achieving the SDG target on drinking water. The key performance indicator (KPI) method, encompassing efficiency of operations and maintenance (O&M), efficiency of investments, and financial sustainability, was employed. Financial sustainability is crucial for any improvements or deteriorations in O&M to realize the SDG target for universal and equitable access to safe and affordable drinking water by 2030. The findings indicate a widening gap between the water demand and supply. Most SWUs in Nigeria lack efficiency and financial sustainability to deliver a reliable water supply to the served population. This situation implies a significant challenge for Nigeria and Africa to attain the Sustainable Development Goal (SDG) target 6.1 of ensuring universal and equitable access to safe and affordable drinking water for all by 2030.
2. Literature Review
2.1. MDG Target on Safe Drinking Water
Low- and middle-income countries (LMICs) frequently lack sewerage in urban areas and their water utilities offer only water services, in contrast to high-income countries (HICs) like England and Wales. The LMICs, constituting 76% of the world’s population and an important constituent of the global economy [4,15,16], fell short of halving the population without access to safe drinking water and sanitation [17]. In Sub-Saharan Africa, the lack of access to safe drinking water increased by 23%, and basic sanitation access decreased by 30% between 1990 and 2015 [18]. Nigeria is among the nine countries projected to represent half of the world’s population between 2010 and 2050 [12]. However, Africa faces challenges in meeting the Sustainable Development Goal (SDGs), requiring a twelvefold increase in the current rate of progress [11]. Challenges include expanding and sustaining water services amid population growth, rapid urbanization, and financial constraints. The COVID-19 pandemic further exacerbates the financing situation for water infrastructure [11].
2.2. The Classification of the Global Economy into Categories
The expansion and maintenance of water services necessitate the development of new networks, alongside the preservation of existing ones, requiring a substantial and regular capital influx. Low- and middle-income countries (LMICs) like Nigeria struggle with insufficient investments [19] for infrastructure upkeep amid tightening financial constraints, impacting service quality, service reliability, and cost recovery [1,20]. Public, professional, and financial institutions, including the World Bank, are increasingly concerned about the failure of the state water utilities in LMICs to provide water supply [1,2,3], prompting heightened scrutiny and a push for operational reforms [21,22].
In helping countries overcome poverty and in response to changes in the global economy, the World Bank classifies nations into four categories each year based on the size, population, and income. The four categories are high-income countries (HICs), upper-middle-income countries (UMICs) with a gross national income (GNI) per capita of USD 4096 to USD 12,695, lower-middle-income countries (LMICs) with a GNI per capita of USD 1046 to USD 4095, and low-income countries (LICs) [23]. Nigeria with a population of 218,541,212 and a GNI of USD 2080 from 2021–2022 [24] is within the LMICs.
Nigeria’s population data are surrounded by controversies. The last credible population figure is that of the 2006 census conducted by the National Population Commission (NPC), which is 140,431,790 [25,26]. Nigeria relies on data from external sources, such as the World Health Organization/United Nations International Children Emergency Fund (WHO/UNICEF) and United Nations Development Programme (UNDP) due to gaps in authentic information available to the public. The absence of data influences key performance indicators (KPIs) and the impact assessment planning for the state water utilities, contributing to challenges like water demand gaps. The United Nations estimates Nigeria’s population at around 206.1 million in 2020 [27], making it one of Africa’s most populous countries. This constitutes 15.1% of the African population that is put at 1,360,677,000 and represents 0.026% of the world population, put at 7.794 billion as of 2020 [28]. Projection suggests a potential rise of Nigeria’s population to 401.31 million by 2050, and over 728 million by 2100, if current growth rates persist [27].
The justification for the choice of Nigeria is the combination of the following reasons. LMICs such as Nigeria face heightened water supply challenges driven by a rising demand for services fueled by rapid population growth and increasing urbanization [29]. Despite a projected slight slowdown in growth, Nigeria continues to outpace many countries of comparable size, with a current annual rate of 2.62% [27].
2.3. Performance Assessment
The performance assessment of water supply service has been the focal point in numerous studies [8,30,31,32], primarily concentrating on high-income countries (HICs) rather than low- and middle-income countries (LMICs), therefore creating a notable literature gap [8]. Wren-Lewis [33] highlights the importation of models and approaches from HICs to LMICs, while Centrulo et al. [8] asserts that studies on LMIC water utilities often rely on HIC-based assessments, overlooking specific LMIC aspects like universal access, inequality in service access, and water quality issues [34]. Sen and Kansal [34] further emphasize the oversight of LMIC-specific factors, including the need for access to services for all, problems related to inequality in access to services, and poor water quality, which have been ignored in the process. Also, elevated levels of water losses and the poor quality of available data should be accounted for in the performance evaluation process.
Over the last two decades, the pace of studies assessing water utilities efficiency in LMICs has been slow. This has been attributed to insufficient data for performance analysis [35]. Benchmarking performance between utilities can enhance efficiency; inconsistencies in benchmarking practices may, however, hinder improvement pathways [32]. Non-parametric benchmarking models, particularly data envelopment analysis (DEA), are commonly used for this purpose [31].
However, the international benchmarking networking (IBNET), which is designed for collecting data about utility performance, mostly in high-income countries (HICs), is unsuitable for assessing water utilities in LMICs. The integrated national data system which is designed to build data production, protection, and use into planning and decision making for development is non-existent in most LMICs like Nigeria. Key performance indicators (KPIs) are defined as a measure of efficiency and effectiveness of the delivery of the services by a water service provider, which results from the combination of several variables [36]. Communicating the implications of quantitative studies to non-technical decision makers and political office holders, who implement and determine public policy, is a challenge [30]. KPIs enable those who determine and implement public policy to track and identify the areas requiring changes to operational procedures, maintenance, and capacity investments [30].
This study aims to assess Nigerian state water utilities’ performance during the initial five years of the SDG era, focusing on narrowing the water demand gap and improving water supply coverage to meet the SDG drinking water target by 2030. Utilizing the KPI method, encompassing operational and maintenance efficiency, investment efficiency, and financial sustainability, the study benchmarks three major water utilities in Nigeria [37], aligning with Tyman and Kingdom’s suggestions [37] and supported by Kalulua and Hoko [1] and Alegre et al. [35,38,39]. A rigorous examination of financial sustainability in the context of Nigerian water utilities is crucial for informed decision making and improving water services in countries like Nigeria.
As a key part of its contributions, the study employs 2006 population figures and growth rates to project current and future populations in the study areas, determining water demand gaps between 2015 and 2030. The findings suggest that five years into the SDG implementation, Nigeria is unlikely to meet SDG targets 6.1 and 6.2 for safe drinking water in Africa by 2030.
3. Study Area
3.1. Overview of Water Supply in Nigeria
Nigeria, operating as a federal republic, features a three-tiered government structure comprising the federal government and the state governments, encompassing thirty-six states and the Federal Capital Territory (FCT), and the local government areas [40]. According to decree 101 of 1973 [40], the thirty-six states and the FCT are mandated to oversee their public water supply schemes through state water utilities (SWUs). State government efforts are often complemented by local governments, particularly in supplying water to rural areas within their districts [41]. Notably, external partners like the World Bank, African Development Bank (ADB), US Aid (USAID), the European Union (EU), Japan International Cooperation Agency (JICA), UNICEF, WaterAid, and Action Against Hunger play crucial roles in the water supply and sanitation sector.
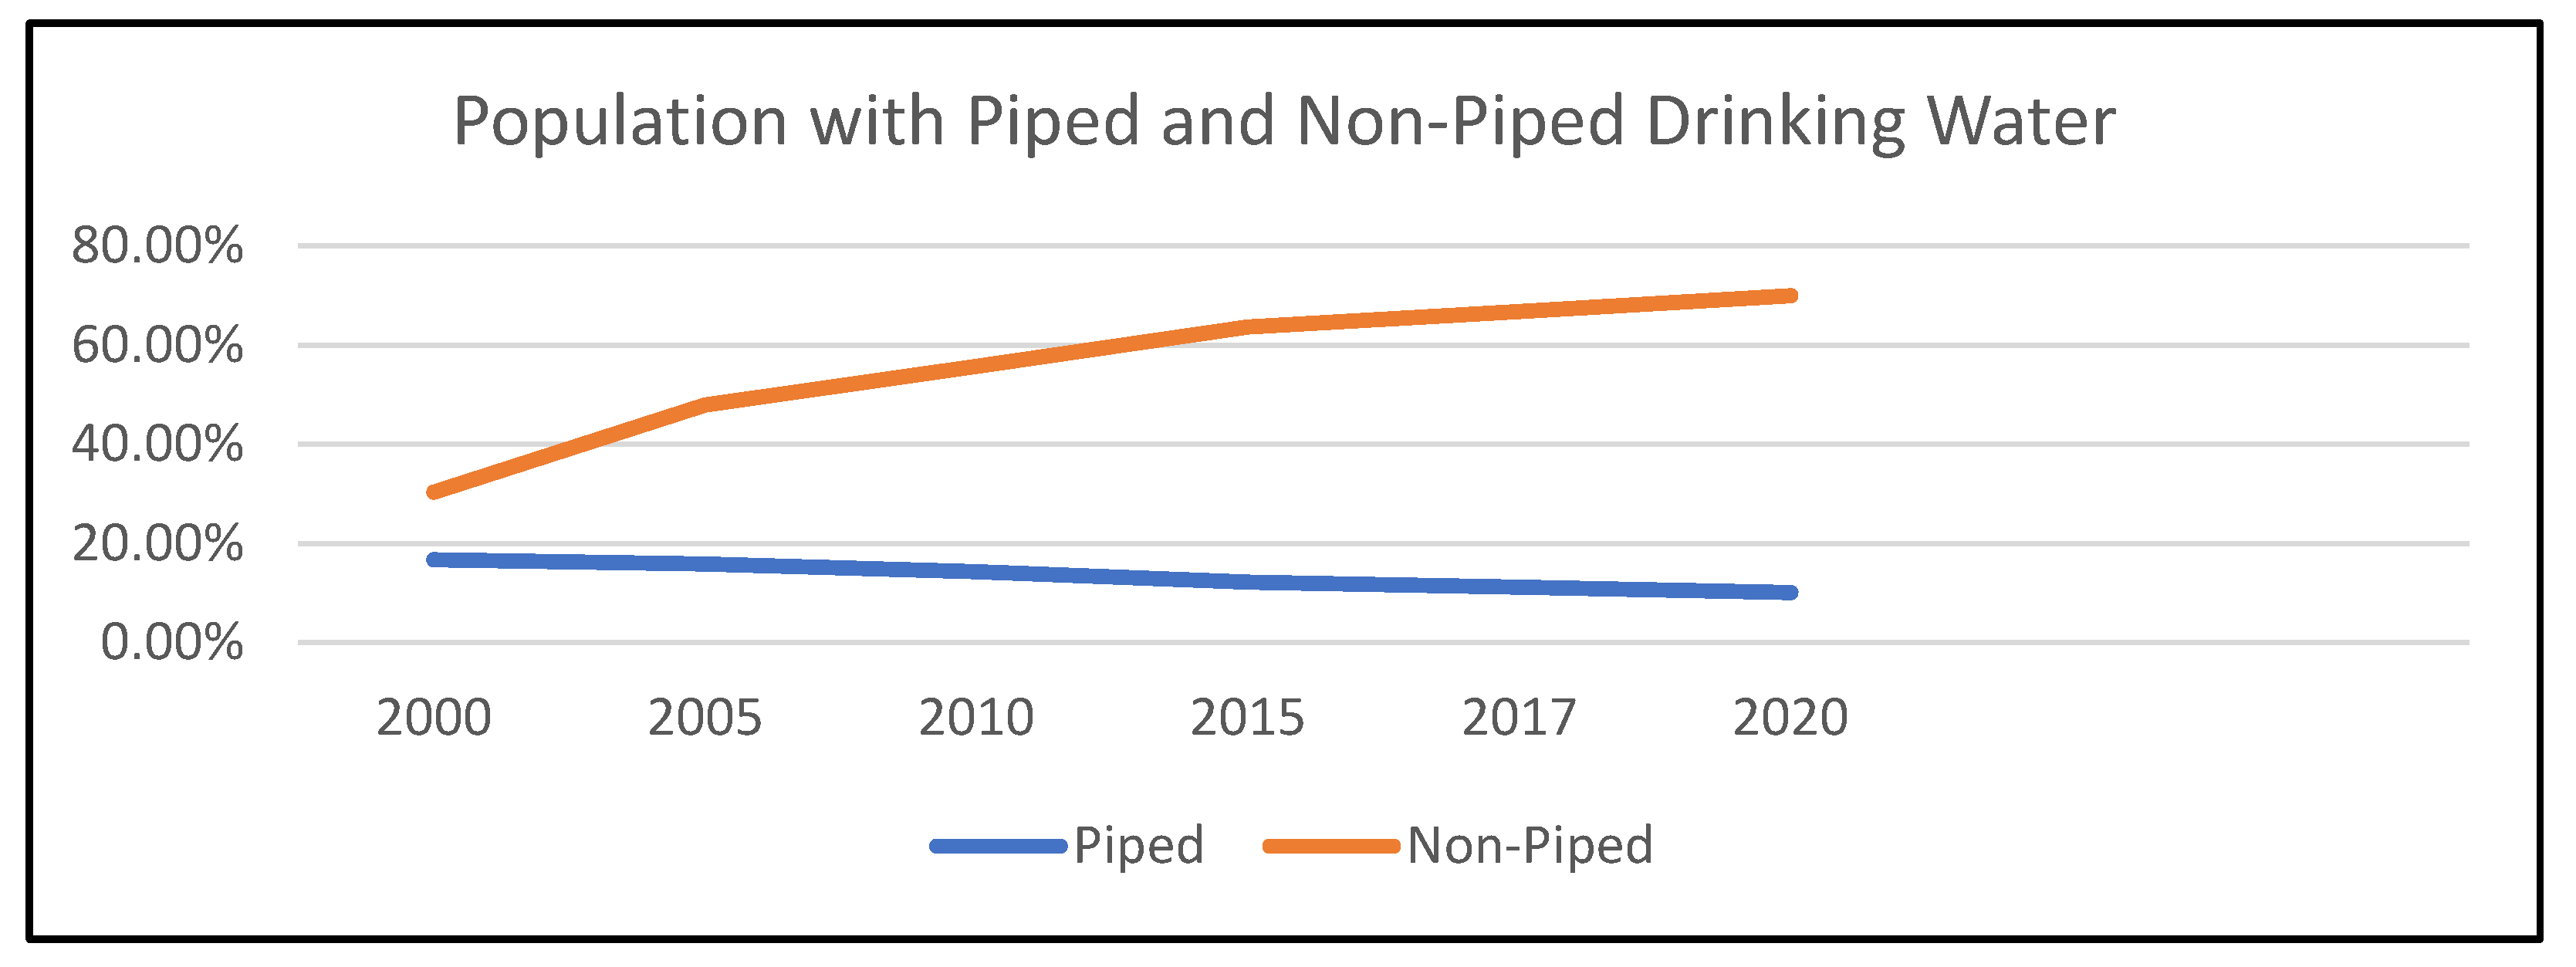
Over the past two decades, the percentage of the population with access to basic drinking water increased from 30.34% in 2000 to 70% in 2020, while those with piped water supply decreased from 16.76% in 2000 to 10.1% in 2020 [9]. Similarly, the percentage of the population with access to basic sanitation rose from 28.7% in 2000 to 42.7% in 2020, exhibiting an increasing annual rate of 2.19% in 2020 [9]. Despite these improvements, 60–70% of the population (trend illustrated in Figure 1) currently lacks either piped water or wastewater services, leaving 55–60 million people still receiving such services [9].
In rural areas, approximately 49% of the population has access to safe water, with 30% having improved sanitation facilities. Meanwhile, about 72% of the urban population enjoys reliable water supply meeting acceptable quality standards, while sanitation coverage is estimated at 44% [42]. The majority of consumers receiving piped water services are served by state water utilities, all of which are presently owned by the respective state governments. To meet the Sustainable Development Goal (SDG) target 6 of achieving universal coverage by 2030, Nigeria’s water and sanitation sector must enhance current progress to broaden access to both water supply and sanitation.
The rationale for evaluating the three selected state water utilities (SWUs) lies in their representation of the country’s three geographical regions: north, south, and east. These chosen SWUs have undergone reform programs funded by the World Bank through the National Urban Water Sector Reform Project (NUWSRP) from 2003 to 2016, amounting to USD 80 million and USD 299 million, respectively. The primary objective of these reforms is to enhance the dependability of safe water supply, expand access to piped water networks, and enhance the financial sustainability of the SWUs [43].
3.2. Case Study 1: Lagos Water Corporation (LWC)
Lagos, the commercial hub and economic capital of Nigeria and Africa’s largest city, faces significant urbanization challenges, evident in its growth rate and population trends [44]. From the last two census figures in Nigeria in 1991 and 2006, the population, recorded as 5,725,116 in 1991 and 9,113,605 in 2006, is projected to reach 19,780,997 by 2030, with an annual growth rate of 3.25% [25]. The Lagos Water Corporation (LWC) originated as the Lagos State Water Board in 1979, became a corporation in 1984, and later transformed into LWC under the Lagos Water Law number 14 in 2004 [45].
It boasts a total installed production capacity of 936,470 cubic meters per day (m3/d) [45], primarily sourced from major surface water treatment plants like Adiyan (318,200 m3/d), Iju (204,570 m3/d), Isashi (18,180 m3/d), and Otta-Ikusi (18,180 m3/d). It has a combined production capacity of 559,160 m3/d, along with contributions from ground water treatment plants such as 31Mini (305,480 m3/d) and 16 micro (71,830 m3/d) waterworks [43,45].
3.3. Case Study 2: Cross River State Water Board Limited (CRSWBL)
Calabar serves as the capital of Cross River State and holds significance as Nigeria’s focal point for the tourism industry. Historically, it functioned as the colonial capital of Nigeria [29]. The Cross River State Water Board Limited (CRSWBL), initially established under Edict No. 13 of 1975 as a department within the State Ministry of Works and Housing [46], is currently a state-government-owned entity transformed into a limited liability company. Its operations, however, face notable interference and influence from the state government. The CRSWBL boasts a total installed production capacity of 160,000 cubic meters per day (m3/d), distributed across the major surface water treatment plants in Calabar/Odukpani (105,000 m3/d), Ugep/Ediba (46,000 m3/d), and Akamkpa (9000 m3/d). As of 2016, the collective daily production stands at 76,000 m3/d, with Calabar/Odukpani contributing 61,000 m3/d, Ugep/Ediba 10,000 m3/d, and Akamkpa 5000 m3/d [43].
3.4. Case Study 3: Kaduna State Water Corporation (KDSWC)
Kaduna State was formerly the capital and central hub of the northern region. Kaduna State Water Corporation (KDSWC) has undergone a series of reforms that led to its current status. It was initially established through Edict No. 2 of 1971, tasked with the responsibility of supplying clean water to its residents. However, a significant transformation occurred with the enactment of the Kaduna State Water Board Law No. 6 in 2016 [43], officially converting it into a corporation. The corporation operates two major water schemes, namely the Zaria treatment plants (150,000 m3/d) and the Kaduna treatment plant (231,000 m3/d), resulting in a combined installed capacity of 381,000 m3/d [43].
4. Materials and Methods
4.1. Methodology for Data Collection
A combination of desk and field studies was employed for comprehensive data collection. Desk studies involved gathering secondary data through document reviews, including published books, journals, and grey literature related to national and state water policies. This secondary information framed the assessment, enabling a focused approach for primary data collection. Documents examined encompassed annual reports, program documentation, and reports from the Federal Ministry of Water Resources (FMWR) National Urban Water Sector Reform Program (NUWSRP), along with various manuals and protocols developed as part of the program. Field studies included passive participation to embed, observe, and collect both primary and secondary data. A five-year technical assessment of the physical condition of the state water utility (SWU) water schemes was conducted using a water system evaluation checklist to discern trends in the improvement of their operations and maintenance (O&M), if any. Semi-structured interviews were conducted with key informants, including policy makers at the FMWR and management and operators at the project implementation units of the SWUs.
The adequacy of a water scheme was evaluated based on the population of the service area and access to piped water supply. Piped water supply was considered a safe water supply compared to unprotected water sources. The population forecasts for Lagos, Cross River, and Kaduna States were derived from the 2006 population census [25]. To project the population beyond that period not covered by the 2006 census, in determining their water demand, Euler’s number was used [47]. A growth rate of 3.25%, 2.94%, and 3.04% was adopted for Lagos, Cross River, and Kaduna States, respectively, for the population projection [26].
where:
Nt = P e r∗t
Nt = The number of people at a future time;
P = The population at the beginning time (current);
e = The base of the natural logarithms (2.71828);
r = The growth rate (natural increase divided by 100);
t = The time involved.
Water Demand
The average daily per capita water consumption for service providers that do not separate domestic water consumption from other types [48]:
[Total billed water sales during assessment period × 100]/[Number of days] × [Number of population served]
The water demand criteria employed for domestic water supply needs used for the estimation of water demand for the Lagos Water Corporation (LWC), Cross River State Water Board Limited (CRSWBL), and Kaduna State Water Corporation (KDSWC) water demand projections from 2015 to 2030 are as follows:
- Urban areas: 120 L per capita per day (L/c/d);
- Semi-urban areas: 100 L/c/d;
- Rural areas: 50 L/c/d;
- Capacity utilization: 95%;
- Distribution network losses: 15%.
These criteria align with the design standards outlined in the National Water Supply and Sanitation Policy [41], as approved by the Federal Ministry of Water Resources. Additionally, these standards adhere to the World Health Organization’s recommendations for domestic water supply, specifying a range of 50–120 L per capita per day for suburban and urban populations [49].
4.2. Methodology for Data Analysis
Various methodologies can be employed to assess the performance of water utilities, with key performance indicators (KPIs) and overall performance indicators (OPIs) representing comprehensible and potentially more technical empirical benchmarks, especially in developing countries [30]. KPIs are widely acknowledged as a foundational tool for evaluating the operational effectiveness of water utility systems [30]. Empirical data derived from the assessment of the state water utilities (SWUs) underwent analysis using broad measures recommended by Tyman and Kingdom [37]. This analysis aimed to ascertain the operational efficiency of the SWUs and evaluate their financial sustainability, particularly in sustaining operations and maintenance (O&M). Given that the SWUs share similar constraints, the study utilized verifiable KPIs based on the International Water Association (IWA) Manual of Best Practices [38]. These KPIs were instrumental in assessing and illustrating trends in water demand gaps, O&M, and the degree to which the SWUs rely on financial support from state governments, through subventions, to fund their O&M activities. This comprehensive approach ensured a robust evaluation of the SWUs’ performance, considering both operational and financial aspects and allowing for meaningful comparisons and insights.
Subsequently, these indicators were benchmarked against each of the three state water utilities (SWUs) in Nigeria to gauge their operational and maintenance (O&M) efficiency, efficiency of investment, and financial sustainability [1,37,38]. The key performance indicators (KPIs) were further broken down into specific variables, facilitating a detailed assessment of the SWUs’ performance, as outlined in Table 1. This breakdown allowed for a nuanced analysis of each component, providing insights into the strengths and areas for improvement in the SWUs’ operations and financial management. The systematic evaluation of these variables aimed to offer a comprehensive understanding of the overall performance of the SWUs in the context of operational efficiency, investment effectiveness, and financial viability.
5. Results and Discussion
The analysis of data obtained from the fieldwork conducted at the three state water utilities (SWUs), namely Lagos Water Corporation (LWC), Cross River State Water Board Limited (CRSWBL), and Kaduna State Water Corporation (KDSWC), has been summarized based on four overarching performance measures. These measures, as recommended by Tyman and Kingdom [37] in alignment with the International Water Association (IWA) Manual of Best Practices [38] in Section 4.2, include water demand gap, efficiency of operations and maintenance, efficiency of investment, and financial sustainability. The subsequent presentation of findings aims to provide a comprehensive understanding of the performance of the SWUs across these critical dimensions.
5.1. Water Demand Gap and Service Coverage
This study undertook the crucial task of projecting the population of the study areas from 2015 to 2030, encompassing the period of the Sustainable Development Goals (SDGs) and addressing a gap not covered by the census records. The adequacy of a water scheme is inherently tied to the population of the service area it serves. To estimate the population for the study areas—Lagos, Cross River, and Kaduna States—available data for forecasting were drawn from the most recent population census conducted by the Federal Republic of Nigeria in 2006 [25]. It is noteworthy that the population projections provided by the census only extend over a ten-year period, from 2006 to 2016, as indicated in the literature discussed in Section 4.1 [26]. The study thus fills a critical temporal gap, extending its projections to 2030, aligning with the SDG timeline, and addressing the need for accurate population estimates for sustainable water resource planning and management.
5.1.1. Lagos Water Corporation (LWC)
Based on the estimated population of Lagos in 2020, standing at 14,263,450, the water demand for the region has been calculated to be approximately 713,172 cubic meters per day, as outlined in Table 2. The analysis reveals a significant shift in the dynamics of water utilization. Despite the population growth from 12,550,598 in 2016 to 14,263,450 in 2020, the capacity utilization of Lagos Water Corporation (LWC) water schemes witnessed a decline, dropping from 59% in 2016 to 52% in 2020.
This decrease in capacity utilization has led to an expansion in the demand gap, escalating from 78,589 cubic meters per day in 2016 to 228,723 cubic meters per day in 2020. The projection anticipates that even if the water schemes operate at maximum capacity (factoring in a 5% allowance for backwash and a 15% allowance for losses in the network due to breakages) by 2030, a substantial demand gap of 242,581 cubic meters per day is expected to persist. This forecasted scenario is detailed in Table 2, indicating a critical need for strategic planning and interventions to bridge the widening demand–supply gap in the water sector for Lagos State.
Table 2 underscores a concerning trend for the Lagos Water Corporation (LWC), revealing an incapacity to reduce the water demand gap in Lagos State. Instead of narrowing, the demand gap continues to widen. The initial water demand projection gap of 78,589 cubic meters per day in 2016 has surged to 242,581 cubic meters per day by 2030, given the current water supply capacity and population growth rate, as illustrated in Table 2.
This persistent widening of the demand–supply gap signifies a formidable challenge in achieving the Sustainable Development Goal (SDG) target by 2030. It is evident that without a concerted effort to significantly expand and enhance the efficiency of water schemes, meeting the SDGs is unattainable. This emphasizes the critical need for strategic interventions, including the expansion of water infrastructure and the implementation of efficiency measures, to ensure sustainable and equitable access to water resources in Lagos State.
5.1.2. Cross River State Water Board Limited (CRSWBL)
The projection in Table 3 indicates a concerning trajectory for the water demand gap. From the initial gap of 298,708 cubic meters per day in 2015, it is estimated to surge to 559,213 cubic meters per day by 2030, given the existing water supply capacity and population growth rate.
This upward trend emphasizes the urgent need for strategic planning and substantial interventions to address the widening demand–supply gap in water resources. Without concerted efforts to expand water infrastructure and enhance operational efficiency, achieving sustainable water access and meeting the outlined targets remains a formidable challenge. It underscores the importance of proactive measures to ensure the adequacy of water supply in the face of growing demand and population expansion.
5.1.3. Kaduna State Water Corporation (KDSWC)
The projection outlined in Table 4 reveals a significant escalation in the water demand gap. Starting at 601,522 cubic meters per day in 2015, the projection indicates a substantial increase to 1,105,756 cubic meters per day by 2030. This estimation is based on the existing water supply capacity and the observed population growth rate.
Such a considerable expansion in the demand–supply gap underscores the pressing need for proactive measures and substantial investments in water infrastructure and management. Without decisive efforts to enhance operational efficiency, expand water supply capacity, and address the burgeoning demands, achieving sustainable water access becomes increasingly challenging. This projection highlights the imperative for strategic planning and interventions to ensure the resilience and adequacy of water resources in the face of a growing population and increasing water demands.
5.1.4. Overall Performance Indicator of Demand Gap and Service Coverage
The literature review, as referenced in Section 2 [1,44], highlights the widening water demand gap, attributing it primarily to the rapid growth in population and urbanization. Additionally, Njoku et al.’s study [29] concurs, emphasizing the significant impact of population growth on the inadequacy of water supply, particularly in low- and middle-income countries like Nigeria. The deficits observed are not solely attributed to population growth; inefficiencies within state water utilities in producing and distributing an adequate water volume also contribute to the challenge.
A crucial aspect contributing to the challenge is the absence of a credible population census in Nigeria since 2006. Discrepancies between population figures reported by each state and the Federal Bureau of Statistics (FBS) further complicate projections of water demand and coverage for individual states. This disparity may arise from the use of state population figures in revenue-sharing formulas, adding to the complexity of projecting water demand.
Recognizing these challenges, Table 5 presents an independent population projection for each state, accounting for their estimated annual growth rates of 3.25%, 3.04%, and 2.94% for Lagos, Kaduna, and Cross River States, respectively. This approach aims to provide a more accurate basis for determining water demand, considering the unique growth dynamics of each state.
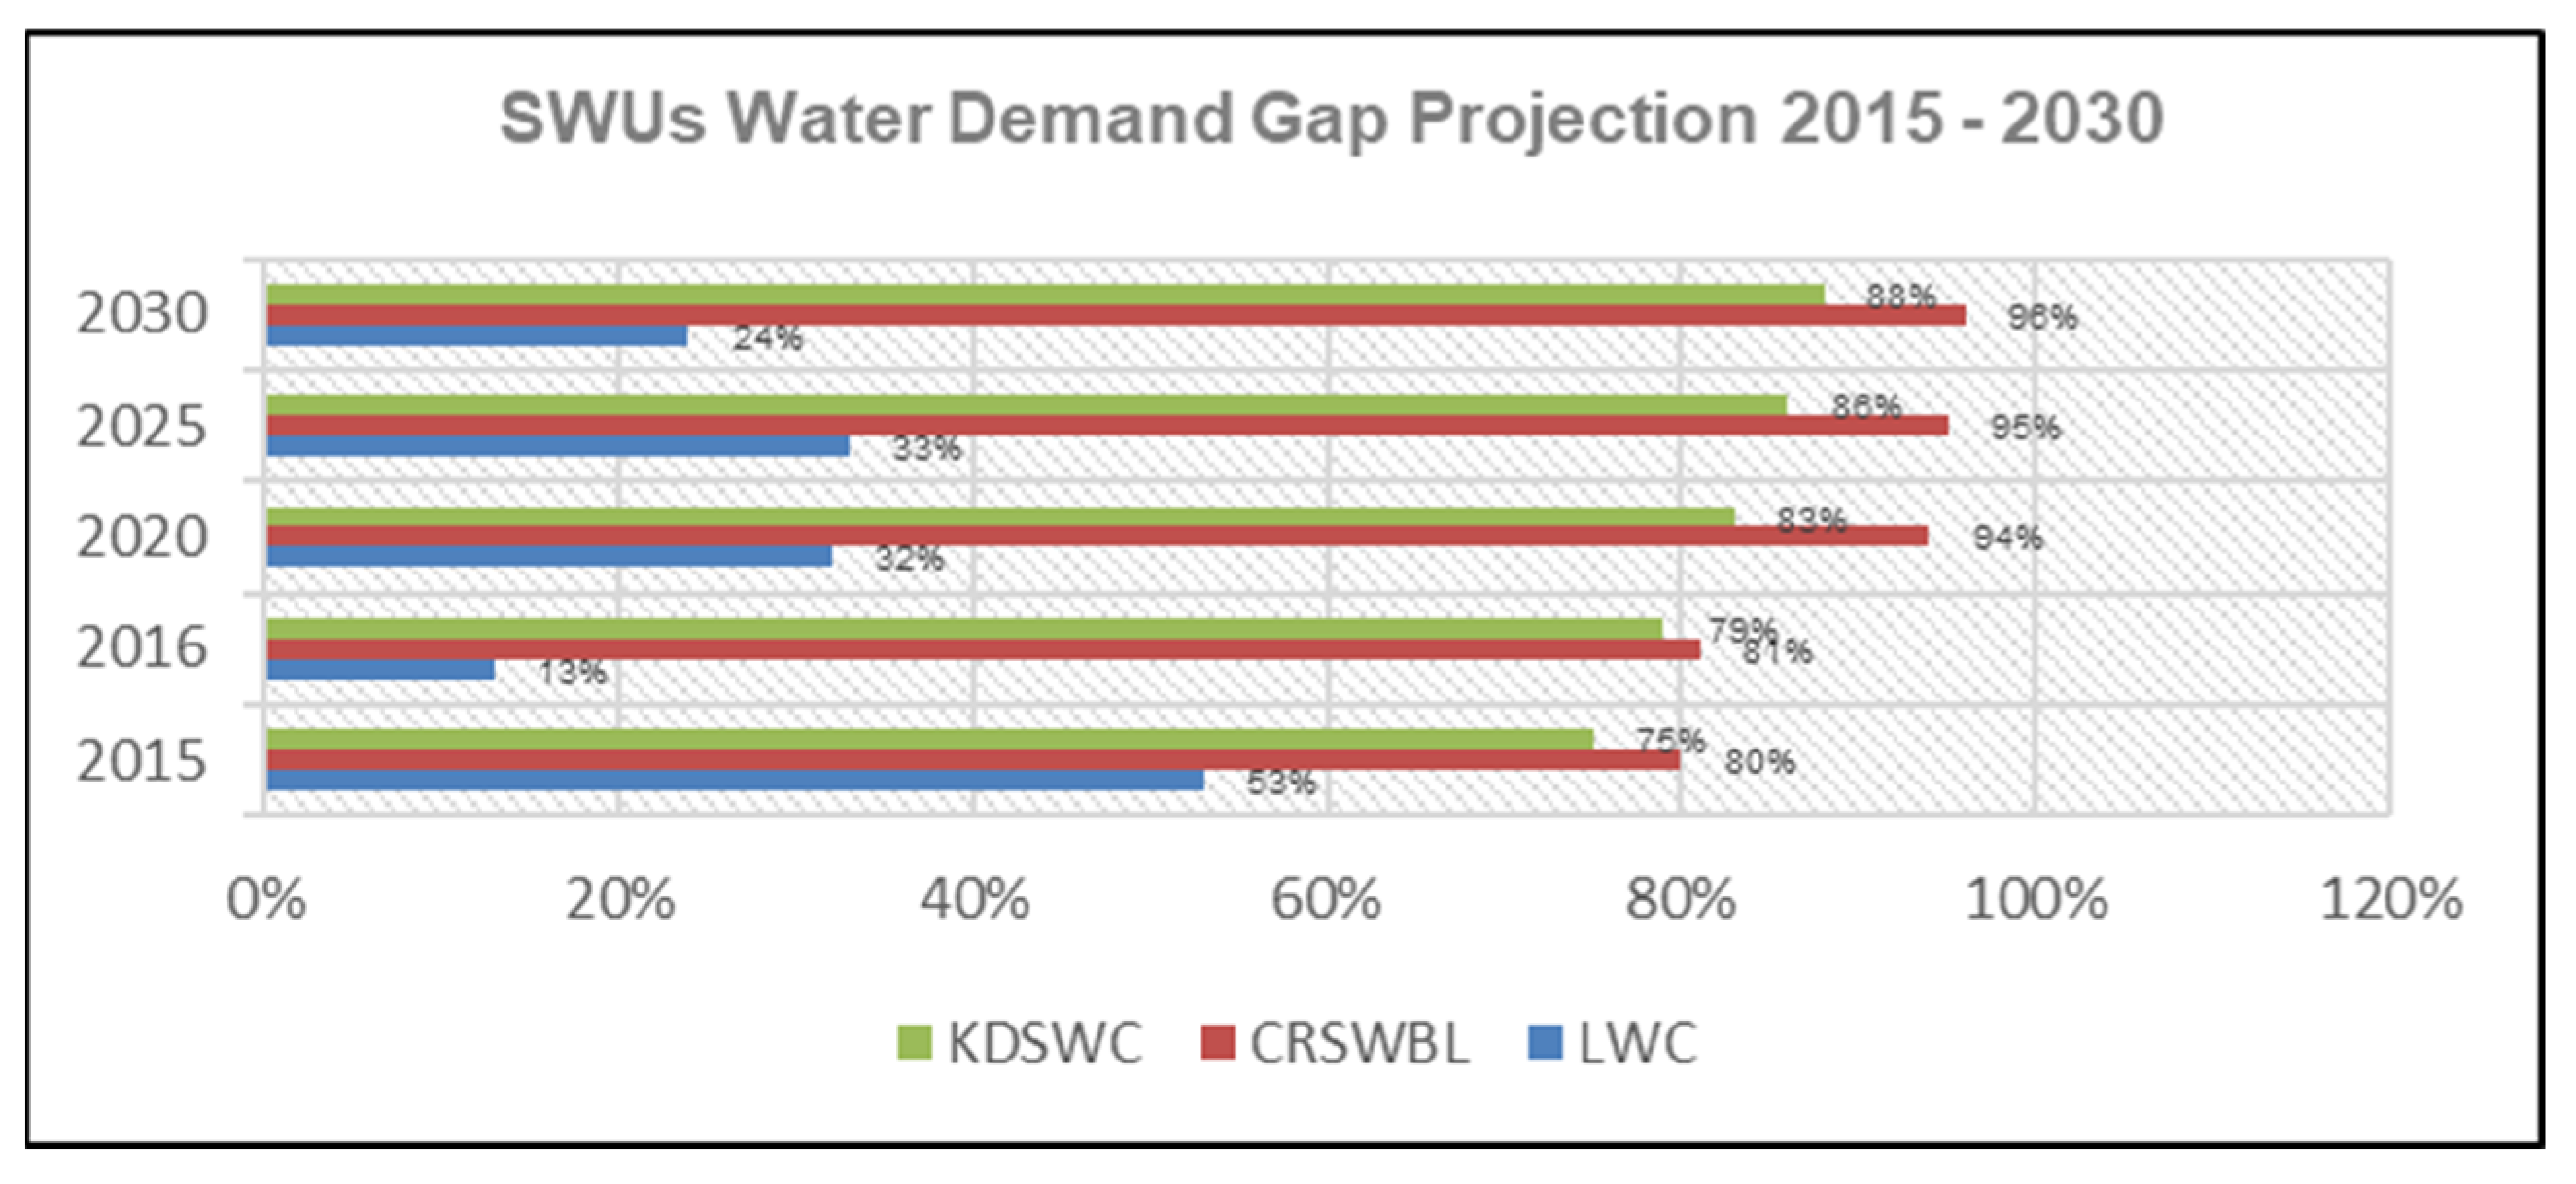
The water demand gaps of the study areas have been benchmarked among the state water utilities (SWUs) and presented in Table 6 and the water coverage in Table 7. By 2030, LWC would have reduced the water demand gap from 53% in 2015 to 24%, while CRSWBL and KDSWC increase it from 80% and 75% to 96% and 88%, respectively, as shown in Table 6.
The graphical representation of the rise and fall trend in the water demand gap is presented in Figure 2 below.
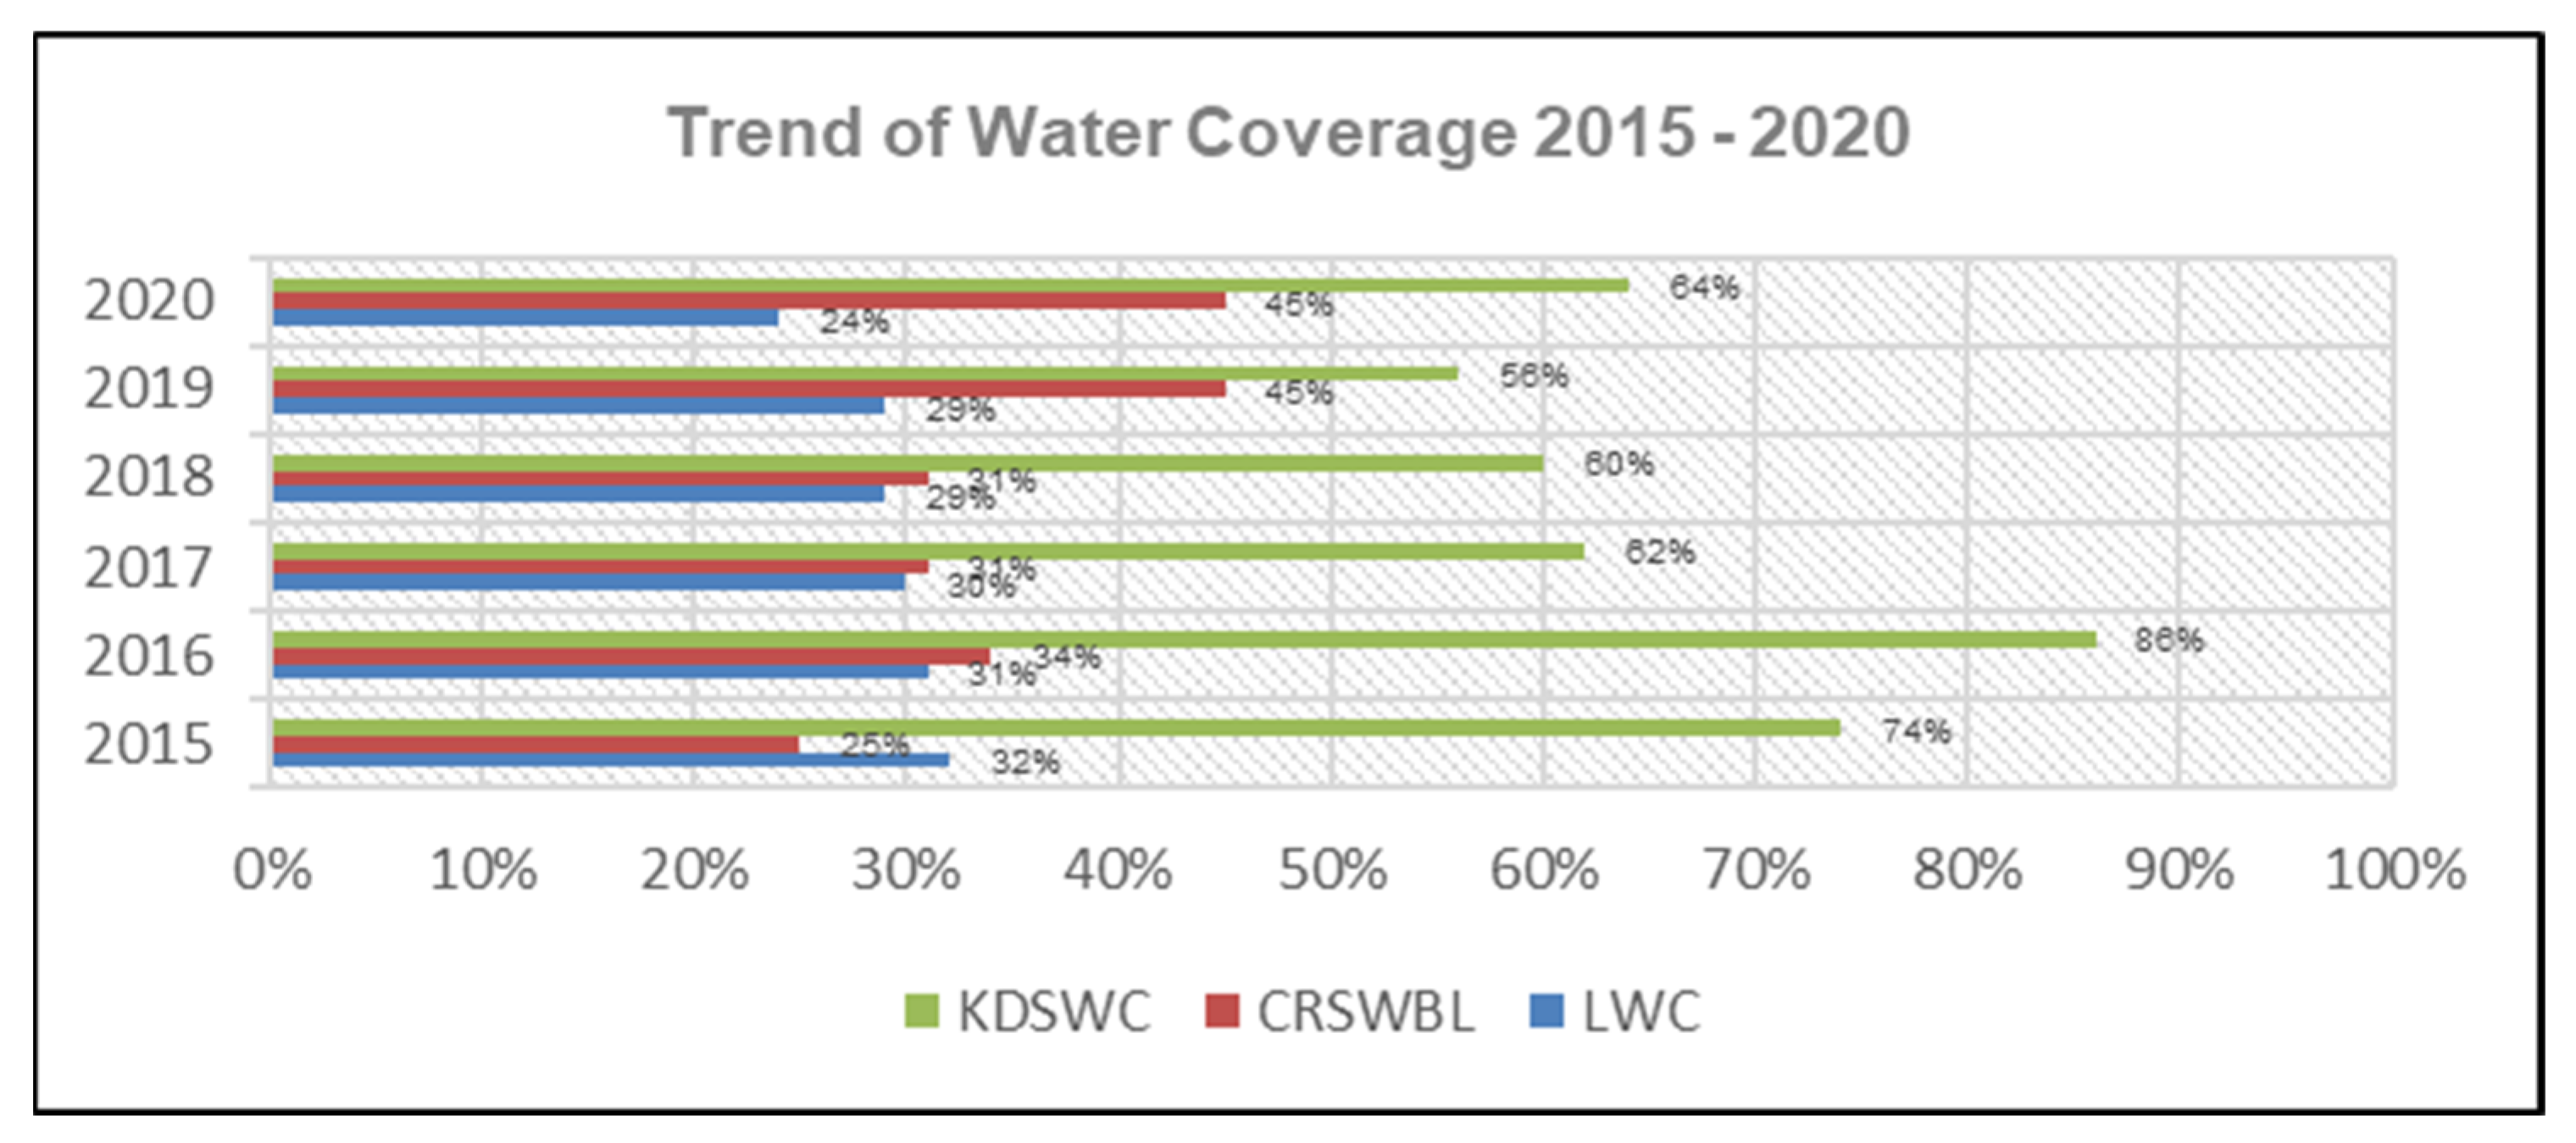
The overall performance (OP) and water coverage of the water utilities in the study area are presented in Table 7. In 2015, Lagos Water Corporation (LWC) achieved an OP of 2.7 and a water coverage of 32%, but by 2020, its water coverage decreased to 24%, leading to a drop in ranking to third place. Conversely, Cross River State Water Board Limited (CRSWBL) started with an OP of 3.3 and a water coverage of 25% in 2015. However, it successfully increased its water coverage to 45% by 2020, resulting in an improvement in ranking to second place. Kaduna State Water Corporation (KDSWC) secured the top position in 2015 with an OP of 6.0 and an impressive 74% water coverage. Although its water coverage declined to 64% in 2020, KDSWC maintained its lead in the rankings.
This analysis provides a snapshot of the performance and coverage dynamics of the water utilities over the specified period, shedding light on their relative standings in the study area.
KDSWC is ranked 1st with the best overall performance (OP) and water coverage of 6 over a five-year period among the benchmarked state water utilities (SWUs) in Nigeria. This trend of the study area is presented in Figure 3 below.
5.2. Efficiency of Operations and Maintenance
This described concept, defined as the lowest cost use of inputs in the daily operation of a utility, aligns with the notion of operational efficiency. In this context, the ratio of inputs to output serves as the primary indicator for measuring operational efficiency. One specific ratio used for this purpose is the number of staff per 1000 connections. As per the literature in Section 4.2 and recommended by Tyman and Kingdom [37] based on the International Water Association (IWA) Manual of Best Practices [38], a staff ratio exceeding 20 staff per 1000 connections is indicative of inefficient use of staff.
Another crucial indicator is the ratio of staff per 1000 people served. According to the literature and recommendations by Tyman and Kingdom [37] and others [1,39], in a developing country utility, a staff ratio surpassing 29% suggests an excessive use of labor resources.
These ratios are essential benchmarks for evaluating and optimizing the operational efficiency of a utility, providing insights into the cost-effectiveness of its operations in relation to the services it provides.
5.2.1. Lagos Water Corporation (LWC)
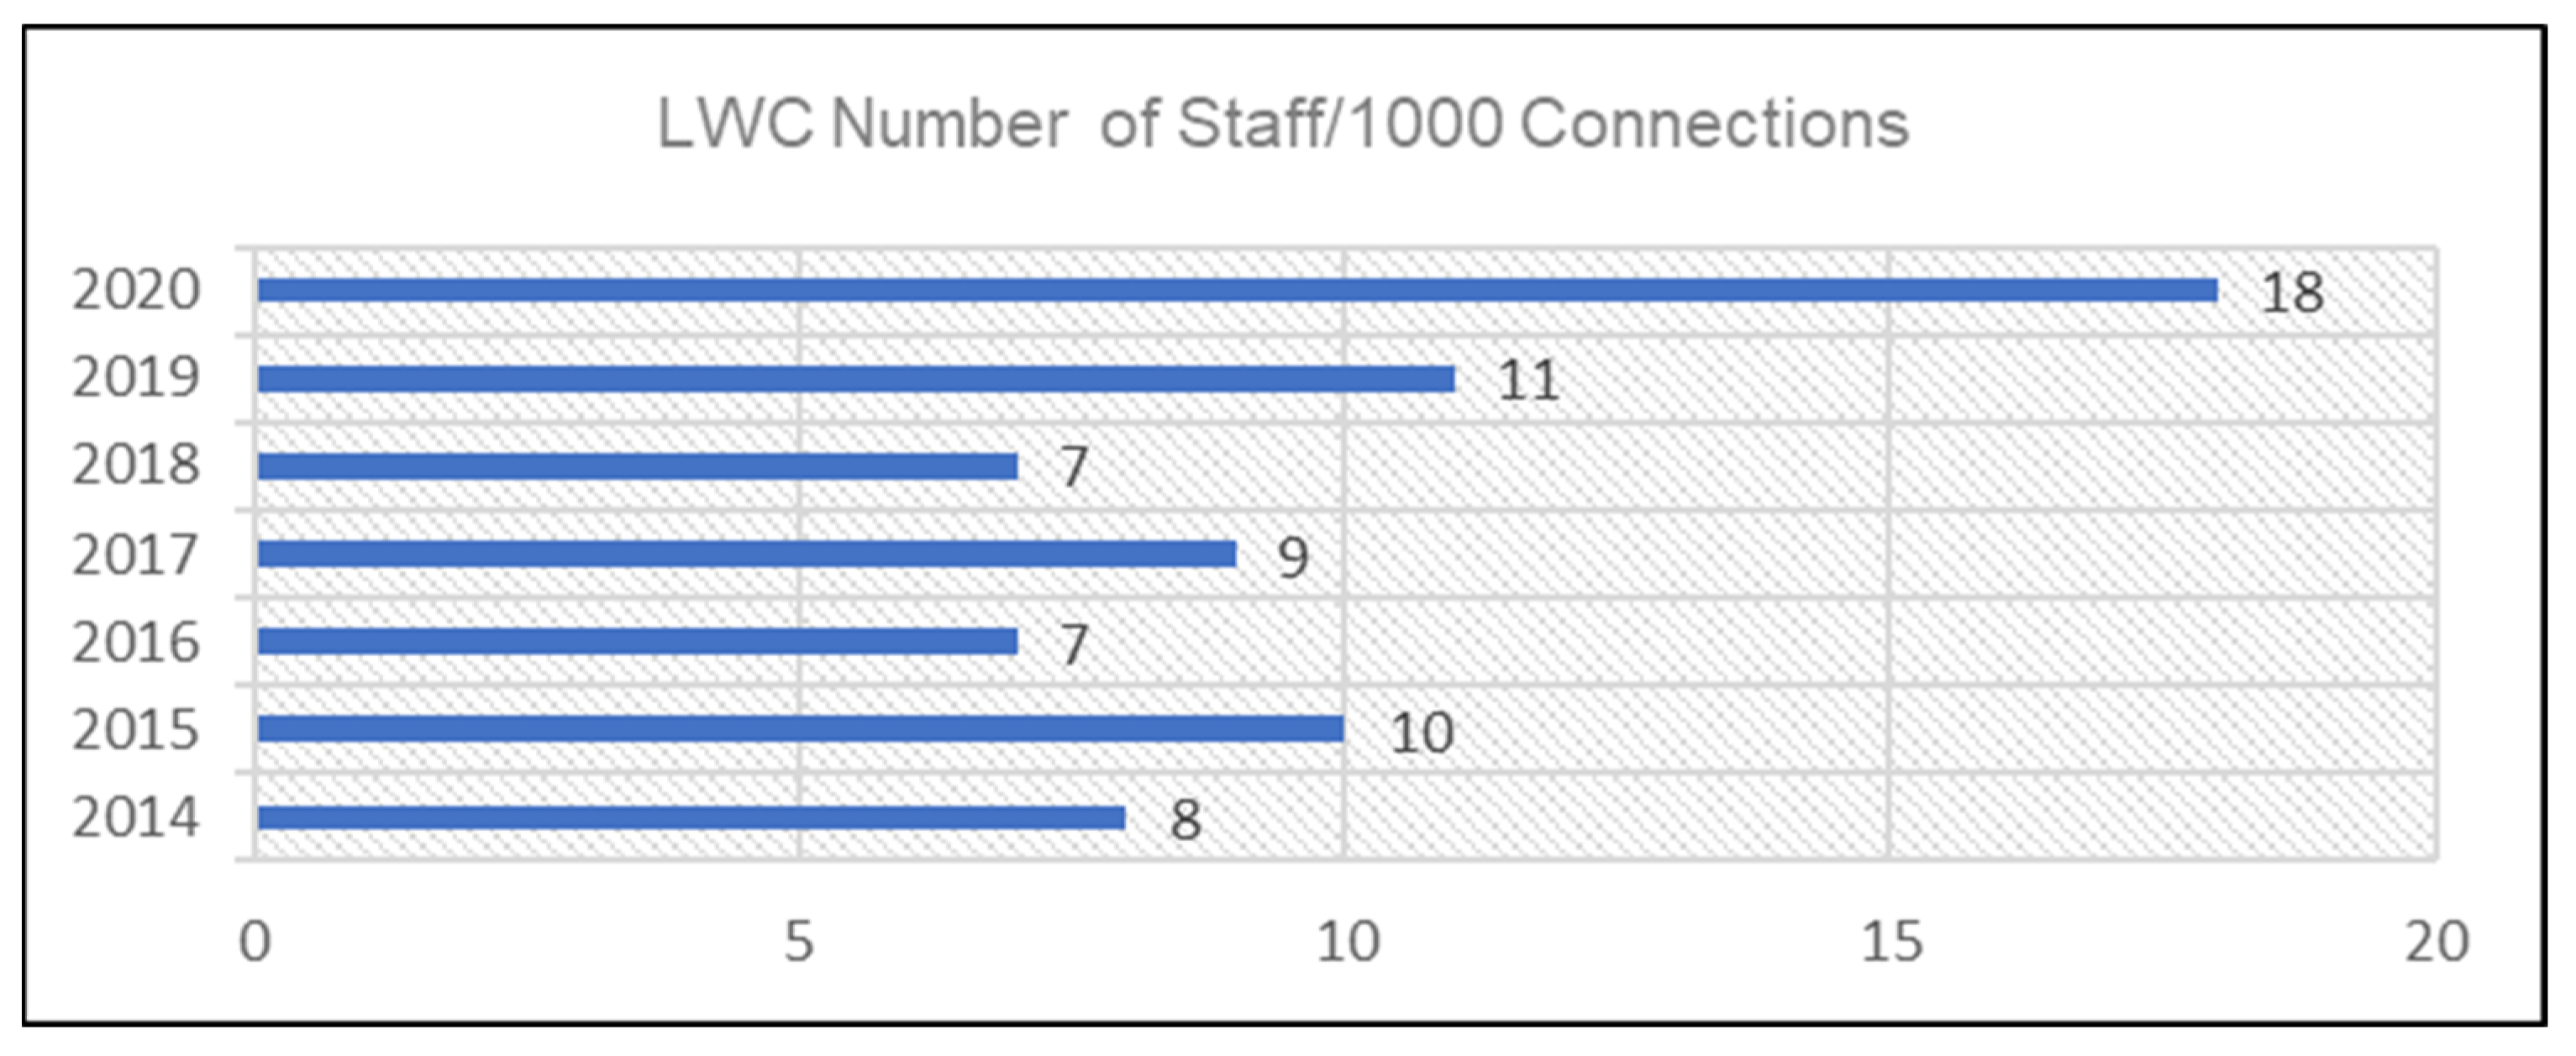
The ratio of staff per 1000 connections for Lagos Water Corporation (LWC), being lower than the baseline of 20, is a positive indication of efficient use of personnel, suggesting that the utility is managing its staff resources effectively relative to its connection capacity. However, the concerning trend noted reveals fluctuations in the efficiency of staff utilization over the years. The increase from 8 in 2014 to 11 in 2019 and the subsequent increase to 18 in 2020 raise a red flag, indicating a potential decline in the efficiency of staff utilization.
Figure 4 visually represents these trends, showing a dip in efficiency, followed by an increase, which could be a cause for investigation and strategic planning to address the observed fluctuations and maintain a consistently efficient use of staff resources. Further analysis and understanding of the factors contributing to these fluctuations could be essential in implementing targeted improvements.
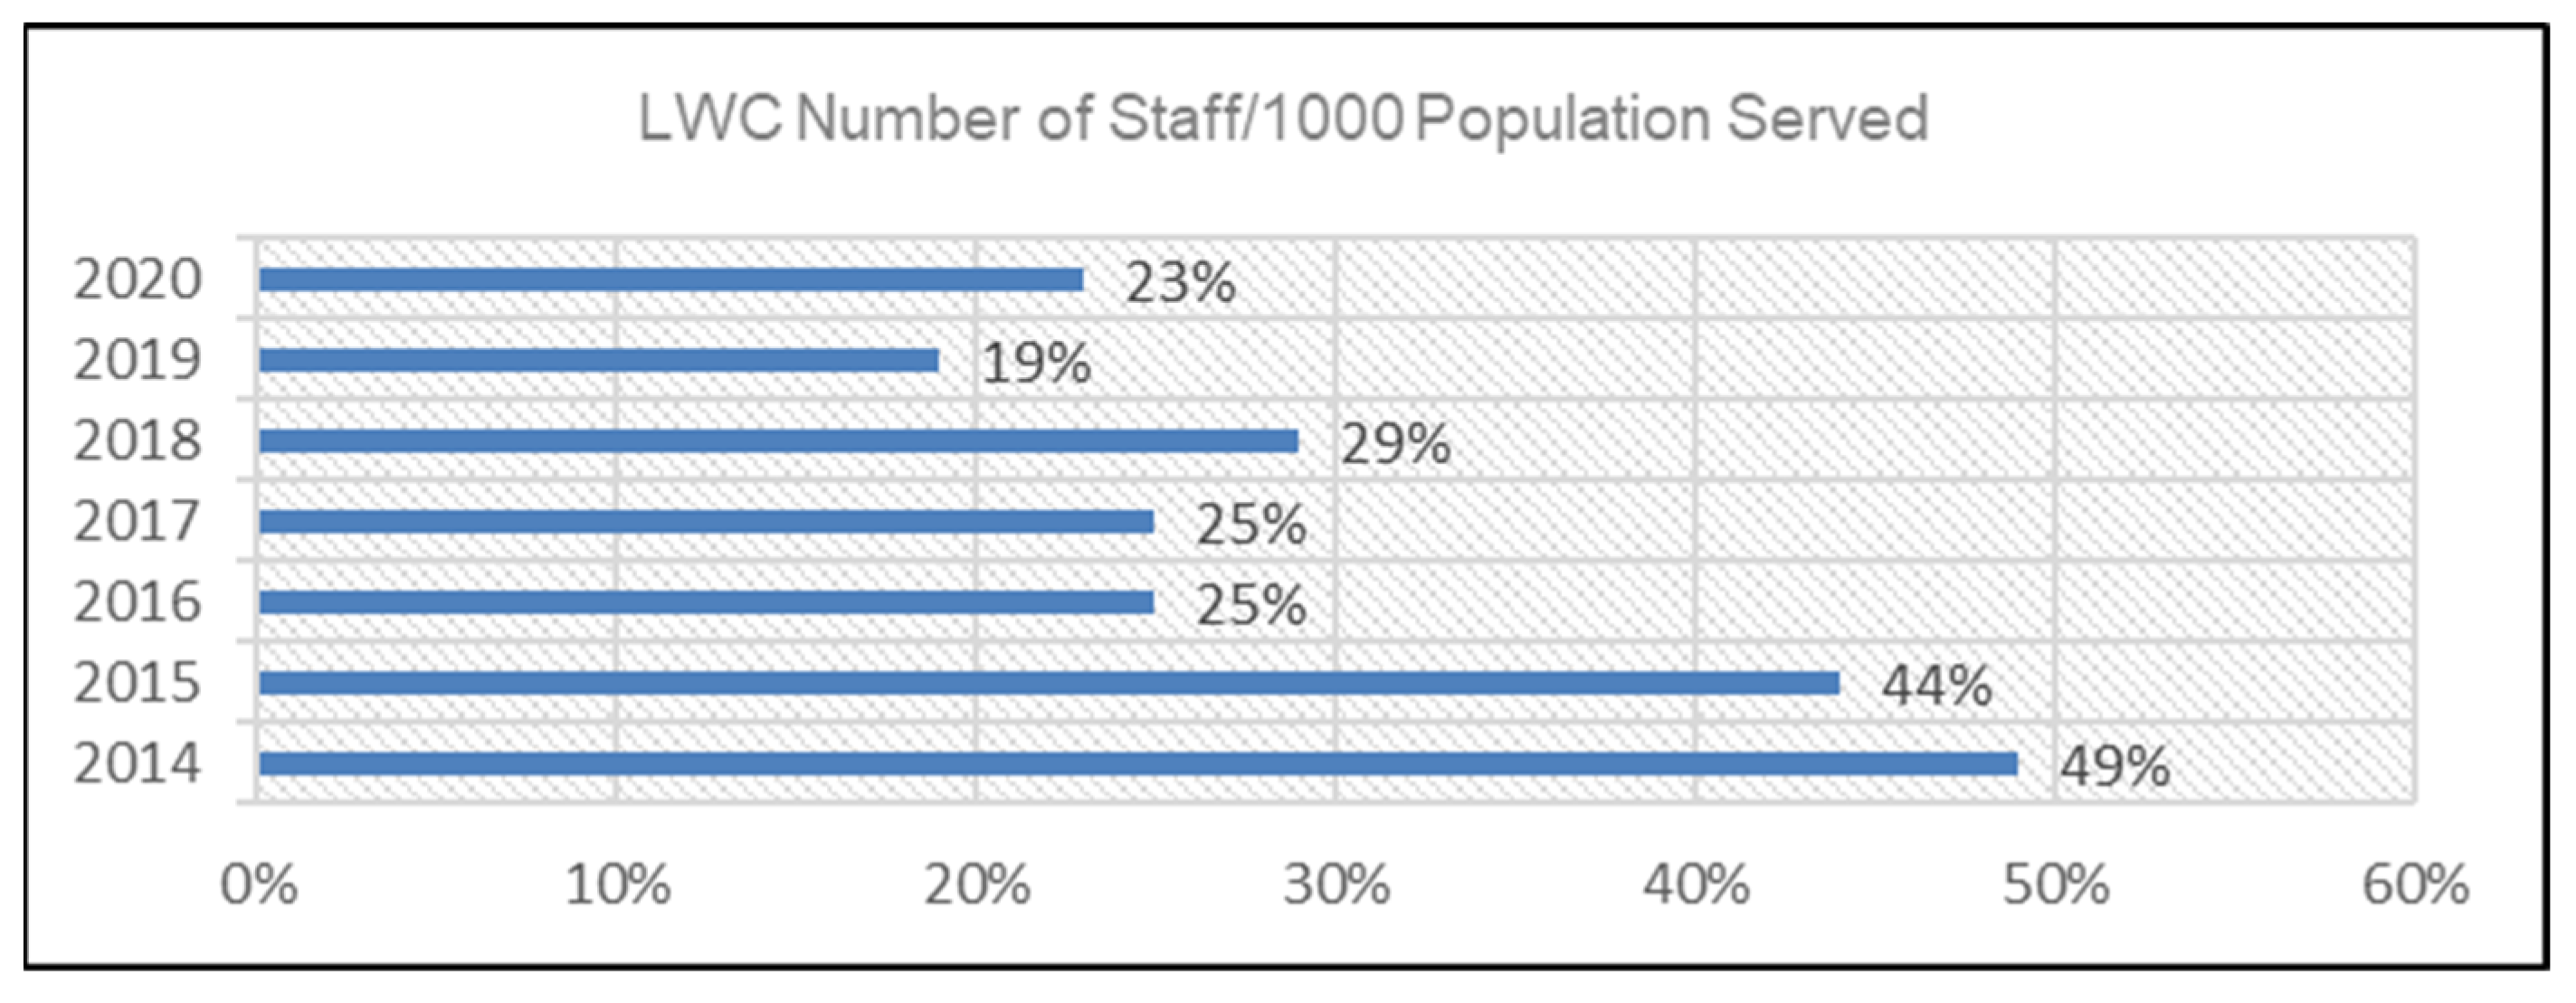
The number of staff per 1000 population served for Lagos Water Corporation (LWC) exceeding the baseline of 29% suggests that, historically, the utility may have had a larger workforce compared to the population it served. However, the trend over the years, as illustrated in Figure 5, shows some variations in the staff-to-population ratio. The ratio being 49% in 2014 indicates a significant deviation from the baseline, signifying a potentially excessive use of labor resources relative to the population served. The subsequent drop below 29% between 2016 and 2017 could be interpreted as an improvement, aligning the staffing levels more closely with the baseline for utilities in developing countries.
The subsequent rise to 29% again in 2018 suggests a return to a higher staff-to-population ratio, which then dropped to 23% by 2020. This fluctuation indicates a dynamic situation that may warrant further investigation into factors influencing staffing levels and population dynamics during these years. Continuous monitoring and strategic planning may be necessary to maintain an optimal balance between staff resources and the population served.
5.2.2. Cross River State Water Board Limited (CRSWBL)
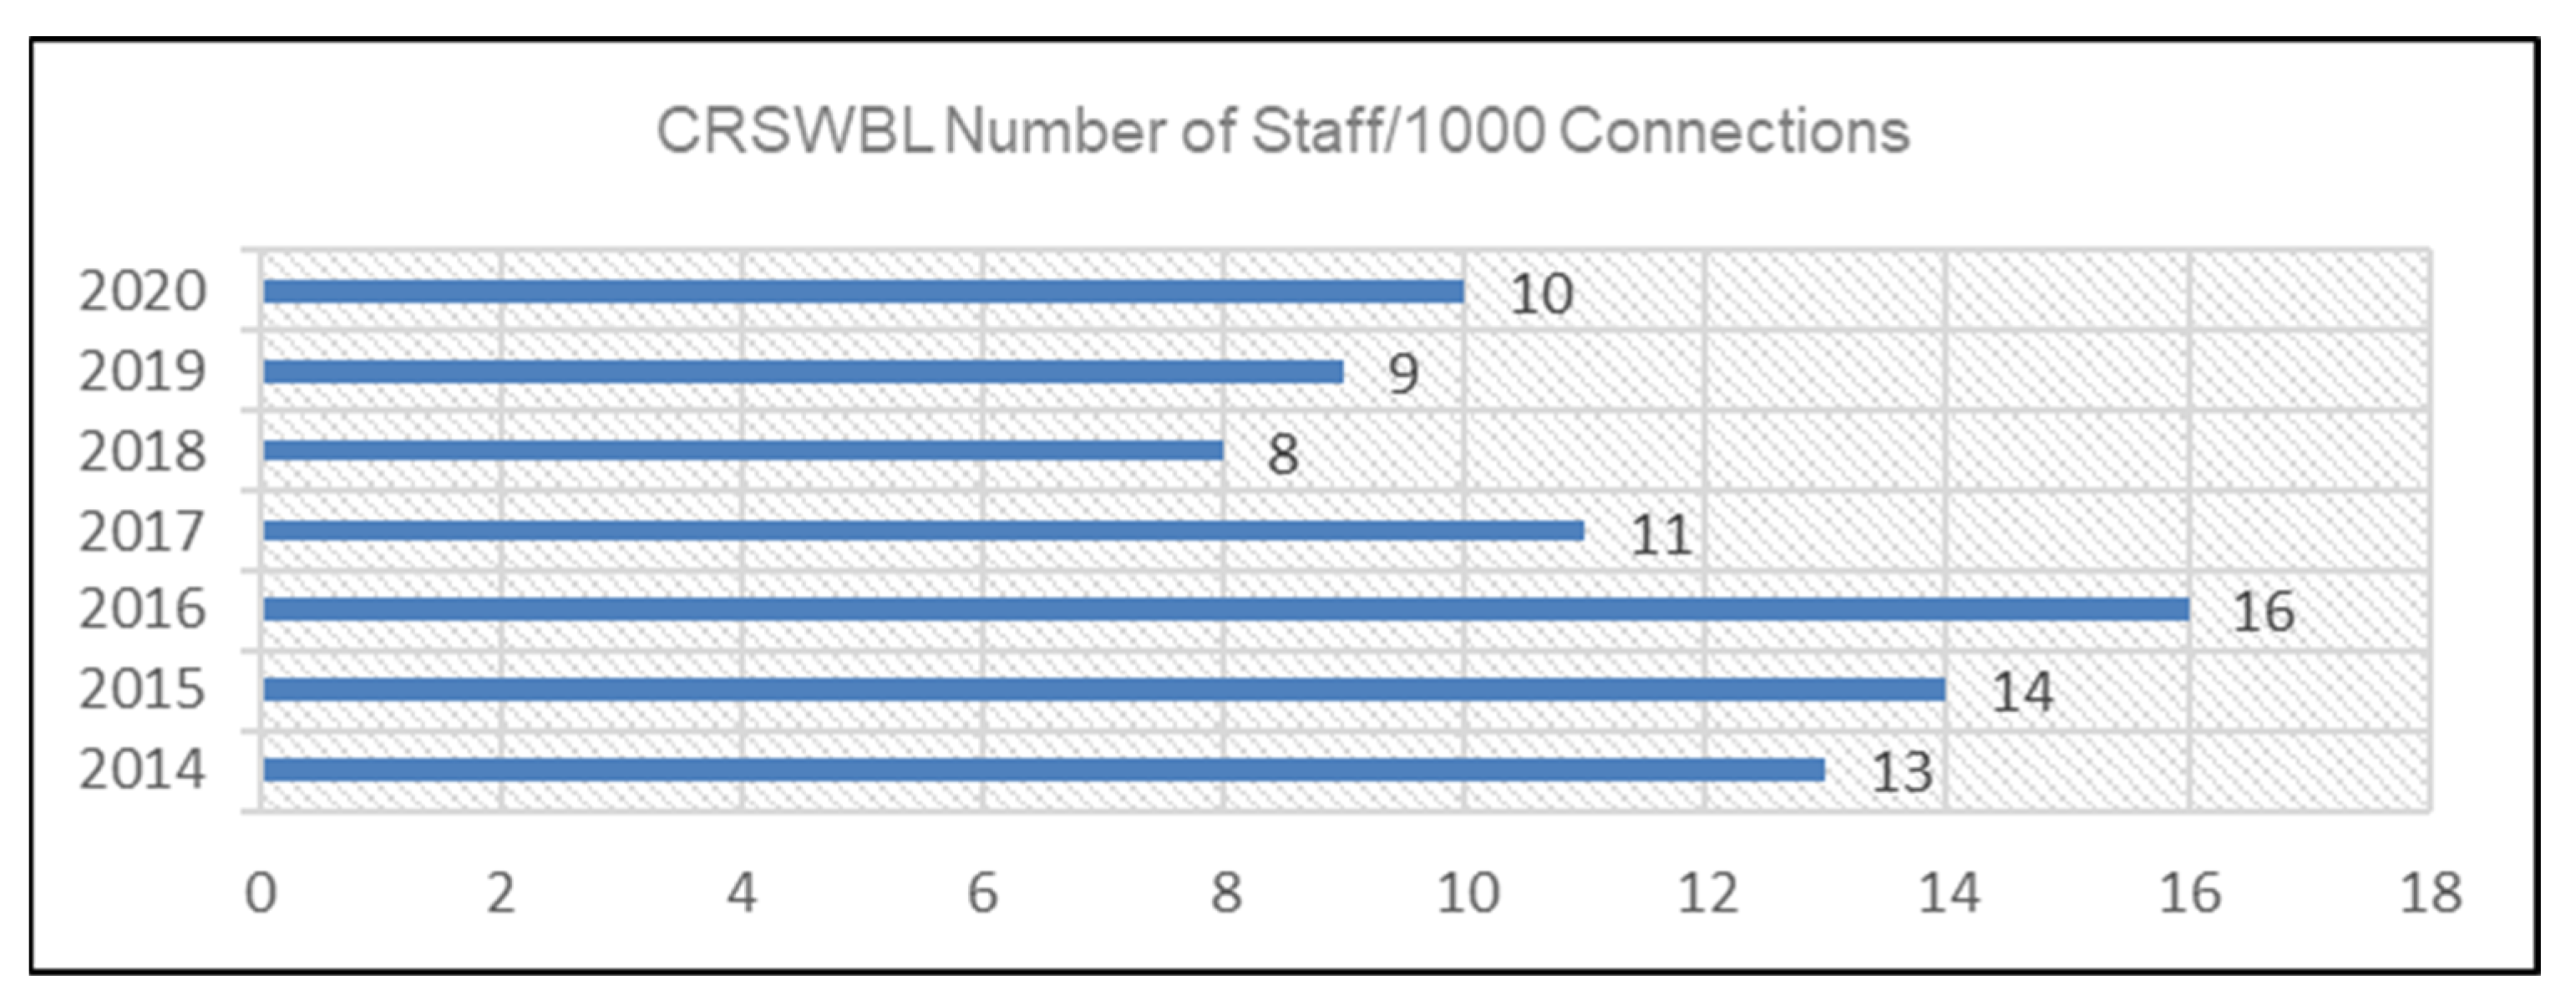
The ratio of staff per 1000 connections at Cross River State Water Board Limited (CRSWBL) is consistently below the baseline of 20 as illustrated in Figure 6. It ranged from 16 in 2016 to 8 in 2018, indicating efficient personnel utilization.
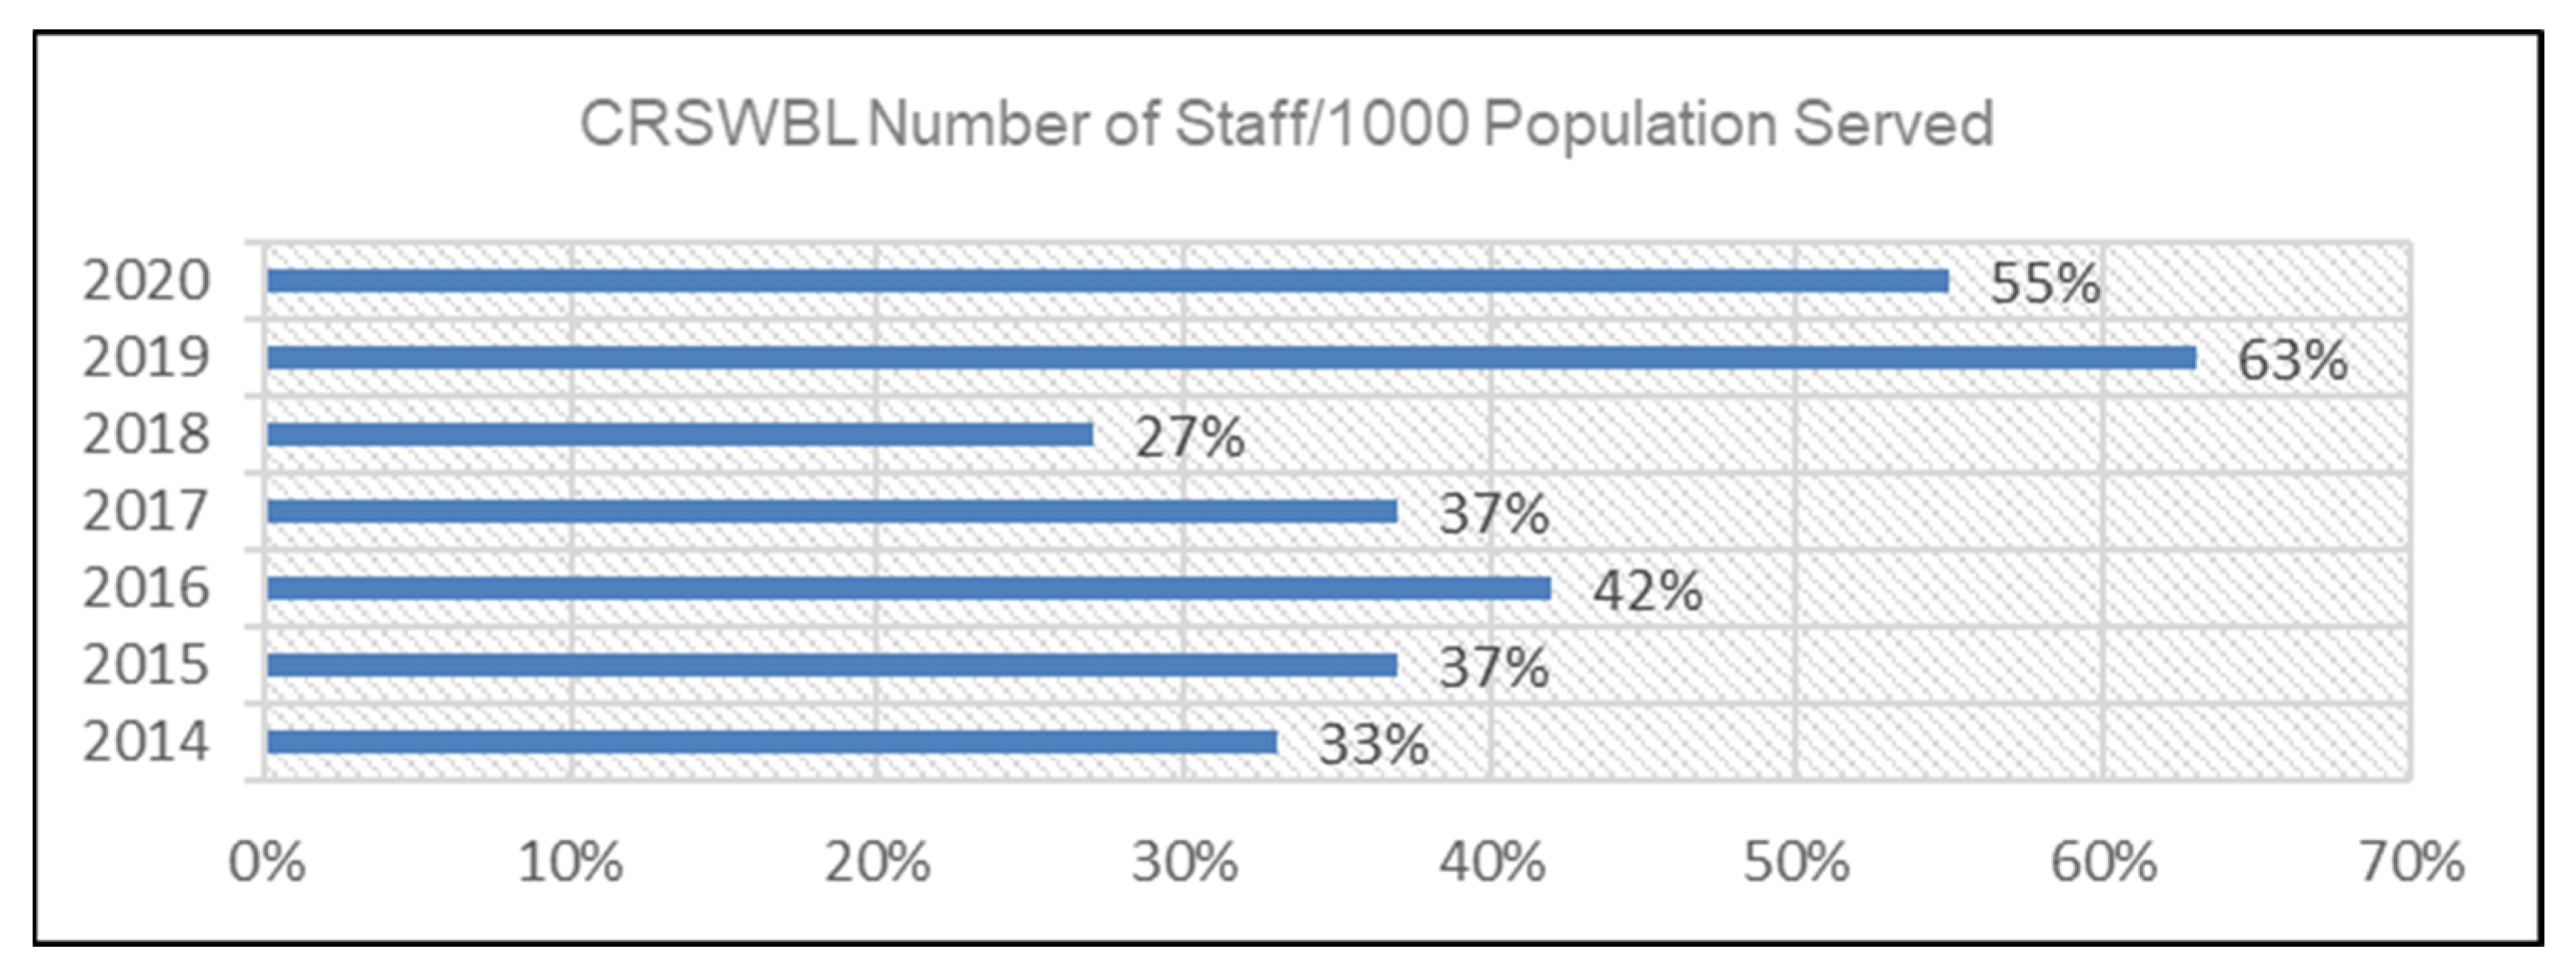
In Figure 7, the ratio of staff per 1000 population served surpassed the baseline of 29% between 2014 and 2017 (33–37%). It dropped below 29% in 2018, rising sharply from 27% to 63% and 55% in 2019 and 2020, respectively.
5.2.3. Kaduna State Water Corporation (KDSWC)
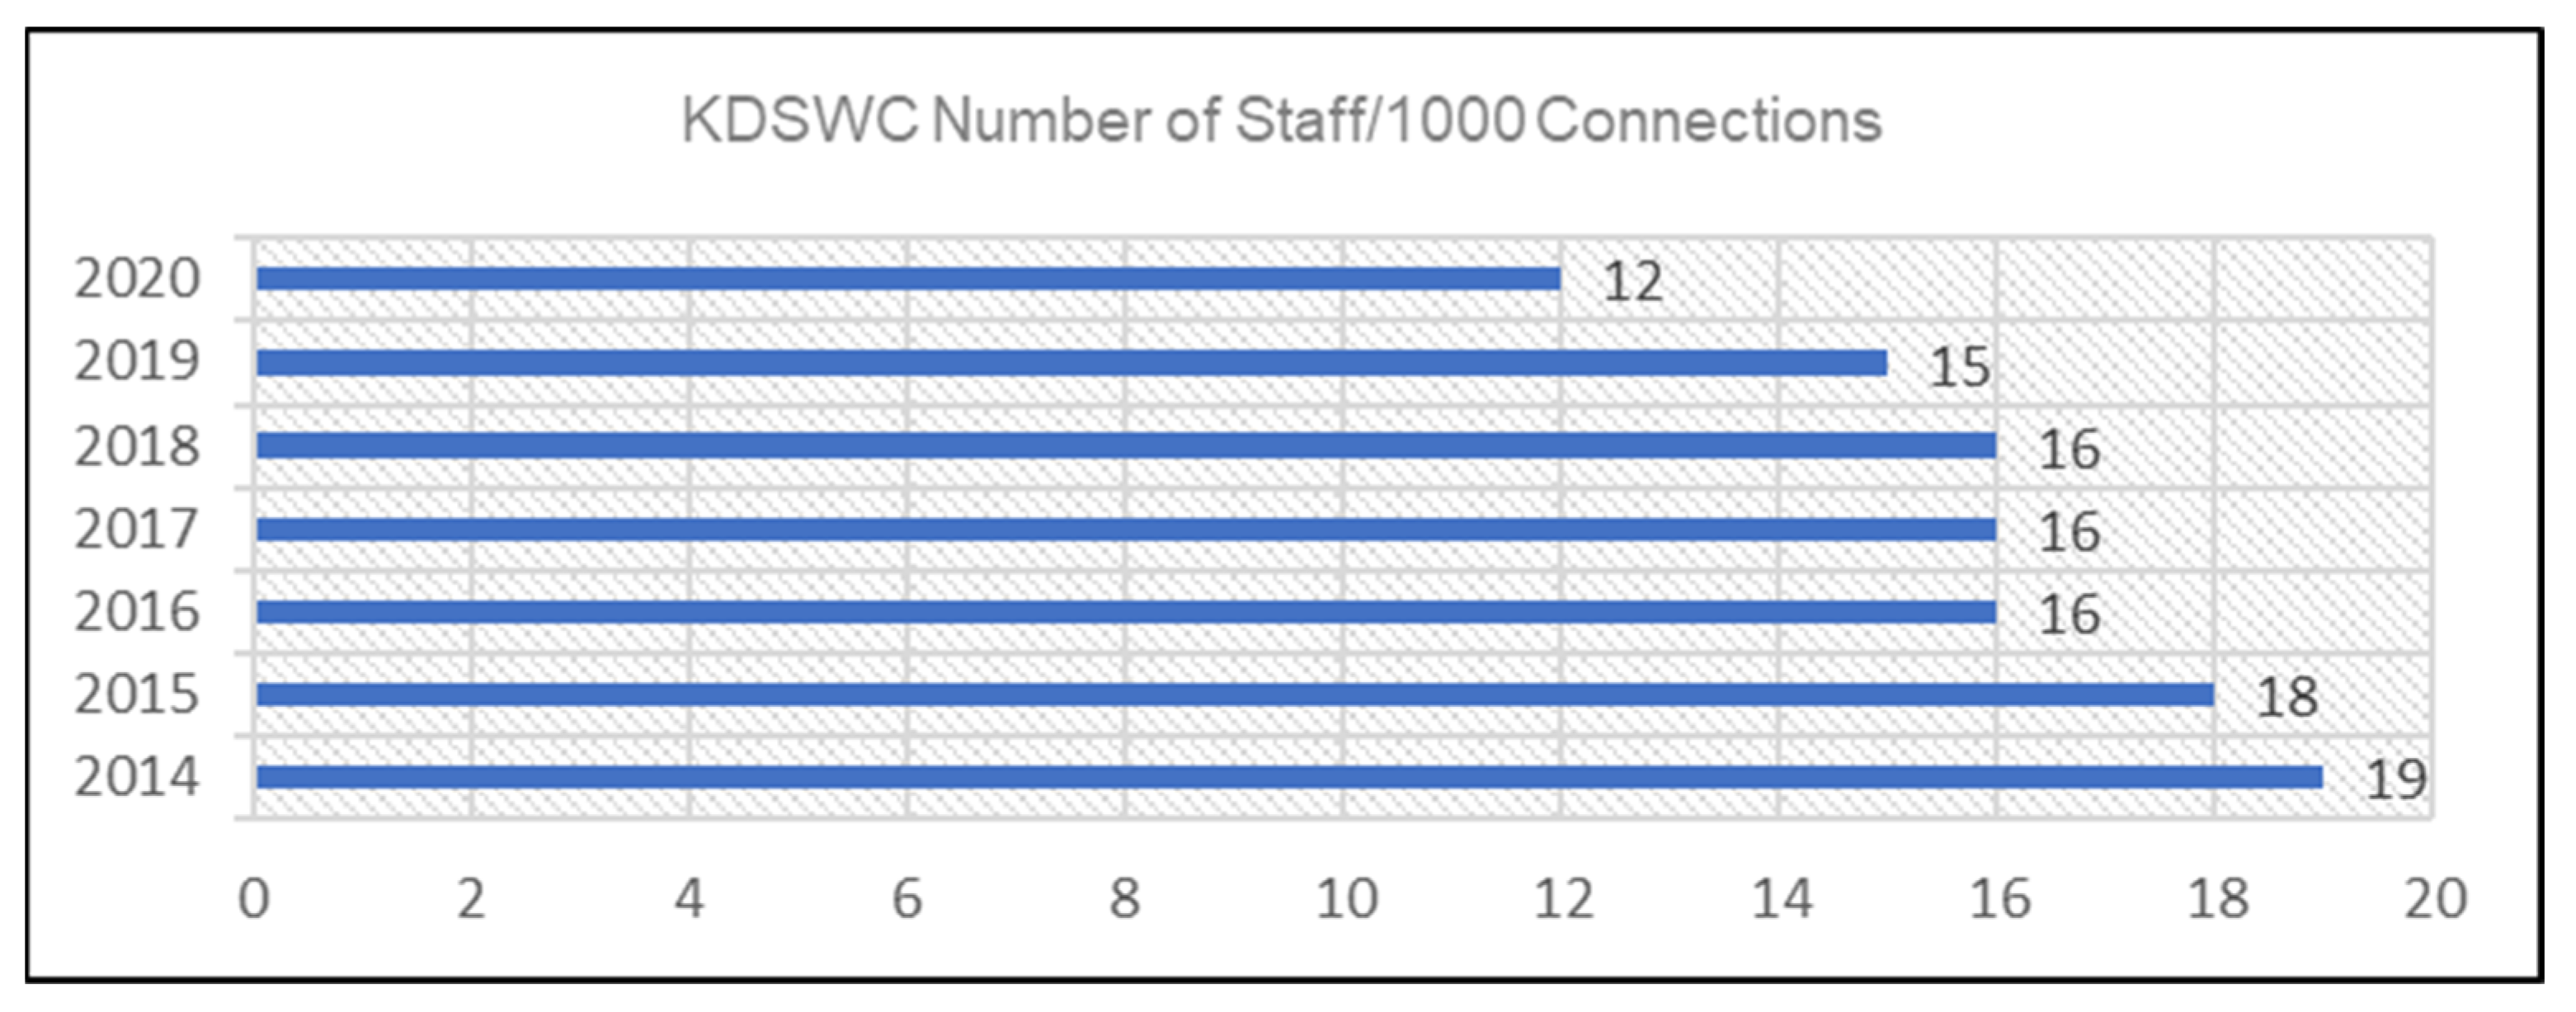
The staff-to-connections ratio at Kaduna State Water Corporation (KDSWC) decreased from 19 to 12 staff per 1000 connections between 2014 and 2020, indicating improvement (Figure 8).
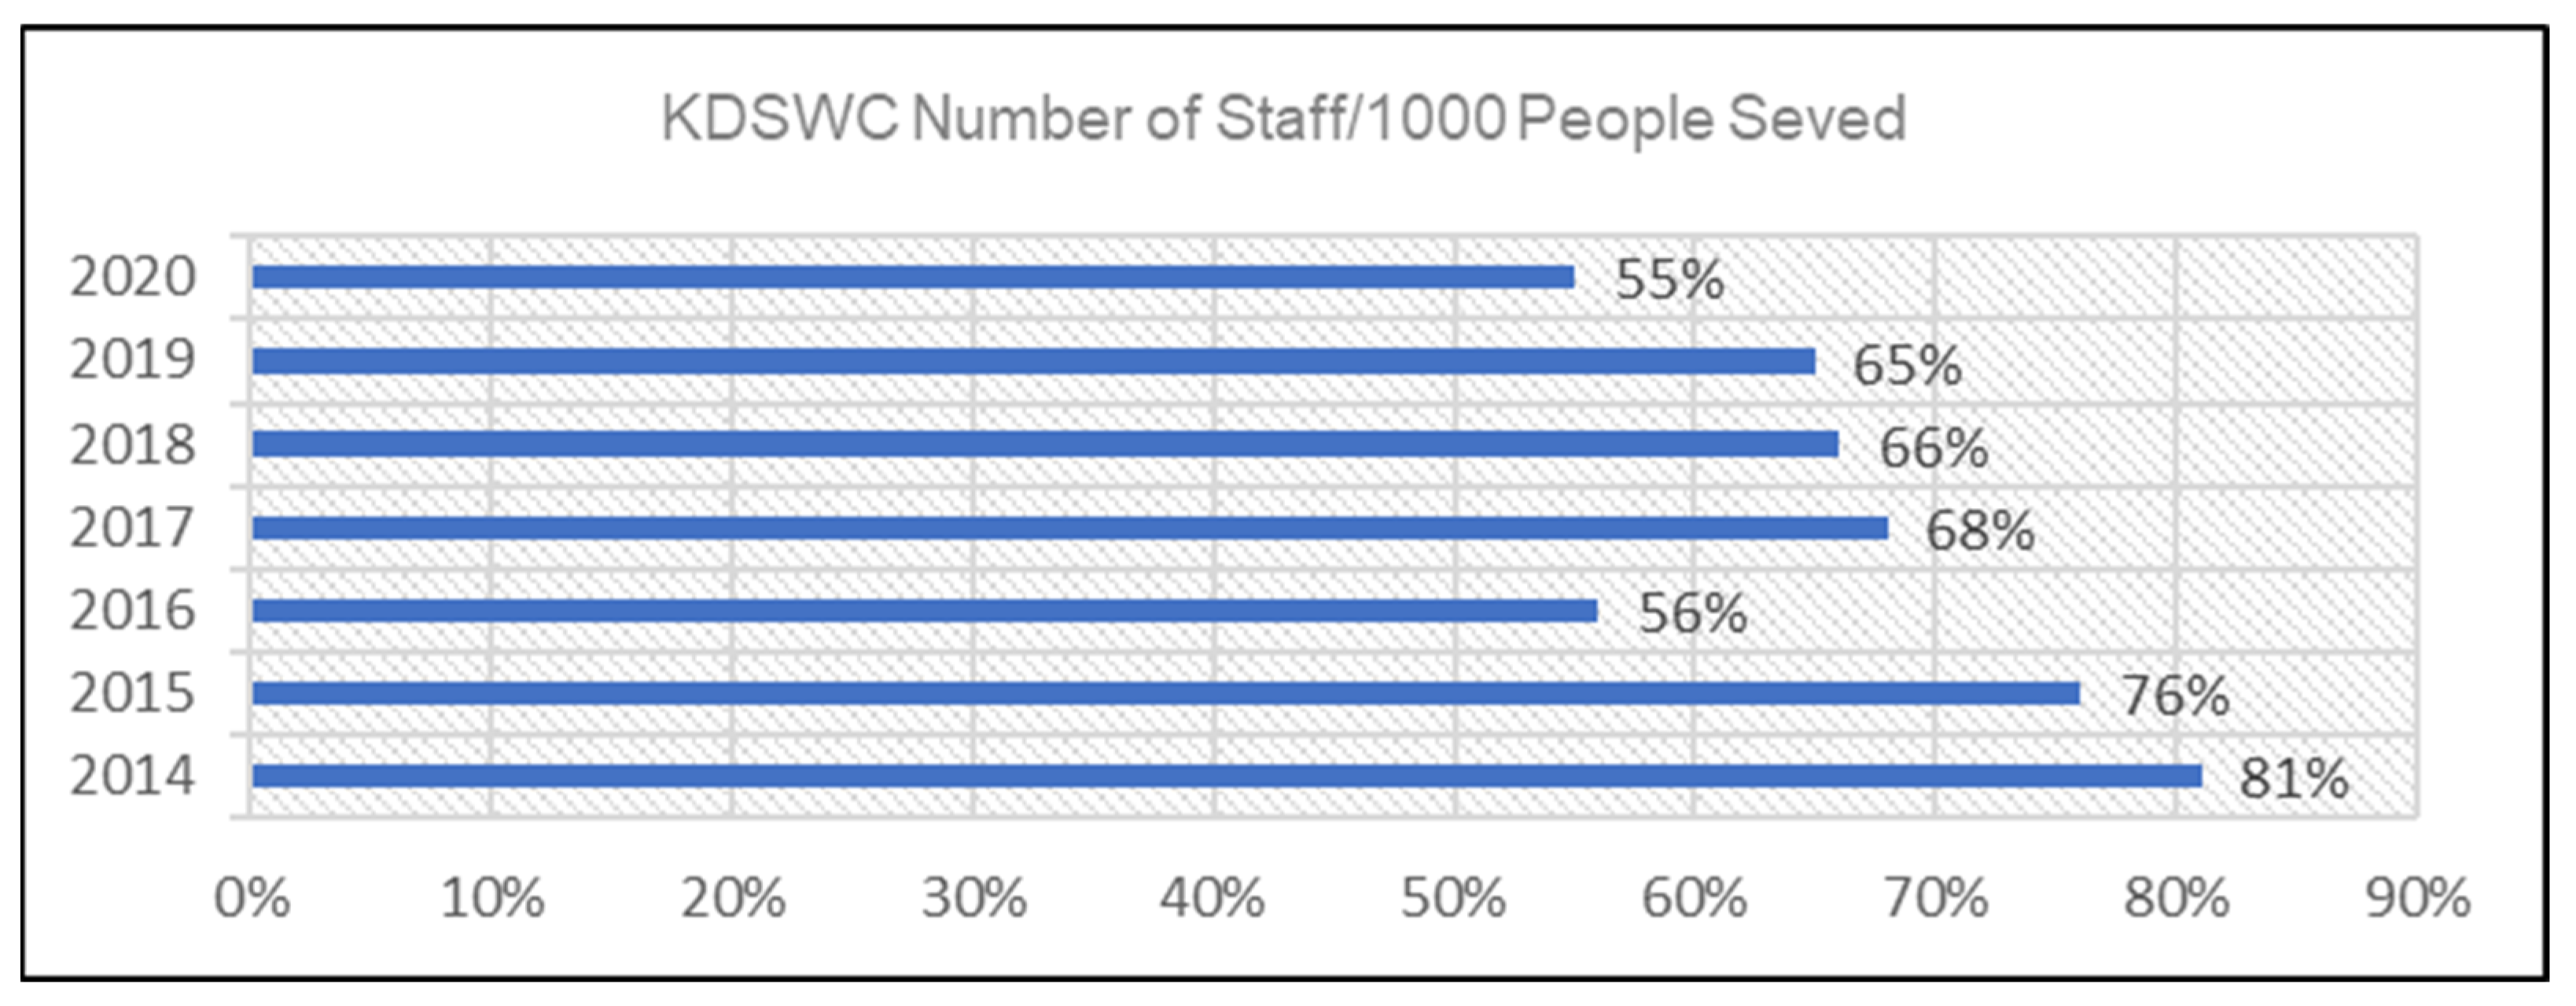
However, the staff-to-population ratio tells a different story (Figure 9). Starting at 81% in 2014, well above the 29% baseline for low- and middle-income country (LMIC) state water utilities (SWUs), it decreased to 56% in 2016, increased to 68% in 2017, and dropped to 55% in 2020, remaining above the 29% baseline.
5.2.4. Overall Key Performance Indicators for Efficiency of Operation and Maintenance
Table 8 displays the overall performance (OP) scores for the staff-to-connections ratio from 2014 to 2020. Lagos Water Corporation (LWC) ranks first with the lowest OP score of 3.7, followed by Cross River State Water Board Limited (CRSWBL) and Kaduna State Water Corporation (KDSWC) with OP scores of 4.1 and 5.7, respectively.
While LWC’s performance score increased from 10 in 2015 to 18 in 2020, that of CRSWBL and KDSWC decreased from 14 and 18 in 2015 to 10 and 12, respectively, in 2020, as shown in Table 8.
Table 9 indicates that only LWC scored below the baseline of 29%, with a score of 23% in 2020, compared to CRSWBL and KDSWC with overall performance (OP) scores of 4.1 and 6.0, respectively.
Although KDSWC reduced its staff-to-population ratio slightly to 56% in 2020 from 76% in 2015, CRSWBL’s ratio increased from 37% in 2015 to 55% by 2020. None are efficient in personnel use relative to the served population.
5.3. Efficiency of Investment
Maintenance, crucial to the pipe network but often neglected for visible assets, accounts for 70% of asset value. Non-revenue water (NRW), the difference between water supplied and water sold, should be below a 23% baseline in a low- or middle-income country (LMIC) state water utility (SWU).
5.3.1. Lagos Water Corporation (LWC)
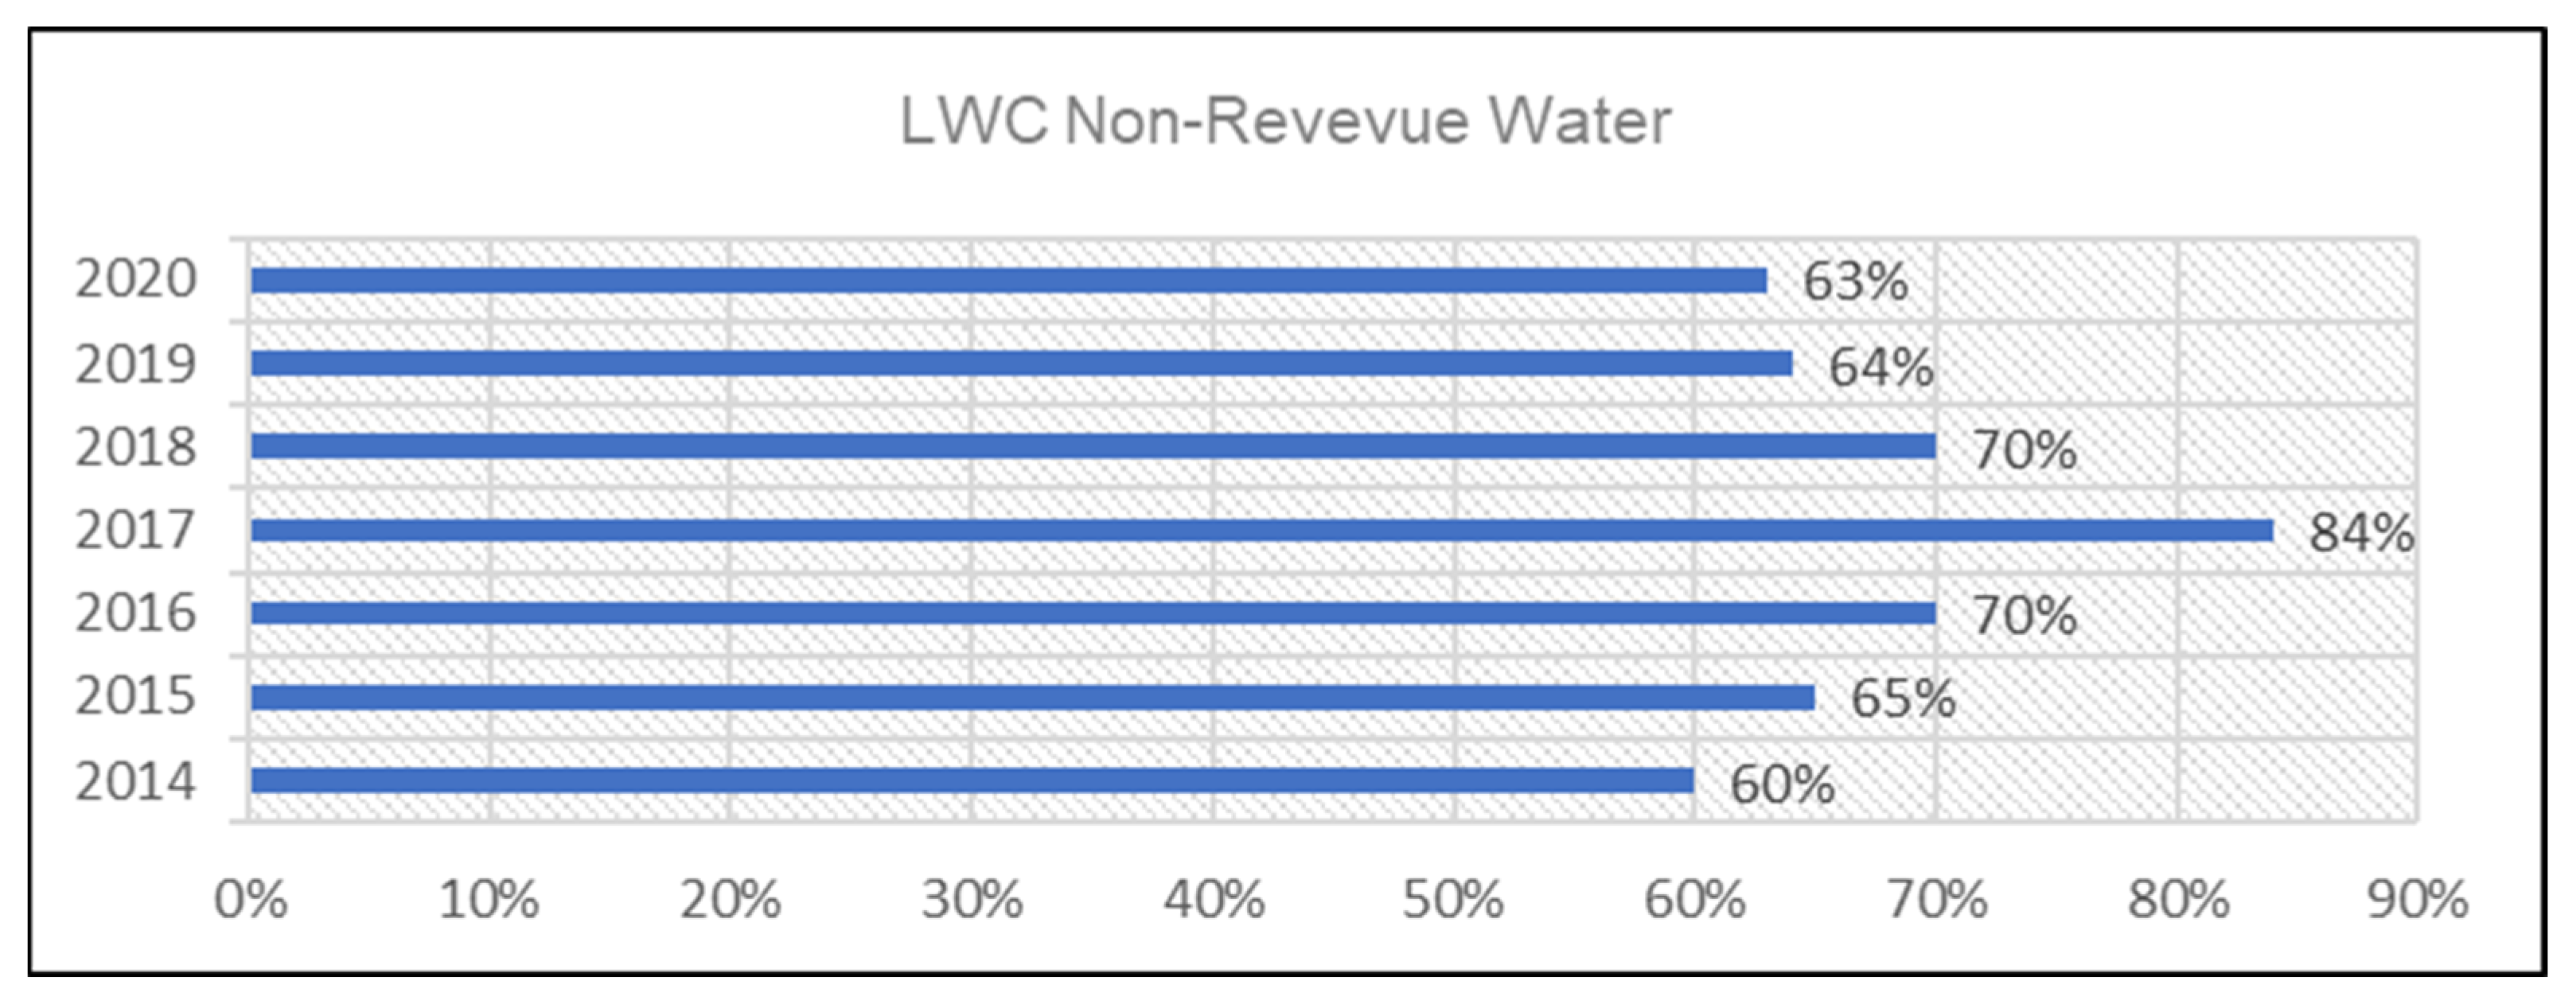
The Lagos Water Corporation (LWC) non-revenue water (NRW) exceeded the 23% baseline consistently from 2014 (60%) to 2020 (63%). The highest NRW was recorded in 2017, when it peaked at 84% (Figure 10). It was observed during fieldwork that pipe bursts occurred on a daily basis due to the aging pipe network and pressure in the supply line. Some were laid during the colonial era and have not been replaced. The proportion of NRW which is rising is lost to such wastages and illegal connections.
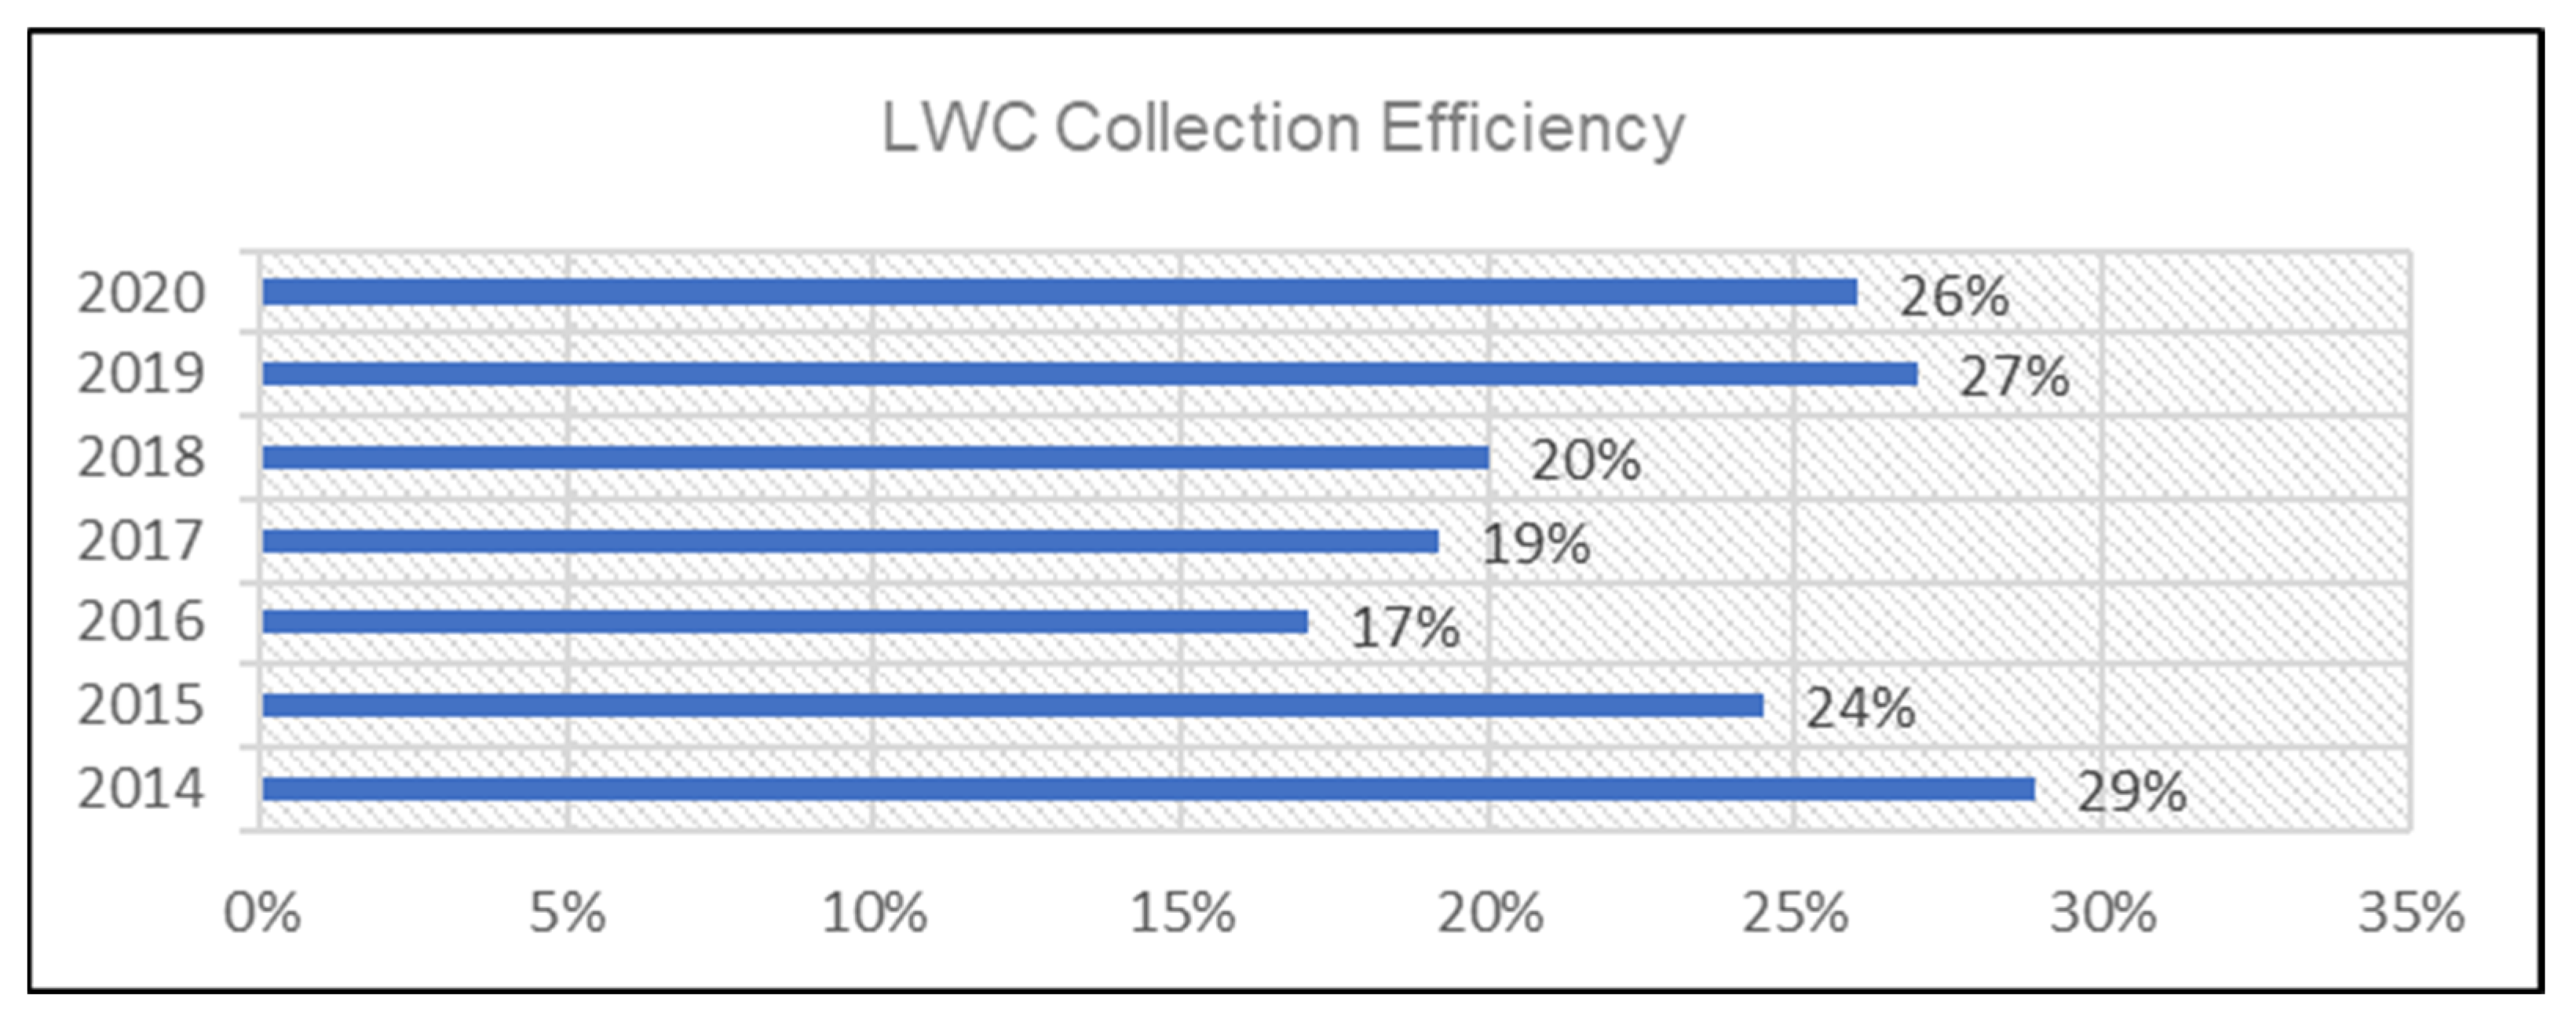
The efficiency of the bill collection of LWC further dropped from 29% in 2014 to 26% in 2020, reflecting difficulties in collecting bills as shown in Figure 11. LWC finds it difficult to collect the bills generated for their customers. Bill collectors find it hard to locate most of the addresses on the bill generated during connection.
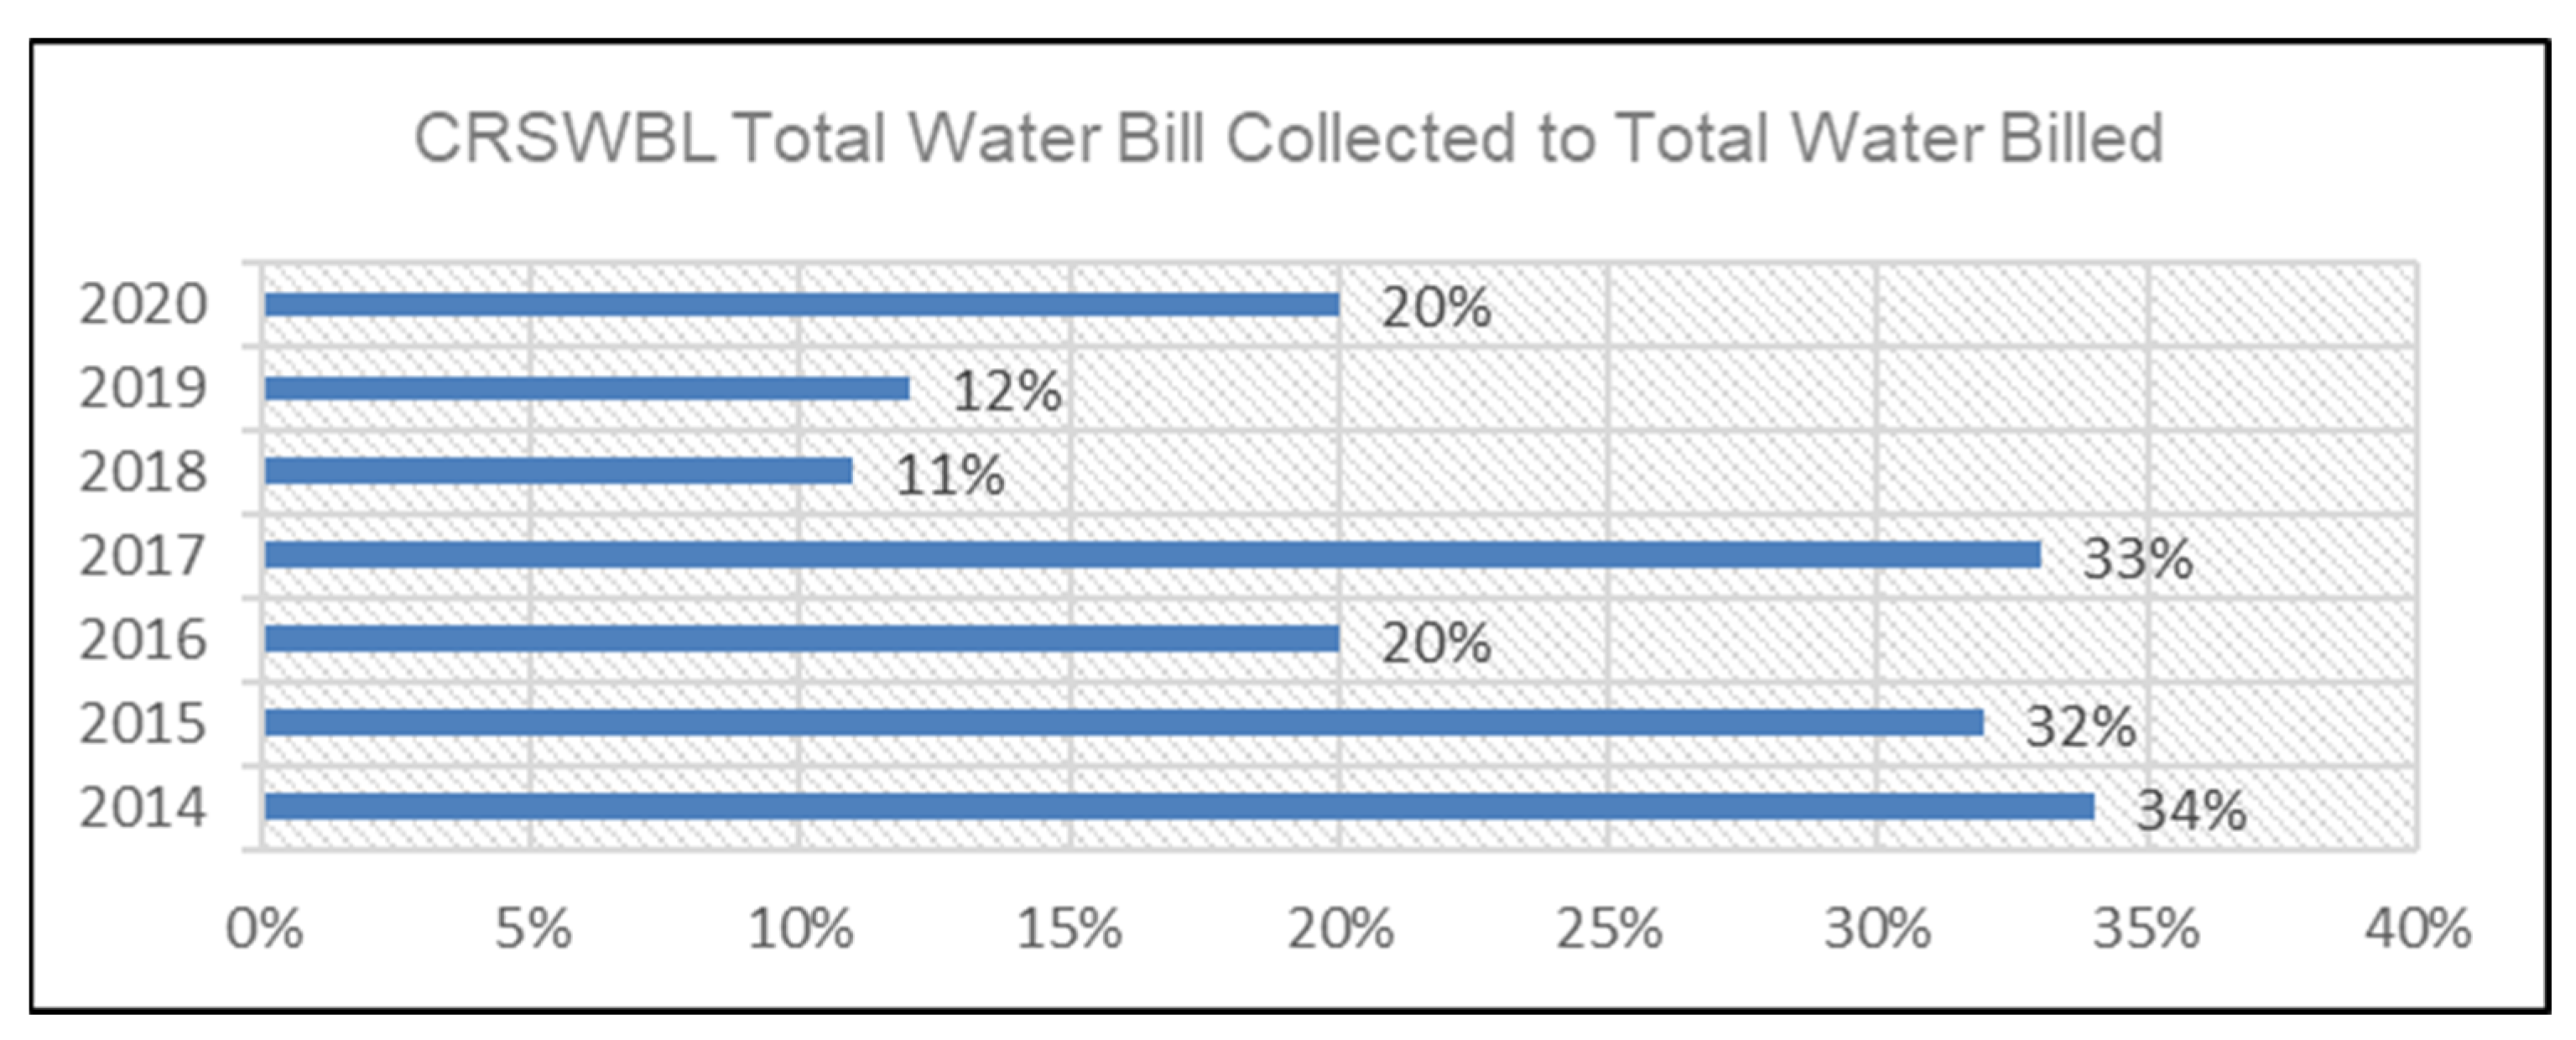
5.3.2. Cross River State Water Board Limited (CRSWBL)
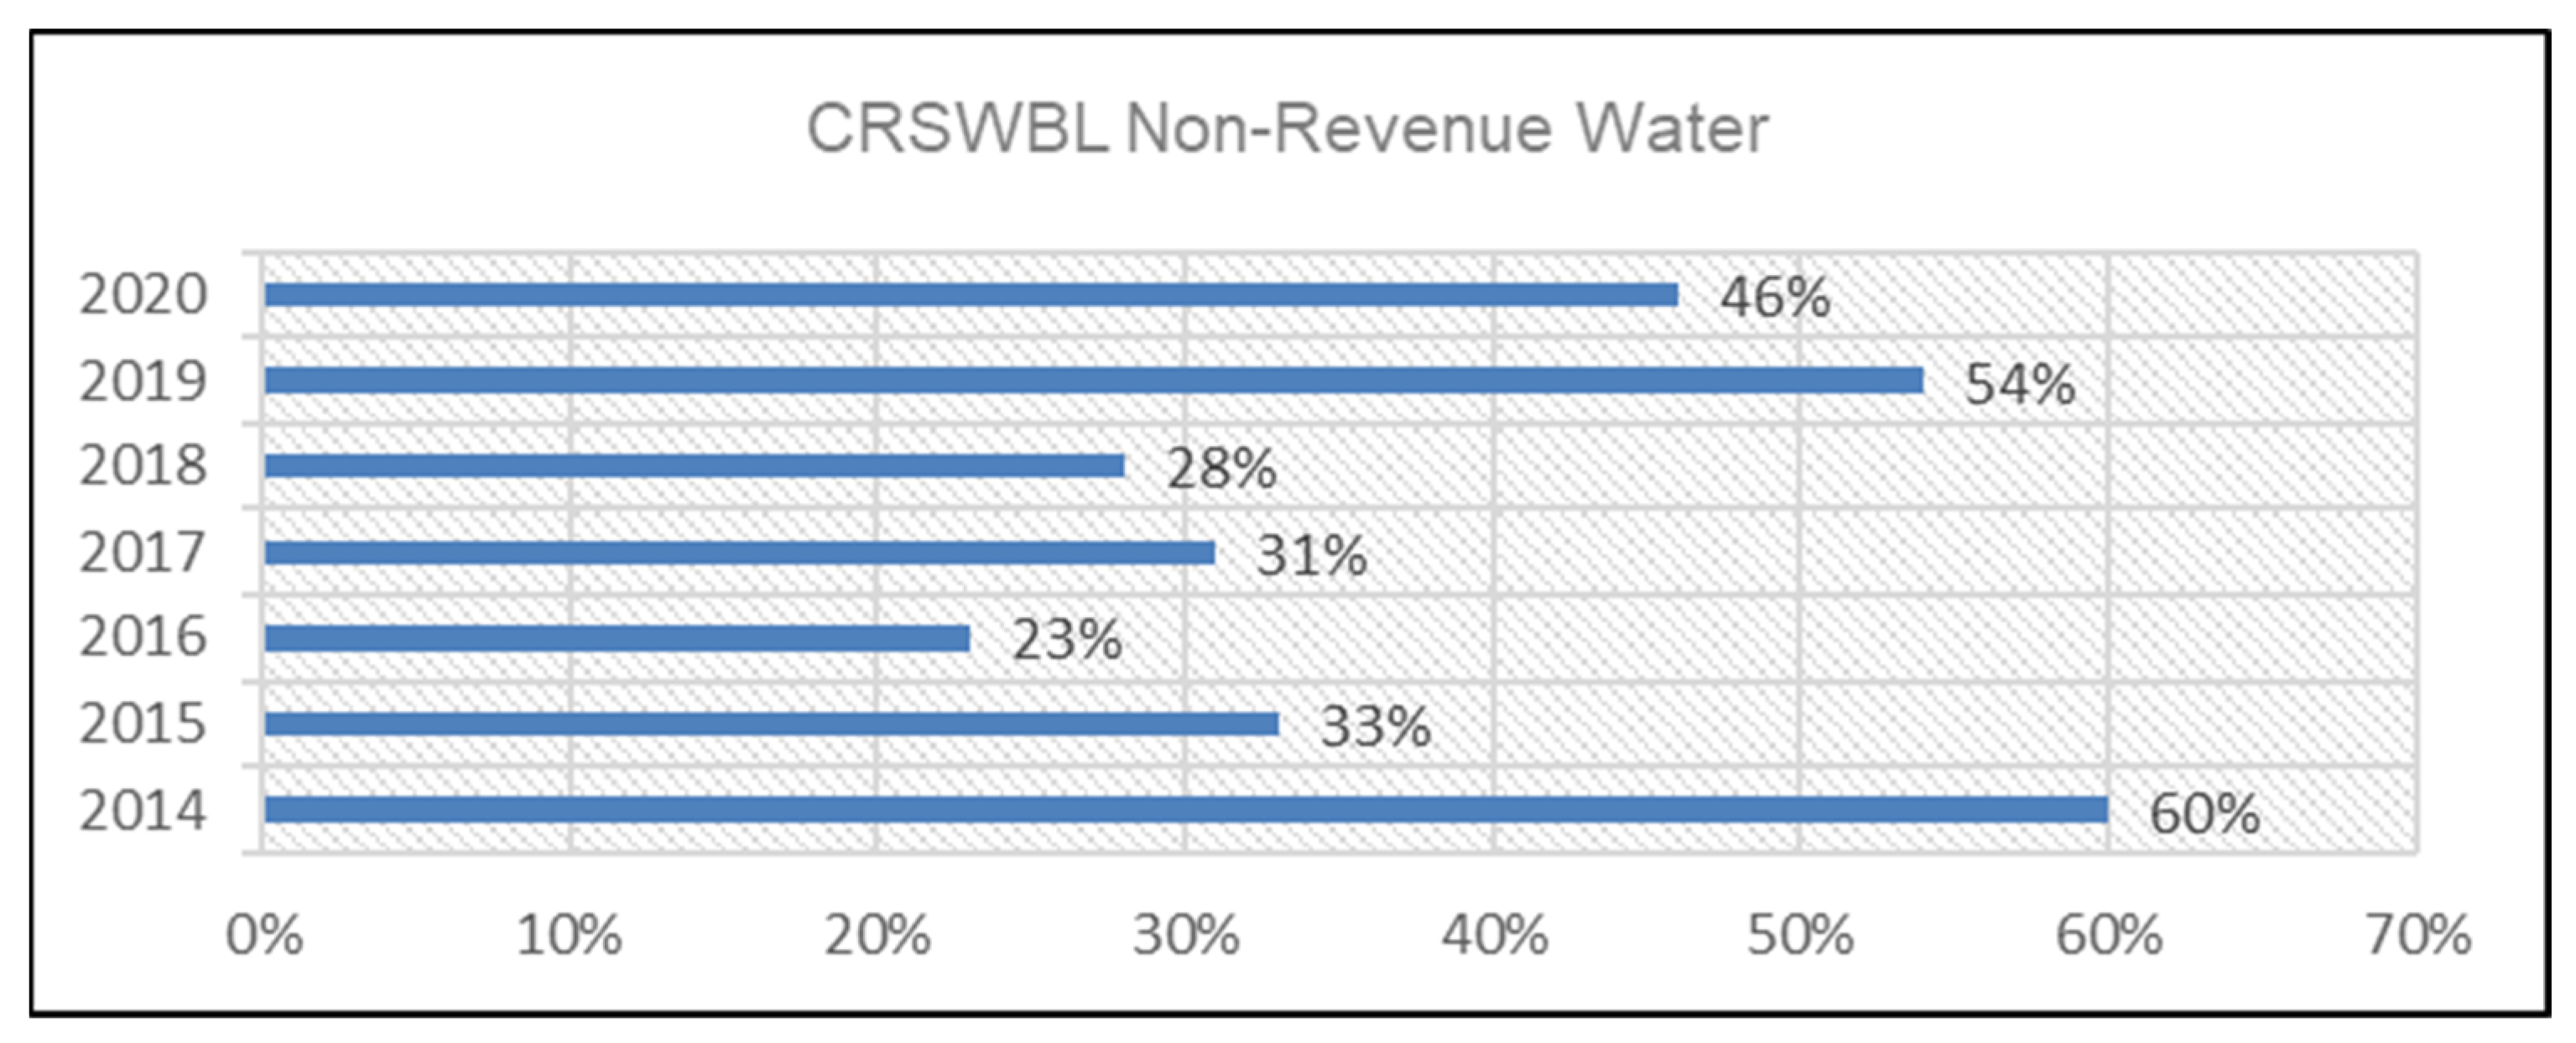
Cross River State Water Board Limited (CRSWBL) reduced non-revenue water drastically from 60% in 2014 to the allowable 23% for water utilities in developing countries in 2016, as shown in Figure 12, but it increased to around 46% in 2020.
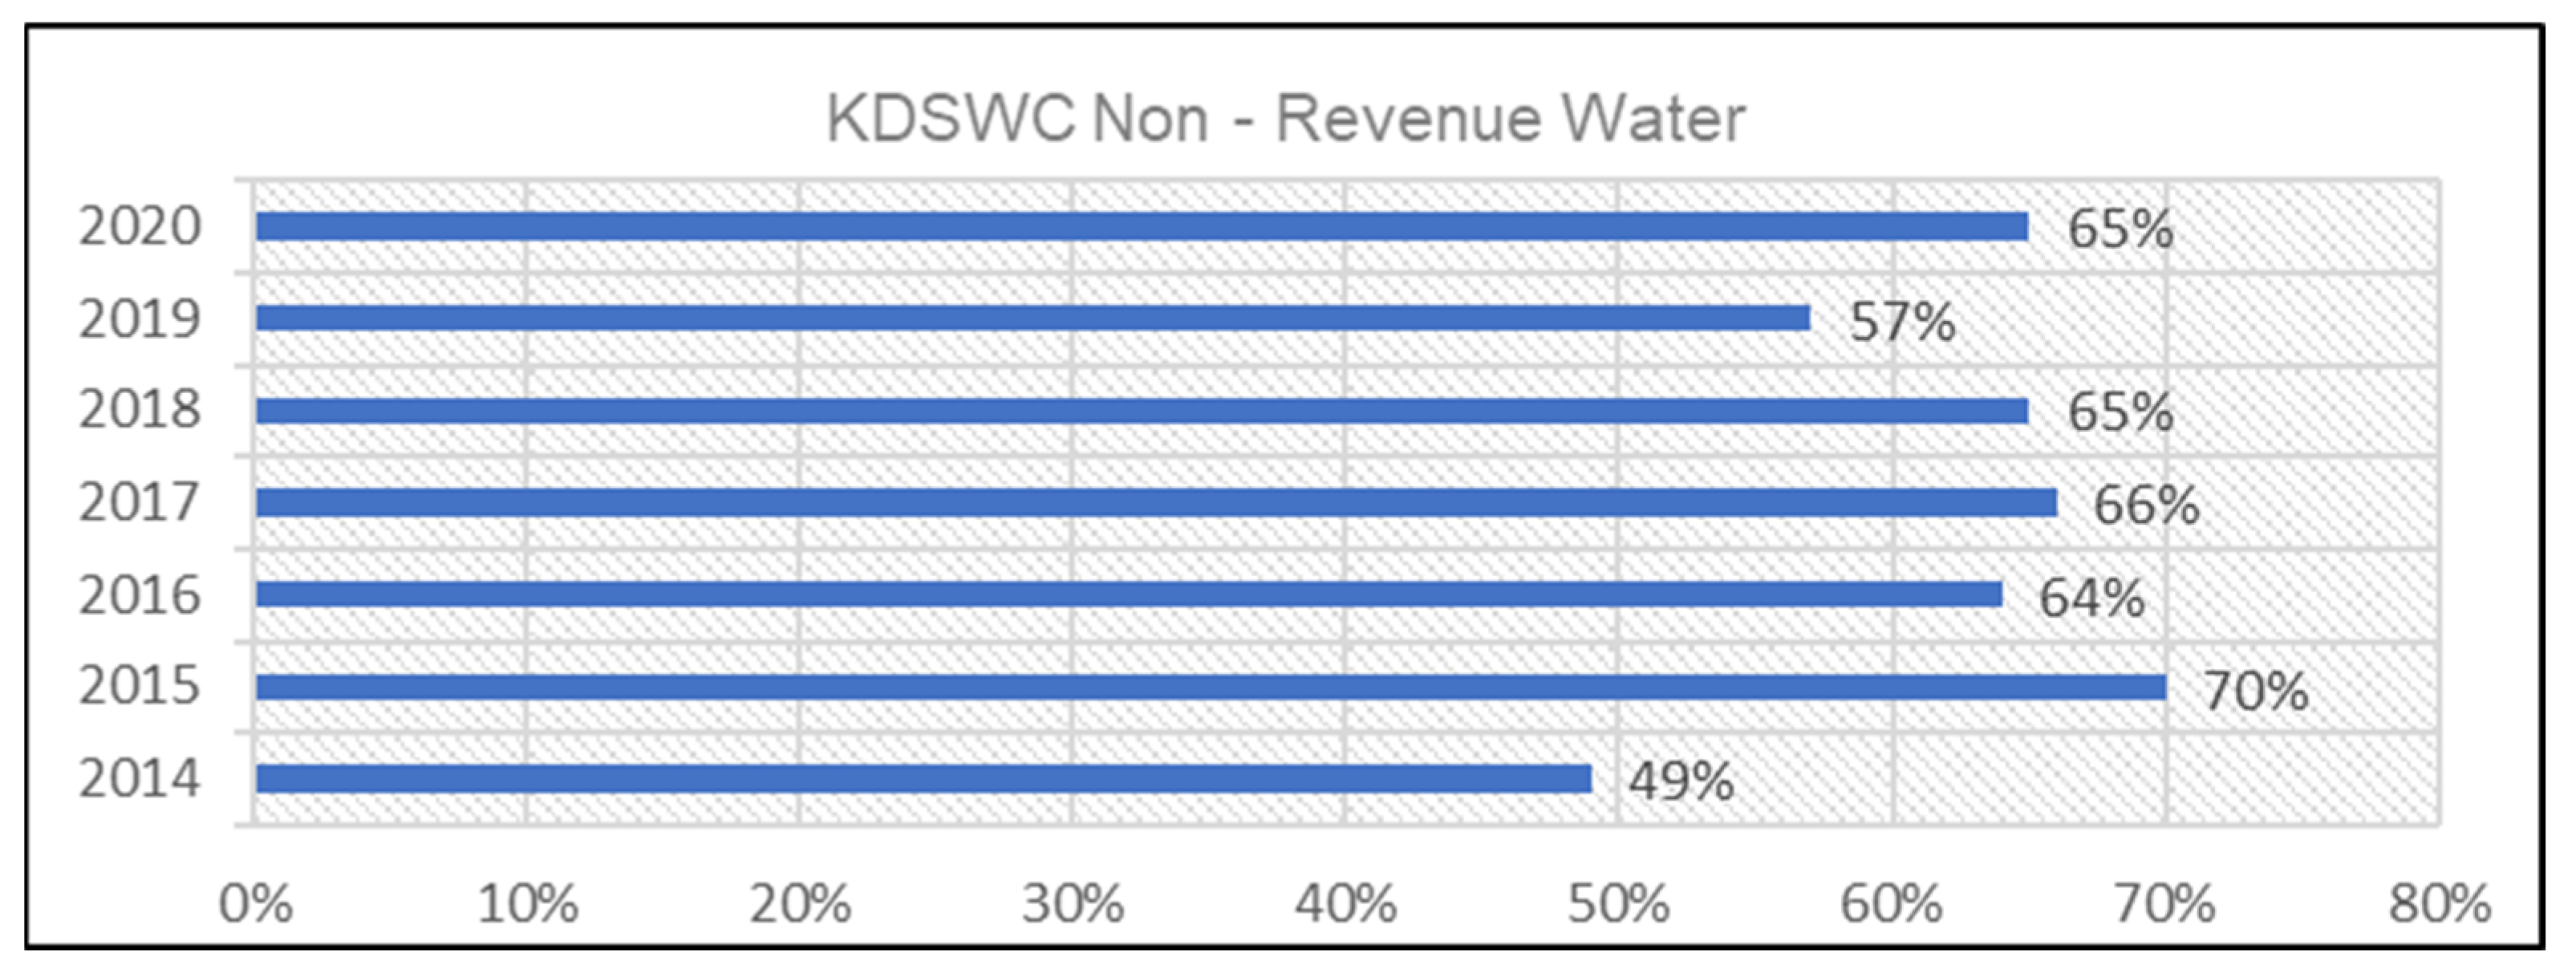
5.3.3. Kaduna State Water Corporation (KDSWC)
Kaduna State Water Corporation (KDSWC) non-revenue water increased to 65% in 2020 from 49% in 2014 as shown in Figure 14. This is common to all state water utilities (SWUs) in Nigeria evaluated during this period.
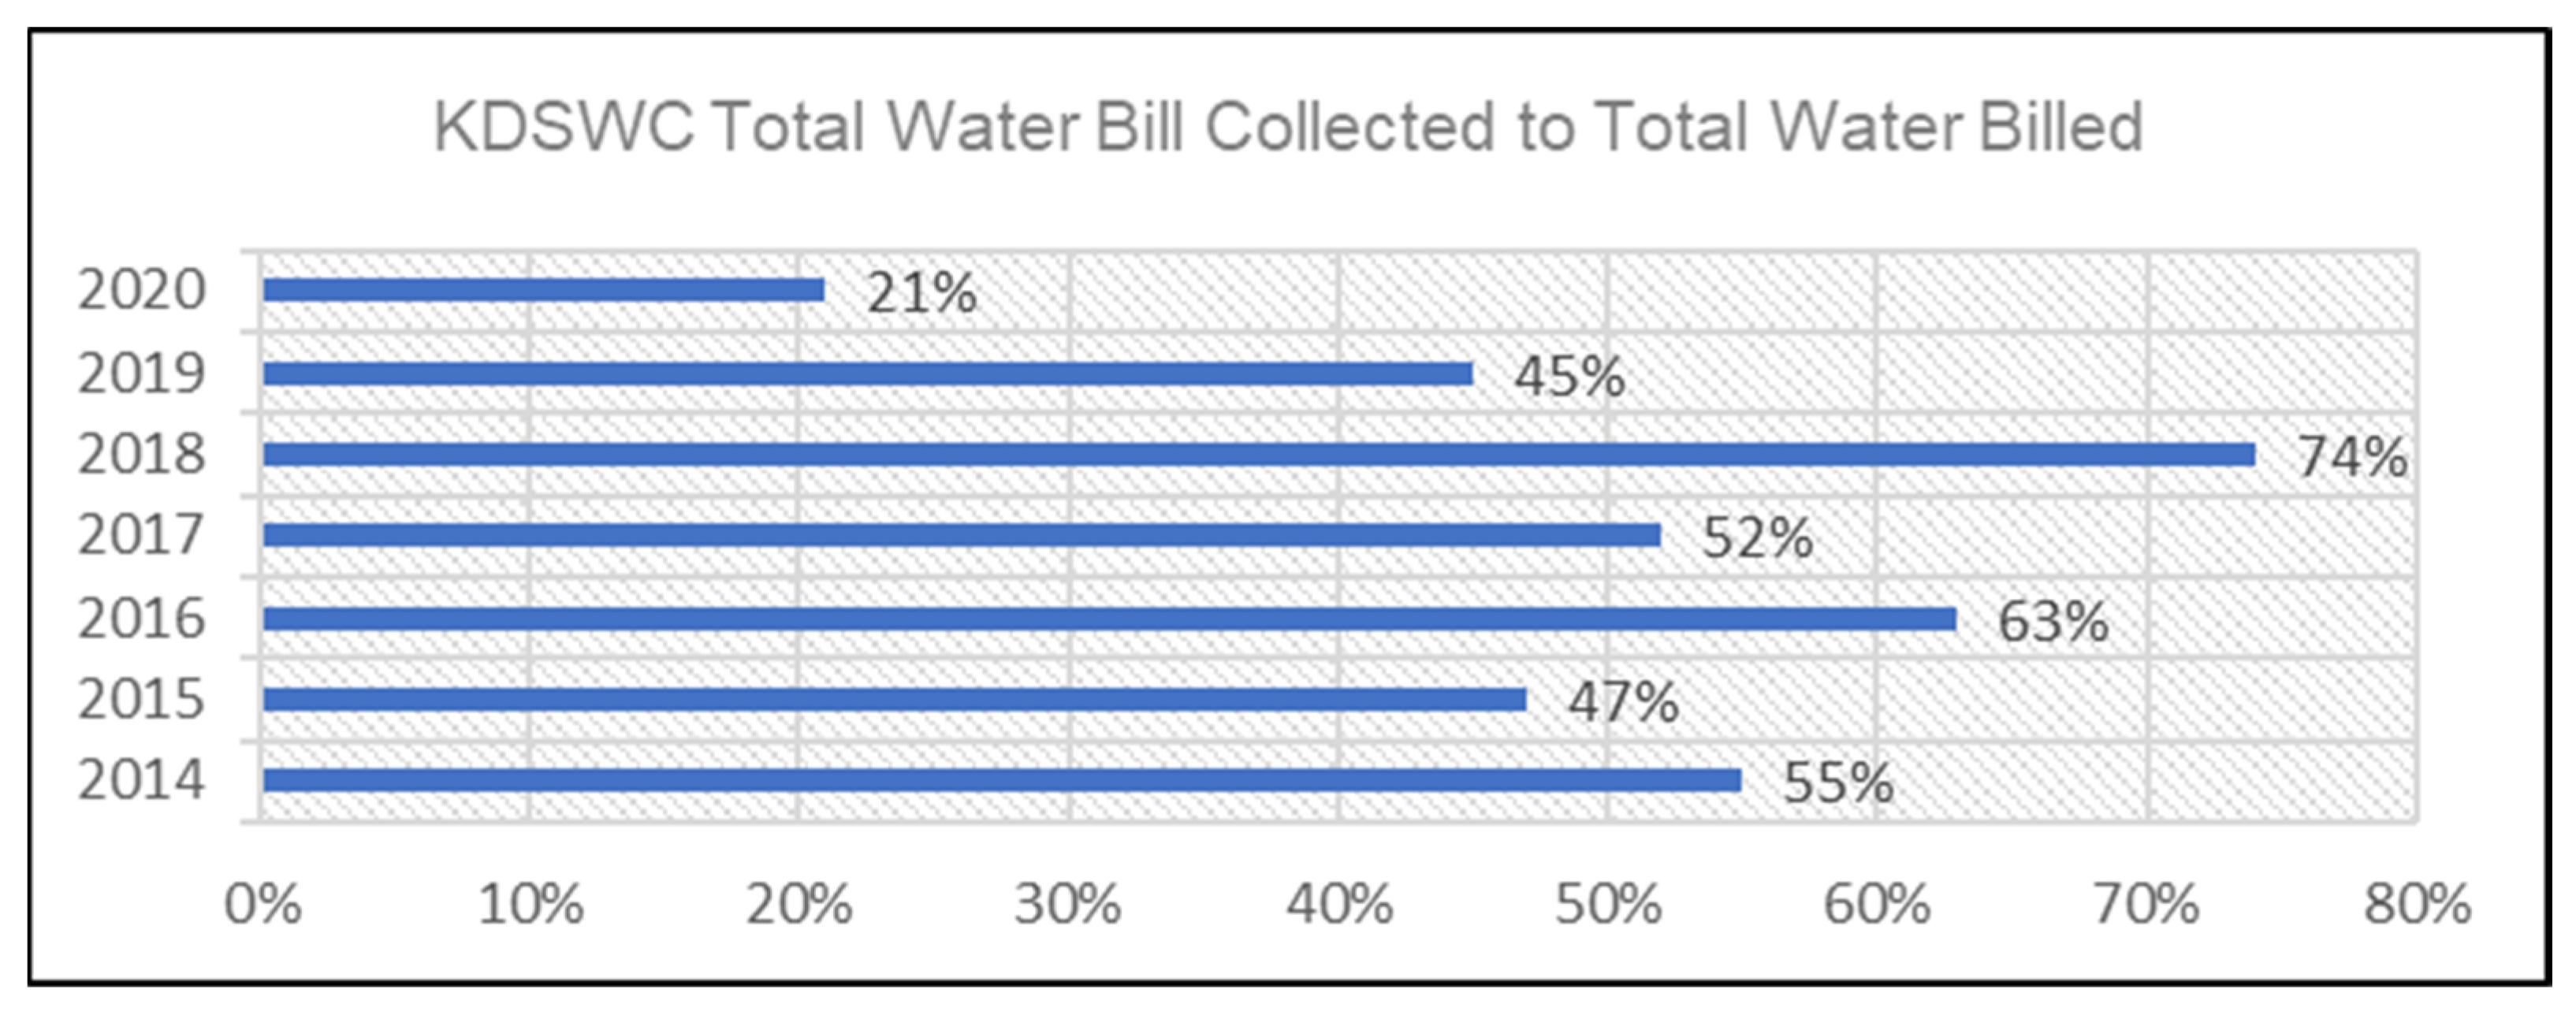
KDSWC bill collection efficiency fluctuated, averaging 50% in 2020, from 55% in 2014, to 74% in 2018, then down to 21% in 2020 as shown in Figure 15. The 74% achieved in 2018 was because of the recovery of outstanding bills collected including the recurrent year’s bills.
5.3.4. Overall Performance Indicator of Efficiency of Investment
The state water utilities (SWUs) evaluated in 2020 recorded 63% for Lagos Water Corporation (LWC), 46% for Cross River State Water Board Limited (CRSWBL), and 65% for Kaduna State Water Corporation (KDSWC) as shown in Table 10. The allowable efficiency of investment overall performance indicator baseline score, for non-revenue water (NRW) in low- and middle-income countries (LMICs), is 23%. This signifies wastage in water supply and inefficient investment.
Amongst the three SWUs benchmarked, CRSWBL ranked first with an overall performance (OP) score of 3.1, KDSWC second with a score of 5.5, and LWC third with a score of 5.9. CRSWBL recorded an NRW score of 33% in 2015 but it increased to 46% in 2020. LWC’s score reduced from 65% in 2015 to 63% in 2020, while KDSWC managed to reduce its NRW from 70% in 2015 to 65% in 2020.
None of the three SWUs were able to collect 50% of the water sold according to the billing efficiency in Table 11. While LWC billing efficiency increased from 17% in 2015 to 26% in 2020, those of CRSWBL and KDSWC reduced from 32% and 47% in 2015 to 20% and 21%, respectively, in 2020.
5.4. Financial Sustainability
Failure to recover costs leads to underinvestment in assets, weakened operation, and declining service quality. A simple measure of cost recovery is the working ratio, which is the ratio of the total annual operational expenses, to total annual pre-tax collections from billing and subsidies, excluding depreciation and debt service. A mean score of more than one indicates the utility fails to recover even the operating costs from annual revenue [1,37,39].
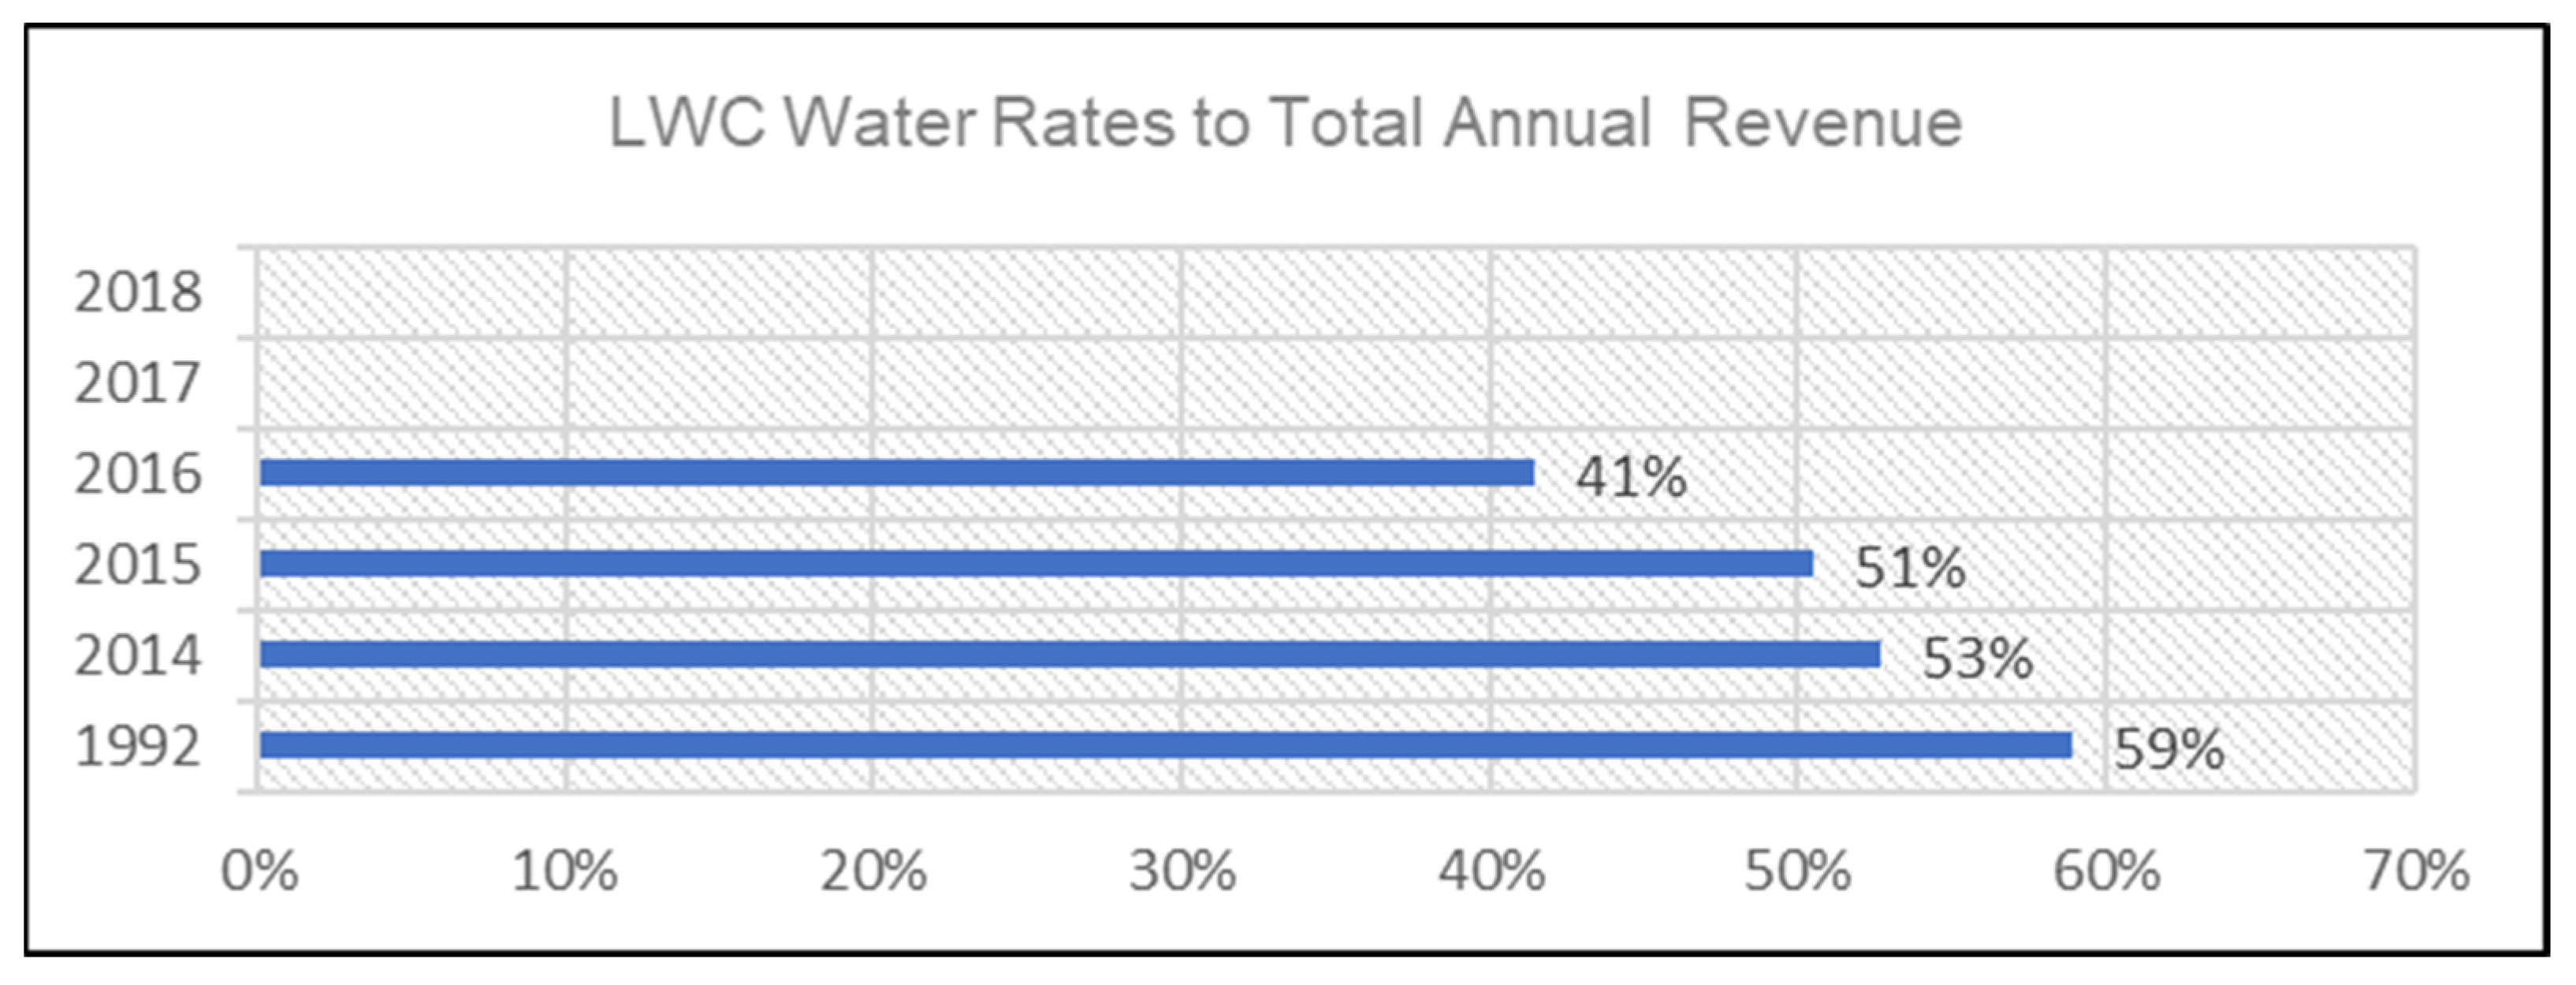
5.4.1. Lagos Water Corporation (LWC)
Figure 16 shows that water rates accounted for just 53% in 2014, dropping to 51% in 2015 and 41% in 2016. That implies that Lagos Water Corporation (LWC) must source funds elsewhere to bridge the gap.
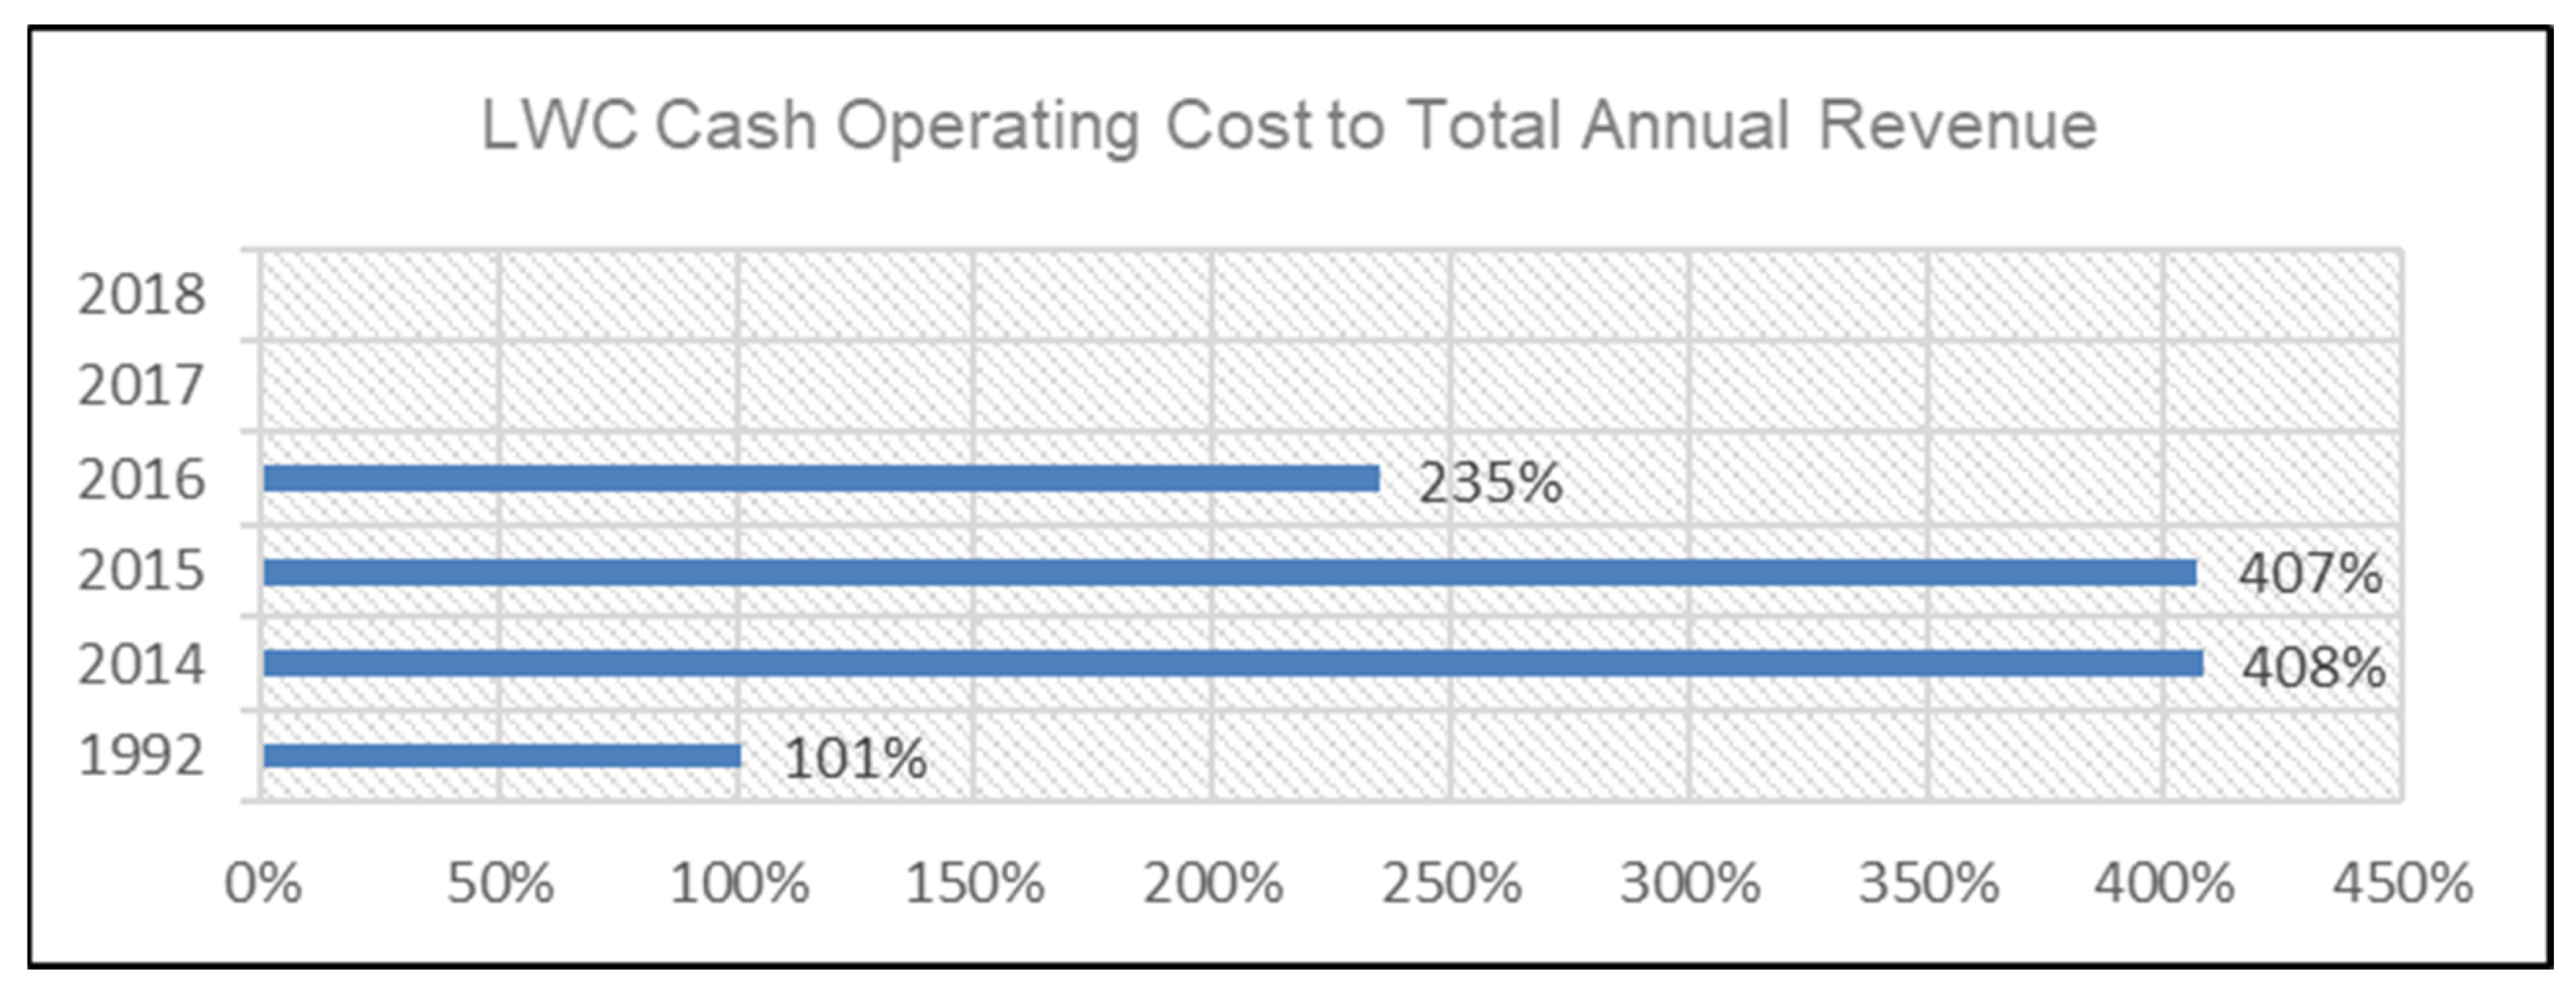
Also, the total annual revenue did not cover cash operating cost, which means the income generated does not cover the expenditure. This resulted in a high working ratio of 408% in 2014, down to 235% in 2016, as shown in Figure 17. The cash operating cost should be less than 100% to break even.
5.4.2. Cross River State Water Board Limited (CRSWBL)
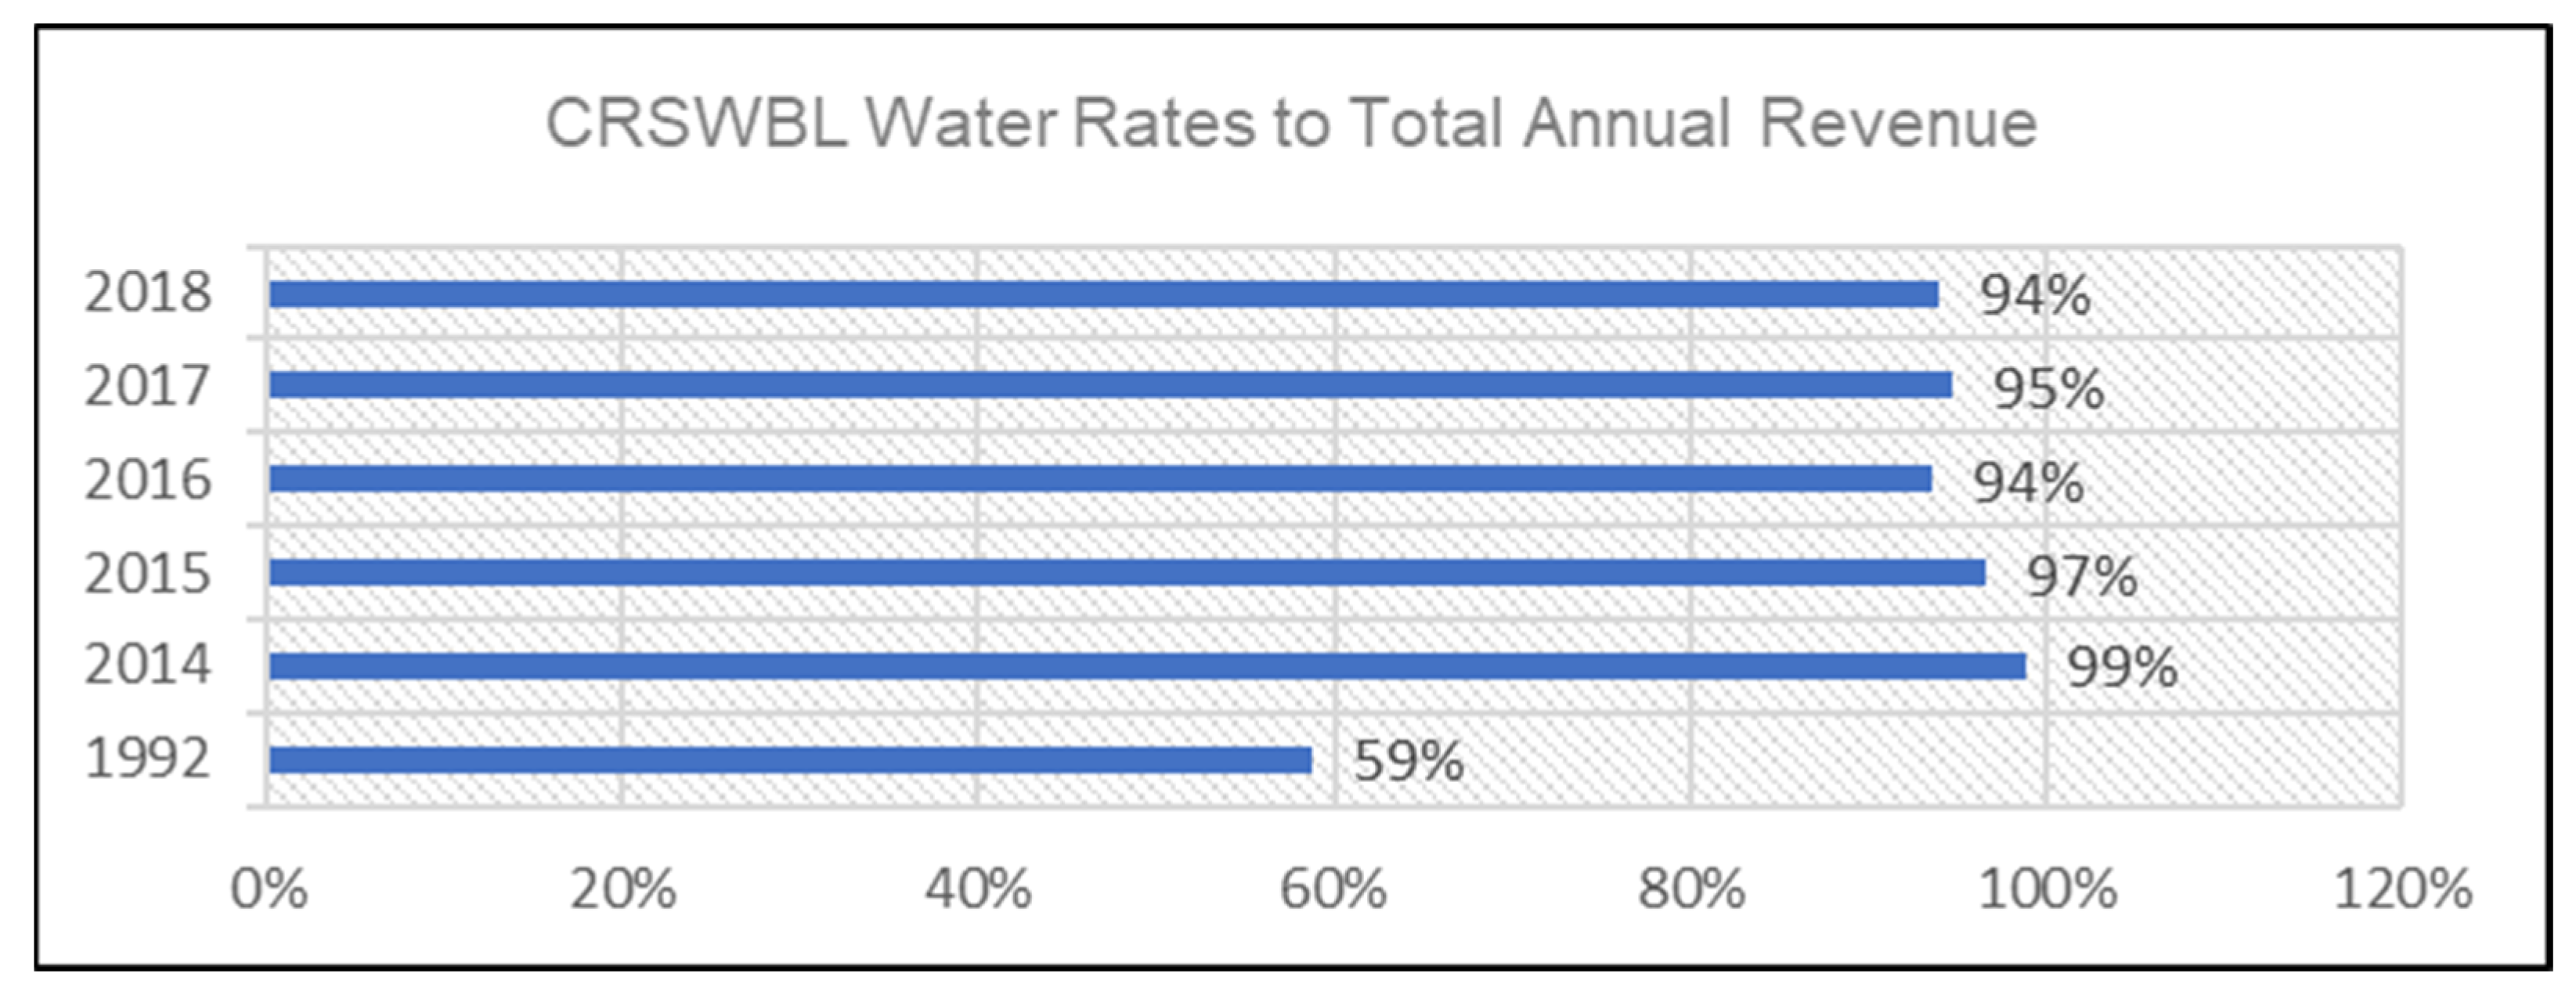
Cross River State Water Board Limited (CRSWBL) through the reform program embraced a public–private partnership (PPP) in form of management contract in 2013. That is why water rates accounted for almost 100% of the total annual revenue in 2014, from 59% in 1992, as shown in Figure 18.
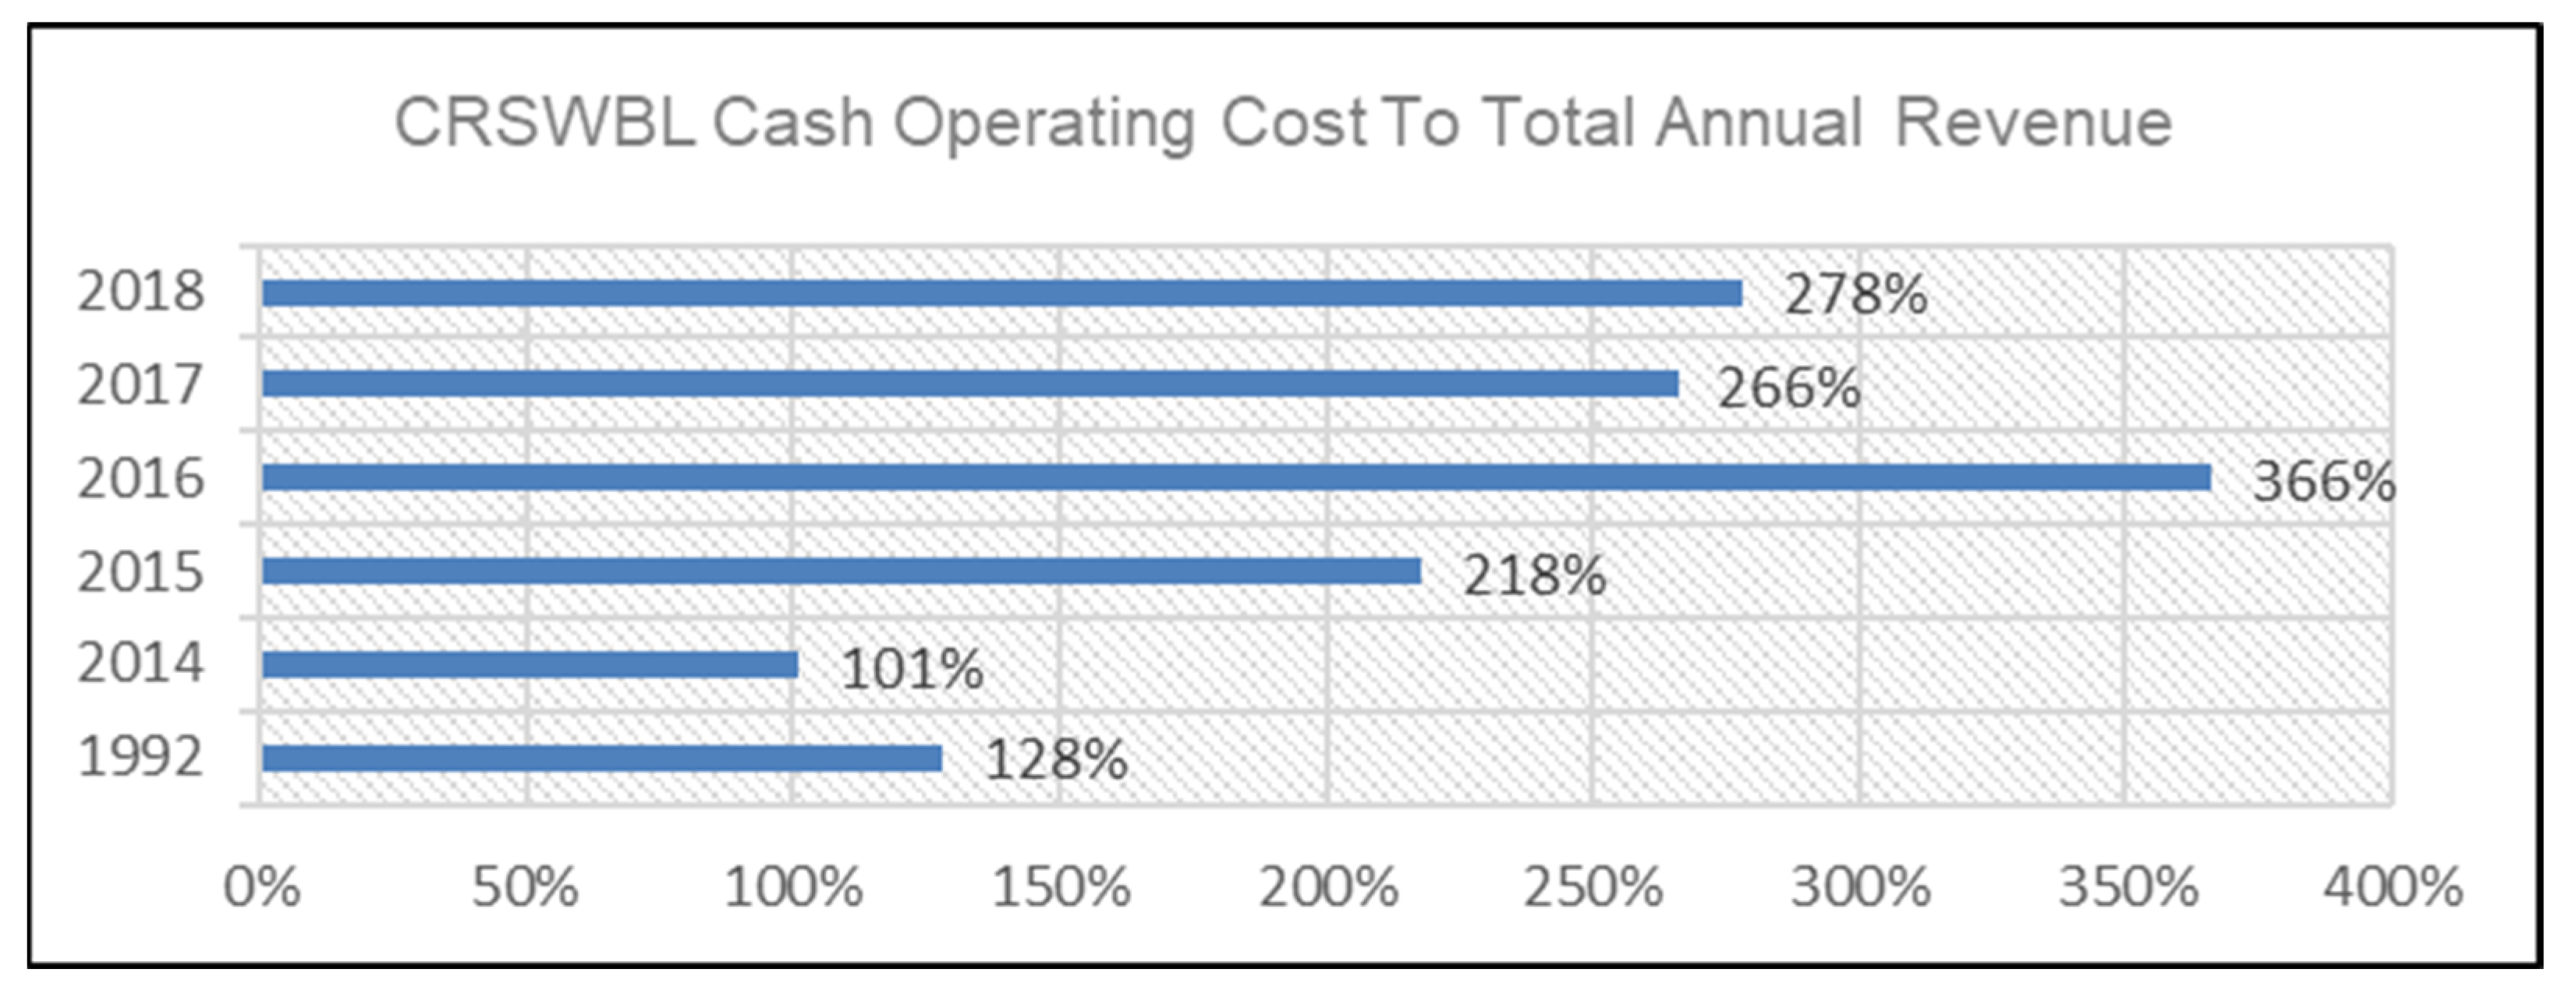
Similarly, a lot of water projects were carried out during this same period to expand the existing water schemes and build new ones, including pipe network expansion, funded mostly by the World Bank and the African Development Bank. This accounts for why the cash operating cost increased from 101% in 2014 to 278% in 2018, as shown in Figure 19.
5.4.3. Kaduna State Water Corporation (KDSWC)
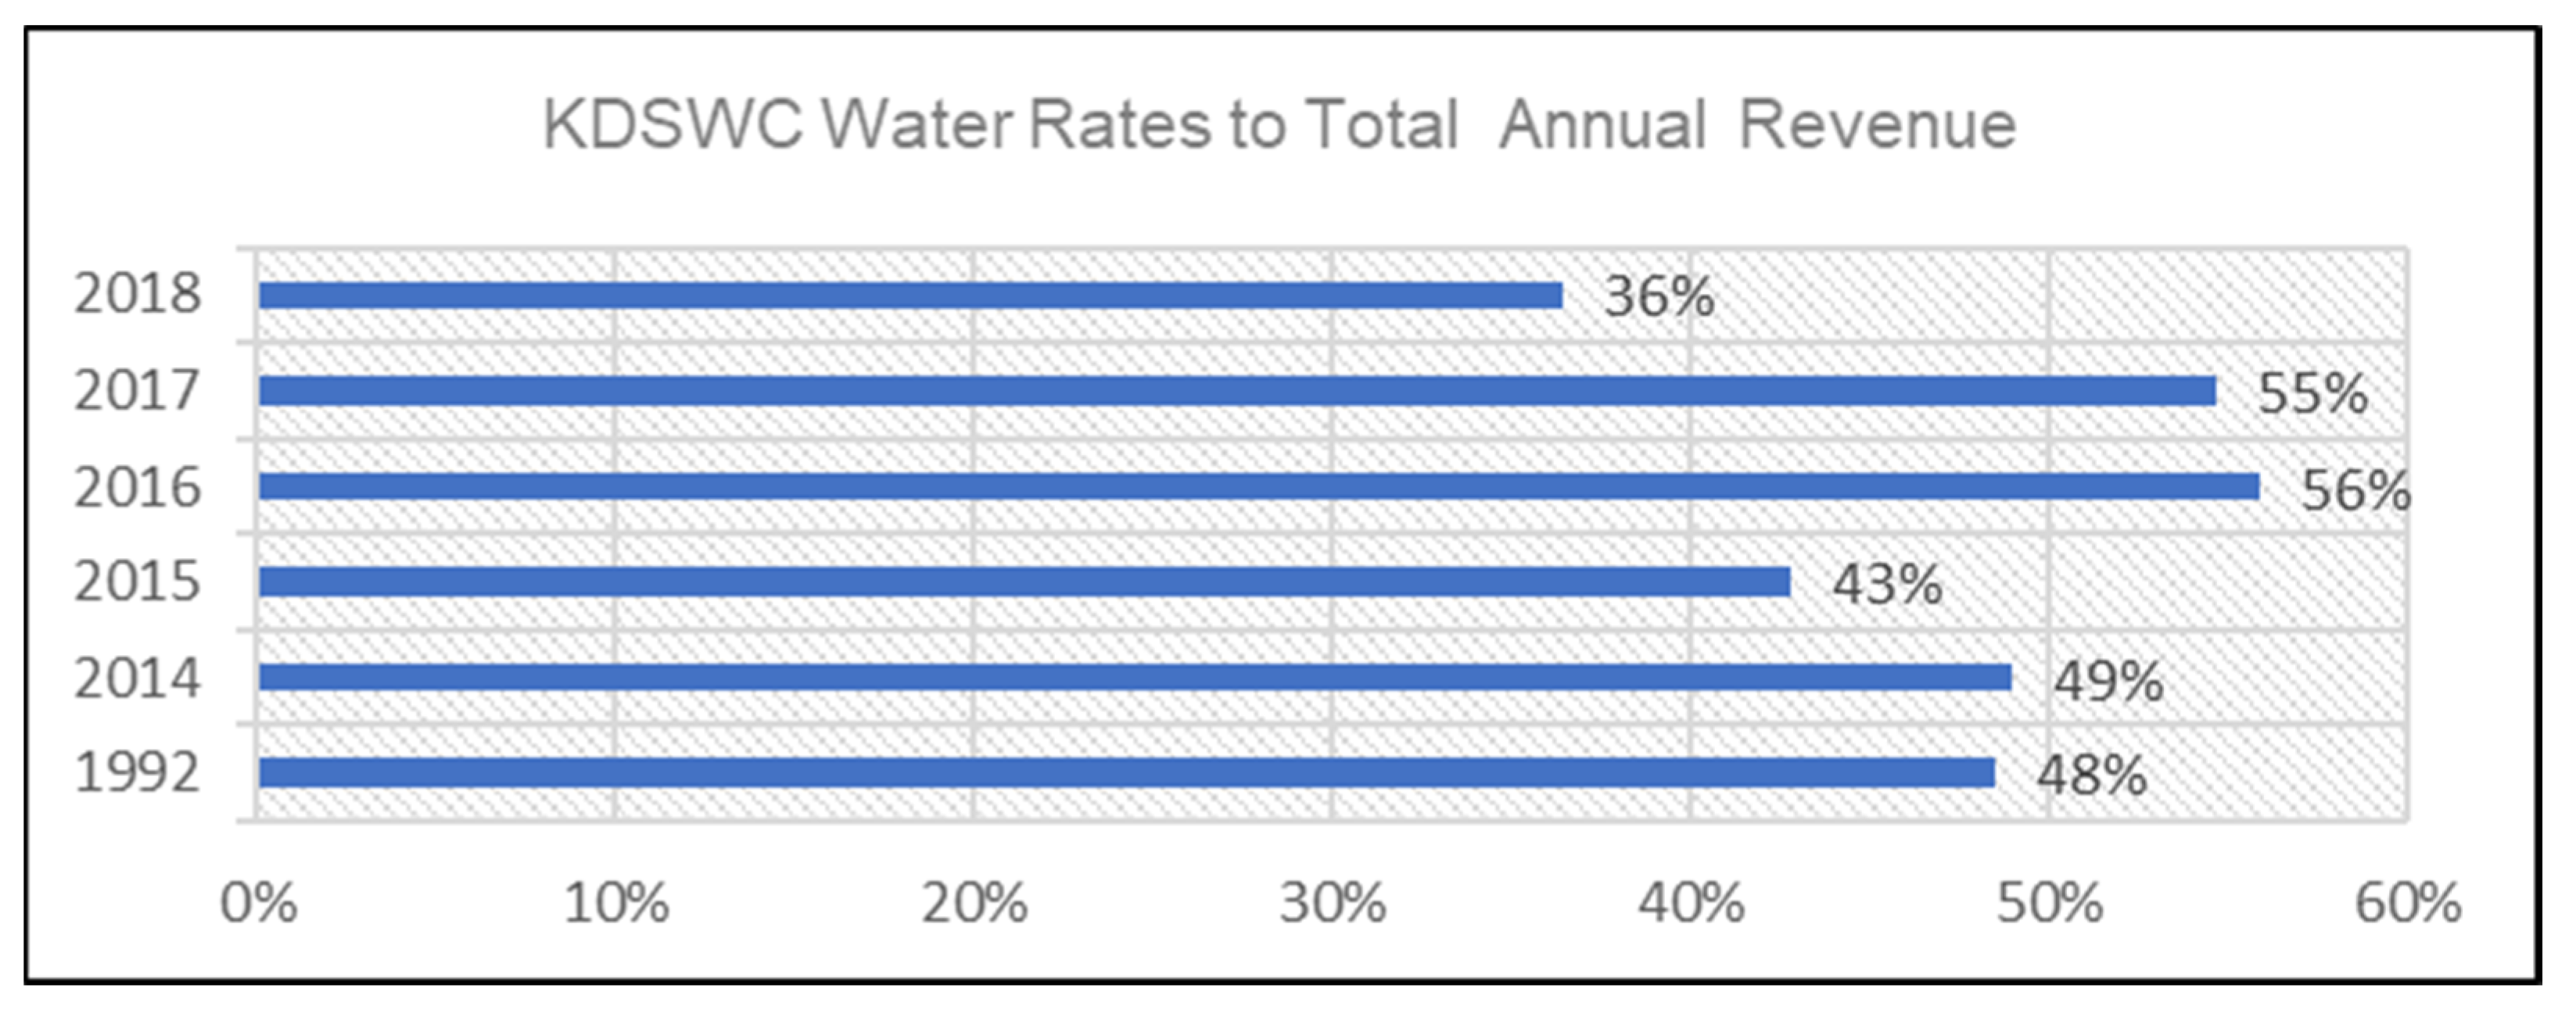
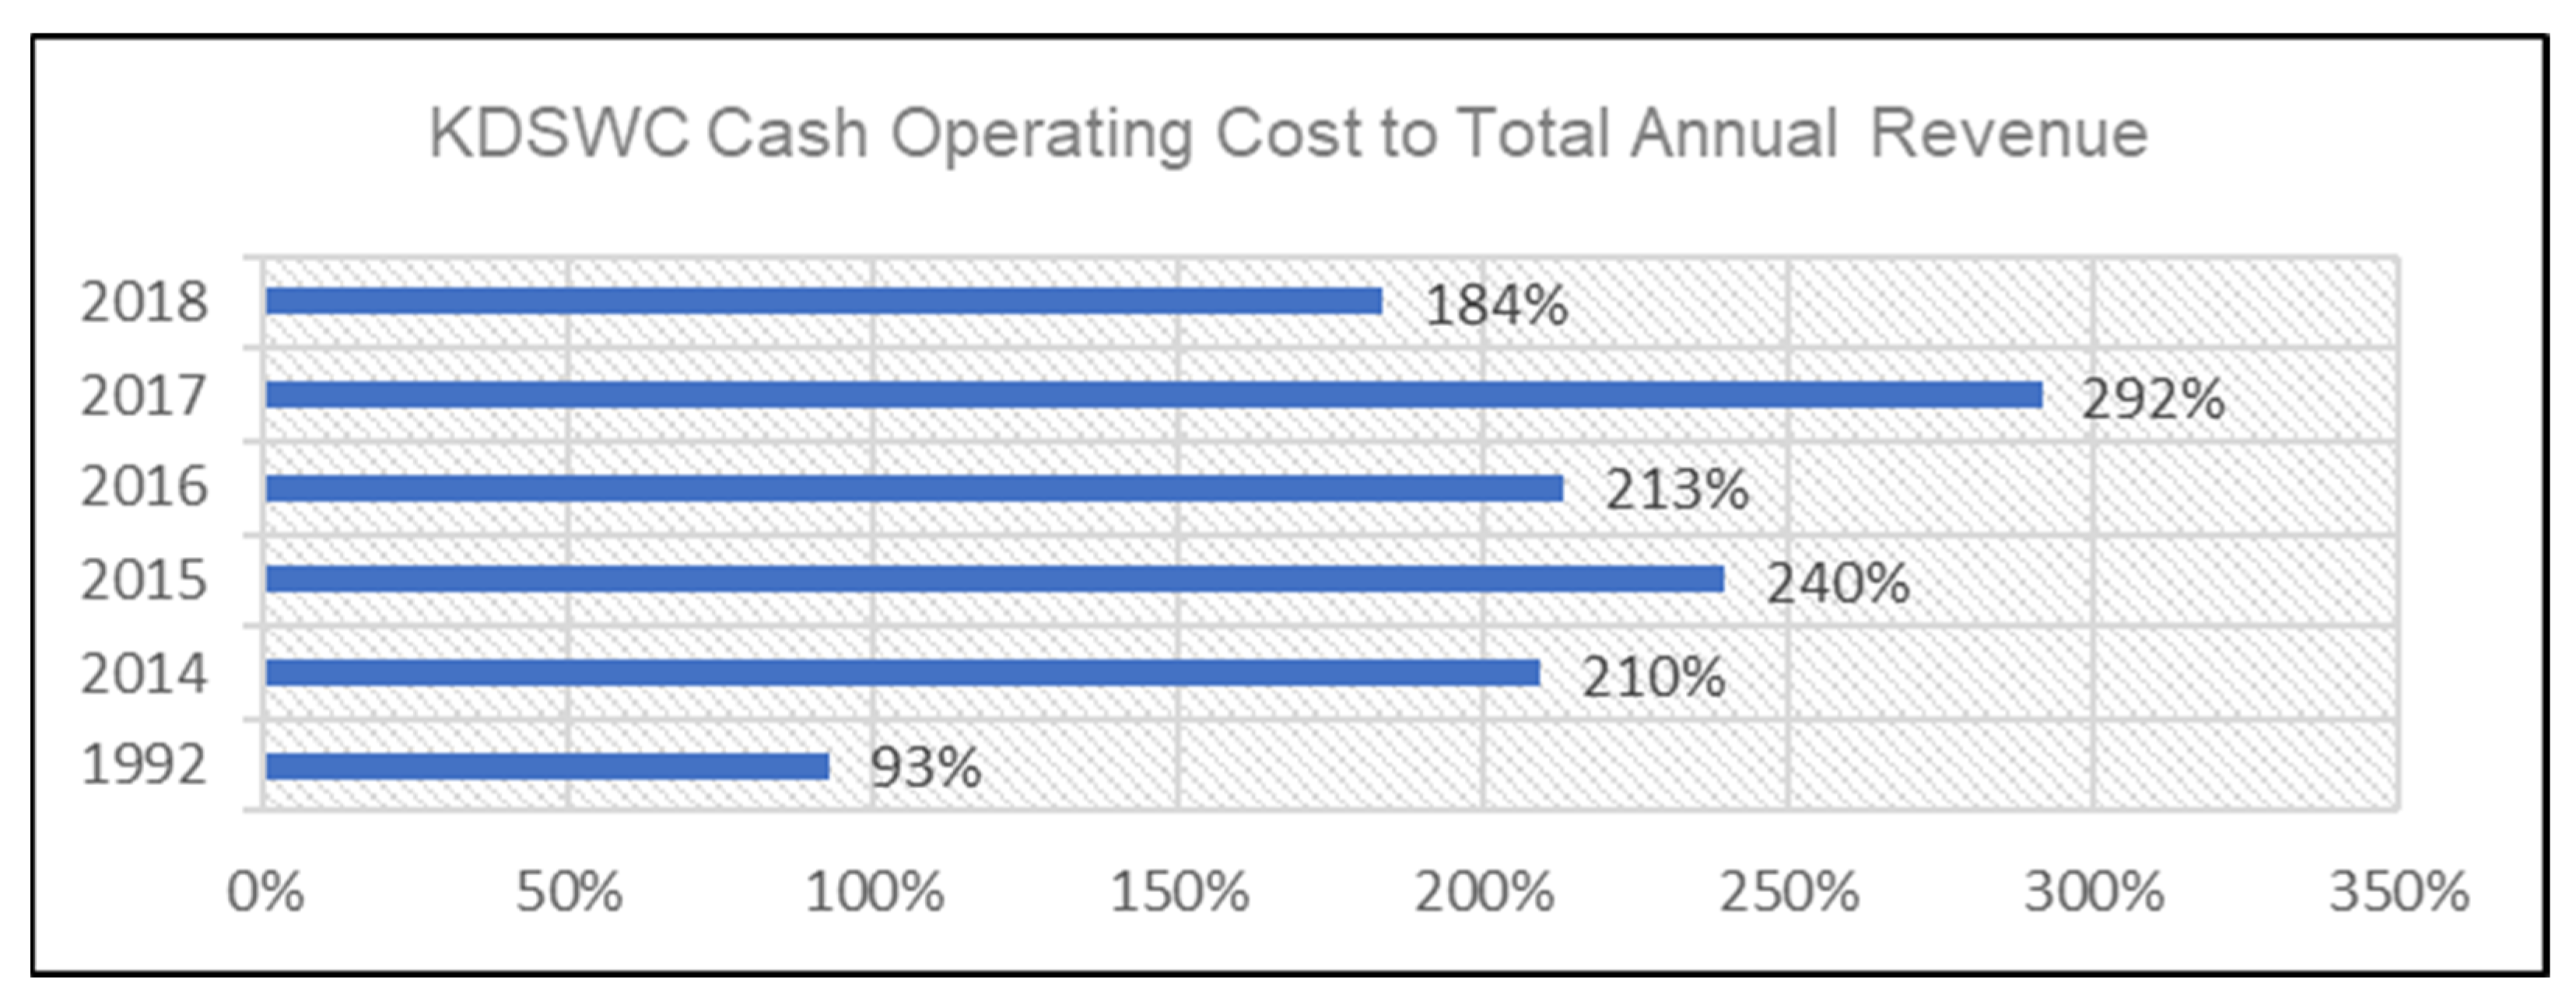
Kaduna State Water Corporation (KDSWC), which ought to be self-sustaining by virtue of its corporatization, dropped in revenue from 48% in 1992 to 36% in 2018, as shown in Figure 20.
KDSWC was able to cover its cash operating cost from the water rates in 1992 (93%), as shown in Figure 21. But cash operating cost accounted for 210% in 2014 and 184% in 2018.
This trend shows that state water utilities (SWUs) are being run at a loss, and the revenue generated does not cover their cash operating costs.
5.4.4. Overall Performance Indicators for Financial Sustainability
The findings from analysis of the financial summaries of Lagos Water Corporation (LWC), Cross River State Water Board Limited (CRSWBL), and Kaduna State Water Corporation (KDSWC) in Figure 14 and Figure 15 show that most state water utilities (SWUs) in Nigeria are not financially sustainable as presented in Table 12.
The SWUs depend on the government financially to finance their cash operating costs (O&M) program. Their ability to generate revenue through the recovery of their (O&M) costs is dwindling and not sustainable. From the analysis presented in Table 13, their operating costs exceeds the annual revenue.
Most water utilities in Nigeria are not generating revenue to cover their cash operating costs. This has resulted in insufficient spending on planned maintenance, low operational efficiency, and poor billing and collection. Similarly, the cash operating cost accounts for 235%, 278%, and 184% of the total annual revenue for LWC, CRSWBL, and KDSWC respectively in Table 13. If at least 95% of the billing generated is received, it will almost cover the cash operating cost and the grant from state governments can be used for the extension of pipe networks. This will reduce the deficit between the water demand and supply which currently keeps widening.
6. Conclusions
This study systematically examines the disparities in the water demand, coverage, and the performance within three state water utilities (SWUs). The operations and maintenance (O&M) assessments unveil critical insights into the challenges faced by these SWUs in ensuring a sustainable water supply to the populace.
The escalating gap between water demand and production is a pressing concern. Projected figures indicate a potential increase in the demand gap to 24%, 88%, and 96% for Lagos Water Corporation (LWC), Kaduna State Water Corporation (KDSWC), and Cross River State Water Board Limited (CRSWBL), respectively, by the year 2030. Concurrently, water coverage trends exhibit a decline in LWC and KDSWC, while CRSWBL has witnessed an increase.
Performance indicators, specifically the ratios of staff per thousand connections and staff per thousand people served, fall below the acceptable baseline for low- and middle-income countries (LMICs). Although LWC demonstrates efficient personnel utilization, both CRSWBL and KDSWC exhibit declining ratios. Notably, only LWC’s staff-to-population ratio adheres to the allowable baseline.
These SWUs grapple with substantial non-revenue water (NRW) percentages and low bill collection efficiencies. Additionally, their heavy reliance on state government subsidies to bridge the financial gap between bill collections and O&M costs is evident. The proportion of revenue derived from water sales has diminished over the years, compelling SWUs to heavily depend on government grants and subventions.
Furthermore, the analysis of the relationship between total annual water rates and total annual revenue underscores financial challenges. The SWUs face a widening gap, exemplified by LWC’s drop from 59% in 1992 to 41% in 2016, CRSWBL’s increase from 59% to 94% in 2018, and KDSWC’s decline from 48% to 36% in 2018. The ratio of total annual cash operating costs to total annual water rates has also surged over time, indicating financial strain for LWC, CRSWBL, and KDSWC.
In conclusion, these findings collectively illustrate a widening gap between water demand and supply, highlighting the inefficiency and financial unsustainability of most SWUs in Nigeria. This predicament poses a formidable challenge to achieving the Sustainable Development Goal (SDG) target 6.1 of universal and equitable access to safe drinking water by 2030, not only for Nigeria but for Africa as a whole.
7. Implications
Ensuring an ample water supply and sanitation infrastructure in Nigeria and across Africa is pivotal to realizing various Sustainable Development Goals (SDGs), including the alleviation of hunger and poverty, fostering healthier lifestyles, and achieving universal access to safe drinking water, as outlined in SDG target 6.1 by 2030. The availability of safe water profoundly influences health, socio-economic conditions, and overall quality of life. Target 6.1 holds particular significance in attaining other SDG objectives, notably target 6.2 addressing sanitation.
Unfortunately, the onset of the COVID-19 pandemic significantly impacted our study, disrupting the operations of state water utilities and hindering data collection due to the necessity for junior employees to stay at home. This unforeseen circumstance not only impeded our research but also placed an additional financial burden on employees who went unpaid during this period. Given these challenges, conducting a comprehensive study to assess the repercussions of the COVID-19 pandemic on water and sanitation becomes imperative.
Author Contributions
Conceptualization: V.O.O.; methodology, V.O.O.; software, V.O.O.; validation, V.O.O. and M.S.; formal analysis, V.O.O.; investigation, V.O.O.; resources, V.O.O.; data curation, V.O.O.; writing—original draft preparation, V.O.O.; writing—review and editing, M.S.; visualization, M.S.; supervision, M.S.; project administration, V.O.O.; funding acquisition, V.O.O. All authors have read and agreed to the published version of the manuscript.
Funding
This research received no external funding.
Institutional Review Board Statement
Not applicable.
Informed Consent Statement
Not applicable.
Data Availability Statement
The data presented in this study are available on request from the corresponding author.
Conflicts of Interest
The authors declare no conflict of interest.
References
- Kalulu, K.; Hoko, Z. Assessment of the performance of a public water utility: A case study of Blantyre water board in Malawi. Phys. Chem. Earth 2010, 35, 806–810. [Google Scholar] [CrossRef]
- World Bank. Infrastructure for Development; Oxford University Press, Inc.: New York, NY, USA, 1994. [Google Scholar]
- World Bank. World Development Report: Making Services Work for Poor People; World Bank: Washington, DC, USA, 2004. [Google Scholar]
- Khatri, K.B.; Vairavamoorthy, K. Challenges for Urban Water Supply and Sanitation in the Developing Countries; Discussion Paper on Urbanization; UNESCO-IHE: Delft, The Netherlands, 2007. [Google Scholar]
- Macheve, B.; Danilenko, A.; Abdullah, R.; Bove, A.; Moffitt, L.J. State Water Agencies in Nigeria: A Performance Assessment; International Bank for Construction and Development/The World Bank: Washington, DC, USA, 2015. [Google Scholar]
- Renzetti, S.; Dupont, D. Ownership and performance of water utilities. Greener Manag. Int. 2003, 42, 9–19. [Google Scholar] [CrossRef]
- Hall, D. Water and Electricity in Nigeria; Public Service International Research Unit (PSIRU); University of Greenwich: London, UK, 2020. [Google Scholar]
- Centrulo, T.B.; Marques, R.C.; Malheiros, T.F.; Centrulo, N.M. Monitoring inequality in water access: Challenges for the 2030 Agenda for Sustainable Development. Sci. Total Env. 2020, 727, 138746. [Google Scholar] [CrossRef] [PubMed]
- Martinez-Cordoba, P.; Raimo, N.; Vitolla, F.; Benito, B. Achieving sustainable development goals. Efficiency in Spanish clean water and sanitation sector. Sustainability 2020, 12, 3015. [Google Scholar] [CrossRef]
- WHO/UNICEF. Work of the Statistical Commission Pertaining to the 2030 Agenda for Sustainable Development; Resolution Adopted by the General Assembly; World Health Organization (WHO) and the United Nations Children’s Fund (UNICEF): Geneva, Switzerland, 2017. [Google Scholar]
- WHO/UNICEF. WHO/UNICEF Joint Monitoring Program (JMP) for Water Supply, Sanitation, and Hygiene Report—Progress on Household Drinking Water, Sanitation, and Hygiene 2000–2020: Five Years into the SDGs; World Health Organization (WHO) and the United Nations Children’s Fund (UNICEF): Geneva, Switzerland, 2021. [Google Scholar]
- Godfrey, S.; Wambugu, M.; Parikh, P.; Tuhuma, F. Validation of the UNICEF fiscal diagnostic tool for SDGs 6.1 and 6.2 in East and Southern Africa using the analytic hierarchy process (AHP). J. Water Sanit. Hyg. Dev. 2022, 12, 721–736. [Google Scholar]
- WHO/UNICEF. Progress on Drinking Water, Sanitation and Hygiene in Africa 2000–2020: Five Years into the SDGs; United Nations Children’s Fund (UNICEF) and World Health Organization (WHO): New York, NY, USA, 2022. [Google Scholar]
- UN-DESA. World Population Prospects: The 2017 Revision; The United Nations Department of Economic and Social Affairs (UN DESA): New York, NY, USA, 2017. [Google Scholar]
- Ramamurti, R. Why are developing countries privatizing? J. Int. Bus. Stud. 1992, 23, 225. [Google Scholar] [CrossRef]
- dos Santos, S.; Adams, E.A.; Neville, G.; Wada, Y.; de Sherbinin, A.; Bernhardt, M.E.; Adamo, S.B. Urban growth and water access in Sub-Saharan Africa: Progress, challenges, and emerging research directions. Sci. Total Environ. 2017, 607–608, 497–508. [Google Scholar] [CrossRef] [PubMed]
- WHO/UNICEF. Progress on Sanitation and Drinking Water: 2015 Update and MDG Assessment; World Health Organization (WHO) and the United Nations Children’s Fund (UNICEF): Geneva, Switzerland, 2015. [Google Scholar]
- WHO/UNICEF. Progress on Drinking Water, Sanitation, and Hygiene: 2017 Update and SDG Baselines; World Health Organization (WHO) and the United Nations Children’s Fund (UNICEF): Geneva, Switzerland, 2017. [Google Scholar]
- Prasad, N. Why is Regulation Insufficient? Social Policies and Private Sector Participation in Water Supply; United Nations Research Institute for Social Development (UNRISD): Geneva, Switzerland, 2007. [Google Scholar]
- Machete, I.; Marques, R. Financing the water and sanitation sectors: A hybrid literature review. Infrastructures 2021, 6, 9. [Google Scholar] [CrossRef]
- Peda, P.; Grossi, G.; Liik, M. Do ownership and size affect the performance of water utilities? Evidence from Estonian municipalities. J. Manag. Gov. 2013, 17, 237–259. [Google Scholar] [CrossRef]
- Agovino, M.; Cerciello, M.; Garofalo, A.; Landriani, L.; Lepore, L. Corporate governance and sustainability in water utilities. The effects of decorporaisation in the city of Naples, Italy. Bus. Strategy Environ. 2021, 30, 874–890. [Google Scholar] [CrossRef]
- World Bank. The World Bank in Middle Income Countries. Available online: https://www.worldbank.org/en/country/mic/overview (accessed on 30 August 2022).
- Sasu, D.D. Income per Capita in Nigeria 2011–2021. Available online: https://www.statista.com/statistics/1291432/gross-national-income-per-capita-in-nigeria/ (accessed on 30 January 2023).
- NPC. Nigeria 2006 Population Census of the Federal Republic of Nigeria: Analytical Report at the National Level; National Population Commission (NPC): Abuja, Nigeria, 2006. [Google Scholar]
- NPC. Nigeria Demographic and Health Survey 2018; ICF: Rockville, MD, USA, 2019. [Google Scholar]
- Worldpopulationreview.com. Nigeria Population 2020—World Population Review. Available online: https://worldpopulationreview.com/countries/nigeria-population (accessed on 8 January 2021).
- Worldpopulationreview.com. Africa Population 2020—World Population Review. Available online: https://worldpopulationreview.com/continents/africa-population (accessed on 8 January 2021).
- Njoku, C.G.; Okon, I.; Itu, P.; Otese, A.V. Population Growth and Pipe-Borne Water Supply in Calabar Metropolis: Finding the Balance. Int. J. Res. Geogr. 2017, 3, 51–59. [Google Scholar]
- Berg, S.V. Performance assessment using key performance indicators (KPIs) for water utilities: A primer. Water Econ. Policy 2020, 6, 2050001. [Google Scholar] [CrossRef]
- Centrulo, T.B.; Marques, R.C.; Malheiros, T.F. An analytical review of efficiency of water and sanitation utilities in developing countries. Water Res. 2019, 161, 372–380. [Google Scholar] [CrossRef] [PubMed]
- Walker, N.L.; Williams, A.P.; Style, D. Key performance indicator to explain energy & economic efficiency across water utilities, and identifying suitable proxies. J. Environ. Manag. 2020, 269, 110810. [Google Scholar]
- Wren-Lewis, L. Utility regulation in Africa: How relevant is the British model? Util. Policy 2014, 31, 203–205. Available online: https://ssrn.com/abstract=2654310 (accessed on 23 October 2022). [CrossRef]
- Sen, S.M.; Kansal, A. Achieving water security in rural Indian Himalayas: A participatory account of challenges and potential solutions. J. Environ. Manag. 2019, 245, 398–408. [Google Scholar] [CrossRef]
- Walter, M.; Cullmann, A.; Hirschhausen, C.; Wand, R.; Zschille, M. Quo Vadis efficiency analysis of water distribution? A comparative literature review. Util. Policy 2009, 17, 225–232. [Google Scholar] [CrossRef]
- Alegre, H.; Baptista, J.M.; Cabrera, E., Jr.; Cubillo, F.; Duarte, P.; Hirner, W.; Merkel, W.; Parena, R. Performance Indicators for Water Supply Services, 3rd ed.; IWA Publishing: London, UK, 2016. [Google Scholar]
- Tyman, N.; Kingdom, B. A Water Score Card: Setting Performance Targets for Water Utilities; Private Sector Infrastructure Network; The World Bank: Washington, DC, USA, 2002; Volume 242, pp. 1–4. [Google Scholar]
- Alegre, H.; Hirner, W.; Baptista, J.M.; Parena, R. Performance Indicators for Water Supply Services, 1st ed.; Manual of Best Practice; IWA Publishing: London, UK, 2000. [Google Scholar]
- Alegre, H.; Baptista, J.M.; Cabrera, E., Jr.; Cubillo, F.; Duarte, P.; Hirner, W.; Merkel, W.; Parena, R. Performance Indicators for Water Supply Services, 2nd ed.; IWA Publishing: London, UK, 2006. [Google Scholar]
- FRN. The Constitution of the Federal Republic of Nigeria 1999; 4th Amendment; The National Assembly; Official Gazette, Federal Republic of Nigeria (FRN): Abuja, Nigeria, 2011.
- FMWR. National Water Policy; Federal Ministry of Water Resources (FMWR): Abuja, Nigeria, 2004.
- FMWR. Water, Sanitation, and Hygiene: National Outcome Routine Mapping (WASH NORM) 2019: A Report of Findings; Federal Ministry of Water Resources, Government of Nigeria, National Bureau of Statistics (NBS) and UNICEF: Abuja, Nigeria, 2020.
- FMWR. Nigeria Water Sector Reform Program; Federal Ministry of Water Resources (FMWR): Abuja, Nigeria, 2021. Available online: https://www.nwsrp.gov.ng/inner.php?pg=d (accessed on 18 January 2021).
- World Bank. Available online: https://data.worldbank.org/indicator/SP.URB.GROW?locations=NG&most_recent_year_desc=false (accessed on 26 January 2021).
- LSG. Lagos State Water Sector Policy; Ministry of Water Resources and Environment: Lagos, Nigeria, 2017.
- CRSWBL. Technical and Financial Overview: CRSWBL-ORTECH Public-Private Partnership; Cross Rivers State Water Board Limited: Calabar, Nigeria, 2007. [Google Scholar]
- Swokowski, E.W. Calculus with Analytic Geometry, 2nd ed.; Taylor & Francis: Boston, MA, USA, 1979. [Google Scholar]
- ChartsBinz Statistics Collector Team (2011). Total Water Use Per Capita by Country. ChartsBin.com. Available online: http://chartsbin.com/view/1455 (accessed on 22 February 2021).
- WHO. How Much Water is Needed in Emergencies. In Technical Notes on Drinking-Water, Sanitation and Hygiene in Emergencies; Water, Engineering and Development Centre (WEDC): Loughborough, UK; Loughborough University: Loughborough, UK, 2011. [Google Scholar]

Figure 2.
Trend of Water Demand Gap Projection of SWUs 2015–2030.

Figure 3.
Trend of the Study Area Piped Water Coverage 2015–2020.

Figure 4.
Trend in the ratio of LWC Staff/1000 Connections.

Figure 5.
Trend in the ratio of LWC Staff/1000 Population Served.

Figure 6.
Trend in the ratio of CRSWBL Staff/1000 Connections.

Figure 7.
Trend in the ratio of CRSWBL Staff/1000 Population Served.

Figure 8.
Trend in the ratio of KDSWC Staff/1000 Connections.

Figure 9.
Trend in the ratio of KDSWC Staff/1000 Population Served.

Figure 10.
Trend of the Non-Revenue Water of LWC.

Figure 11.
Trend of the Bill Collection Efficiency of LWC.

Figure 12.
Trend of the Non-Revenue Water of CRSWBL.

Figure 13.
Trend of the Bill Collection Efficiency of CRSWBL.

Figure 14.
Trend of the Non-Revenue Water of KDSWC.

Figure 15.
Trend of the Bill Collection Efficiency of KDSWC.

Figure 16.
Disturbing Trend of the Relationship of LWC Water Rates to Total Income Dropping.

Figure 17.
Operating Costs of LWC Accounts for 235% of the Total Revenue.

Figure 18.
Trend of the Relationship of CRSWBL Water Rates to Total Revenue.

Figure 19.
Operating Costs of CRSWBL Accounts for 278% of the Total Revenue.

Figure 20.
Trend in the Relationship of KDSWC Water Rates to Total Annual Revenue.

Figure 21.
Cash Operating Costs of KDSWC Total Annual Revenue.


Table 1.
Key Performance Indicators and Variables.
| No. | Key Performance Indicators | Performance Indicators/Variables |
|---|---|---|
| 1. | Water Demand Gap | a. The difference between the annual water demand and annual water produced (%). b. Service coverage (population served with water/total population in service area %). |
| 2. | Efficiency of Operation and Maintenance (O&M) | a. Number of staff/1000 connections (number of staff/1000 connections %). b. Number of staff per 1000 people served (number of staff/1000 people served %). |
| 3. | Efficiency of Investment | a. Non-revenue water (difference between water produced and water sold %). b. Collection efficiency (difference between total billed and total revenue collected %). |
| 4. | Financial Sustainability | a. Working ratio (the ratio of cash operating cost to total annual revenue %). b. Water rates to total annual revenue (the difference between water rates and total revenue %). |
Table 2.
Projected Population and Water Demand for Lagos 2016–2030.
| Year | Projected Population | Water Demand (m3/d) | Water Production (m3/d) | Demand Gap (m3/d) |
|---|---|---|---|---|
| 2016 | 12,550,598 | 627,529 | 548,940 | 78,589 (12.5%) |
| 2020 | 14,263,450 | 713,172 | 484,449 | 228,723 (32%) |
| 2025 | 16,814,036 | 840,701 | 561,888 | 278,813 (33%) |
| 2030 | 19,780,997 | 989,049 | 746,468 | 242,581 (24.5%) |
Table 3.
Projected Population and Water Demand for Cross River State.
| Year | Population | Water Demand (m3/d) | Water Production (m3/d) | Demand Gap (m3/d) |
|---|---|---|---|---|
| 2014 | 3,648,404 | 364,840 | 103,911 | 260,929 (77%) |
| 2015 | 3,755,757 | 375,575 | 76,867 | 298,708 (79.5%) |
| 2016 | 3,866,269 | 386,626 | 75,323 | 313,303 (81%) |
| 2020 | 4,342,653 | 434,265 | 24,284 | 409,981 (94%) |
| 2025 | 5,037,360 | 503,736 | 24,284 | 479,452 (95%) |
| 2030 | 5,834,973 | 583,497 | 24,284 | 559,213 (95.8%) |
Table 4.
Projected Population and Water Demand for Kaduna State.
| Year | Population | Water Demand (m3/d) | Water Production (m3/d) | Demand Gap (m3/d) |
|---|---|---|---|---|
| 2014 | 7,771,785 | 777,178 | 214,795 | 562,383 (72%) |
| 2015 | 8,008,472 | 800,847 | 199,325 | 601,522 (75%) |
| 2016 | 8,252,366 | 825,236 | 175,352 | 649,884 (78.8%) |
| 2020 | 9,302,547 | 930,254 | 157,268 | 772,986 (83%) |
| 2025 | 10,848,560 | 1,084,856 | 157,268 | 927,570 (85.5%) |
| 2030 | 12,630,246 | 1,263,024 | 157,268 | 1,105,756 (87.5%) |
Table 5.
Study Area Population Projection 2015–2030.
| State Water Utility | 2015 | 2016 | 2020 | 2025 | 2030 | Growth Rate | |
|---|---|---|---|---|---|---|---|
| 1. | Lagos State | 12,155,337 | 12,550,598 | 14,263,450 | 16,814,036 | 19,780,997 | 3.25% P/A. |
| 2. | Cross River State | 3,755,757 | 3,866,269 | 4,342,653 | 5,037,360 | 5,834,973 | 2.94% P/A. |
| 3. | Kaduna State | 8,008,472 | 8,252,163 | 9,302,547 | 10,848,560 | 12,630,246 | 3.04% P/A. |
Table 6.
Study Area Projected Water Demand Gap 2015–2030.
| State Water Utility | 2015 | 2016 | 2020 | 2025 | 2030 | |
|---|---|---|---|---|---|---|
| 1. | LWC | 53% | 13% | 32% | 33% | 24% |
| 2. | CRSWBL | 80% | 81% | 94% | 95% | 96% |
| 3. | KDSWC | 75% | 79% | 83% | 86% | 88% |
Table 7.
Study Area Water Coverage 2014–2020.
| State Water Utility | 2015 | 2016 | 2017 | 2018 | 2019 | 2020 | OP | Rank | |
|---|---|---|---|---|---|---|---|---|---|
| 1. | LWC | 32% | 31% | 30% | 29% | 29% | 24% | 2.7 | 3rd |
| 2. | CRSWBL | 25% | 34% | 31% | 31% | 45% | 45% | 3.3 | 2nd |
| 3. | KDSWC | 74% | 86% | 62% | 60% | 56% | 64% | 6.0 | 1st |
Table 8.
Trend in the Number of Staff Per 1000 Connections 2014–2020.
| State Water Utility | 2015 | 2016 | 2017 | 2018 | 2019 | 2020 | OP | Rank | |
|---|---|---|---|---|---|---|---|---|---|
| 1. | LWC | 10 | 7 | 9 | 7 | 11 | 18 | 3.7 | 1st |
| 2. | CRSWBL | 14 | 16 | 11 | 8 | 9 | 10 | 4.1 | 2nd |
| 3. | KDSWC | 18 | 16 | 16 | 16 | 15 | 12 | 5.7 | 3rd |
Table 9.
Trend in the Number of Staff Per 1000 People Served 2014–2020.
| State Water Utility | 2015 | 2016 | 2017 | 2018 | 2019 | 2020 | OP | Rank | |
|---|---|---|---|---|---|---|---|---|---|
| 1. | LWC | 44% | 25% | 25% | 29% | 19% | 23% | 2.5 | 1st |
| 2. | CRSWBL | 37% | 42% | 37% | 27% | 63% | 55% | 4.1 | 2nd |
| 3. | KDSWC | 76% | 56% | 68% | 66% | 65% | 56% | 6.0 | 3rd |
Table 10.
Non-Revenue Water 2014–2020.
| State Water Utility | 2015 | 2016 | 2017 | 2018 | 2019 | 2020 | OP | Rank | |
|---|---|---|---|---|---|---|---|---|---|
| 1. | LWC | 65% | 70% | 84% | 70% | 64% | 63% | 5.9 | 3rd |
| 2. | CRSWBL | 33% | 23% | 31% | 28% | 54% | 46% | 3.1 | 1st |
| 3. | KDSWC | 70% | 64% | 66% | 65% | 57% | 65% | 5.5 | 2nd |
Table 11.
Bill Collection Efficiency 2014–2020.
| State Water Utility | 2015 | 2016 | 2017 | 2018 | 2019 | 2020 | OP | Rank | |
|---|---|---|---|---|---|---|---|---|---|
| 1. | LWC | 17% | 19% | 19% | 15% | 27% | 26% | 2.8 | 1st |
| 2. | CRSWBL | 32% | 20% | 33% | 11% | 12% | 20% | 2.8 | 1st |
| 3. | KDSWC | 47% | 63% | 52% | 74% | 45% | 21% | 5.81 | 3rd |
Table 12.
Trend of Water Rates to Total Annual Revenue (%) 1992–2018.
| State Water Utility | 1992 | 2014 | 2015 | 2016 | 2017 | 2018 | |
|---|---|---|---|---|---|---|---|
| 1. | LWC | 59% | 53% | 51% | 41% | ||
| 2. | CRSWBL | 59% | 99% | 97% | 94% | 95% | 94% |
| 3. | KDSWC | 48% | 49% | 43% | 56% | 55% | 36% |
Table 13.
Trend of Cash Operating Costs to Total Annual Revenue (%) 1992–2018.
| State Water Utility | 1992 | 2014 | 2015 | 2016 | 2017 | 2018 | |
|---|---|---|---|---|---|---|---|
| 1. | LWC | 101% | 408% | 407% | 235% | ||
| 2. | CRSWBL | 128% | 101% | 218% | 366% | 266% | 278% |
| 3. | KDSWC | 93% | 21% | 240% | 213% | 293% | 184% |
Disclaimer/Publisher’s Note: The statements, opinions and data contained in all publications are solely those of the individual author(s) and contributor(s) and not of MDPI and/or the editor(s). MDPI and/or the editor(s) disclaim responsibility for any injury to people or property resulting from any ideas, methods, instructions or products referred to in the content. |
© 2023 by the authors. Licensee MDPI, Basel, Switzerland. This article is an open access article distributed under the terms and conditions of the Creative Commons Attribution (CC BY) license (https://creativecommons.org/licenses/by/4.0/).
Share and Cite
MDPI and ACS Style
Ojo, V.O.; Sohail, M. Assessing the Performance of State Water Utilities in Nigeria: Towards Achieving the Sustainable Development Goal on Drinking Water. Sustainability 2024, 16, 59. https://doi.org/10.3390/su16010059
AMA Style
Ojo VO, Sohail M. Assessing the Performance of State Water Utilities in Nigeria: Towards Achieving the Sustainable Development Goal on Drinking Water. Sustainability. 2024; 16(1):59. https://doi.org/10.3390/su16010059
Chicago/Turabian StyleOjo, Victor O., and M. Sohail. 2024. "Assessing the Performance of State Water Utilities in Nigeria: Towards Achieving the Sustainable Development Goal on Drinking Water" Sustainability 16, no. 1: 59. https://doi.org/10.3390/su16010059
Note that from the first issue of 2016, this journal uses article numbers instead of page numbers. See further details here.