
Spatial Analysis of COVID-19 Pandemic Impacts on Mobility in Madrid Region

Transport Research Centre (TRANSyT), Universidad Politécnica de Madrid, 28040 Madrid, Spain
*
Author to whom correspondence should be addressed.
Sustainability 2023, 15(19), 14259; https://doi.org/10.3390/su151914259
Submission received: 4 August 2023
/
Revised: 24 September 2023
/
Accepted: 25 September 2023
/
Published: 27 September 2023
(This article belongs to the Special Issue Impact of COVID-19 Pandemic on Sustainable Mobility)
Abstract
:After three years of COVID-19 lockdown and restrictions, mobility seems to have returned to normality. However, the pandemic has left changes in the mobility patterns of the Madrid Region produced by new trends emerging from COVID-19. This paper analyzes these changes, focusing on the impacts on public transport use, the effects of telematic activities and the influence of home relocation. The basis of the analysis is a survey conducted from November to December 2022, with more than 15,000 valid responses. The results show that public transport lost 6% of trips. These trips have different transfer rates depending on their geographic location. In the City Center, the majority transferred to active modes. However, the car attracted most of these trips in the Metropolitan Ring. These changes in mobility patterns are partly a consequence of the increase in telematic activities. Teleworking has increased by more than 20% in the Madrid Region and has caused changes in trips per week and trip purpose. In addition, teleworking has caused 18% of home relocations to peripheral zones of the region. This paper investigates through statistical analysis which sociodemographic and spatial factors explain the differences in mobility impacts throughout the zones of the Madrid Region.
1. Introduction
For years, mobility trends have focused on pursuing sustainable transport, seeking trip reductions and modal shift toward more sustainable modes, such as public transport or active modes. The COVID-19 pandemic was a turning point in these trends due to the induced changes. Some authors identify the COVID-19 crisis as an accelerator of the changes that were to emerge in the long term. However, the pandemic’s direct impacts are short-term [1].
The rapid transmission of the virus and the poor reaction time to control the pandemic led to the imposition of various restrictions. The restrictions imposed due to the COVID-19 pandemic ranged from closing jobs and commercial activities to introducing telematic activities as the primary model for work or study [2]. As expected, these restrictions directly impacted mobility patterns [3]. The worldwide imposed restrictions caused the volume of trips to decrease drastically [4]. For example, lockdown reduced trips by up to 39% in Germany [5] and caused a drop of more than 4500 trips in Shenzhen (China) [6]. In the case of Spain, these reductions were more significant, reaching values of around 40–50% fewer trips [7]. These decreases were more notable in public transport, with reductions close to 50% of trips compared to 2019 usage values [8]. Finally, focusing on the Madrid Region, the impacts were more significant than those in the rest of Spain. This was because the restrictions were harsher and more extended in time. The Madrid Region is one of the most densely populated regions in the country. Hence, the total trips were reduced by up to 70% during the lockdown in the Madrid Region [9]. Mobility patterns changed dramatically during the COVID-19 crisis. However, research should focus on something other than these short-term effects. Therefore, it should focus on the overall long-term impact and emerging new trends. Consequently, this paper aims to study the changes in mobility that have persisted after the end of the pandemic. Specifically, this paper analyzes modal shift changes, identifying the variables that influence the population’s mobility choices.
This paper begins with a literature review in Section 2, focusing on the new mobility trends that have emerged after the COVID-19 pandemic. Next, Section 3 includes a description of the Madrid Region. Section 4 presents the methodology used in the research, from the preliminary analysis of the Madrid Region to the final analysis of the data collected. Section 5 includes the results of this methodology and their discussion. Finally, Section 6 presents the conclusions of the study.
2. New Mobility Trends after the COVID-19 Pandemic
COVID-19 has led to changes in mobility patterns. Early publications on COVID-19 stated that its impact would focus on four trends: an increase in telematic activities, changes in trip purpose, the fear of infection and the adoption of healthier modes [10]. However, other factors, such as implementing Low Emission Zones (LEZs) and rising fuel prices, have also affected the population’s mobility choices. This literature review focuses on the main contributions regarding these trends.
Mobility restrictions led to the increased implementation of telematic activities (teleworking and e-learning). Numerous studies have suggested that telematic activities would gain popularity after the pandemic [11,12,13]. In European cities, teleworking increased from 37% to 49% due to the pandemic [14]. This type of activity does not necessarily result in a decrease in the number of trips. Telematic activities result in more trips of shorter duration and by car [15]. Moreover, regarding the impact of telematic activities, representative surveys will be necessary to feed strategic behavioral models [16].
The increase in telematic activities, particularly teleworking, means that the purpose of the most frequent trips is changing. Although the number of trips to work is decreasing, recreational trips are replacing these trips, such as shopping or other social or leisure events. This increase in non-working trips may influence a more local scale, as these trips are shorter in duration and distance than working trips [17]. Teleworking has led to a trend toward home relocation. A study in Ireland found that those who saw their non-working time improved by the flexibility of teleworking considered home relocation. Moreover, this behavior happens more among those living in city centers than those living in the outskirts [18]. According to a study conducted in Scotland, the number of people contemplating home relocation increased from 33% to 40%, stating the fear of infection and the possibility of working from home as reasons [19]. The fear of infection has been one of the main reasons for the change in mobility patterns. This reason has made public transport the most affected mode in the pandemic, as its use decreased to avoid crowds [20,21], reduce contact with other people and prevent infection [22]. However, users who were captive to public transport, generally those with less income, had to put aside the fear of infection because they had no other mobility option [23,24,25,26]. Ironically, this loss of ridership meant a reduction in the risk of infection on public transport [27]. The authorities increased the frequency of services and implemented vehicle sanitation measures to avoid this loss of passengers [28]. They subsidized fares to make public transport more attractive and to compensate for the increase in fuel prices [29].
The modal shift from public transport led to an overall increase in car use. In South Korea, the demand for car travel in 2020 was higher than that in 2019 on weekdays [30]. A study of car use in different European cities showed how frequently public transport users before the pandemic shifted their primary transport mode to cars [31]. Although the transfer of passengers from public transport has been mainly to cars, people have opted for active modes and micro-mobility alternatives such as walking, cycling or scooters [32,33]. Therefore, COVID-19 provided an opportunity to promote active modes [34]. This opportunity opens the door to developing more environmentally friendly mobility [35] if policies or strategies are in place to support this development [36,37].
Consequently, this paper proposes the following three objectives: first, to study the impact of the COVID-19 pandemic on public transport use; second, to analyze the effects of telematic activities on mobility; and finally, to explore the factors influencing people to undergo home relocation. Therefore, this paper comprehensively analyzes sociodemographic characteristics, mobility patterns and population habits.
3. Madrid Region: Sociodemographic and Mobility Framework
3.1. Sociodemographic Framework
The Madrid Region is Spain’s third most populated region, with more than 6.75 million inhabitants, and one of the most economically powerful, with more than 3.2 million jobs [38,39]. The Madrid Region is split into 179 municipalities. In turn, Madrid City is divided into 21 districts, where almost half of the population of the Madrid Region (49%) lives. The Madrid Public Transport Authority (CRTM) aggregates the Madrid Region’s municipalities into four rings, as shown in Table 1 [40]. The sociodemographic dynamics of the Madrid Region correspond to a concentric model. In terms of population, practically the entire population (92%) lives in the City Center, the City Suburbs and the Metropolitan Ring. On the other hand, the Metropolitan Ring and the City Center rise as the most important work centers.
3.2. Pre-Pandemic Mobility Patterns
Every ten years, the Madrid Region conducts a Household Mobility Survey. This survey aims to study the mobility patterns of the population of the Madrid Region, including all trips made on a working day. For this purpose, this survey collects this information through telephone (CATI) and face-to-face (F2F) interviews. The latest survey (EDM18) was conducted from February to May 2018 [40]. EDM18 collected information from over 13,000 households, which equates to nearly 35,000 individuals. Its results reference mobility patterns in the Madrid Region before the COVID-19 pandemic.
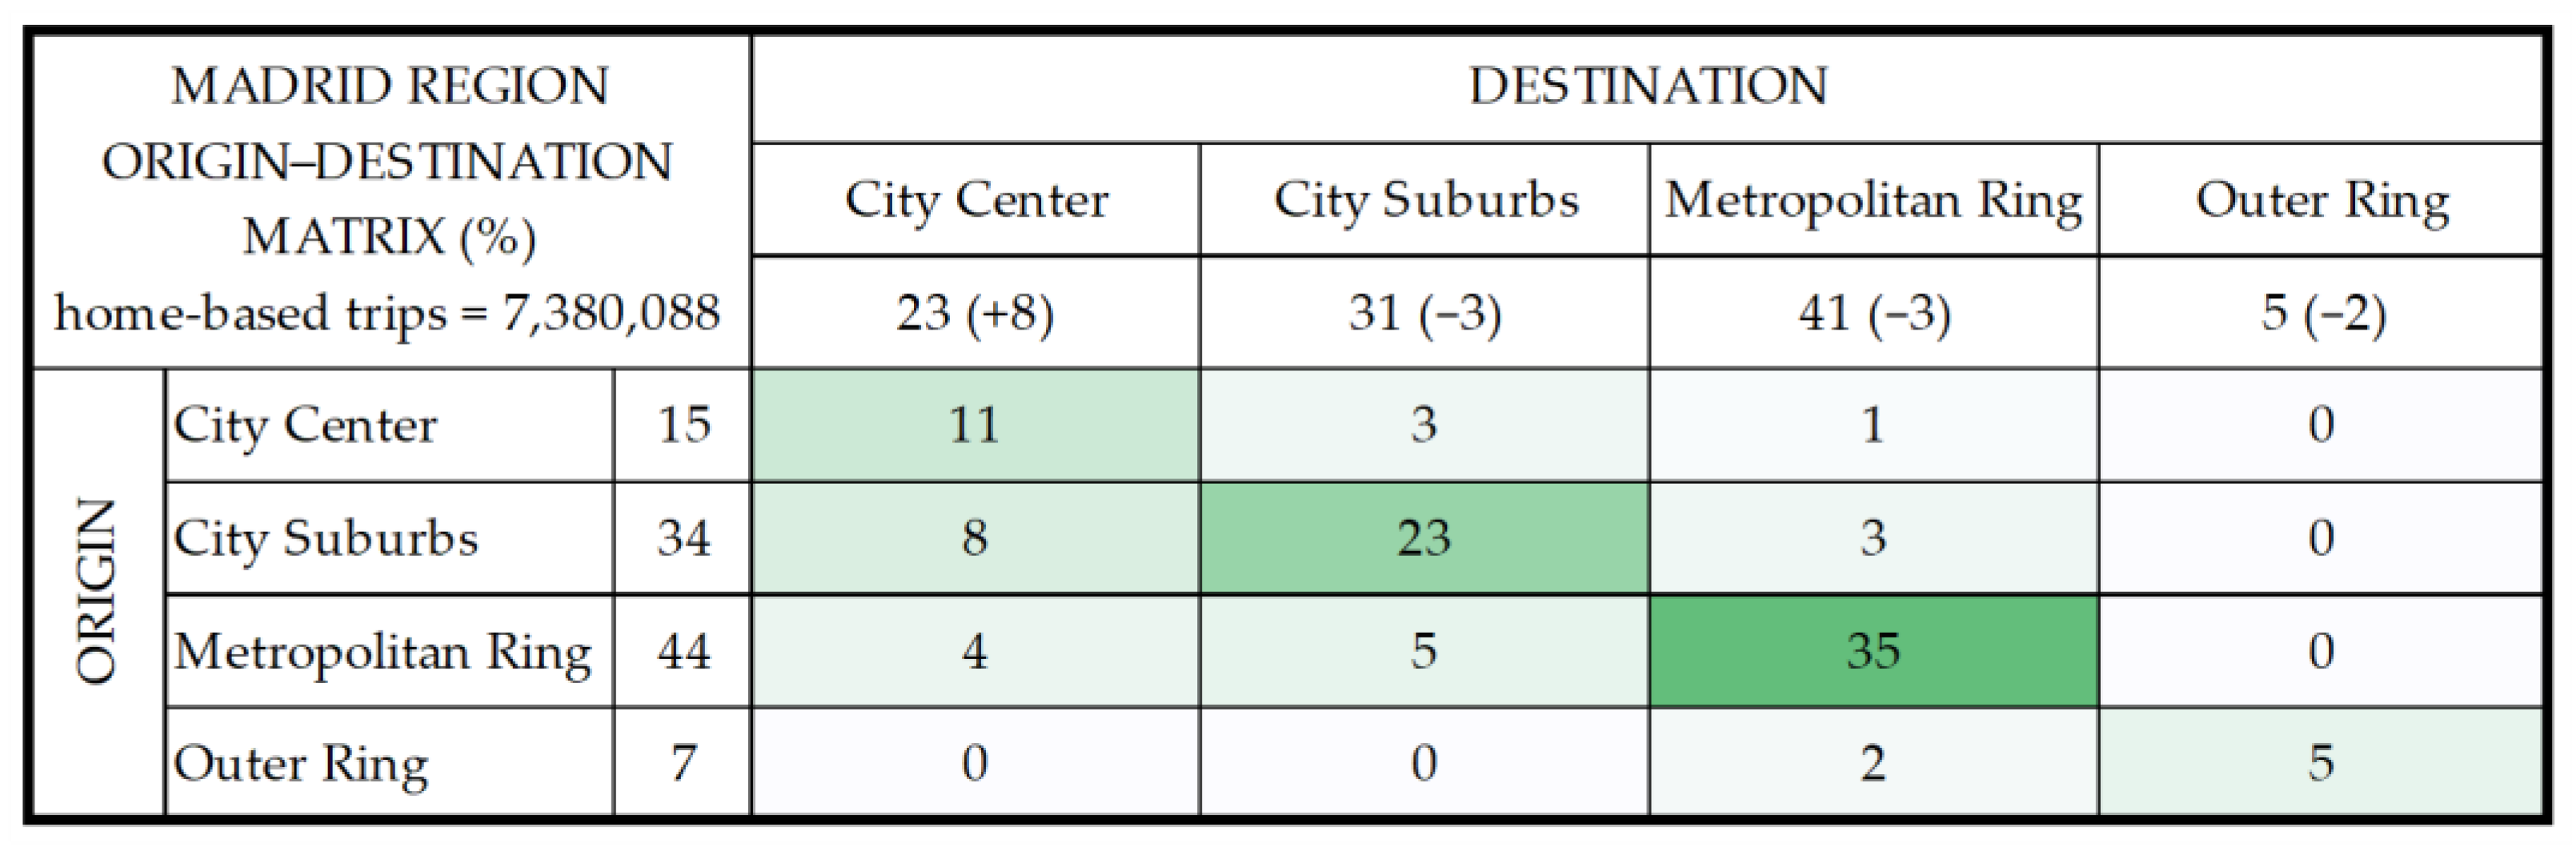
The origin–destination matrix shown in Figure 1 explains the mobility dynamics among the four rings of the Madrid Region. This matrix contains the home-based trips generated in each ring, specifying their destination. According to the EDM18 results, the population of the Madrid Region generated more than seven million home-based trips on a working day before the pandemic. Considering the difference between inbound and outbound trips for each ring, the City Suburbs and the Metropolitan Ring generate almost 250,000 trips (3%). Moreover, the City Center attracts nearly half a million trips (8%), positioning itself as the ring with the highest trip attraction.
3.3. Global Impact of the Pandemic on Trip Generation
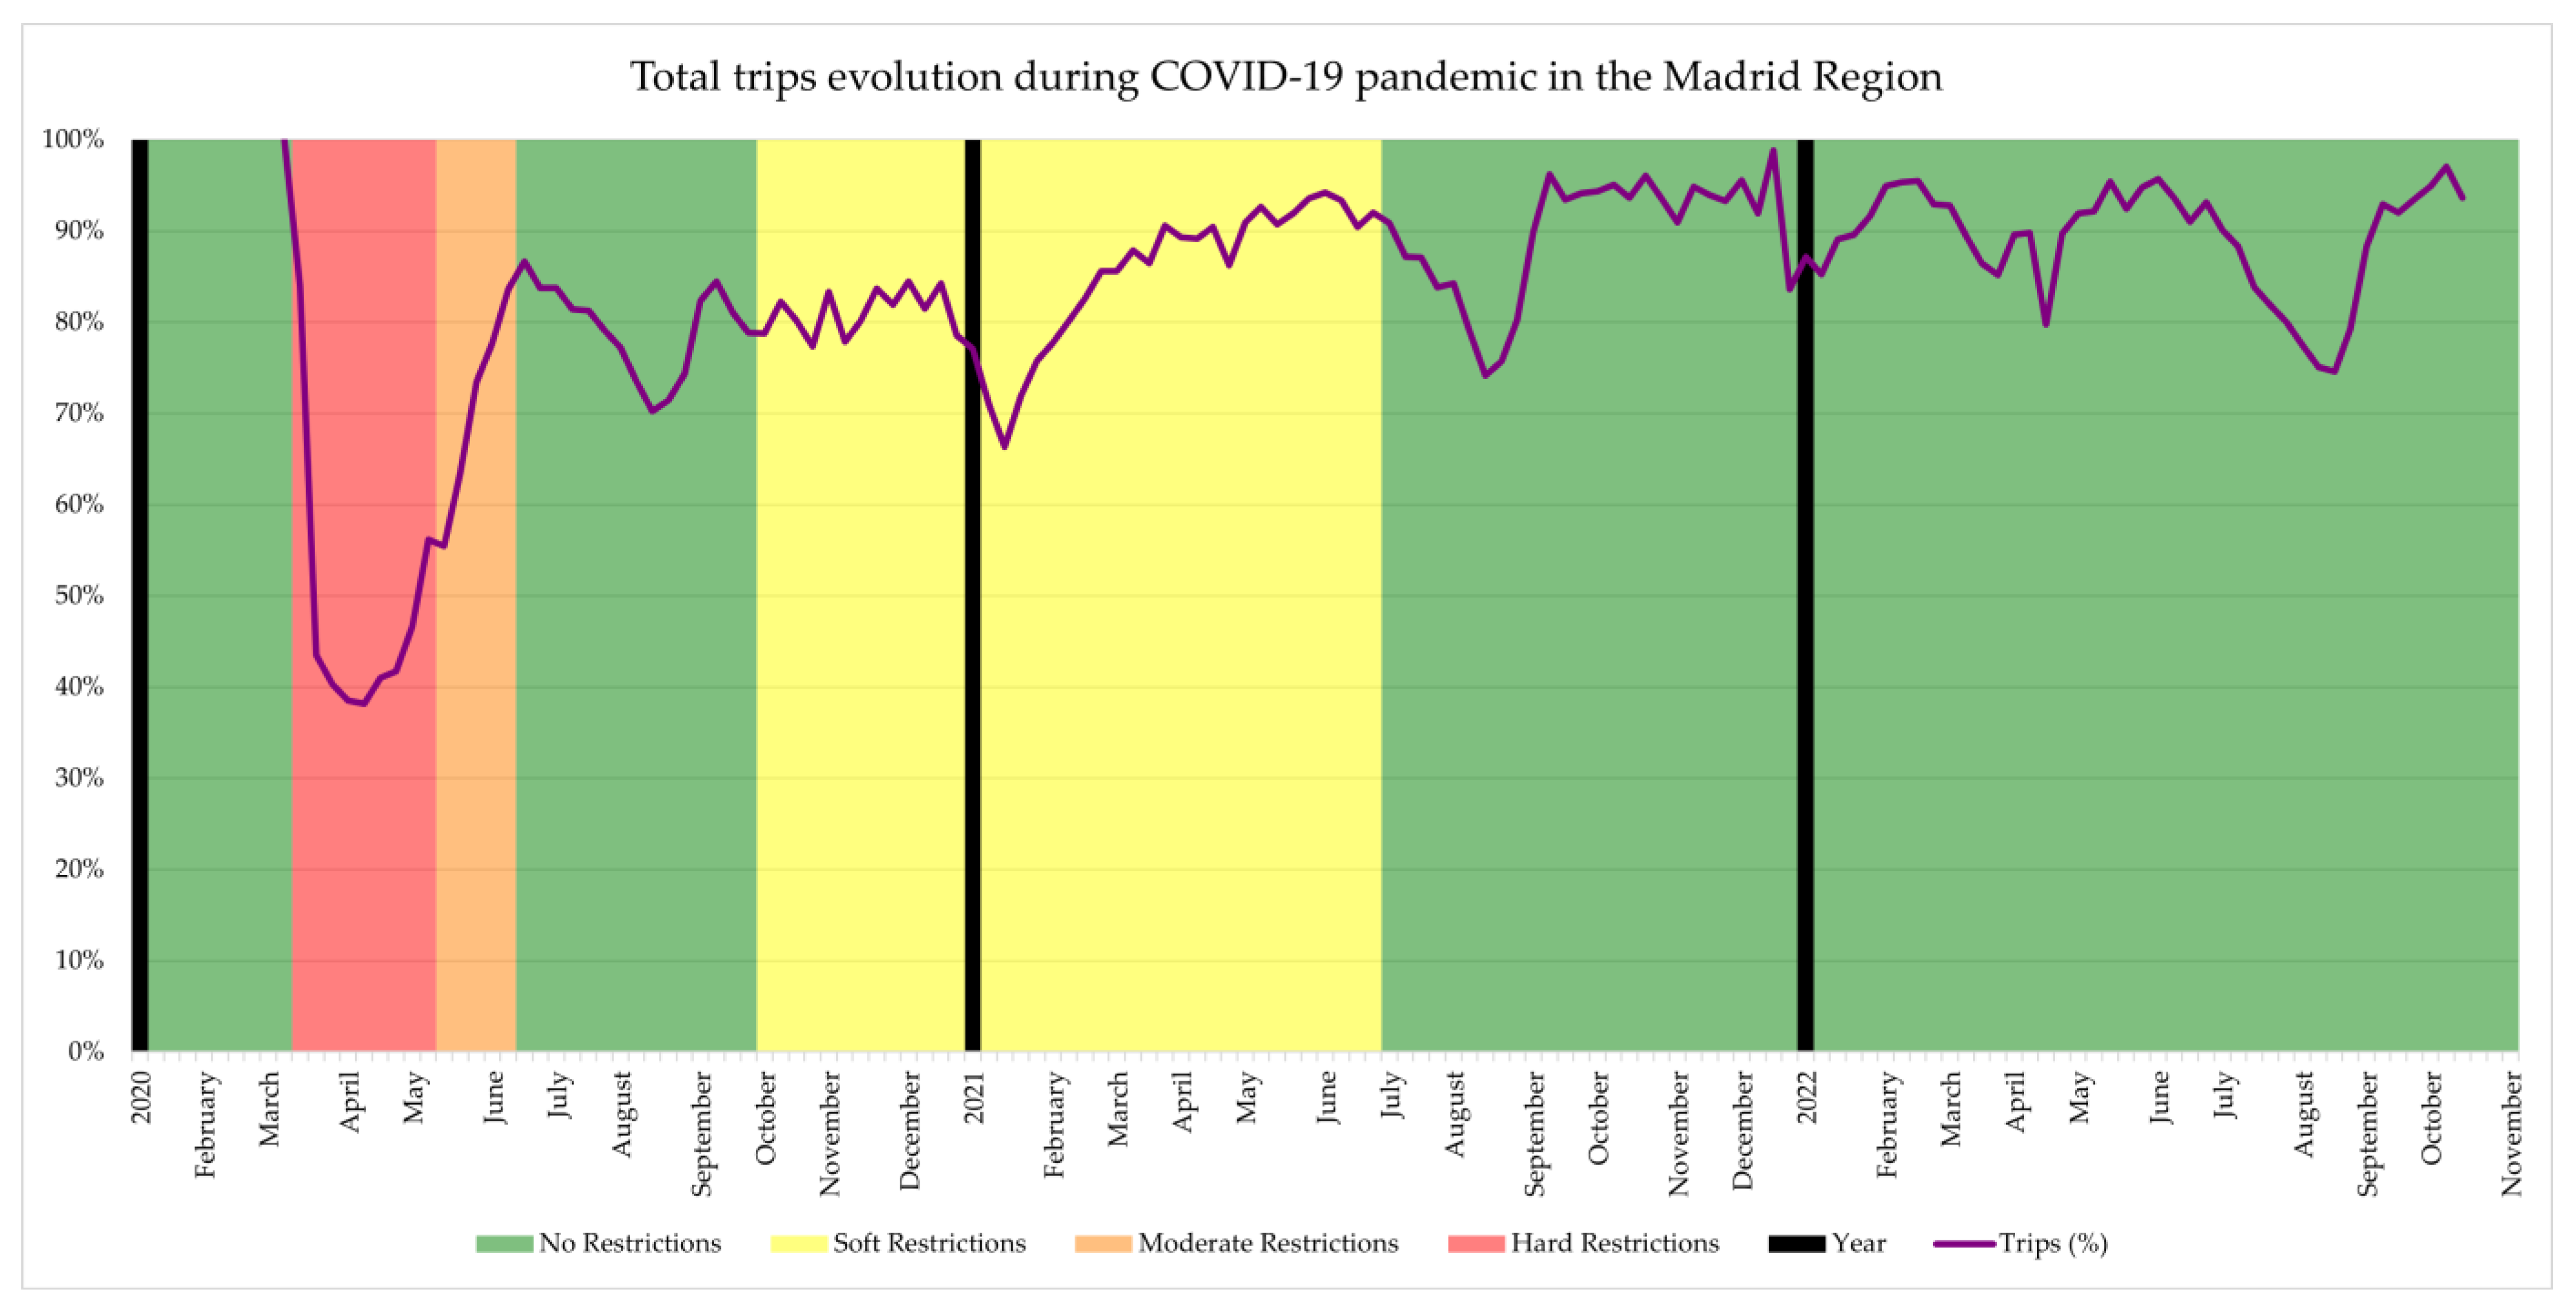
The Madrid Region was one of the Spanish regions that was most affected by the pandemic due to its large population. The COVID-19 Community Mobility Reports [30] analysis has shown the evolution of trips during the COVID-19 crisis, presented in Figure 2. This study compares the trips made to a reference period, corresponding to the average value for each day of five weeks between 3 January and 6 February 2020.
Trip generation in the Madrid Region follows a seasonal pattern. Trips drastically reduce in the summer months, reaching minimums in August. Moreover, significant declines occur during Easter and Christmas. Furthermore, trips tend to decrease in May due to several holidays inviting people to leave the Madrid Region.
When COVID-19 arrived, the Spanish government imposed a lockdown with rigid mobility restrictions [41]. During this lockdown, trips were reduced by more than 60%. The lockdown lasted until 11 May 2020, when the lockdown was loosened with moderate restrictions. Initially, these moderate restrictions limited people’s trips within a radius of 1 km, except for justified causes. At the end of this phase, trips recovered rapidly, reaching almost 90% of pre-COVID-19 trips.
The normal phase continued through the summer of 2020 with no mobility restrictions. After the summer, a spike in COVID-19 infections led to new soft restrictions imposed in October 2020, such as curfews from 11 p.m. to 6 a.m. and perimeter enclosures, in which people could only move within their neighborhood. These perimeter closures were updated weekly and were applied or not depending on the incidence rates of the virus in each neighborhood. This phase lasted almost a year, leaving trip levels at around 80% by the end of 2020. The Christmas decline in 2021 was not due to COVID-19 restrictions. Instead, this significant decline was due to a landmark snowfall that paralyzed the Madrid Region for two weeks. After Christmas, trips increased to over 90% in the first half of 2021.Finally, the Spanish government lifted the mobility restrictions in July 2021. However, the rest of 2021 remained at 90% of pre-pandemic trips, with a maximum in December. Nevertheless, during 2022, trips remained at 90% again. This paper aims to discover why 100% of pre-pandemic trips have yet to recover.
Figure 2.
Evolution of trips during the COVID-19 pandemic in the Madrid Region. Source: [42].
Figure 2.
Evolution of trips during the COVID-19 pandemic in the Madrid Region. Source: [42].

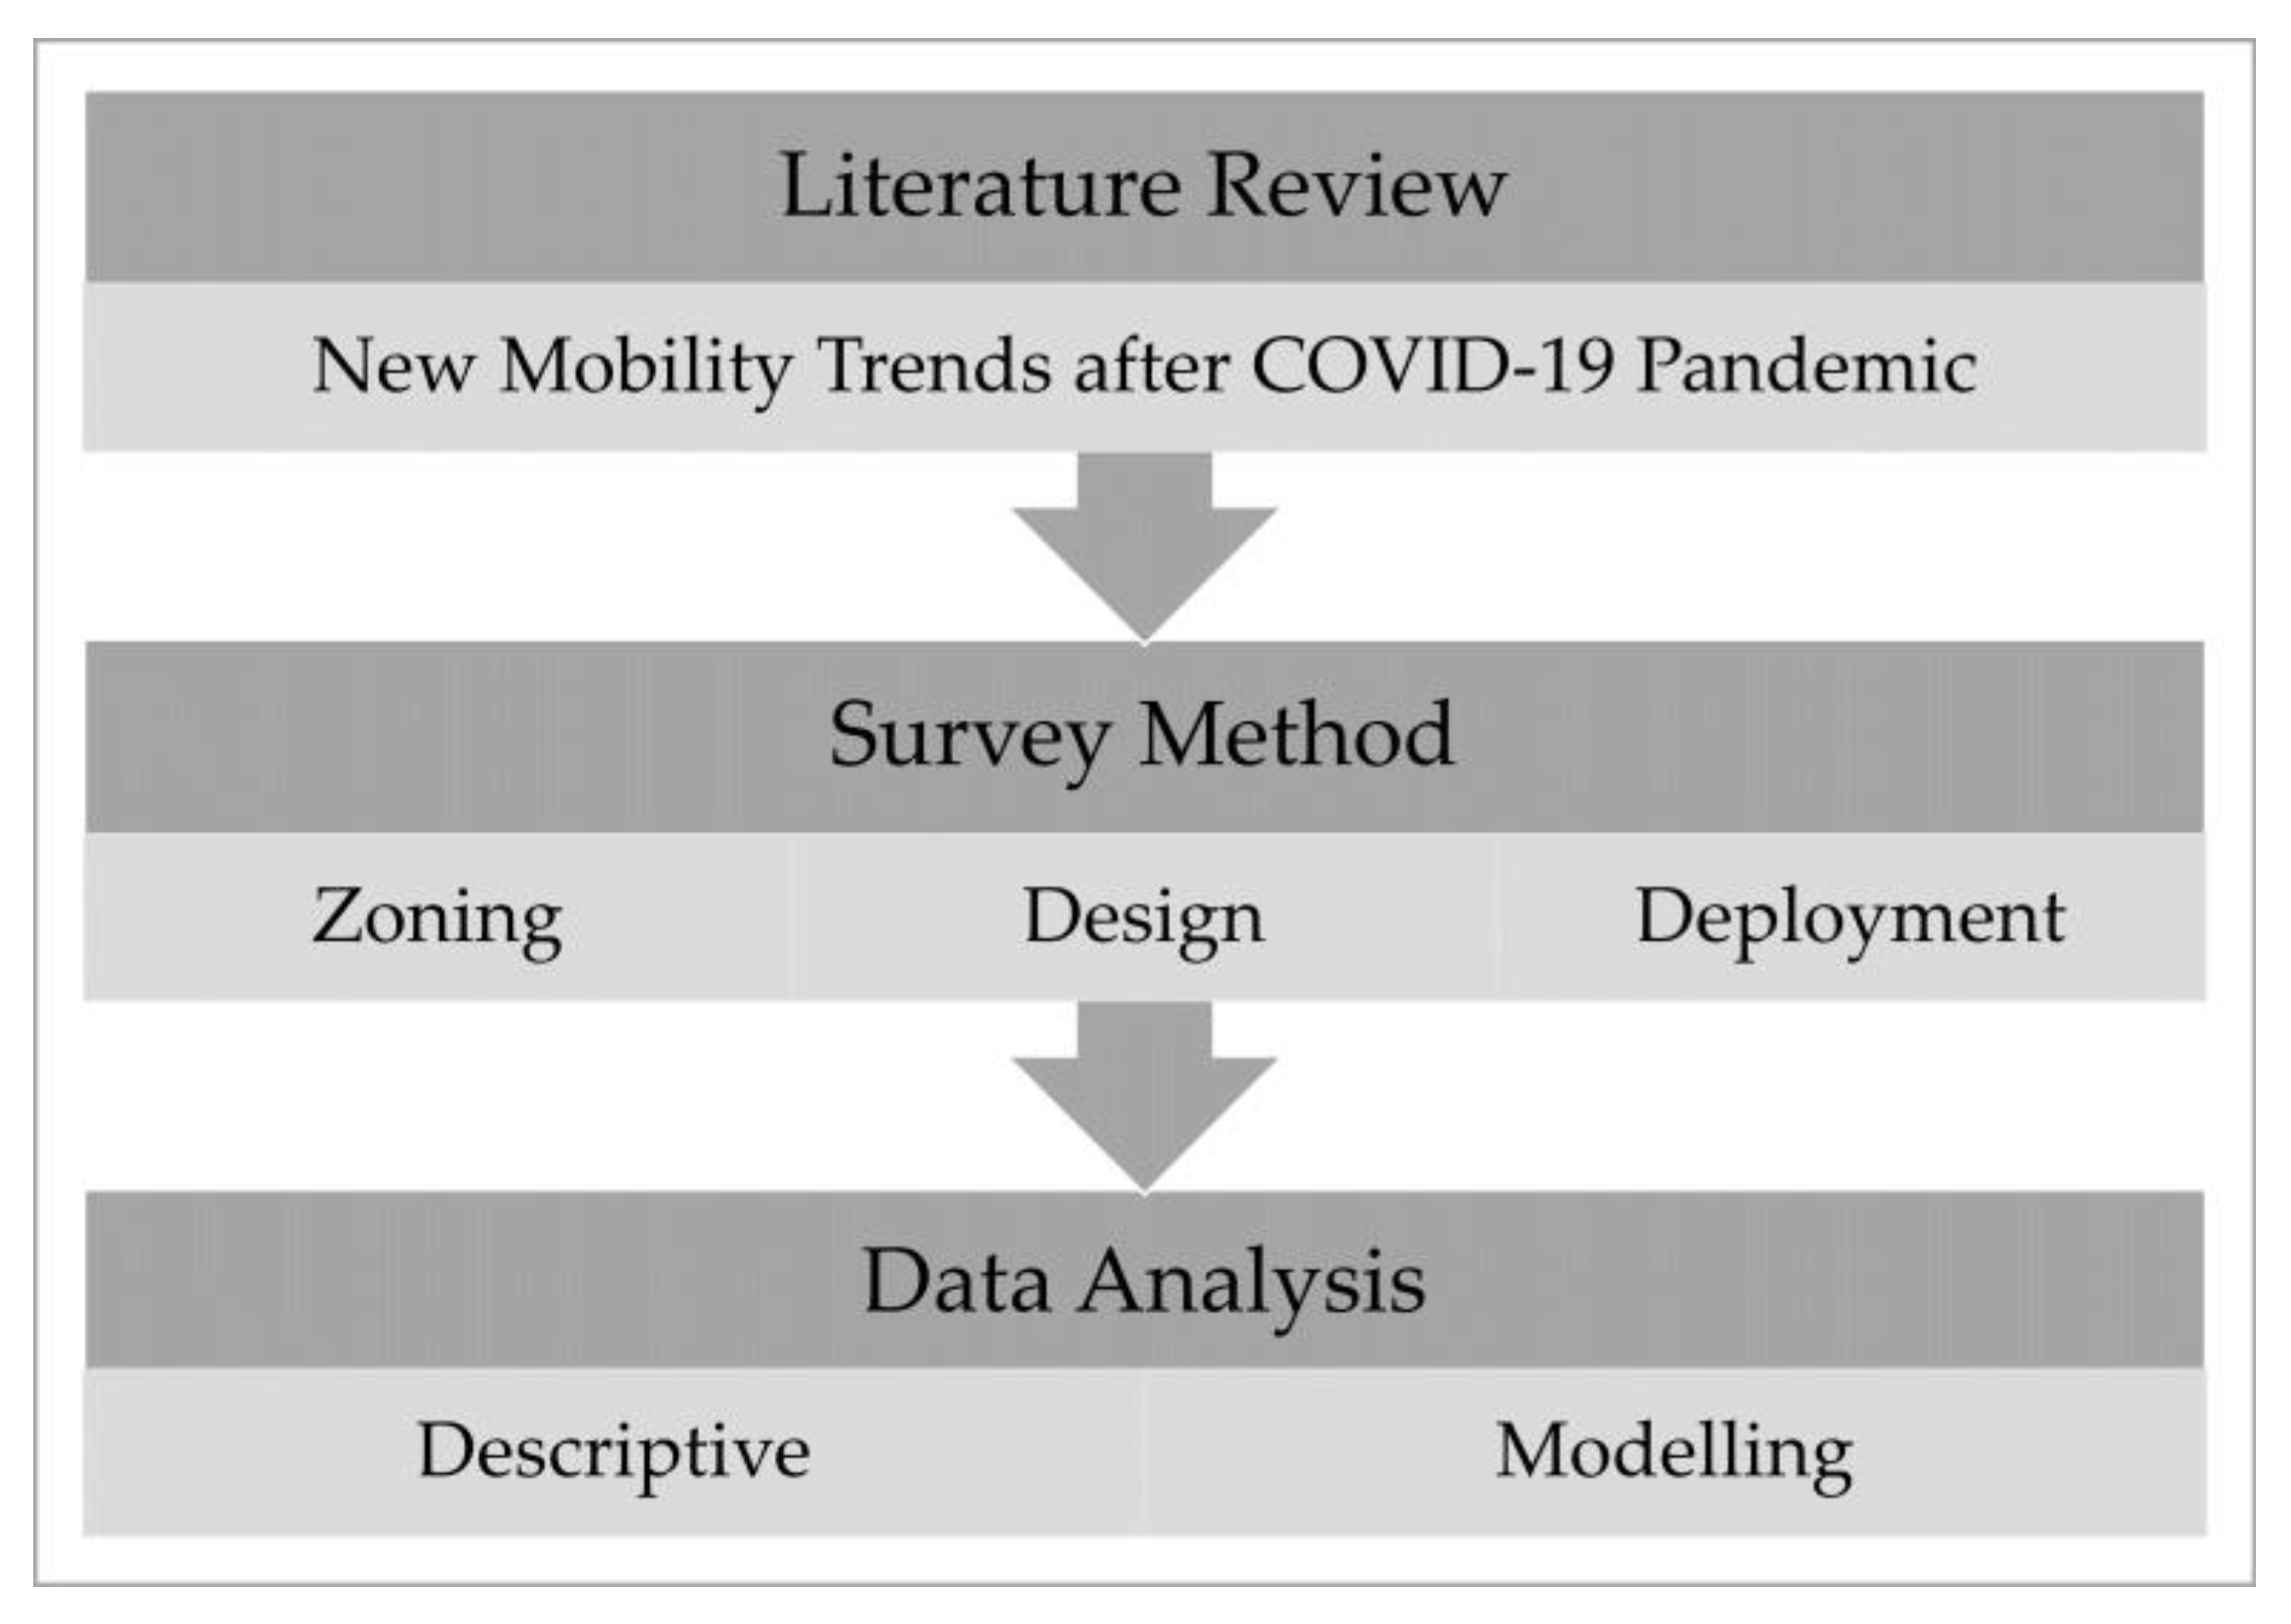
4. Survey-Based Methodology
This paper aims to understand these changes in mobility due to the evolution of the population’s habits. The best way to capture these changes is to ask people what their habits were before and what they are now. This paper uses the survey-based methodology presented in Figure 3 to achieve this goal.
4.1. Survey Zoning
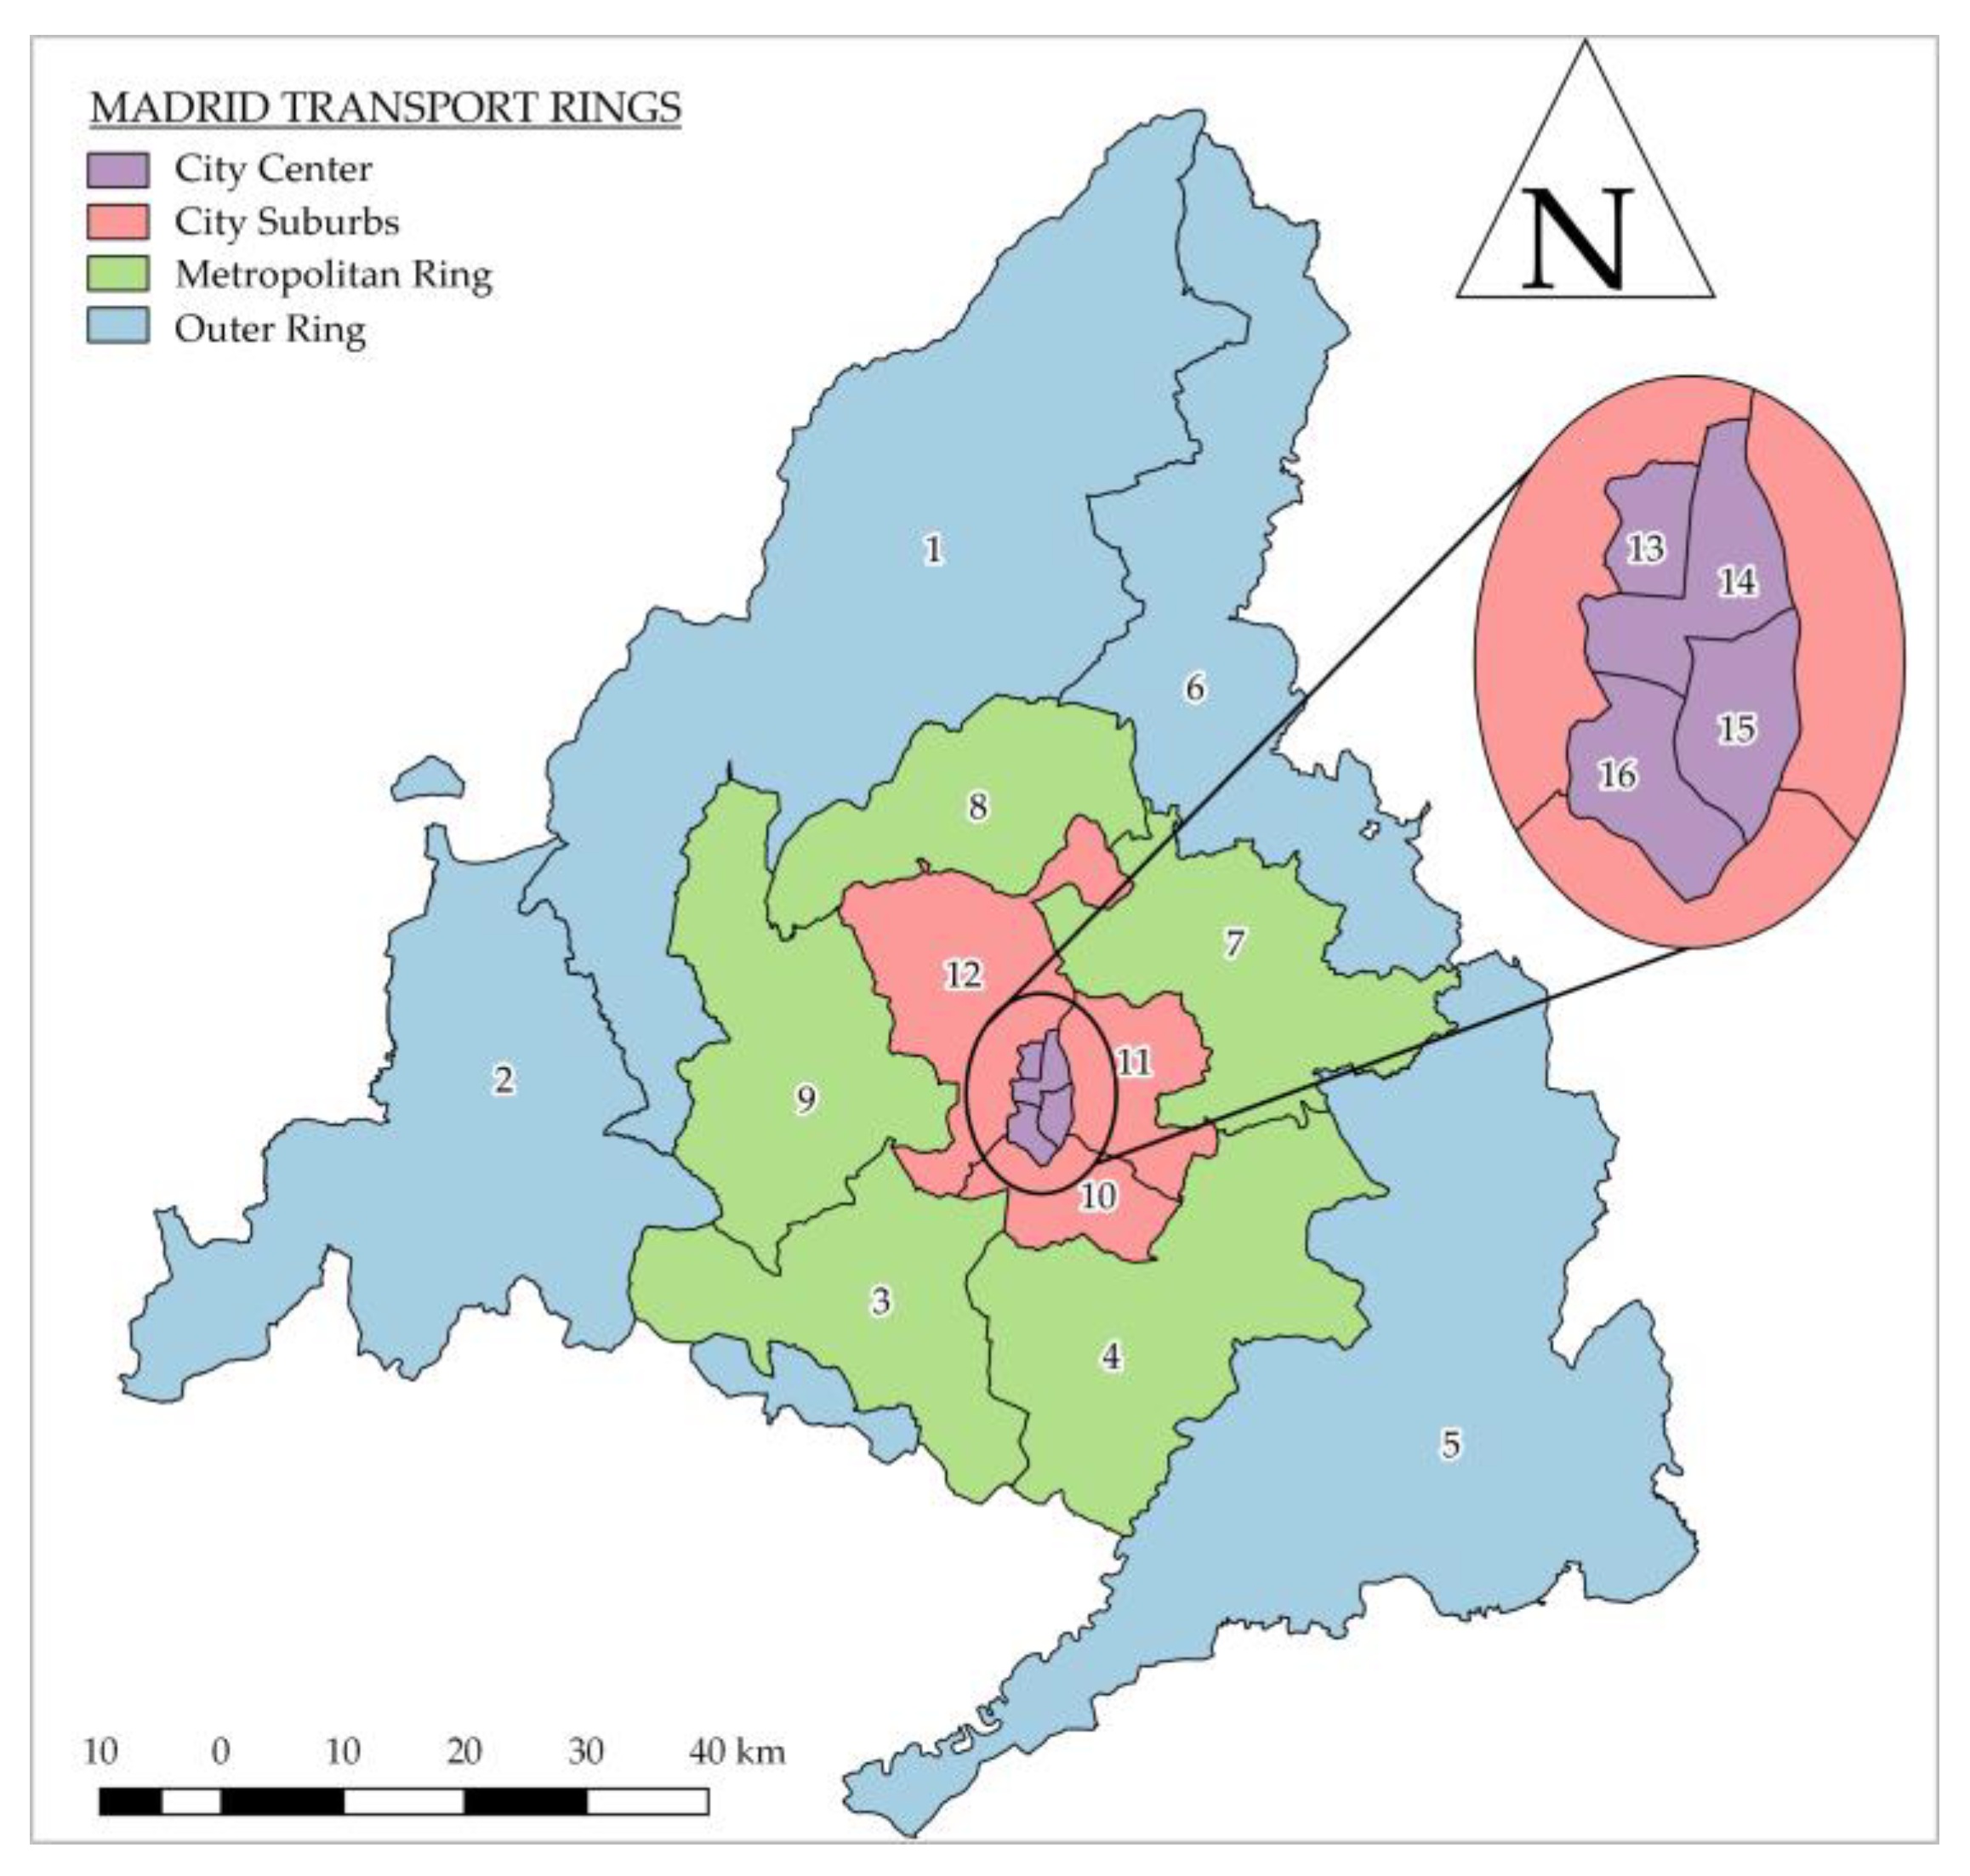
Figure 4 shows the sixteen zones chosen for the survey and their correspondence with the four rings of the Madrid Region. This zoning is based on analyzing sociodemographic characteristics, making them as homogeneous as possible. The use of this zoning helped to capture the differences in mobility patterns in each ring. A minimum target of 425 responses was set for each zone, meeting minimum criteria of twenty-five responses for each age group and 40% representation of each gender. This ensures good representativeness of the sample.
4.2. Survey Design
The Transport Research Centre team designed a multidisciplinary survey to understand the impacts of COVID-19 in the Madrid Region. This survey consisted of seven sections. This paper focuses on three of these seven sections (see Appendix A):
- Sociodemographic characteristics: data such as gender, age and income. This section also includes questions about home relocation.
- Changes in mobility patterns: information related to mobility patterns. This section captured changes in mobility patterns, asking about them before and after the pandemic. This provides a picture of the evolution of mobility patterns throughout the pandemic.
- Performing telematic activities: adoption of activities via telematic means. This section includes using these activities before and after the pandemic.
4.3. Survey Deployment
A company with a lot of expertise in surveys and opinion pools was responsible for the field work. Data collection was performed with a hybrid method combining telephone (CATI) and online (CAWI) interviews. This combination makes it possible to take advantage of the benefits of each technique. First, CAWI interviews yield many responses with minimal investment of time and money [43]. However, these interviews only reach some of the population. Older people, for example, prefer CATI interviews, resulting in biased samples [44]. To avoid this, CATI interviews complemented CAWI interviews, achieving better sample control and ensuring its representativeness. The company selected the CATI sample randomly to ensure the representativeness of the final sample. The company has a panel with thousands of panelists enrolled in the CAWI survey. The selection of this sample was made from their profiles. Panelists were rewarded for their participation in the survey with virtual points that could be exchanged for gifts.
This methodology was applied in a pilot test conducted in October 2022. This test detected errors that were corrected in the final survey and allowed training the surveyor team. Seventy-one responses from the respondents and feedback from surveyors helped improve the survey. Within the design parameters, the average response time was 35 min per survey.
The final survey conducted between November and December 2022 obtained 15,666 valid responses, fulfilling the minimum criteria of representativeness in all zones. The distribution of responses according to ring and gender was extracted. All groups had over 1000 responses, above the 385 responses that ensure the sample’s representativeness according to probability sampling. Therefore, it was demonstrated that the data collected are representative for a confidence level of 95% and a margin of error of 5% (Table 2).
The sample weighting allowed the provision of population estimations. This weighting adjusted the sample distribution for each zone and type of individual to the actual population distribution according to official sources. The sample weighting process concluded that the 15,666 responses equaled 5,690,634 people.
4.4. Descriptive Analysis
A descriptive analysis of the data collected in the survey reveals the characteristics of the sample. This descriptive analysis covers all survey questions, starting with the sociodemographic factors. Next, this analysis studies the variables related to changes in habits due to the pandemic. This analysis is based on variables designed to capture them in two ways: first, in a scale format (Decrease, Same, Increase), and second, in a binary form (Yes, No). These variables capture changes in habits regarding telematic activities, home relocation, trips per week, car ownership and changes in trip purpose and transport mode. The descriptive analysis shows which mobility trends have persisted in the aftermath of the COVID-19 pandemic and what the main changes in mobility patterns are.
4.5. Modeling COVID-19 Impacts
A binary logit model was applied to identify which factors are determinants of changes in mobility choices. The dependent variable is the modal shift expressed as a binary variable: zero (0) if there is no modal shift and one (1) if there is a modal shift. Numerous research studies on modal shift have used this methodology [45,46,47]. The model was run with Stata 15.0 software. This software uses the following formulation:
where x is the value of the independent variable, y is the value of the dependent variable, and β is the coefficient.
Because public transport is the transport mode that was most affected by the COVID-19 pandemic, this modeling analyzes people who used public transport before the pandemic. This paper contains five statistical analyses: one for the entire sample of the Madrid Region and one for each ring. Hence, it is possible to see the differences in these factors in each ring, allowing their comparison.
5. Results and Discussion
The interpretation of results led to the detection of different impacts. The analysis of effects helps to determine whether the new predicted mobility trends are present in the current situation of mobility patterns and population habits in the Madrid Region.
5.1. Descriptive Analysis
The descriptive analysis includes fifteen variables that capture sociodemographic characteristics and the impacts of the pandemic on the population’s habits. First, the variables shown in Table 3 characterize the sample from a sociodemographic point of view. As shown, the survey has almost equal representation of men and women. In terms of age, the least represented group is the youngest, which is unsurprising because only those over sixteen years old responded. More than half of the sample has a university degree. Moreover, almost 60% of the sample is employed, with only 7% being students (including those working part-time), 6% being unemployed and 18% being retired. Income ranges have virtually equal representation, ranging from 14 to 23%, except for the smallest range, with only 6%. Finally, only 7% of the sample takes more than 60 min, with the first three trip duration ranges accounting for the majority.
The survey included several questions to analyze changes in activities due to the COVID-19 pandemic. They included mobility patterns, telematic activities and home relocation. Table 4 summarizes those changes. Teleworking has increased by 23%, a relevant change, and 70% of the sample reported no changes in telematic activities. This increase in teleworking has induced changes in the number of trips per week, home location and trip purpose. First, 19% of the sample stated they have decreased their trips per week. Remarkably, 18% reported having moved after the pandemic, with the majority moving to the City Suburbs and the Metropolitan Ring (13%). This behavior is directly related to teleworking: 32% of those who have relocated their home have increased their teleworking habits. Before the pandemic, commuting was at 69%. Of the sample, 19% stated that they changed their primary trip purpose: 13% no longer travel to work, and on the contrary, 6% have switched to commuting. Therefore, traveling to work was reduced by 7%. Finally, 13% of the sample said they have changed their car ownership: 8% have increased it, whereas 5% have decreased it, with a net increase of 3%. This increase is higher in peripheral zones.
The analysis of modal share changes after COVID-19 is shown in Figure 5. Of the respondents, 25% declared to have changed their transport mode. Public transport was the primary mode affected, with a decrease of 6%. These users have migrated to active modes and cars. The second main change is an increase in active modes (walking and cycling) from a 12 to 16% share. Despite the modal shift, the most used mode in the region is still the car, followed by public transport and active modes.
The impact of the pandemic on modal share has also been different in each ring of the Madrid Region. The modal shift in the central zones are higher than those in the peripheral zones. The analysis of the variations in each transport mode is based on the four matrices, one for each ring of study, presented in Figure 6. As a result of these matrices, it is possible to see how user flows have been in each case.
Before the pandemic, public transport use in the City Center was higher than car use. This may be due to the good supply of public transport and the presence of different LEZs that regulate car access. Madrid has two Special Protection LEZs in the City Center. Only low-emission cars can circulate in these zones. The City Center is also a LEZ, although less restrictive. The most polluting cars cannot access this ring [48]. In addition, car traffic lanes turned into new pedestrian spaces [49]. Reducing the number of cars that enter these LEZs has made the City Center more attractive for pedestrians. This fits with other research results, concluding that people are more likely to be active commuters when fewer cars exist [50]. In addition, the presence of pedestrian [51,52,53] and cycling [54,55] infrastructure and local commerce with mixed land use [56] further encourages more sustainable transport modes.
As the distance to the City Center increases, car use increases, and public transport use decreases. This is because public transport supply decreases as the distance to the City Center increases. Furthermore, the distance factor makes public transport trips longer. Groth et al. assert [57] that this may also be due to the socioeconomic profile in each city zone. In the center, young and progressive people (who use active modes) settle. In the periphery, people with lower incomes use public transport. Finally, in the outer zones, there are more traditional people who use cars.
Because most of the population has kept the same transport modes, the diagonals present the highest values. In the case of the City Center, those who continue using the car represent 25%, which is less than those who continue to travel via public transport (35%). The car and public transport captives are equivalent in the City Suburbs, with 33% and 35% values, respectively. Finally, car use increases in the peripheral zones, representing half of the population: 48% in the Metropolitan Ring and 56% in the Outer Ring. There is a higher proportion of captives of active modes in the City Center than in the rest of the rings. Specifically, these proportions are twice as high as those in the peripheral rings.
Regarding those who have shifted their transport modes, in the case of the City Center, the highest percentages of users have migrated from public transport to cars and active modes, with the latter being higher. In the rest of the rings, the highest modal shift value was from public transport to the car, with values between 7% and 8%. Although the values are lower, it is surprising that former car users now use public transport or active modes in all rings, with values between 3% and 5%. This may be due to increased fuel prices, which make the car a less attractive transport mode.
The results indicate that public transport has lost more passengers than the other modes. Therefore, the car and active modes are the ones that have received these passengers. Specifically, public transport has lost between 5% and 7%, depending on the zone. The next step in this research is to determine the reason for this trend based on statistical models.
5.2. Modeling COVID-19 Impacts
Previous analyses have shown that public transport is the mode that has been most adversely affected by the COVID-19 pandemic. For this reason, the modeling and its analysis focus on the users of this transport mode before the COVID-19 pandemic. This part of the analysis characterizes the key factors of those public transport users who changed their usual transport mode after the pandemic.
This analysis applies a binary logit model to the selected sample. The dependent variable of this analysis is the modal shift. The modeling focuses on all former public transport users in the Madrid Region. This helps to understand the key factors influencing the entire population of the Madrid Region. The heterogeneity of the sociodemographic characteristics of the Madrid Region justifies the analysis of the four rings separately. In this way, it is possible to conduct a spatial analysis of the determining factors of each zone.
This modeling includes the variables studied in the descriptive analysis, including sociodemographic characteristics, changes in habits and mobility patterns. This allows a comprehensive analysis of all the factors influencing the decision to shift transport modes. Table 5 collects the main results of the five models in parallel, one for the whole region and one for each ring. The complete results for each model are in Table A1, Table A2, Table A3, Table A4 and Table A5 in Appendix B. All the models show reliable results and most of the variables are significant in explaining the modal shift from public transport. The large sample size of the survey (15,666 responses) results in significant representation of the population of the Madrid Region.
In three rings (CC, CS, OR), people between 26 and 45 are more likely to use less public transport. In the case of the Metropolitan Ring, those over 45 years old tend to continue using public transport as the most frequent mode. Educational level is not significant in the City Center. However, in the City Suburbs, people with more education are more likely to use less public transport. Occupation is significant in the peripheral rings of the Madrid Region (MR, OR). In these rings, although the self-employed and retirees are more prone to modal shift, students show the opposite behavior. People with higher incomes (>€3000) throughout the Madrid Region seem to use public transport less. According to other studies, this trend may be because higher-income households have more alternatives to public transport [58]. The results show that gender is not significant: men and women behave similarly.
Teleworking is significant in the central rings, where the presence of jobs that allow this modality is more significant. In the case of the City Center, people who have reduced teleworking are more likely to shift their mode. The coefficients of these variables are like the coefficients of the age group of 26–45 years, which is consistent because this age group constitutes most of the workforce in the Madrid Region. This is consistent with other studies that found that teleworking is highly correlated with age [59].
Home relocation is significant in the peripheral zones. However, although the Metropolitan Ring has not influenced any modal shift, the Outer Ring has led to a more remarkable one. The coefficient of the Outer Ring explains the results obtained from the variables corresponding to income, and all groups are prone to modal shift in this ring. This may indicate that people of all income levels follow home relocation. Furthermore, according to the result for the age variable, most of those who have moved to the Outer Ring are between 26 and 45 years old. These results are aligned with other studies indicating that those that are most prone to home relocation are the youngest [18].
Regarding mobility-related variables, the increase in car ownership is significant for fewer public transport trips in all rings. The weight of car ownership increases with distance to the City Center. This may be because public transport is less competitive than cars in the peripheral zones, especially in the Outer Ring. This result aligns with other studies, which have found a relationship between the increase in car ownership and public transport services supply [60]. On the other hand, the rise in car ownership may be related to income. Therefore, households with higher incomes have increased car ownership.
The results of the three variables related to trip purpose explain a fascinating behavior: people who no longer commute to work have changed the transport mode of their current trips. This means that reducing commuting trips has led to a decrease in public transport use. This result is consistent with the results of the analysis of trips per week, whose results show that people who have varied their total trips are more likely to stop using public transport, with a more significant influence on those who have increased their trips. Finally, public transport trips have a longer duration. The modal choice has shifted to active modes for short trips (≤15 min), becoming the second most used mode (21%). On the other hand, public transport trips that have transferred to the car are now shorter.
6. Conclusions
Mobility has undergone significant changes due to the COVID-19 pandemic. During the pandemic peak, the Spanish government imposed mobility restrictions that led to a decline in trips. However, the pandemic has left some changes in mobility patterns. This paper analyzes these changes and their medium-term impacts.
The survey-based methodology used in this paper provides data on how the pandemic has affected mobility patterns. The literature review states that four concepts influence mobility in the post-COVID-19 era: increased telematic activities, the fear of infection, the adoption of healthier modes and changes in trip purpose. The zoning allows for a spatial analysis, showing how these changes vary in each zone of the Madrid Region. The deep and detailed customized survey provides an overview of these impacts by asking the population about their habits before and after the pandemic. Finally, the large sample size ensures the high representativeness of the survey.
The first objective was to study the impact of COVID-19 on public transport use. According to the results, its demand decreased by 6% in the Madrid Region. A descriptive analysis and a statistical model of the data allowed to characterize this impact. An interesting finding of this research is the increase in active modes (4%). The increase in active modes is more significant in the City Center (5%) than in other zones. The fear of infection, the implementation of LEZs and the promotion of active modes encouraged this behavior. Active modes are also an attractive alternative to public transport in the peripheral zones of the region. Specifically, in the Outer Ring, the increase in cars and active modes was the same (3%). This is because the Metropolitan Ring and the Outer Ring consist of independent urban cores. Although there are extensive trip flows to the capital, a large part of the population lives and works in the same urban center. Car use has increased by 2% in the Madrid Region. The most influential factor in public transport demand is the increase in car ownership. All of the Madrid Region’s rings show this trend. Moreover, the population segment that shifted transport modes corresponds to the wealthiest group. This shows a relationship between income and mobility choices: high-income households are more likely to transfer trips from public transport to cars. Gender is not significant for modal shift: men and women have behaved similarly concerning their modal choices.
This research captures trends related to telematic activities: more than 20% claim to telework more than before the pandemic. Increases in teleworking are higher in the central zones: almost 30% of the City Center sample said that they have increased their telematic activities. These new teleworkers have changed their mobility choices, with a 30% modal shift. Teleworking is significant for modal shift in the central zones, leading to a tendency not to use public transport. The flexibility associated with these activities has led to changes in trip purpose and the number of weekly trips: 19% of the sample claim to make fewer weekly trips, and 13% no longer travel to work regularly.
Finally, there has also been a significant change in home location: 18% of the sample said that they have relocated their homes, with 13% of them moving to the peripheral zones. Most of those who have relocated houses are part of the younger population. Home relocation is related to the increase in telematic activities: more than 30% of those who have relocated have increased their teleworking habits. According to the results, home relocation causes a modal shift away from public transport. This may be because there are fewer public transport services in peripheral zones. Therefore, public transport is less attractive than cars for long trips, which causes car ownership to increase.
The results of this paper show the changes that the pandemic has left on mobility in the Madrid Region. The limitations of this research should be considered when interpreting the results obtained. The survey design captures well the changes in the mobility patterns of the population. However, it does not capture the reasons for these changes. This should be improved in future research to enrich the results.
This analysis can serve as a basis for creating strategies or policies to regulate using less sustainable modes. Knowledge of these new trends and their impacts can help when proposing actions to counteract the modal shift resulting from the pandemic. Among these actions, the implementation of LEZs can be highlighted due to restrictions to car access, which encourage the use of public transport and active modes. On the other hand, implementing policies aimed at the development of a 15-min city, such as mixing land use and promoting local commerce, could reduce car use in the city. Such actions will improve the sustainability of mobility in the Madrid Region.
Author Contributions
Conceptualization: A.A.-A. and A.M.; Methodology: A.A.-A.; Formal Analysis: A.A.-A.; Writing—Original Draft Preparation: A.A.-A.; Writing—Review and Editing: A.A.-A. and A.M.; Supervision: A.M. All authors have read and agreed to the published version of the manuscript.
Funding
This research was supported by the E.MORES-CM project, financed by the REACT-EU program of the European Regional Development Fund.
Informed Consent Statement
Informed consent was obtained from all subjects involved in the study.
Data Availability Statement
Not applicable.
Conflicts of Interest
The authors declare no conflict of interest.
Appendix A. Questionnaire
Sociodemographic Characteristics
- 1.
- Indicate your residence zone:☐ 1 ☐ 2 ☐ 3 ☐ 4 ☐ 5 ☐ 6 ☐ 7 ☐ 8 ☐ 9 ☐ 10 ☐ 11 ☐ 12 ☐ 13 ☐ 14 ☐ 15 ☐ 16
- 2.
- Indicate your gender:☐ Male ☐ Female
- 3.
- Indicate your age: ___
- 4.
- Indicate your education level:☐ Basic ☐ Secondary ☐ Baccalaureate ☐ Vocational Training ☐ University Degree
- 5.
- Indicate your current occupation:☐ Employee ☐ Self-Employed ☐ Student ☐ Student and Employee ☐ Homemaker☐ Unemployed ☐ Retiree
- 6.
- Monthly Income:☐ ≤1000 € ☐ 1000–1500 € ☐ 1500–2000 € ☐ 2000–3000 € ☐ >3000 €☐ I prefer not to answer.
- 7.
- Have you changed your place of residence since the beginning of the pandemic?☐ Yes ☐ No
Changes in mobility patterns
- 8.
- Indicate the number of cars in your household before the pandemic: ___
- 9.
- Indicate the number of cars in your household currently: ___
- 10.
- Indicate the reason for your main trip before the pandemic:☐ Work or study ☐ Shopping, leisure, etc.
- 11.
- Indicate the reason for your main trip currently:☐ Work or study ☐ Shopping, leisure, etc.
- 12.
- Indicate the transport mode used on your main trip before the pandemic:☐ Car or moto ☐ Public transport ☐ Walking, bicycle or scooter☐ Car or moto sharing ☐ Bike or scooter sharing ☐ Taxi
- 13.
- Indicate the transport mode used on your main trip currently:☐ Car or moto ☐ Public transport ☐ Walking, bicycle, or scooter☐ Car or moto sharing ☐ Bike or scooter sharing ☐ Taxi
- 14.
- Indicate the frequency of your main trip before the pandemic:☐ Never ☐ Occasionally ☐ 1–2 times per week ☐ 3–4 times per week☐ More than 4 times per week
- 15.
- Indicate the frequency of your main trip currently:☐ Never ☐ Occasionally ☐ 1–2 times per week ☐ 3–4 times per week☐ More than 4 times per week
- 16.
- Indicate the duration in minutes of your main trip: ___
Performing telematic activities
- 17.
- Indicate the frequency of teleworking before the pandemic:☐ Never ☐ Occasionally ☐ A few times per month ☐ 1–2 times per week☐ 3–4 times per week ☐ Daily
- 18.
- Indicate the frequency of teleworking currently:☐ Never ☐ Occasionally ☐ A few times per month ☐ 1–2 times per week☐ 3–4 times per week ☐ Daily
- 19.
- Indicate the frequency of e-learning before the pandemic:☐ Never ☐ Occasionally ☐ A few times per month ☐ 1–2 times per week☐ 3–4 times per week ☐ Daily
- 20.
- Indicate the frequency of e-learning currently:☐ Never ☐ Occasionally ☐ A few times per month ☐ 1–2 times per week☐ 3–4 times per week ☐ Daily
Appendix B. Logit Model Complete Results

Table A1.
Logit model results for the modal shift from public transport in Madrid Region.
| Variables | Categories | Coef. | Std. Err. | p-Value | 95% Conf. Interval | |
|---|---|---|---|---|---|---|
| Sociodemographic | ||||||
| Age (≤25) | 46–60 | −0.377 | 0.080 | 0.000 | −0.533 | −0.220 |
| >60 | −0.502 | 0.098 | 0.000 | −0.694 | −0.310 | |
| Monthly Income (€) (≤1000) | 1500–2000 | 0.197 | 0.094 | 0.036 | 0.013 | 0.380 |
| 2000–3000 | 0.169 | 0.085 | 0.046 | 0.003 | 0.335 | |
| >3000 | 0.587 | 0.084 | 0.000 | 0.422 | 0.753 | |
| Teleworking (Same) | Increase | 0.226 | 0.072 | 0.002 | 0.085 | 0.367 |
| Mobility | ||||||
| Car Ownership (Same) | Increase | 1.176 | 0.100 | 0.000 | 0.979 | 1.373 |
| Trip Purpose Now (Non-Working) | Working | −0.378 | 0.086 | 0.000 | −0.546 | −0.210 |
| Trip Purpose Change (No) | Yes | 0.827 | 0.089 | 0.000 | 0.652 | 1.002 |
| Trips per Week (Same) | Decrease | 0.876 | 0.078 | 0.000 | 0.723 | 1.030 |
| Increase | 1.581 | 0.115 | 0.000 | 1.356 | 1.805 | |
| Trip Duration (min) (≤15) | 16–30 | −0.438 | 0.088 | 0.000 | −0.610 | −0.265 |
| 31–60 | −1.054 | 0.091 | 0.000 | −1.233 | −0.875 | |
| >60 | −1.326 | 0.131 | 0.000 | −1.582 | −1.070 | |
n = 5823; Pseudo R2 = 0.154.
Table A2.
Logit model results for the modal shift from public transport in City Center (CC).
| Variables | Categories | Coef. | Std. Err. | p-Value | 95% Conf. Interval | |
|---|---|---|---|---|---|---|
| Sociodemographic | ||||||
| Age (≤25) | 26–45 | 0.264 | 0.126 | 0.036 | 0.018 | 0.510 |
| Monthly Income (€) (≤1000) | >3000 | 0.386 | 0.133 | 0.004 | 0.125 | 0.647 |
| Teleworking (Same) | Decrease | 0.432 | 0.223 | 0.053 | −0.005 | 0.869 |
| Increase | 0.381 | 0.136 | 0.005 | 0.115 | 0.647 | |
| Mobility | ||||||
| Car Ownership (Same) | Increase | 1.094 | 0.206 | 0.000 | 0.690 | 1.498 |
| Trip Purpose Now (Non-Working) | Working | −0.618 | 0.147 | 0.000 | −0.906 | −0.330 |
| Trip Purpose Change (No) | Yes | 0.637 | 0.165 | 0.000 | 0.313 | 0.961 |
| Trips per Week (Same) | Decrease | 0.730 | 0.147 | 0.000 | 0.442 | 1.018 |
| Increase | 1.527 | 0.233 | 0.000 | 1.069 | 1.984 | |
| Trip Duration (min) (≤15) | 16–30 | −0.388 | 0.155 | 0.012 | −0.692 | −0.084 |
| 31–60 | −1.146 | 0.181 | 0.000 | −1.502 | −0.790 | |
| >60 | −0.803 | 0.336 | 0.017 | −1.461 | −0.145 | |
n = 1690; Pseudo R2 = 0.130.
Table A3.
Logit model results for the modal shift from public transport in City Suburbs (CS).
| Variables | Categories | Coef. | Std. Err. | p-Value | 95% Conf. Interval | |
|---|---|---|---|---|---|---|
| Sociodemographic | ||||||
| Age (≤25) | 26–45 | 0.398 | 0.120 | 0.001 | 0.163 | 0.633 |
| Studies (Basic) | Baccalaureate | 0.444 | 0.264 | 0.093 | −0.738 | 0.963 |
| Vocational Training | 0.478 | 0.259 | 0.065 | −0.290 | 0.986 | |
| University Degree | 0.666 | 0.237 | 0.005 | 0.202 | 1.131 | |
| Monthly Income (€) (≤1000) | >3000 | 0.441 | 0.150 | 0.003 | 0.148 | 0.735 |
| Teleworking (Same) | Increase | 0.352 | 0.131 | 0.007 | 0.095 | 0.609 |
| Mobility | ||||||
| Car Ownership (Same) | Increase | 1.005 | 0.192 | 0.000 | 0.629 | 1.380 |
| Trip Purpose Change (No) | Yes | 1.017 | 0.139 | 0.000 | 0.743 | 1.290 |
| Trips per Week (Same) | Decrease | 1.000 | 0.140 | 0.000 | 0.725 | 1.275 |
| Increase | 1.874 | 0.197 | 0.000 | 1.488 | 2.259 | |
| Trip Duration (min) (≤15) | 16–30 | −0.419 | 0.167 | 0.012 | −0.747 | −0.092 |
| 31–60 | −1.023 | 0.170 | 0.000 | −1.356 | −0.691 | |
| >60 | −1.315 | 0.289 | 0.000 | −1.881 | −0.749 | |
n = 1946; Pseudo R2 = 0.170.
Table A4.
Logit model results for the modal shift from public transport in Metropolitan Ring (MR).
| Variables | Categories | Coef. | Std. Err. | p-Value | 95% Conf. Interval | |
|---|---|---|---|---|---|---|
| Sociodemographic | ||||||
| Age (≤25) | 46–60 | −0.536 | 0.154 | 0.000 | −0.837 | −0.234 |
| >60 | −0.502 | 0.199 | 0.012 | −0.892 | −0.111 | |
| Studies (Basic) | University Degree | 0.282 | 0.123 | 0.022 | 0.041 | 0.524 |
| Occupation (Employee) | Self-Employed | 0.473 | 0.261 | 0.070 | −0.038 | 0.984 |
| Student | −0.504 | 0.224 | 0.025 | −0.944 | −0.064 | |
| Monthly Income (€) (≤1000) | >3000 | 0.580 | 0.150 | 0.000 | 0.286 | 0.874 |
| E-Learning (Same) | Increase | 0.276 | 0.144 | 0.055 | −0.006 | 0.559 |
| Home Relocation (No) | Yes | −0.280 | 0.146 | 0.055 | −0.567 | 0.006 |
| Mobility | ||||||
| Car Ownership (Same) | Increase | 1.127 | 0.184 | 0.000 | 0.765 | 1.489 |
| Trip Purpose Now (Non-Working) | Working | −0.430 | 0.167 | 0.010 | −0.758 | −0.103 |
| Trip Purpose Change (No) | Yes | 0.794 | 0.171 | 0.000 | 0.460 | 1.129 |
| Trips per Week (Same) | Decrease | 0.908 | 0.145 | 0.000 | 0.623 | 1.192 |
| Increase | 1.205 | 0.216 | 0.000 | 0.781 | 1.629 | |
| Trip Duration (min) (≤15) | 16–30 | −0.372 | 0.169 | 0.028 | −0.703 | −0.040 |
| 31–60 | −1.398 | 0.166 | 0.000 | −1.724 | −1.072 | |
| >60 | −1.862 | 0.213 | 0.000 | −2.279 | −1.445 | |
n = 1679; Pseudo R2 = 0.196.
Table A5.
Logit model results for the modal shift from public transport in Outer Ring (OR).
| Variables | Categories | Coef. | Std. Err. | p-Value | 95% Conf. Interval | |
|---|---|---|---|---|---|---|
| Sociodemographic | ||||||
| Age (≤25) | 26–45 | 0.713 | 0.245 | 0.004 | 0.233 | 1.194 |
| Studies (Basic) | Vocational Training | 0.460 | 0.263 | 0.080 | −0.055 | 0.975 |
| Occupation (Employee) | Retiree | 0.899 | 0.443 | 0.043 | 0.030 | 1.768 |
| Monthly Income (€) (≤1000) | 1000–1500 | 0.915 | 0.425 | 0.031 | 0.082 | 1.747 |
| 1500–2000 | 0.995 | 0.442 | 0.024 | 0.129 | 1.861 | |
| 2000–3000 | 1.151 | 0.429 | 0.007 | 0.310 | 1.993 | |
| >3000 | 2.059 | 0.455 | 0.000 | 1.166 | 2.951 | |
| No Answer | 0.812 | 0.418 | 0.052 | −0.007 | 1.631 | |
| Home Relocation (No) | Yes | 1.128 | 0.266 | 0.000 | 0.607 | 1.650 |
| Mobility | ||||||
| Car Ownership (Same) | Increase | 1.297 | 0.298 | 0.000 | 0.713 | 1.881 |
| Trip Purpose Before (Non-Working) | Working | 0.887 | 0.415 | 0.033 | 0.074 | 1.701 |
| Trip Purpose Now (Non-Working) | Working | −0.745 | 0.429 | 0.083 | −1.586 | 0.097 |
| Trip Purpose Change (No) | Yes | 1.214 | 0.394 | 0.002 | 0.442 | 1.986 |
| Trips per Week (Same) | Decrease | 0.895 | 0.295 | 0.002 | 0.317 | 1.473 |
| Increase | 1.733 | 0.399 | 0.000 | 0.951 | 2.515 | |
| Trip Duration (min) (≤15) | 16–30 | 0.845 | 0.294 | 0.004 | 0.268 | 1.421 |
| >60 | −1.429 | 0.285 | 0.000 | −1.986 | −0.871 | |
n = 508; Pseudo R2 = 0.284.
References
- Arce Ruiz, R.M. Tendencias Sostenibles En La Movilidad Urbana. In El Desarrollo Urbano en la era Pos-COVID; Eixo Atlántico do Noroeste Peninsular: Culleredo, Spain, 2022; pp. 45–70. Available online: https://www.eixoatlantico.com/en/listado-publicaciones/6021-el-desarrollo-urbano-en-la-era-pos-covid (accessed on 8 April 2023).
- Shibayama, T.; Sandholzer, F.; Laa, B.; Brezina, T. Impact of COVID-19 Lockdown on Commuting: A Multi-Country Perspective. Eur. J. Transp. Infrastruct. Res. 2021, 21, 70–93. [Google Scholar] [CrossRef]
- Kallidoni, M.; Katrakazas, C.; Yannis, G. Modelling the Relationship between Covid-19 Restrictive Measures and Mobility Patterns across Europe Using Time-Series Analysis. Eur. J. Transp. Infrastruct. Res. 2022, 22, 161–182. [Google Scholar] [CrossRef]
- Dingil, A.E.; Esztergár-Kiss, D. The Influence of the COVID-19 Pandemic on Mobility Patterns: The First Wave’s Results. Transp. Lett. 2021, 13, 434–446. [Google Scholar] [CrossRef]
- Eisenmann, C.; Nobis, C.; Kolarova, V.; Lenz, B.; Winkler, C. Transport Mode Use during the COVID-19 Lockdown Period in Germany: The Car Became More Important, Public Transport Lost Ground. Transp. Policy 2021, 103, 60–67. [Google Scholar] [CrossRef]
- Niu, C.; Zhang, W. Causal Effects of Mobility Intervention Policies on Intracity Flows during the COVID-19 Pandemic: The Moderating Role of Zonal Locations in the Transportation Networks. Comput. Environ. Urban. Syst. 2023, 102, 101957. [Google Scholar] [CrossRef]
- Radics, M.; Christidis, P. Impact of the COVID-19 Pandemic on Mobility in Spain; Publications Office of the European Union: Luxembourg, 2022. [Google Scholar] [CrossRef]
- Monzón, A.; López, C.; Cuvillo, R.; González, A.; Hernández, S.; Olmedo, E. Informe OMM 2020—Avance 2021; Ministerio de Transportes, Movilidad y Agenda Urbana: Madrid, Spain, 2022. [Google Scholar]
- Al-Akioui, A.; Monzón, A.; Álvarez Del Valle, L. Evolution of Mobility during the COVID-19 Crisis in the Region of Madrid. Transp. Res. Procedia 2021, 58, 416–422. [Google Scholar] [CrossRef]
- Van Audenhove, F.J.; Pourbaix, J.; Rominger, G.; Dommergues, E.; Eagar, R.; Carlier, J. The Future of Mobility Post-COVID. Turning the Crisis into an Opportunity to Accelerate towards More Sustainable, Resilient and Human-Centric Urban Mobility Systems; International Association of Public Transport: Luxembourg, 2020. [Google Scholar]
- Zhang, J.; Hayashi, Y. Impacts of COVID-19 on the Transport Sector and Measures as Well as Recommendations of Policies and Future Research: Analyses Based on a World-Wide Expert Survey. SSRN. 2020. Available online: https://papers.ssrn.com/sol3/papers.cfm?abstract_id=3611806 (accessed on 8 April 2023).
- Christidis, P.; Christodoulou, A.; Navajas-Cawood, E.; Ciuffo, B. The Post-Pandemic Recovery of Transport Activity: Emerging Mobility Patterns and Repercussions on Future Evolution. Sustainability 2021, 13, 6359. [Google Scholar] [CrossRef]
- Sharifi, A.; Khavarian-Garmsir, A.R.; Kummitha, R.K.R. Contributions of Smart City Solutions and Technologies to Resilience against the COVID-19 Pandemic: A Literature Review. Sustainability 2021, 13, 8018. [Google Scholar] [CrossRef]
- López Soler, J.R.; Christidis, P.; Vassallo, J.M. Evolution of Teleworking and Urban Mobility Changes Driven by the COVID-19 Pandemic across European Cities. Transp. Res. Procedia 2023, 69, 488–495. [Google Scholar] [CrossRef]
- De Abreu e Silva, J.; Melo, P.C. The Effects of Home-Based Telework on Household Total Travel: A Path Analysis Approach of British Households. Transp. Res. Procedia 2017, 27, 832–840. [Google Scholar] [CrossRef]
- Abduljabbar, R.L.; Liyanage, S.; Dia, H. A Systematic Review of the Impacts of the Coronavirus Crisis on Urban Transport: Key Lessons Learned and Prospects for Future Cities. Cities 2022, 127, 103770. [Google Scholar] [CrossRef] [PubMed]
- Balbontin, C.; Hensher, D.A.; Beck, M.J. Relationship between Commuting and Non-Commuting Travel Activity under the Growing Incidence of Working from Home and People’s Attitudes towards COVID-19. Transportation 2023. [Google Scholar] [CrossRef]
- Stefaniec, A.; Brazil, W.; Whitney, W.; Caulfield, B. Desire to Work from Home: Results of an Irish Study. J. Transp. Geogr. 2022, 104, 103416. [Google Scholar] [CrossRef] [PubMed]
- Downey, L.; Fonzone, A.; Fountas, G.; Semple, T. The Impact of COVID-19 on Future Public Transport Use in Scotland. Transp. Res. Part. A Policy Pr. 2022, 163, 338–352. [Google Scholar] [CrossRef] [PubMed]
- De Vos, J. The Effect of COVID-19 and Subsequent Social Distancing on Travel Behavior. Transp. Res. Interdiscip. Perspect. 2020, 5, 100121. [Google Scholar] [CrossRef]
- Tirachini, A.; Cats, O. COVID-19 and Public Transportation: Current Assessment, Prospects, and Research Needs. J. Public Trans. 2020, 22, 1–21. [Google Scholar] [CrossRef]
- Shtele, E.; Beria, P.; Lunkar, V. Using Location Based Social Media Data to Explain COVID-19 Spread in Italy. Eur. J. Transp. Infrastruct. Res. 2022, 22, 132–160. [Google Scholar] [CrossRef]
- Hu, S.; Xiong, C.; Yang, M.; Younes, H.; Luo, W.; Zhang, L. A Big-Data Driven Approach to Analyzing and Modeling Human Mobility Trend under Non-Pharmaceutical Interventions during COVID-19 Pandemic. Transp. Res. Part. C Emerg. Technol. 2021, 124, 102955. [Google Scholar] [CrossRef]
- Zhao, P.; Gao, Y. Public Transit Travel Choice in the Post COVID-19 Pandemic Era: An Application of the Extended Theory of Planned Behavior. Travel. Behav. Soc. 2022, 28, 181–195. [Google Scholar] [CrossRef]
- Fernández Pozo, R.; Wilby, M.R.; Vinagre Díaz, J.J.; Rodríguez González, A.B. Data-Driven Analysis of the Impact of COVID-19 on Madrid’s Public Transport during Each Phase of the Pandemic. Cities 2022, 127, 103723. [Google Scholar] [CrossRef]
- Liu, C.; Zhang, W. Social and Spatial Heterogeneities in COVID-19 Impacts on Individual’s Metro Use: A Big-Data Driven Causality Inference. Appl. Geogr. 2023, 155, 102947. [Google Scholar] [CrossRef] [PubMed]
- UITP. Public Transport Is COVID-Safe; UITP: Bruxelles, Belgium, 2020. [Google Scholar]
- Subbarao, S.S.V.; Kadali, R. Impact of COVID-19 Pandemic Lockdown on the Public Transportation System and Strategic Plans to Improve PT Ridership: A Review. Innov. Infrastruct. Solut. 2021, 7, 97. [Google Scholar] [CrossRef]
- Das, S.; Boruah, A.; Banerjee, A.; Raoniar, R.; Nama, S.; Maurya, A.K. Impact of COVID-19: A Radical Modal Shift from Public to Private Transport Mode. Transp. Policy 2021, 109, 1–11. [Google Scholar] [CrossRef] [PubMed]
- Kim, S.; Jang, K.; Yeo, J. Non-Linear Impacts of COVID-19 Pandemic on Human Mobility: Lessons from Its Variations across Three Pandemic Waves. Sustain. Cities Soc. 2023, 97, 104769. [Google Scholar] [CrossRef]
- Vega-Gonzalo, M.; Gomez, J.; Christidis, P. How Has COVID-19 Changed Private Car Use in European Urban Areas? An Analysis of the Effect of Socio-Economic Characteristics and Mobility Habits. Transp. Res. Part. A Policy Pr. 2023, 172, 103679. [Google Scholar] [CrossRef]
- Arias-Molinares, D.; García-Palomares, J.C.; Gutiérrez, J. Micromobility Services before and after a Global Pandemic: Impact on Spatio-Temporal Travel Patterns. Int. J. Sustain. Transp. 2022, 17, 1058–1073. [Google Scholar] [CrossRef]
- Christidis, P.; Vega-Gonzalo, M.; Ulpiani, G.; Vetters, N. Post-Pandemic Trends in Urban Mobility; Publications Office of the European Union: Luxembourg, 2023. [Google Scholar] [CrossRef]
- Nalmpantis, D.; Vatavali, F.; Kehagia, F. A Review of the Good Practices of Active Mobility Measures Implemented by European Cities Due to the COVID-19 Pandemic. IOP Conf. Ser. Earth Environ. Sci. 2021, 899, 12057. [Google Scholar] [CrossRef]
- Jasiński, A. COVID-19 Pandemic Is Challenging Some Dogmas of Modern Urbanism. Cities 2022, 121, 103498. [Google Scholar] [CrossRef]
- Nikiforiadis, A.; Mitropoulos, L.; Kopelias, P.; Basbas, S.; Stamatiadis, N.; Kroustali, S. Exploring Mobility Pattern Changes between before, during and after COVID-19 Lockdown Periods for Young Adults. Cities 2022, 125, 103662. [Google Scholar] [CrossRef]
- Ciuffini, F.; Tengattini, S.; Bigazzi, A.Y. Mitigating Increased Driving after the COVID-19 Pandemic: An Analysis on Mode Share, Travel Demand, and Public Transport Capacity. Transp. Res. Rec. 2023, 2677, 154–167. [Google Scholar] [CrossRef]
- Instituto de Estadística de la Comunidad de Madrid; Banco de Datos Municipal y Zonal ALMUDENA. 2022. Available online: https://gestiona.comunidad.madrid/desvan/Inicio.icm?enlace=almudena (accessed on 8 April 2023).
- Ayuntamiento de Madrid; Banco de Datos Del Ayuntamiento de Madrid; 2022. Available online: https://www-s.madrid.es/CSEBD_WBINTER/arbol.html (accessed on 8 April 2023).
- Consorcio Regional de Transportes de Madrid; Encuesta Domiciliaria de Movilidad de La Comunidad de Madrid 2018. 2020. Available online: https://crtm.maps.arcgis.com/apps/MinimalGallery/index.html?appid=a60bb2f0142b440eadee1a69a11693fc (accessed on 8 April 2023).
- Gobierno de España Real Decreto 463/2020, de 14 de Marzo, Por El Que Se Declara El Estado de Alarma Ocasionado Por El COVID-19. 2020. Available online: https://www.boe.es/eli/es/rd/2020/03/14/463/con (accessed on 8 April 2023).
- Google; COVID-19 Community Mobility Reports. 2022. Available online: https://www.google.com/covid19/mobility/ (accessed on 8 April 2023).
- Christensen, L. The Role of Web Interviews as Part of a National Travel Survey. In Transport Survey Methods; Zmud, J., Lee-Gosselin, M., Munizaga, M., Carrasco, J.A., Eds.; Emerald Group Publishing Limited: Bingley, UK, 2013; pp. 115–154. ISBN 978-1-78-190288-2, 978-1-78-190287-5. [Google Scholar]
- Kagerbauer, M.; Manz, W.; Zumkeller, D. Analysis of PAPI, CATI, and CAWI Methods for a Multiday Household Travel Survey. In Transport Survey Methods; Zmud, J., Lee-Gosselin, M., Munizaga, M., Carrasco, J.A., Eds.; Emerald Group Publishing Limited: Bingley, UK, 2013; pp. 289–304. ISBN 978-1-78-190288-2/978-1-78-190287-5. [Google Scholar]
- Ma, X.; Yuan, Y.; Van Oort, N.; Hoogendoorn, S. Bike-Sharing Systems’ Impact on Modal Shift: A Case Study in Delft, the Netherlands. J. Clean. Prod. 2020, 259, 120846. [Google Scholar] [CrossRef]
- Abdulrazzaq, L.R.; Abdulkareem, M.N.; Mat Yazid, M.R.; Borhan, M.N.; Mahdi, M.S. Traffic Congestion: Shift from Private Car to Public Transportation. Civ. Eng. J. 2020, 6, 1547–1554. [Google Scholar] [CrossRef]
- Tarriño-Ortiz, J.; Gómez, J.; Soria-Lara, J.A.; Vassallo, J.M. Analyzing the Impact of Low Emission Zones on Modal Shift. Sustain. Cities Soc. 2022, 77, 103562. [Google Scholar] [CrossRef]
- Ayuntamiento de Madrid; Zonas de Bajas Emisiones. 2023. Available online: https://www.madrid.es/portales/munimadrid/es/Inicio/Movilidad-y-transportes/Zonas-de-Bajas-Emisiones/?vgnextfmt=default&vgnextchannel=da7add4bfea9b710VgnVCM2000001f4a900aRCRD (accessed on 8 April 2023).
- Bañuelos-Gimeno, J.; Sobrino, N.; Arce-Ruiz, R.M. Effects of Mobility Restrictions on Air Pollution in the Madrid Region during the COVID-19 Pandemic and Post-Pandemic Periods. Sustainability 2023, 15, 12702. [Google Scholar] [CrossRef]
- Cao, X.; Handy, S.L.; Mokhtarian, P.L. The Influences of the Built Environment and Residential Self-Selection on Pedestrian Behavior: Evidence from Austin, TX. Transportation 2006, 33, 1–20. [Google Scholar] [CrossRef]
- Ewing, R.; Cervero, R. Travel and the Built Environment: A Meta-Analysis. J. Am. Plan. Assoc. 2010, 76, 265–294. [Google Scholar] [CrossRef]
- Ferrer-Ortiz, C.; Marquet, O.; Mojica, L.; Vich, G. Barcelona under the 15-Minute City Lens: Mapping the Accessibility and Proximity Potential Based on Pedestrian Travel Times. Smart Cities 2022, 5, 146–161. [Google Scholar] [CrossRef]
- Núñez, F.; Albornoz, E.; Gutiérrez, M.; Zumelzu, A. Socially Sustainable Accessibility to Goods and Services in the Metropolitan Area of Concepción, Chile, Post-COVID-19. Sustainability 2022, 14, 14042. [Google Scholar] [CrossRef]
- Félix, R.; Cambra, P.; Moura, F. Build It and Give ‘em Bikes, and They Will Come: The Effects of Cycling Infrastructure and Bike-Sharing System in Lisbon. Case Stud. Transp. Policy 2020, 8, 672–682. [Google Scholar] [CrossRef]
- Valenzuela-Levi, N.; Echiburu, T.; Correa, J.; Hurtubia, R.; Muñoz, J.C. Housing and Accessibility after the COVID-19 Pandemic: Rebuilding for Resilience, Equity and Sustainable Mobility. Transp. Policy 2021, 109, 48–60. [Google Scholar] [CrossRef]
- Cervero, R.; Kockelman, K. Travel Demand and the 3Ds: Density, Diversity, and Design. Transp. Res. D Transp. Environ. 1997, 2, 199–219. [Google Scholar] [CrossRef]
- Groth, S.; Hunecke, M.; Wittowsky, D. Middle-Class, Cosmopolitans and Precariat among Millennials between Automobility and Multimodality. Transp. Res. Interdiscip. Perspect. 2021, 12, 100467. [Google Scholar] [CrossRef]
- Gramsch, B.; Guevara, C.A.; Munizaga, M.; Schwartz, D.; Tirachini, A. The Effect of Dynamic Lockdowns on Public Transport Demand in Times of COVID-19: Evidence from Smartcard Data. Transp. Policy 2022, 126, 136–150. [Google Scholar] [CrossRef] [PubMed]
- López Soler, J.R.; Christidis, P.; Vassallo, J.M. Teleworking and Online Shopping: Socio-Economic Factors Affecting Their Impact on Transport Demand. Sustainability 2021, 13, 7211. [Google Scholar] [CrossRef]
- Vega-Gonzalo, M.; Christidis, P.; Gomez, J. Car Ownership and Post-COVID Urban Mobility across European Cities. Transp. Res. Procedia 2023, 69, 305–312. [Google Scholar] [CrossRef]
Figure 1.
Pre-pandemic home-based generated trips in Madrid Region (2018). Source: [40].
Figure 1.
Pre-pandemic home-based generated trips in Madrid Region (2018). Source: [40].

Figure 3.
Survey-based methodology overview.

Figure 4.
Survey zoning of Madrid Region.

Figure 5.
Changes in modal share due to COVID-19 pandemic in Madrid Region.

Figure 6.
Modal shift flows per ring of Madrid Region.

| Ring | Surface (km2) | Population (2022) | Workplaces (2022) |
|---|---|---|---|
| City Center (CC) | 42 | 999,486 | 1,063,834 |
| City Suburbs (CS) | 563 | 2,304,428 | 873,674 |
| Metropolitan Ring (MR) | 2276 | 2,950,534 | 1,156,681 |
| Outer Ring (OR) | 5150 | 519,020 | 114,478 |
| Madrid Region | 8031 | 6,773,468 | 3,208,667 |
Table 2.
Representativeness analysis.
| Ring | Gender | Population * | Responses | Representative ** |
|---|---|---|---|---|
| City Center (CC) | Male | 403,347 | 1589 | ✓ |
| Female | 486,072 | 1920 | ✓ | |
| City Suburbs (CS) | Male | 905,240 | 1956 | ✓ |
| Female | 1,055,964 | 2389 | ✓ | |
| Metropolitan Ring (MR) | Male | 1,166,263 | 2516 | ✓ |
| Female | 1,250,442 | 2961 | ✓ | |
| Outer Ring (OR) | Male | 210,576 | 1102 | ✓ |
| Female | 212,057 | 1233 | ✓ |
* ≥16 years old; ** Confidence level of 95% and margin of error of 5%.
Table 3.
Sample distribution of general attributes.
| Variables | Categories | Distribution (%) |
|---|---|---|
| Gender | Male | 47 |
| Female | 53 | |
| Age | ≤25 | 12 |
| 26–45 | 37 | |
| 46–60 | 24 | |
| >60 | 27 | |
| Studies | Basic | 5 |
| Secondary (GCSE) | 8 | |
| Baccalaureate | 17 | |
| Vocational Training | 19 | |
| University Degree | 51 | |
| Occupation | Employee | 59 |
| Self-Employed | 7 | |
| Student | 4 | |
| Student and Employee | 3 | |
| Homemaker | 3 | |
| Unemployed | 6 | |
| Retiree | 18 | |
| Monthly Income (€) | ≤1000 | 6 |
| 1000–1500 | 14 | |
| 1500–2000 | 15 | |
| 2000–3000 | 21 | |
| >3000 | 23 | |
| No Answer | 21 | |
| Trip Duration (min.) | ≤15 | 25 |
| 16–30 | 39 | |
| 31–60 | 29 | |
| >60 | 7 |
n = 5,690,634.
Table 4.
Changes due to the COVID-19 pandemic.
| Variables | Decrease (%) | Same (%) | Increase (%) |
|---|---|---|---|
| Teleworking | 7 | 70 | 23 |
| E-Learning | 11 | 72 | 17 |
| Car Ownership | 5 | 87 | 8 |
| Trips per Week | 19 | 73 | 8 |
| No (%) | Yes (%) | ||
| Home Relocation | 82 | 18 | |
| Trip Purpose Change | 81 | 19 | |
| Modal Shift | 75 | 25 |
n = 5,690,634.
Table 5.
Logit model results for the modal shift from public transport per ring.
| Variables | Categories | Region | CC | CS | MR | OR |
|---|---|---|---|---|---|---|
| Sociodemographic | ||||||
| Age (≤25) | 26–45 | 0.264 ** | 0.398 ** | 0.713 ** | ||
| 46–60 | −0.377 *** | −0.536 *** | ||||
| >60 | −0.502 *** | −0.502 ** | ||||
| Studies (Basic) | Baccalaureate | 0.444 * | ||||
| Vocational Training | 0.478 * | 0.460 * | ||||
| University Degree | 0.666 ** | 0.282 ** | ||||
| Occupation (Employee) | Self-Employed | 0.473 * | ||||
| Student | −0.504 ** | |||||
| Retiree | 0.899 ** | |||||
| Monthly Income (€) (≤1000) | 1000–1500 | 0.915 ** | ||||
| 1500–2000 | 0.197 ** | 0.995 ** | ||||
| 2000–3000 | 0.169 ** | 1.151 ** | ||||
| >3000 | 0.587 *** | 0.386 ** | 0.441 ** | 0.580 *** | 2.059 *** | |
| No Answer | 0.812 * | |||||
| Teleworking (Same) | Decrease | 0.432 * | ||||
| Increase | 0.226 ** | 0.381 ** | 0.352 ** | |||
| E-Learning (Same) | Increase | 0.276 * | ||||
| Home Relocation (No) | Yes | −0.280 * | 1.128 *** | |||
| Mobility | ||||||
| Car Ownership (Same) | Increase | 1.176 *** | 1.094 *** | 1.005 *** | 1.127 *** | 1.297 *** |
| Trip Purpose Before (Non-Working) | Working | 0.887 ** | ||||
| Trip Purpose Now (Non-Working) | Working | −0.378 *** | −0.618 *** | −0.430 ** | −0.745 * | |
| Trip Purpose Change (No) | Yes | 0.827 *** | 0.637 *** | 1.017 *** | 0.794 *** | 1.214 ** |
| Trips per Week (Same) | Decrease | 0.876 *** | 0.730 *** | 1.000 *** | 0.908 *** | 0.895 ** |
| Increase | 1.581 *** | 1.527 *** | 1.874 *** | 1.205 *** | 1.733 *** | |
| Trip Duration (min) (≤15) | 16–30 | −0.438 *** | −0.388 ** | −0.419 ** | −0.372 ** | 0.845 ** |
| 31–60 | −1.054 *** | −1.146 *** | −1.023 *** | −1.398 *** | ||
| >60 | −1.326 *** | −0.803 ** | −1.315 *** | −1.862 *** | −1.429 *** |
* p < 0.100; ** p < 0.050; *** p < 0.001.
Disclaimer/Publisher’s Note: The statements, opinions and data contained in all publications are solely those of the individual author(s) and contributor(s) and not of MDPI and/or the editor(s). MDPI and/or the editor(s) disclaim responsibility for any injury to people or property resulting from any ideas, methods, instructions or products referred to in the content. |
© 2023 by the authors. Licensee MDPI, Basel, Switzerland. This article is an open access article distributed under the terms and conditions of the Creative Commons Attribution (CC BY) license (https://creativecommons.org/licenses/by/4.0/).
Share and Cite
MDPI and ACS Style
Al-Akioui, A.; Monzon, A. Spatial Analysis of COVID-19 Pandemic Impacts on Mobility in Madrid Region. Sustainability 2023, 15, 14259. https://doi.org/10.3390/su151914259
AMA Style
Al-Akioui A, Monzon A. Spatial Analysis of COVID-19 Pandemic Impacts on Mobility in Madrid Region. Sustainability. 2023; 15(19):14259. https://doi.org/10.3390/su151914259
Chicago/Turabian StyleAl-Akioui, Abid, and Andres Monzon. 2023. "Spatial Analysis of COVID-19 Pandemic Impacts on Mobility in Madrid Region" Sustainability 15, no. 19: 14259. https://doi.org/10.3390/su151914259
Note that from the first issue of 2016, this journal uses article numbers instead of page numbers. See further details here.