

Static and Dynamic Load Transfer Behaviors of the Composite Foundation Reinforced by the Geosynthetic-Encased Stone Column

1
CSCEC Road and Bridge Group Co., Ltd., Shijiazhuang 050001, China
2
Ningxia Institute of Water Resources Research, Yinchuan 750021, China
3
School of Civil Engineering, Southwest Jiaotong University, Chengdu 610031, China
*
Author to whom correspondence should be addressed.
Sustainability 2023, 15(2), 1108; https://doi.org/10.3390/su15021108
Submission received: 2 December 2022
/
Revised: 31 December 2022
/
Accepted: 1 January 2023
/
Published: 6 January 2023
(This article belongs to the Special Issue Enhancing Subgrade Stability in Complex Environment for Sustainable Road)
Abstract
:An accurate description of the load transfer behaviors of the geosynthetic-encased stone column (GESC) is of great importance for revealing the bearing capacity of GESC. Static load tests and shake table model tests were performed to characterize the static and dynamic load transfer behaviors of the composite foundation reinforced by the GESC. Under static loading, static load tests were conducted on a fully geosynthetic-encased stone column (FGESC), partially geosynthetic-encased stone column (PGESC) and traditional stone column (TSC). The influence of length and stiffness of the encasement on the stone columns were investigated. Under seismic loading, the shake table model tests were performed to analyze the differences of the dynamic pile-soil stress responses between the composite foundations with the GESC and the TSC. The results show that the static pile-soil stress ratios of the composite foundation with the FGESC are about three to six times of those of the composite foundation with the TSC, and the difference increases with the increase in the stiffness or length of the encasement. The static vertical stress of 60% acting on the pile top can be transferred to the pile bottom for the FGESC, while only 27~45% for the TSC. The dynamic pile-soil stress ratios of the GESC and the TSC first decrease and then increase slightly with the increase of the input peak acceleration. The dynamic pile-soil stress ratio of the GESC is about three times that of the TSC under seismic excitation with the same type and peak acceleration. The attenuation rate of dynamic stress along the pile body under dynamic loading is much faster than that under the static loading. Under the static and dynamic conditions, the load transfer capacity and pile efficacy of the GESC are always better than those of the TSC.
1. Introduction
Soft soil is characterized by a high water content, large void ratio, high compressibility, low shear strength, and is widely distributed in coastal and inland areas of China. When soft soil is used for the foundation of structures, foundation reinforcement is required, and stone column is a common foundation reinforcement technique [1,2,3]. However, when the strength of the surrounding soil is low, the stone column is prone to lead to failure of the composite foundation due to excessive deformation [4]. Engineering practice has proved that if the undrained shear strength of foundation soil is less than 20 kPa, the suitability of the stone column shall be checked. For this reason, Van Impe [5] put forward the method of making a sleeve of geomaterial and wrapping the stone column with this sleeve. In this way, the sleeve can provide radial restraint for loose gravel material, so as to control the swelling deformation of the stone column. This kind of pile is called a “geosynthetic-encased stone column (GESC)” in this paper.
In order to reveal the bearing characteristics of the GESC, many scholars have studied the bearing capacity and deformation of single pile [6,7,8,9]. Murugesan and Rajagopal [10] conducted an experimental study of single and group pile models for reinforcing saturated soft clay foundations with the GESC. It is found that the sleeve can effectively improve the bearing capacity of the stone column and control pile deformation, and the ultimate bearing capacity of the GESC is about four times more than that of the stone column. Gniel and Bouazza [2] carried out a series of small-scale model tests on the GESC. They found that the swelling deformation of pile mainly occurred under partially wrapped sleeves, and the pile deformation is at a minimum when the sleeve length is consistent with the pile length. Lo et al. [11] found that the bearing capacity of end-bearing GESC (end-bearing pile) is improved when the sleeve’s stiffness increases. When the stiffness of the GESC is larger, the pile swelling deformation is more uniform and the swelling amount is smaller, and the settlement is also smaller [12]. However, the above researches are generally aimed at composite foundations reinforced by the GESC without a cushion. The cushion can regulate the pile-soil deformation and help the pile and soil to work together. Moreover, there is also a lack of research on the effect of different geotextile tensile strengths on the load transfer characteristics of the GESC.
For composite foundations reinforced by the GESC, some scholars carried out research on pile-soil stress ratio and end-bearing influence characteristics [13,14]. Ouyang et al. [15] investigated the pile-soil stress sharing ratio, and the pile stress transfer law of composite foundations with the GESC. Almeida et al. [16,17] conducted in situ tests and numerical simulations to study the stress concentration, pile deformation, and excess pore water pressure in soft soil, and the soil settlement characteristics of the GESC under embankment loading. They found that the pile-soil stress ratio gradually increased with the development of foundation consolidation. Fattah et al. [18] compared the bearing capacity of the GESC and the stone column under embankment load, as well as the pile-soil stress ratio and settlement law when the foundation was damaged through model testing. The shaking table model test can reproduce the actual seismic responses of acceleration, stress and strain in composite foundations during earthquake, which is one of the reliable means to study the ground motion response of a geotechnical structure [19,20]. There is little research on the response characteristics of composite foundations with the GESC under earthquake conditions, and there is no shaking table model for a reference. Tang et al. [21] pointed out that the wrapped stone column can effectively strengthen the saturated sandy soil foundation and improve the liquefaction resistance of the saturated sandy soil foundation. In addition to the research results of our research group [22], there is no other research on sandy soil foundations reinforced by the GESC under earthquake conditions. The literature [22] is mainly about the difference in acceleration response between the GESC and the TSC, and does not involve dynamic load transfer behavior. The load transfer behaviors of the GESC under both static and dynamic conditions are not thoroughly understood [23].
Although some scholars have carried out research on the GESC, they mainly focus on the study of the bearing capacity of composite foundations reinforced by the GESC, including pile-soil stress sharing, etc. However, the static and dynamic load transfer behaviors of composite foundations with the GESC are less explored. In this paper, the pile-soil stress transfer characteristics, pile axial force transfer law, and radial restraint effect of pile perimeter soil of composite foundations reinforced by the GESC with different stiffnesses and lengths of encasements were investigated through a series of static load tests. Based on these tests, the response characteristics of dynamic axial stress, dynamic pile-soil stress ratio and horizontal shear stress of composite foundations with the FGESC and the TSC were investigated via shaking table model tests. The research results can provide a reference for understanding the bearing mechanism of the GESC.
2. Static Load Test Design of a Composite Foundation Reinforced by the GESC
2.1. Preparation of Test Model
Based on a foundation treatment project with the GESC in Ningbo, China, a model test study was conducted via model similitude ratio design. In the actual project, the diameter of the GESC was 1 m, and the pile length–diameter ratio was 6.5. The internal dimension of the model box was 100 cm × 100 cm × 90 cm (long × wide × high). Considering the size of the model box and the characteristics of the GESC, the similitude ratio (prototype/model) of the length was determined to be 10 in the model test. Since the experiment was conducted in a conventional gravity environment, the gravity similitude ratio was determined as 1. Considering that soft clay in actual engineering exhibits strong nonlinearity in the process of loading, it is difficult to find a similitude material to simulate soft clay, so the density similitude ratio was determined as 1. According to the Buckingham π theorem, the similitude ratios of stress, tensile strength and force can be calculated as 10, 100, 1000, respectively. The diameter and pile length of the GESC in the model test were determined as 10 cm and 65 cm, respectively, in the experiment. The pile length–diameter ratio was also 6.5. The distribution of the piles was in the form of equilateral triangles with an area replacement rate of 16%. The diameter of the bearing plate was determined as 25 cm according to the affected area of single pile. The similar ratio of tensile force and tensile strength of the sleeve was determined as 1000 and 100.
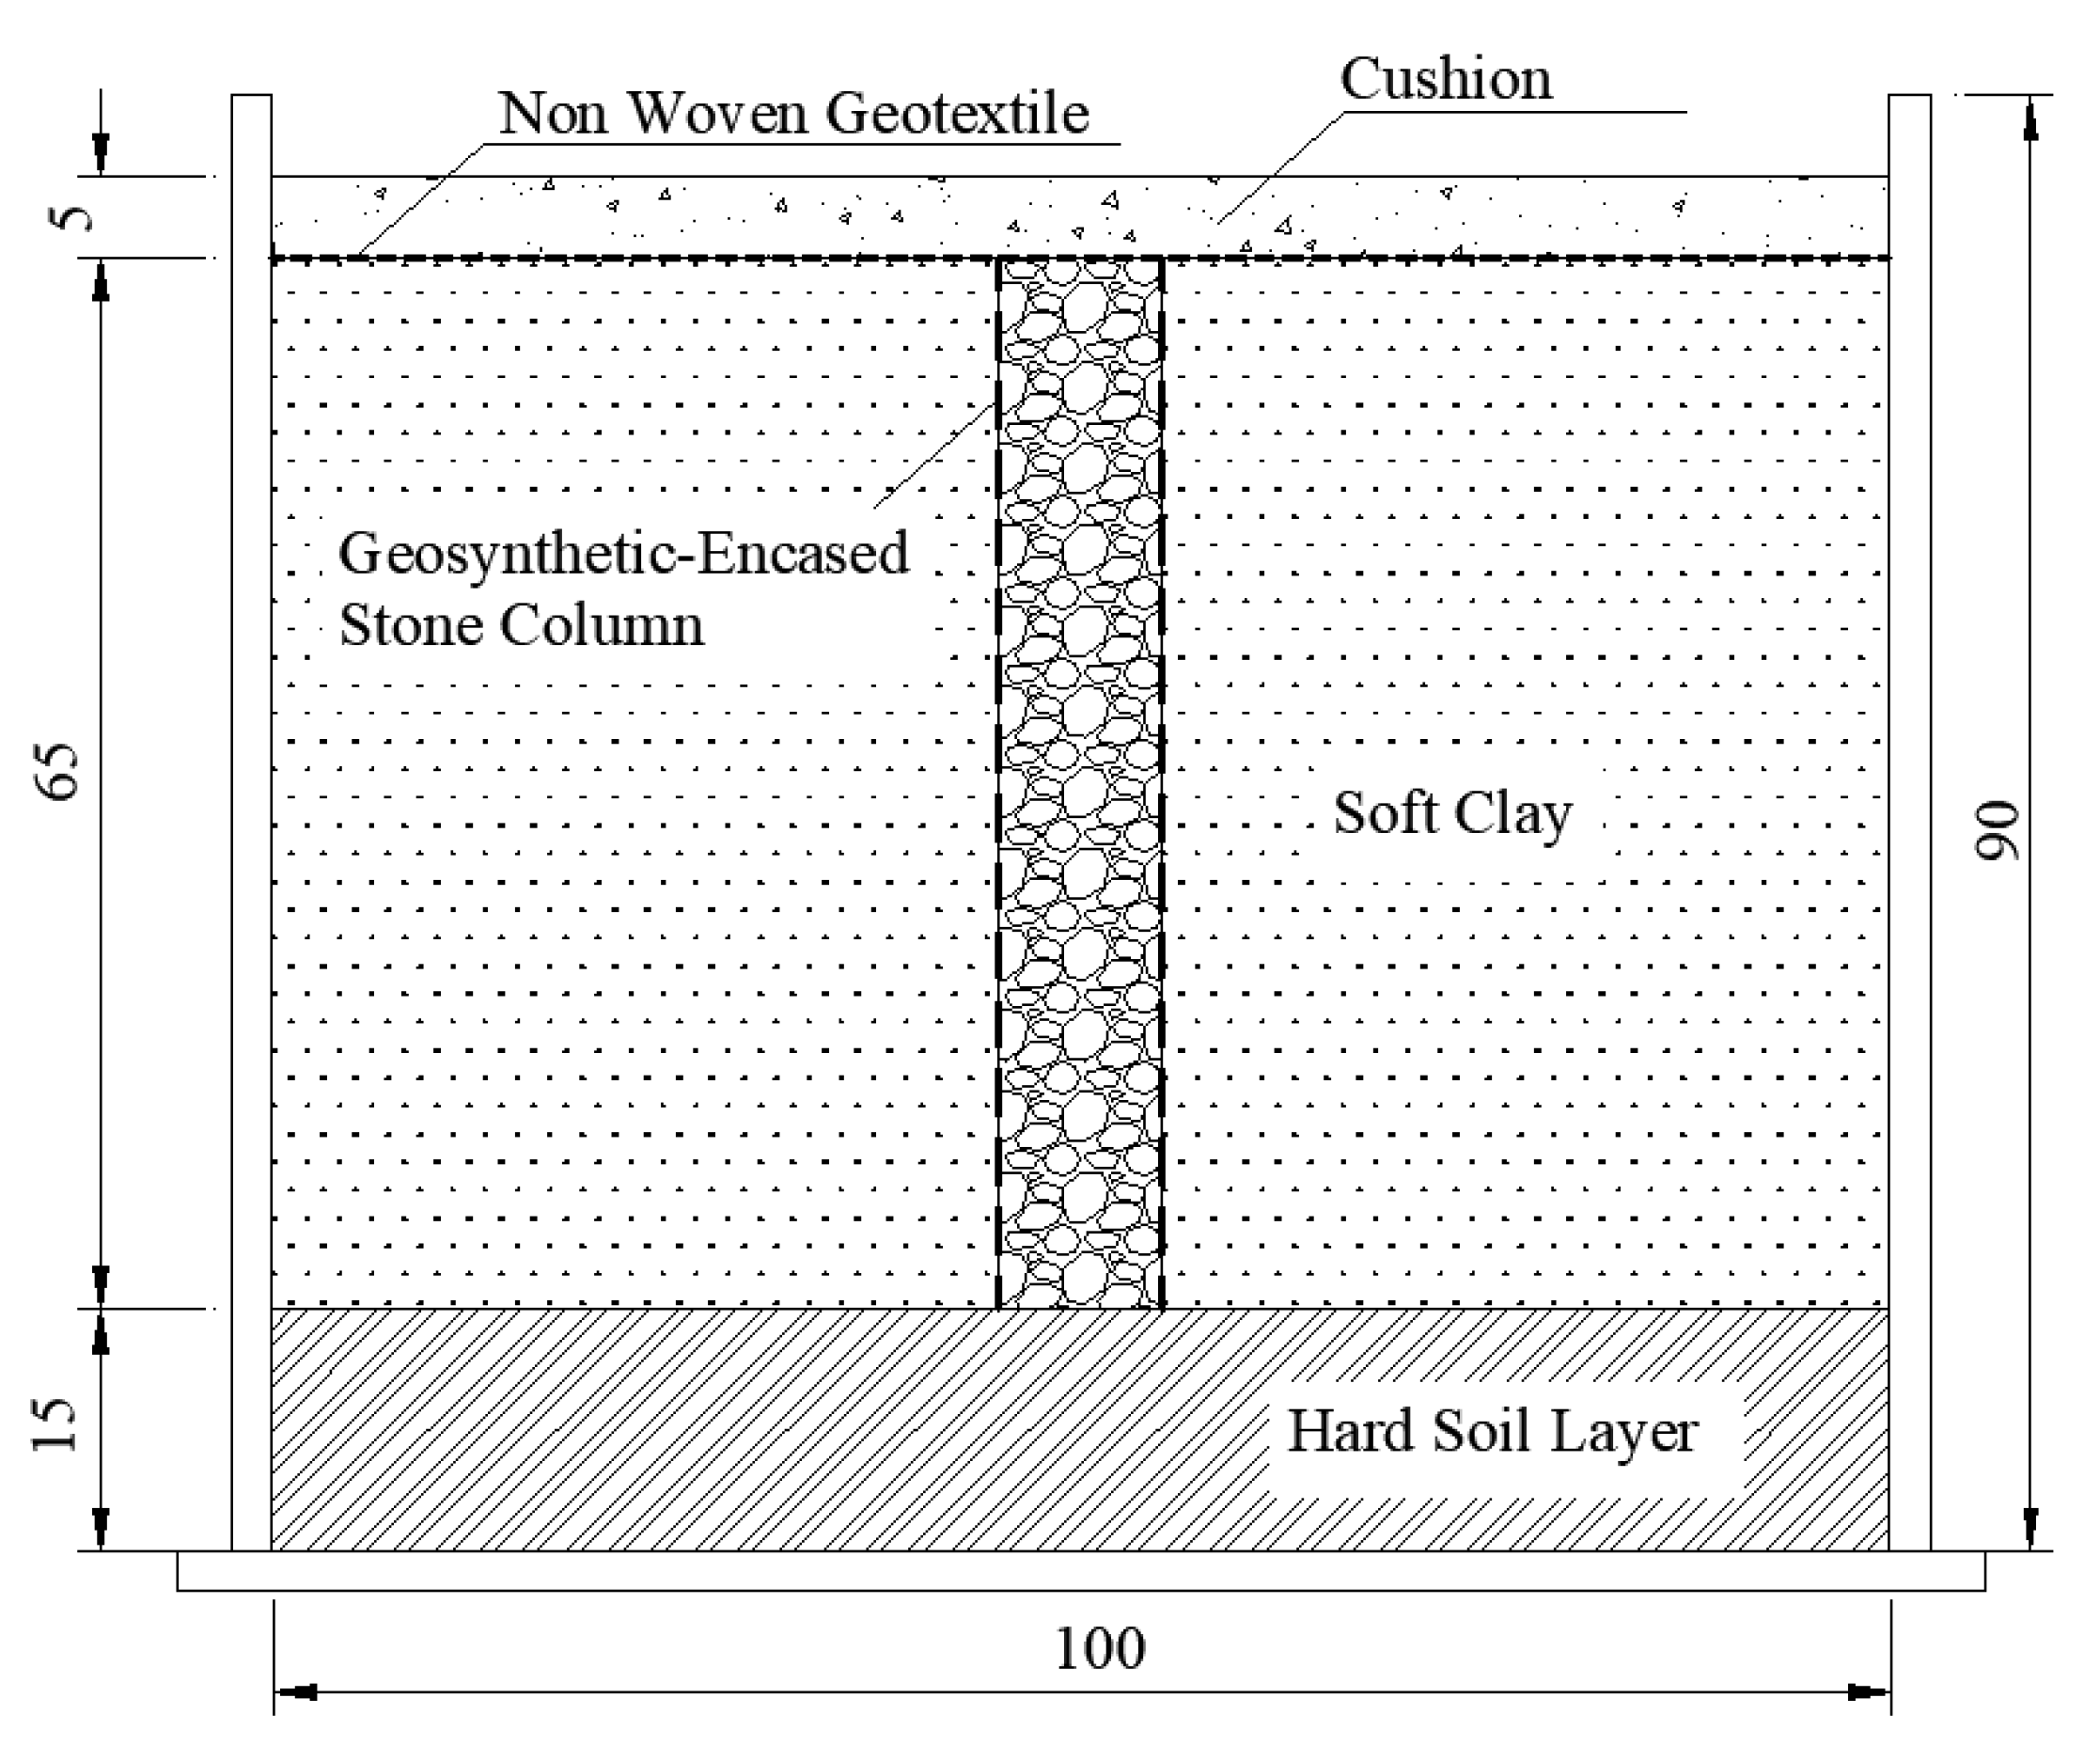
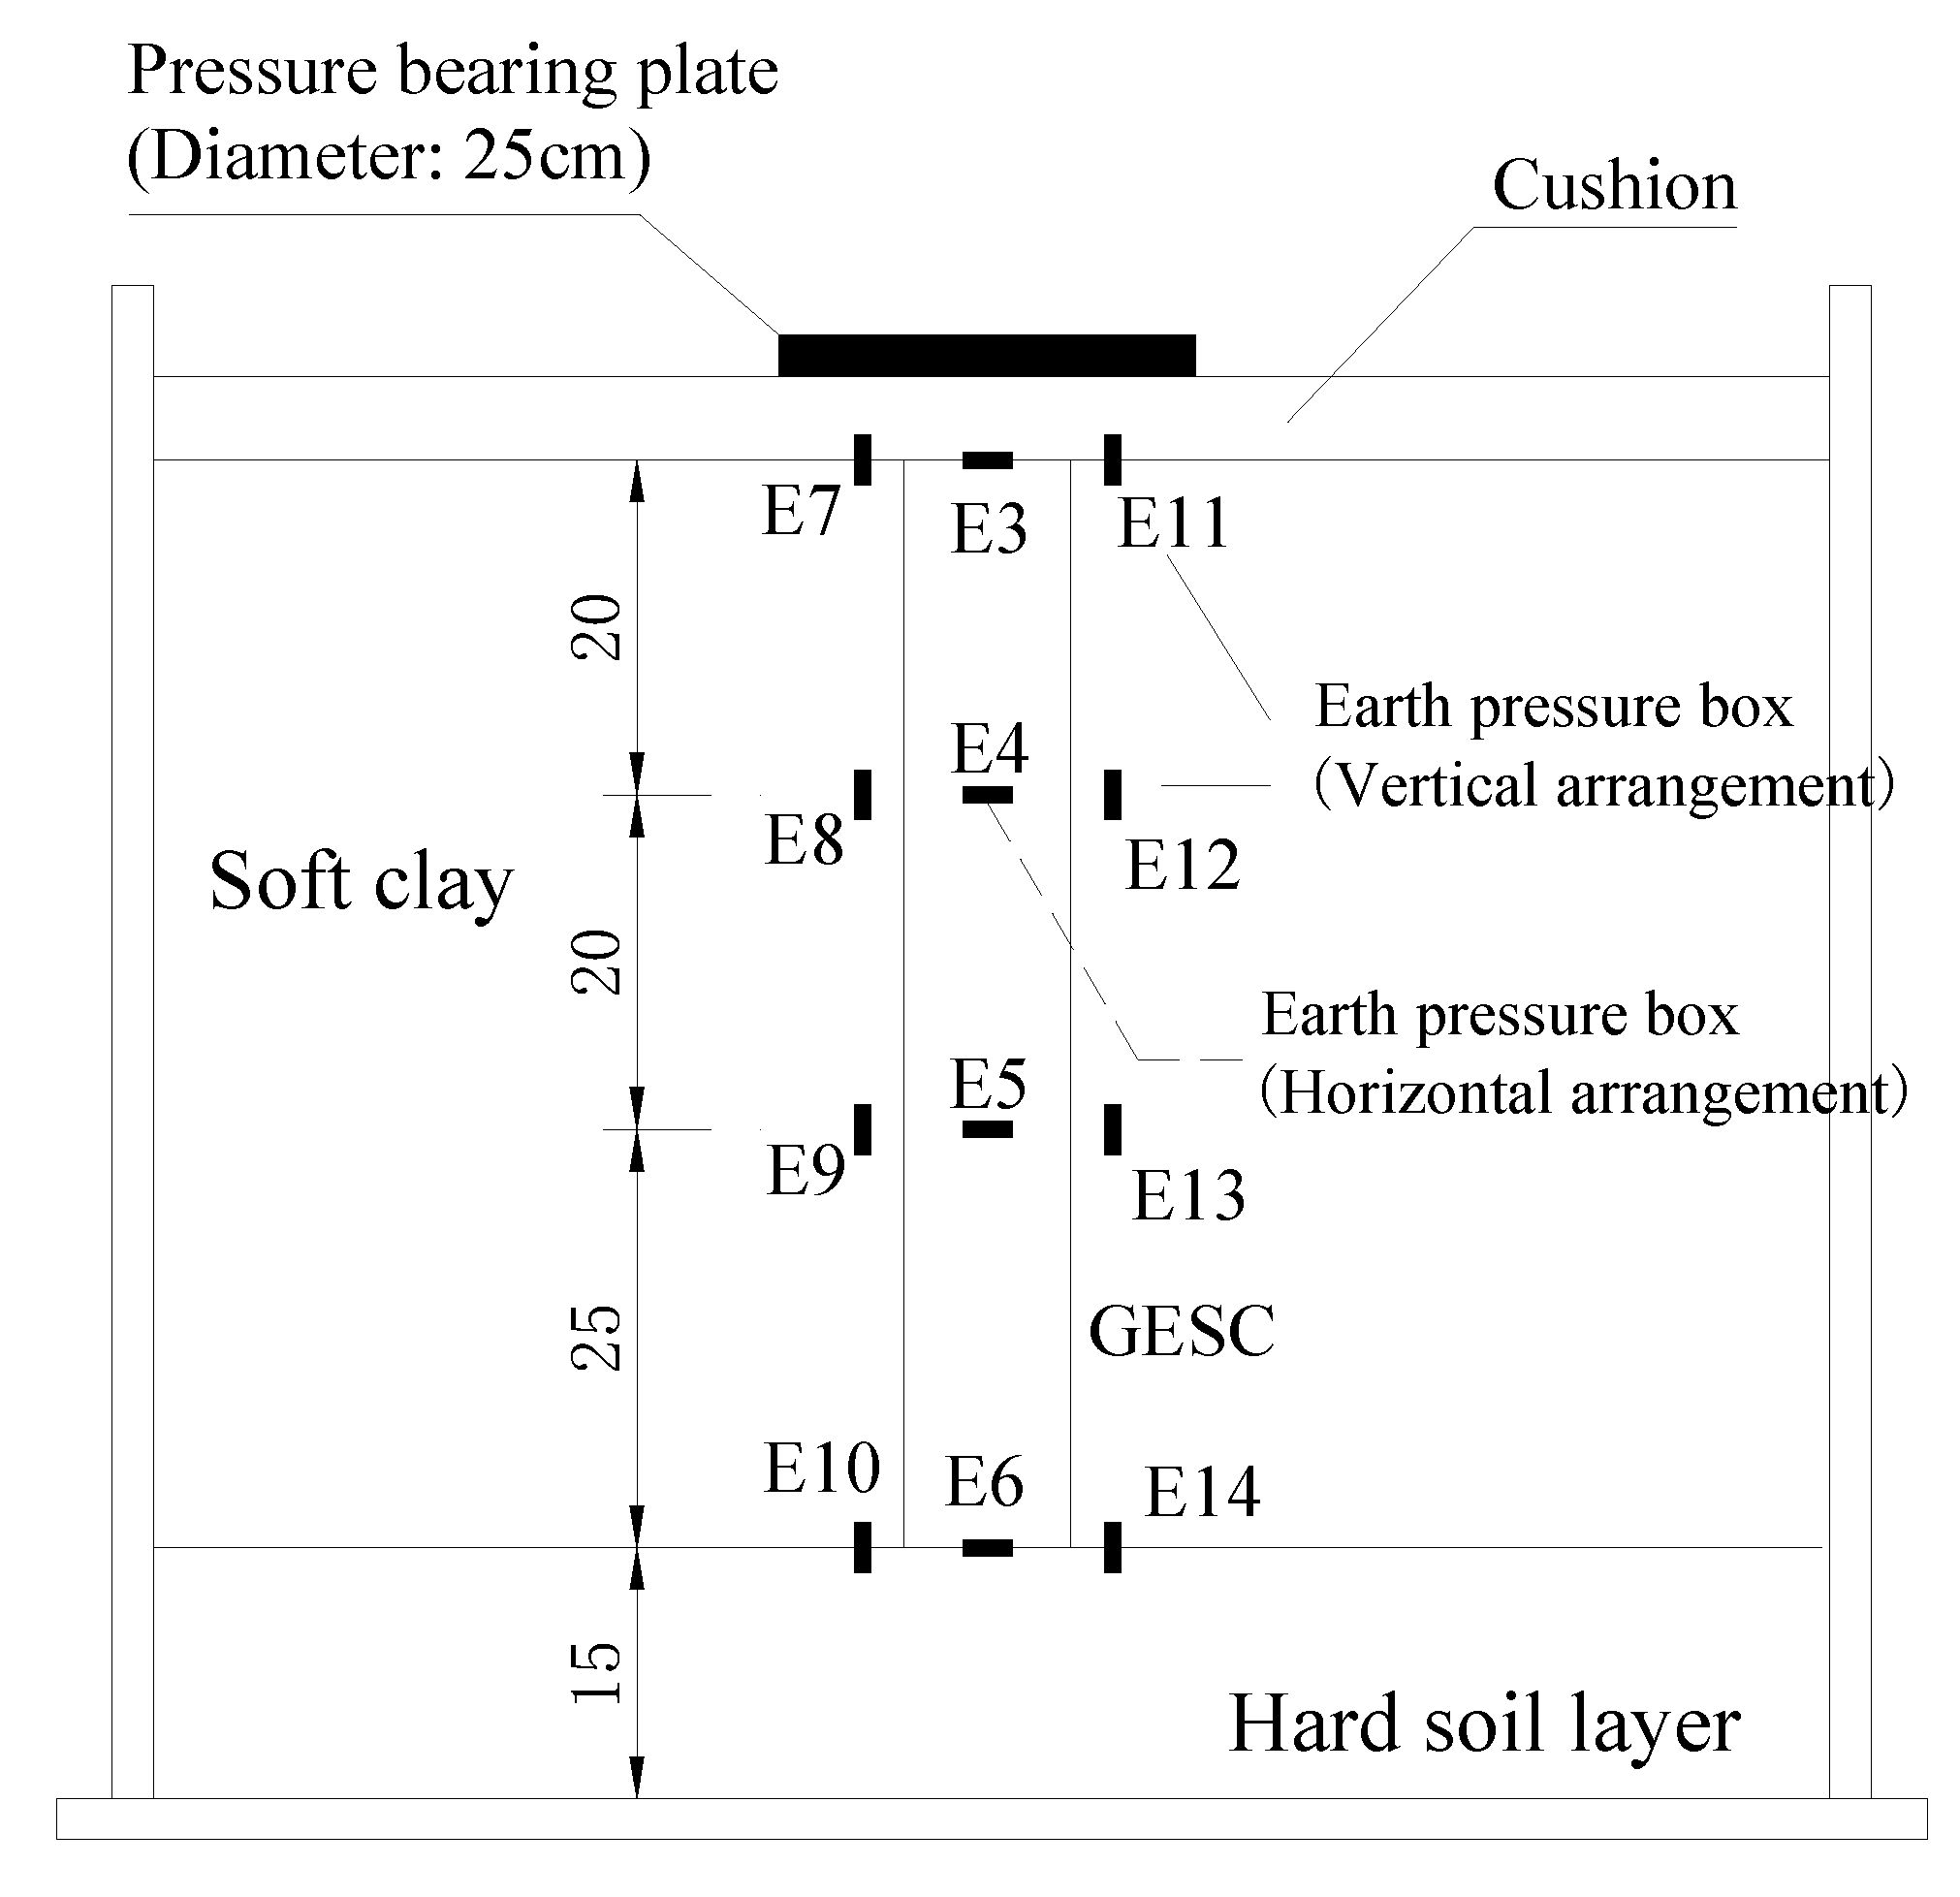
The overall arrangement of the indoor static load test of the composite foundation reinforced by the GESC is shown in Figure 1. The soil layers in the model box from bottom to top were hard soil and soft clay, with a thickness of 15 cm and 65 cm, respectively. Considering the high water content of soft clay, the model box was treated with water protection and rust prevention. According to the actual project design, the pile body adopted the form of an end bearing pile; that is, the pile end was directly fixed to the hard soil layer, and the pile length was taken as 65 cm. The thickness of the hard soil layer was 15 cm, the density was 1920 kg/m3, the water content was 31%, the cohesion was 40 kPa, and the internal friction angle was 36°. The Q235 steel pipe with a wall thickness of 2 mm was used to form the GESC(PGESC). Firstly, the steel pipe was fixed on a hard soil layer, and the fiberglass sleeve was pre-arranged outside the steel pipe. Secondly, the soft clay was filled in the model box while the stone column was made. In total 0.4 kg of crushed stone was poured into the steel pipe each time. Then, we slowly pulled the steel pipe up by 2 cm, while vibrating the crushed stone, and keeping the sleeve in the same position. Finally, the earth pressure box was installed in the pile to monitor the stress value.
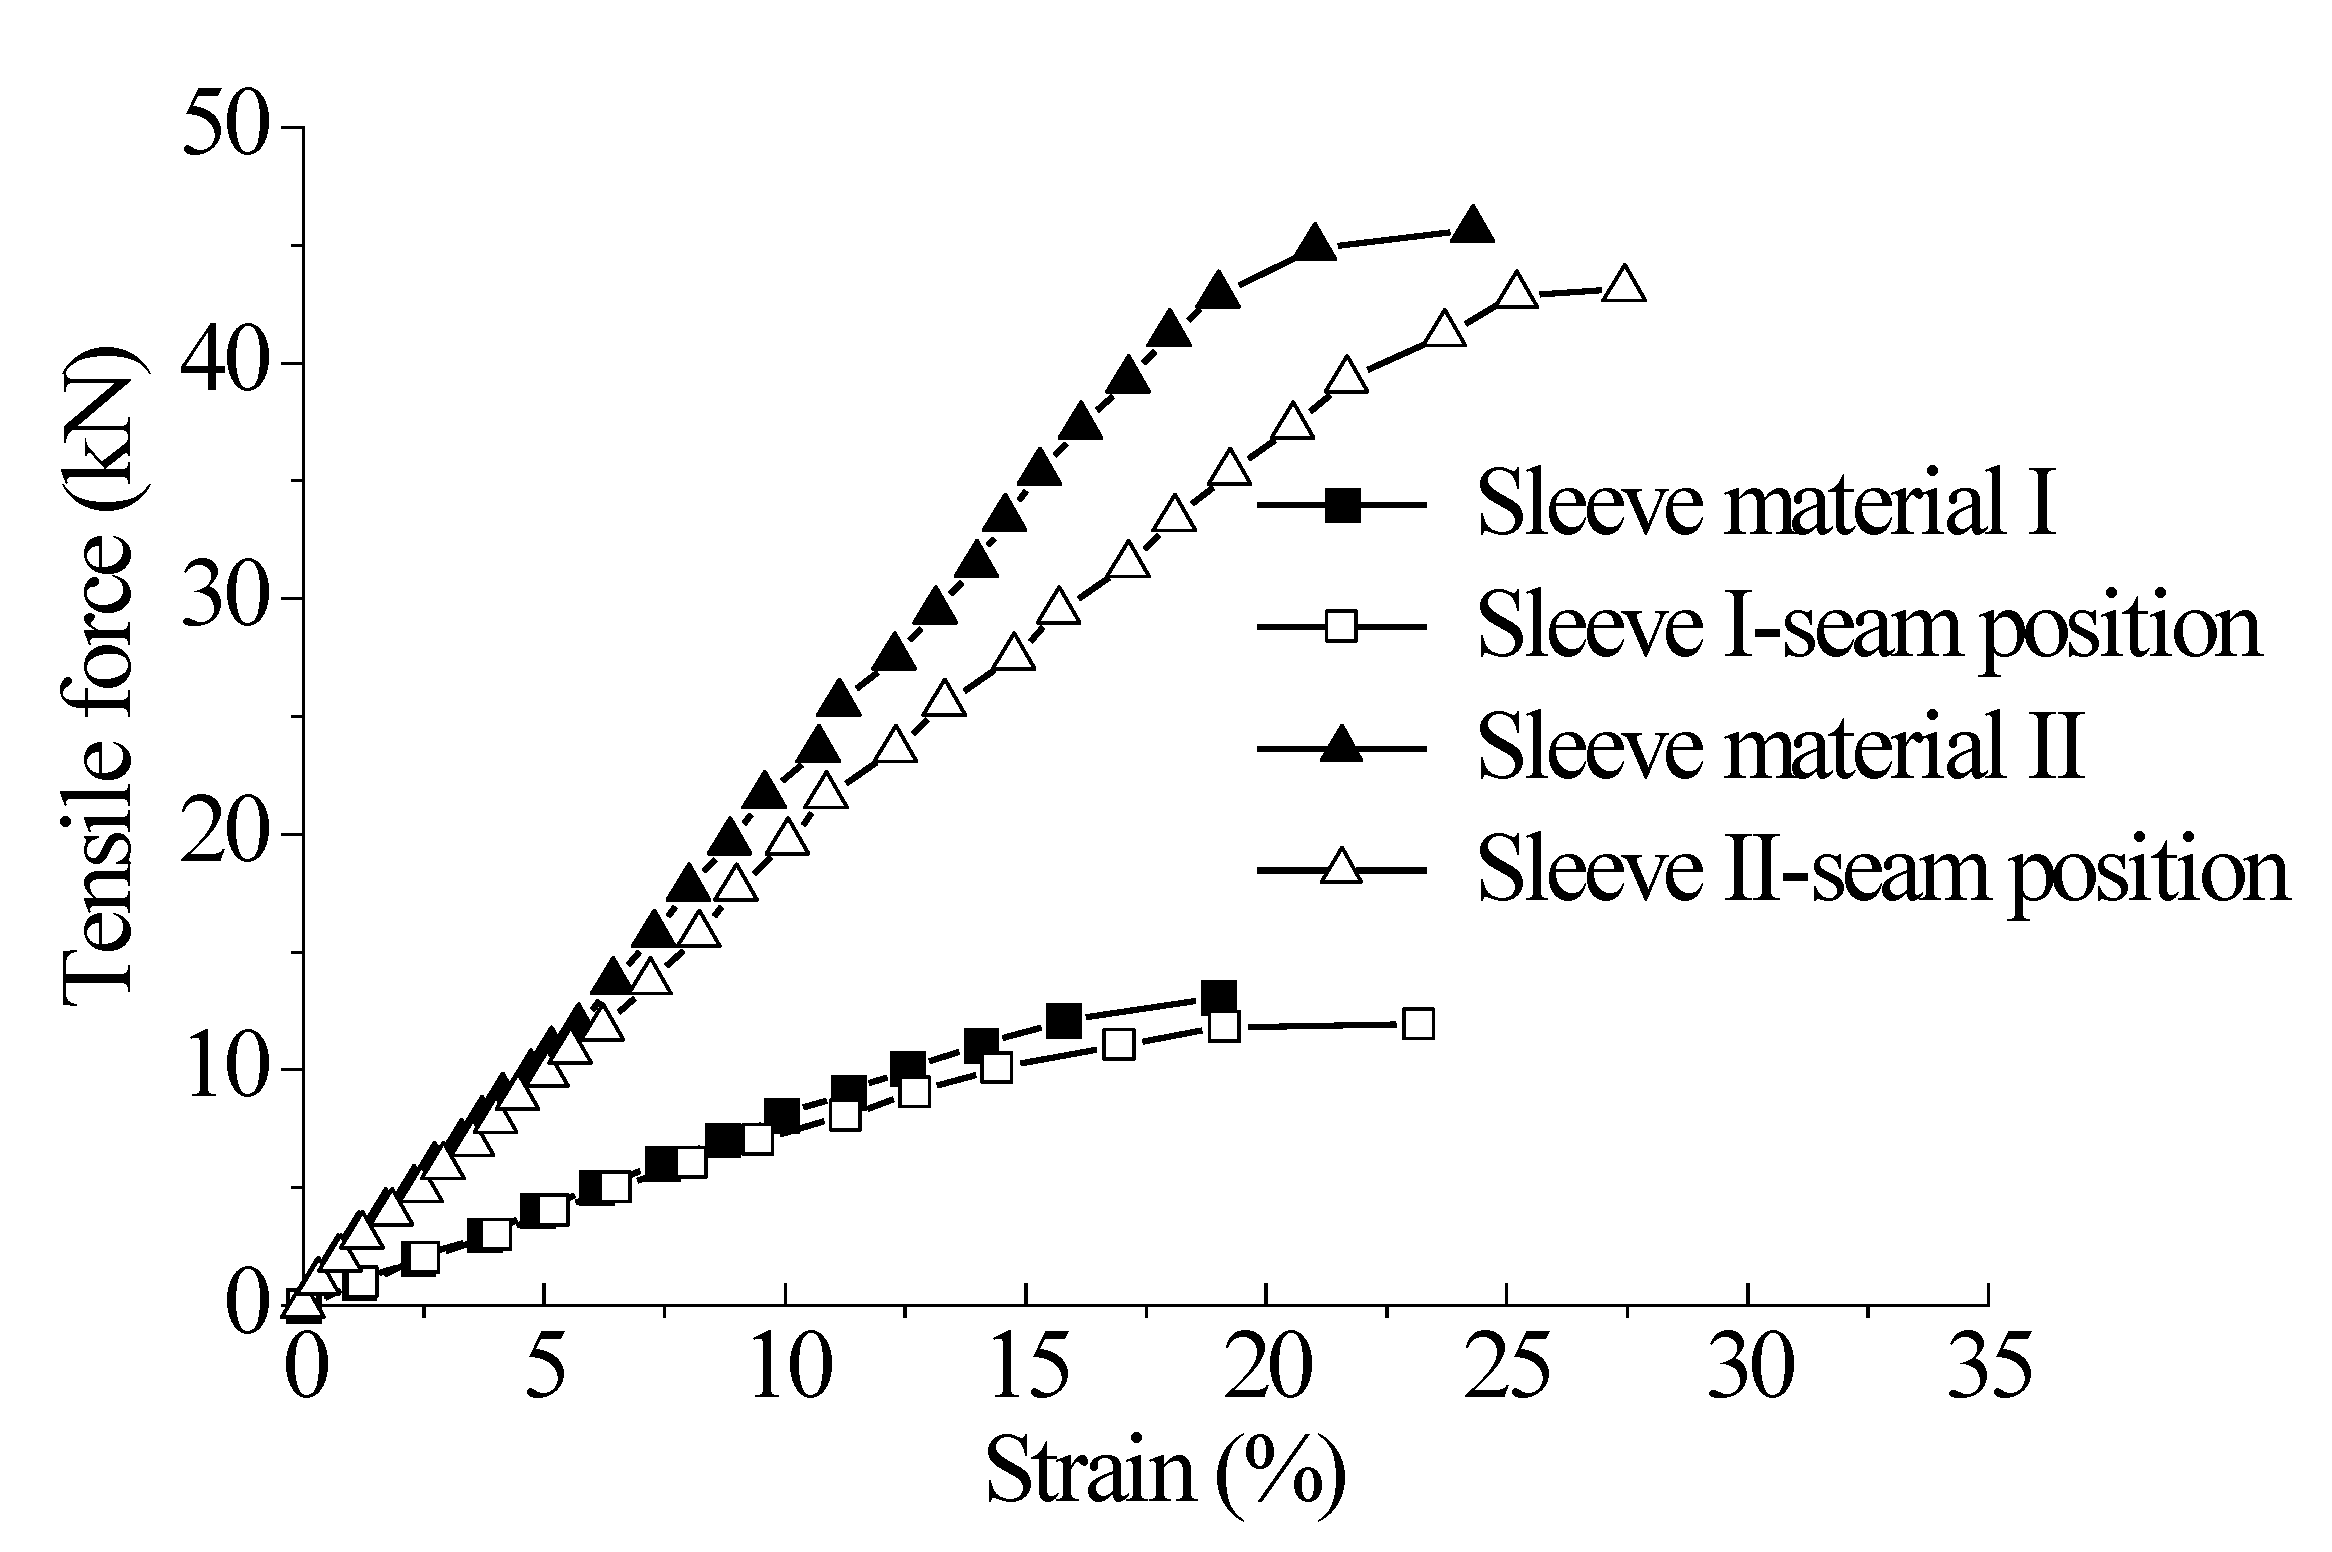
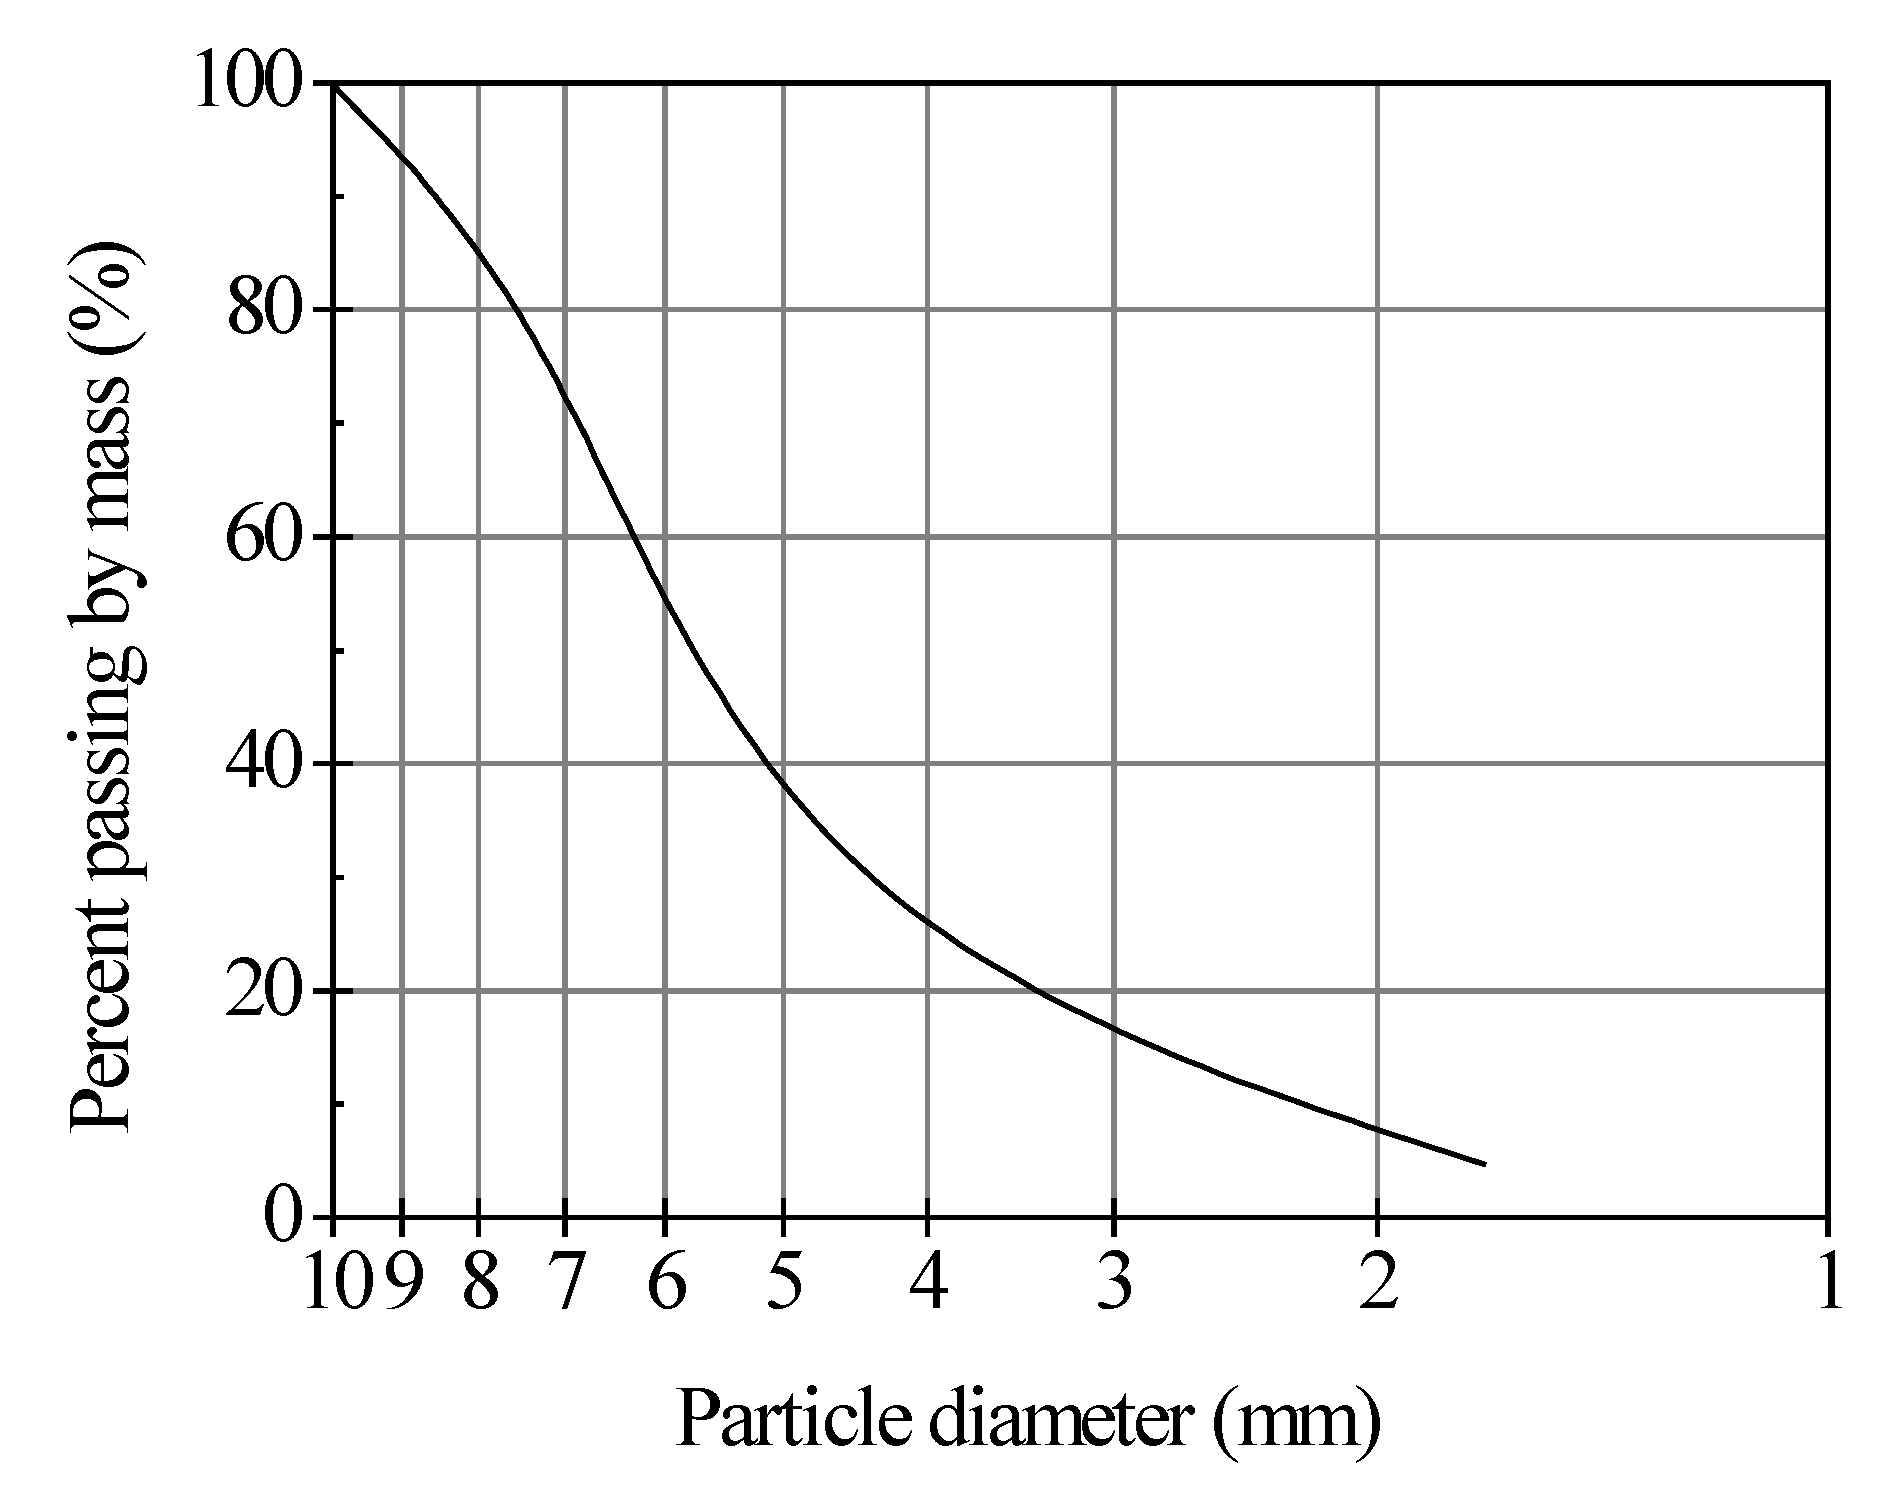
Considering the tensile strength and mesh size of the sleeve material, two kinds of glass fiber mesh simulation sleeves were selected, and their tensile strengths were, respectively, 11 kN/m and 43 kN/m. The grid size of both materials was 2 mm × 2 mm. The glass fiber was stitched into a sleeve shape, where the suture line was similar to the glass fiber material. The tensile strength tests were conducted on both sleeves and their joints, and the tensile–strain curves were obtained, as shown in Figure 2. The secant modulus of sleeve I and sleeve II were 95 kN/m2 and 200 kN/m2, respectively, when the strain was 5%. Their joint strength was close to the sleeve strength. It is difficult to find suitable materials to simulate soft clay on the premise of the following similar ratio, and the muddy, soft soil excavated from a seashore in Ningbo, China exhibits great nonlinearity. Therefore, the undisturbed soil excavated on site was directly used as the test soil. The total thickness of soft clay in the model was 65 cm, and each layer was filled by 10 cm. The first 6 layers were 10 cm, and the last layer was 5 cm. The weight of the soft clay per cm thickness in the model box was controlled to be 17.2 kg during filling. The density of the stone column was 1565 kg/m3. The gravel grading curve inside the pile is shown in Figure 3. The particle size was 1.7~10 mm, and the non-uniformity coefficient and curvature coefficient were 2.60 and 1.86, respectively. According to the specification in the “Standard for the engineering classification of soil” (GB/T 50145-2007) in China, the soil with a nonuniform coefficient less than 5 is regarded as homogeneous; that is, poorly graded. Therefore, the gravel particles were uniform and poorly graded [24].
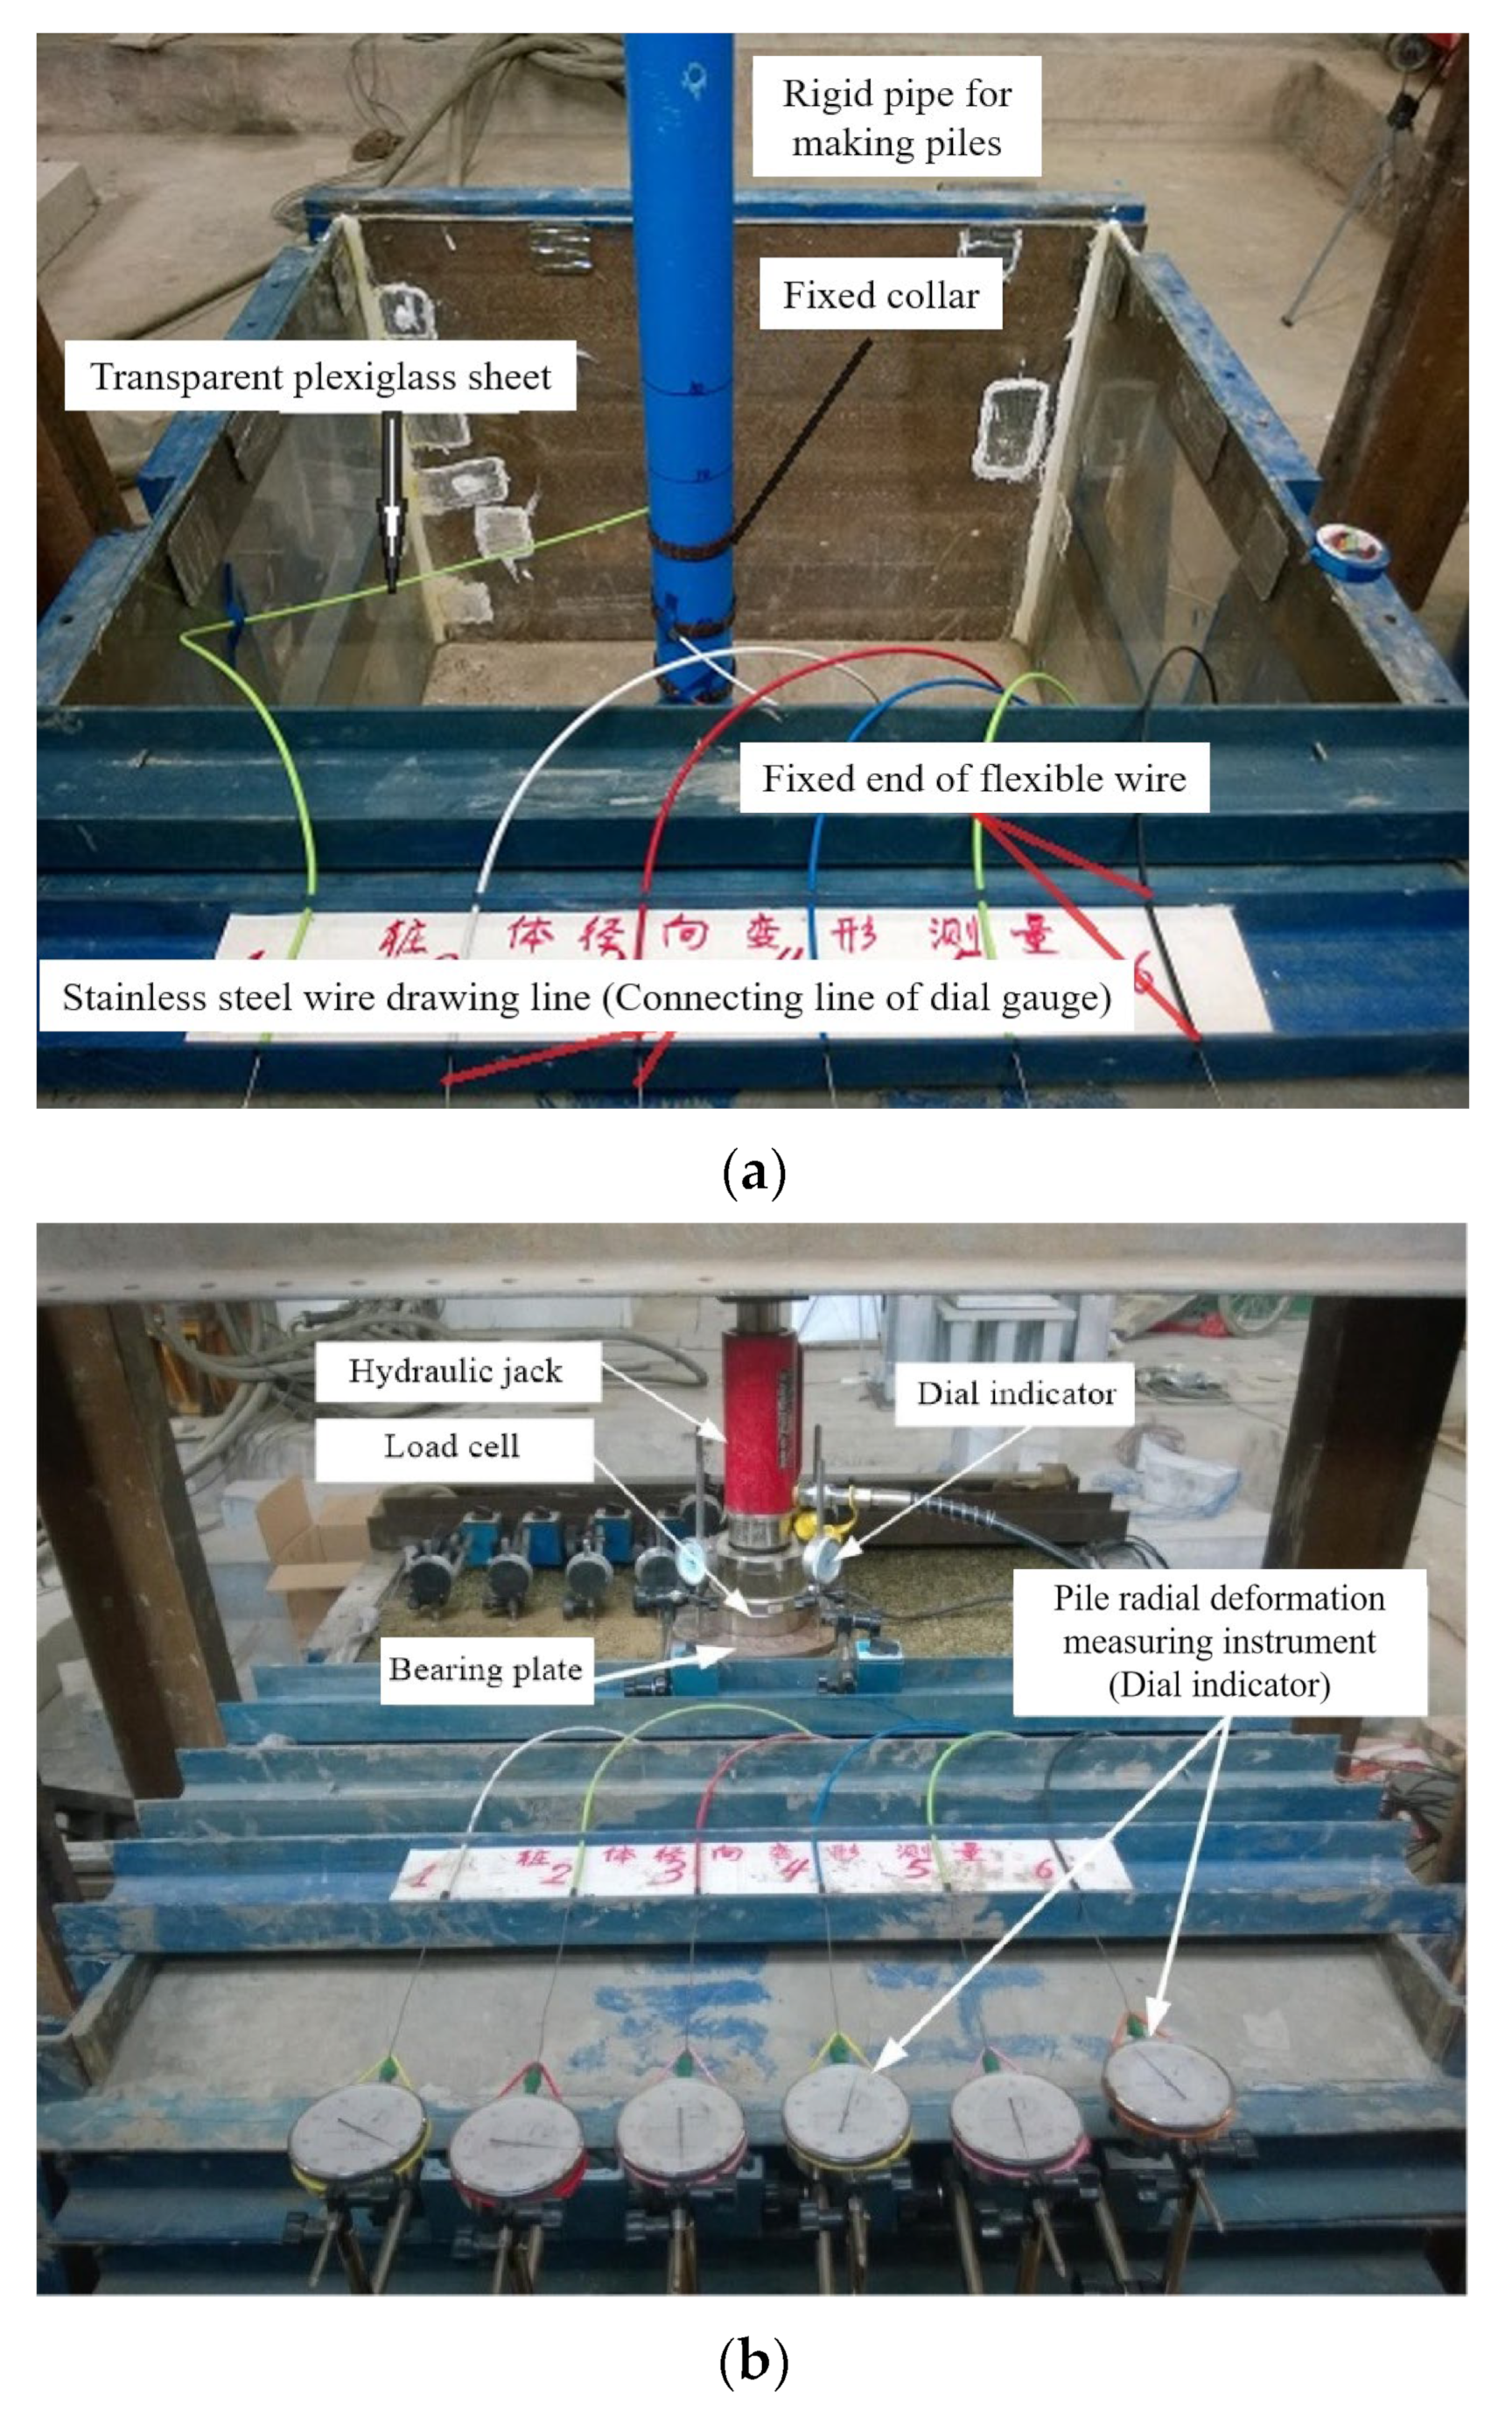
After the completion of the soft clay and pile body, the foundation surface was levelled and a layer of low strength non-woven geotextile was laid on top. Then, we lay 5 cm of thick small gravel onto the non-woven geotextile to form a cushion layer. The cushion layer was made up of gravel with a diameter of 0.2–1.0 cm, and the thickness of the cushion layer was 5 cm. Its elastic modulus was 42 MPa, internal friction angle was 40°, and unit weight was 18 kN/m3. Here, the secant modulus of geotextile at 5% strain was 0.36 kN/m2, the tensile strength was 1.6 kN/m, and the corresponding strain was 110%. The geotextile has no reinforcement effect and is only used to prevent the upper cushion material from squeezing into the lower soil mass. After the composite foundation model was made, it was first pre-pressurized by stacking for 24 h. After that, we let it stand for 24 h to eliminate any disturbance. Some soft clay samples were taken near the model box and indoor geotechnical tests were conducted to obtain the physical and mechanical parameters. The density of the soft clay was 1720 kg/m3, the moisture content was 45%, the cohesion was 3.4 kPa, and the internal friction angle was 3.5°. Finally, the bearing plate, load sensor, ball joint, and hydraulic jack were arranged on the model, in turn, as shown in Figure 4. A spherical hinge and hydraulic jacks were used to make the load a vertically concentrated force and to apply the vertical load step by step, respectively.
2.2. Sensor Arrangement
In order to monitor the settlement of the top surface of the foundation, four dial indicators were evenly arranged at the edge of the top surface of the bearing plate. The dial gauge range was 50 mm. In order to monitor the axial force of the pile, the earth pressure boxes A1~A4 were arranged at the depths of 0, 20, 40 and 65 cm from the pile top, as shown in Figure 5. To improve the monitoring accuracy of the earth pressure box: when burying the earth pressure box, we lay 2 cm of thick fine sand on the earth pressure box, and places a round rubber pad with the same diameter as the earth pressure box under the earth pressure box. In order to measure the vertical stress of the soil around the pile, earth pressure box B1 was arranged 2 cm away from the edge of the pile. In order to measure the horizontal earth pressure of the soil around the pile, earth pressure boxes C1~C4 were arranged a 2 cm distance from the outer edge of the pile on one side of the pile. The earth pressure boxes C1 to C4 were arranged at depths of 0, 20, 40 and 65 cm from the top of the pile. The earth pressure boxes (B1, C1~C4) buried in soft clay adopted a resistance strain type miniature earth pressure box. The external size was φ30 mm × 7 mm and the measuring range was 200 kPa. The earth pressure value in the pile body (A1~A4) was measured using a resistance strain type micro earth pressure box. The external size was φ70 mm × 10 mm and the measuring range was 800 kPa. In order to eliminate the problems of “stiffness matching” and “soil arching effect” of the earth pressure box, earth pressure boxes B1 and C1~C4 were calibrated with soft clay used in the test, and earth pressure boxes A1~A4 were calibrated with standard sand. After each group of model tests, we checked and corrected the change in the calibration coefficient of the earth pressure box.
2.3. Experimental Conditions
There were four groups of tests: the first group was a fully geosynthetic-encased stone column with a tensile strength of geotextile of 11 kN/m (FGESC-11); the second group was a fully geosynthetic-encased stone column with a tensile strength of geotextile of 43 kN/m (FGESC-43); the third group was a partially geosynthetic-encased stone column with a tensile strength of geotextile of 43 kN/m (PGESC-43); the last group was a traditional stone column (TSC). The sleeve length of the PGESC was 60% of the pile length (60%l for short). The parameters of the different groups are listed in Table 1.
3. Static Test Results and Discussion
3.1. Sharing Law of Pile-Soil Stress
The pile-soil stress ratio is often used to explain the sharing state of pile and soil on the action of the upper load in composite foundations [25]. In general, with the increase of the stiffness difference between the pile and soil, the stress in the composite foundation gradually concentrates to the pile, and the pile-soil stress ratio of the composite foundation increases [26]. The vertical stress Pt on the pile and the vertical stress Ps on the soil can be measured from the earth pressure box placed on the top of the pile and the surface of the foundation. Therefore, the pile-soil stress ratio is n = Pt/Ps. Since the upper load is shared by the pile and soil, Equation (1) can be obtained according to the force balance:
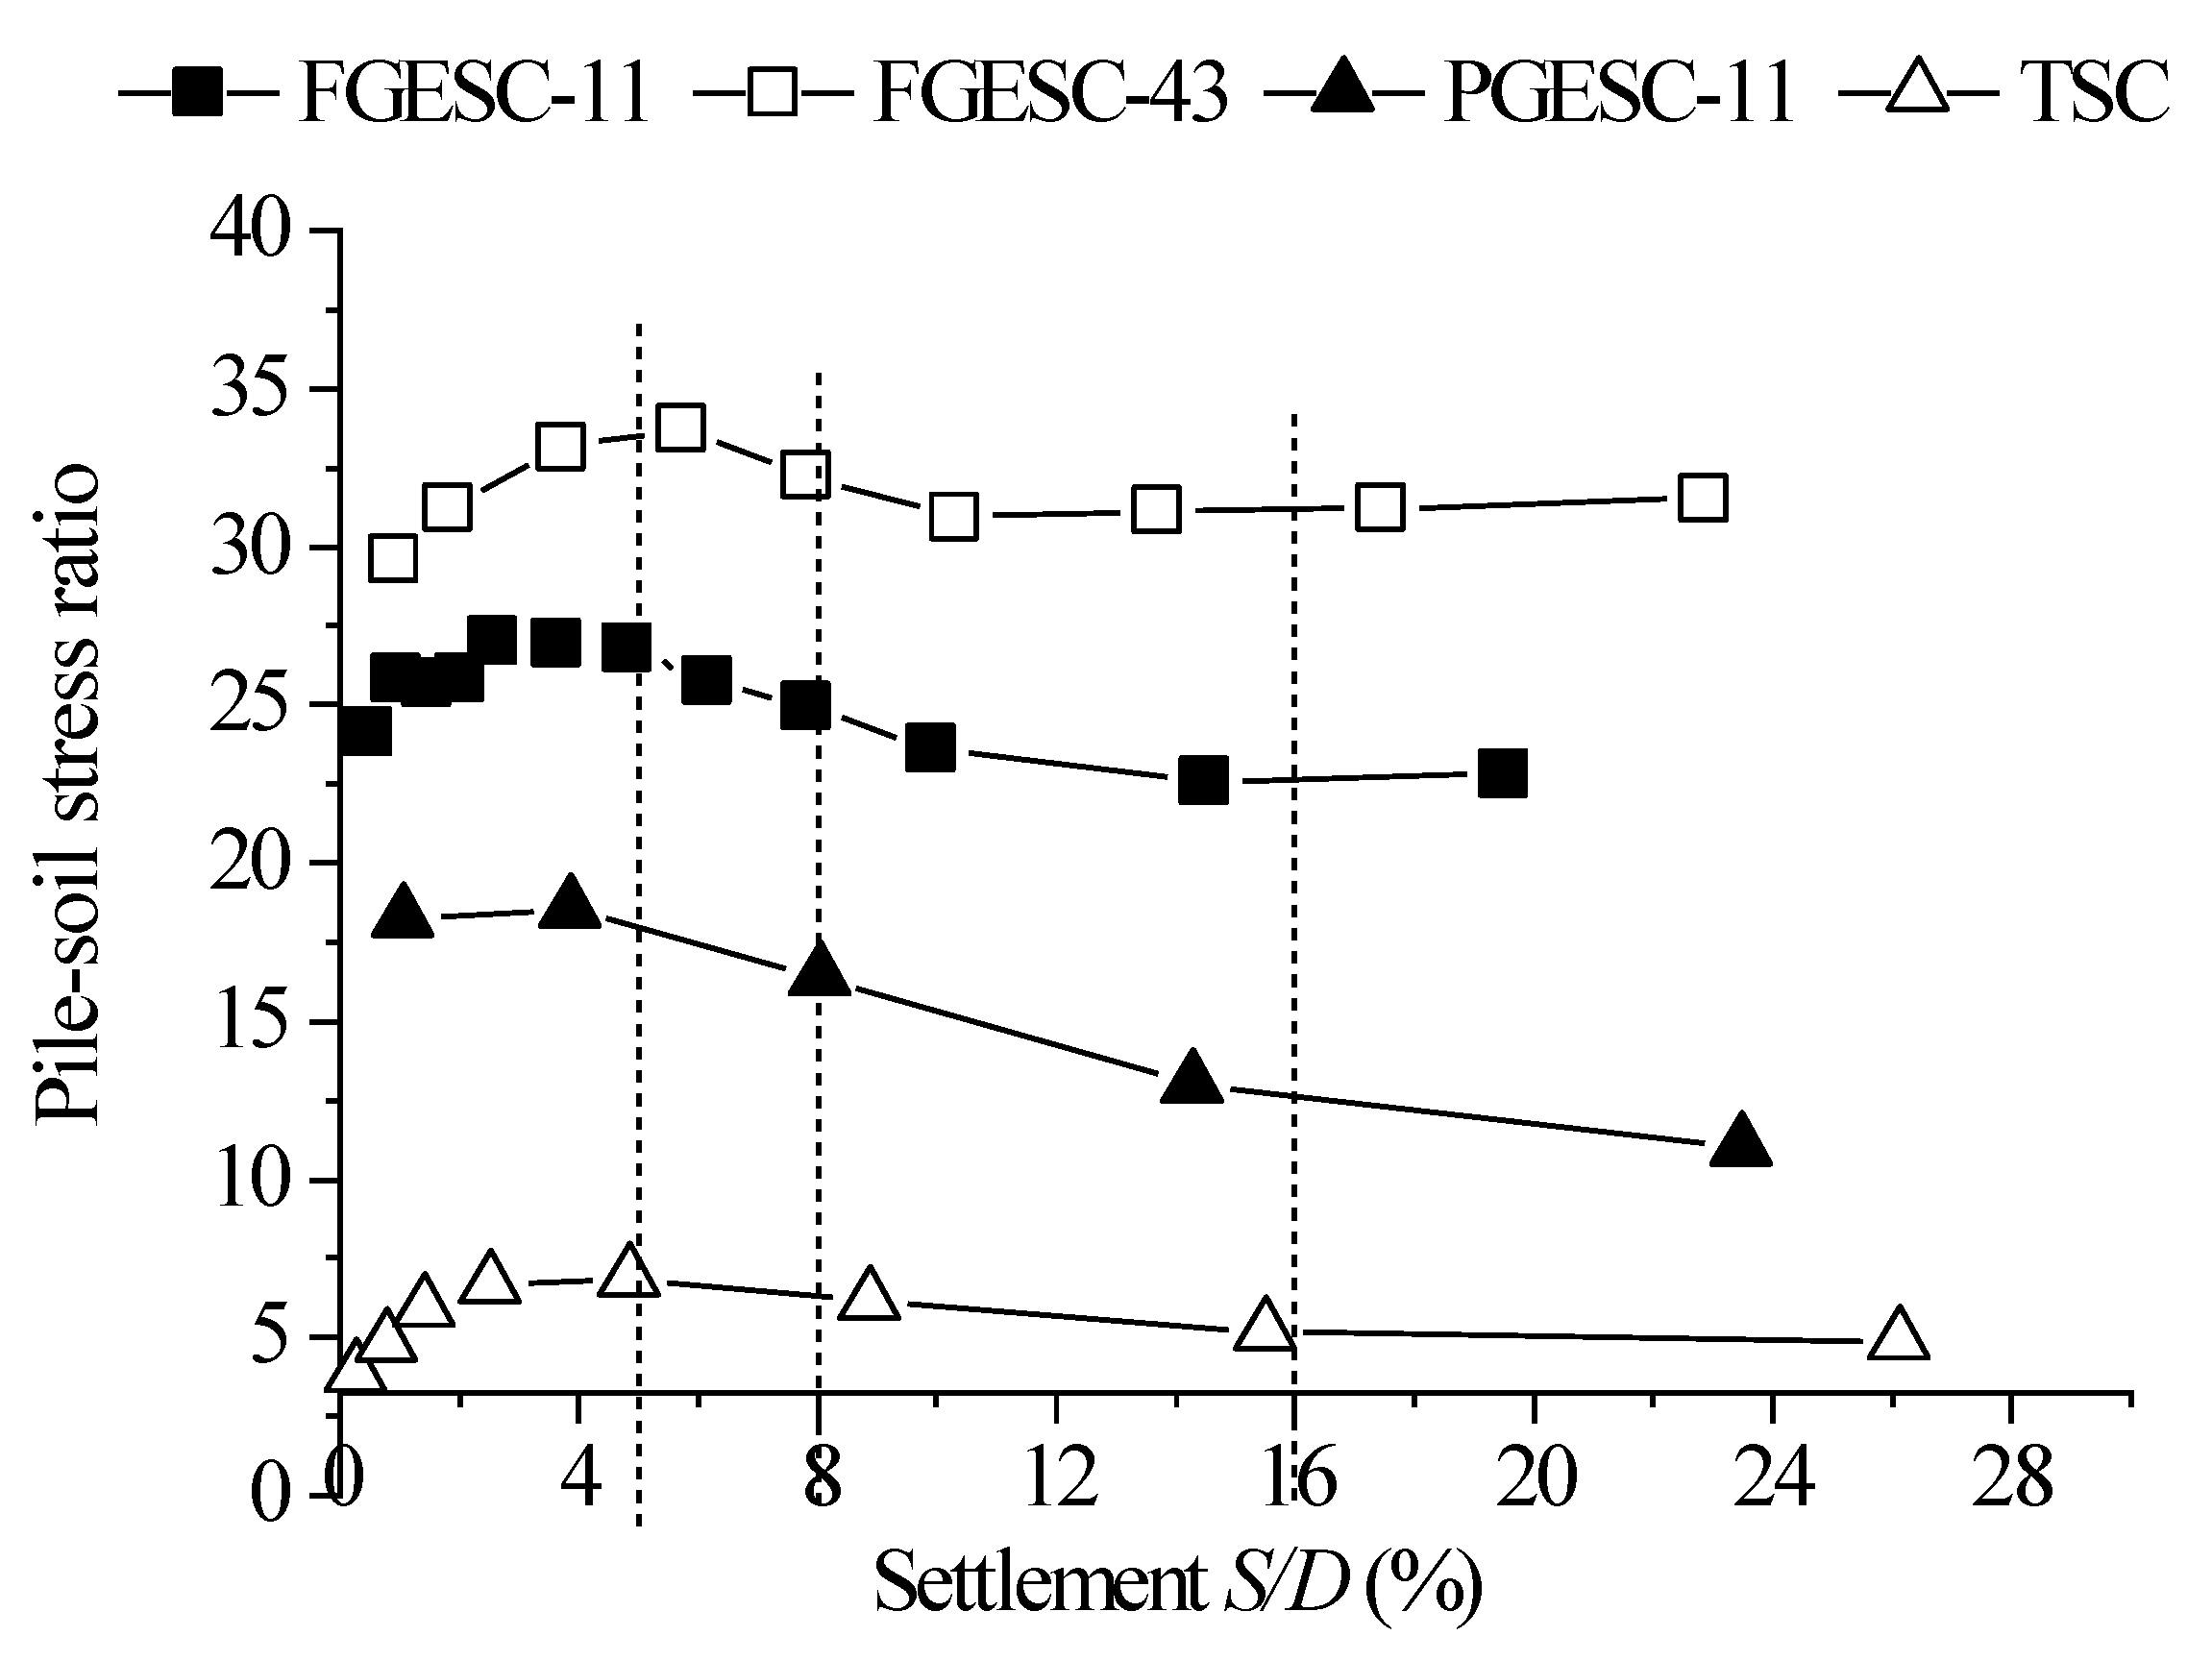
where Ap is the pile sectional area, As is the soil area, and Q is the upper load. By comparing the measured vertical stress at the top of the pile with the calculated value using Equation (1), it was found that the two results were in good agreement when the upper load was smaller. When the load was larger, the difference between the two results was 10~25%. Considering that the stress distribution on the soil was uneven, the pile top stress was corrected according to the calculated value. Therefore, the pile-soil stress ratio could be obtained, as shown in Figure 6. In Figure 6, S is the settlement of the bearing plate, and D is the diameter of the bearing plate.
The results in Figure 6 show that at the initial stage of loading, the pile-soil stress ratio of the different composite foundations increases slightly with the increase of settlement S/D. Then, with the increase of settlement, the pile-soil stress ratio decreases slightly. Finally, when the settlement S/D is greater than 10%, the pile-soil stress ratio tends to be stable. During the whole loading process, the pile-soil stress ratio of FGESC-11 was 22~27, the pile-soil stress ratio of FGESC-43 was 29~34, the pile-soil stress ratio of PGESC-43 was 11~19, and the pile-soil stress ratio of TSC was 3~7. The comparison shows that the wrapping effect and the strength of the sleeve material can effectively improve the pile-soil stress ratio, so that the stress is more concentrated on the pile and the force acting on the soil is reduced; thus, the working condition of the composite foundation is improved. In order to further analyze the influence of different reinforcement measures on the pile-soil stress ratio of the composite foundation, the pile-soil stress ratios with settlement S/D = 5%, 8% and 16% were taken for comparison, as shown in Table 2. The pile-soil stress ratio corresponding to the settlement S/D = 5% was close to the maximum pile-soil stress ratio, the pile-soil stress ratio corresponding to the settlement S/D = 8% was in the descending section, and the pile-soil stress ratio corresponding to the settlement S/D = 16% was in the stable section. As shown in Table 2, the pile-soil stress ratios of FGESC-11, FGESC-43, PGESC-43 and TSC were stable at 23, 31, 13 and 5, respectively. The pile-soil stress ratio of FGESC-11 was about four times that of TSC. The pile-soil stress ratio of FGESC-43 was about six times that of TSC. The pile-soil stress ratio of PGESC-43 was about three times that of TSC. This observation shows that the GESC has a greater bearing capacity advantage compared with the TSC in soft clay foundations.
3.2. Transfer Law of Pile-Soil Vertical Stress
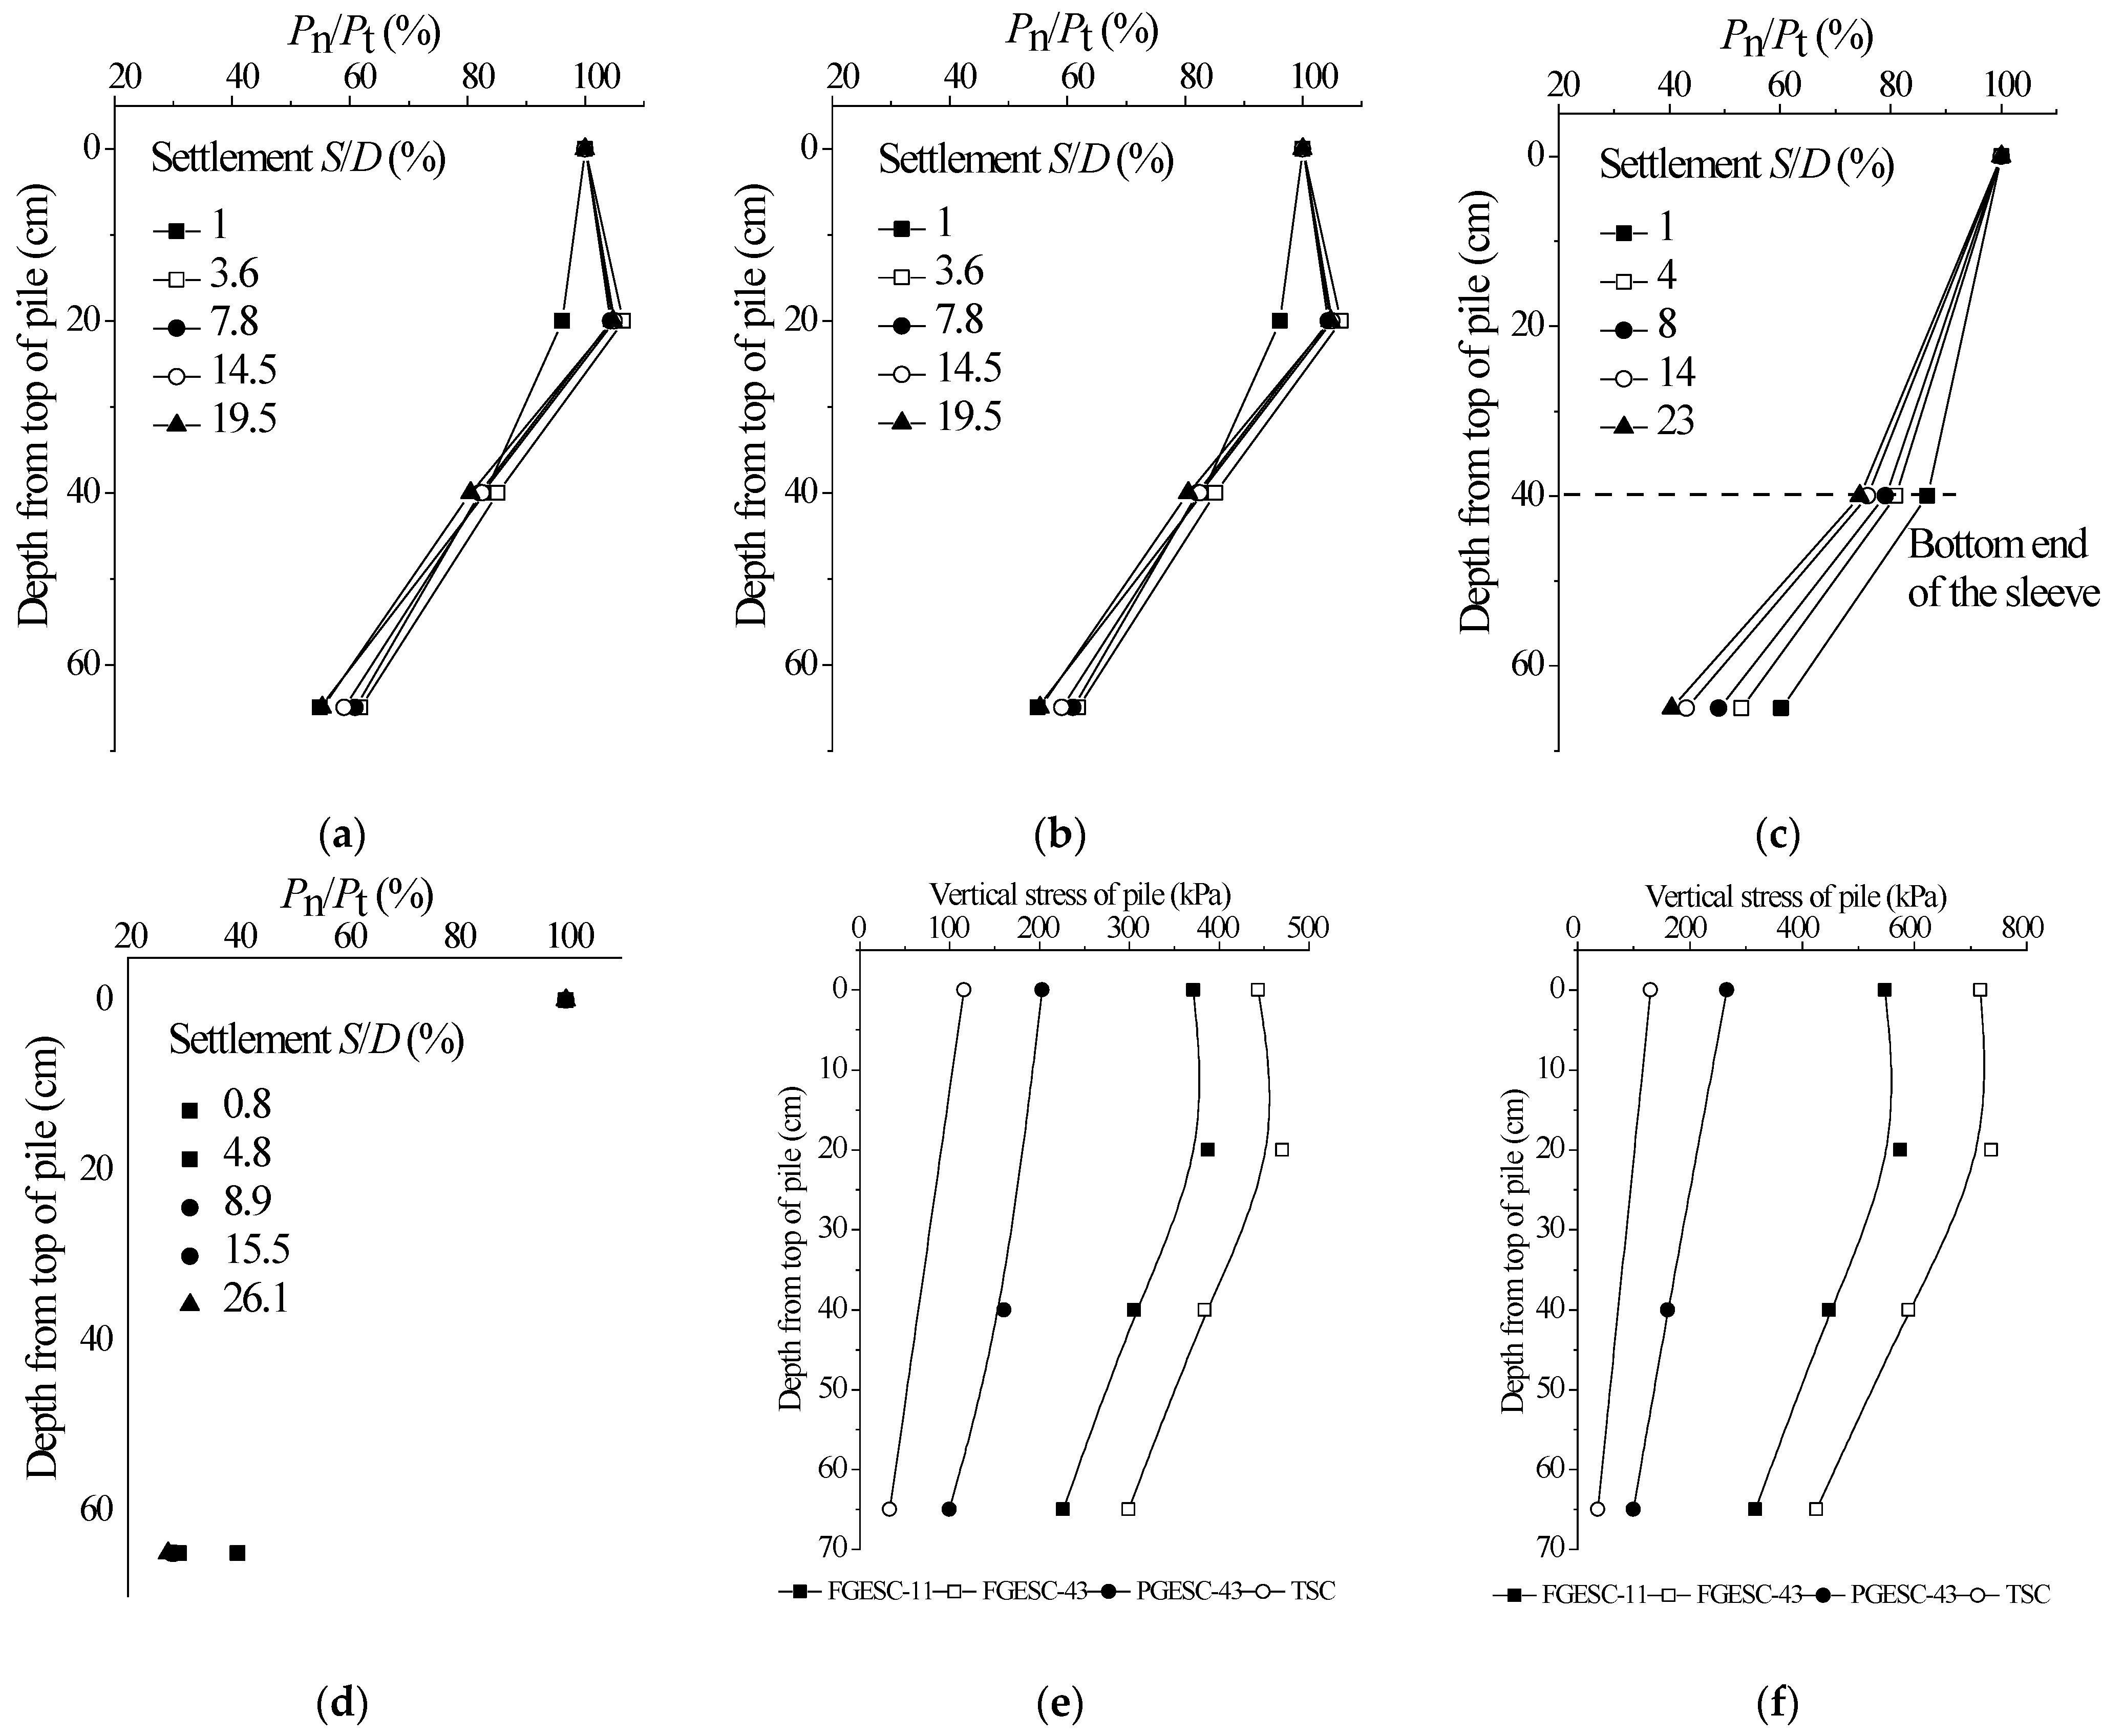
In order to study the transfer law of stress in the GESC, several earth pressure boxes were buried in the pile body along the pile length to measure the pile stress. Based on the axial ratio of the measured stress Pt at the top of the pile and the stress Pn in a test section within the pile, the stress transfer law within different piles under a certain settlement could be plotted, see Figure 7 and Table 3. In order to better compare the pile stress transfer laws for different types of piles, Figure 7e,f were plotted. From Figure 7a,b the comparison shows that the pile stress at 20 cm (equal to 2D) of the GESC was greater than the stress at the top of the pile. This is because the compression modulus of the GESC was much larger than the compression modulus of the soil around the pile, which makes the settlement of the soil around the pile larger than the settlement of the pile. Therefore, the soil around the pile near the top of the pile had a downward frictional resistance to the pile; that is, negative frictional resistance.
It can also be seen from Figure 7a,b that for the FGESC, the stress transferred to the location 40 cm below the top of the pile was about 80% of the stress at the top of the pile, and the stress transferred to the bottom of the pile was about 60% of the stress at the top of the pile. For the PGESC, the stress transmitted to the position 40 cm below the top of the pile was slightly less than that of the FGESC, and the stress transmitted to the bottom of the pile was about 40% to 60% of the stress at the top of the pile. For the TSC, the stress transferred to the bottom of the pile was about 27% to 45% of the stress at the top of the pile, as shown in Table 3. In Table 3, the min and max of Pn/Pt refer to the minimum and maximum values under different loads, respectively. The comparison between Figure 7e,f shows that the PGESC could bear greater stresses than the TSC under the same settlement, but the attenuation law of stress increment with pile length was almost the same. Compared with the PGESC and the TSC, the FGESC were able to bear greater stresses. Within the range of about 1/3 of the pile length from the top of the pile, the stress in the pile varies little, and then the stress in the pile decays downward along the pile body. Comparing the FGESCs made of sleeve materials with different tensile strengths, it is safe to conclude that the greater the tensile strength of the sleeve materials, the greater the stress they can bear. However, along the pile body, the stress attenuation laws of FGESC-11 and FGESC-43 are almost the same.
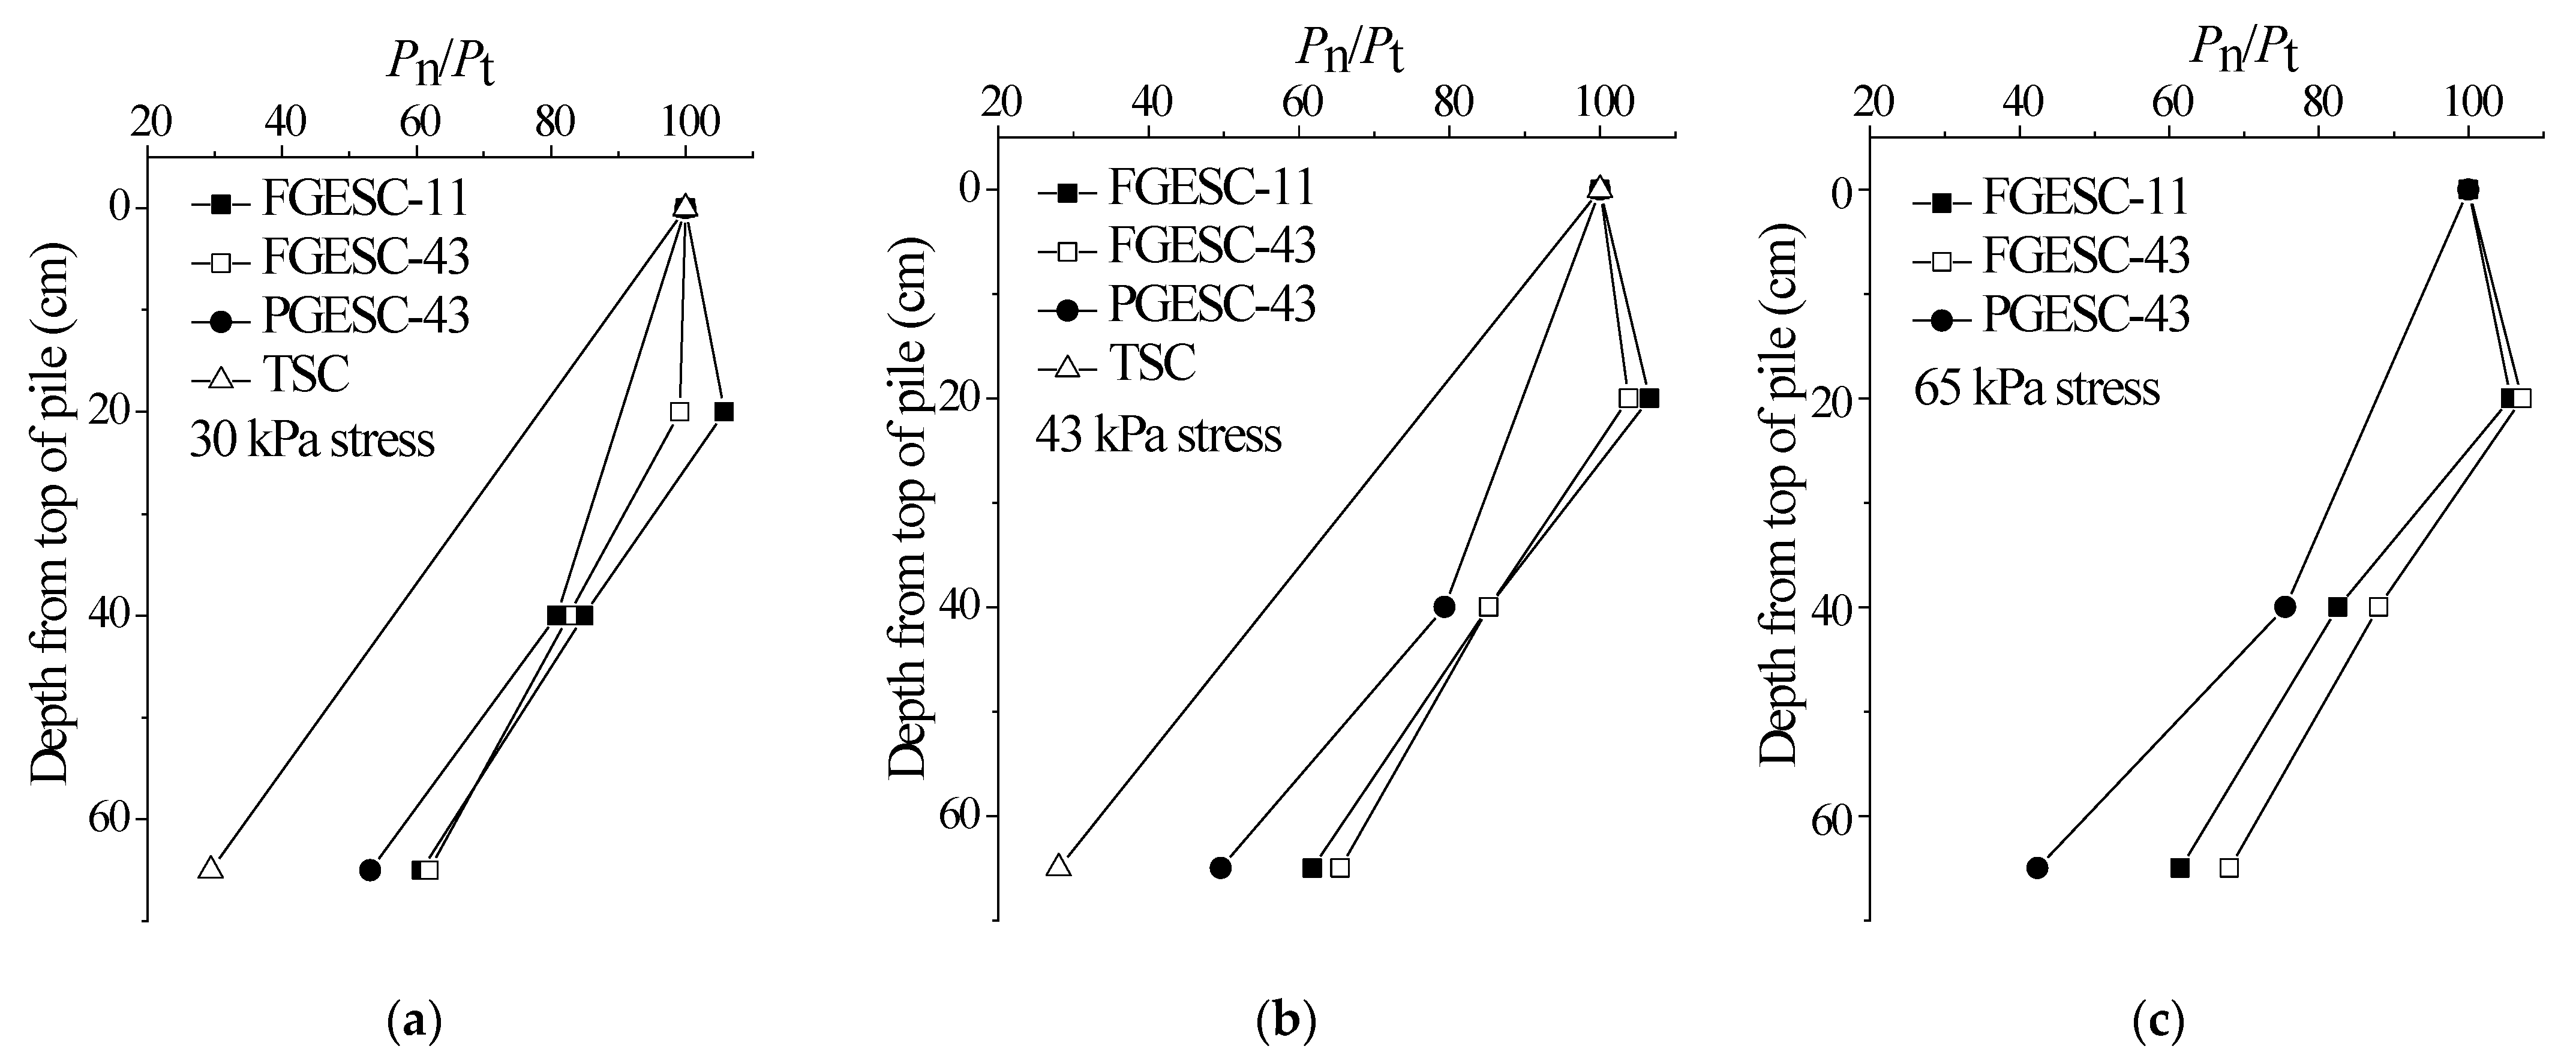
The stress transfer characteristics of the different pile bodies under different loads are shown in Figure 8, below. The percentage of stresses transferred to a depth of 40 cm was the same for PGESC and FGESC. However, the percentage of axial force transferred to the bottom end of the pile by PGESC was relatively small. With the increase in the upper load, the attenuation rate of the axial force of PGESC was obviously accelerated, while the transfer percentage of the axial force of the FGESC changed slightly.
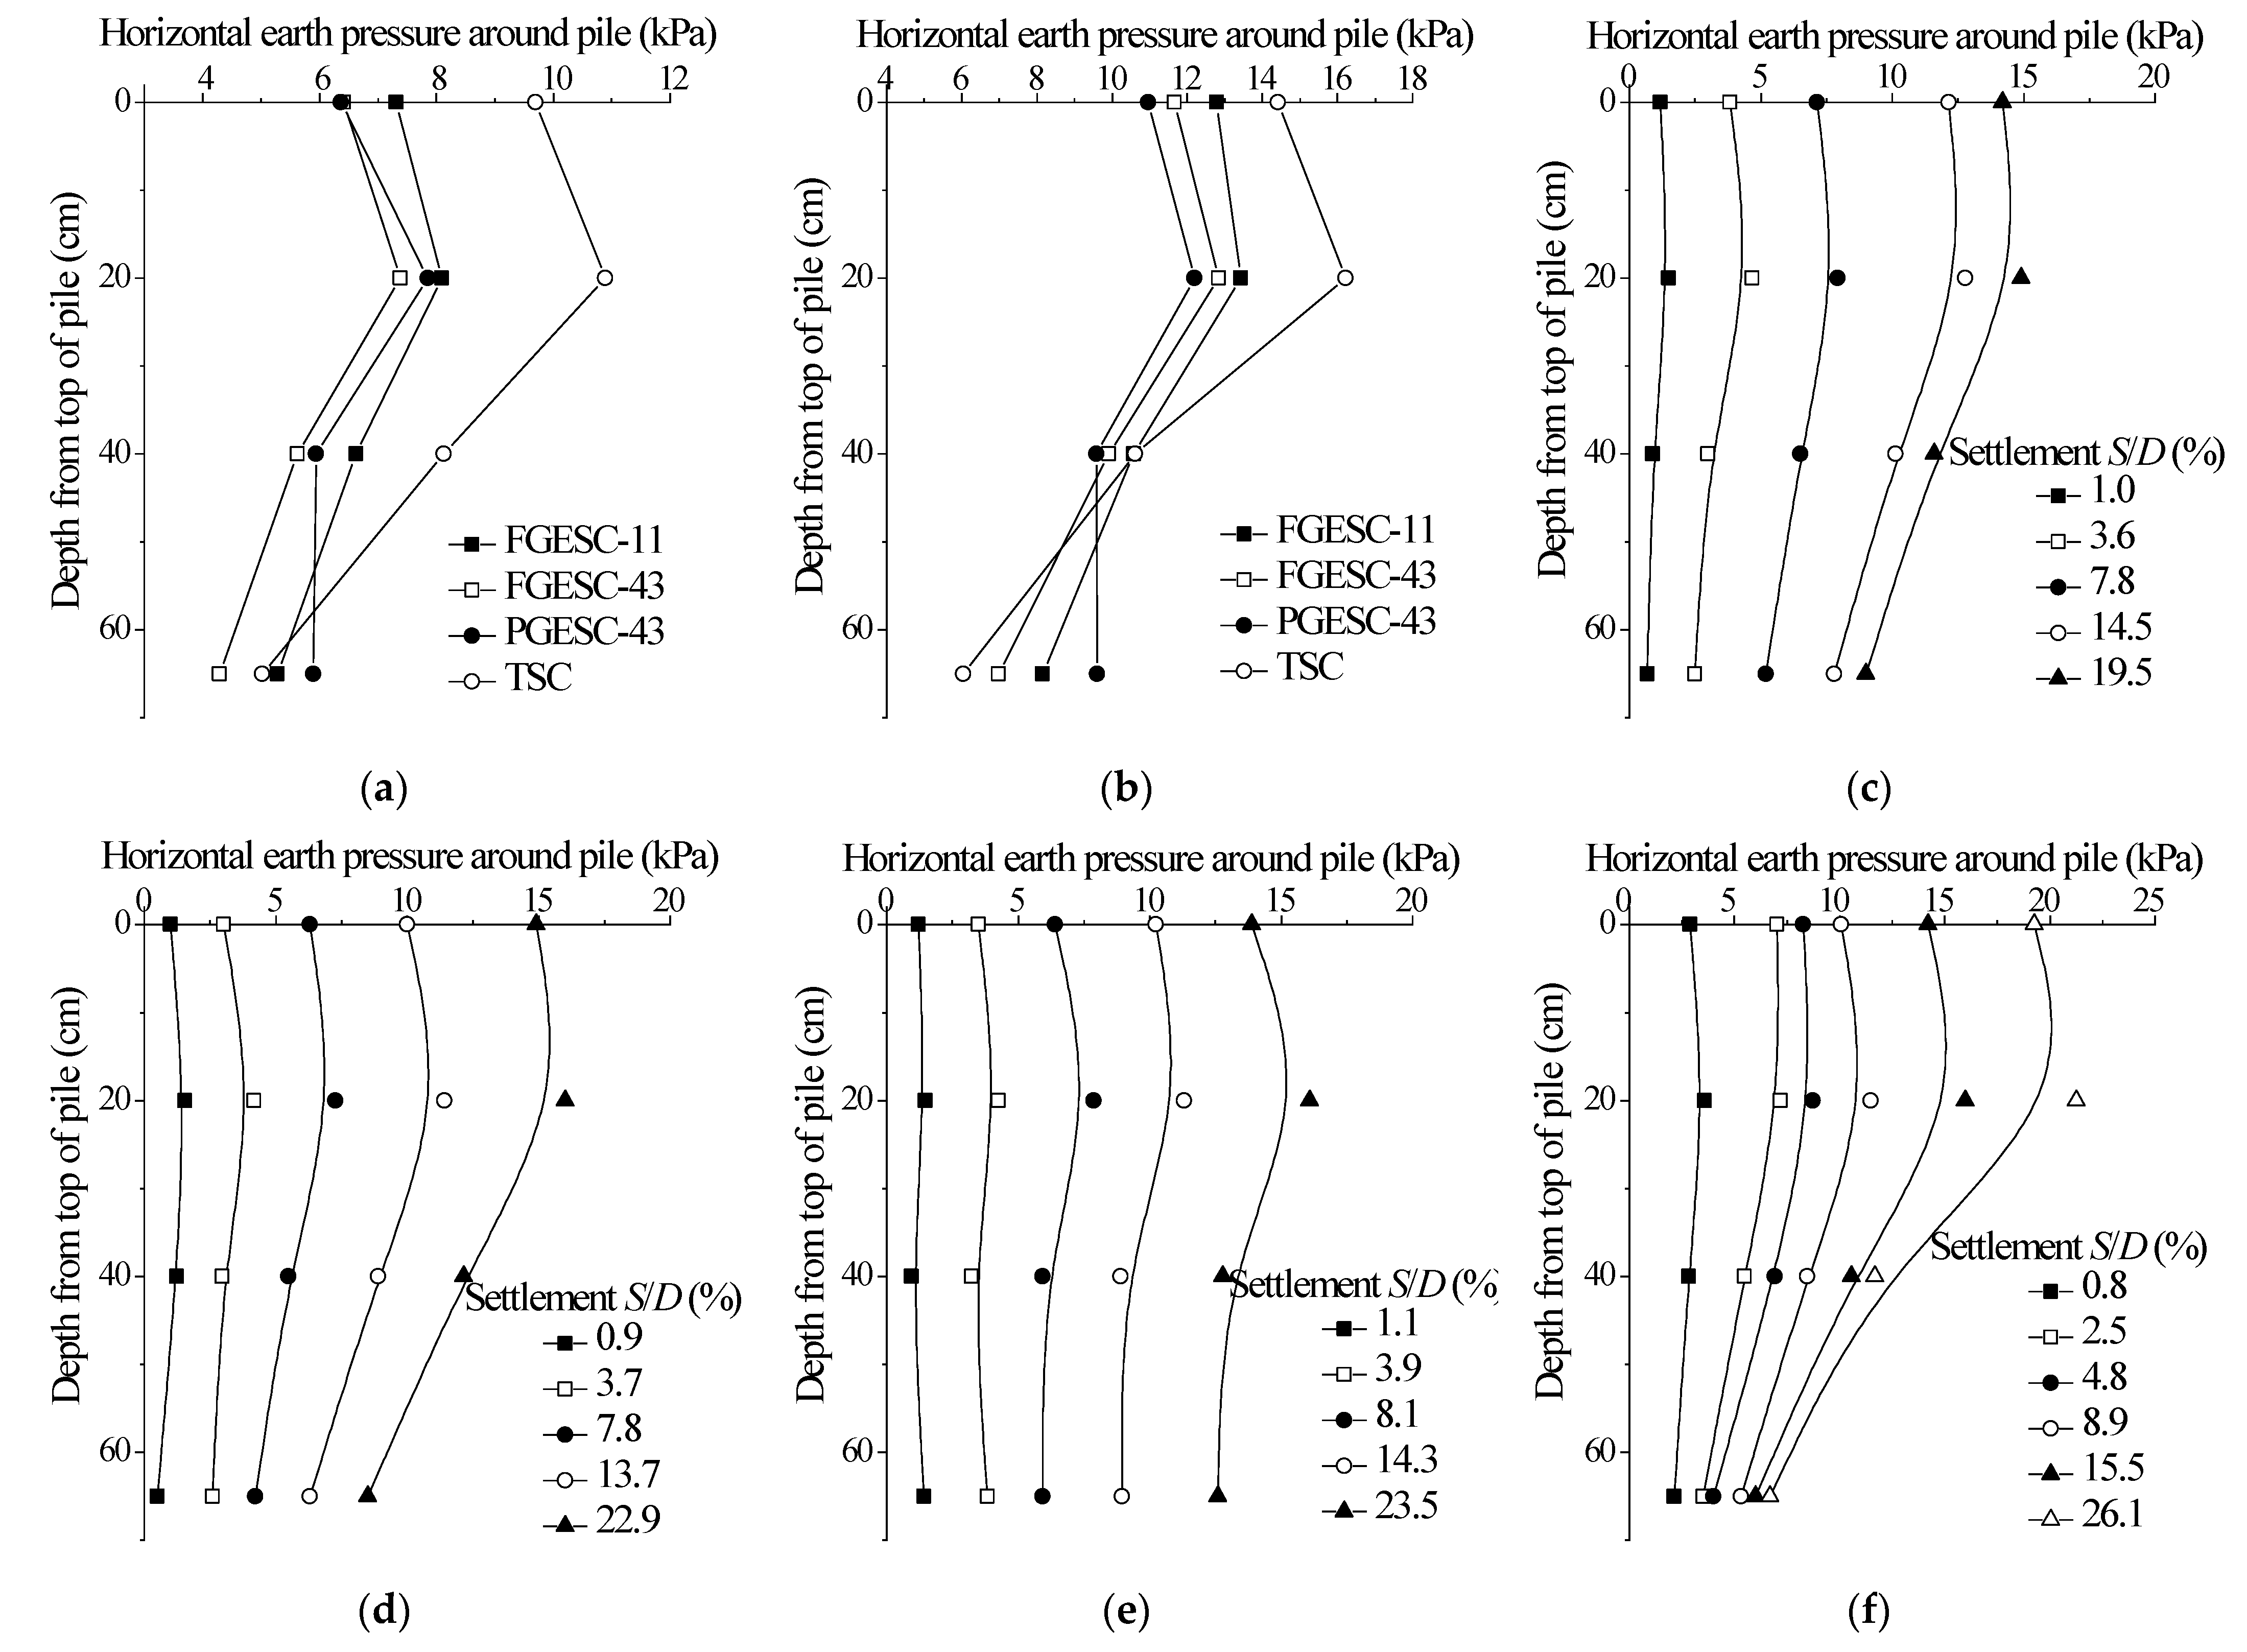
3.3. Horizontal Earth Pressure of Soil around Pile
The horizontal earth pressure of the soil around the pile can provide a certain radial restraint for the pile. For the TSC, the soil around the pile mainly provides radial restraint; For the GESC, the sleeve and the soil around the pile can provide radial restraint for the pile. In order to obtain the horizontal force on the soil around the pile, a number of earth pressure boxes were buried vertically at different depths around the pile. The stress membrane surface of the earth pressure box was parallel to the axis of the pile, so that the horizontal stress around the pile could be monitored. The relationship between the monitored horizontal earth pressure and the buried depth is shown in Figure 9. The horizontal earth pressure of the soil around the pile consists of two parts, one is the static earth pressure generated by the upper vertical load, and the other is the passive earth pressure generated by the bulging deformation of the pile, which can be expressed as:
where PSH represents the horizontal earth pressure of the soil around the pile, K0 is the static earth pressure coefficient, α is the additional stress coefficient, Δ is the horizontal displacement of the pile, and KP is the horizontal resistance of the soil around the pile caused by unit horizontal displacement.
Since the additional stress coefficient decreases with depth and the static earth pressure coefficient remains basically unchanged with depth, the first term of Equation (2) decreases with the increase in burial depth. The existing research shows that within the range of 0~4D from the top of the pile, the swelling deformation of the GESC and the TSC first increases and then decreases with the increase in burial depth. Thus, the horizontal displacement of the soil around the pile also increases and then decreases with the increase in the burial depth. Therefore, the maximum value of Equation (2) exists in the depth range of 0~4D from the top of the pile. Combining with Figure 9c–f, it can be found that the maximum horizontal earth pressure of different composite foundations occurred approximately at 2D depth. This finding indicates that the maximum swelling deformation may occur in the pile at this location, which is consistent with the existing test results. In the depth range of 4D from the top of the pile, the horizontal soil pressure around the TSC is greater than that of the GESC. The reason is that the bulge deformation produced by the former is greater than that of the latter in the 4D depth range from the top of the pile. Therefore, the horizontal earth pressure of the soil around the TSC is larger. When the depth is greater than 4D, that is, under the sleeve of the PGESC, the horizontal stress of the PGESC is greater than those of the TSC and FGESC. This is because the stress transmitted to the unwrapped section for the PGESC is greater than the vertical stress of the TSC at the same depth, resulting in a larger swelling deformation of this part. In addition, the upper wrapped section penetrates the lower unwrapped section downward, which also aggravates its bulging deformation. The above reasons make the horizontal stress of the soil around the pile, under the sleeve of the PGESC, relatively large.
4. Shaking Table Test Design of the Composite Foundation Reinforced by the GESC
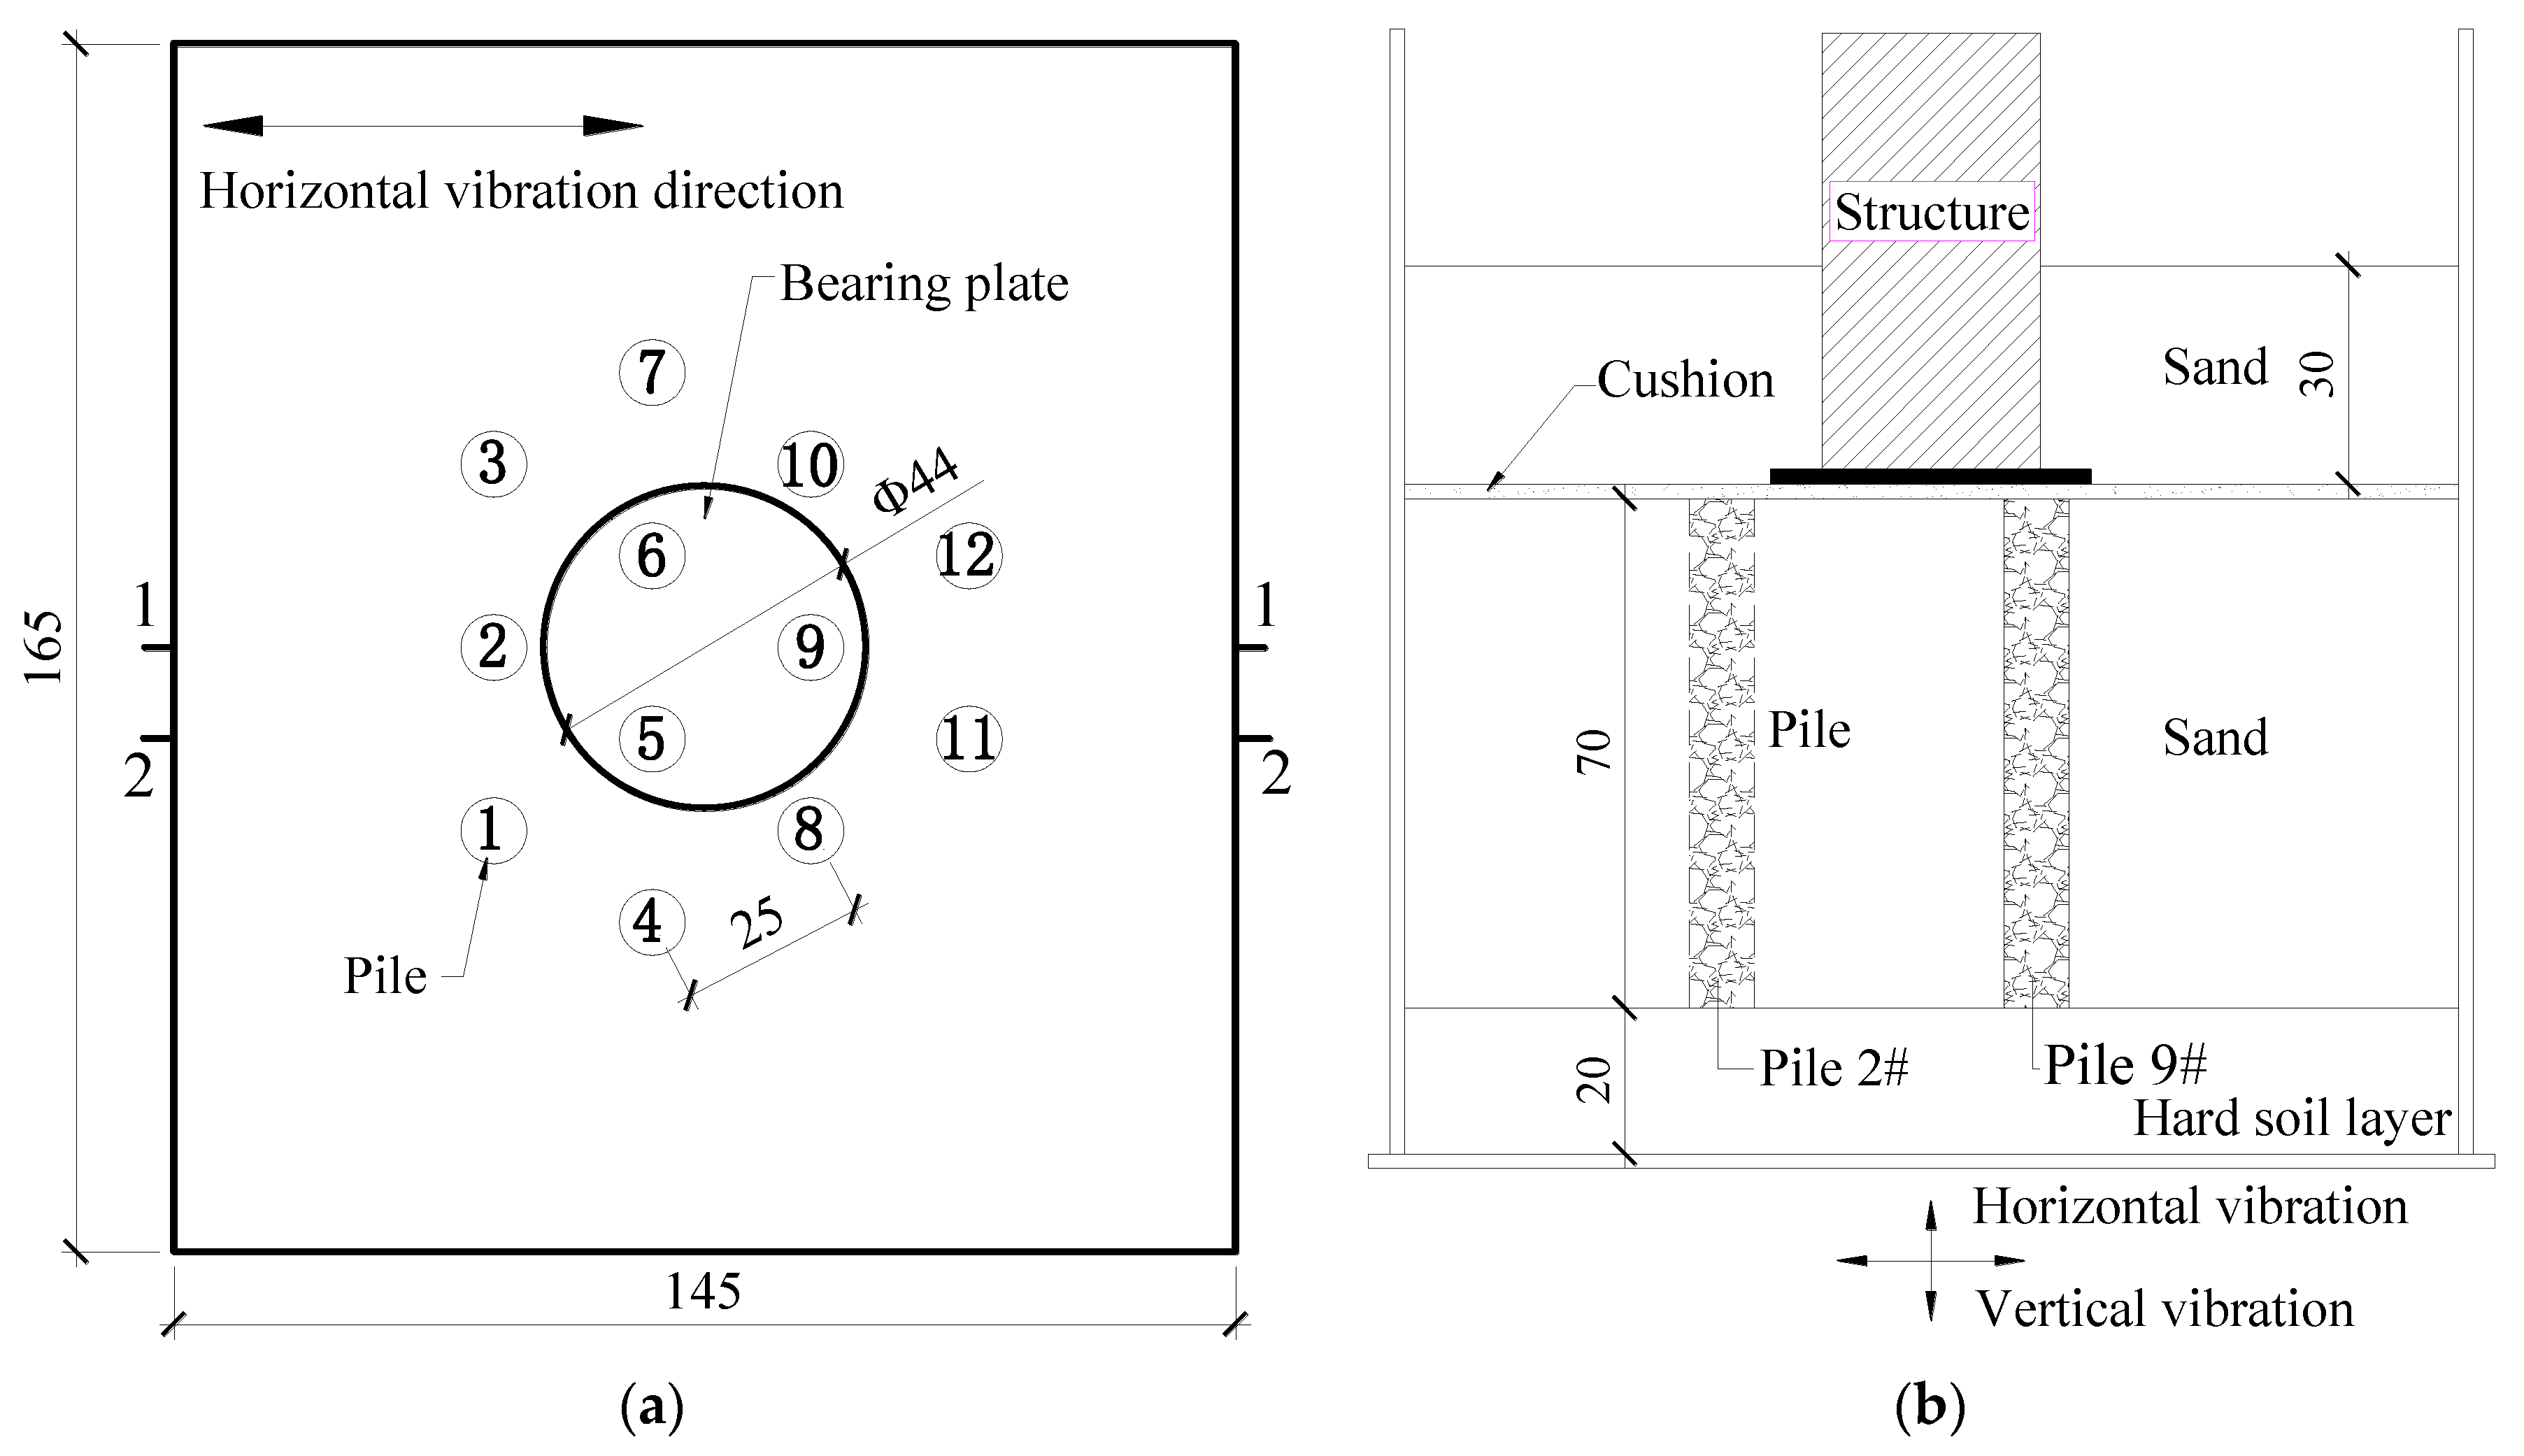
The performance of the earthquake simulation shaking table, the size and boundary treatment of the layered shear model box, the design of similitude relations, the determination of similitude materials, and the construction process of the test model are introduced in detail in the published literature of our research group [22]. This section does not repeat the content mentioned above. Considering the similitude conditions of the model, the length of the GESC is 70 cm, the pile diameter is 9 cm, the length diameter ratio is about 8, and the pile spacing is 25 cm. The piles are arranged in the form of a square triangle with a total of 12 piles. In the following, unless otherwise specified, the GESC refers to the fully geosynthetic-encased stone column. The diameter of the bearing plate is 44 cm, which is placed on the three central piles, and the area replacement rate is 13%. In order to simplify the test process and pay attention to the response of the composite foundation, the structure on the composite foundation is simplified as a solid steel column with a height of 60 cm, standing on the bearing plate, and its mass is 370 kg. The design parameters of the stone column are the same as those of the GESC, but the difference is that there is no sleeve outside the stone column. The soil layer in the model box is divided into two layers, the bottom layer is a 20 cm thick, hard soil layer, and the upper layer is a 100 cm thick, sandy soil. The plan and elevation layout of the GESC are shown in Figure 10. The material parameters of the sand are listed in Table 4. The non-uniformity coefficient of the crushed stone aggregate in the pile body is 2.29, the curvature coefficient is 1.57, the crushed stone particles are uniform, and the grading is poor.
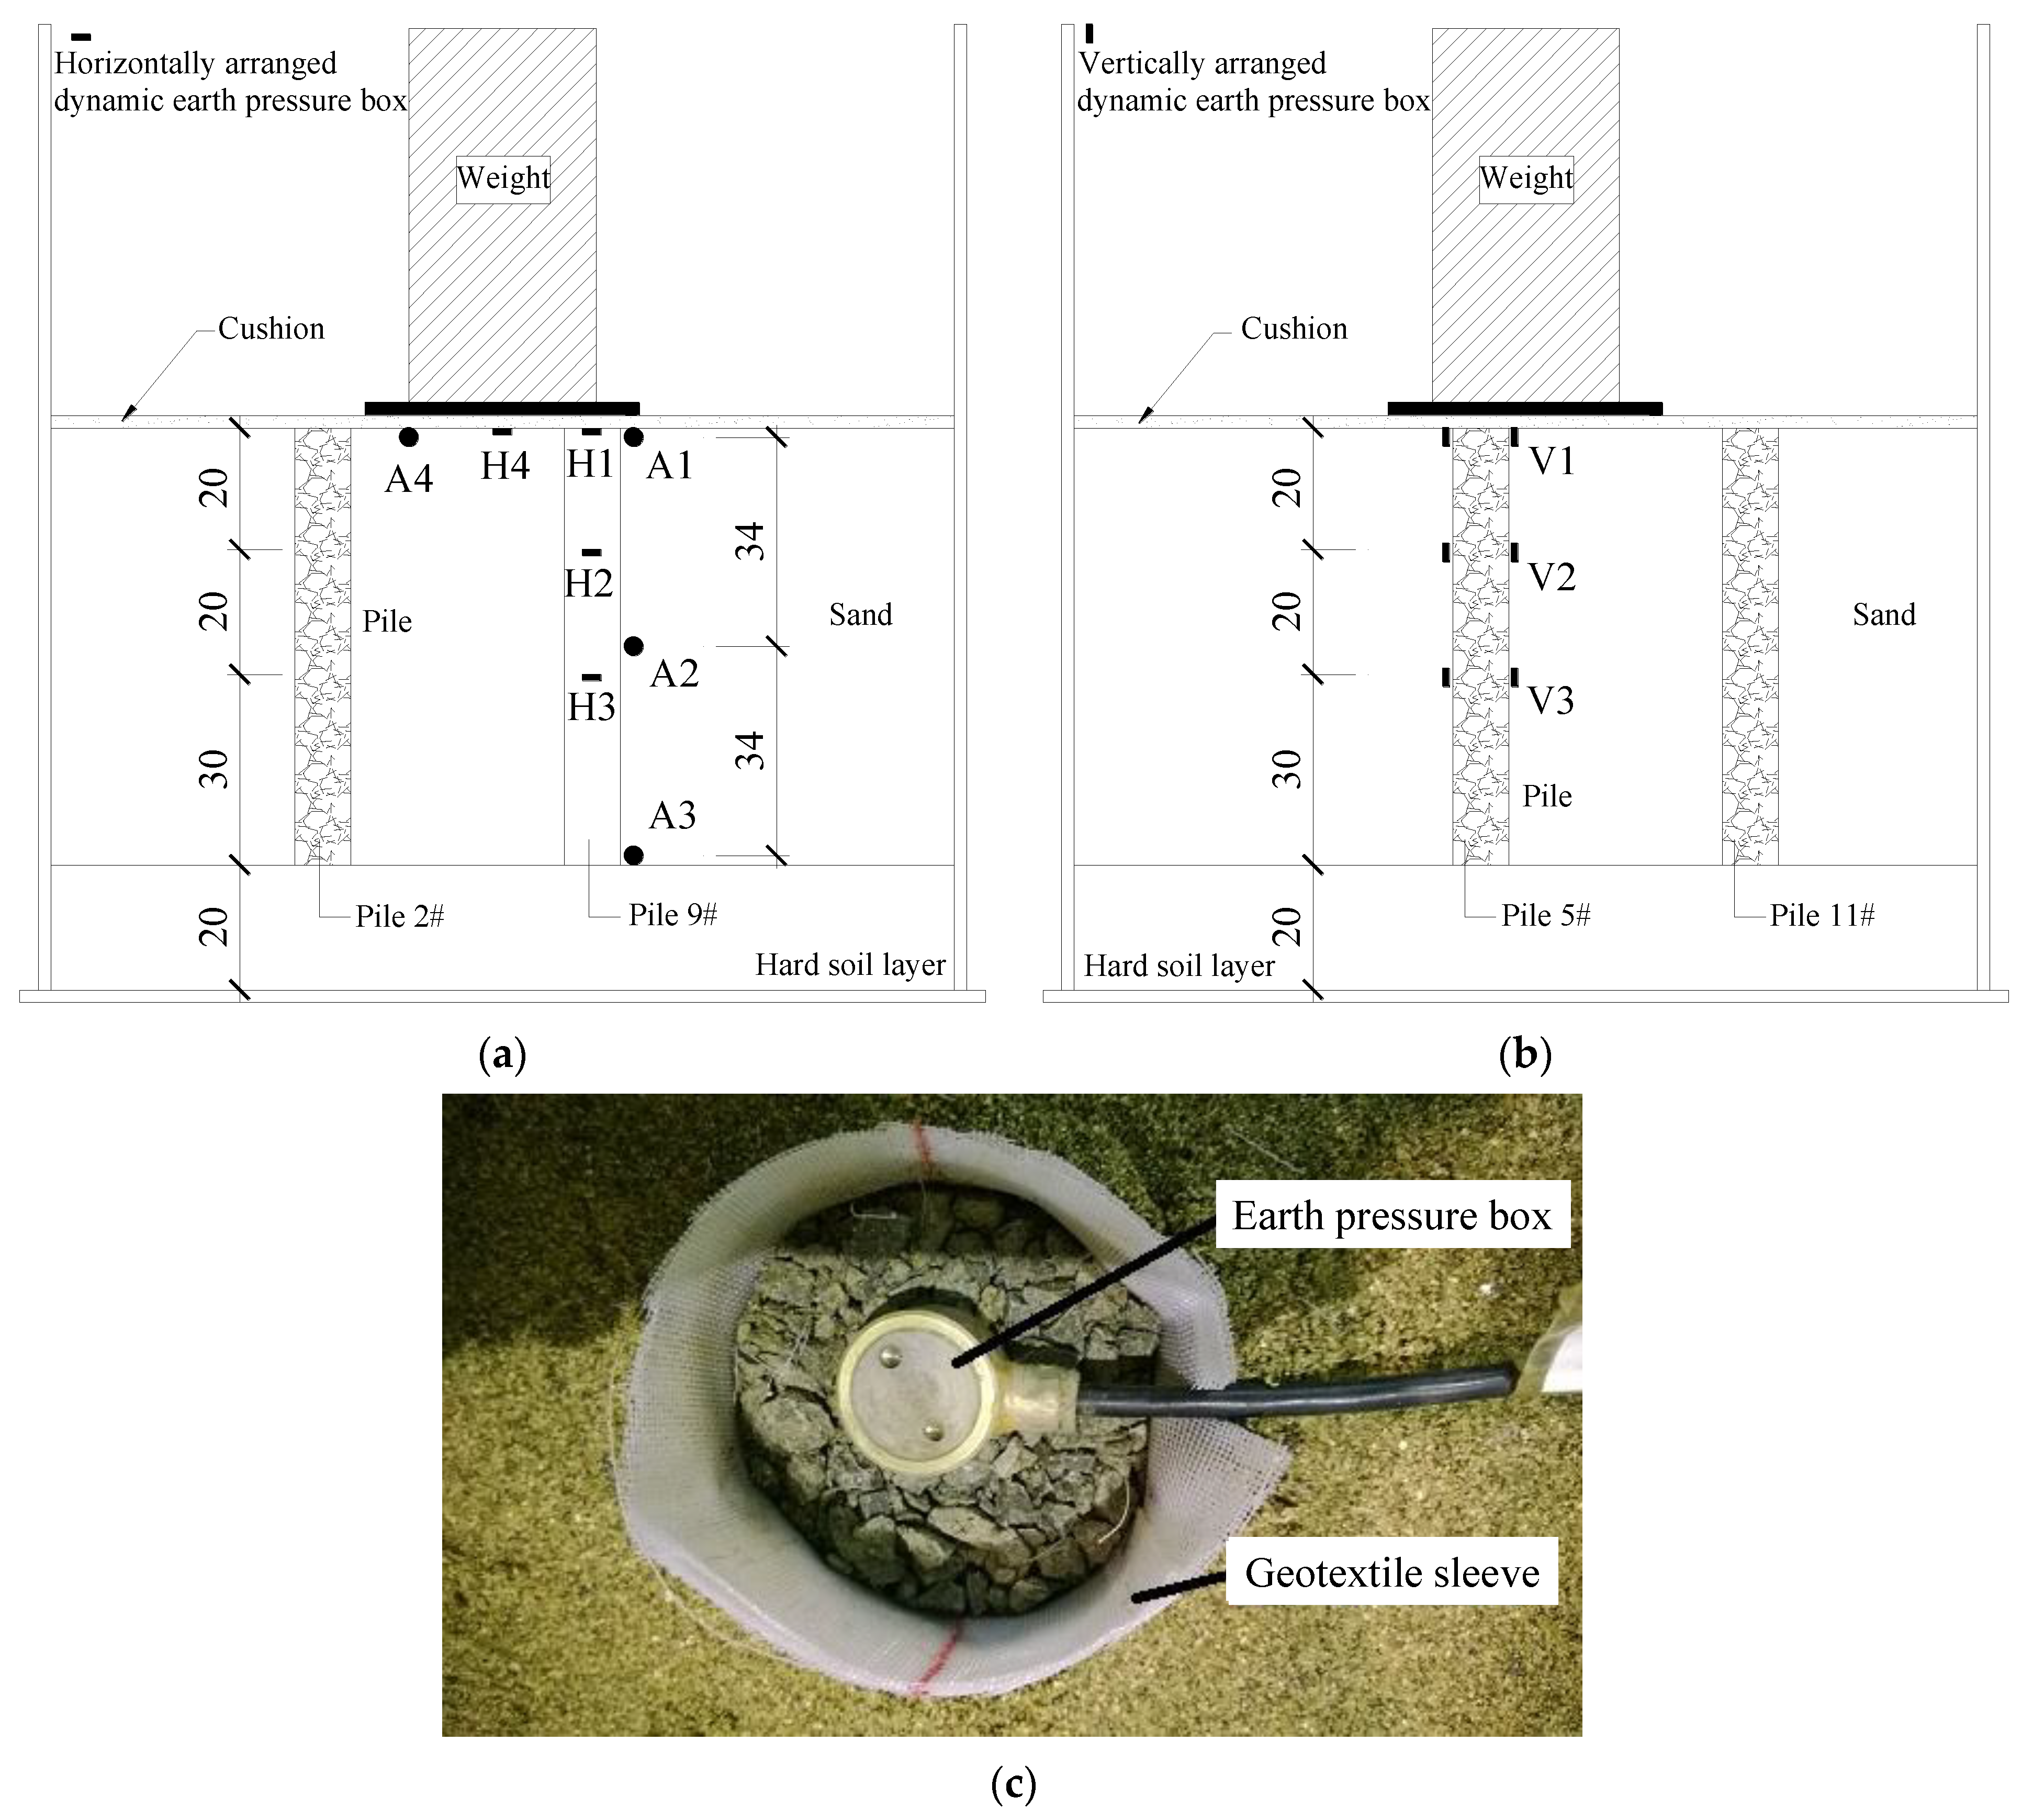
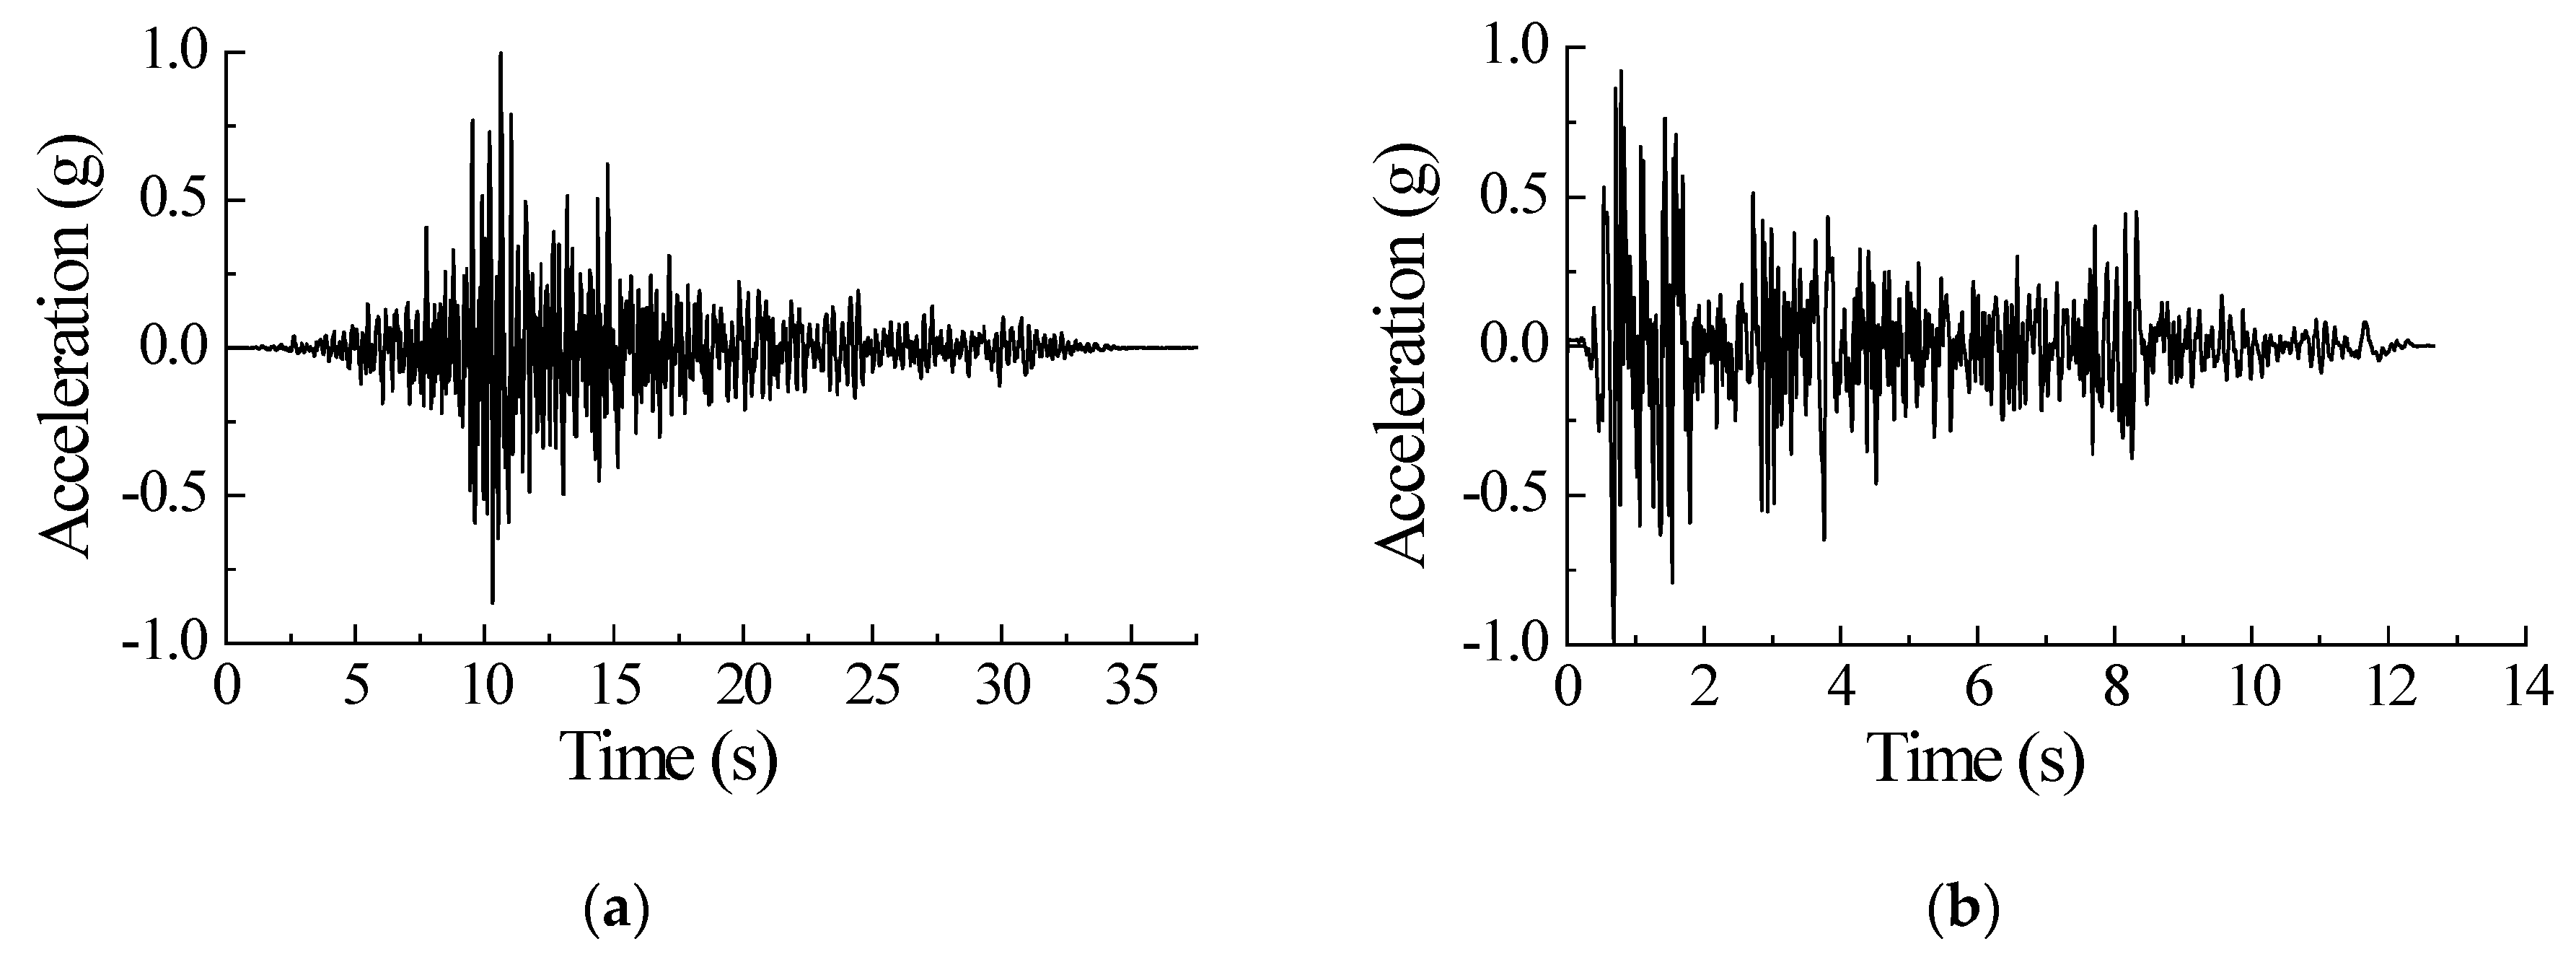
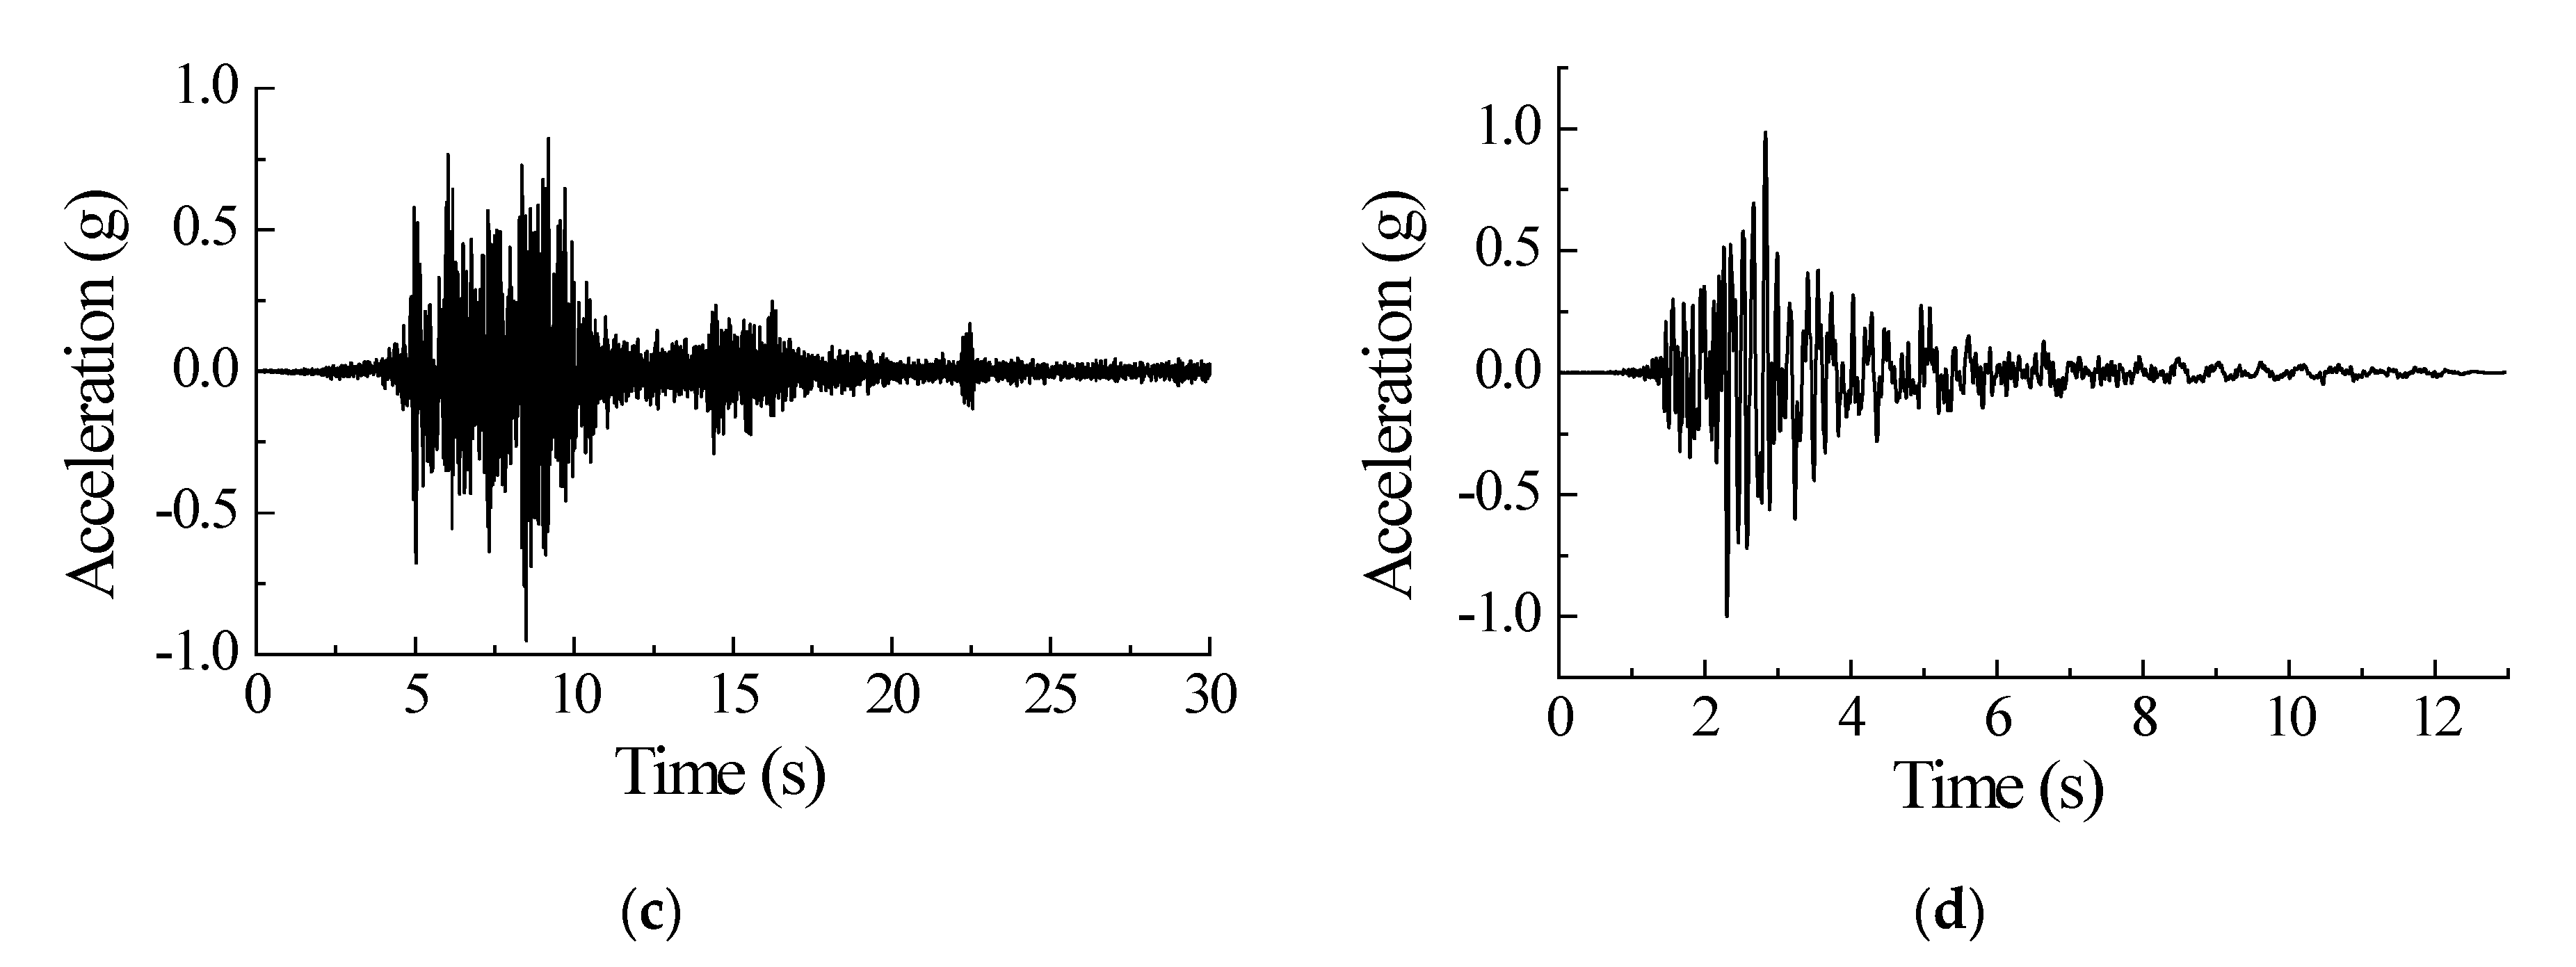
The dynamic earth pressure boxes H1 to H3 were arranged at 0, 20 and 40 cm from the top of the pile to collect the axial dynamic stress response in the pile body. The dynamic earth pressure box H4 was arranged on the top surface of the soil between the piles. The dynamic earth pressure boxes V1 to V3 were arranged vertically along the side of the pile at 0, 20 and 40 cm from the top of the pile to monitor the horizontal shear stress applied to the pile body by the soil. The location of the dynamic earth pressure box is shown in Figure 11. Artificial wave (CHO), El Centro wave (EL), Wenchuan Qingping wave (QP) and Kobe wave (KB) were loaded into the shaking table model test. The duration of the original seismic wave was first compressed by the time similitude ratio, and then interpolated by the sampling frequency to obtain the required input wave, as shown in Figure 12. The CHO, EL, QP and KB seismic waves with the same peak value were input, in turn, and the peak acceleration values were 0.1 g, 0.2 g, 0.4 g, 0.6 g and 0.9 g, respectively. Before inputting each level peak, a white noise of 0.05 g was input to check the dynamic properties of the model. The same seismic wave was loaded simultaneously into the X and Z directions, and the acceleration amplitude applied in the Z direction was multiplied by a factor of 0.7.
5. Dynamic Test Results and Discussion
5.1. Axial Dynamic Stress of Pile
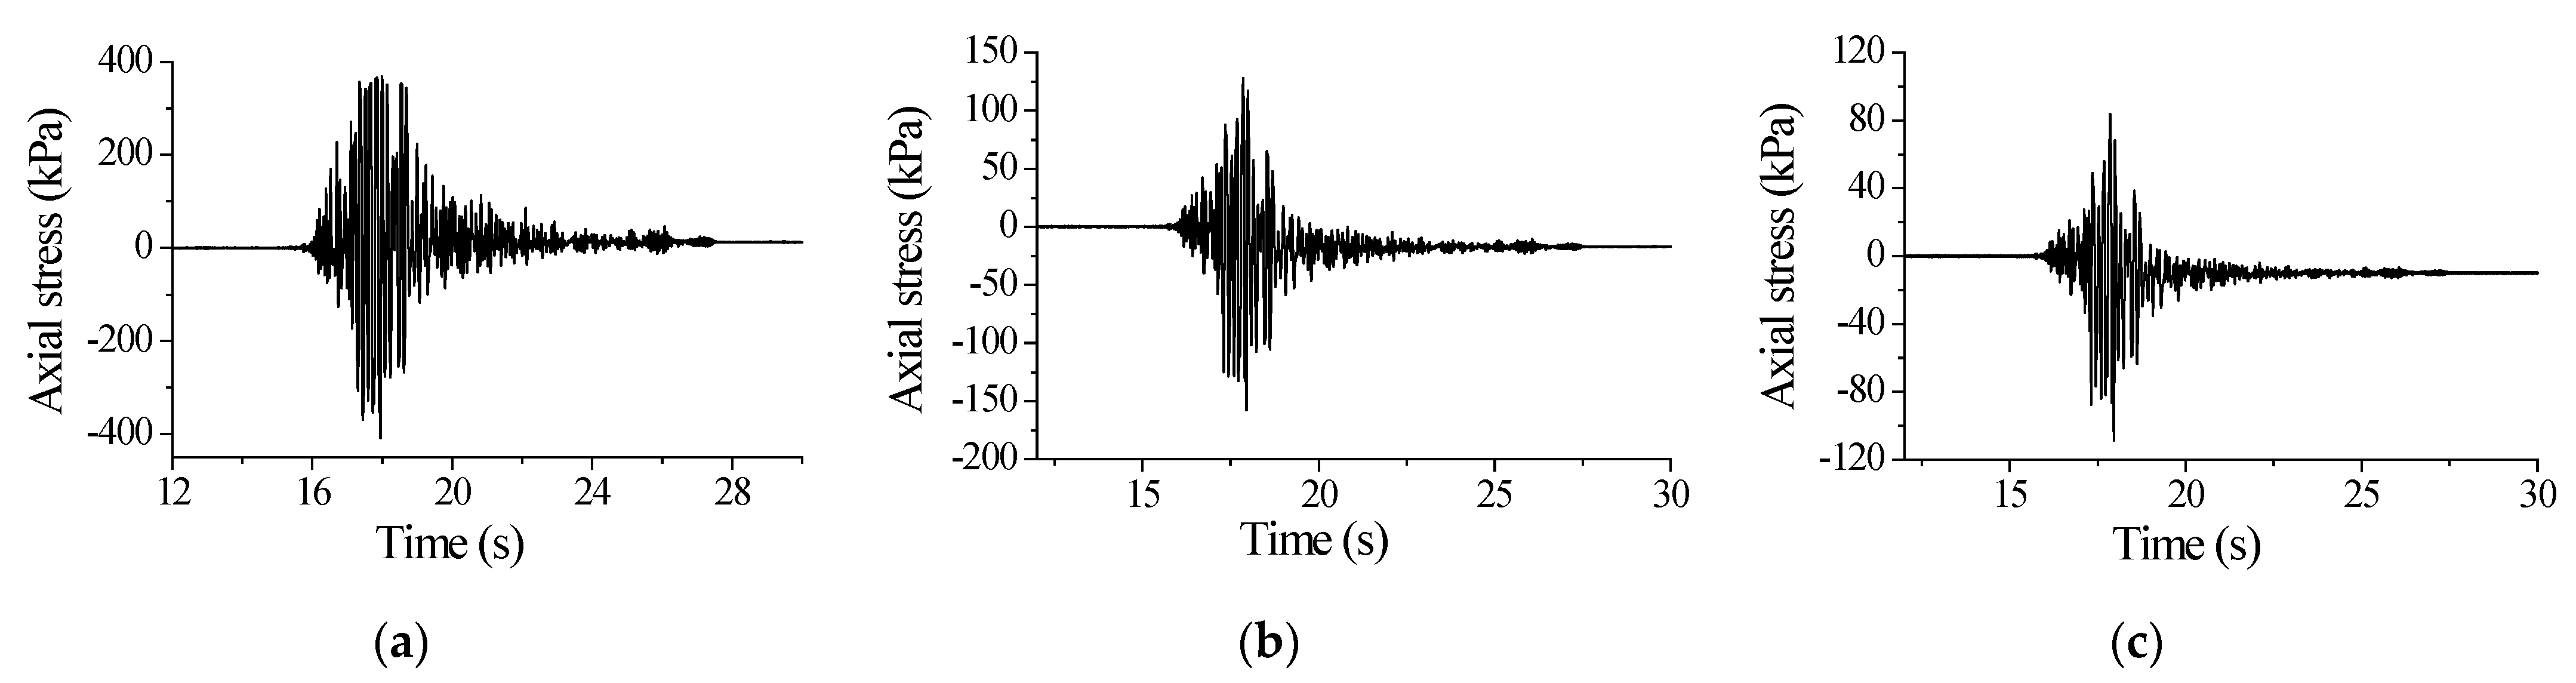
Figure 13 shows the time history curves of axial dynamic stress at different positions of the GESC under the excitation of the 0.4 g KB wave. It is apparent from this figure that the seismic action makes the stress at different positions in the pile fluctuate above and below zero, and finally, there is a certain residual stress. This observation shows that during the earthquake, the pile bore repeated actions of extrusion and relaxation; after the earthquake, the stress in the pile body had changed compared with the initial value.
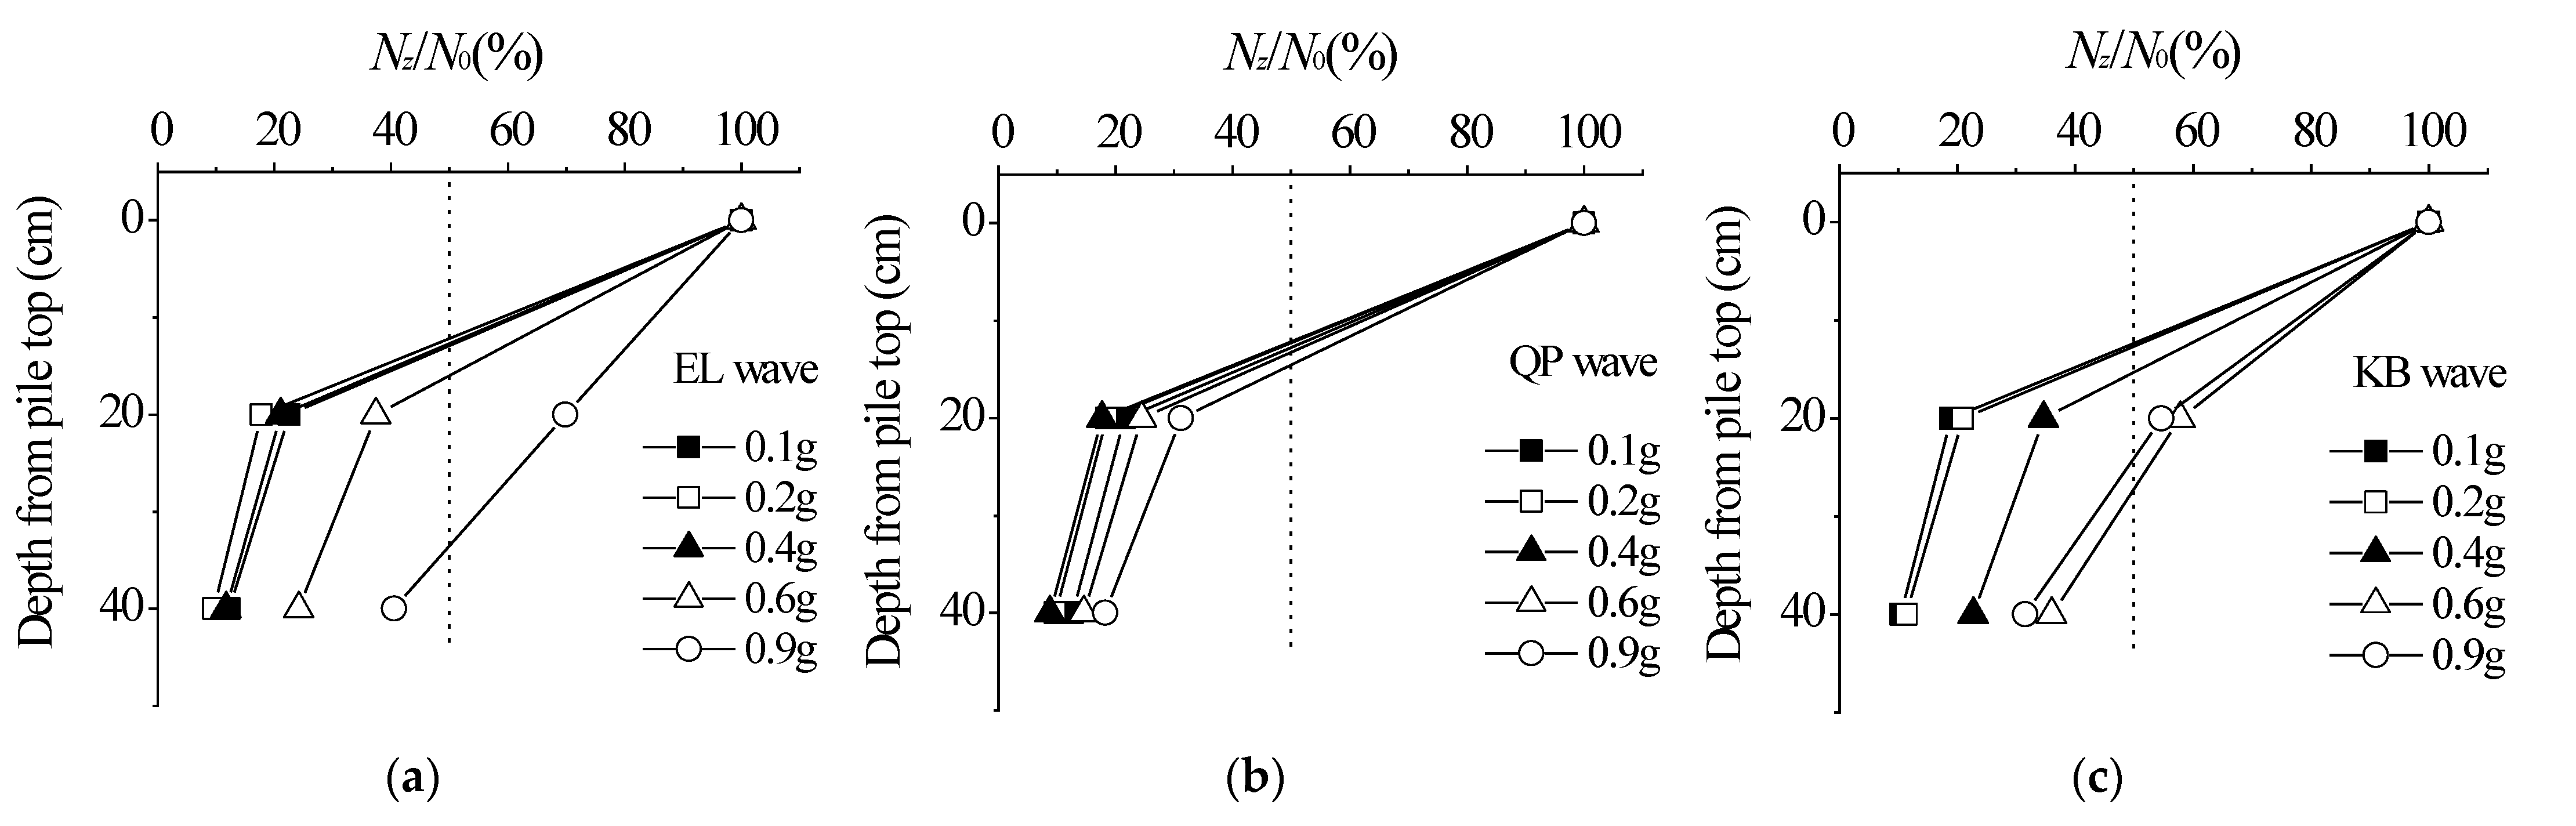
The maximum value of the stress time history curve of the GESC under the excitation of a certain peak value and type of seismic wave was selected. The percentage Nz/N0 of the maximum stress at any position of the pile body to the maximum stress at the top of the pile can be calculated. The distribution of stress percentages along the pile body is shown in Figure 14. Under the excitation of a certain seismic wave, the dynamic stress decayed rapidly from the top to the bottom of the pile. For example, under the excitations of the EL, QP and KB waves of 0.1~0.4 g, when the dynamic stress was transferred from the pile top to 20 cm below the pile top, the dynamic stress decreased by 60~85%. Under static loading, there was almost no change in stress when the pile top force was transferred to 20 cm below the pile top (see Figure 7). This finding indicates that the attenuation rate of dynamic stress along the pile body under earthquake conditions is much faster than that under static loading. It may be that the pile soil interaction is stronger under the earthquake conditions.
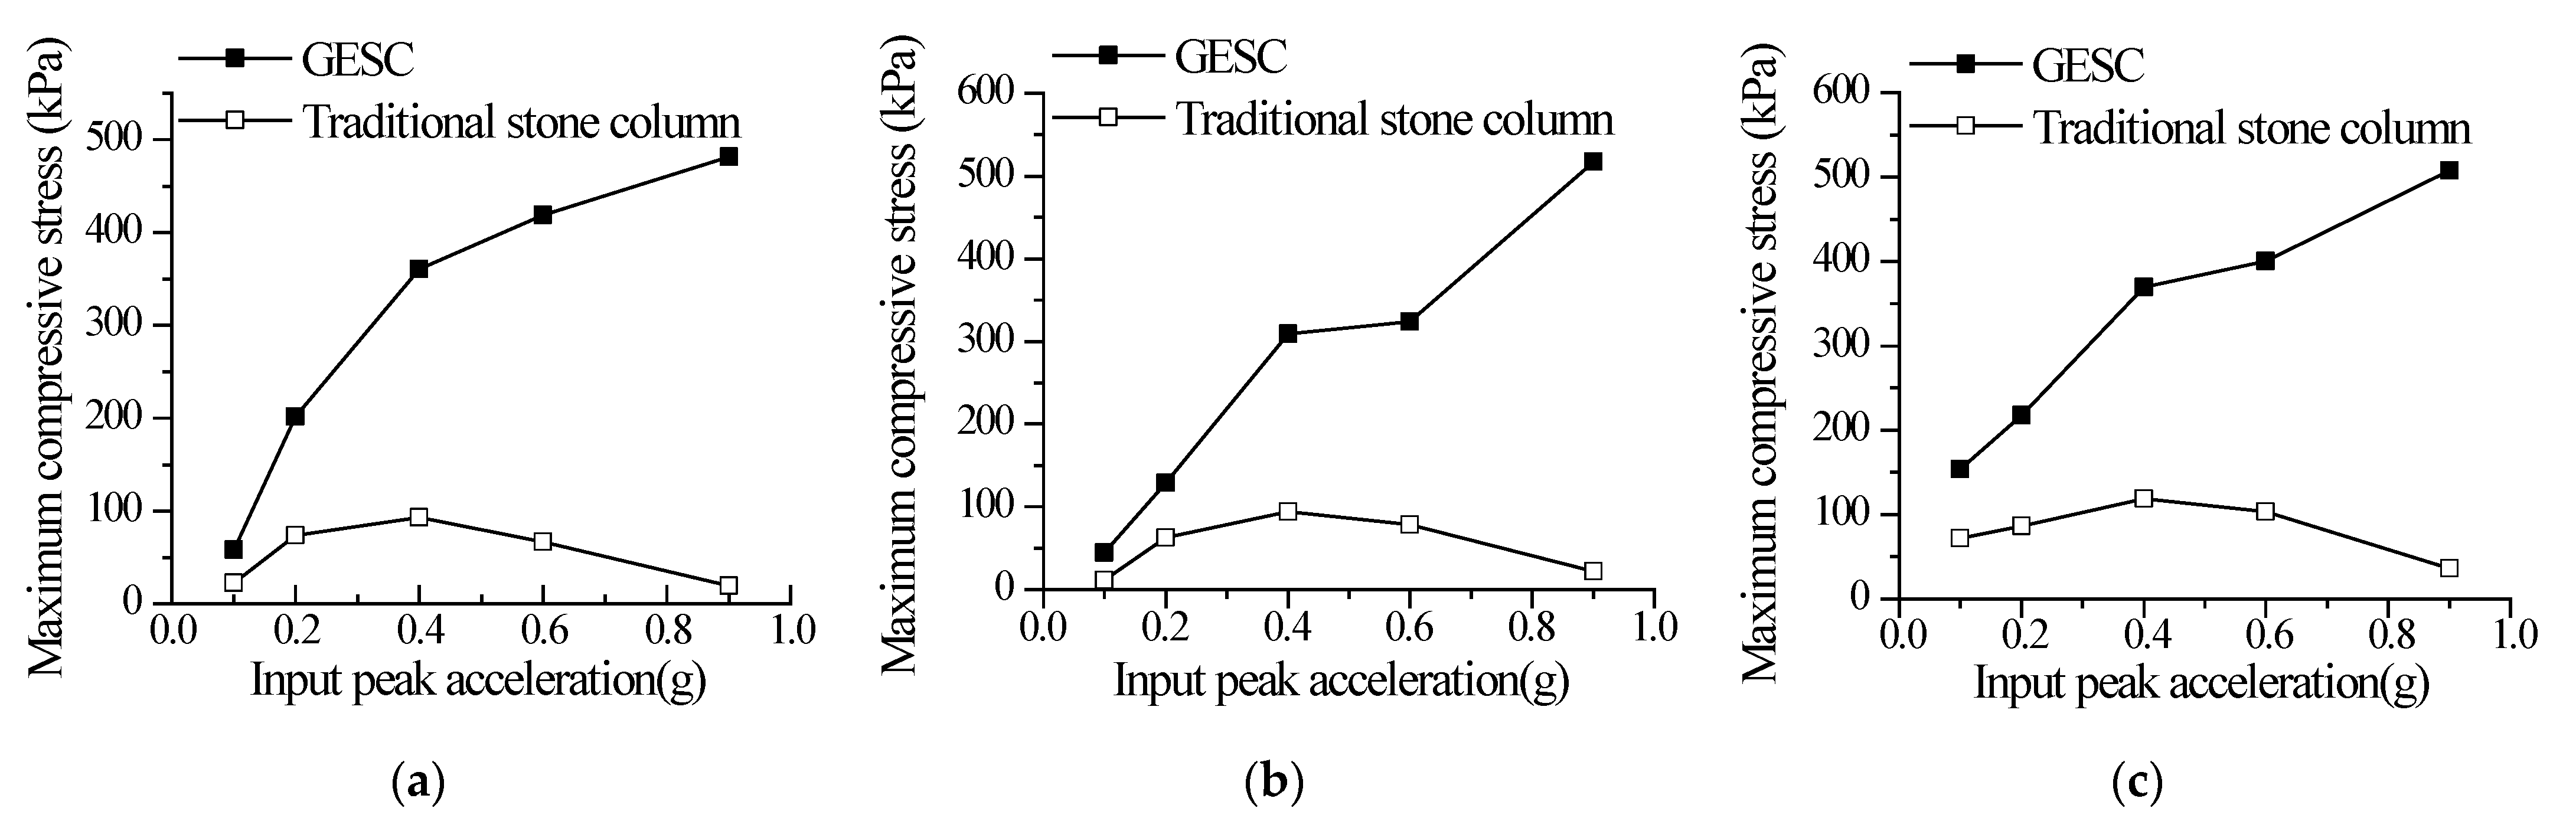
From the above analysis, it should be noted that the compressive stress at the top position of the GESC is larger, which also indicates that damage is more likely to occur at this position. In order to analyze the change in axial stiffness at the pile top position during seismic excitation, the change curves of the maximum compressive stresses at the top of the GESC and the traditional stone column with the input peak acceleration were plotted, as shown in Figure 15. Under the seismic excitations with different input peak accelerations, the absolute value of compressive stress in the GESC was greater than that in the traditional stone column. This is because the GESC is restrained by the sleeve and the pile stiffness is larger, so the stress concentration at the pile top is larger. Under the excitations of different seismic waves, the compressive stress at the top of the GESC increases with the increase of the input peak acceleration. When the input peak acceleration was greater than or equal to 0.4 g, the increase speed of the compressive stress at the top of the GESC decreased. This is because the stiffness of the GESC decreases with the increase of the input peak acceleration, so the increase speed decreases. For the traditional stone column, when the input peak acceleration was 0.1~0.4 g, the compressive stress at the pile top increased with the increase of the input peak acceleration. However, when the input peak acceleration was 0.6 g and 0.9 g, the compressive stress at the pile top decreased with the increase of the input peak acceleration. It may be that under the excitation of the 0.4 g KB wave, the top of the traditional stone column was damaged in the process of vibration, resulting in the reduction of its stiffness. However, since the top of the GESC was not damaged under the earthquake conditions, the maximum compressive stress did not decrease with the increase of the input peak acceleration.
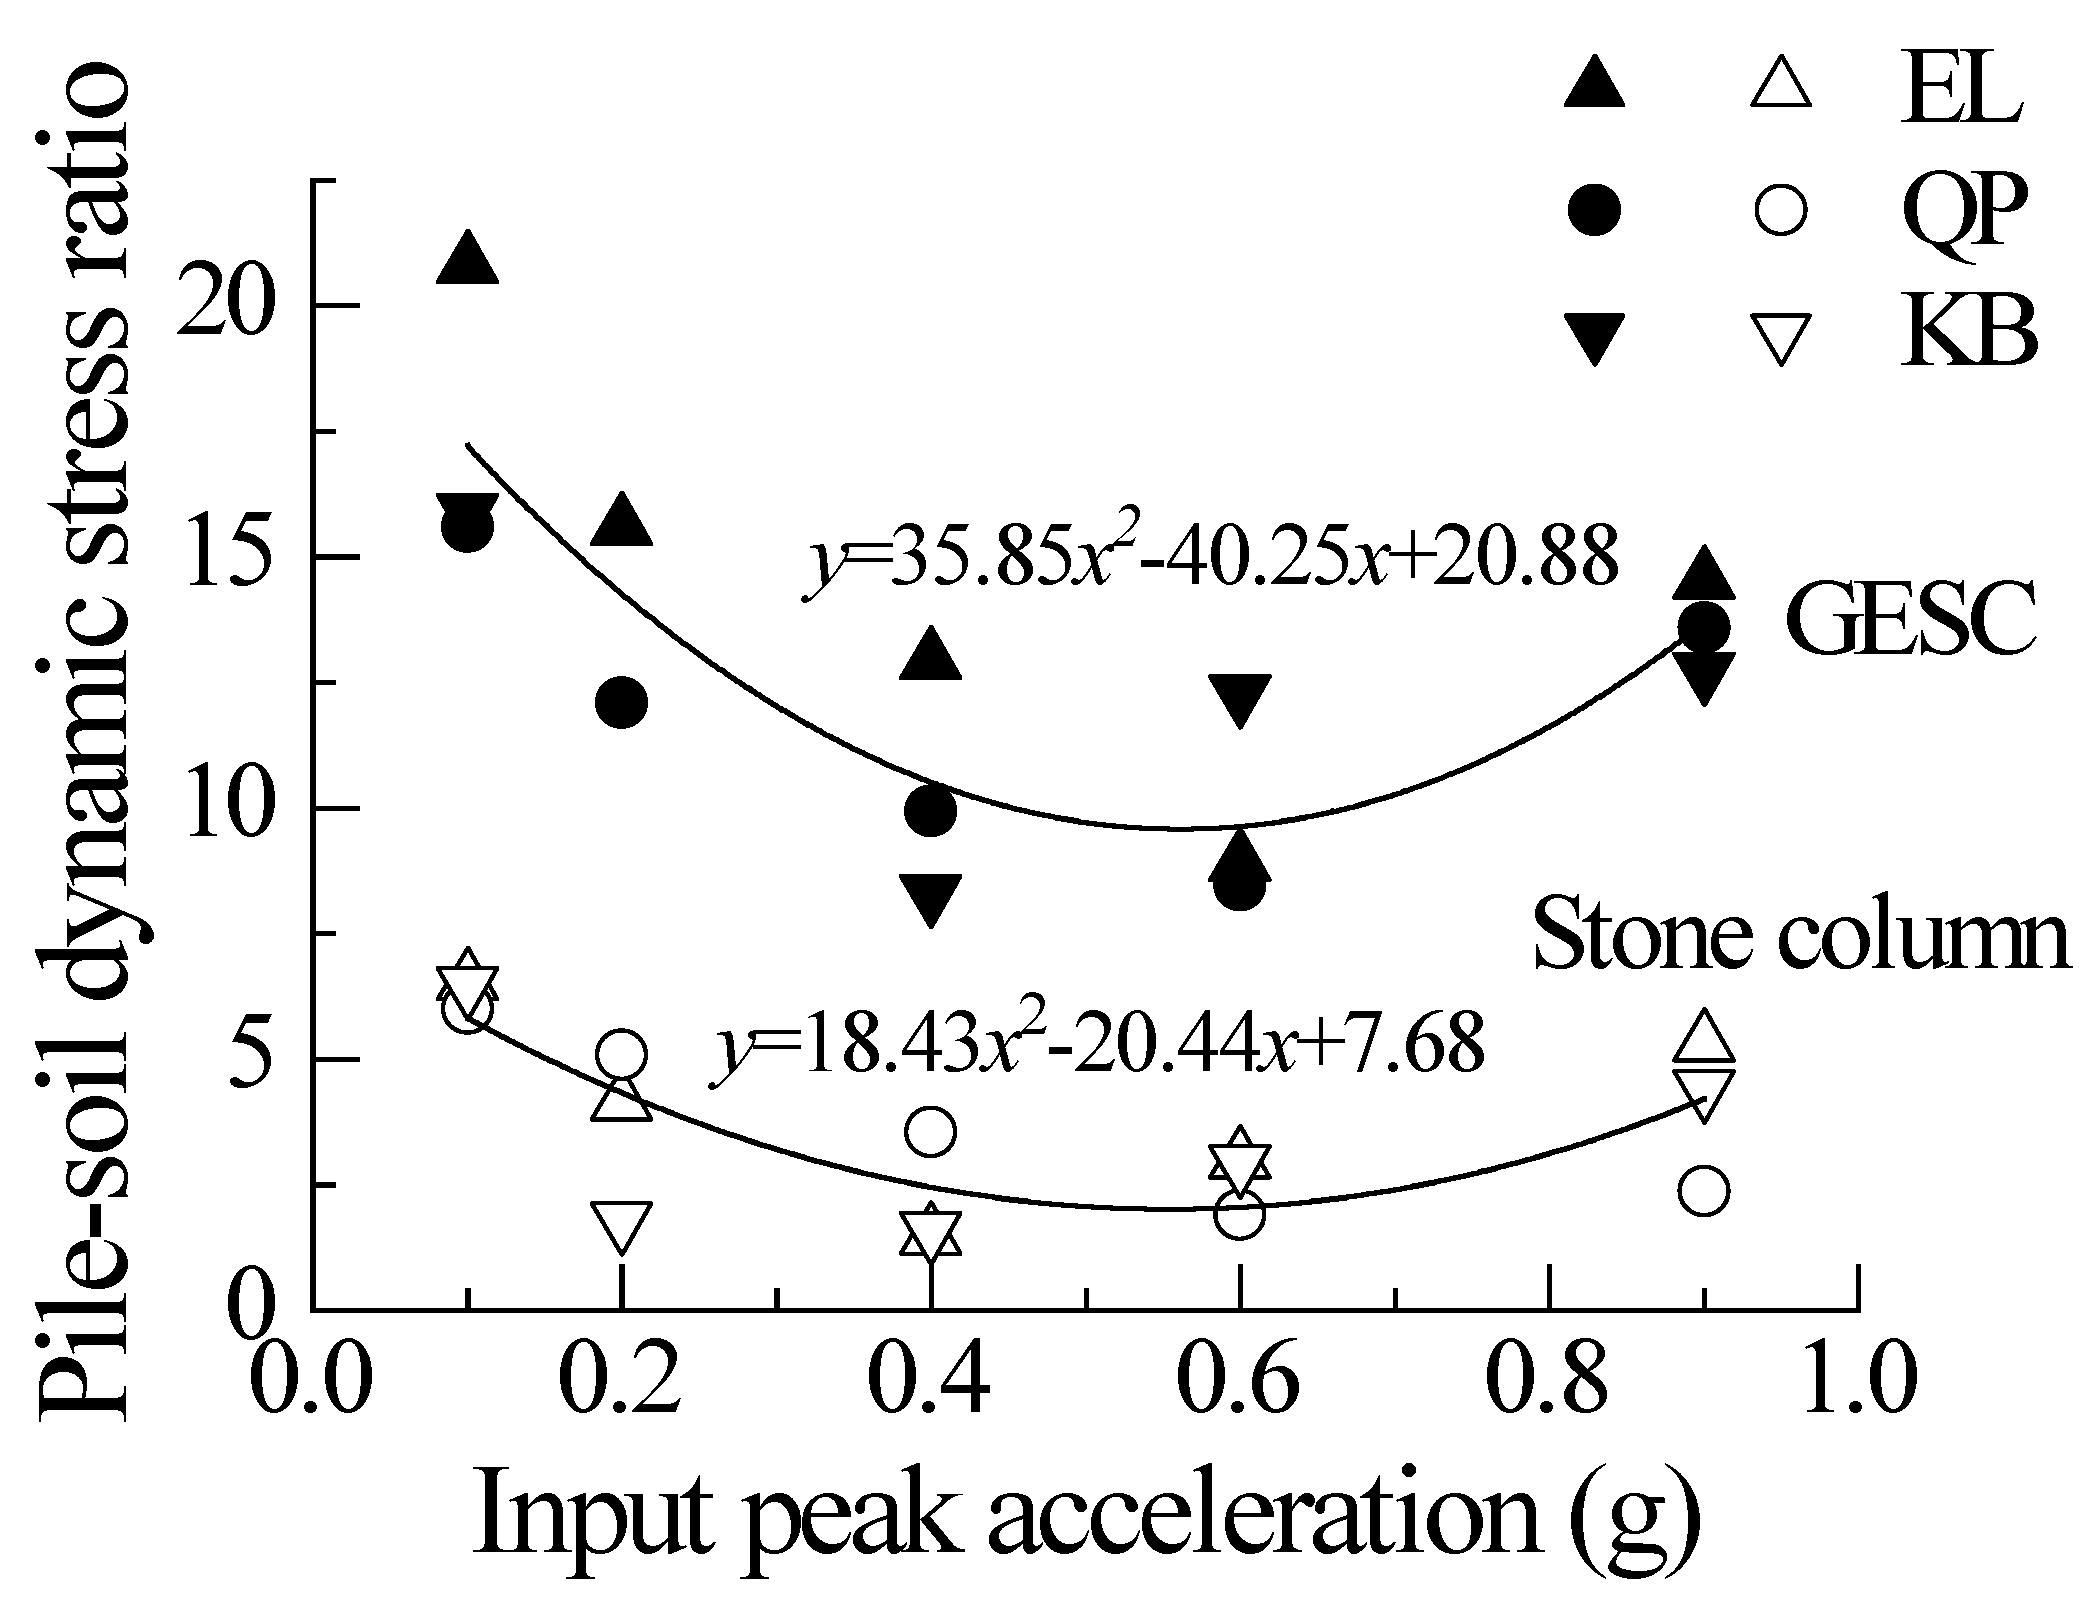
5.2. Dynamic Pile-Soil Stress Ratio
Since the top surface of the pile and the top surface of the soil between the piles were on the same horizontal plane, under the model test conditions, the stresses of the pile and soil basically reached the maximum at the same time point. The maximum stresses of Point H1 on the top surface of the GESC and Point H4 on the top surface of the soil between the piles are used to calculate the maximum stress ratio of the pile and soil, which is defined as the dynamic pile-soil stress ratio. The dynamic stress ratio does not consider the static effect, but only considers the dynamic stress change caused by the earthquake, reflecting the sharing effect of the pile and soil on dynamic stress when the vertical dynamic effect of the composite foundation surface is at maximum. Under different excitation conditions, the change in the dynamic pile-soil stress ratio of the GESC and the traditional stone column with the input peak acceleration is shown in Figure 16. The dynamic pile-soil stress ratios of the GESC and the traditional stone column first decreased and then slightly increased with the increase of the input peak acceleration. Under the excitation of the 0.4 g EL, QP and KB seismic waves, the dynamic pile-soil stress ratios of the GESC and the traditional stone column were relatively small. Under the excitations of the 0.1~0.9 g seismic wave, the dynamic pile-soil stress ratio of the GESC is in the range of 8~21, and the dynamic pile-soil stress ratio of the traditional stone column is in the range of 1.6~6.5. Under the excitation of the same peak and type of seismic wave, the dynamic pile-soil stress ratio of the GESC is about three times that of the traditional stone column. The geosynthetic material enhances the tensile and shear strength of the composite foundation’s soil mass through a reinforcement effect [27,28].
5.3. Horizontal Stress at Pile Side
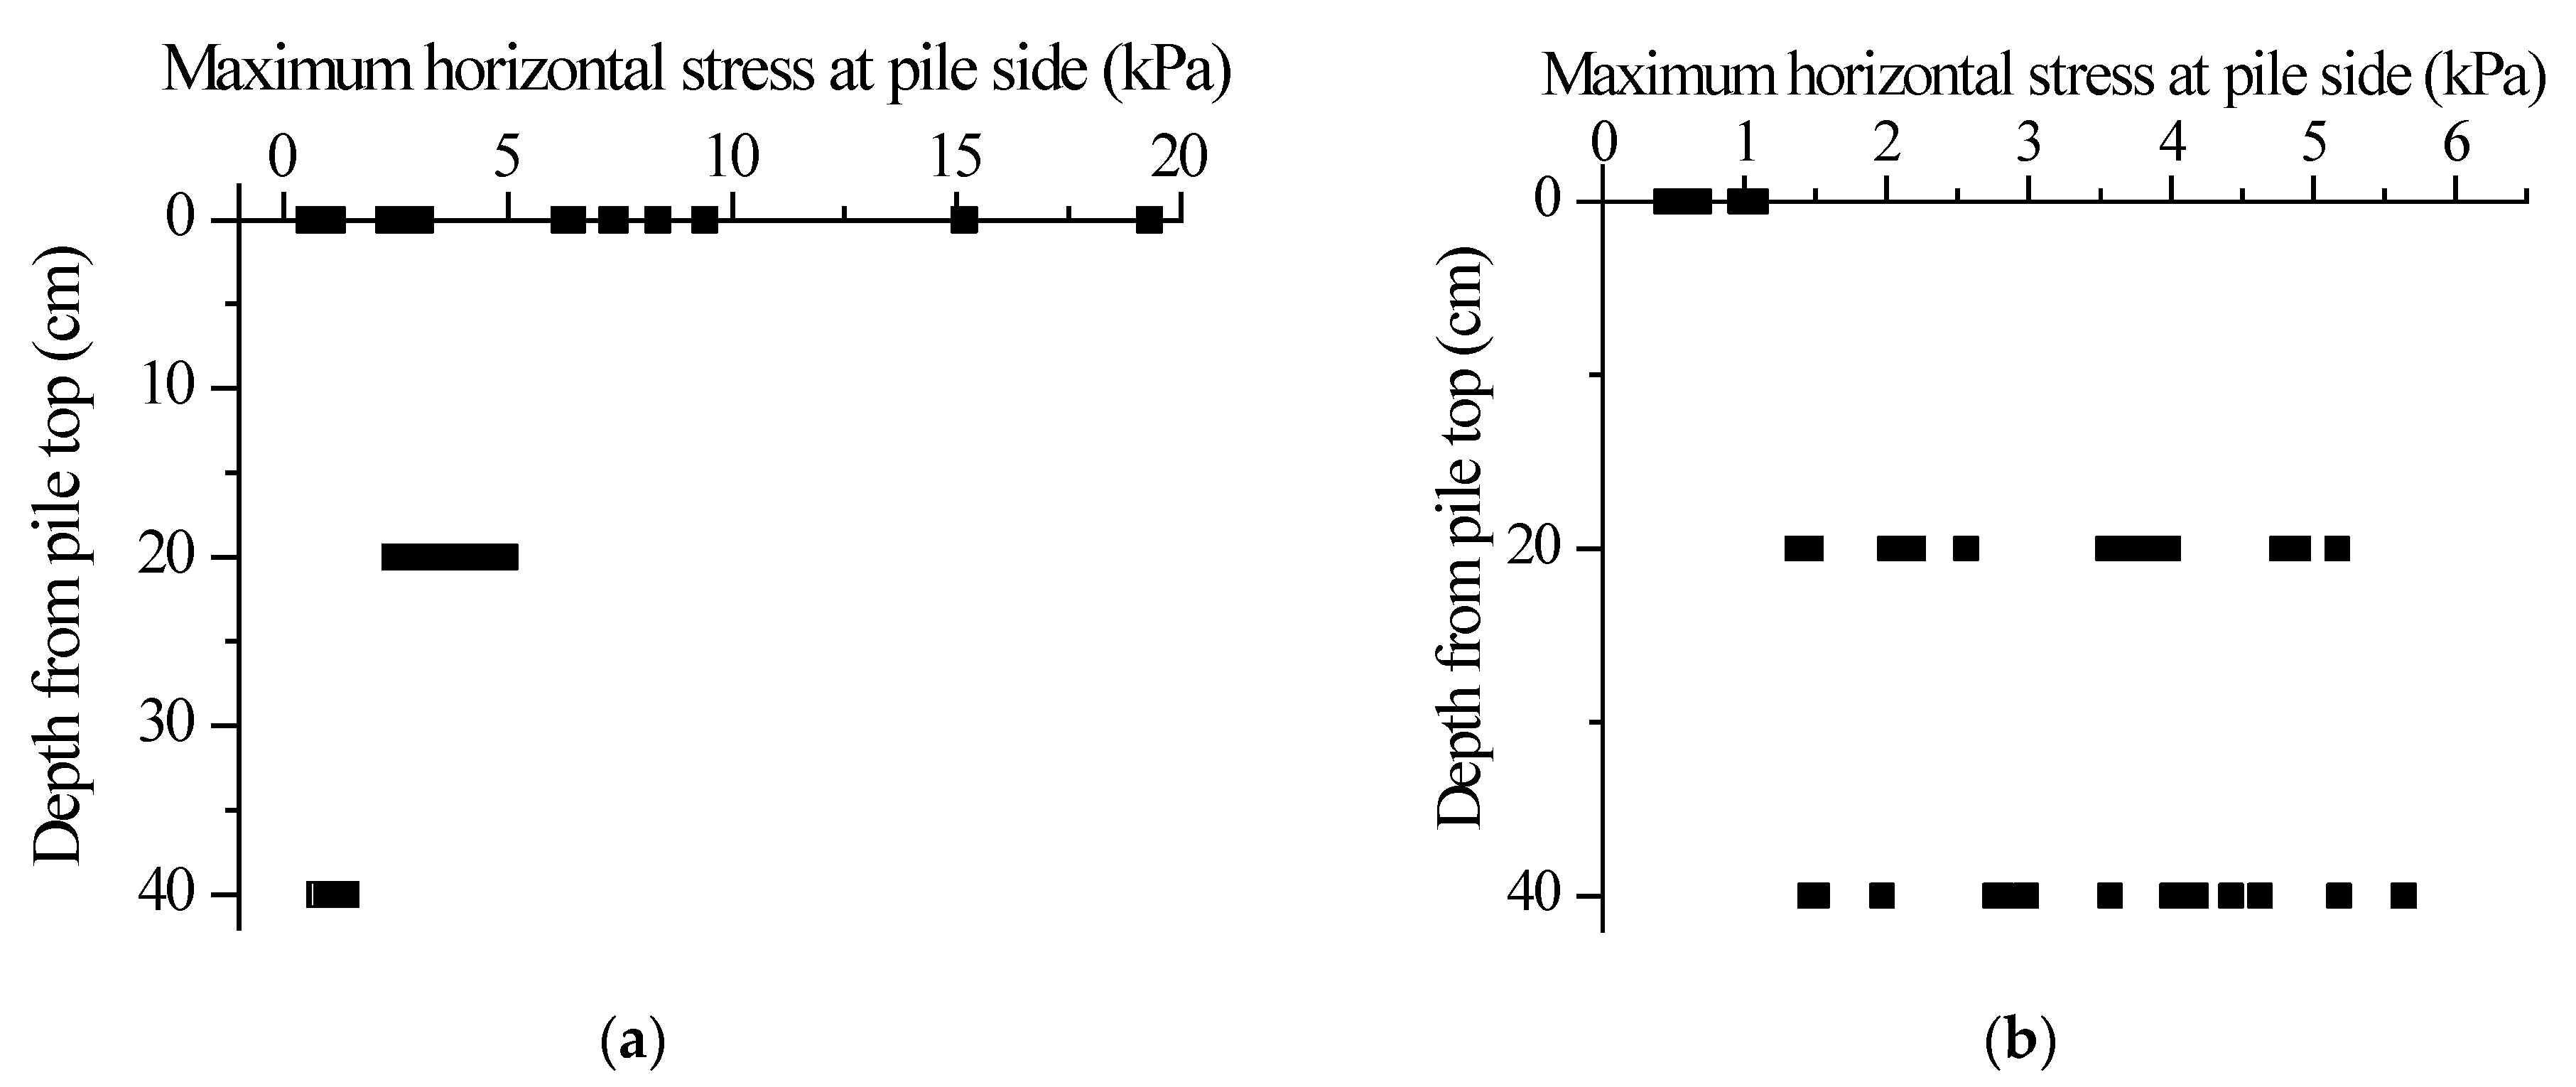
Under the RG, EL, QP, KB seismic excitations with the amplitudes of 0.1 g, 0.2 g and 0.4 g, the maximum horizontal stress distribution at the sides of the GESC and the traditional stone column is shown in Figure 17. The horizontal stress at the side of the GESC presents a triangular shape with a large top and a small bottom. The maximum compressive stress at the pile top is the largest, and the maximum value can reach 18.5 kPa. This is because the confining pressure stress on the upper part of the pile is smaller, and the pile and soil are not close enough, so the movement interaction between the pile and soil is larger. At the depth of 40 cm, the horizontal stress at the pile side of the GESC is close to zero. The maximum horizontal stress at the top of the traditional stone column is small, and the value is almost zero. As the stone column is made of loose materials, it is highly dependent on the surrounding soil, and the soil mass at the top of the pile provides less confining pressure stress. Therefore, the rigidity of the top of the pile is smaller, and the gravel in the top of the pile moves together with the soil mass, and the interaction between them is smaller. When the depth is increased, the confining pressure stress provided by the soil around the pile increases, the pile stiffness increases, and the interaction between the pile and soil increases. The standard ranges of maximum horizontal stresses of the GESC and the TSC are 0~6 kPa and 0~20 kPa, respectively.
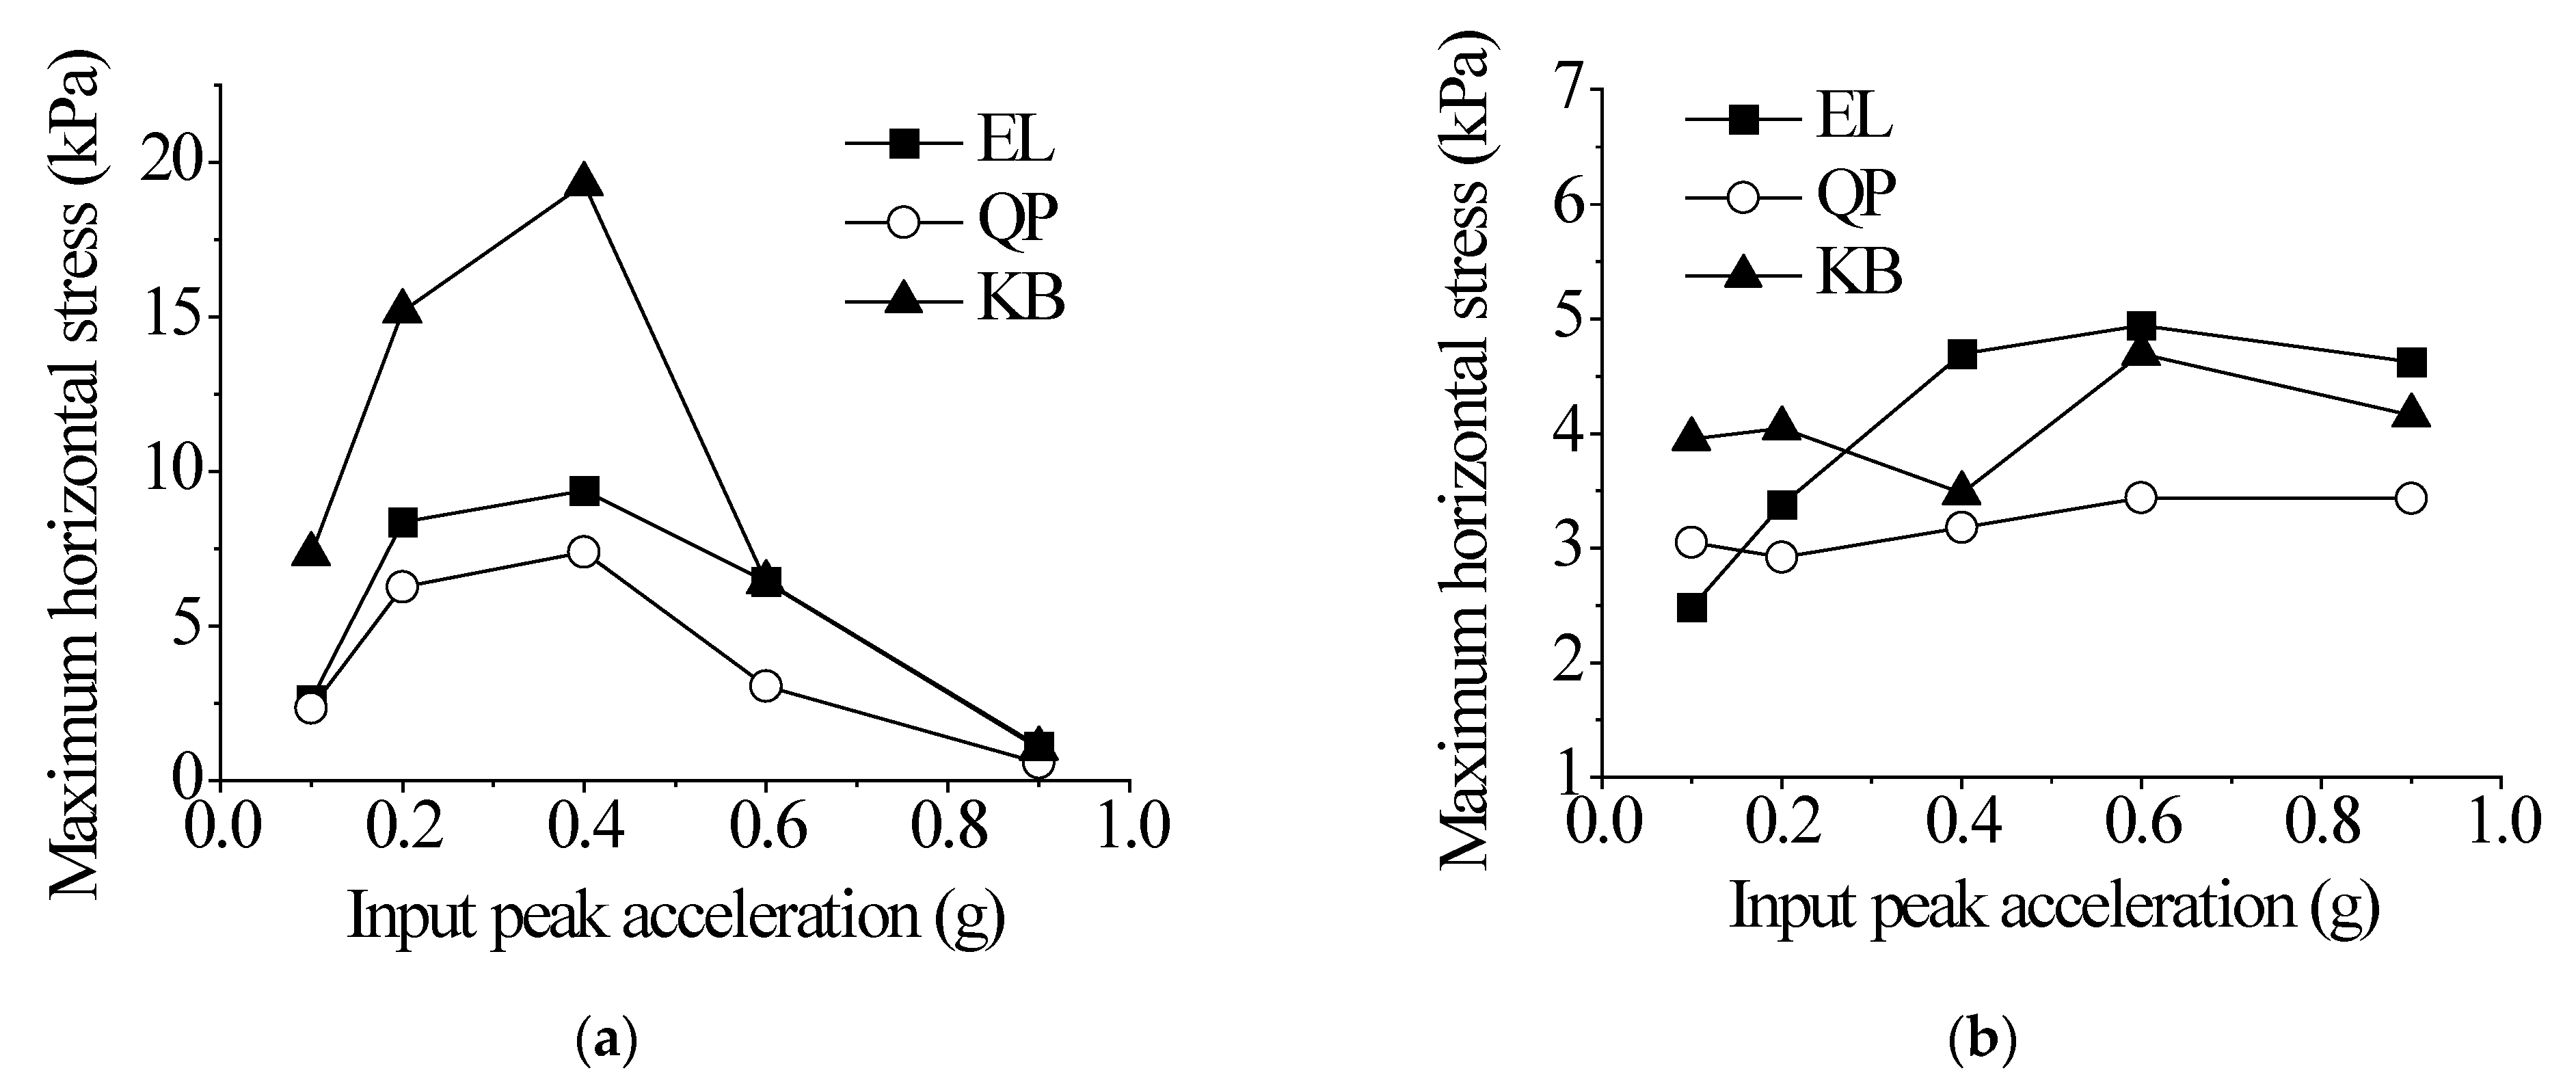
From the above analysis, it should be noted that the horizontal stress at the top of the GESC and at the depth of 20 cm below the pile top is relatively large. Therefore, the maximum horizontal stresses at the above positions with the input peak acceleration are shown in Figure 18. Under the excitations of different types of seismic waves, with the increase of the input peak acceleration, the horizontal stress at the pile top first increases, reaches the maximum value when the input peak acceleration is 0.4 g, and then the horizontal stress at the pile top decreases. Under the excitations of the EL, QP and KB waves with the amplitude of 0.9 g, the horizontal stress at the pile top is almost zero. The reduction of the horizontal stress at the pile top indicates that the shear strength of the top of the GESC is reduced. For the depth of 20 cm below the pile top, with the increase of the input peak acceleration, the horizontal stress at the pile side increases slightly, at first, and then tends to be stable (under the excitations with amplitudes of 0.6~0.9 g).
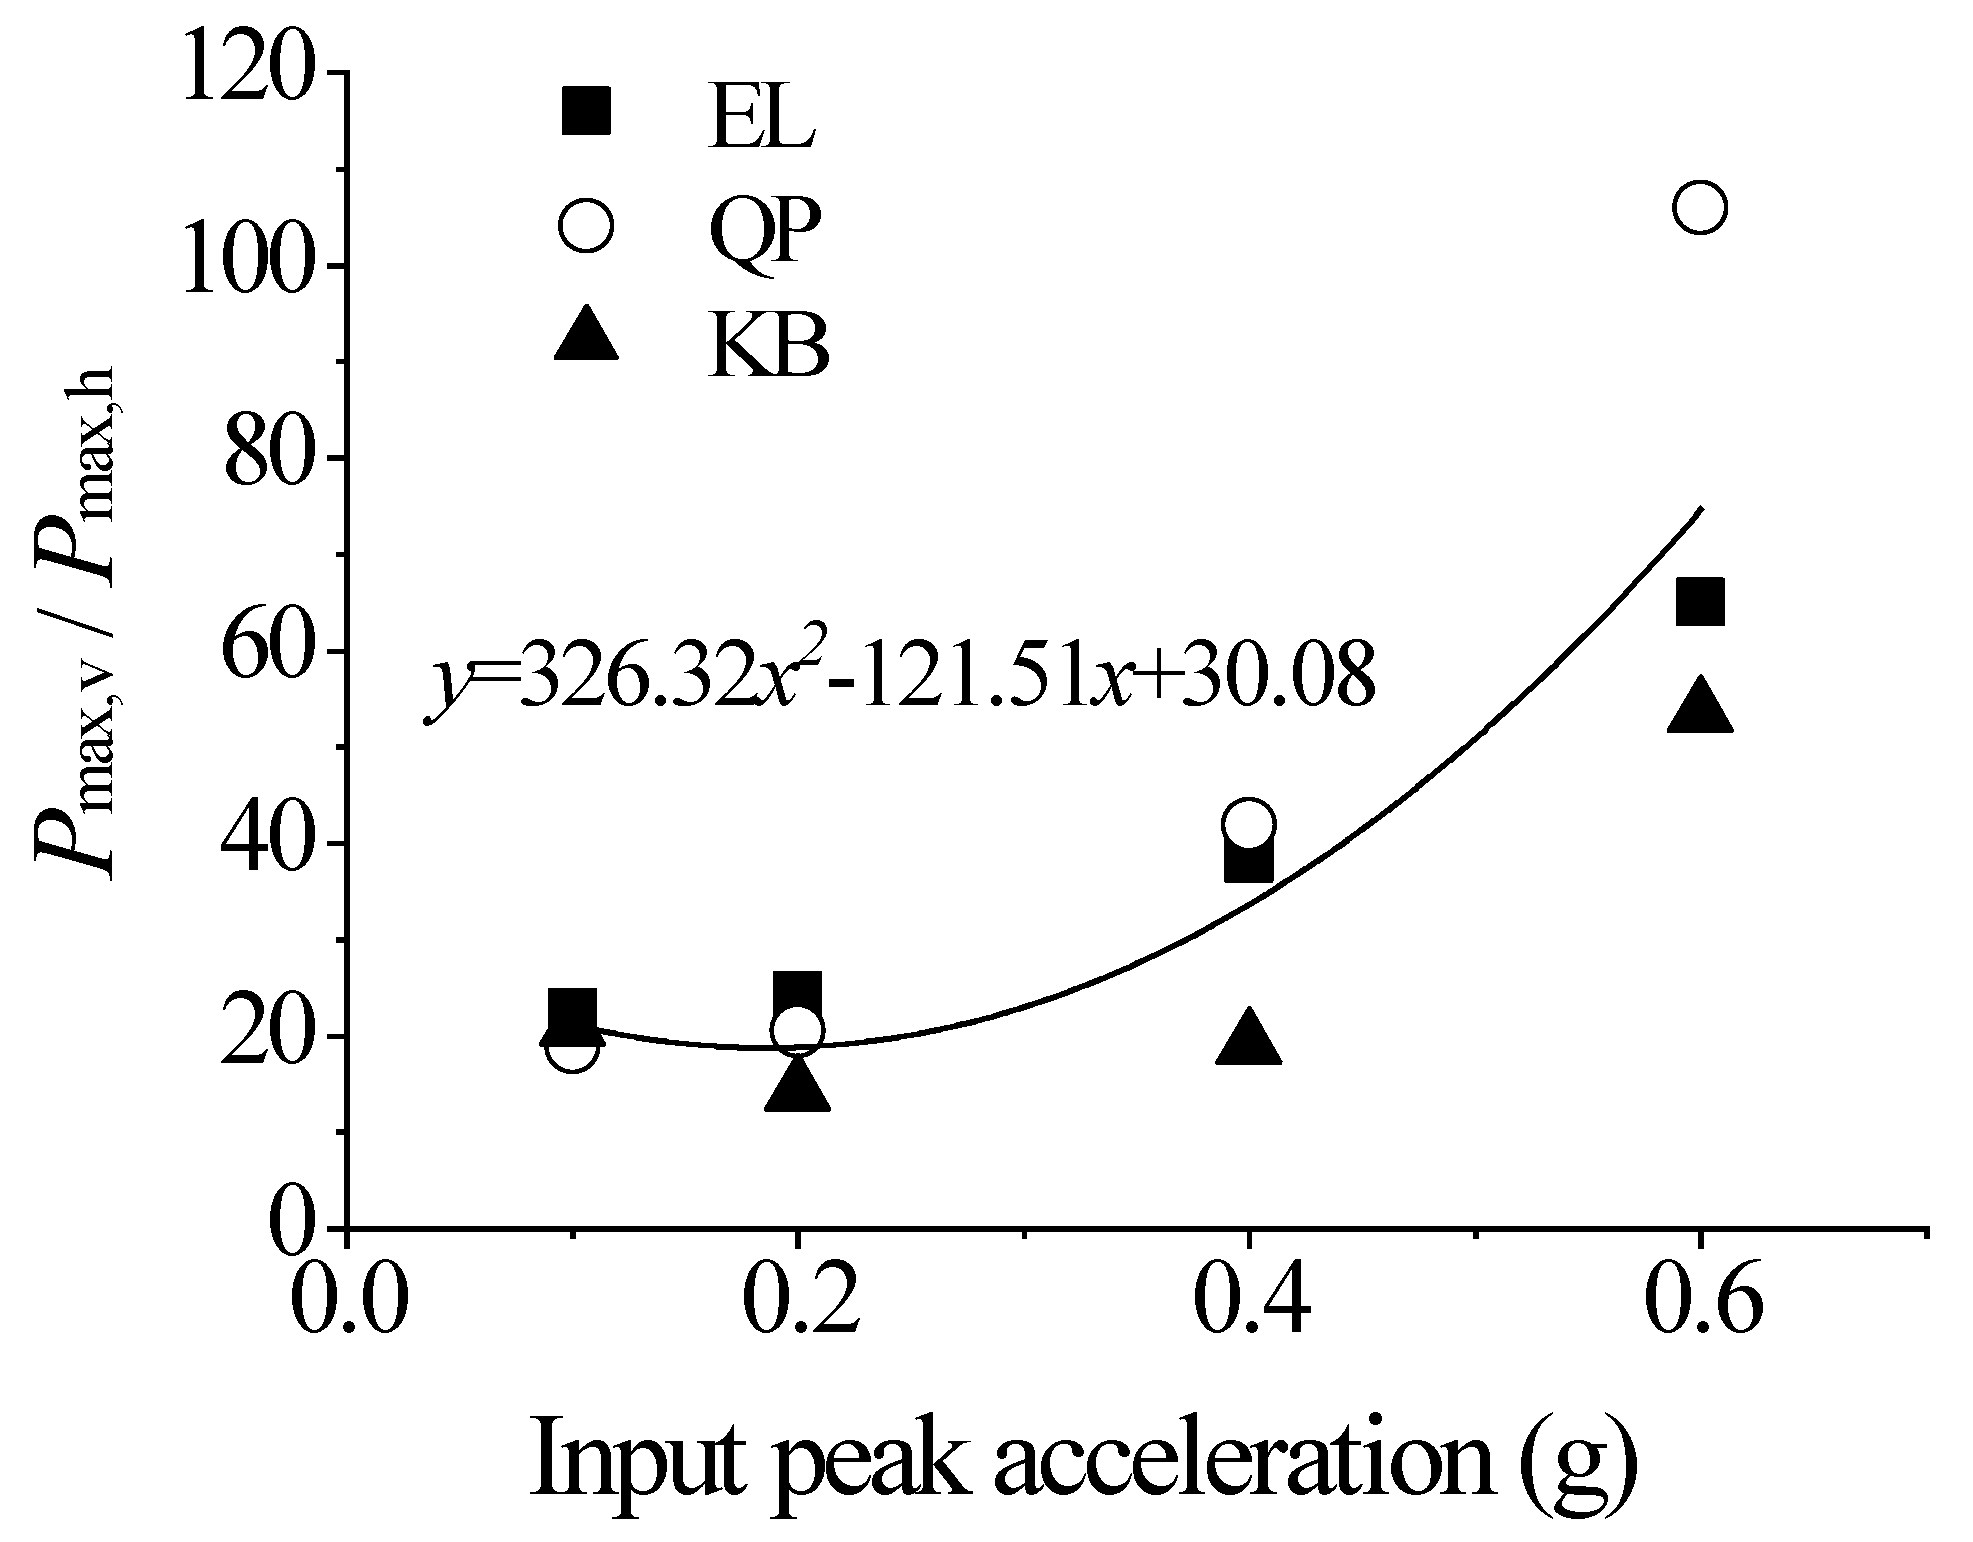
To compare the relative magnitude of vertical stress and horizontal stress, the ratios of the maximum vertical stress (Pmax,v) to the maximum horizontal stress (Pmax,h) at the top of the GESC under excitations with amplitudes of 0.1 g, 0.2 g, 0.4 g and 0.6 g, are shown in Figure 19. Under excitation with the amplitude of 0.9 g, the maximum vertical pressure was much larger than the maximum horizontal pressure, which covers other data, so it is not listed in the figure. Under excitations with the amplitudes of 0.1 g and 0.2 g, the maximum vertical stress was about 20 times the maximum horizontal stress, and the ratio increased with the increase of the input peak acceleration. This is mainly because the inertial action of the superstructure increases the vertical dynamic stress response at the top of the GESC. This finding also shows that when there is a structure on the surface of the composite foundation reinforced by the GESC, and the acceleration in the horizontal and vertical directions is input at the bottom, the horizontal interaction between the pile and the soil is extremely small compared with the vertical stress response at the pile top. The static and dynamic load transfer behaviors of the traditional stone column and the GESC are changing with time under the action of superstructure load. Since this study is a model experiment with short-term mechanical behavior, in further studies, attention should be paid to the long-term mechanical behavior of composite foundations reinforced by the GESC in actual projects. In addition, the soil material parameters vary with depth in actual projects, and the influence of soil inhomogeneity on the static and dynamic properties of composite foundations reinforced by the GESC should also be considered.
6. Conclusions
Static load tests of a fully geosynthetic-encased stone column (FGESC), partially geosynthetic-encased stone column (PGESC) and traditional stone column (TSC) were carried out, and the static stress transfer behavior of a geosynthetic-encased stone column (GESC) was studied through the tests. Based on large-scale shaking table model tests of a composite foundation with the GESC and a composite foundation with the TSC, the dynamic stress transfer behavior of the two kinds of composite foundations under different excitations were investigated. The main conclusions are as follows:
- In soft clay foundations, the GESC has greater advantages concerning bearing capacity than the TSC. The pile-soil stress ratio of fully geosynthetic-encased stone column with a tensile strength of geotextile of 11 kN/m is 22~27, the pile-soil stress ratio of fully geosynthetic-encased stone column with a tensile strength of geotextile of 43 kN/m is 29~34, the pile-soil stress ratio of partially geosynthetic-encased stone column with a tensile strength of geotextile of 43 kN/m is 11~19, and the pile-soil stress ratio of a traditional stone column is 3~7.
- For the FGESC with different geomaterial tensile strengths, negative frictional resistance may occur at a depth of about 2D from the top of the pile. Approximately 80% of the pile top force is transferred to 4D depth and about 60% of the pile top force is transferred to the bottom end of the pile. For the PGESC with a tensile strength of geotextile of 43 kN/m, the pile top force transferred to the 4D depth is slightly less than that of the FGESC, and about 40~60% of the pile top force is transferred to the bottom end of the pile. For the TSC, about 27~45% of the pile top force is transferred to the bottom end of the pile.
- The maximum horizontal soil pressures around the pile perimeter for the GESC and the TSC occur near the 2D depth. In the depth range of 4D from the top of the pile, the horizontal earth pressure around the GESC is less than that around the TSC. At the depth below the sleeve of the PGESC, the horizontal stress of the PGESC is greater than those of the FGESC and TSC. This is related to the stress transfer and the difference in stiffness between the upper and lower parts of the PGESC.
- The dynamic pile-soil stress ratios of the GESC and the TSC first decrease and then increase slightly with the increase of the input peak acceleration. The dynamic pile-soil stress ratio of the GESC is in the range of 8~21. The upper part of the GESC bears a larger shear stress, while the middle and lower parts of the TSC bear a larger shear stress. The dynamic pile-soil stress ratio of the GESC is about three times that of the TSC under seismic excitation with the same type and peak acceleration. The attenuation rate of dynamic stress along the pile body under dynamic loading is much faster than that under static loading.
Author Contributions
Conceptualization, M.L. and K.W.; methodology, F.O. and J.N.; data curation, M.L. and F.O.; writing—original draft preparation, J.N.; writing—review and editing, K.W.; visualization, J.N.; supervision, F.O. All authors have read and agreed to the published version of the manuscript.
Funding
This research was funded by the Research Project of CSCEC Road and Bridge Group Co., Ltd. (Grant no. ZJLQ—XNKJ-001).
Institutional Review Board Statement
Not applicable.
Informed Consent Statement
Not applicable.
Data Availability Statement
Not applicable.
Conflicts of Interest
The authors declare no conflict of interest.
References
- Guetif, Z.; Bouassida, M.; Debats, J.M. Improved soft clay characteristics due to stone column installation. Comput. Geotech. 2007, 34, 104–111. [Google Scholar] [CrossRef]
- Gniel, J.; Bouazza, A. Improvement of soft soils using geogrid encased stone columns. Geotext. Geomembr. 2009, 27, 167–175. [Google Scholar] [CrossRef]
- Miranda, M.; Da Costa, A. Laboratory analysis of encased stone columns. Geotext. Geomembr. 2016, 44, 269–277. [Google Scholar] [CrossRef]
- McKenna, J.M.; Eyre, W.A.; Wolstenholme, D.R. Performance of an embankment supported by stone columns in soft ground. Geotechnique 1975, 25, 51–59. [Google Scholar] [CrossRef]
- Van Impe, W.F. Soil Improvement Techniques and Their Evolution; Balkema: Rotterdam, The Netherlands, 1989. [Google Scholar]
- Gu, M.; Zhao, M.; Zhang, L.; Han, J. Effects of geogrid encasement on lateral and vertical deformations of stone columns in model tests. Geosynth. Int. 2016, 23, 100–112. [Google Scholar] [CrossRef] [Green Version]
- Grizi, A.; Al-Ani, W.; Wanatowski, D. Numerical analysis of the settlement behavior of soft soil improved with stone columns. Appl. Sci. 2022, 12, 5293. [Google Scholar] [CrossRef]
- Yoo, C. Settlement behavior of embankment on geosynthetic-encased stone column installed soft ground-a numerical investigation. Geotext. Geomembr. 2015, 43, 484–492. [Google Scholar] [CrossRef]
- Almeida, M.S.S.; Hosseinpour, I.; Riccio, M. Performance of a geosynthetic-encased column (GEC) in soft ground: Numerical and analytical studies. Geosynth. Int. 2013, 20, 252–262. [Google Scholar] [CrossRef]
- Murugesan, S.; Rajagopal, K. Studies on the behavior of single and group of geosynthetic encased stone columns. J. Geotech. Geoenvironmental Eng. 2010, 136, 129–139. [Google Scholar] [CrossRef]
- Lo, S.R.; Zhang, R.; Mak, J. Geosynthetic-encased stone columns in soft clay: A numerical study. Geotext. Geomembr. 2010, 28, 292–302. [Google Scholar] [CrossRef]
- Yoo, C. Performance of geosynthetic-encased stone columns in embankment construction: Numerical investigation. J. Geotech. Geoenvironmental Eng. 2010, 136, 1148–1160. [Google Scholar] [CrossRef]
- Castro, J. Modeling stone columns. Materials 2017, 10, 782. [Google Scholar] [CrossRef] [Green Version]
- Esameldin, F.R.; Zalihe, N. Behavior of geotextile encased single stone column in soft soils. Arab. J. Sci. Eng. 2020, 45, 3877–3890. [Google Scholar]
- Ou Yang, F.; Zhang, J.J.; Liao, W.M.; Han, J.W.; Tang, Y.L.; Bi, J.B. Characteristics of the stress and deformation of geosynthetic-encased stone column composite ground based on large-scale model tests. Geosynth. Int. 2017, 24, 242–254. [Google Scholar] [CrossRef]
- Almeida, M.S.S.; Hosseinpour, I.; Riccio, M.; Alexiew, D. Behavior of geotextile-encased granular columns supporting test embankment on soft deposit. J. Geotech. Geoenvironmental Eng. 2015, 141, 04014116. [Google Scholar] [CrossRef]
- Hosseinpour, I.; Almeida, M.S.S.; Riccio, M. Full-scale load test and finite-element analysis of soft ground improved by geotextile-encased granular columns. Geosynth. Int. 2015, 22, 428–438. [Google Scholar] [CrossRef]
- Fattah, M.Y.; Zabar, B.S.; Hassan, H.A. Experimental analysis of embankment on ordinary and encased stone columns. Int. J. Geomech. 2016, 16, 04015102. [Google Scholar] [CrossRef]
- Zhang, J.J.; Niu, J.Y.; Fu, X.; Cao, L.C.; Xie, Q. Shaking table test of seismic responses of anchor cable and lattice beam reinforced slope. J. Mt. Sci. 2020, 17, 1251–1268. [Google Scholar] [CrossRef]
- Zhang, J.J.; Niu, J.Y.; Fu, X.; Cao, L.C.; Yan, S.J. Failure modes of slope stabilized by frame beam with prestressed anchors. Eur. J. Environ. Civ. Eng. 2022, 26, 2120–2142. [Google Scholar] [CrossRef]
- Tang, L.; Cong, S.; Ling, X.; Lu, J.; Elgamal, A. Numerical study on ground improvement for liquefaction mitigation using stone columns encased with geosynthetics. Geotex. Geomemb. 2015, 43, 190–195. [Google Scholar] [CrossRef]
- Ou Yang, F.; Fan, G.; Wang, K.F.; Yang, C.; Lyu, W.Q.; Zhang, J.J. A large-scale shaking table model test for acceleration and deformation response of geosynthetic encased stone column composite ground. Geotext. Geomembr. 2021, 49, 1407–1418. [Google Scholar] [CrossRef]
- Nguyen, V.D.; Luo, Q.; Wang, T.F.; Liu, K.W.; Zhang, L.; Nguyen, T.P. Load transfer in geosynthetic-reinforced piled embankments with a triangular arrangement of piles. J. Geotech. Geoenviron. Eng. 2023, 149, 04022131. [Google Scholar] [CrossRef]
- GB/T 50145-2007. Standard for the engineering classification of soil. China Planning Press: Beijing, China, 2008.
- Chaonoi, W.; Shiau, J.; Ngamkhanong, C.; Thongchom, C.; Jamsawang, P.; Keawsawasvong, S. Predicting lateral resistance of piles in cohesive soils. Sustainability 2022, 14, 12940. [Google Scholar] [CrossRef]
- Li, X.; Zhang, J.; Xu, H.; Shi, Z.; Gao, Q. Static Load test and numerical analysis of influencing factors of the ultimate bearing capacity of PHC pipe piles in multilayer soil. Sustainability 2021, 13, 13166. [Google Scholar] [CrossRef]
- Niu, J.Y.; Zhou, Y.Y.; Zhang, J.J.; Duan, D.; Chen, K.P. Tensile strength of root and soil composite based on new tensile apparatus. J. Southwest JiaoTong Univ. 2022, 57, 191–199. [Google Scholar]
- Lu, Y.; Abuel-Naga, H.; Shaia, H.A.; Shang, Z. Preliminary study on the behaviour of fibre-reinforced polymer piles in sandy soils. Buildings 2022, 12, 1144. [Google Scholar] [CrossRef]
Figure 1.
Composite foundation model reinforced by the GESC (unit: cm).

Figure 2.
Tensile strain relation curve of the sleeve.

Figure 3.
Gravel size grading curve.

Figure 4.
Loading device and measuring equipment for the composite foundation reinforced by the GESC: (a) Installation of the GESC; (b) Loading device after installation.
Figure 4.
Loading device and measuring equipment for the composite foundation reinforced by the GESC: (a) Installation of the GESC; (b) Loading device after installation.

Figure 5.
Layout of the earth pressure box.

Figure 6.
Pile-soil stress ratios of different types of composite foundation.

Figure 7.
Comparison of the axial forces of different piles (under the same settlement): (a) FGESC-11; (b) FGESC-43; (c) PGESC-43; (d) TSC; (e) Settlement S/D = 8%; (f) Settlement S/D = 16%.
Figure 7.
Comparison of the axial forces of different piles (under the same settlement): (a) FGESC-11; (b) FGESC-43; (c) PGESC-43; (d) TSC; (e) Settlement S/D = 8%; (f) Settlement S/D = 16%.

Figure 8.
Comparison of the axial forces of different piles (under different loads): (a) 30 kPa; (b) 43 kPa; (c) 65 kPa.
Figure 8.
Comparison of the axial forces of different piles (under different loads): (a) 30 kPa; (b) 43 kPa; (c) 65 kPa.

Figure 9.
Variation of the horizontal earth pressure of soil around the pile with depth: (a) Settlement S/D = 8%; (b) Settlement S/D = 16%; (c) FGESC-11; (d) FGESC-43; (e) PGESC-43; (f) TSC.
Figure 9.
Variation of the horizontal earth pressure of soil around the pile with depth: (a) Settlement S/D = 8%; (b) Settlement S/D = 16%; (c) FGESC-11; (d) FGESC-43; (e) PGESC-43; (f) TSC.

Figure 10.
Layout of the composite foundation reinforced by the GESC (unit: cm): (a) Plan layout diagram; (b) Elevation layout diagram (Section 1-1).
Figure 10.
Layout of the composite foundation reinforced by the GESC (unit: cm): (a) Plan layout diagram; (b) Elevation layout diagram (Section 1-1).

Figure 11.
Layout diagram of a dynamic earth pressure box (unit: cm): (a) Section 1-1; (b) Section 2-2; (c) The earth pressure box was buried on top of the pile.

Figure 12.
Time history curves of the input seismic waves: (a) RG wave; (b) EL wave; (c) QP wave; (d) KB wave.
Figure 12.
Time history curves of the input seismic waves: (a) RG wave; (b) EL wave; (c) QP wave; (d) KB wave.


Figure 13.
Time history curves of the axial dynamic stress of the GESC: (a) Pile top; (b) 20 cm below pile top; (c) 40 cm below pile top.
Figure 13.
Time history curves of the axial dynamic stress of the GESC: (a) Pile top; (b) 20 cm below pile top; (c) 40 cm below pile top.

Figure 14.
Maximum compressive stress of the GESC under different seismic waves: (a) EL wave; (b) QP wave; (c) KB wave.
Figure 14.
Maximum compressive stress of the GESC under different seismic waves: (a) EL wave; (b) QP wave; (c) KB wave.

Figure 15.
Maximum compressive stresses at the top of the GESC and the traditional stone column under different seismic waves: (a) EL wave; (b) QP wave; (c) KB wave.
Figure 15.
Maximum compressive stresses at the top of the GESC and the traditional stone column under different seismic waves: (a) EL wave; (b) QP wave; (c) KB wave.

Figure 16.
Variation of the dynamic pile-soil stress ratio with input peak acceleration.

Figure 17.
Maximum horizontal stresses at the pile side of two types of piles: (a) GESC; (b) Traditional stone column.
Figure 17.
Maximum horizontal stresses at the pile side of two types of piles: (a) GESC; (b) Traditional stone column.

Figure 18.
Variation of maximum horizontal stress of the GESC with the input peak acceleration: (a) Pile top; (b) Depth of 20 cm below the pile top.
Figure 18.
Variation of maximum horizontal stress of the GESC with the input peak acceleration: (a) Pile top; (b) Depth of 20 cm below the pile top.

Figure 19.
Ratio of the maximum vertical stress to the maximum horizontal stress.


Table 1.
Test conditions.
| Test Conditions | Pile Diameter D (cm) | Pile Length l (cm) | 5% Secant Modulus (kN/m2) | Sleeve Length |
|---|---|---|---|---|
| FGESC-11 | 10 | 65 | 95 | l |
| FGESC-43 | 10 | 65 | 200 | l |
| PGESC-43 | 10 | 65 | 200 | 0.6l |
| TSC | 10 | 65 | 0 | 0 |
Table 2.
Comparison of pile-soil stress ratio of different types of composite foundation.
| S/D | Pile-Soil Stress Ratio | |||
|---|---|---|---|---|
| FGESC-11 | FGESC-43 | PGESC-43 | TSC | |
| 5% | 26.68 | 33.52 | 17.96 | 6.83 |
| 8% | 24.85 | 32.15 | 16.39 | 6.24 |
| 16% | 22.66 | 31.21 | 12.64 | 5.13 |
Table 3.
Percentage of axial force transmission of different types of piles.
| Different Depths/cm | FGESC-11 | FGESC-43 | PGESC-43 | TSC | ||||
|---|---|---|---|---|---|---|---|---|
| Min | Max | Min | Max | Min | Max | Min | Max | |
| 20 | 95.72 | 107.71 | 87.14 | 107.14 | - | - | - | - |
| 40 | 80.54 | 87.59 | 78.22 | 87.99 | 74.43 | 86.64 | - | - |
| 65 | 54.27 | 63.19 | 54.94 | 68.03 | 40.45 | 60.18 | 27.39 | 45.42 |
Table 4.
Material parameters of the sand.
| Type | Natural Density (kg/m3) | Moisture Content (%) | Dry Density (kg/m3) | Maximum Dry Density (kg/m3) | Minimum Dry Density (kg/m3) | Relative Density | Compactness Type |
|---|---|---|---|---|---|---|---|
| Sand | 1735 | 9.5 | 1584 | 1940 | 1406 | 0.41 | Medium dense |
Disclaimer/Publisher’s Note: The statements, opinions and data contained in all publications are solely those of the individual author(s) and contributor(s) and not of MDPI and/or the editor(s). MDPI and/or the editor(s) disclaim responsibility for any injury to people or property resulting from any ideas, methods, instructions or products referred to in the content. |
© 2023 by the authors. Licensee MDPI, Basel, Switzerland. This article is an open access article distributed under the terms and conditions of the Creative Commons Attribution (CC BY) license (https://creativecommons.org/licenses/by/4.0/).
Share and Cite
MDPI and ACS Style
Liu, M.; Wang, K.; Niu, J.; Ouyang, F. Static and Dynamic Load Transfer Behaviors of the Composite Foundation Reinforced by the Geosynthetic-Encased Stone Column. Sustainability 2023, 15, 1108. https://doi.org/10.3390/su15021108
AMA Style
Liu M, Wang K, Niu J, Ouyang F. Static and Dynamic Load Transfer Behaviors of the Composite Foundation Reinforced by the Geosynthetic-Encased Stone Column. Sustainability. 2023; 15(2):1108. https://doi.org/10.3390/su15021108
Chicago/Turabian StyleLiu, Mengjie, Kaifeng Wang, Jiayong Niu, and Fang Ouyang. 2023. "Static and Dynamic Load Transfer Behaviors of the Composite Foundation Reinforced by the Geosynthetic-Encased Stone Column" Sustainability 15, no. 2: 1108. https://doi.org/10.3390/su15021108
Note that from the first issue of 2016, this journal uses article numbers instead of page numbers. See further details here.