

Interplay in Circular Economy Innovation, Business Model Innovation, SDGs, and Government Incentives: A Comparative Analysis of Pakistani, Malaysian, and Chinese SMEs


Abstract
:1. Introduction
- To what degree do circular economy innovation, BMI, and government incentives impact economic, environmental, and social performance among SMEs in Pakistan, Malaysia, and China?
- What is the relationship between circular economy innovation, BMI, and government incentives among SMEs in Pakistan, Malaysia, and China?
- Do government incentives mediate the relationship between circular economy innovation, BMI, and economic, environmental, and social performance among SMEs in Pakistan, Malaysia, and China?
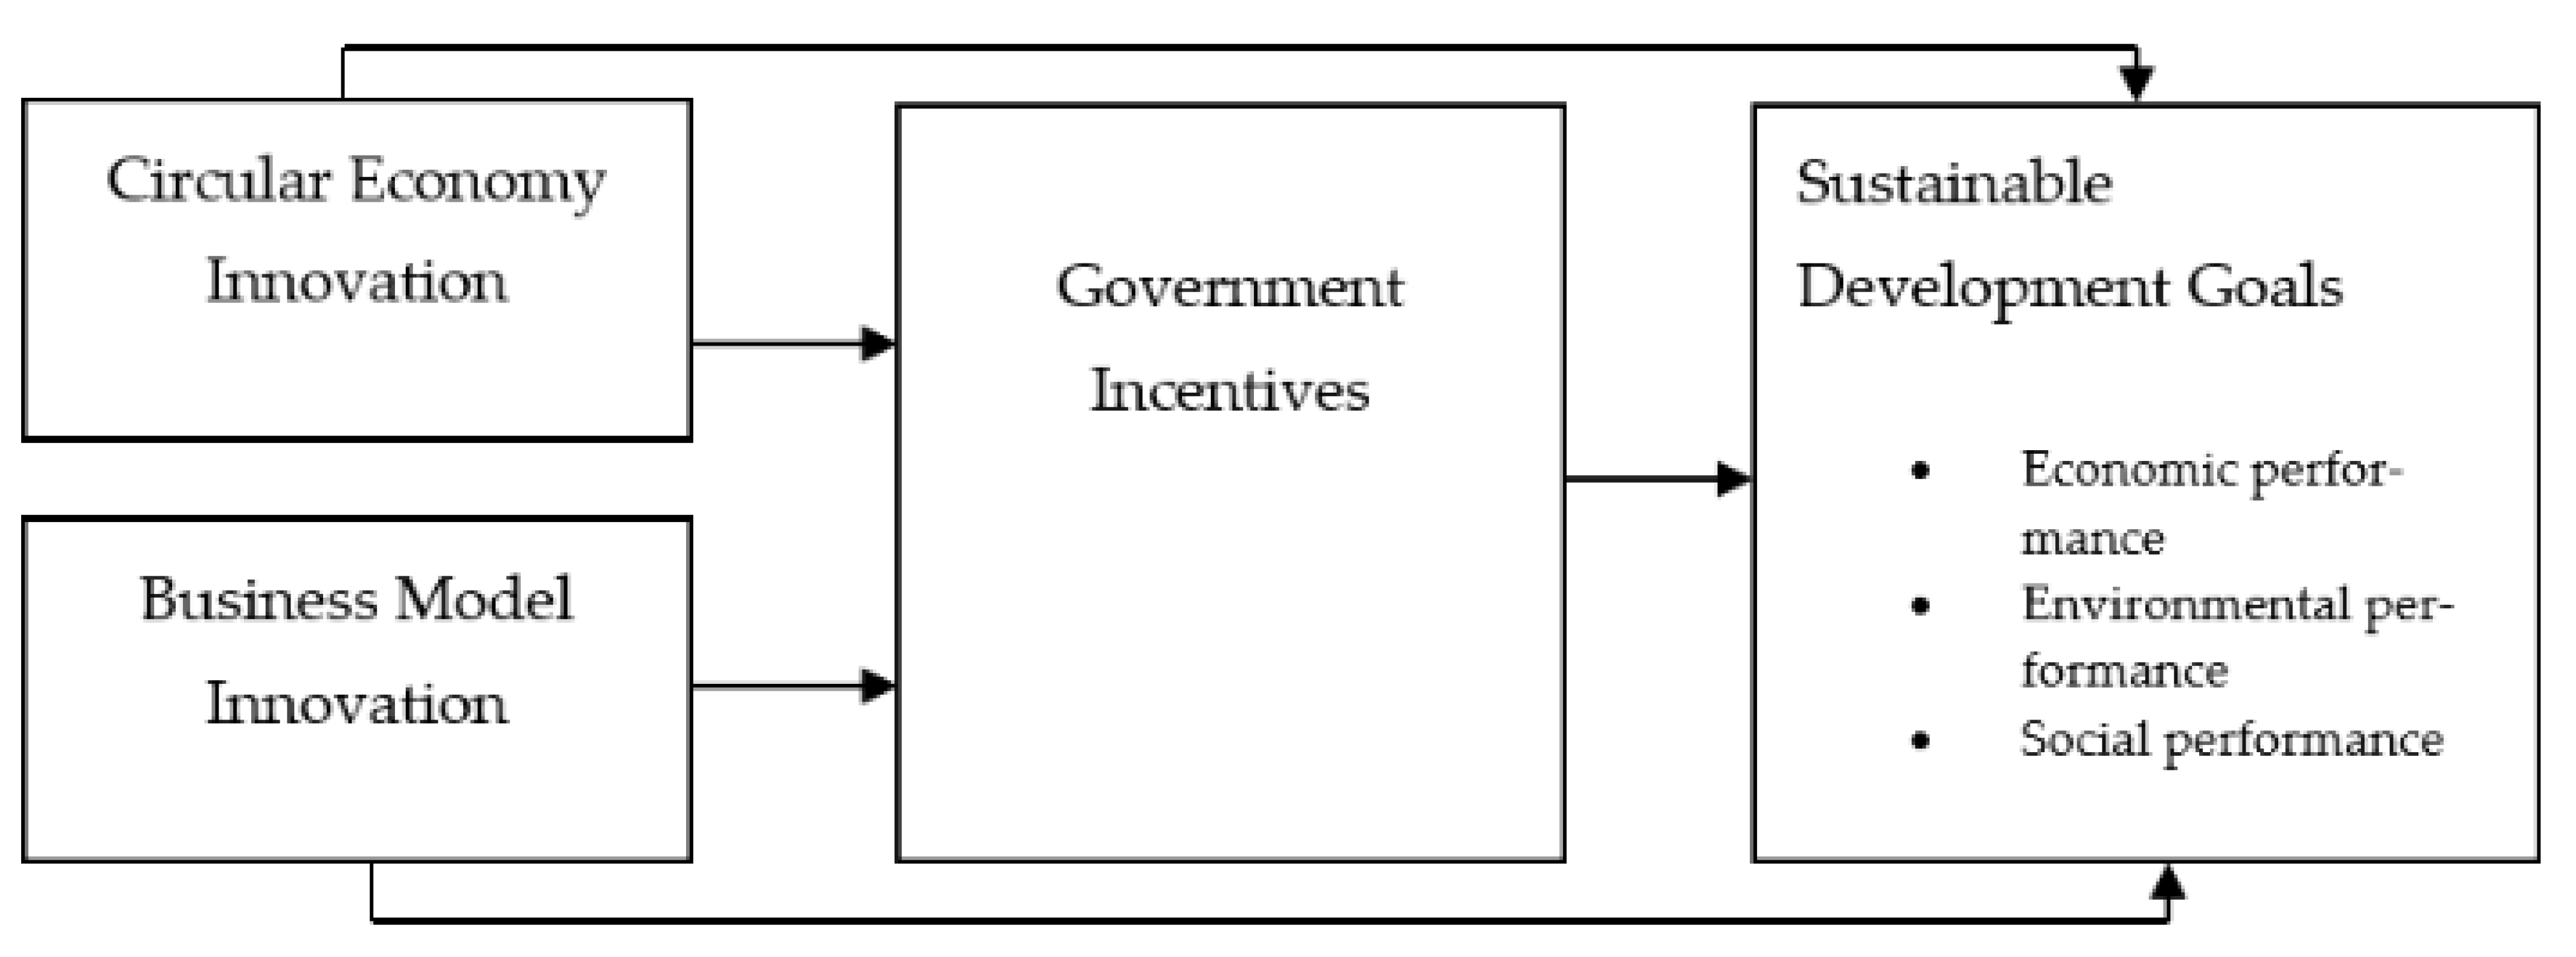
2. Theoretical Background and Hypothesis Development
2.1. The Resource-Based View Theory
2.2. Circular Economy Innovation and Sustainable Development Goals
- H1a:
- Circular Economy Innovation has positive effects on economic performance among SMEs in Pakistan, Malaysia, and China
- H1b:
- Circular Economy Innovation has positive effects on environmental performance among SMEs in Pakistan, Malaysia, and China
- H1c:
- Circular Economy Innovation has positive effects on social performance among SMEs in Pakistan, Malaysia, and China
2.3. Business Model Innovation and Sustainable Development Goals
- H2a:
- BMI has positive effects on the economic performance of SMEs in Pakistan, Malaysia, and China
- H2b:
- BMI has positive effects on the environmental performance of SMEs in Pakistan, Malaysia, and China
- H2c:
- BMI has positive effects on the social performance of SMEs in Pakistan, Malaysia, and China
2.4. Government Incentives and Sustainable Development Goals
- H3a:
- Government incentives have positive effects on the economic performance of SMEs in Pakistan, Malaysia, and China
- H3b:
- Government incentives have positive effects on the environmental performance of SMEs in Pakistan, Malaysia, and China
- H3c:
- Government incentives have positive effects on the social performance of SMEs in Pakistan, Malaysia, and China
2.5. Circular Economy Innovation and Government Incentives
- H4:
- There is a positive relationship between circular economy innovation and government incentives among SMEs in Pakistan, Malaysia, and China
2.6. Business Model Innovation and Government Incentives
- H5:
- There is a positive relationship between BMI and the government incentives among SMEs in Pakistan, Malaysia, and China
2.7. Mediating Role of Government Incentives
- H6a:
- Government incentives mediate the relationship between circular economy innovation and economic performance among SMEs in Pakistan, Malaysia, and China
- H6b:
- Government incentives mediate the relationship between circular economy innovation and environmental performance among SMEs in Pakistan, Malaysia, and China
- H6c:
- Government incentives mediate the relationship between circular economy innovation and social performance among SMEs in Pakistan, Malaysia, and China
- H7a:
- Government incentives mediate the relationship between BMI and economic performance among SMEs in Pakistan, Malaysia, and China
- H7b:
- Government incentives mediate the relationship between BMI and environmental performance among SMEs in Pakistan, Malaysia, and China
- H7c:
- Government incentives mediate the relationship between BMI and social performance among SMEs in Pakistan, Malaysia, and China
3. Methodology
3.1. Sample and Data Collection
3.2. Instruments
3.3. Technique
4. Results
5. Discussion
5.1. Implications of the Study
5.1.1. Practical Implications
5.1.2. Theoretical Implications
6. Conclusions and Future Directions
Author Contributions
Funding
Data Availability Statement
Acknowledgments
Conflicts of Interest
Appendix A
- Circular Economy Innovation
- In our company we have replaced new recyclable system for raw materials with renewable, recyclable, or biodegradable inputs
- In our company we have launched new processes to decrease the usage of non-recyclable raw materials in our processes
- In our company we have launched new environmentally friendly packaging system
- In our company we have launched new system to use the leftover raw material again in our processes
- In our company we are using recycled materials as an input in our new processes
- In our company we have launched new initiatives to collect leftover products from customers to recycle them
- In our company we have introduced new alternative ways to use our products once they have served their initial purpose
- In our company we have found new revenue streams for products/services after they have served their initial purpose
- Business Model Innovation
- How much of revenue from noncore products are generated through traditional revenue sources such as circulation, display advertising, and classified operations?Almost all 1 2 3 4 5 Almost none
- How do you sell your noncore products?Existing salesforce sells both core and noncore products.1 2 3 4 5Noncore products are exclusively sold through digital media salesforce.
- How many new formal or informal arrangements for information exchange with your partners have been created in the past 3 years?No new arrangements 1 2 3 4 5 Very many new arrangements
- In the last 3 years, have you changed your pricing structure for raw material, product, and services?We have made no changes to our pricing structure.1 2 3 4 5We have completely changed our pricing structure.
- Please compare the value propositions offered by your products/services now with those offered 3 years ago.They are pretty much the same 1 2 3 4 5 They are dramatically different
- Please compare the cost structure of means employed to produce the noncore products with that employed to produce the core products.Cost structure for noncore product is much higher1 2 3 4 5Cost structure for noncore products is much lower
- Government Incentives
- Government Financial Support
- We can easily access sufficient equity fundings provided by the government for SDGs
- In our country, there are sufficient government financial subsidies available for SMEs, and we have easy access to it
- We can easily access interest-free, and a low level of interest charged debt/loan fundings
- We can easily access government short term and long-term financial services
- Government Nonfinancial Support
- 5.
- Our government supports SMEs in building science parks and SDGs incubators in poor communities
- 6.
- We access a wide range of assistance provided by the government for SDGs activities and SDGs projects
- 7.
- Our government encourages SMEs to help in sustainable development by improving the corporate social responsibilities
- Sustainable Development
- Economics Performance
- We have achieved return on asset
- We have achieved return on equity
- We have achieved return on investment
- We have improved our profitability
- We have improved the production cost
- We have improved the sales growth
- We have improved in work productivity
- Environmental Performance
- We raise awareness and/or train of the employees in water and/or energy conservation
- We give priority to reusable, used or recycled materials.
- We have established metrics that monitor (e.g., regarding risks, levels of pollution, of energy consumption, waste, etc.) the environmental initiatives
- We consult stakeholders (e.g., employees, suppliers, clients, creditors, etc.) for environment-related decisions
- We integrate environmental considerations in the conception and development of products and services in all phases of their life cycle (eco-conception and the analysis of the life cycle)
- We integrate environmental considerations in purchase decisions and the evaluation of suppliers
- We give priority to more water and energy-efficient equipment
- We separate garbage and waste (recycling of materials: paper, plastic, glass and metal)
- We encourage and support employees to use alternatives means of transportation to commute instead of single-occupancy cars (e.g., rideshare, public transport, bicycle, etc.)
- We give priority to less polluting vehicles and modes of transportation and/or optimize distribution network
- We communicate actions to internal stakeholders (e.g., meetings with staff, intranet, reports, etc.)
- We communicate actions to external stakeholders (e.g., website, reports, etc.)
- Social Performance
- We have established metrics that monitor (e.g., amounts spent, allocated time, types of beneficiaries, etc.) to benefit the communities
- We favor local suppliers in the regions
- We favor job creation in the regions
- We offer internships and contribute to student training in different communities
- We contribute to community cultural, sporting or teaching activities (public organizations or associations with social, cultural, sporting or teaching activities)
- We consult other stakeholders (employees, suppliers, clients, creditors, associations, firms, etc.) for decisions concerning local development
- We communicate actions among internal stakeholders (e.g., meetings with staff, intranet, reports, etc.)
- We communicate actions to external stakeholders (e.g., website, reports, etc.)
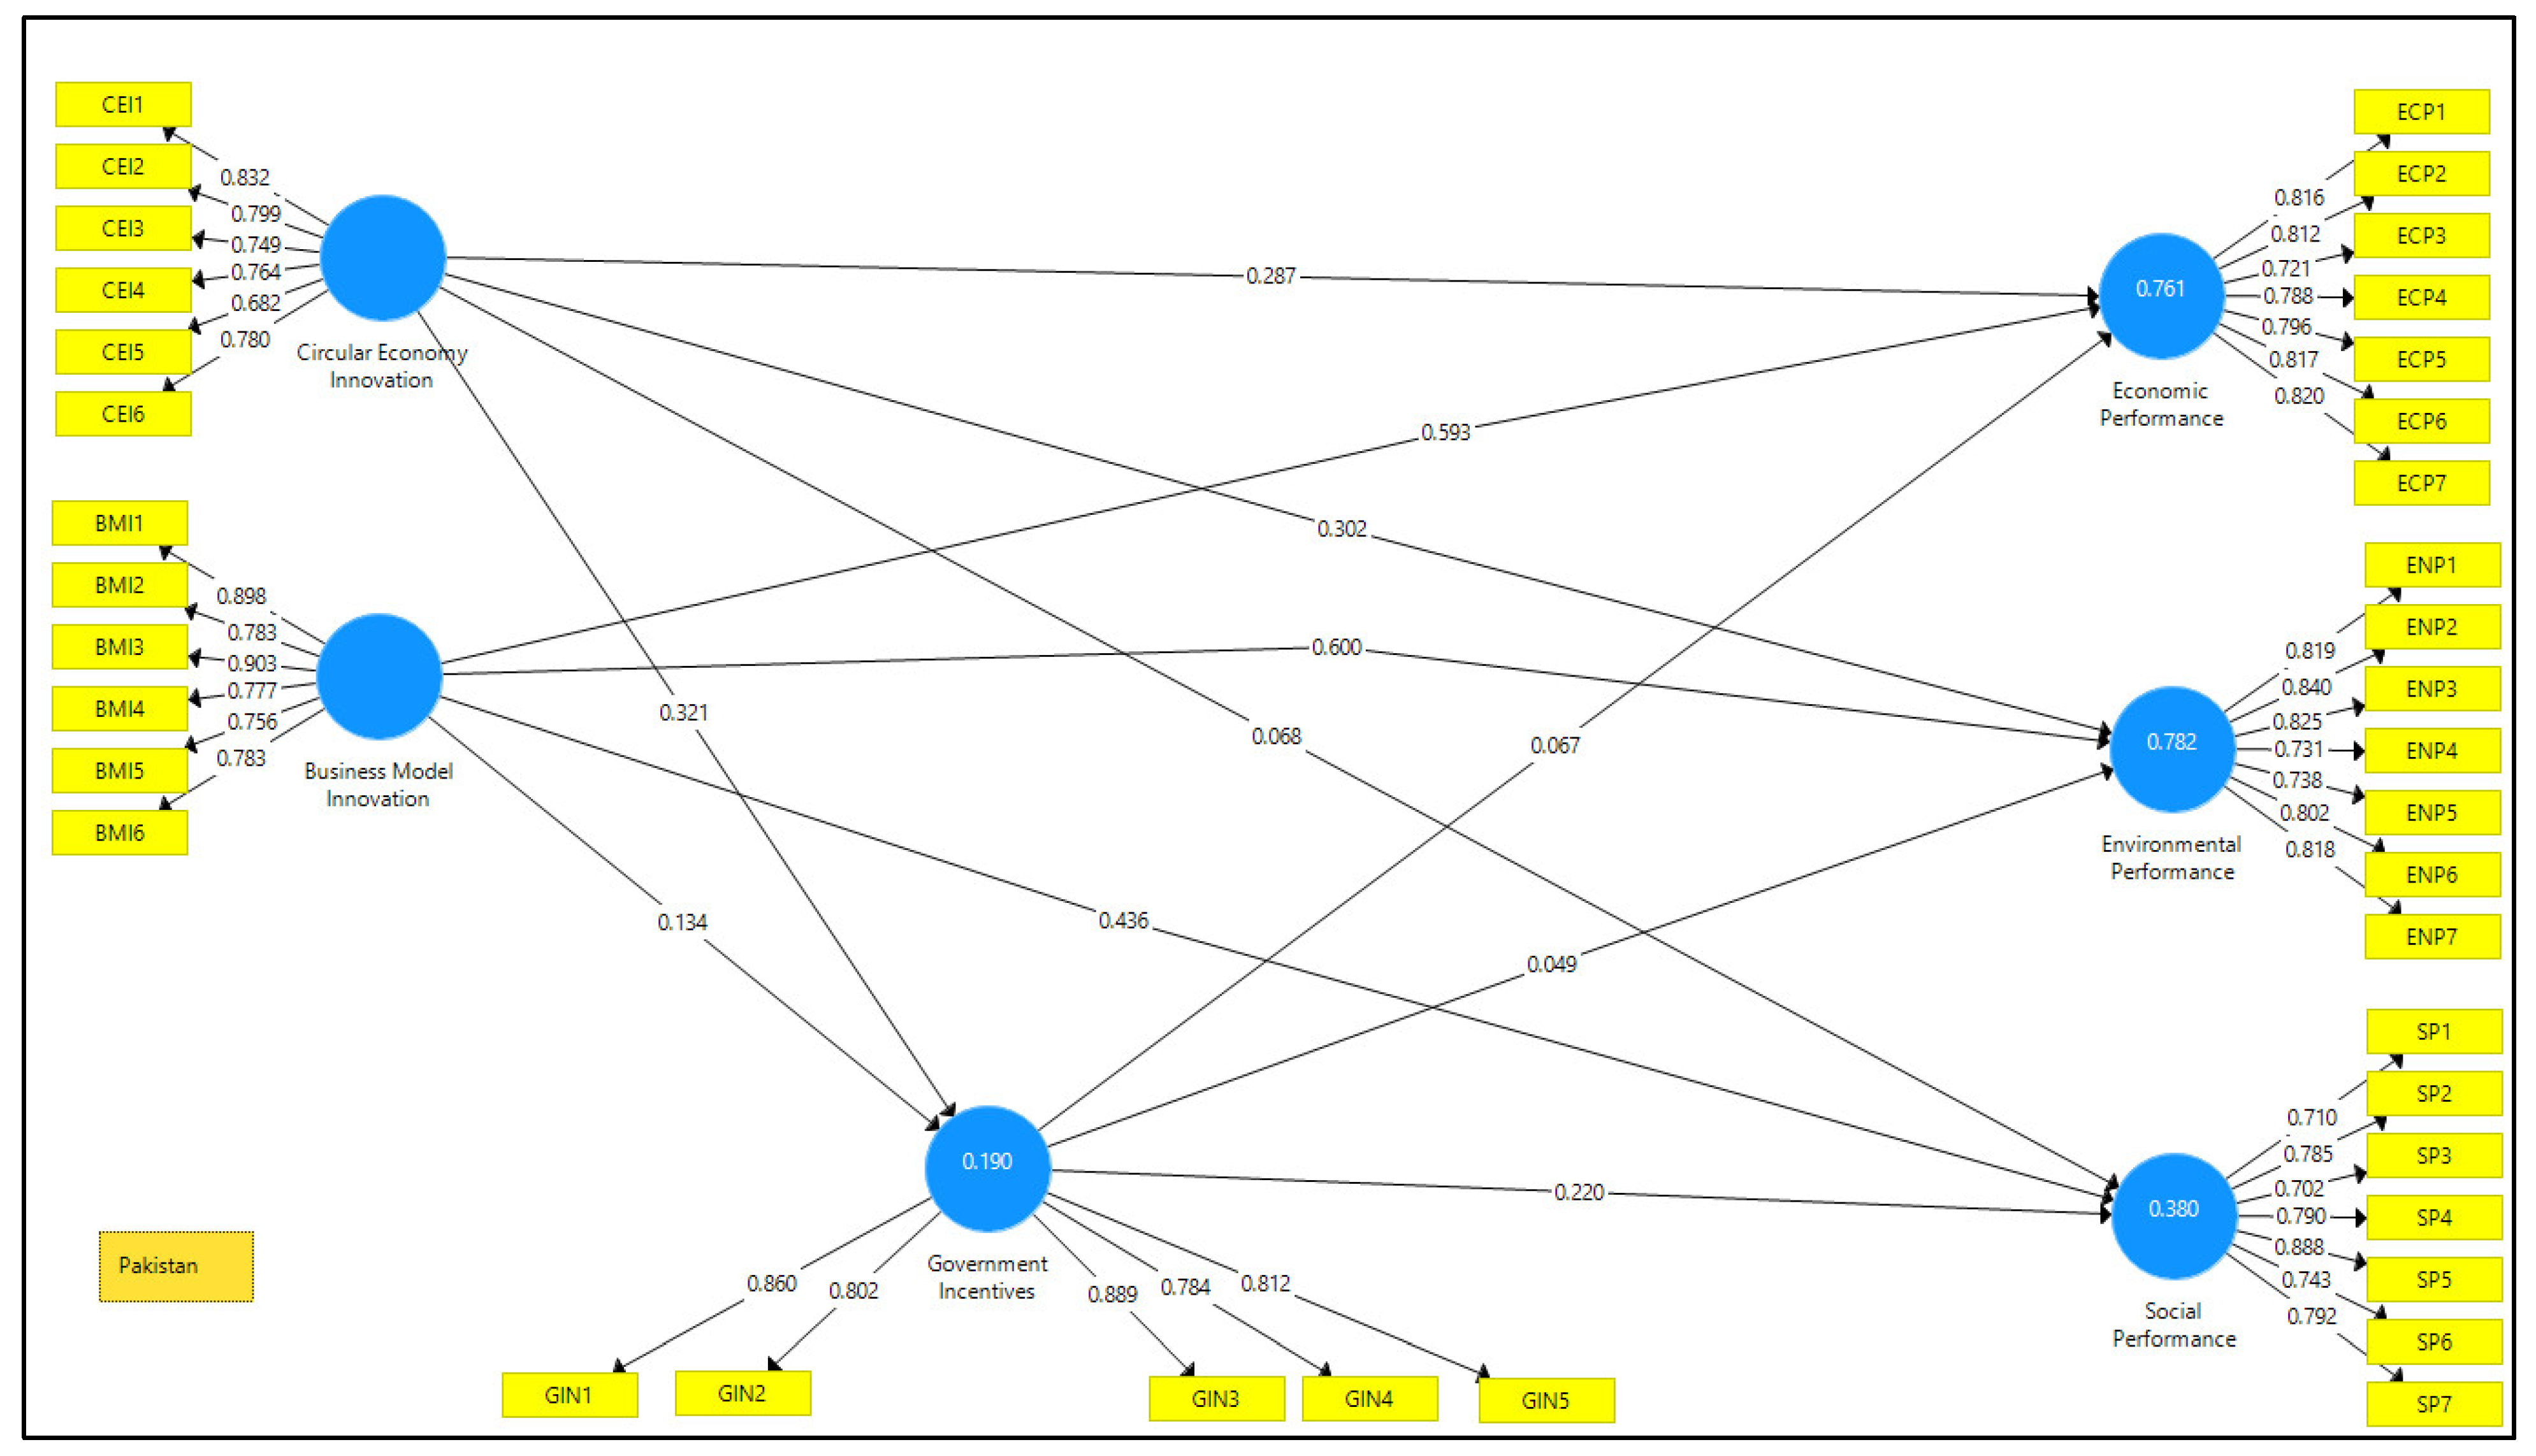
- Pakistan Sample

- Outer Weight (Pakistan Sample)
| Business Model Innovation | Circular Economy Innovation | Economic Performance | Environmental Performance | Government Incentives | Social Performance | |
| BMI1 | 0.219 | |||||
| BMI2 | 0.19 | |||||
| BMI3 | 0.219 | |||||
| BMI4 | 0.183 | |||||
| BMI5 | 0.177 | |||||
| BMI6 | 0.232 | |||||
| CEI1 | 0.243 | |||||
| CEI2 | 0.227 | |||||
| CEI3 | 0.196 | |||||
| CEI4 | 0.223 | |||||
| CEI5 | 0.185 | |||||
| CEI6 | 0.221 | |||||
| ECP1 | 0.178 | |||||
| ECP2 | 0.174 | |||||
| ECP3 | 0.179 | |||||
| ECP4 | 0.187 | |||||
| ECP5 | 0.193 | |||||
| ECP6 | 0.177 | |||||
| ECP7 | 0.169 | |||||
| ENP1 | 0.178 | |||||
| ENP2 | 0.182 | |||||
| ENP3 | 0.196 | |||||
| ENP4 | 0.173 | |||||
| ENP5 | 0.169 | |||||
| ENP6 | 0.178 | |||||
| ENP7 | 0.177 | |||||
| GIN1 | 0.262 | |||||
| GIN2 | 0.235 | |||||
| GIN3 | 0.265 | |||||
| GIN4 | 0.211 | |||||
| GIN5 | 0.229 | |||||
| SP1 | 0.177 | |||||
| SP2 | 0.177 | |||||
| SP3 | 0.149 | |||||
| SP4 | 0.19 | |||||
| SP5 | 0.199 | |||||
| SP6 | 0.168 | |||||
| SP7 | 0.225 |
- Q-Square (Pakistan Sample)
| SSO | SSE | Q2 (=1 − SSE/SSO) | |
| Business Model Innovation | 1824 | 1824 | |
| Circular Economy Innovation | 1824 | 1824 | |
| Economic Performance | 2128 | 1120.829 | 0.473 |
| Environmental Performance | 2128 | 1084.452 | 0.49 |
| Government Incentives | 1520 | 1325.282 | 0.128 |
| Social Performance | 2128 | 1660.263 | 0.22 |
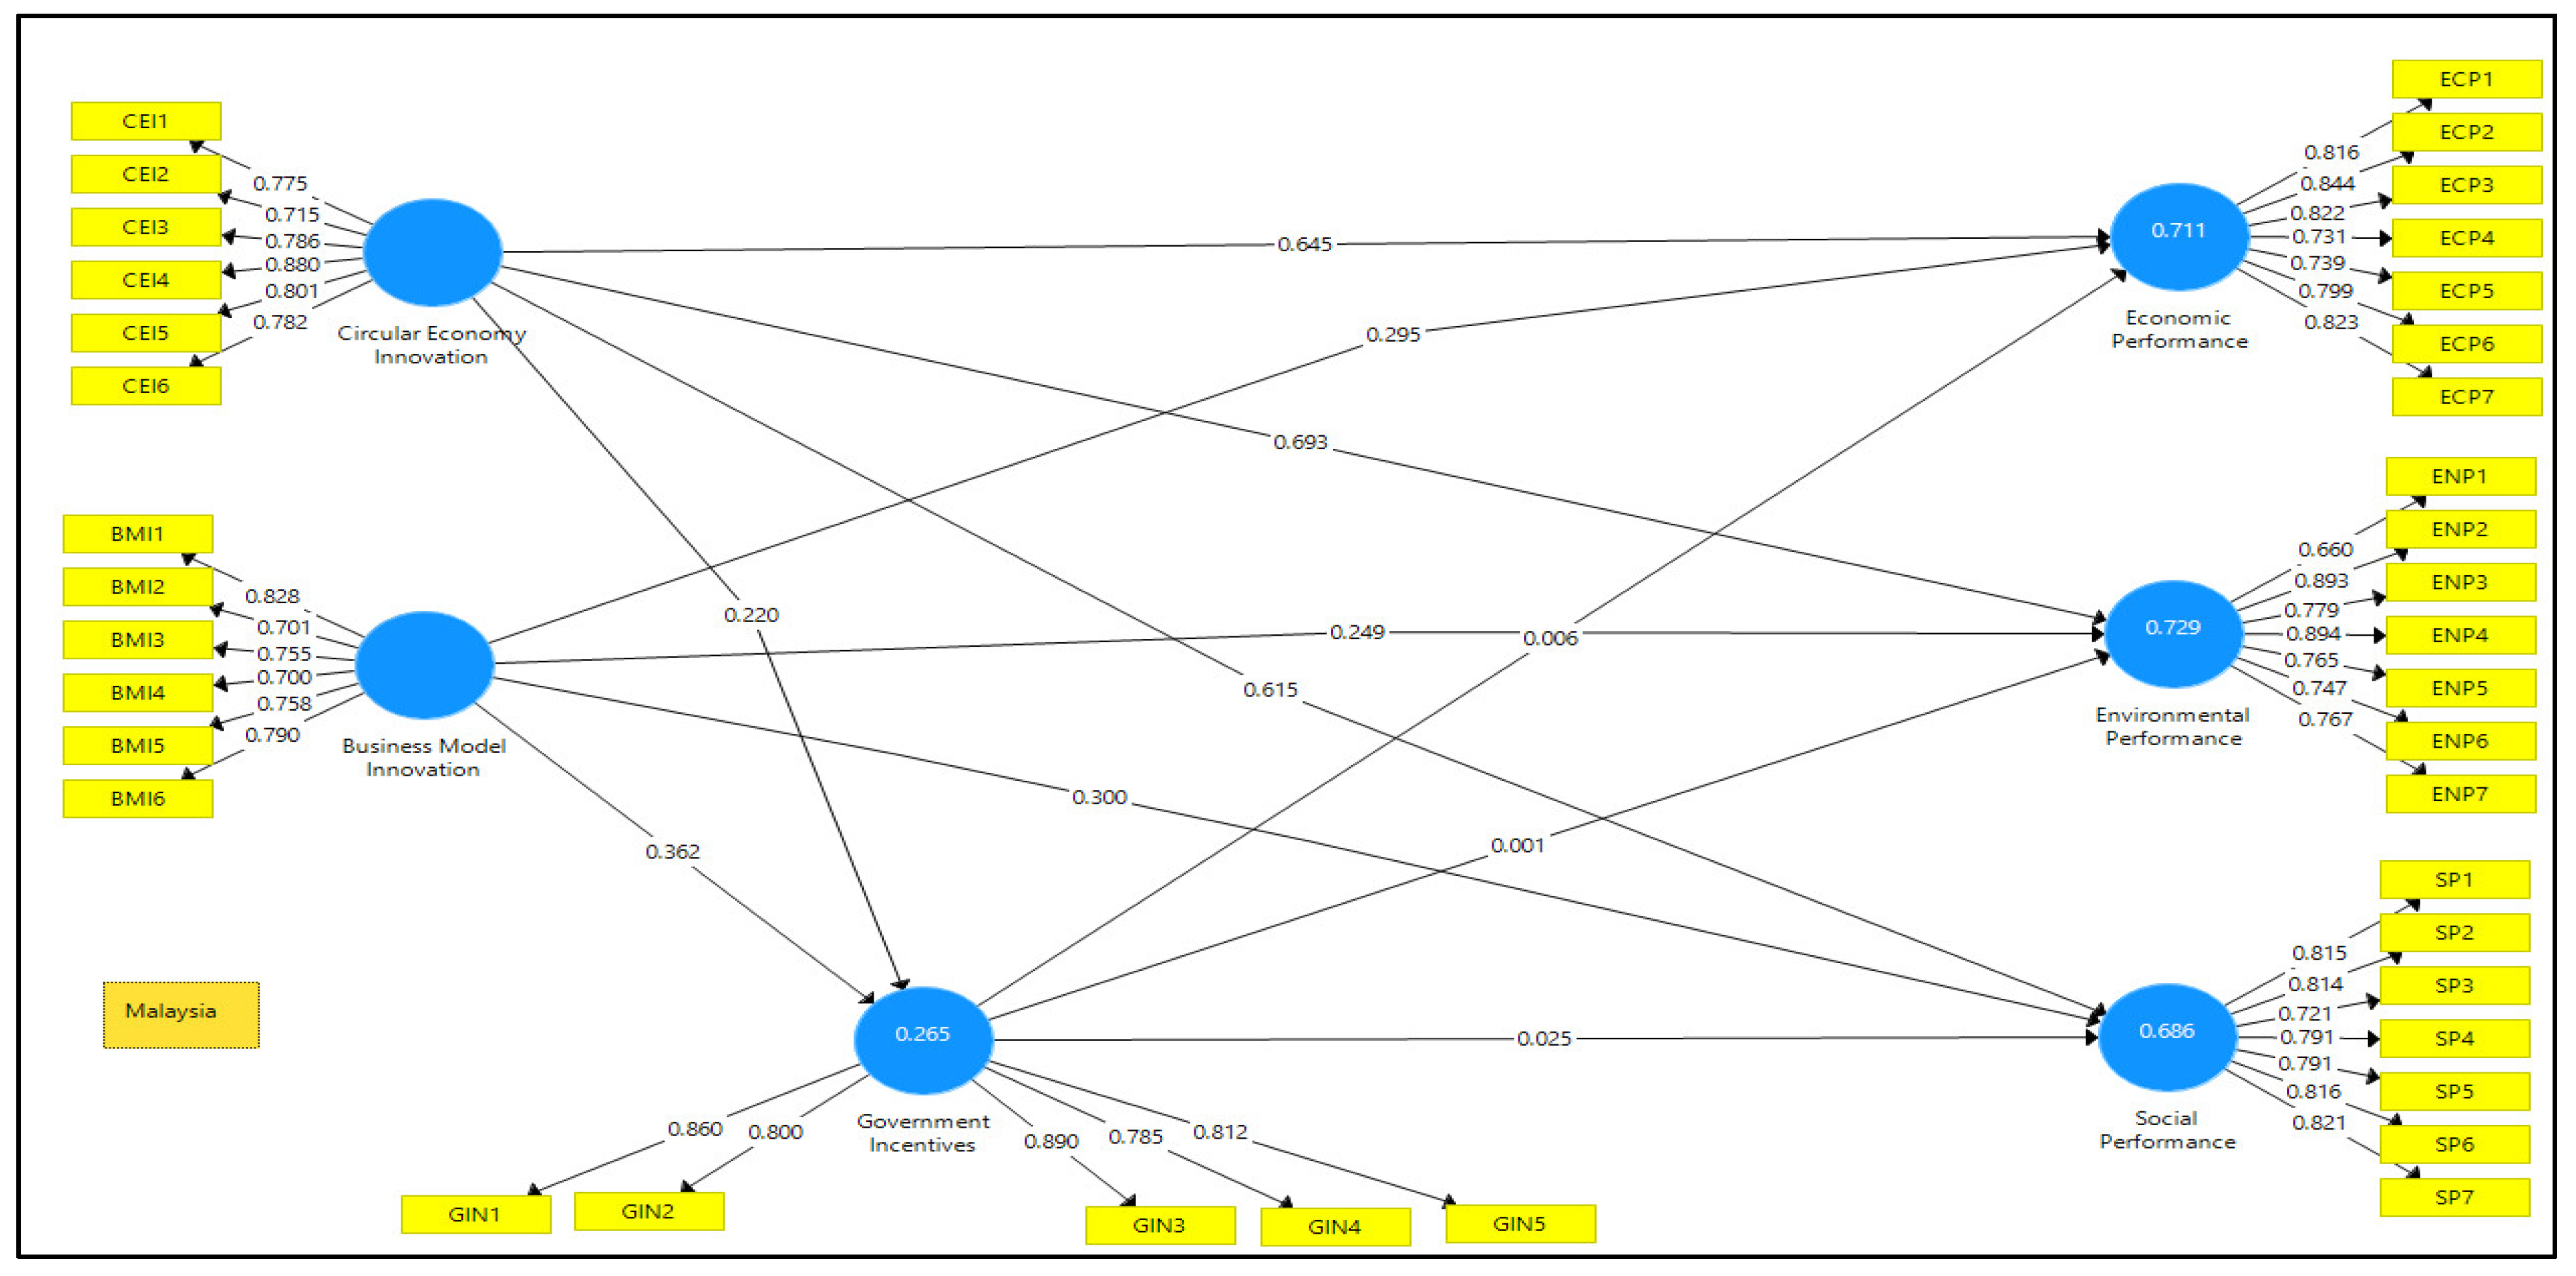
- Malaysia Sample

- Outer Weight (Malaysia Sample)
| Business Model Innovation | Circular Economy Innovation | Economic Performance | Environmental Performance | Government Incentives | Social Performance | |
| BMI1 | 0.258 | |||||
| BMI2 | 0.179 | |||||
| BMI3 | 0.209 | |||||
| BMI4 | 0.25 | |||||
| BMI5 | 0.208 | |||||
| BMI6 | 0.216 | |||||
| CEI1 | 0.217 | |||||
| CEI2 | 0.175 | |||||
| CEI3 | 0.211 | |||||
| CEI4 | 0.254 | |||||
| CEI5 | 0.205 | |||||
| CEI6 | 0.196 | |||||
| ECP1 | 0.175 | |||||
| ECP2 | 0.189 | |||||
| ECP3 | 0.187 | |||||
| ECP4 | 0.171 | |||||
| ECP5 | 0.171 | |||||
| ECP6 | 0.176 | |||||
| ECP7 | 0.184 | |||||
| ENP1 | 0.179 | |||||
| ENP2 | 0.206 | |||||
| ENP3 | 0.168 | |||||
| ENP4 | 0.202 | |||||
| ENP5 | 0.16 | |||||
| ENP6 | 0.161 | |||||
| ENP7 | 0.188 | |||||
| GIN1 | 0.262 | |||||
| GIN2 | 0.231 | |||||
| GIN3 | 0.267 | |||||
| GIN4 | 0.211 | |||||
| GIN5 | 0.229 | |||||
| SP1 | 0.176 | |||||
| SP2 | 0.177 | |||||
| SP3 | 0.18 | |||||
| SP4 | 0.194 | |||||
| SP5 | 0.182 | |||||
| SP6 | 0.177 | |||||
| SP7 | 0.171 |
- Q-Square (Malaysia Sample)
| SSO | SSE | Q2 (=1 − SSE/SSO) | |
| Business Model Innovation | 1824 | 1824 | |
| Circular Economy Innovation | 1824 | 1824 | |
| Economic Performance | 2128 | 1178.145 | 0.446 |
| Environmental Performance | 2128 | 1181.213 | 0.445 |
| Government Incentives | 1520 | 1248.516 | 0.179 |
| Social Performance | 2128 | 1219.677 | 0.427 |
- China Sample

- Outer Weight (China Sample)
| Business Model Innovation | Circular Economy Innovation | Economic Performance | Environmental Performance | Government Incentives | Social Performance | |
| BMI1 | 0.182 | |||||
| BMI2 | 0.236 | |||||
| BMI3 | 0.202 | |||||
| BMI4 | 0.234 | |||||
| BMI5 | 0.197 | |||||
| BMI6 | 0.191 | |||||
| CE14 | 0.253 | |||||
| CEI1 | 0.21 | |||||
| CEI2 | 0.18 | |||||
| CEI3 | 0.21 | |||||
| CEI5 | 0.209 | |||||
| CEI6 | 0.197 | |||||
| ECP1 | 0.183 | |||||
| ECP2 | 0.178 | |||||
| ECP3 | 0.17 | |||||
| ECP4 | 0.178 | |||||
| ECP5 | 0.187 | |||||
| ECP6 | 0.177 | |||||
| ECP7 | 0.176 | |||||
| ENP1 | 0.167 | |||||
| ENP2 | 0.184 | |||||
| ENP3 | 0.19 | |||||
| ENP4 | 0.187 | |||||
| ENP5 | 0.177 | |||||
| ENP6 | 0.171 | |||||
| ENP7 | 0.183 | |||||
| GIN1 | 0.177 | |||||
| GIN2 | 0.224 | |||||
| GIN3 | 0.251 | |||||
| GIN4 | 0.287 | |||||
| GIN5 | 0.363 | |||||
| SP1 | 0.171 | |||||
| SP2 | 0.184 | |||||
| SP3 | 0.151 | |||||
| SP4 | 0.195 | |||||
| SP5 | 0.214 | |||||
| SP6 | 0.171 | |||||
| SP7 | 0.253 |
- Q-Square (China Sample)
| SSO | SSE | Q2 (=1 − SSE/SSO) | |
| Business Model Innovation | 1824 | 1824 | |
| Circular Economy Innovation | 1824 | 1824 | |
| Economic Performance | 2128 | 1145.61 | 0.462 |
| Environmental Performance | 2128 | 1163.374 | 0.453 |
| Government Incentives | 1520 | 1304.65 | 0.142 |
| Social Performance | 2128 | 1610.65 | 0.243 |
References
- Mwangi, G.M.; Despoudi, S.; Espindola, O.R.; Spanaki, K.; Papadopoulos, T. A planetary boundaries perspective on the sustainability: Resilience relationship in the Kenyan tea supply chain. Ann. Oper. Res. 2021, 1–35. [Google Scholar] [CrossRef]
- Lii, P.; Kuo, F.I. Innovation-oriented supply chain integration for combined competitiveness and firm performance. Int. J. Prod. Econ. 2016, 174, 142–155. [Google Scholar] [CrossRef]
- Rodríguez-Espíndola, O.; Cuevas-Romo, A.; Chowdhury, S.; Díaz-Acevedo, N.; Albores, P.; Despoudi, S.; Dey, P. The role of circular economy principles and sustainable-oriented innovation to enhance social, economic and environmental performance: Evidence from Mexican SMEs. Int. J. Prod. Econ. 2022, 248, 108495. [Google Scholar] [CrossRef]
- Dey, P.K.; Malesios, C.; De, D.; Chowdhury, S.; Abdelaziz, F.B. The impact of lean management practices and sustainably oriented innovation on sustainability performance of small and medium-sized enterprises: Empirical evidence from the UK. Br. J. Manag. 2020, 31, 141–161. [Google Scholar] [CrossRef] [Green Version]
- Korhonen, J.; Honkasalo, A.; Seppälä, J. Circular economy: The concept and its limitations. Ecol. Econ. 2018, 143, 37–46. [Google Scholar] [CrossRef]
- Klewitz, J.; Hansen, E.G. Sustainability-oriented innovation of SMEs: A systematic review. J. Clean. Prod. 2014, 65, 57–75. [Google Scholar] [CrossRef]
- Abad-Segura, E.; González-Zamar, M.D.; Infante-Moro, J.C.; Ruipérez García, G. Sustainable management of digital transformation in higher education: Global research trends. Sustainability 2020, 12, 2107. [Google Scholar] [CrossRef] [Green Version]
- Cracolici, M.F.; Cuffaro, M.; Lacagnina, V. Assessment of sustainable well-being in the Italian regions: An activity analysis model. Ecol. Econ. 2018, 143, 105–110. [Google Scholar] [CrossRef]
- Sehnem, S.; Jabbour, C.J.C.; Pereira, S.C.F.; de Sousa Jabbour, A.B.L. Improving sustainable supply chains performance through operational excellence: Circular economy approach. Resour. Conserv. Recycl. 2019, 149, 236–248. [Google Scholar] [CrossRef]
- Ntsonde, J.; Aggeri, F. Stimulating innovation and creating new markets–the potential of circular public procurement. J. Clean. Prod. 2021, 308, 127303. [Google Scholar] [CrossRef]
- Cristoni, N.; Tonelli, M. Strategic Management and the Circular Economy; Routledge: London, UK, 2018. [Google Scholar]
- De los Ríos, C.; Charnley, F.J.S. Skills and capabilities for a sustainable and circular economy: The changing role of design. J. Clean. Prod. 2017, 160, 109–122. [Google Scholar] [CrossRef]
- Rattalino, F. Circular advantage anyone? Sustainability-driven innovation and circularity at Patagonia, Inc. Thunderbird Int. Bus. Rev. 2018, 60, 747–755. [Google Scholar] [CrossRef]
- Lüdeke-Freund, F.; Gold, S.; Bocken, N.M. A review and typology of circular economy business model patterns. J. Ind. Ecol. 2019, 23, 36–61. [Google Scholar] [CrossRef] [Green Version]
- De PáduaPieroni, M.; McAloone, T.; Pigosso, D. Business model innovation for circular economy: Integrating literature and practice into a conceptual process model. In Proceedings of the Design Society: International Conference on Engineering Design; Cambridge University Press: Cambridge, UK, 2019; Volume 1, pp. 2517–2526. [Google Scholar]
- Geissdoerfer, M.; Savaget, P.; Bocken, N.M.; Hultink, E.J. The Circular Economy—A new sustainability paradigm? J. Clean. Prod. 2017, 143, 757–768. [Google Scholar] [CrossRef] [Green Version]
- Snihur, Y.; Bocken, N. A call for action: The impact of business model innovation on business ecosystems, society and planet. Long Range Plan. 2022, 55, 102182. [Google Scholar] [CrossRef]
- Brown, P.; Bocken, N.; Balkenende, R. Why do companies pursue collaborative circular oriented innovation? Sustainability 2019, 11, 635. [Google Scholar] [CrossRef] [Green Version]
- Aghelie, A. Exploring drivers and barriers to sustainability green business practices within small medium sized enterprises: Primary findings. Int. J. Bus. Econ. Dev. (IJBED) 2017, 5. Available online: https://ijbed.org/cdn/article_file/content_26562_17-03-27-10-42-33.pdf (accessed on 14 September 2022).
- Ghisellini, P.; Cialani, C.; Ulgiati, S. A review on circular economy: The expected transition to a balanced interplay of environmental and economic systems. J. Clean. Prod. 2016, 114, 11–32. [Google Scholar] [CrossRef]
- Ormazabal, M.; Prieto-Sandoval, V.; Puga-Leal, R.; Jaca, C. Circular economy in Spanish SMEs: Challenges and opportunities. J. Clean. Prod. 2018, 185, 157–167. [Google Scholar] [CrossRef]
- Awan, U.; Sroufe, R.; Shahbaz, M. Industry 4.0 and the circular economy: A literature review and recommendations for future research. Bus. Strat. Environ. 2021, 30, 2038–2060. [Google Scholar] [CrossRef]
- Groening, C.; Sarkis, J.; Zhu, Q. Green marketing consumer-level theory review: A compendium of applied theories and further research directions. J. Clean. Prod. 2018, 172, 1848–1866. [Google Scholar] [CrossRef]
- Hudecheck, M.; Sire´n, C.; Grichnik, D.; Wincent, J. How Companies Can Respond to the Coronavirus’. MIT Sloan Management Review. Available online: https://sloanreview.mit.edu/article/how-companies-can-respondto-the-coronavirus/ (accessed on 31 May 2020).
- Ranjbari, M.; Saidani, M.; Esfandabadi, Z.S.; Peng, W.; Lam, S.S.; Aghbashlo, M.; Tabatabaei, M. Two decades of research on waste management in the circular economy: Insights from bibliometric, text mining, and content analyses. J. Clean. Prod. 2021, 314, 128009. [Google Scholar] [CrossRef]
- Wang, N.; Lee, J.C.K.; Zhang, J.; Chen, H.; Li, H. Evaluation of Urban circular economy development: An empirical research of 40 cities in China. J. Clean. Prod. 2018, 180, 876–887. [Google Scholar] [CrossRef]
- White, K.; Habib, R.; Hardisty, D.J. How to SHIFT consumer behaviors to be more sustainable: A literature review and guiding framework. J. Mark. 2019, 83, 22–49. [Google Scholar] [CrossRef] [Green Version]
- Han, D.; Konietzko, J.; Dijk, M.; Bocken, N. How do companies launch circular service business models in different countries? Sustain. Prod. Consum. 2022, 31, 591–602. [Google Scholar] [CrossRef]
- Cronin, J.J.; Smith, J.S.; Gleim, M.R.; Ramirez, E.; Martinez, J.D. Green marketing strategies: An examination of stakeholders and the opportunities they present. J. Acad. Mark. Sci. 2011, 39, 158–174. [Google Scholar] [CrossRef]
- Dangelico, R.M.; Vocalelli, D. Green Marketing: An analysis of definitions, strategy steps, and tools through a systematic review of the literature. J. Clean. Prod. 2017, 165, 1263–1279. [Google Scholar] [CrossRef]
- Papadas, K.K.; Avlonitis, G.J.; Carrigan, M.; Piha, L. The interplay of strategic and internal green marketing orientation on competitive advantage. J. Bus. Res. 2019, 104, 632–643. [Google Scholar] [CrossRef]
- Moraga, G.; Huysveld, S.; De Meester, S.; Dewulf, J. Development of circularity indicators based on the in-use occupation of materials. J. Clean. Prod. 2021, 279, 123889. [Google Scholar] [CrossRef]
- Izzo, M.F.; Ciaburri, M.; Tiscini, R. The challenge of sustainable development goal reporting: The first evidence from Italian listed companies. Sustainability 2020, 12, 3494. [Google Scholar] [CrossRef] [Green Version]
- Williams, A.; Whiteman, G.; Parker, J.N. Backstage interorganizational collaboration: Corporate endorsement of the sustainable development goals. Acad. Manag. Discov. 2019, 5, 367–395. [Google Scholar] [CrossRef]
- Philip, J.; Graham, W. A Framework for Codifying Business Models and Process Models in E-Business Design; Butterworth-Heinemann: Oxford, UK, 2004; pp. 35–64. [Google Scholar]
- Barney, J. Firm resources and sustained competitive advantage. J. Manag. 1991, 17, 99–120. [Google Scholar] [CrossRef]
- Rodríguez-Antón, J.M.; Rubio-Andrada, L.; Celemín-Pedroche, M.S.; Ruíz-Peñalver, S.M. From the circular economy to the sustainable development goals in the European Union: An empirical comparison. Int. Environ. Agreem. Politics Law Econ. 2022, 22, 67–95. [Google Scholar] [CrossRef]
- Rodríguez-Antón, J.M. La Economía circular comomodeloimpulsor de losObjetivos de Desarrollo Sostenible. In Agenda 2030: Claves para la Transformaciónsostenible; Alfaro, M., Arias, S., Gamba, A., Eds.; Los Libros de la Catarata: Madrid, Spain, 2019; pp. 296–311. [Google Scholar]
- Rodríguez-Antón, J.M.; Alonso-Almeida, M.M. La estrategiaespañola de Economía circular y suadecuación al plan de acción de la Unión Europea para la Economía circular. In Proceedings of the 25th APDR Congress, Proceedings, Lisboa, Portugal, 5–6 July 2018; pp. 183–190. [Google Scholar]
- Kirchherr, J.; Reike, D.; Hekkert, M. Conceptualizing the circular economy: An analysis of 114 definitions. Resour. Conserv. Recycl. 2017, 127, 221–232. [Google Scholar] [CrossRef]
- Valverde, J.M.; Avilés-Palacios, C. Circular economy as a catalyst for progress towards the sustainable development goals: A positive relationship between two self-sufficient variables. Sustainability 2021, 13, 12652. [Google Scholar] [CrossRef]
- DeCajas, A.U.; Seguros, B.Y. La Economía Circular Enel Sector Agroalimentario; Adicae: Brussels, Belgium, 2013. [Google Scholar]
- Lewandowski, M. Designing the Business Models for Circular Economy—Towards the Conceptual Framework. Sustainability 2016, 8, 43. [Google Scholar] [CrossRef] [Green Version]
- Khajuria, A.; Atienza, V.A.; Chavanich, S.; Henning, W.; Islam, I.; Kral, U.; Li, J. Accelerating circular economy solutions to achieve the 2030 agenda for sustainable development goals. Circ. Econ. 2022, 1, 100001. [Google Scholar] [CrossRef]
- Khajuria, A. Integrated approach between DPSIR, planetary boundaries and sustainable development goals~towards 3Rs and resource efficiency. World Environ. 2020, 10, 52–56. [Google Scholar]
- Suárez-Eiroa, B.; Fernández, E.; Méndez-Martínez, G.; Soto-Oñate, D. Operational principles of circular economy for sustainable development: Linking theory and practice. J. Clean. Prod. 2019, 214, 952–961. [Google Scholar] [CrossRef]
- Mai, Y.; Yang, H.; Zhang, G. Does business model innovation enhance the sustainable development of new ventures? Understanding an inverted-U relationship. Sustainability 2020, 13, 262. [Google Scholar] [CrossRef]
- Evans, S.; Vladimirova, D.; Holgado, M.; Van Fossen, K.; Yang, M.; Silva, E.A.; Barlow, C.Y. Business model innovation for sustainability: Towards a unified perspective for creation of sustainable business models. Bus. Strategy Environ. 2017, 26, 597–608. [Google Scholar] [CrossRef]
- Madsen, H.L. Business model innovation and the global ecosystem for sustainable development. J. Clean. Prod. 2010, 247, 119102. [Google Scholar] [CrossRef]
- Aryal, K.; Laudari, H.K.; Ojha, H.R. To what extent is Nepal’s community forestry contributing to the sustainable development goals? An institutional interaction perspective. Int. J. Sustain. Dev. World Ecol. 2020, 27, 28–39. [Google Scholar] [CrossRef]
- Boţa-Avram, C.; Groşanu, A.; Răchişan, P.R.; Gavriletea, M. The bidirectional causality between country-level governance, economic growth and sustainable development: A cross-country data analysis. Sustainability 2018, 10, 502. [Google Scholar] [CrossRef] [Green Version]
- Aceleanu, M.I.; Șerban, A.C.; Țîrcă, D.M.; Badea, L. The rural sustainable development through renewable energy. The case of Romania. Technol. Econ. Dev. Econ. 2018, 24, 1408–1434. [Google Scholar] [CrossRef]
- Anwar, M.; Khattak, M.S.; Popp, J.; Meyer, D.F.; Máté, D. The nexus of government incentives and sustainable development goals: Is the management of resources the solution to non-profit organisations? Technol. Econ. Dev. Econ. 2020, 26, 1284–1310. [Google Scholar] [CrossRef]
- Rodríguez Bolívar, M.P.; Navarro Galera, A.; Alcaide Muñoz, L.; López Subirés, M.D. Risk factors and drivers of financial sustainability in local government: An empirical study. Local Gov. Stud. 2016, 42, 29–51. [Google Scholar] [CrossRef]
- Ayuso, S.; Navarrete-Báez, F.E. How does entrepreneurial and international orientation influence SMEs’ commitment to sustainable development? Empirical evidence from Spain and Mexico. Corp. Soc. Responsib. Environ. Manag. 2018, 25, 80–94. [Google Scholar] [CrossRef]
- Bimonte, G.; Romano, M.G.; Russolillo, M. Green innovation and competition: R&D incentives in a circular economy. Games 2021, 12, 68. [Google Scholar]
- Katrakis, E.; Nacci, G.; Couder, N. Incentives to Boost the Circular Economy: A Guide for Public Authorities; European Commission: Minato City, Tokyo, 2021. [Google Scholar]
- Scotchmer, S. Innovation and Incentives; MIT Press: Cambridge, MA, USA, 2004. [Google Scholar]
- Zhang, J.; Guan, J. The time-varying impacts of government incentives on innovation. Technol. Forecast. Soc. Change 2018, 135, 132–144. [Google Scholar] [CrossRef]
- Khattak, M.S. Does access to domestic finance and international finance contribute to sustainable development goals? Implications for policymakers. J. Public Aff. 2020, 20, e2024. [Google Scholar] [CrossRef]
- Van Leeuwen, G.; Mohnen, P. Revisiting the Porter hypothesis: An empirical analysis of green innovation for The Netherlands. Econ. Innov. New Technol. 2017, 26, 63–77. [Google Scholar] [CrossRef] [Green Version]
- Li, B.; Chen, W.; Xu, C.; Hou, P. Impacts of government subsidies for environmental-friendly products in a dual-channel supply chain. J. Clean. Prod. 2018, 171, 1558–1576. [Google Scholar] [CrossRef]
- Owen, R.; Brennan, G.; Lyon, F. Enabling investment for the transition to a low carbon economy: Government policy to finance early stage green innovation. Curr. Opin. Environ. Sustain. 2018, 31, 137–145. [Google Scholar] [CrossRef]
- Ullah, R.; Ahmad, H.; Rehman, F.U.; Fawad, A. Green innovation and Sustainable Development Goals in SMEs: The moderating role of government incentives. J. Econ. Adm. Sci. 2021; in press. [Google Scholar] [CrossRef]
- Monasterolo, I.; Raberto, M. The EIRIN flow-of-funds behavioural model of green fiscal policies and green sovereign bonds. Ecol. Econ. 2018, 144, 228–243. [Google Scholar] [CrossRef]
- Gerlach, H.; Zheng, X. Preferences for green electricity, investment and regulatory incentives. Energy Econ. 2018, 69, 430–441. [Google Scholar] [CrossRef]
- Albort-Morant, G.; Leal-Millán, A.; Cepeda-Carrión, G. The antecedents of green innovation performance: A model of learning and capabilities. J. Bus. Res. 2016, 69, 4912–4917. [Google Scholar] [CrossRef]
- Hair, J.F.; Hult, G.M.; Ringle, C.; Sarstedt, M. A Primer on Partial Least Squares Structural Equation Modeling (PLS-SEM); Sage Publications: Thousand Oaks, CA, USA, 2014. [Google Scholar]
- Anwar, M. Business model innovation and SMEs performance—Does competitive advantage mediate? Int. J. Innov. Manag. 2018, 22, 1850057. [Google Scholar] [CrossRef]
- Rehman, A.U.; Anwar, M. Mediating role of enterprise risk management practices between business strategy and SME performance. Small Enterp. Res. 2019, 26, 207–227. [Google Scholar] [CrossRef]
- Anwar, M.; Khan, S.Z.; Shah, S.Z.A. Big data capabilities and firm’s performance: A mediating role of competitive advantage. J. Inf. Knowl. Manag. 2018, 17, 1850045. [Google Scholar] [CrossRef]
- Rehman, F.U.; Yusoff, R.B.M.; Zabri, S.B.M.; Ismail, F.B. Determinants of personal factors in influencing the buying behavior of consumers in sales promotion: A case of fashion industry. Young Consum. 2017, 18, 408–424. [Google Scholar] [CrossRef]
- Kabra, A.G.; Akhtar, R.P.; Dash, M.K. Understanding behavioural intention to use information technology: Insights from humanitarian practitioners. Telemat. Inform. 2017, 34, 1250–1261. [Google Scholar] [CrossRef]
- Rehman, F.U.; Al-Ghazali, B.M. Evaluating the Influence of Social Advertising, Individual Factors, and Brand Image on the Buying Behavior toward Fashion Clothing Brands. SAGE Open 2022, 12, 21582440221088858. [Google Scholar] [CrossRef]
- Ringle, C.M.; Wende, S.; Becker, J.M. Smart PLS 3. Smart PLS. 2015. Available online: http://www.smartpls.com (accessed on 14 September 2022).
- Fornell, C.G.; Larcker, D.F. Evaluating structural equation models with unobservable variables and measurement error. J. Mark. Res. 1981, 18, 39–50. [Google Scholar] [CrossRef]
- Khan, P.A.; Johl, S.K.; Akhtar, S. Vinculum of Sustainable Development Goal Practices and Firms’ Financial Performance: A Moderation Role of Green Innovation. J. Risk Financ. Manag. 2022, 15, 96. [Google Scholar] [CrossRef]
- Korsakienė, R.; Raišienė, A.G. Sustainability drivers of small and medium sized firms: A review and research agenda. Sci. Pap. Univ. Pardubice. Ser. D Fac. Econ. Adm. 2022, 30, 1–12. [Google Scholar] [CrossRef]
- Udeh, F.N.; Akporien, F.O. Triple bottom line reporting practices and corporate relationship with host communities in Nigeria (a case study of Niger Delta region). Sci. Pap. Univ. Pardubice. Ser. D Fac. Econ. Adm. 2016, 36, 207–217. [Google Scholar]


| Pakistan | Malaysia | China | ||||||
|---|---|---|---|---|---|---|---|---|
| Description | Frequency | Percentage | Description | Frequency | Percentage | Description | Frequency | Percentage |
| Owners/Managers | Owners/Managers | Owners/Managers | ||||||
| Owner | 53 | 17.66% | Owner | 61 | 20.33% | Owner | 76 | 25.33% |
| CEO | 64 | 21.33% | CEO | 69 | 23.00% | CEO | 57 | 19.00% |
| Managers | 183 | 61.00% | Managers | 170 | 56.66% | Managers | 167 | 55.66% |
| Industries | Industries | Industries | ||||||
| Chemicals | 41 | 13.66% | Chemicals | 45 | 15.00% | Chemicals | 39 | 13.00% |
| Software | 57 | 19.00% | Software | 64 | 21.33% | Software | 63 | 21.00% |
| Pharmacy | 47 | 15.66% | Pharmacy | 43 | 14.33% | Pharmacy | 52 | 17.33% |
| Cosmetics | 62 | 20.66% | Cosmetics | 54 | 18.00% | Cosmetics | 59 | 19.66% |
| Engineering | 37 | 12.33% | Engineering | 42 | 14.00% | Engineering | 50 | 16.66% |
| Electronics | 56 | 18.66% | Electronics | 52 | 17.33% | Electronics | 37 | 12.33% |
| Size of the Firm | Size of the Firm | Size of the Firm | ||||||
| 20–50 Employees | 44 | 14.66% | 20–50 Employees | 51 | 17.00% | 20–50 Employees | 31 | 10.33% |
| 51–100 Employees | 72 | 24.00% | 51–100 Employees | 68 | 22.66% | 51–100 Employees | 57 | 19.00% |
| 101–150 Employees | 82 | 27.33% | 101–150 Employees | 74 | 24.66% | 101–150 Employees | 72 | 24.00% |
| 151–200 Employees | 56 | 18.66% | 151–200 Employees | 79 | 26.33% | 151–200 Employees | 81 | 27.00% |
| 201–250 Employees | 46 | 15.33% | 201–250 Employees | 28 | 9.33% | 201–250 Employees | 59 | 19.66% |
| Age of the Firm | Age of the Firm | Age of the Firm | ||||||
| 10 Years or less | 145 | 48.33% | 10 Years or less | 87 | 29.00% | 10 Years or less | 85 | 28.33% |
| 11–20 Years | 94 | 31.33% | 11–20 Years | 173 | 57.66% | 11–20 Years | 181 | 60.33% |
| 21 and above Years | 61 | 20.33% | 21 and above Years | 40 | 13.33% | 21 and above Years | 34 | 11.33% |
| Constructs | Number of Items | Authors | |
|---|---|---|---|
| Circular Economy Innovation | 8 | Rodríguez-Espíndola et al., 2022 [3] | |
| BMI | 6 | Anwar, 2018 [68] | |
| Government Incentives | Financial Support | 6 | Anwar et al., 2020 [52] |
| Non-Financial Support | 6 | Anwar et al., 2020 [52] | |
| Sustainable Development Goals | Social Development | 8 | Rizwanullah et al., 2021; Anwar et al., 2020 [52,63] |
| Environmental Development | 12 | Rizwanullah et al., 2021; Anwar et al., 2020 [52,63] | |
| Economics Development | 6 | Rehman& Anwar, 2019; Anwar, Khan& Shah, 2018 [69,70] | |
| Variable | Items | Pakistan | Malaysia | China | |||||||||
|---|---|---|---|---|---|---|---|---|---|---|---|---|---|
| F.L | C.A | C.R | AVE | F.L | C.A | C.R | AVE | F.L | C.A | C.R | AVE | ||
| Circular Economy Innovation | CEIN1 | 0.832 | 0.861 | 0.924 | 0.671 | 0.775 | 0.88 | 0.909 | 0.626 | 0.879 | 0.880 | 0.909 | 0.626 |
| CEIN 2 | 0.799 | 0.715 | 0.772 | ||||||||||
| CEIN 3 | 0.749 | 0.786 | 0.719 | ||||||||||
| CEIN 4 | 0.764 | 0.880 | 0.785 | ||||||||||
| CEIN 5 | 0.682 | 0.801 | 0.803 | ||||||||||
| CEIN 6 | 0.780 | 0.782 | 0.782 | ||||||||||
| BMI | BMI1 | 0.898 | 0.901 | 0.896 | 0.591 | 0.828 | 0.851 | 0.889 | 0.573 | 0.653 | 0.886 | 0.914 | 0.643 |
| BMI2 | 0.783 | 0.701 | 0.899 | ||||||||||
| BMI3 | 0.903 | 0.755 | 0.787 | ||||||||||
| BMI4 | 0.777 | 0.700 | 0.900 | ||||||||||
| BMI5 | 0.756 | 0.758 | 0.778 | ||||||||||
| BMI6 | 0.783 | 0.790 | 0.768 | ||||||||||
| Government Incentives | GIN1 | 0.860 | 0.887 | 0.924 | 0.634 | 0.860 | 0.887 | 0.917 | 0.689 | 0.611 | 0.814 | 0.868 | 0.571 |
| GIN2 | 0.802 | 0.800 | 0.747 | ||||||||||
| GIN3 | 0.889 | 0.890 | 0.750 | ||||||||||
| GIN4 | 0.784 | 0.785 | 0.826 | ||||||||||
| GIN5 | 0.812 | 0.812 | 0.822 | ||||||||||
| Economics Performance | EF1 | 0.816 | 0.903 | 0.928 | 0.636 | 0.816 | 0.904 | 0.924 | 0.636 | 0.855 | 0.907 | 0.926 | 0.642 |
| EF2 | 0.812 | 0.844 | 0.806 | ||||||||||
| EF3 | 0.721 | 0.822 | 0.748 | ||||||||||
| EF4 | 0.788 | 0.731 | 0.743 | ||||||||||
| EF5 | 0.796 | 0.739 | 0.794 | ||||||||||
| EF6 | 0.817 | 0.799 | 0.847 | ||||||||||
| EF7 | 0.820 | 0.823 | 0.810 | ||||||||||
| Environmental Performance | ENF1 | 0.819 | 0.904 | 0.917 | 0.689 | 0.660 | 0.897 | 0.92 | 0.624 | 0.798 | 0.903 | 0.923 | 0.632 |
| ENF2 | 0.840 | 0.893 | 0.815 | ||||||||||
| ENF3 | 0.825 | 0.779 | 0.798 | ||||||||||
| ENF4 | 0.731 | 0.894 | 0.817 | ||||||||||
| ENF5 | 0.738 | 0.765 | 0.745 | ||||||||||
| ENF6 | 0.802 | 0.747 | 0.792 | ||||||||||
| ENF7 | 0.818 | 0.767 | 0.797 | ||||||||||
| Social Performance | SF1 | 0.710 | 0.888 | 0.913 | 0.601 | 0.815 | 0.903 | 0.924 | 0.634 | 0.708 | 0.868 | 0.899 | 0.561 |
| SF2 | 0.785 | 0.814 | 0.774 | ||||||||||
| SF3 | 0.702 | 0.721 | 0.691 | ||||||||||
| SF4 | 0.790 | 0.791 | 0.771 | ||||||||||
| SF5 | 0.888 | 0.791 | 0.878 | ||||||||||
| SF6 | 0.743 | 0.816 | 0.743 | ||||||||||
| SF7 | 0.792 | 0.821 | 0.656 | ||||||||||
| Discriminant Validity | HTMT | |||||||||||||
|---|---|---|---|---|---|---|---|---|---|---|---|---|---|---|
| Pakistan | CEIN | BMI | GIN | ED | END | SD | CEIN | BMI | GIN | ED | END | SD | ||
| CEIN | 0.919 | CEIN | ||||||||||||
| BMI | 0.507 | 0.869 | BMI | 0.407 | ||||||||||
| GIN | 0.651 | 0.494 | 0.846 | GIN | 0.535 | 0.497 | ||||||||
| ED | 0.563 | 0.607 | 0.653 | 0.897 | ED | 0.549 | 0.513 | 0.440 | ||||||
| END | 0.393 | 0.429 | 0.423 | 0.414 | 0.830 | END | 0.335 | 0.401 | 0.357 | 0.463 | ||||
| SD | 0.578 | 0.515 | 0.615 | 0.620 | 0.421 | 0.775 | SD | 0.438 | 0.582 | 0.282 | 0.388 | 0.464 | ||
| Malaysia | CEIN | 0.757 | CEIN | |||||||||||
| BMI | 0.536 | 0.891 | BMI | 0.502 | ||||||||||
| GIN | 0.643 | 0.505 | 0.897 | GIN | 0.423 | 0.498 | ||||||||
| ED | 0.622 | 0.428 | 0.568 | 0.790 | ED | 0.301 | 0.319 | 0.261 | ||||||
| END | 0.480 | 0.414 | 0.414 | 0.408 | 0.830 | END | 0.242 | 0.364 | 0.363 | 0.254 | ||||
| SD | 0.641 | 0.286 | 0.353 | 0.456 | 0.423 | 0.796 | SD | 0.223 | 0.274 | 0.054 | 0.347 | 0.470 | ||
| China | CEIN | 0.802 | CEIN | |||||||||||
| BMI | 0.509 | 0.791 | BMI | 0.453 | ||||||||||
| GIN | 0.424 | 0.492 | 0.801 | GIN | 0.318 | 0.482 | ||||||||
| ED | 0.324 | 0.394 | 0.464 | 0.795 | ED | 0.219 | 0.304 | 0.066 | ||||||
| END | 0.516 | 0.446 | 0.496 | 0.348 | 0.755 | END | 0.386 | 0.411 | 0.354 | 0.530 | ||||
| SD | 0.525 | 0.574 | 0.398 | 0.493 | 0.349 | 0.749 | SD | 0.492 | 0.428 | 0.261 | 0.303 | 0.418 | ||
| Country | Relationship | Estimate | SM | SD | T-Value | Decision | R-Square | F-Square | VIF | Q-Square |
|---|---|---|---|---|---|---|---|---|---|---|
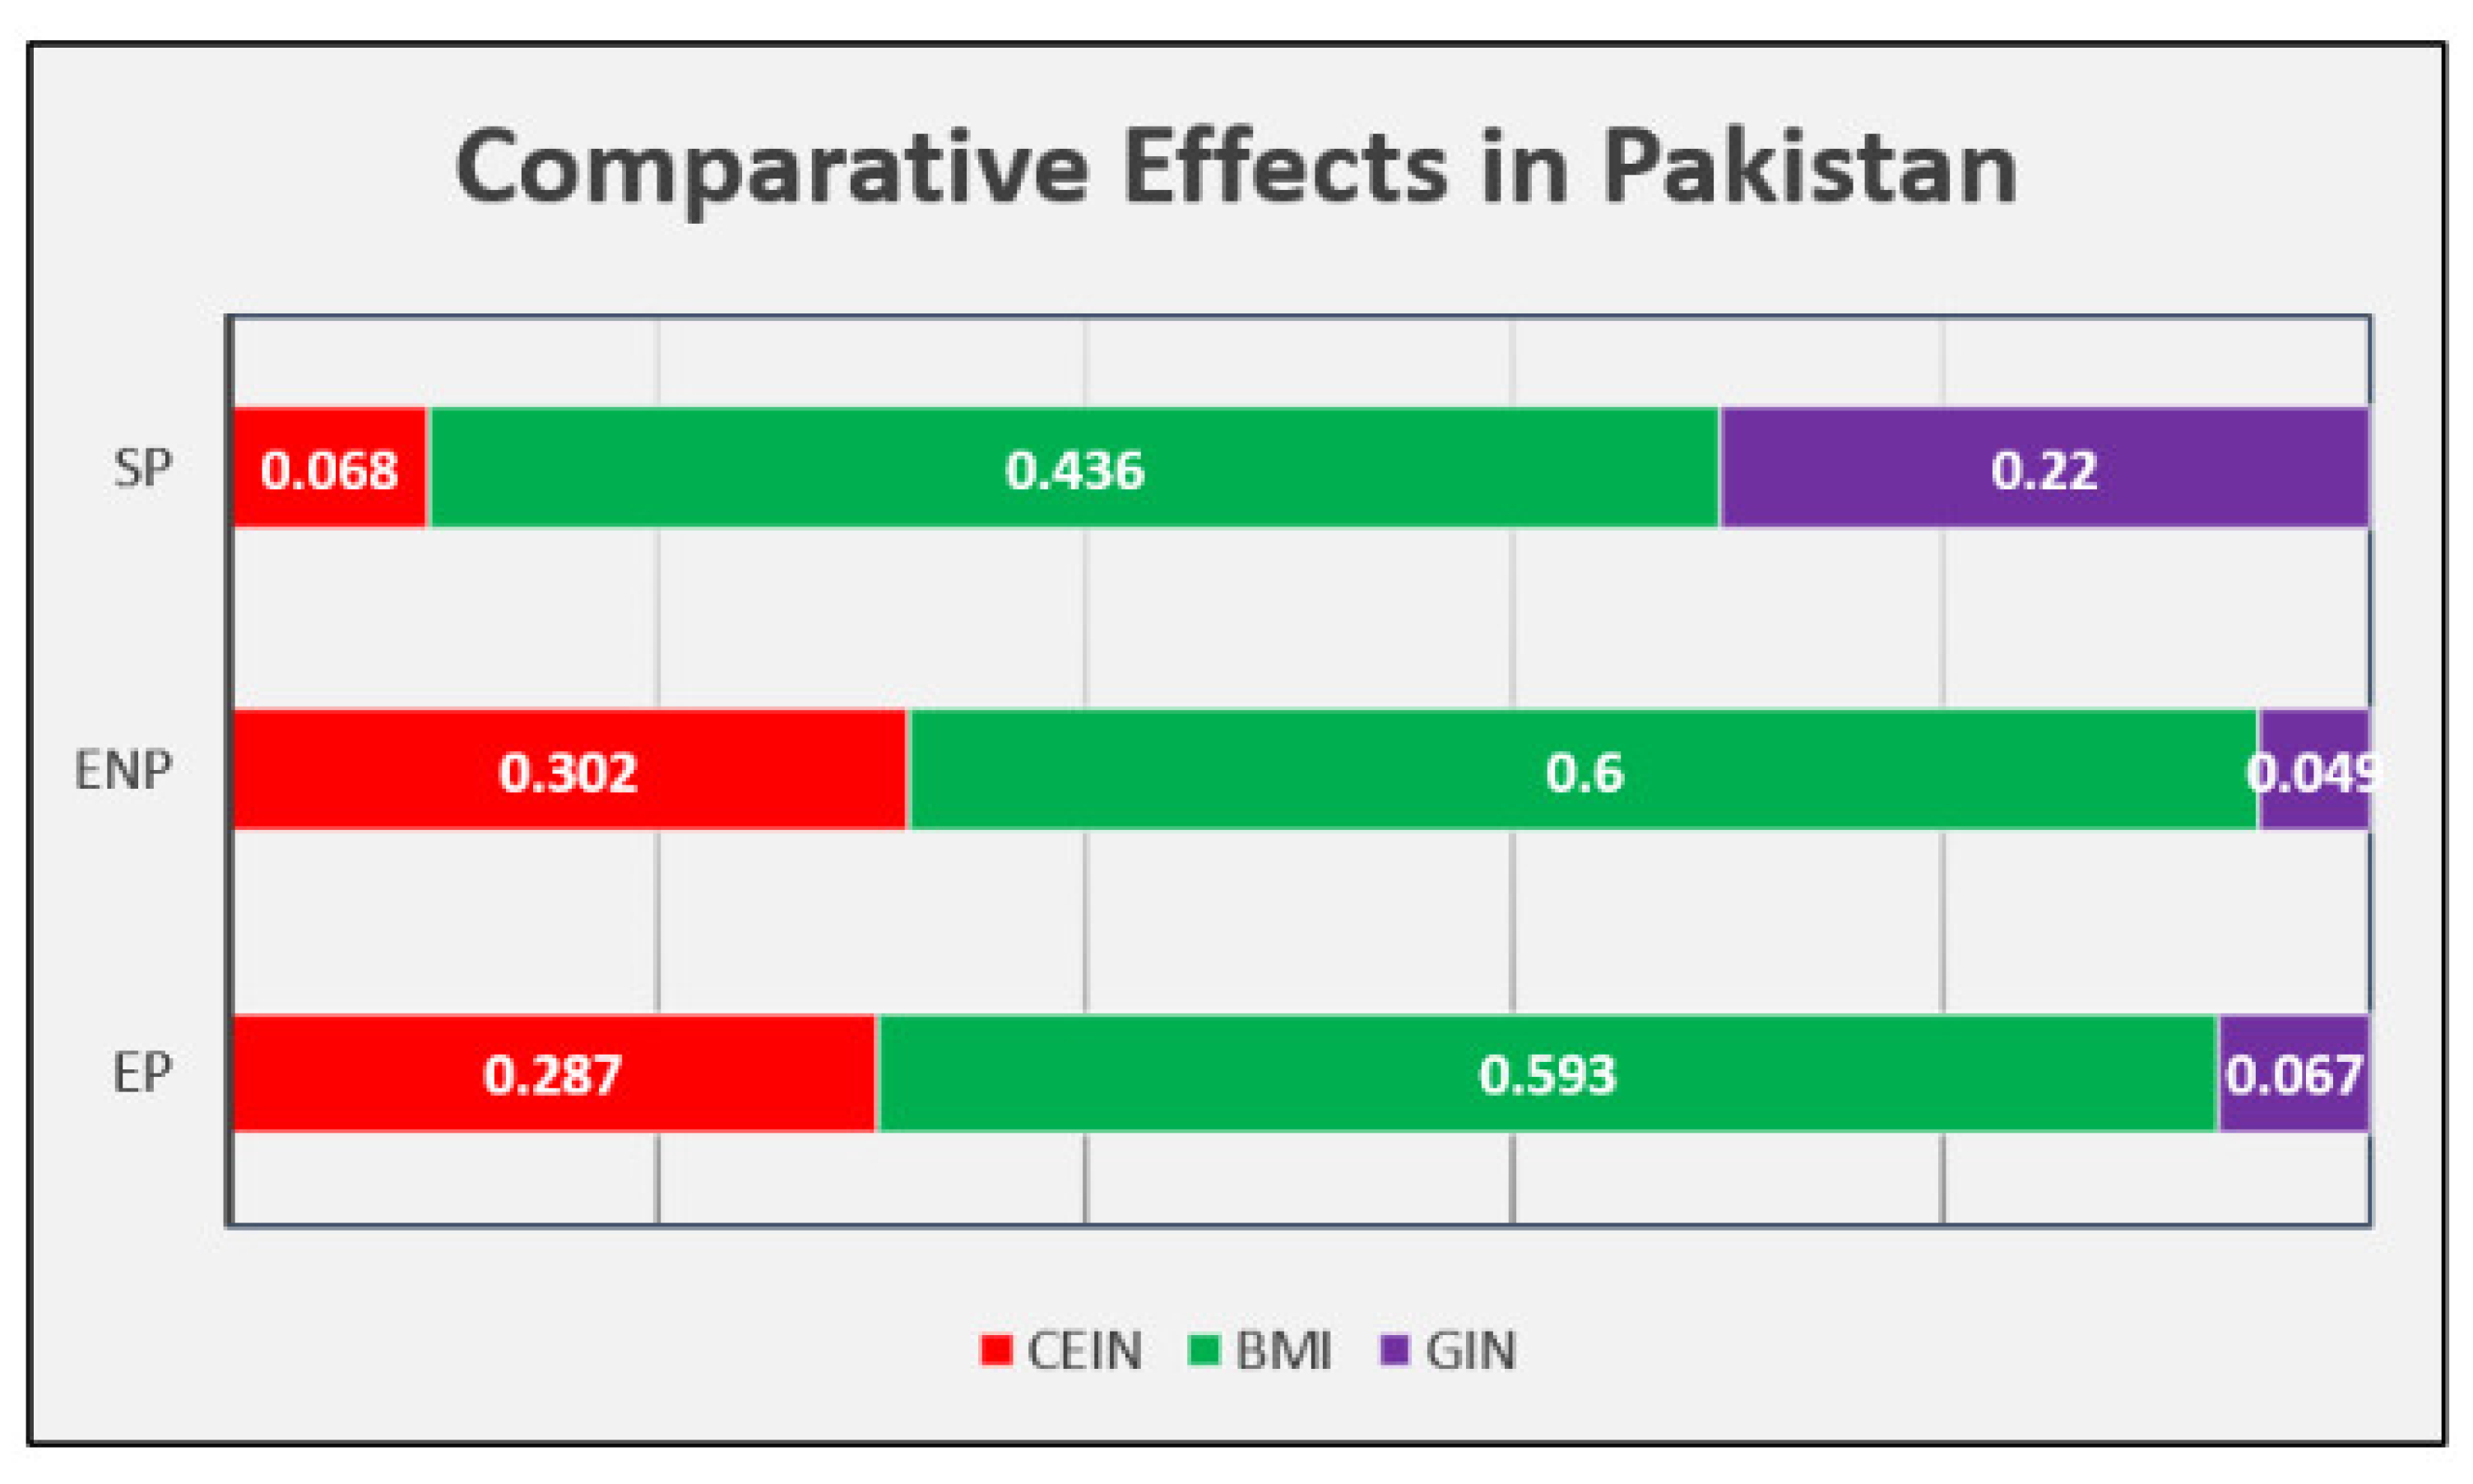
| Pakistan | CEIN→EP | 0.287 | 0.289 | 0.048 | 5.945 | Supported | 0.761 | 0.115 | 2.994 | 0.473 |
| BMI→EP | 0.593 | 0.592 | 0.045 | 13.151 | Supported | 0.510 | 2.889 | |||
| GIN→EP | 0.067 | 0.066 | 0.031 | 2.193 | Supported | 0.015 | 1.235 | |||
| CEIN→ENP | 0.302 | 0.303 | 0.046 | 6.497 | Supported | 0.782 | 0.139 | 2.994 | 0.49 | |
| BMI→ENP | 0.600 | 0.599 | 0.04 | 15.191 | Supported | 0.571 | 2.889 | |||
| GIN→ENP | 0.049 | 0.048 | 0.029 | 2.665 | Supported | 0.009 | 1.235 | |||
| CEIN→SP | 0.068 | 0.068 | 0.081 | 2.839 | Supported | 0.38 | 0.003 | 2.987 | 0.22 | |
| BMI→SP | 0.436 | 0.436 | 0.076 | 5.760 | Supported | 0.106 | 2.853 | |||
| GIN→SP | 0.220 | 0.222 | 0.055 | 3.986 | Supported | 0.064 | 1.262 | |||
| CEIN→GIN | 0.321 | 0.326 | 0.096 | 3.340 | Supported | 0.19 | 0.044 | 2.867 | 0.128 | |
| BMI→GIN | 0.134 | 0.134 | 0.097 | 2.382 | Supported | 0.008 | 2.867 | |||
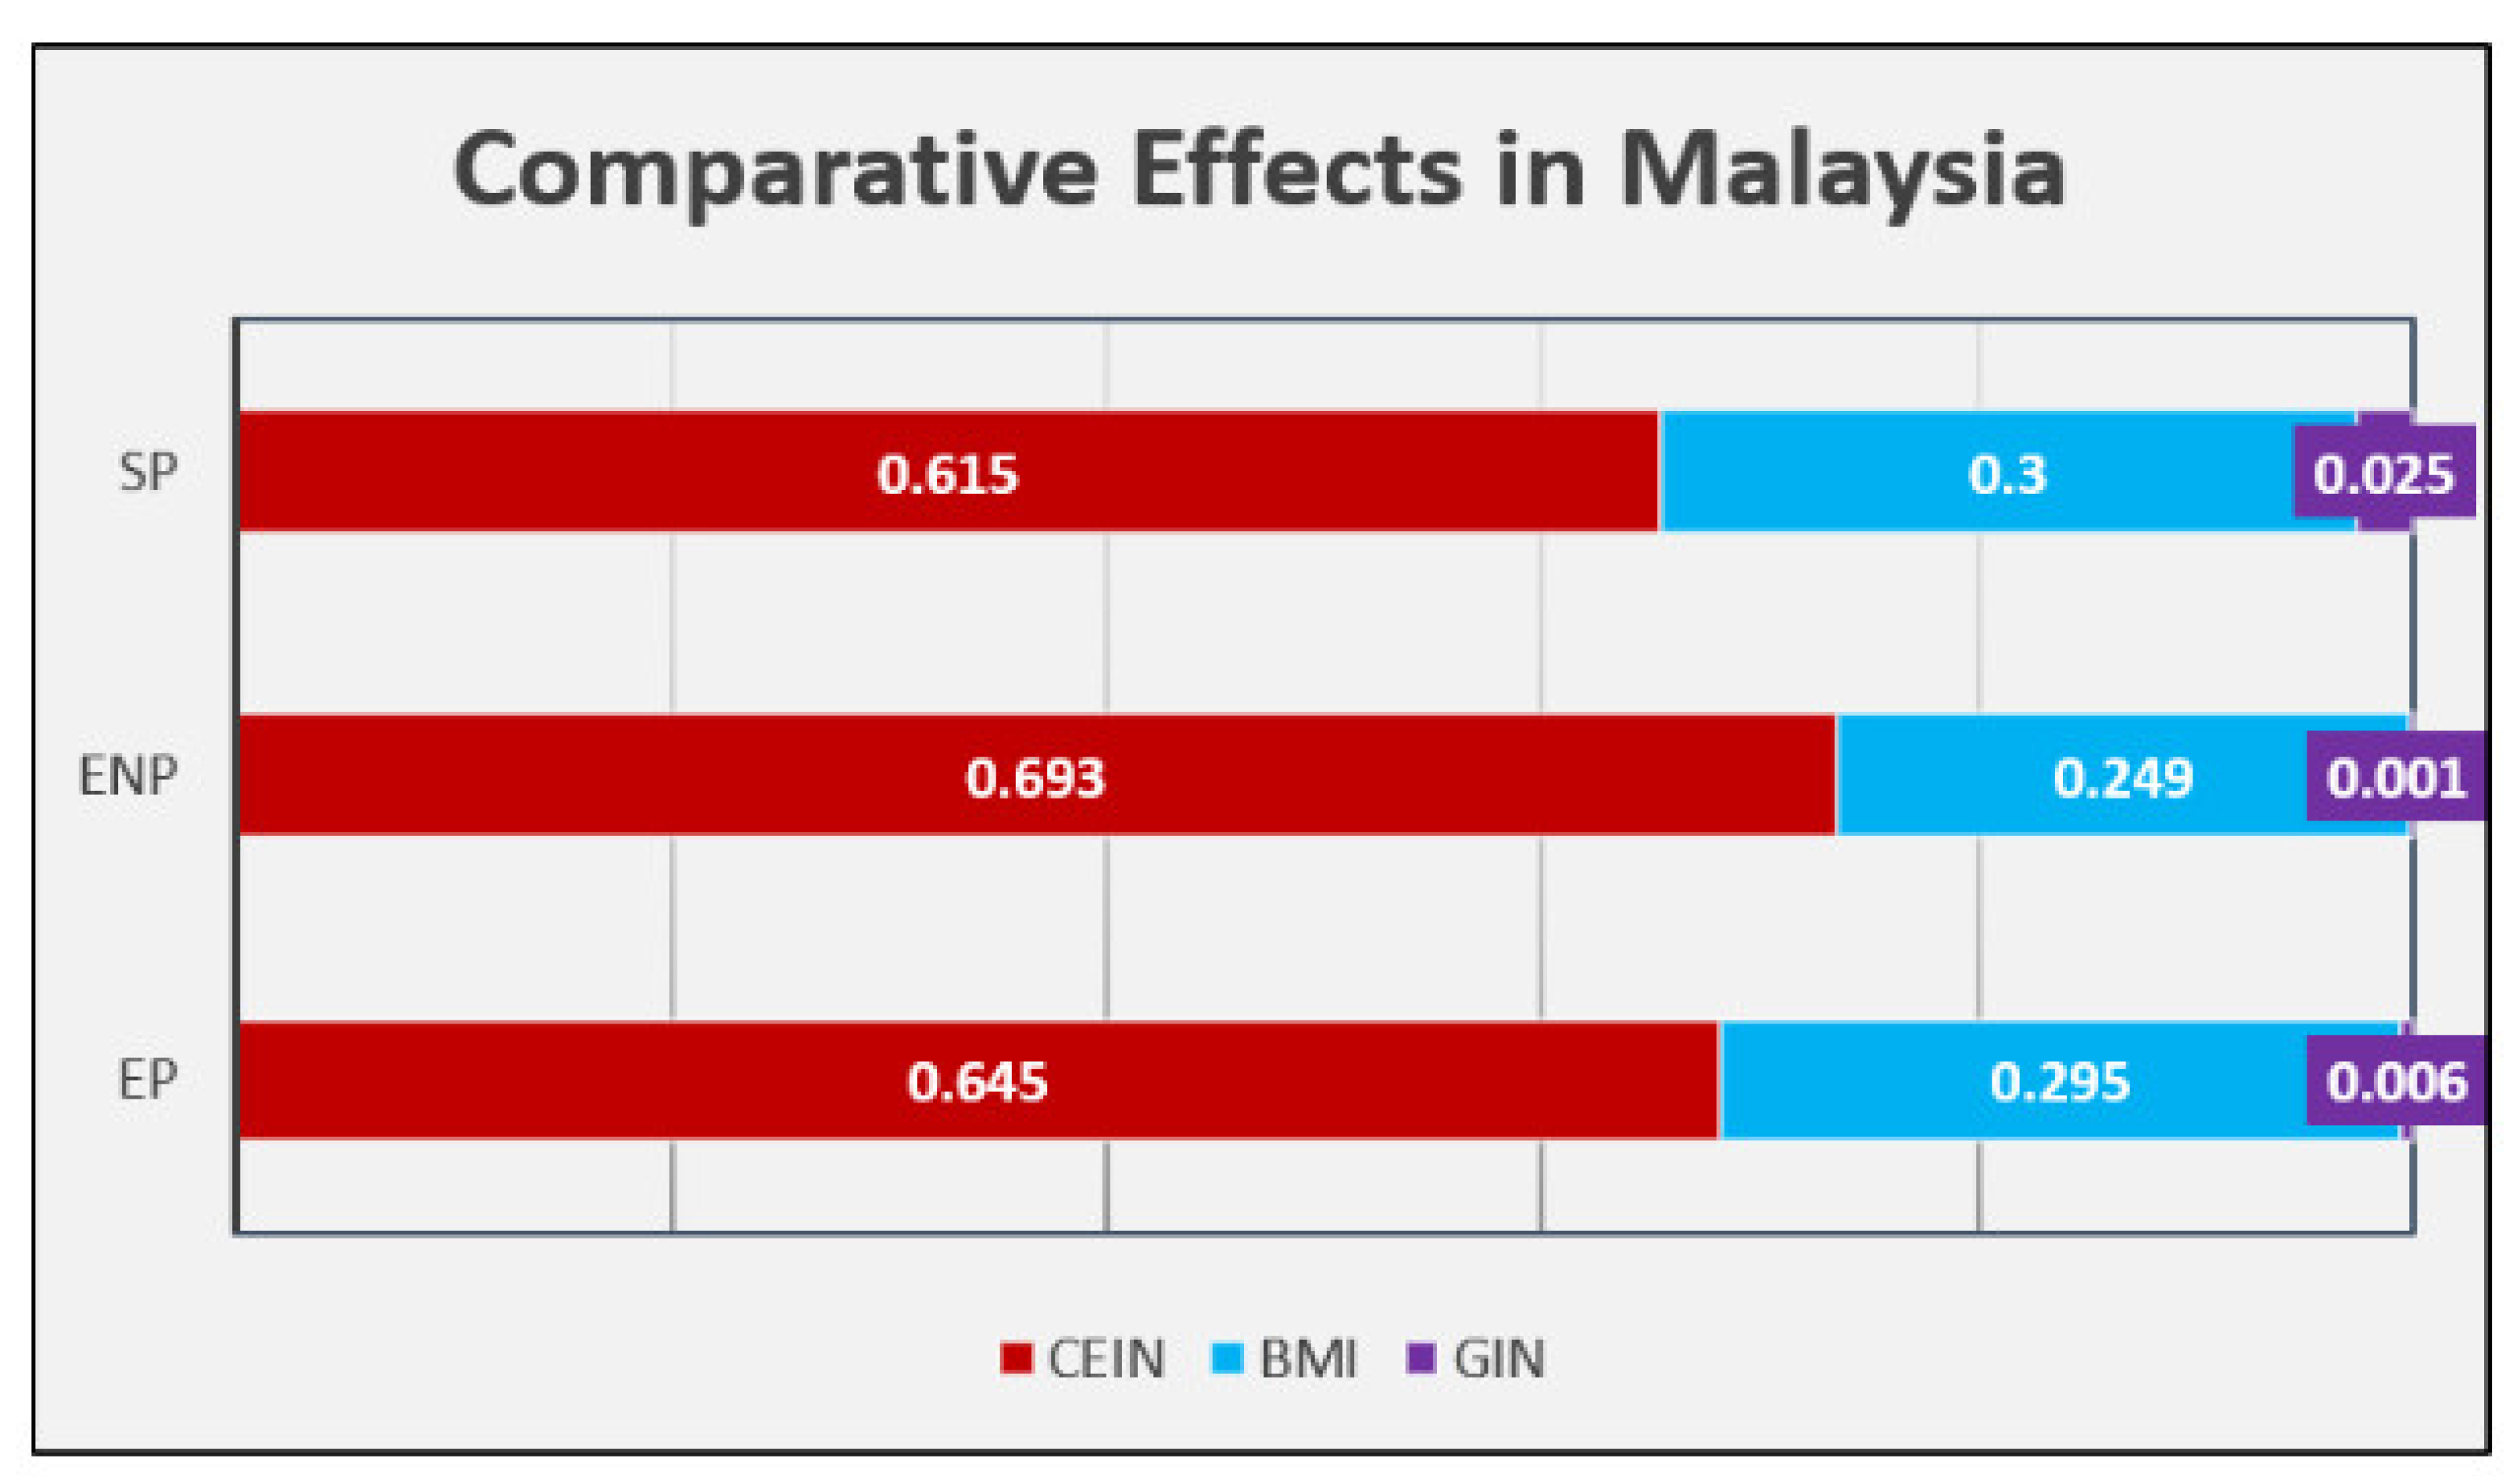
| Malaysia | CEIN→EP | 0.645 | 0.643 | 0.035 | 18.367 | Supported | 0.711 | 0.978 | 1.470 | 0.446 |
| BMI→EP | 0.295 | 0.297 | 0.04 | 7.335 | Supported | 0.190 | 1.582 | |||
| GIN→EP | 0.006 | 0.004 | 0.036 | 2.153 | Supported | 0.000 | 1.361 | |||
| CEIN→ENP | 0.693 | 0.693 | 0.03 | 23.069 | Supported | 0.729 | 1.208 | 1.470 | 0.445 | |
| BMI→ENP | 0.249 | 0.251 | 0.037 | 6.656 | Supported | 0.145 | 1.582 | |||
| GIN→ENP | 0.001 | 0.000 | 0.039 | 0.038 | Not Supported | 0.000 | 1.361 | |||
| CEIN→SP | 0.615 | 0.613 | 0.035 | 17.38 | Supported | 0.686 | 0.818 | 1.470 | 0.427 | |
| BMI→SP | 0.300 | 0.302 | 0.04 | 7.468 | Supported | 0.181 | 1.582 | |||
| GIN→SP | 0.025 | 0.023 | 0.04 | 2.012 | Supported | 0.001 | 1.361 | |||
| CEIN→GIN | 0.220 | 0.221 | 0.061 | 3.631 | Supported | 0.265 | 0.047 | 1.404 | 0.179 | |
| BMI→GIN | 0.362 | 0.361 | 0.06 | 5.990 | Supported | 0.127 | 1.404 | |||
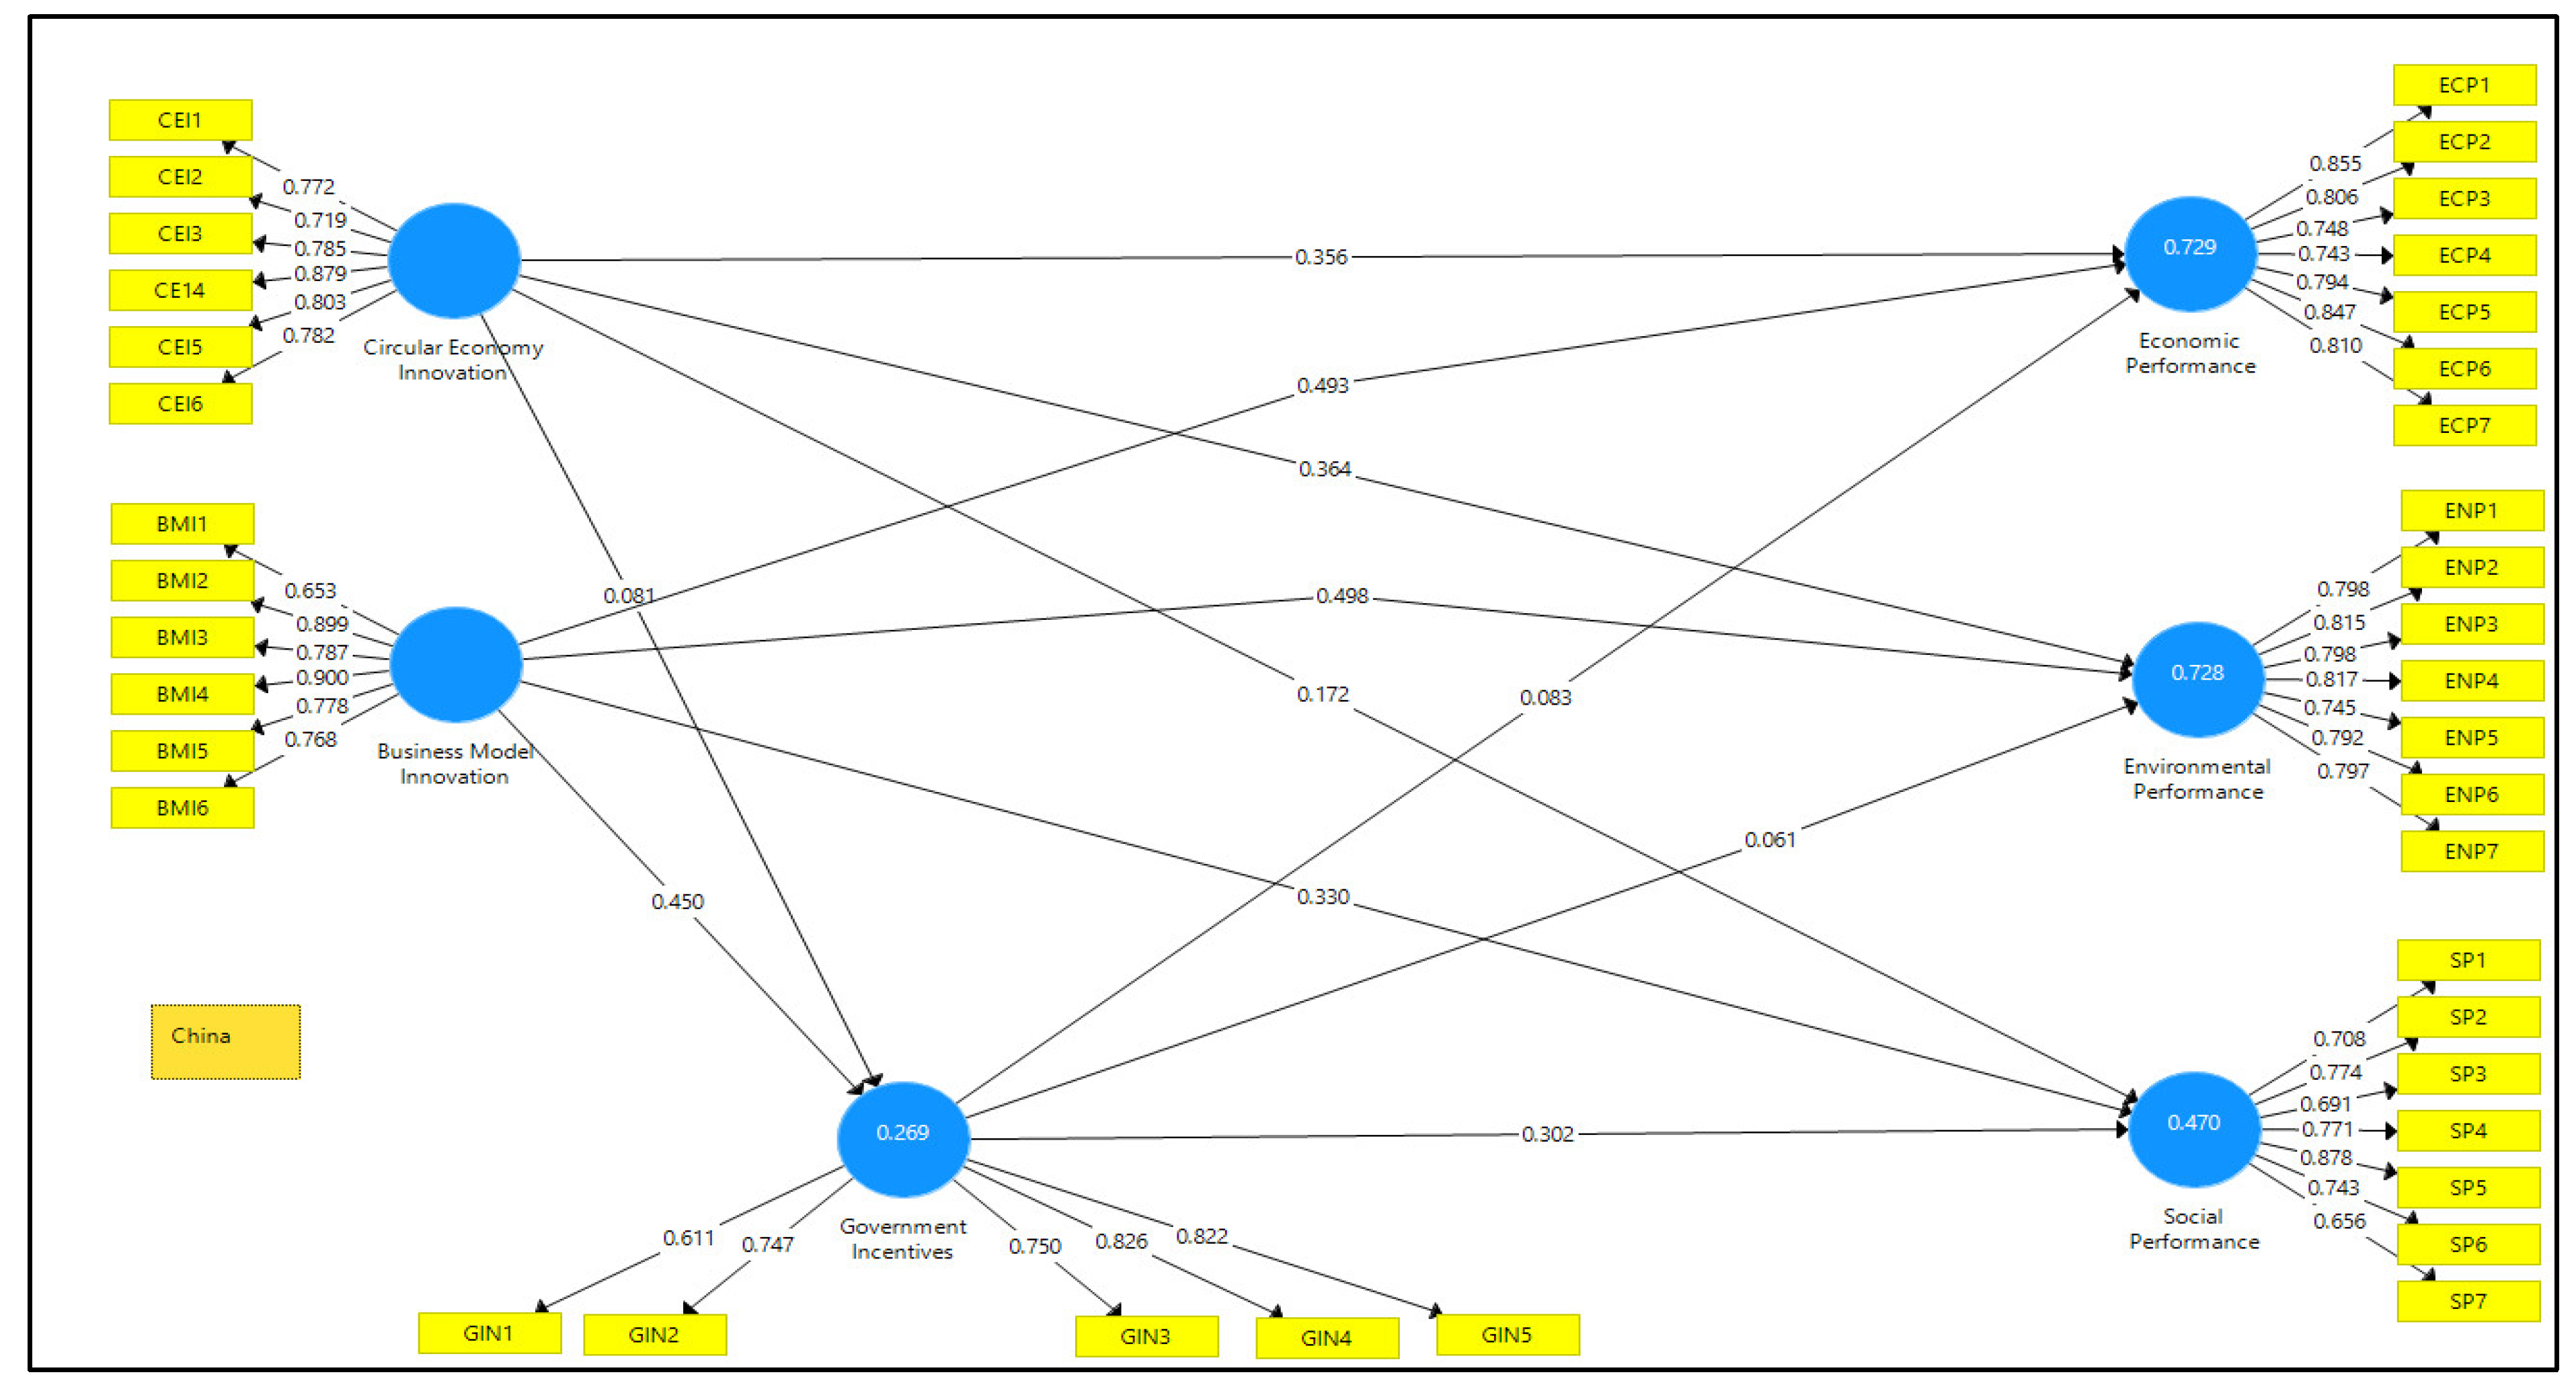
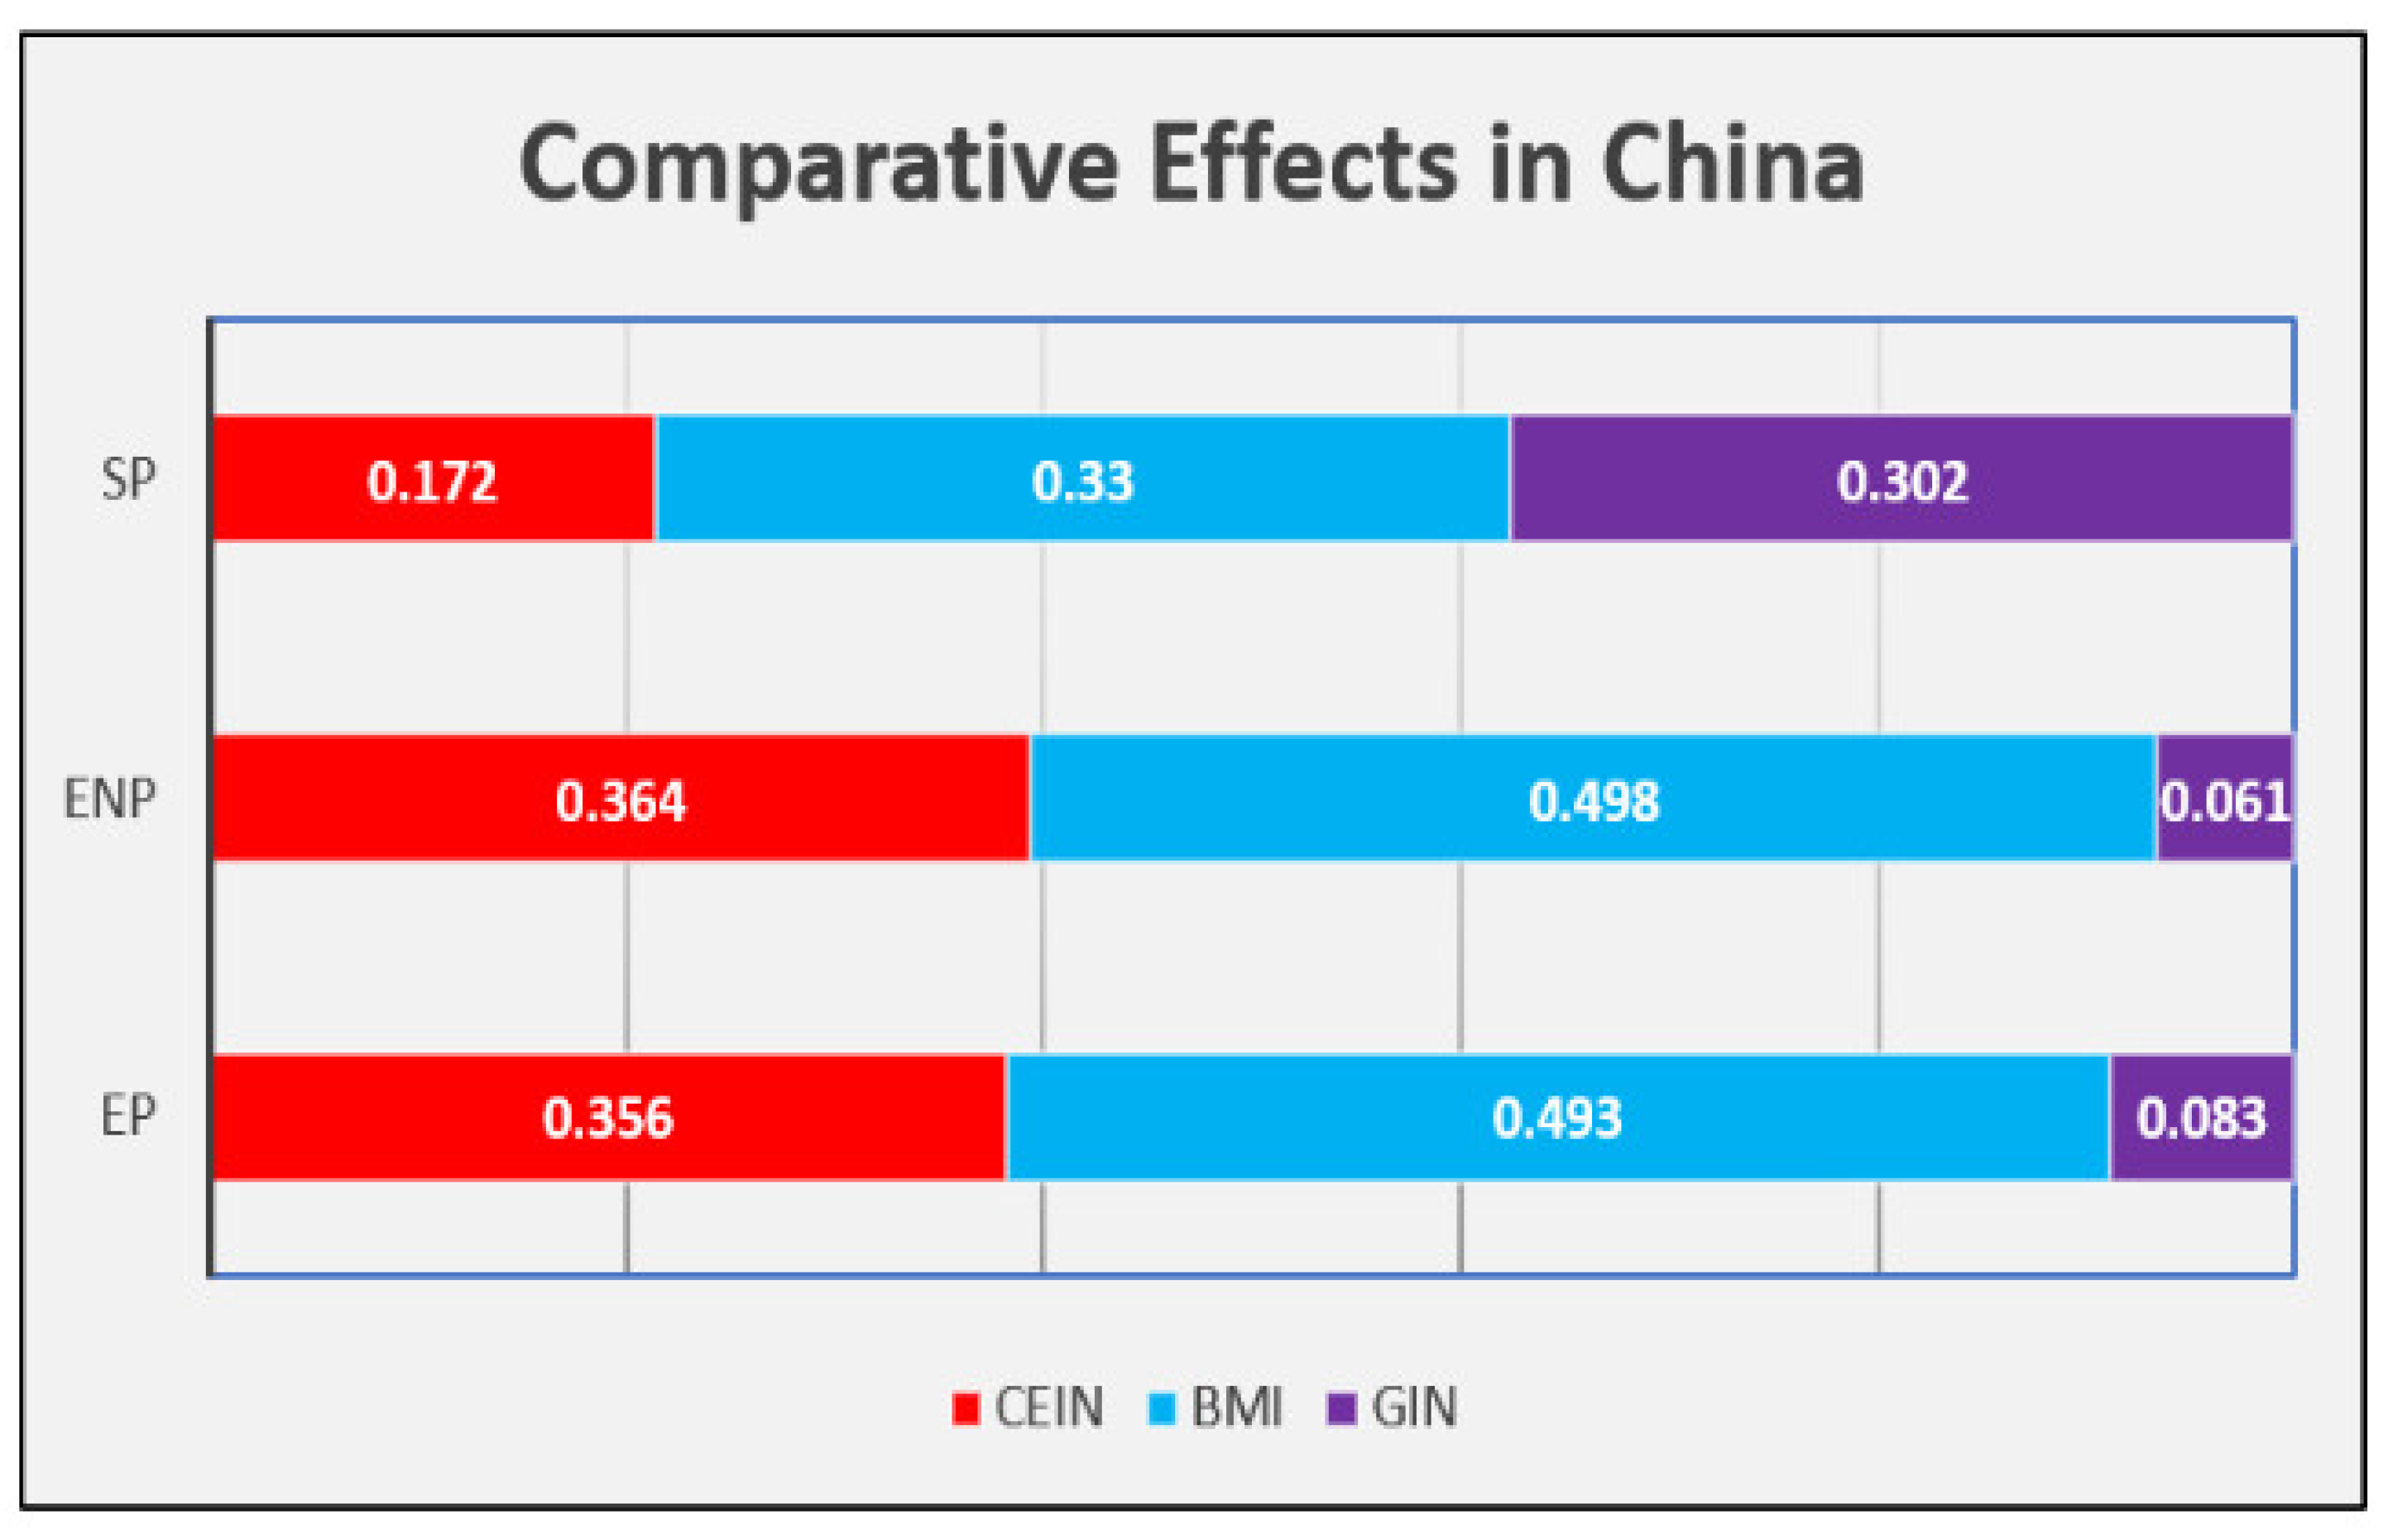
| China | CEIN→EP | 0.356 | 0.359 | 0.046 | 7.658 | Supported | 0.729 | 0.161 | 2.910 | 0.462 |
| BMI→EP | 0.493 | 0.488 | 0.048 | 10.267 | Supported | 0.282 | 3.178 | |||
| GIN→EP | 0.083 | 0.088 | 0.04 | 2.068 | Supported | 0.019 | 1.367 | |||
| CEIN→ENP | 0.364 | 0.366 | 0.044 | 8.277 | Supported | 0.728 | 0.167 | 2.910 | 0.453 | |
| BMI→ENP | 0.498 | 0.493 | 0.047 | 10.671 | Supported | 0.287 | 3.178 | |||
| GIN→ENP | 0.061 | 0.066 | 0.04 | 2.534 | Supported | 0.010 | 1.367 | |||
| CEIN→SP | 0.172 | 0.169 | 0.07 | 2.460 | Supported | 0.47 | 0.019 | 2.750 | 0.243 | |
| BMI→SP | 0.330 | 0.33 | 0.063 | 5.223 | Supported | 0.065 | 3.168 | |||
| GIN→SP | 0.302 | 0.305 | 0.049 | 6.109 | Supported | 0.126 | 1.332 | |||
| CEIN→GIN | 0.081 | 0.086 | 0.086 | 1.988 | Supported | 0.269 | 0.003 | 2.900 | 0.142 | |
| BMI→GIN | 0.45 | 0.453 | 0.085 | 5.293 | Supported | 0.096 | 3.094 |
| Country | Relationship | Estimate | SM | SD | T-Value | CILL | CIUL | Decision |
|---|---|---|---|---|---|---|---|---|
| Pakistan | CEIN→GIN→EP | 0.122 | 0.222 | 0.213 | 1.982 | 0.021 | 0.169 | Supported |
| CEIN→GIN→ENP | 0.148 | 0.416 | 0.312 | 2.318 | 0.035 | 0.256 | Supported | |
| CEIN→GIN→SP | 0.061 | 0.173 | 0.203 | 2.341 | 0.071 | 0.289 | Supported | |
| BMI→GIN→EP | 0.239 | 0.309 | 0.108 | 2.105 | 0.043 | 0.160 | Supported | |
| BMI→GIN→ENP | 0.347 | 0.206 | 0.206 | 3.043 | 0.034 | 0.278 | Supported | |
| BMI→GIN→SP | 0.030 | 0.330 | 0.223 | 2.276 | 0.050 | 0.172 | Supported | |
| Malaysia | CEIN→GIN→EP | 0.261 | 0.101 | 0.308 | 2.146 | 0.021 | 0.173 | Supported |
| CEIN→GIN→ENP | 0.373 | 0.300 | 0.209 | 3.036 | 0.039 | 0.249 | Supported | |
| CEIN→GIN→SP | 0.145 | 0.405 | 0.209 | 2.575 | 0.045 | 0.266 | Supported | |
| BMI→GIN→EP | 0.182 | 0.202 | 0.114 | 2.147 | 0.039 | 0.161 | Supported | |
| BMI→GIN→ENP | 0.191 | 0.200 | 0.214 | 3.037 | 0.056 | 0.239 | Supported | |
| BMI→GIN→SP | 0.169 | 0.409 | 0.115 | 4.588 | 0.048 | 0.184 | Supported | |
| China | CEIN→GIN→EP | 0.117 | 0.207 | 0.209 | 2.793 | 0.009 | 0.222 | Supported |
| CEIN→GIN→ENP | 0.205 | 0.305 | 0.207 | 3.705 | 0.020 | 0.159 | Supported | |
| CEIN→GIN→SP | 0.125 | 0.226 | 0.126 | 2.944 | 0.017 | 0.222 | Supported | |
| BMI→GIN→EP | 0.238 | 0.204 | 0.121 | 3.813 | 0.003 | 0.132 | Supported | |
| BMI→GIN→ENP | 0.227 | 0.203 | 0.202 | 2.389 | 0.008 | 0.071 | Supported | |
| BMI→GIN→SP | 0.236 | 0.338 | 0.035 | 3.836 | 0.007 | 0.089 | Supported |
Publisher’s Note: MDPI stays neutral with regard to jurisdictional claims in published maps and institutional affiliations. |
© 2022 by the authors. Licensee MDPI, Basel, Switzerland. This article is an open access article distributed under the terms and conditions of the Creative Commons Attribution (CC BY) license (https://creativecommons.org/licenses/by/4.0/).
Share and Cite
Rehman, F.U.; Al-Ghazali, B.M.; Farook, M.R.M. Interplay in Circular Economy Innovation, Business Model Innovation, SDGs, and Government Incentives: A Comparative Analysis of Pakistani, Malaysian, and Chinese SMEs. Sustainability 2022, 14, 15586. https://doi.org/10.3390/su142315586
Rehman FU, Al-Ghazali BM, Farook MRM. Interplay in Circular Economy Innovation, Business Model Innovation, SDGs, and Government Incentives: A Comparative Analysis of Pakistani, Malaysian, and Chinese SMEs. Sustainability. 2022; 14(23):15586. https://doi.org/10.3390/su142315586
Chicago/Turabian StyleRehman, Fazal Ur, Basheer M. Al-Ghazali, and Mohamed Riyazi M. Farook. 2022. "Interplay in Circular Economy Innovation, Business Model Innovation, SDGs, and Government Incentives: A Comparative Analysis of Pakistani, Malaysian, and Chinese SMEs" Sustainability 14, no. 23: 15586. https://doi.org/10.3390/su142315586