
Variation and Influencing Factors of Cloud Characteristics over Qinghai Lake from 2006 to 2019
1
College of Geography and Environmental Science, Northwest Normal University, Lanzhou 730070, China
2
Key Laboratory of Resource Environment and Sustainable Development of Oasis, Lanzhou 730070, China
*
Author to whom correspondence should be addressed.
Sustainability 2022, 14(19), 11935; https://doi.org/10.3390/su141911935
Submission received: 27 July 2022
/
Revised: 12 September 2022
/
Accepted: 15 September 2022
/
Published: 22 September 2022
(This article belongs to the Special Issue Oasis Resources Environment and Sustainable Development)
Abstract
:Clouds are an indispensable part of climate change, and the occurrence and development of clouds in the Qinghai Lake area (QHL) have great significance for the regional energy budget and precipitation system. To a certain extent, clouds will affect the water resources, agriculture, animal husbandry, and photovoltaic power industry in this region. In this study, we used CloudSat satellite data, combined with meteorological elements and atmospheric circulation, to analyze the cloud occurrence frequency and cloud water content in QHL. The results demonstrate that the frequency of cloud occurrences in QHL is 33% with a decreasing trend from 2006 to 2019. Altostratus and Nimbostratus are the main types of cloud systems in QHL. The cloud ice water content is 62.21 mg/m3 and the cloud liquid water content is 261.66 mg/m3. The highest value of the vertical cloud fraction occurs from March to June, at a height of 7–11 km in QHL. The height of the mixed-phase clouds is approximately 4–8 km and the ice clouds are above 8 km. The vertical distribution of ice particles is relatively dispersed, while the vertical distribution of liquid particles is relatively concentrated. The time and height of high particle effective radius and high particle concentration are consistent with the high value of cloud water content. The decrease in total cloud occurrence frequency in QHL is caused by the increase in temperature. This study helps to clarify the detailed structure of clouds and the distribution of cloud water resources, which has an important reference value for the study of climate change impact and the sustainable development of lake resources in QHL.
1. Introduction
Global climate change has a significant impact on human survival and development. Under the background of global warming, the current air temperature has increased by 1 °C compared with the pre-industrial period, increasing at 0.2 °C (likely between 0.1 °C and 0.3 °C) per decade [1]. At the same time, the frequency and intensity of the global extreme climate and weather events have also increased significantly. The evolution of lakes is closely related to climate change [2] and it is also an important indicator of climate change [3]. In recent years, influenced by the meltwater of the Qilian Mountain glaciers and increased precipitation in the basin, the water level of QHL has continued rising and its area is gradually expanding [4,5]. The climate of QHL is a typical alpine arid continental climate with a low annual temperature and a large daily temperature range. The annual average temperature ranges from −1.4 °C to 1.7 °C, gradually decreasing from southeast to northwest. The annual average precipitation of the lake area is 319~395 mm, which mainly occurs in summer. The precipitation presents a distribution pattern of less in the southwest and more in the northeast, increasing from the lake center to the surrounding mountains. From the 1960s to the beginning of the 21st century, the water level of QHL continued to drop by 3 m and then rose sharply [6]. The contribution of climate change to lake water volume change was 97.55%, while the local human activities contribution was only 2.45% [7]. Thus, climate change has a dominant influence on water volume change in QHL. The unique natural condition makes QHL a treasure trove of biological species on the Tibetan Plateau (TP). Clouds are the main influencing factor of precipitation and radiation budget in the region, which affect the agriculture, animal husbandry, and photovoltaic power generation industry in the region to a certain extent. Therefore, it is of great significance to study the occurrence and development of clouds in QHL for wetland protection, ecological security, and resource utilization. It is of great significance to analyze the climate change of TP by monitoring and studying the meteorological elements of lakes on TP [8].
Clouds are an important factor in climate change [9,10]. Acting as a radiative forcing and feedback factor in the atmosphere, clouds play an important role in regulating the global and regional energy balance [11,12]. Clouds are also important for the water cycle. As the link between the various spheres of the climate systems, clouds affect the coupling between the atmosphere and the underlying surface through different physical processes [13,14,15]. These effects are mainly realized through the macroscopic and microscopic characteristics such as cloud amount, cloud type, cloud water content, cloud height, cloud thickness, cloud phase state, and the size of cloud droplets and cloud crystals [16,17]. Therefore, a comprehensive understanding of the distribution and variation of cloud characteristic parameters and its main influencing factors is important to assess the role of clouds in climate change.
The early research data on cloud characteristics mainly came from surface observation. The research mainly focused on cloud fraction, cloud distribution characteristics, and their formation causes. By analyzing the surface observation data of the former Soviet Union, it is found that the low-level cloud cover decreased significantly from 1936 to 1990 [18]. Based on the analysis of the cloud cover data of the ground stations on TP, it is concluded that the total cloud amount distribution on the plateau decreased from southeast to northwest, and there was a significant decreasing trend in the changes in annual and seasonal total cloud amount [19].
With the development of satellite technology, the research results of clouds using satellites have become more accurate. By comparing and analyzing the ground observation data and satellite data, the total cloud cover from the satellites can better reveal the cloud climate characteristics of TP [20]. The CloudSat satellite was launched in 2006. It can simultaneously observe most of the condensation clouds and precipitation in its lowest field of view, provides profiles with these characteristics, and quantitatively detects the internal structure of clouds [17], providing a new method to study the structural characteristics of clouds in TP. Based on CloudSat data, the study found that the ice cloud frequently occurs during the cold season over TP, while the mixed-phase cloud fraction is more frequent during the warm season. In addition, the liquid cloud exhibits a weak seasonal variation, and the relative cloud fraction is very low [21]. In the Northern Hemisphere, the number of deep cloud systems (DCS) reached a maximum in summer and a minimum in winter. Seasonal variations in the number of DCS varied zonally in the Southern Hemisphere. DCS occurred most frequently over central Africa, the northern parts of South America and Australia, and Tibet [22]. The statistical results show that high clouds, altostratus, altocumulus, and cumulus tend to coexist with other cloud types. However, stratus (or stratocumulus), nimbostratus, and convective clouds are much more likely to exhibit individual features than other cloud types [23]. Based on CloudSat and CALIPSO data to analyze the global cloud distribution characteristics, the study concluded that the global average total cloud amount is approximately 0.69, with a high amount of cloud area mainly concentrated in the westerlies near 60° S and a low amount of cloud area concentrated in the desert region of North Africa and the northern Indian Ocean [24]. In the study of the summer cloud vertical structure over the eastern part of TP, it is concluded that the clouds in the eastern part of TP can reach the stratosphere in summer, the water clouds are below 5 km, the mixed-phase clouds with liquid and ice phase are between 5~10 km, and the ice clouds are above 10 km [25]. The occurrence frequency of clouds on TP is 35%, with the maximum frequency of the low clouds close to 21%, followed by mid-level clouds with 14%, and the minimum frequency of the high clouds [26].
Many scholars at home and abroad have used ground observation data and satellite remote sensing data to carry out relevant research on the characteristics of cloud cover, cloud height, and vertical structure of the global and TP, and have achieved some results [18,19,20,21,22,23,24,25,26]. However, the research on the distribution of different types of clouds and their internal characteristic parameters in the local range of TP is not comprehensive. There are few surface stations in the plateau area, and there is a lack of detailed cloud observation data. Therefore, satellite data provide a great deal of help to study cloud systems over TP. The innovation of this paper is the use of CloudSat satellite data to study and analyze the vertical structure of small-scale cloud systems in QHL. By using the CloudSat data from 2006 to 2019, this study analyzed the occurrence frequency, water content, and vertical structure of cloud systems in QHL, and systematically analyzed the spatial-temporal variation characteristics and influencing factors of cloud systems in QHL. It will intuitively understand the temporal changes of clouds and cloud water resources over QHL. This provides data and theoretical support for the changes in water resources in QHL.
2. Materials and Methods
2.1. Study Area
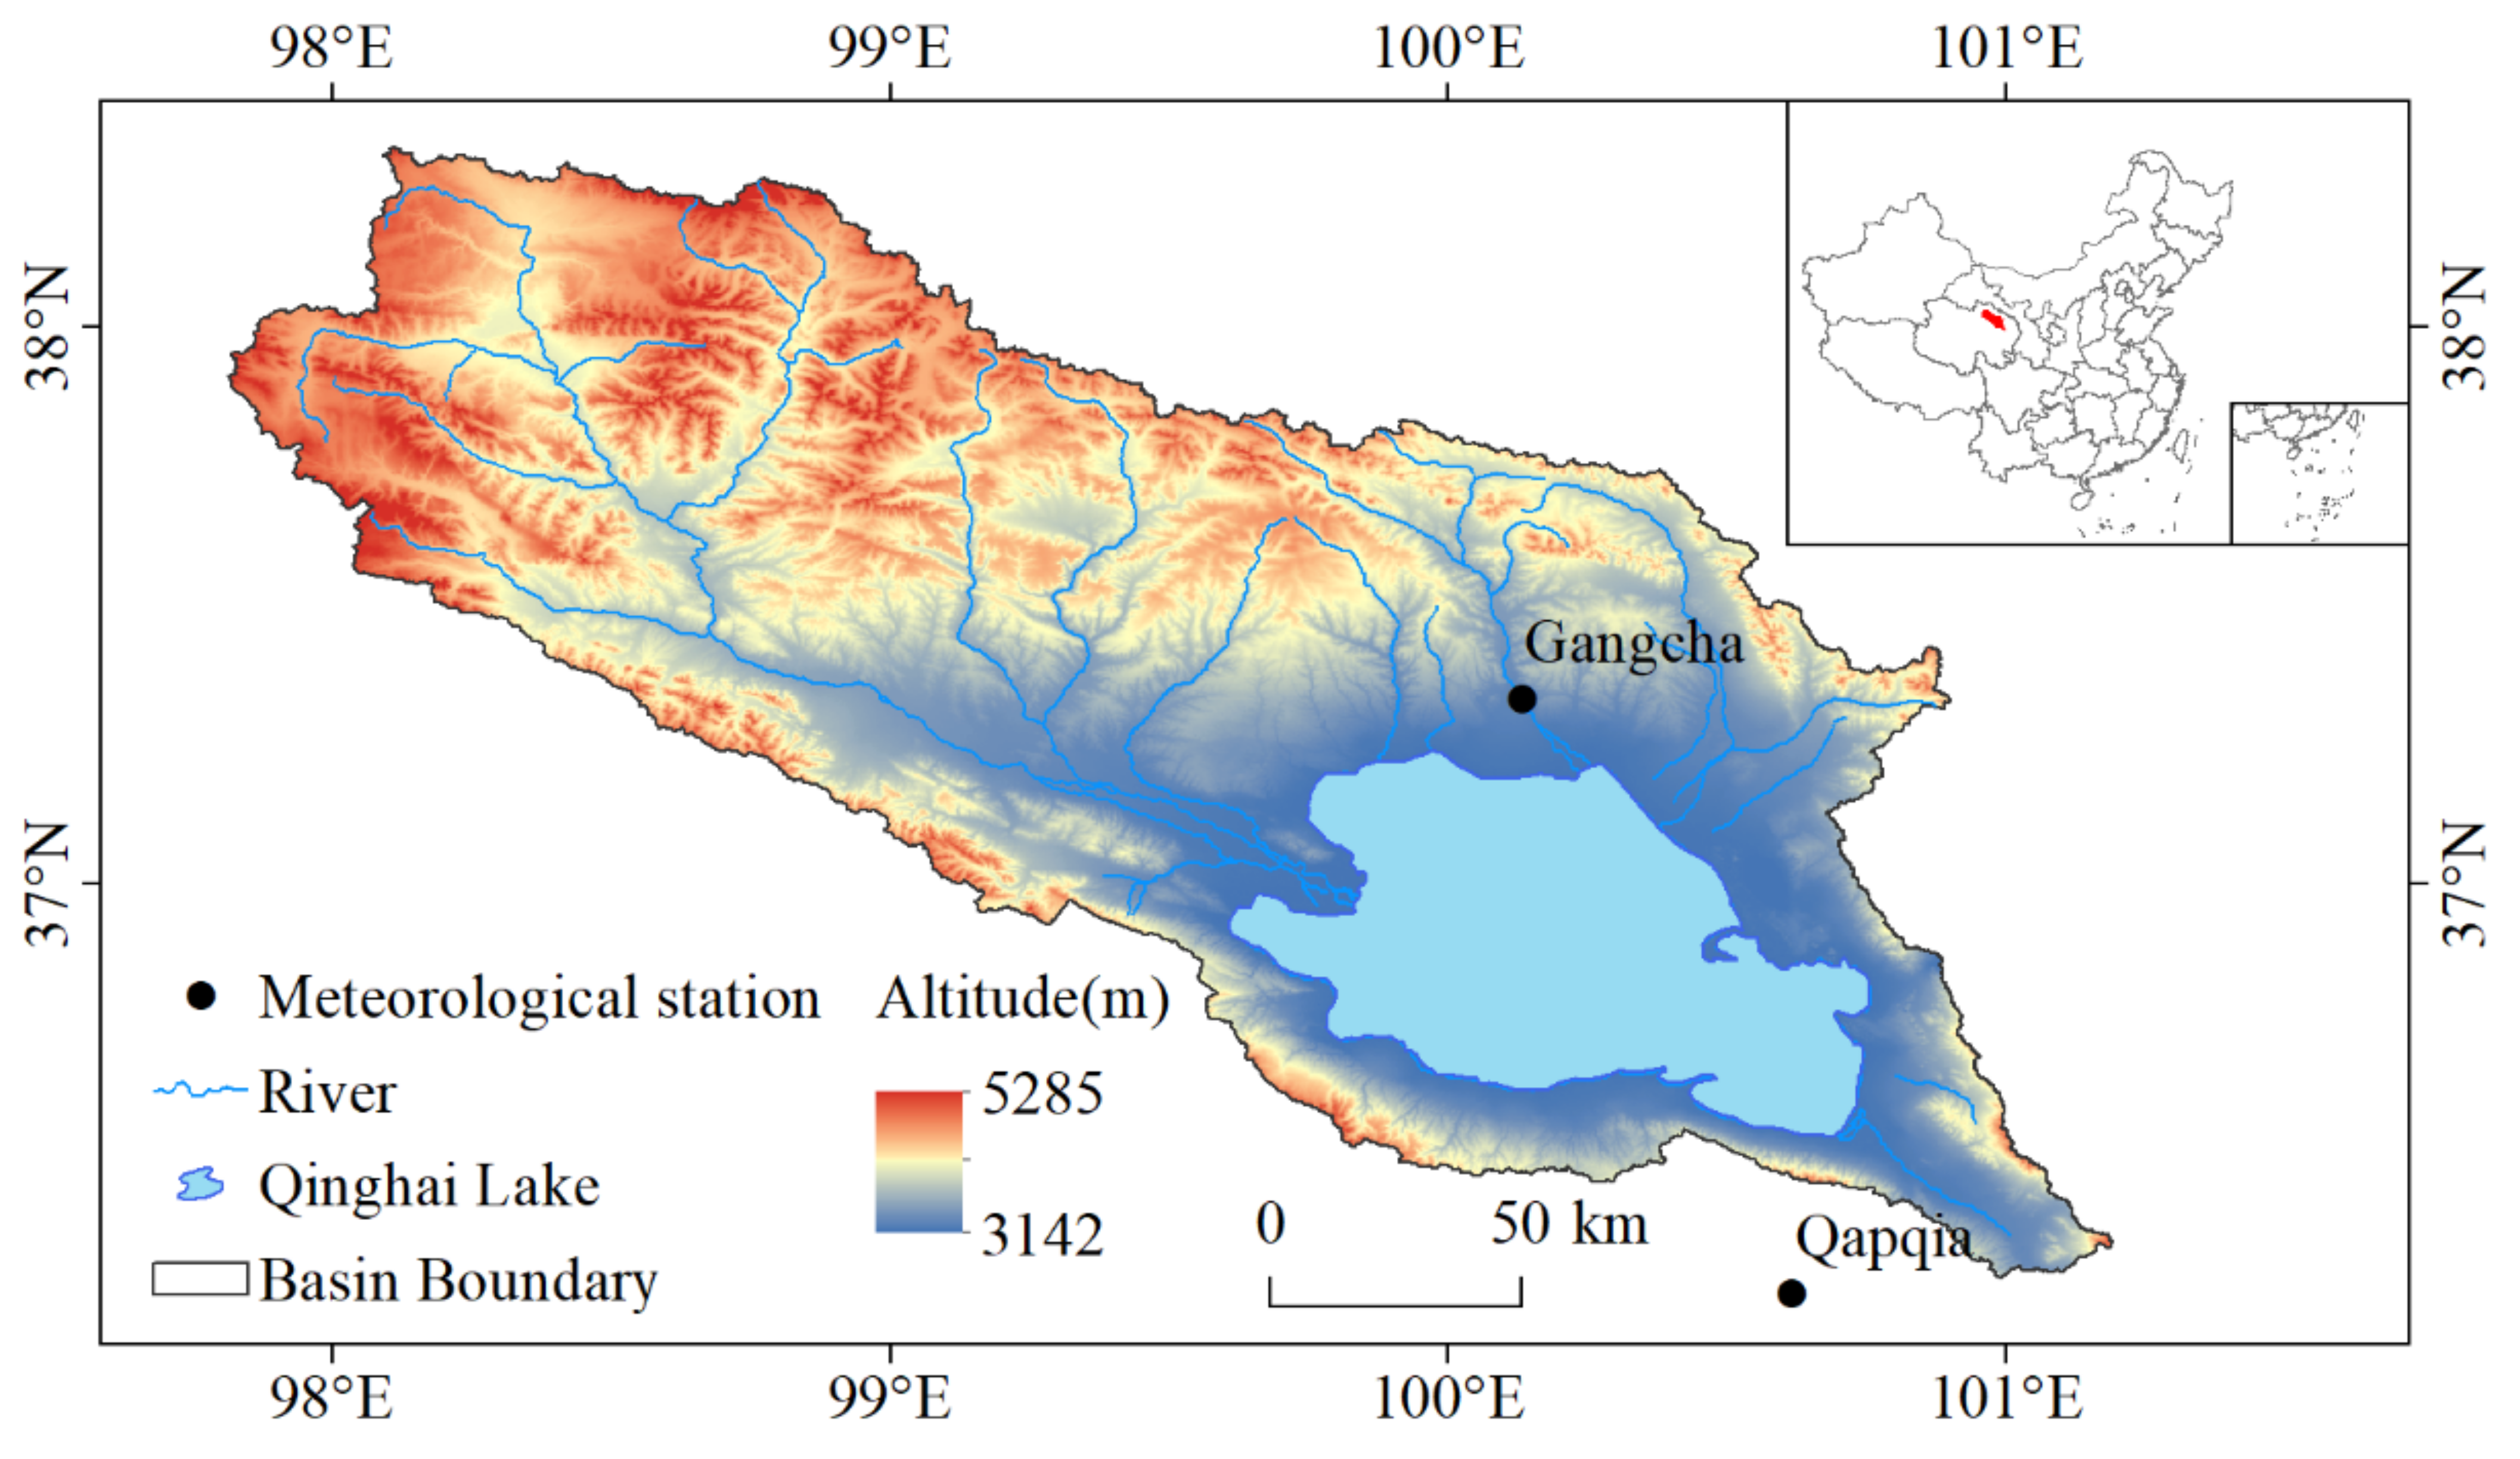
QHL is the largest inland plateau saltwater lake in China, located in the northeastern part of TP (36°31′~37°15′ N, 99°36′~100°47′ E). QHL is not only an important water body to maintain ecological security in the northeast of TP, but also a natural barrier to prevent the eastward spread of desertification, which has an important ecological status. QHL is formed by fault depression, and the terrain is high in the northwest and low in the Southeast. The average elevation is approximately 3200 m. The length is approximately 109 km from east to west and the width is approximately 39.8 km from north to south. The climate in QHL is becoming warmer and more pluvial, and the lake water volume decreased by 9.48 km3 from 1975 to 2004 and increased by 15.18 km3 from 2005 to 2020 [7].
2.2. Data Resources
2.2.1. CloudSat Data
The CloudSat satellite, launched on 28 April 2006 in the United States, is a member of the A-Train satellite observing system, and its primary mission is to provide observation data of the vertical structure of clouds. The CloudSat carries a 94 GHz millimeter-wavelength cloud profiling radar (CPR), which points nominally in the nadir direction to probe the vertical structure of clouds and precipitation [27]. The CloudSat CPR has a minimum sensitivity of −30 dBZe with a 480 m effective vertical resolution, but the measurements are reported on an increment of 240 m with 125 vertical layers. The footprint for a single profile is approximately 1.3 km across-track by 1.7 km along-track, with along-track sampling spaced every 1.1 km [28], which provides a high vertical resolution.
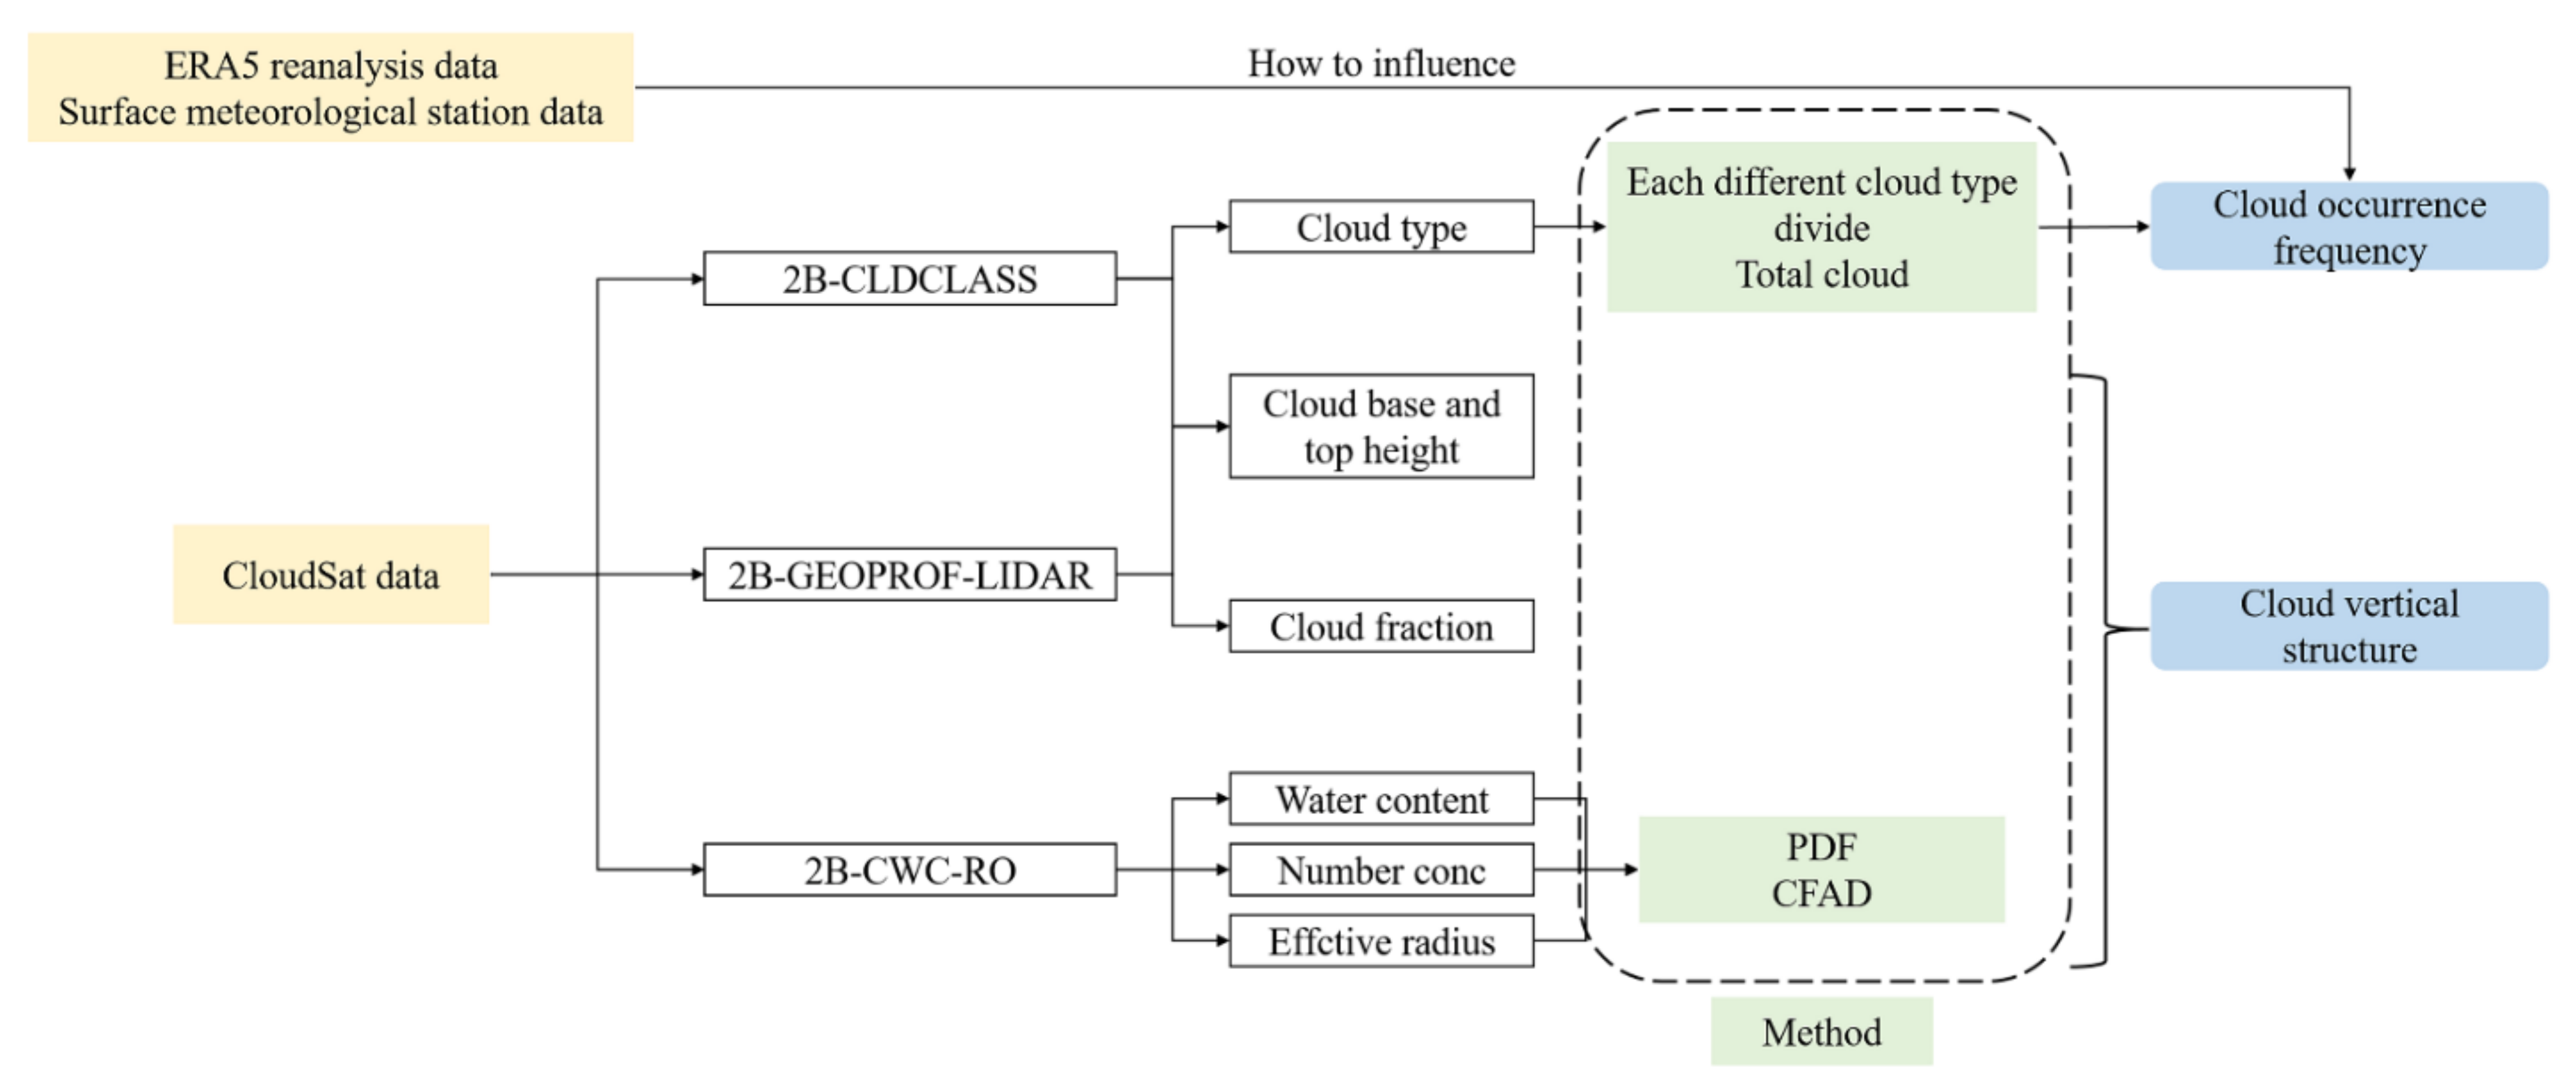
In this study, 2B-GEOPROF-LIDAR, 2B-CLDCLASS, and 2B-CWC-RO were used, and the data period was from June 2006 to July 2019. In this period, the CloudSat satellite had a total of 37,912 detection grid points over QHL. The 2B-GEOPROF-LIDAR product indicates the fraction of each GEOPROF radar volume that contains a lidar cloud detection (detected using 5 km or shorter along-track averaging), as well as a variety of summary values (such as the height of the highest detected cloud). 2B-CLDCLASS classifies clouds into either stratus (St), stratus (Sc), cumulus (Cu, including cumulus congestus), nimbostratus (Ns), altocumulus (Ac), altostratus (As), deep convective (DC) (cumulonimbus), or high clouds (cirrus and cirrostratus), based on different rules for hydrometeor vertical and horizontal scales. The CloudSat Radar-Only Cloud Water Content Product (2B-CWC-RO) contains retrieved estimates of cloud liquid and ice water content, effective radius, and related quantities for each radar profile measured by the CPR on CloudSat. Retrievals are performed separately for the liquid and ice phases; the two sets of results are then combined in a simple way to obtain a composite profile that is consistent with the input measurements [29,30,31]. CloudSat satellite data are freely available from NASA (http://www.cloudsat.cira.colostate.edu/data_dist/OrderData.php (accessed on 26 April 2021)).
2.2.2. Surface Meteorological Data and Reanalysis Data
The surface meteorological data of QHL used the daily data of Gangcha station and Qapqia station from 2006 to 2019 in the datasets of daily values of terrestrial climate information for China (V3.0). Meteorological elements include temperature, evaporation, relative humidity, precipitation, and wind speed. The surface meteorological data were obtained from the China Meteorological Data Service Centre (http://data.cma.cn/en (accessed on 30 April 2021)), and the locations of the stations are shown in Figure 1.
ERA5 is the fifth generation of reanalysis information from the European Centre for Medium-Range Weather Forecasts (ECMWF) (http://www.ecmwf.int/datasets (accessed on 30 April 2021)) for global climate and weather change analysis. We used ERA5 information in characterizing the large-scale atmospheric circulation with data from June 2006 to July 2019 and a spatial resolution of 0.25° × 0.25°. Meteorological factors include the U-component of wind, the V-component of wind, relative humidity, and temperature. All the data product descriptions are shown in Table 1.
2.3. Method
2.3.1. Cloud Type Classify
The cloud classification product (2B-CLDCLASS) is used in the statistics of cloud occurrence frequency. In this study, Sc, Cu, Ns, and DC are classified as low clouds, Ac and As are classified as mid-level clouds, and Ci is classified as high clouds [26]. Cloud height is defined as the height relative to the sea level. The basic characteristics of different types of clouds are shown in Table 2.
2.3.2. PDF and CFAD
In this study, we used the probability density function (PDF) and the contoured frequency by altitude diagram (CFAD) to analyze the cloud microphysics vertical structure. PDF can reflect the frequency distribution of cloud physical quantities. The standardized CFAD states that the frequency of occurrence of a physical quantity at a certain height is the frequency of occurrence of the physical quantity at that height divided by the sum of samples at all heights. This method can analyze the cloud spectrum characteristics in detail [32,33]. The technology roadmap of this study is shown in Figure 2.
3. Results
3.1. Cloud Occurrence Frequency
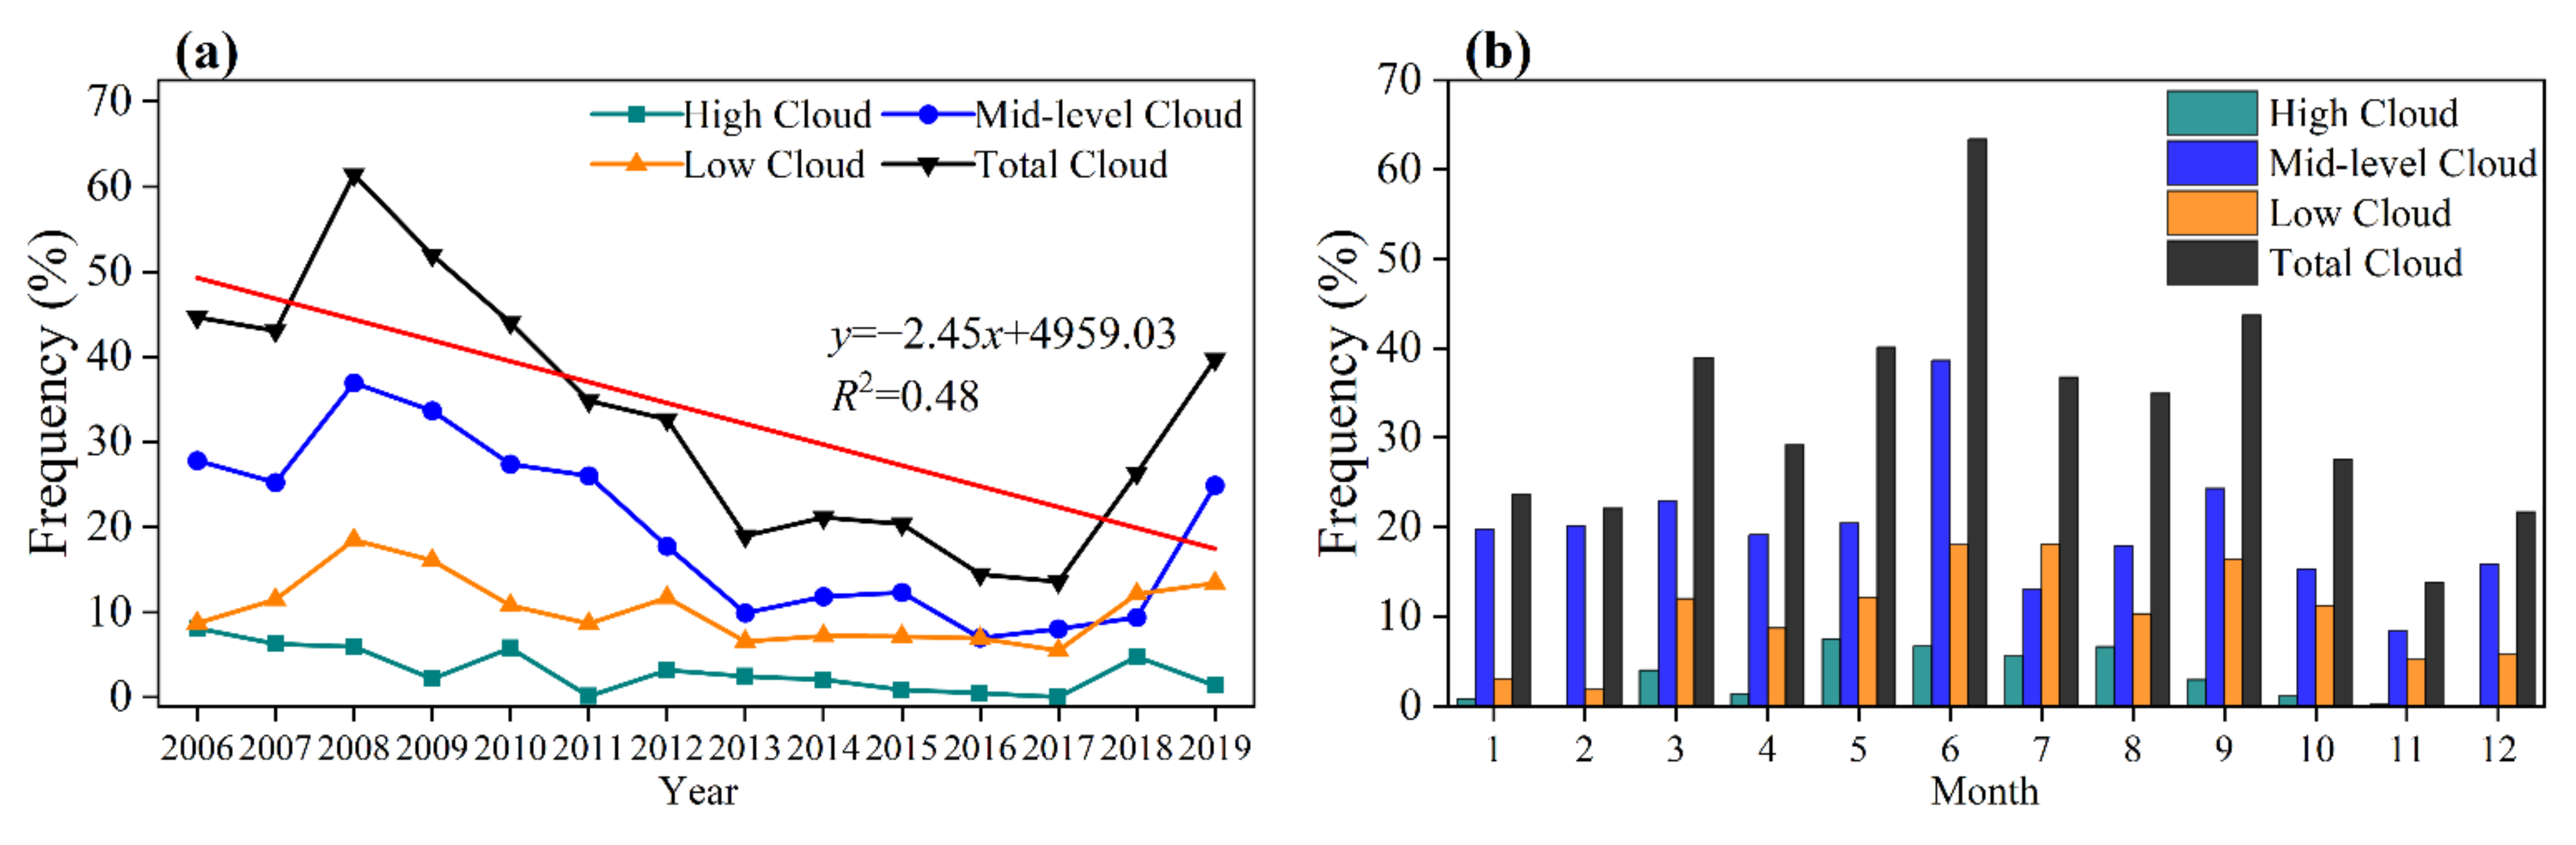
Figure 3 shows the occurrence frequency of clouds over QHL. The results show that the cloud systems in QHL are dominated by mid-level and low clouds, and the frequency of high clouds is low. The annual average of the total cloud occurrence frequency is approximately 33.3%. The occurrence frequency of the mid-level clouds is the highest, followed by the low clouds, and the occurrence frequency of the high clouds is the lowest, with occurrence frequencies of 19.6%, 10.4%, and 3.3%, respectively. The annual average of the total cloud frequency in QHL shows a decreasing trend, with a decreasing rate of 2.45%/a (Figure 3a). The decrease in the total cloud occurrence frequency is mainly affected by the changes in the high clouds and the mid-level clouds, and the results are consistent with those of Warren et al. [34]. QHL is located in the eastern part of the Qilian Mountains. The mountain terrain in the north and south of QHL affects the local circulation. On the small scale, the cold air entering QHL and the terrain affect the formation of clouds [35]. The distribution of monthly average cloud occurrence frequency in QHL shows obvious seasonal change characteristics. The cloud occurrence frequency is high in spring and summer, and low in autumn and winter. The frequency of the total clouds and mid-level clouds is the highest in June and lowest in November. The frequency of the high clouds and low clouds is highest in May and July and lowest in December and February (Figure 3b). This is due to the strong convective activity in spring and summer around QHL, with sufficient water vapor convergence. The rising motion exists only on the western Plateau in winter and then spreads to the whole Plateau as the season progresses. The monsoon onset over Asia is an interactive process between the plateau-induced circulation and the circulation associated with the principal rain belt migrating northward [36], and this also affects the circulation situation in QHL.
3.2. Cloud Types Occurrence Frequency
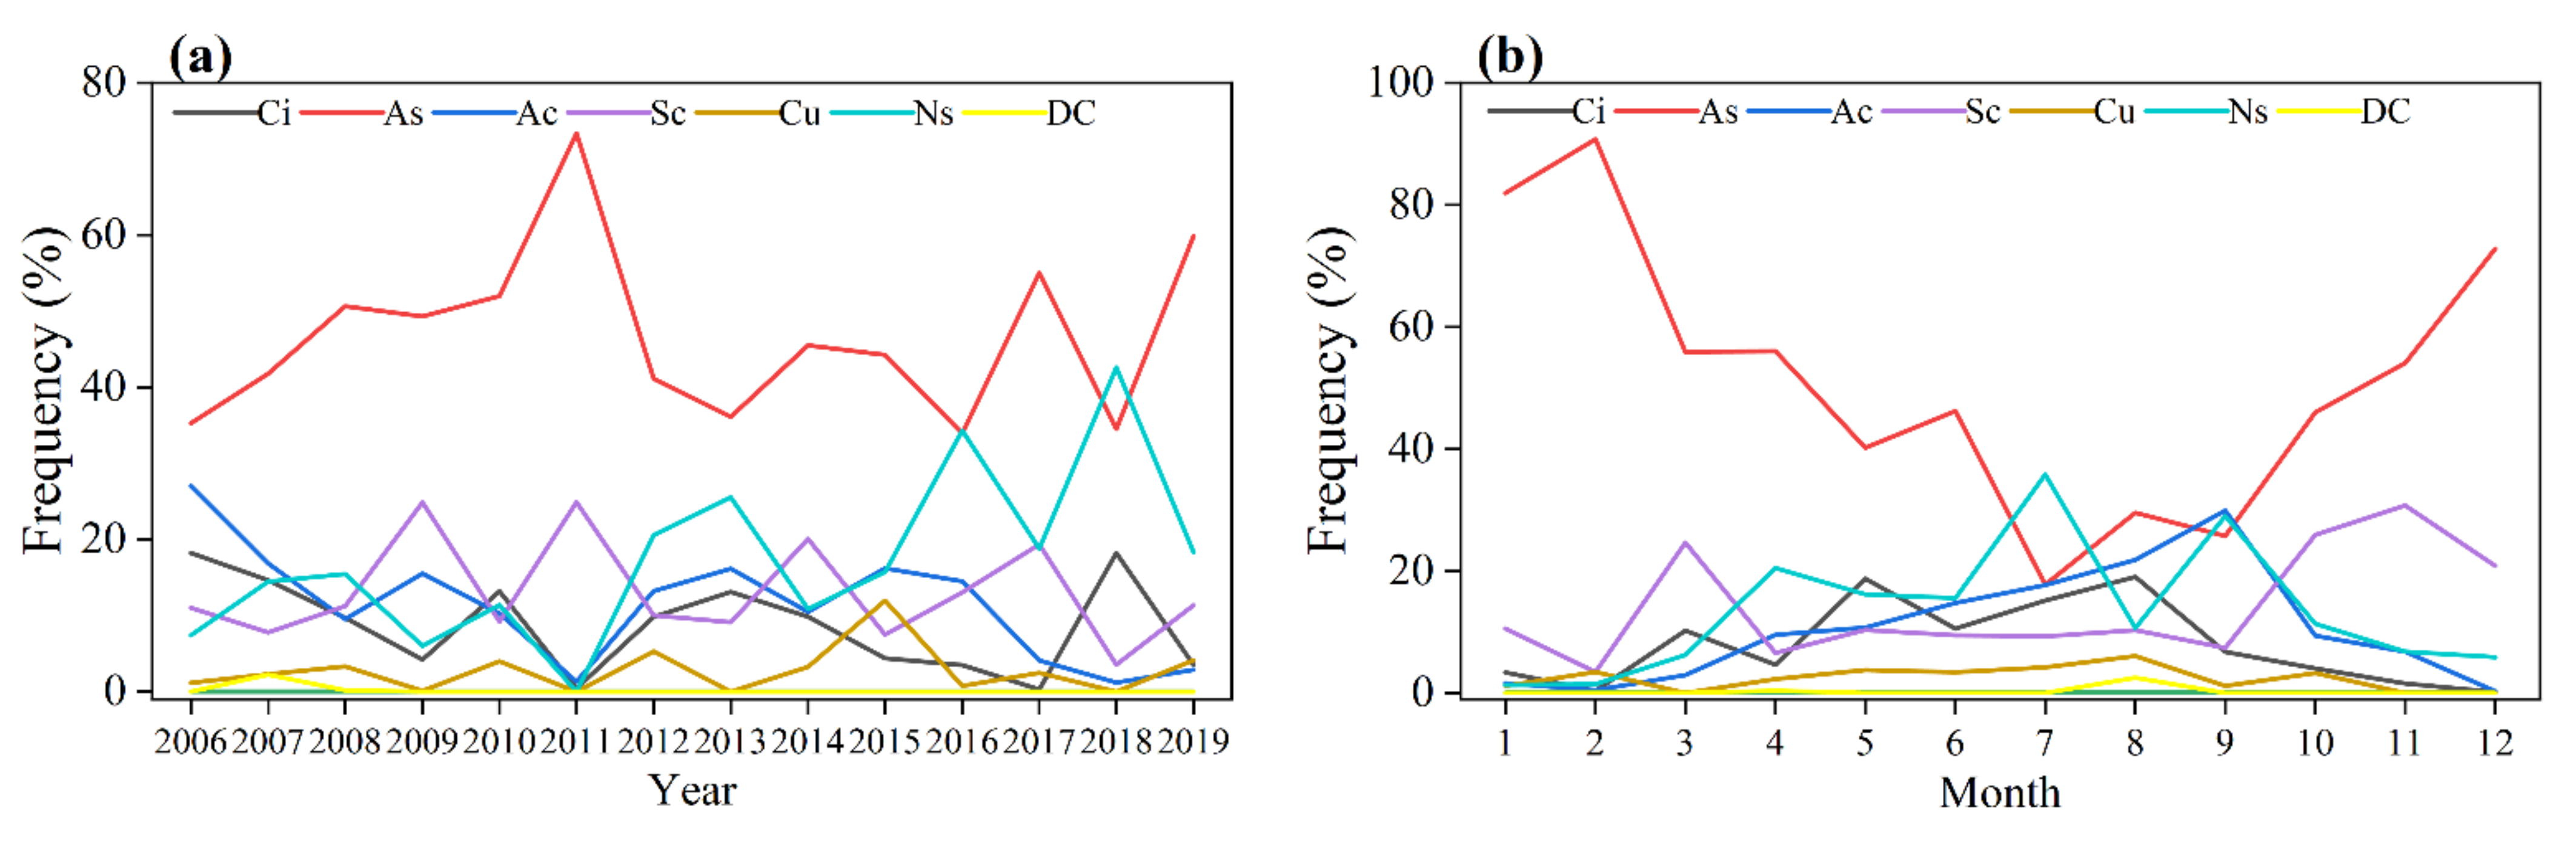
The occurrence frequency of different types of clouds is analyzed by 2B-CLDCLASS data. In this study, the occurrence percentage of different types of clouds is defined as the frequency of each type of cloud in the total clouds. Among all kinds of clouds in QHL, As has the highest frequency (46%), followed by Ns (15%). The occurrence frequency of Sc, Ac, and Ci is approximately 10%; Cu and DC have the lowest frequency. Ci, Ac, and Sc show a decreasing trend, while As, Cu, and Ns show an increasing trend (Figure 4a; Table 3). In the monthly scale distribution of the occurrence frequency of different kinds of clouds, As has obvious seasonal changes, its occurrence frequency decreases gradually from February to July, the occurrence frequency is lowest in July, and the frequency increases gradually from July to December. Other types of clouds have a high occurrence frequency from May to September (Figure 4b).
3.3. Cloud Water Content
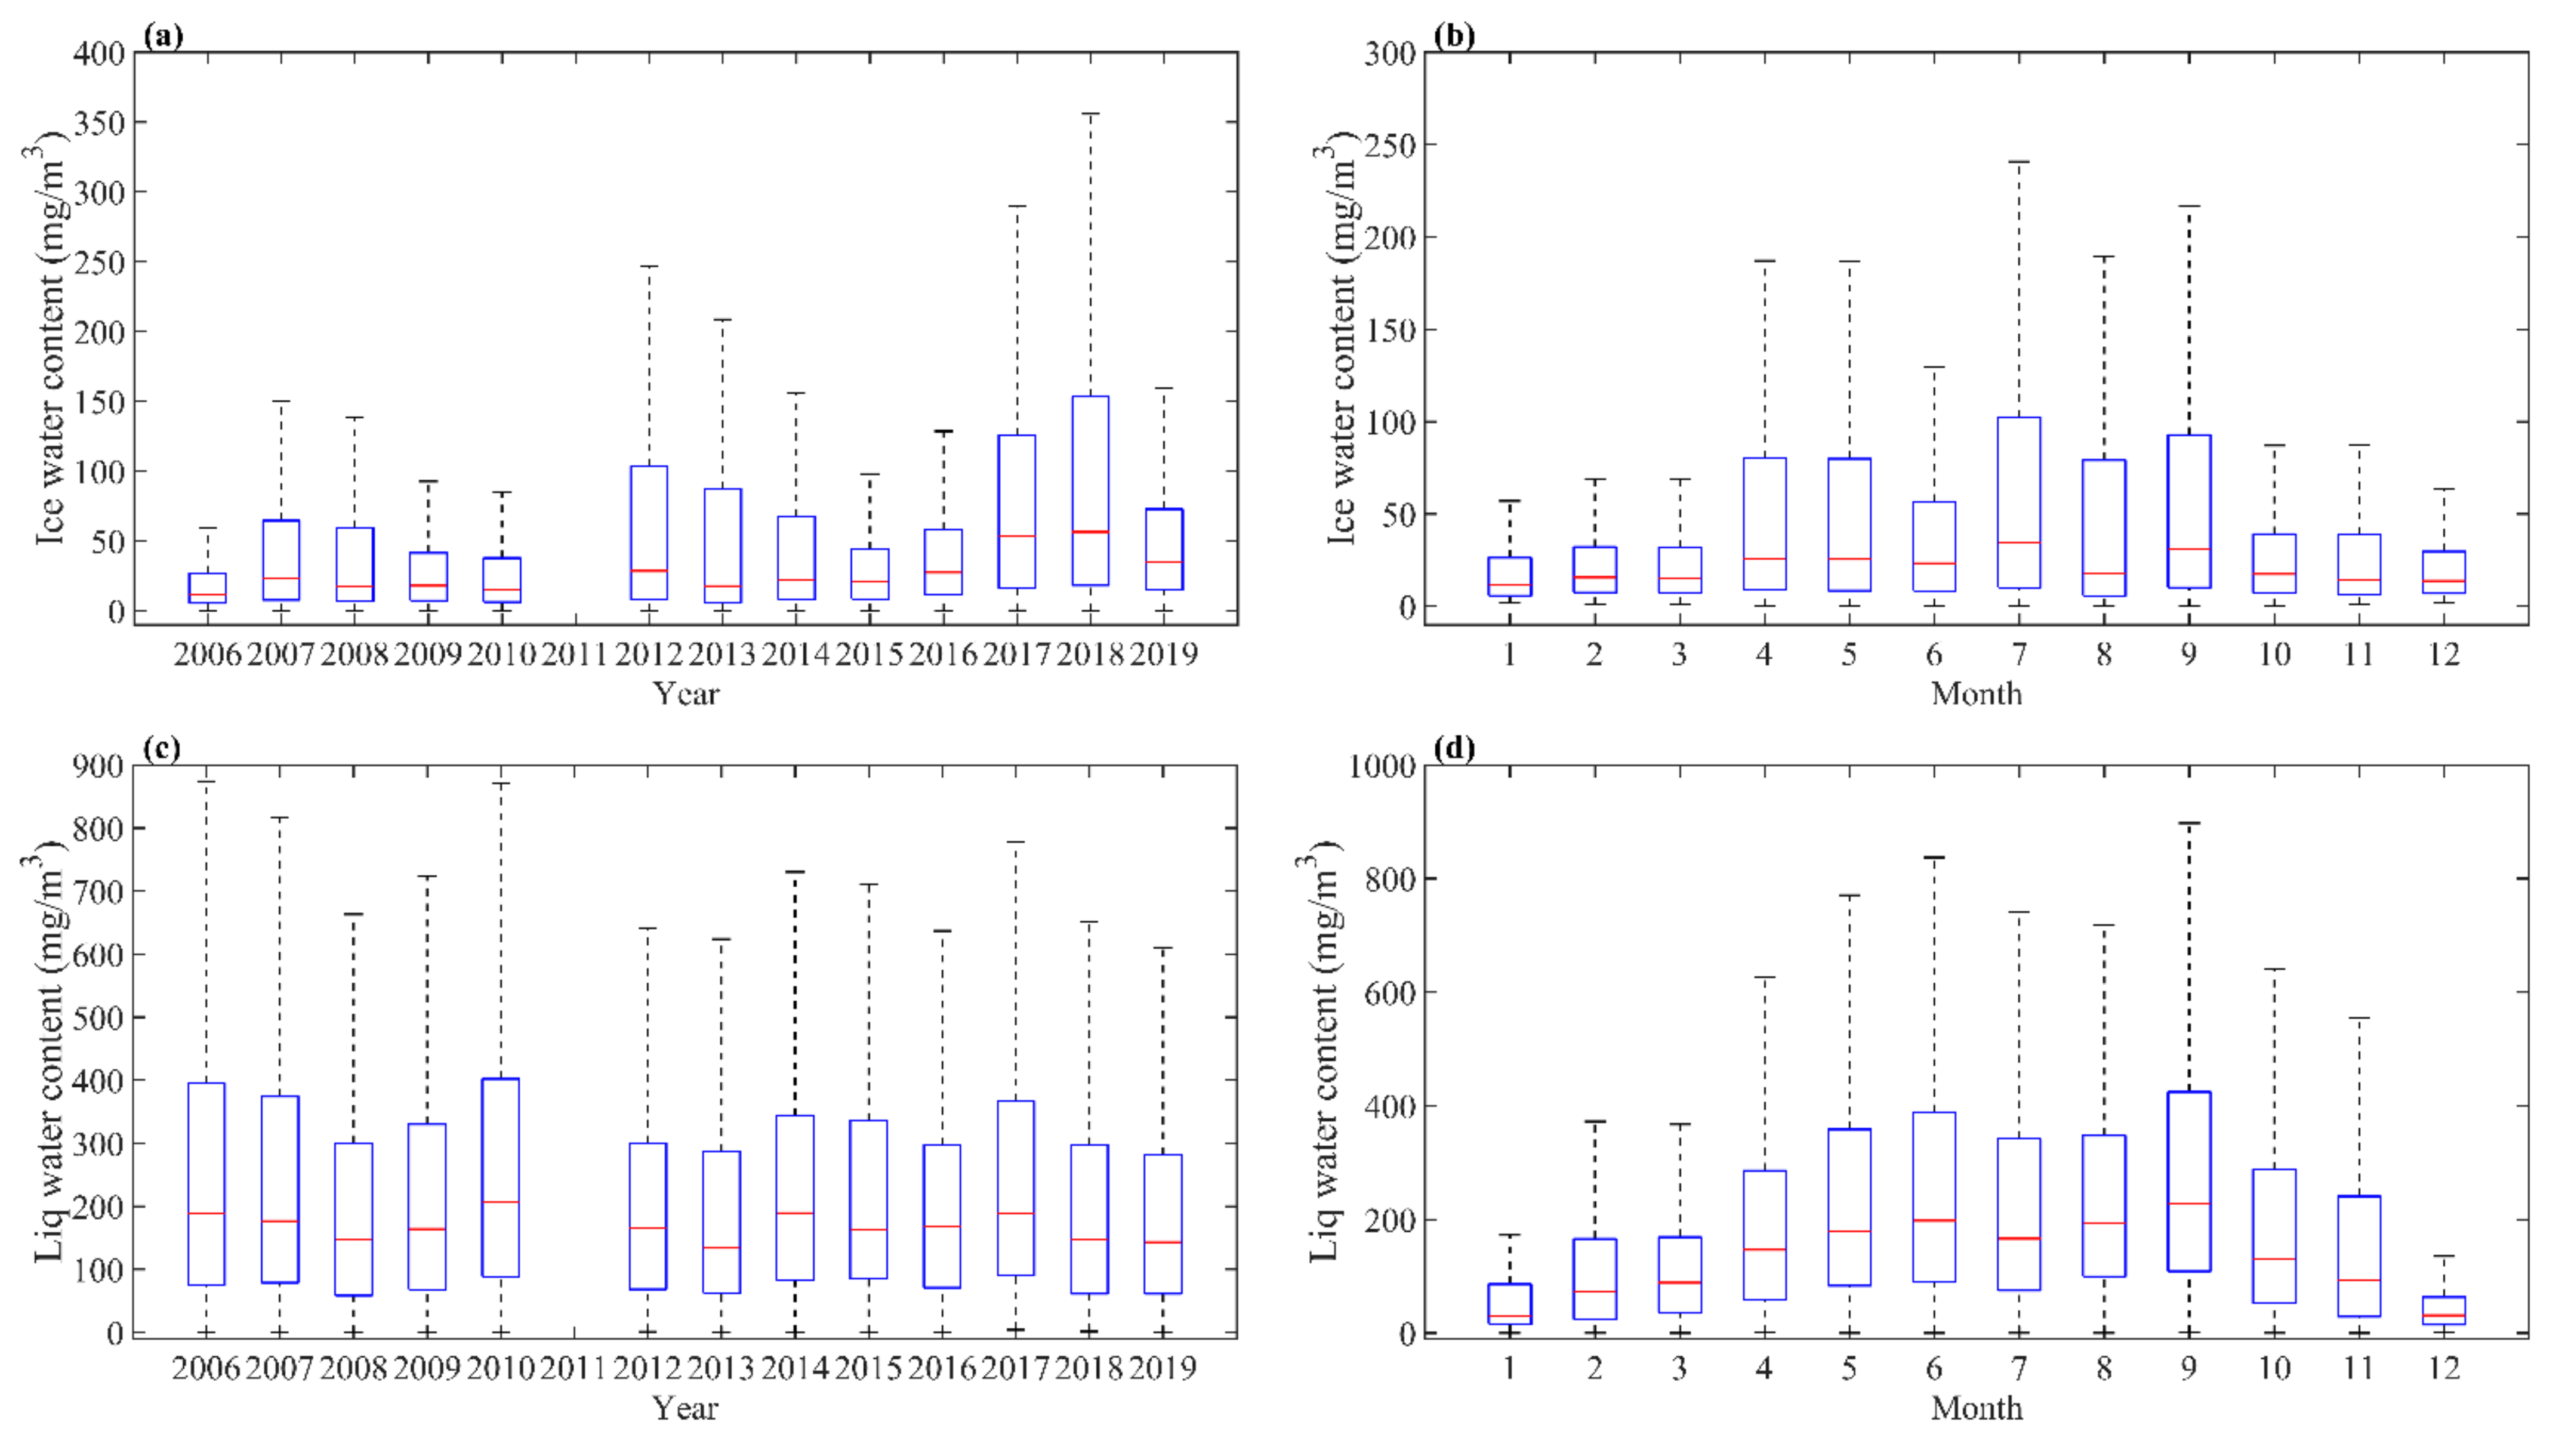
Figure 5 shows the annual and monthly average cloud water content distribution from 2006 to 2019. Cloud water content in QHL is analyzed using box plots. The box plots can provide crucial information about the location and dispersion of the data, and each box plot reflects the maximum, upper quartile, median, lower quartile, and minimum of cloud water content. Data on cloud water content were missing in 2011 due to a severe anomaly on CloudSat and it departed the A-Train (CloudSat rejoined the A-Train in June 2012) [37]. The annual average cloud ice water content of QHL is 62.21 mg/m3 and the annual average cloud liquid water content is 263.66 mg/m3. The cloud ice water content is larger in 2018, which exceeds 113.4 mg/m3, and the cloud liquid water content is larger in 2010, 2015, and 2017, which all exceed 300 mg/m3. The change in cloud ice water content is relatively concentrated, and the change in cloud liquid water content fluctuates greatly. The annual average cloud ice water shows an increasing trend, and the annual average cloud liquid water shows a decreasing trend but did not pass the significance test (Figure 5a,c; Table 3). In the distribution of monthly average cloud water content, summer and autumn are the periods of high cloud water content, and winter is the period of low cloud water content. The monthly average cloud ice water content is the highest in August (98.56 mg/m3) and the lowest in March (24.73 mg/m3). The monthly average cloud liquid water content is the highest in July (321.5 mg/m3) and the lowest in December (61.34 mg/m3) (Figure 5b,d). The cloud water content has obvious seasonal characteristics, which may be related to atmospheric circulation. The summer monsoon gradually moves northward in spring and summer every year and reaches the northernmost point from July to August. In addition, the northward movement, southward retreat, and westward extension of the Western Pacific subtropical high also affect the cloud water content in QHL [38]. At the same time, QHL cools the near-surface air, resulting in a decrease in sensible heat flux throughout the year and greater evaporation in autumn. In summer, the cooling effect of the lake reduces the precipitation in the surrounding area and generates abnormal circulation patterns [39], resulting in high values of cloud water content concentrated in summer and autumn.
3.4. Cloud Vertical Structure
3.4.1. Vertical Structure of Cloud Characteristic Parameters
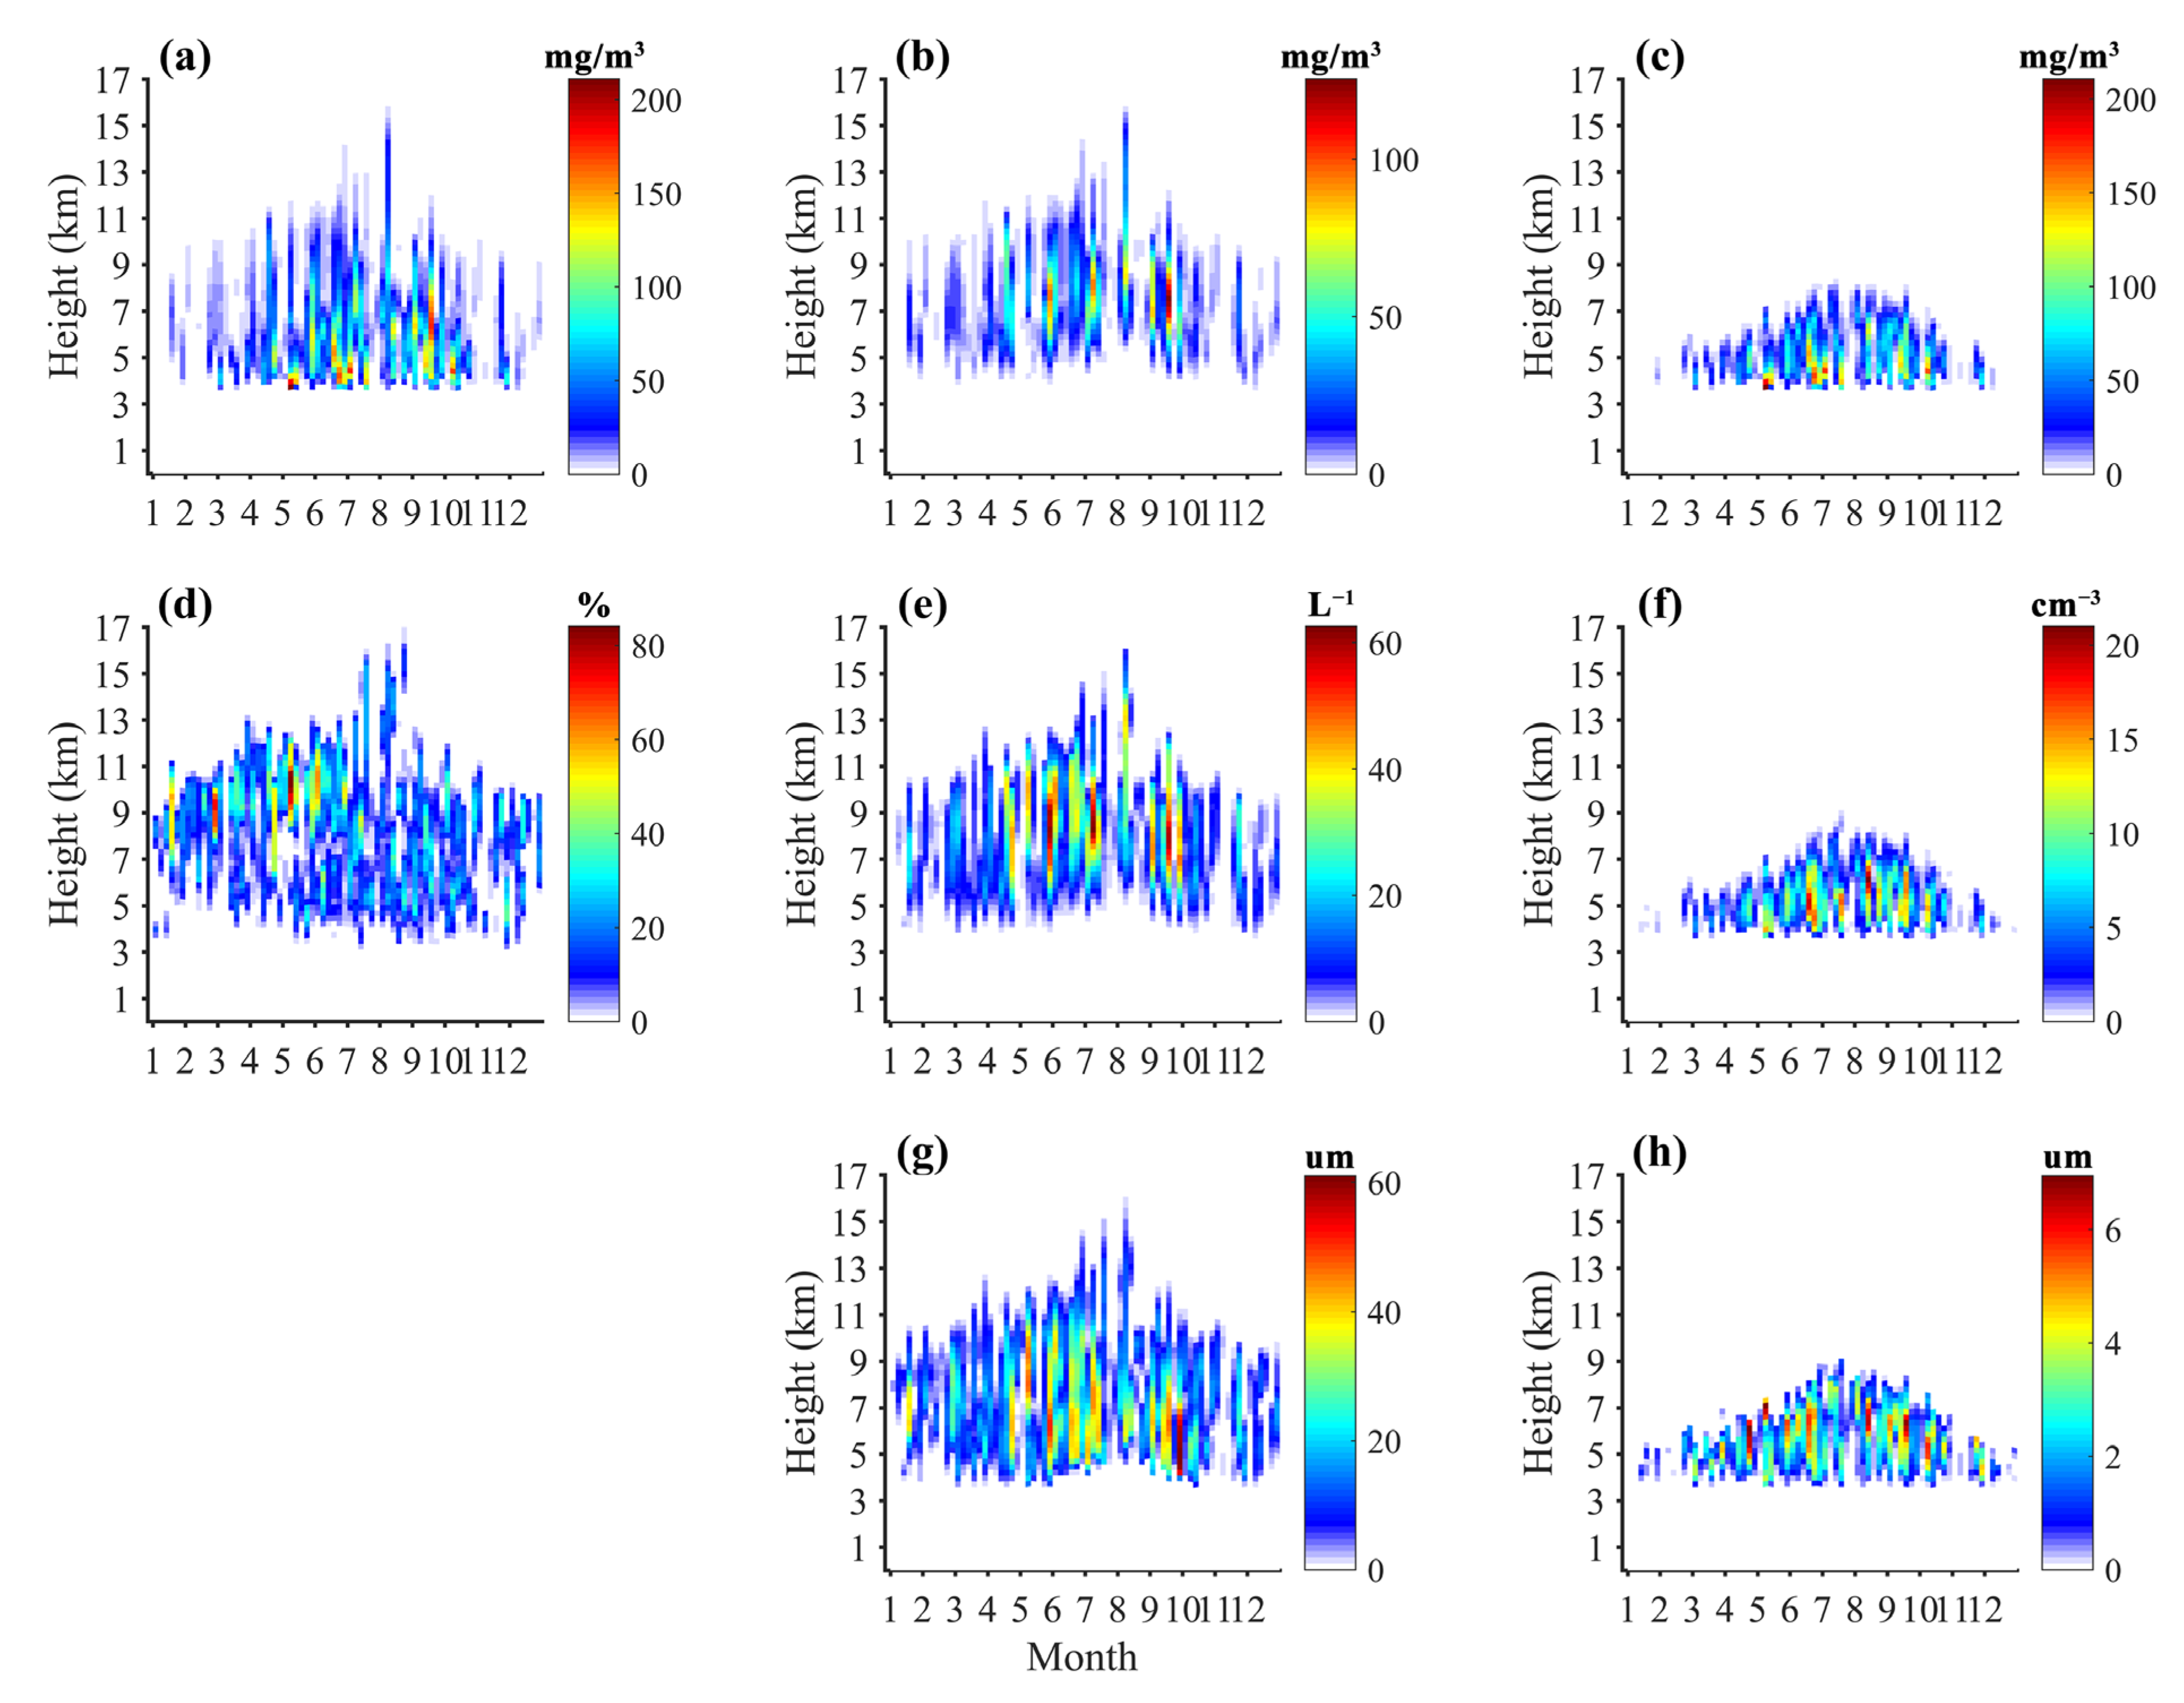
Figure 6a–c show the vertical distribution of the pentad average cloud water content in QHL. The vertical structure of the cloud water content reflects the internal dynamic, thermal, and cloud precipitation microphysical processes, and its distribution has important implications for the growth of cloud droplets and the formation and intensity of the precipitation. The vertical distribution of the sum of cloud ice water and cloud liquid water has obvious seasonal variation, which shows that the cloud water content is higher in summer and autumn than in winter. The cloud ice water distribution in QHL is concentrated from April to October, at a height of 5–10 km. The maximum value appears in September, with a height of 7 km and content exceeding 120 mg/m3. The cloud liquid water distribution is concentrated from May to September, at a height of 4–8 km. The maximum value appears in May, with a height of 4 km and content exceeding 200 mg/m3. The mixed-phase clouds are at a height of 4–8 km, while the ice clouds are above 8 km.
Figure 6d shows the vertical distribution of the pentad average cloud fraction in QHL. In this study, the vertical height of the clouds is based on the sea level height. The high-value area of cloud fraction appears around 9 km in the first pentad of March, which corresponds to an increase in the occurrence frequency of Ci. In the middle of May, the high-value area of cloud fraction moves up to approximately 10 km, when the vertical motion is strengthened. After May, the high-value area of cloud fraction moves to lower altitudes, which is associated with enhanced convective activity after the beginning of the summer monsoon. These results are consistent with the findings of Yan et al. [40]. After June, the high-value moves to a low altitude, and the cloud fraction decreases to 8–11 km.
Figure 6e,f show the vertical distribution of the pentad average cloud water particle concentration in QHL. The particle concentration distribution in the vertical direction can reflect the existence of the mixed-phase clouds in QHL. Ice water particles over QHL are concentrated at a height of 6–10 km, with more than 60 particles per liter. Liquid water particles are concentrated at a height of 4–6 km, with more than 20 particles per cubic centimeter. The cloud water particle concentration is higher in summer and autumn. From June to October, the high-value centers of ice and liquid water particles are closer to each other over QHL, and it is easy to produce mixed-phase clouds, which is consistent with the conclusion of the vertical distribution of cloud water content.
Figure 6g,h show the vertical distribution of the pentad average cloud water particle effective radius in QHL. As the height increases, the particle size decreases. Larger particles are distributed at low altitudes and smaller particles are distributed at high altitudes. The particle radius of ice particles is larger at the altitude of 4–8 km from June to October, and that of liquid particles is larger at the altitude of 5–7 km from April to October. The occurrence time of the high value of particle radius corresponds to the occurrence time of the high value of ice and liquid water.
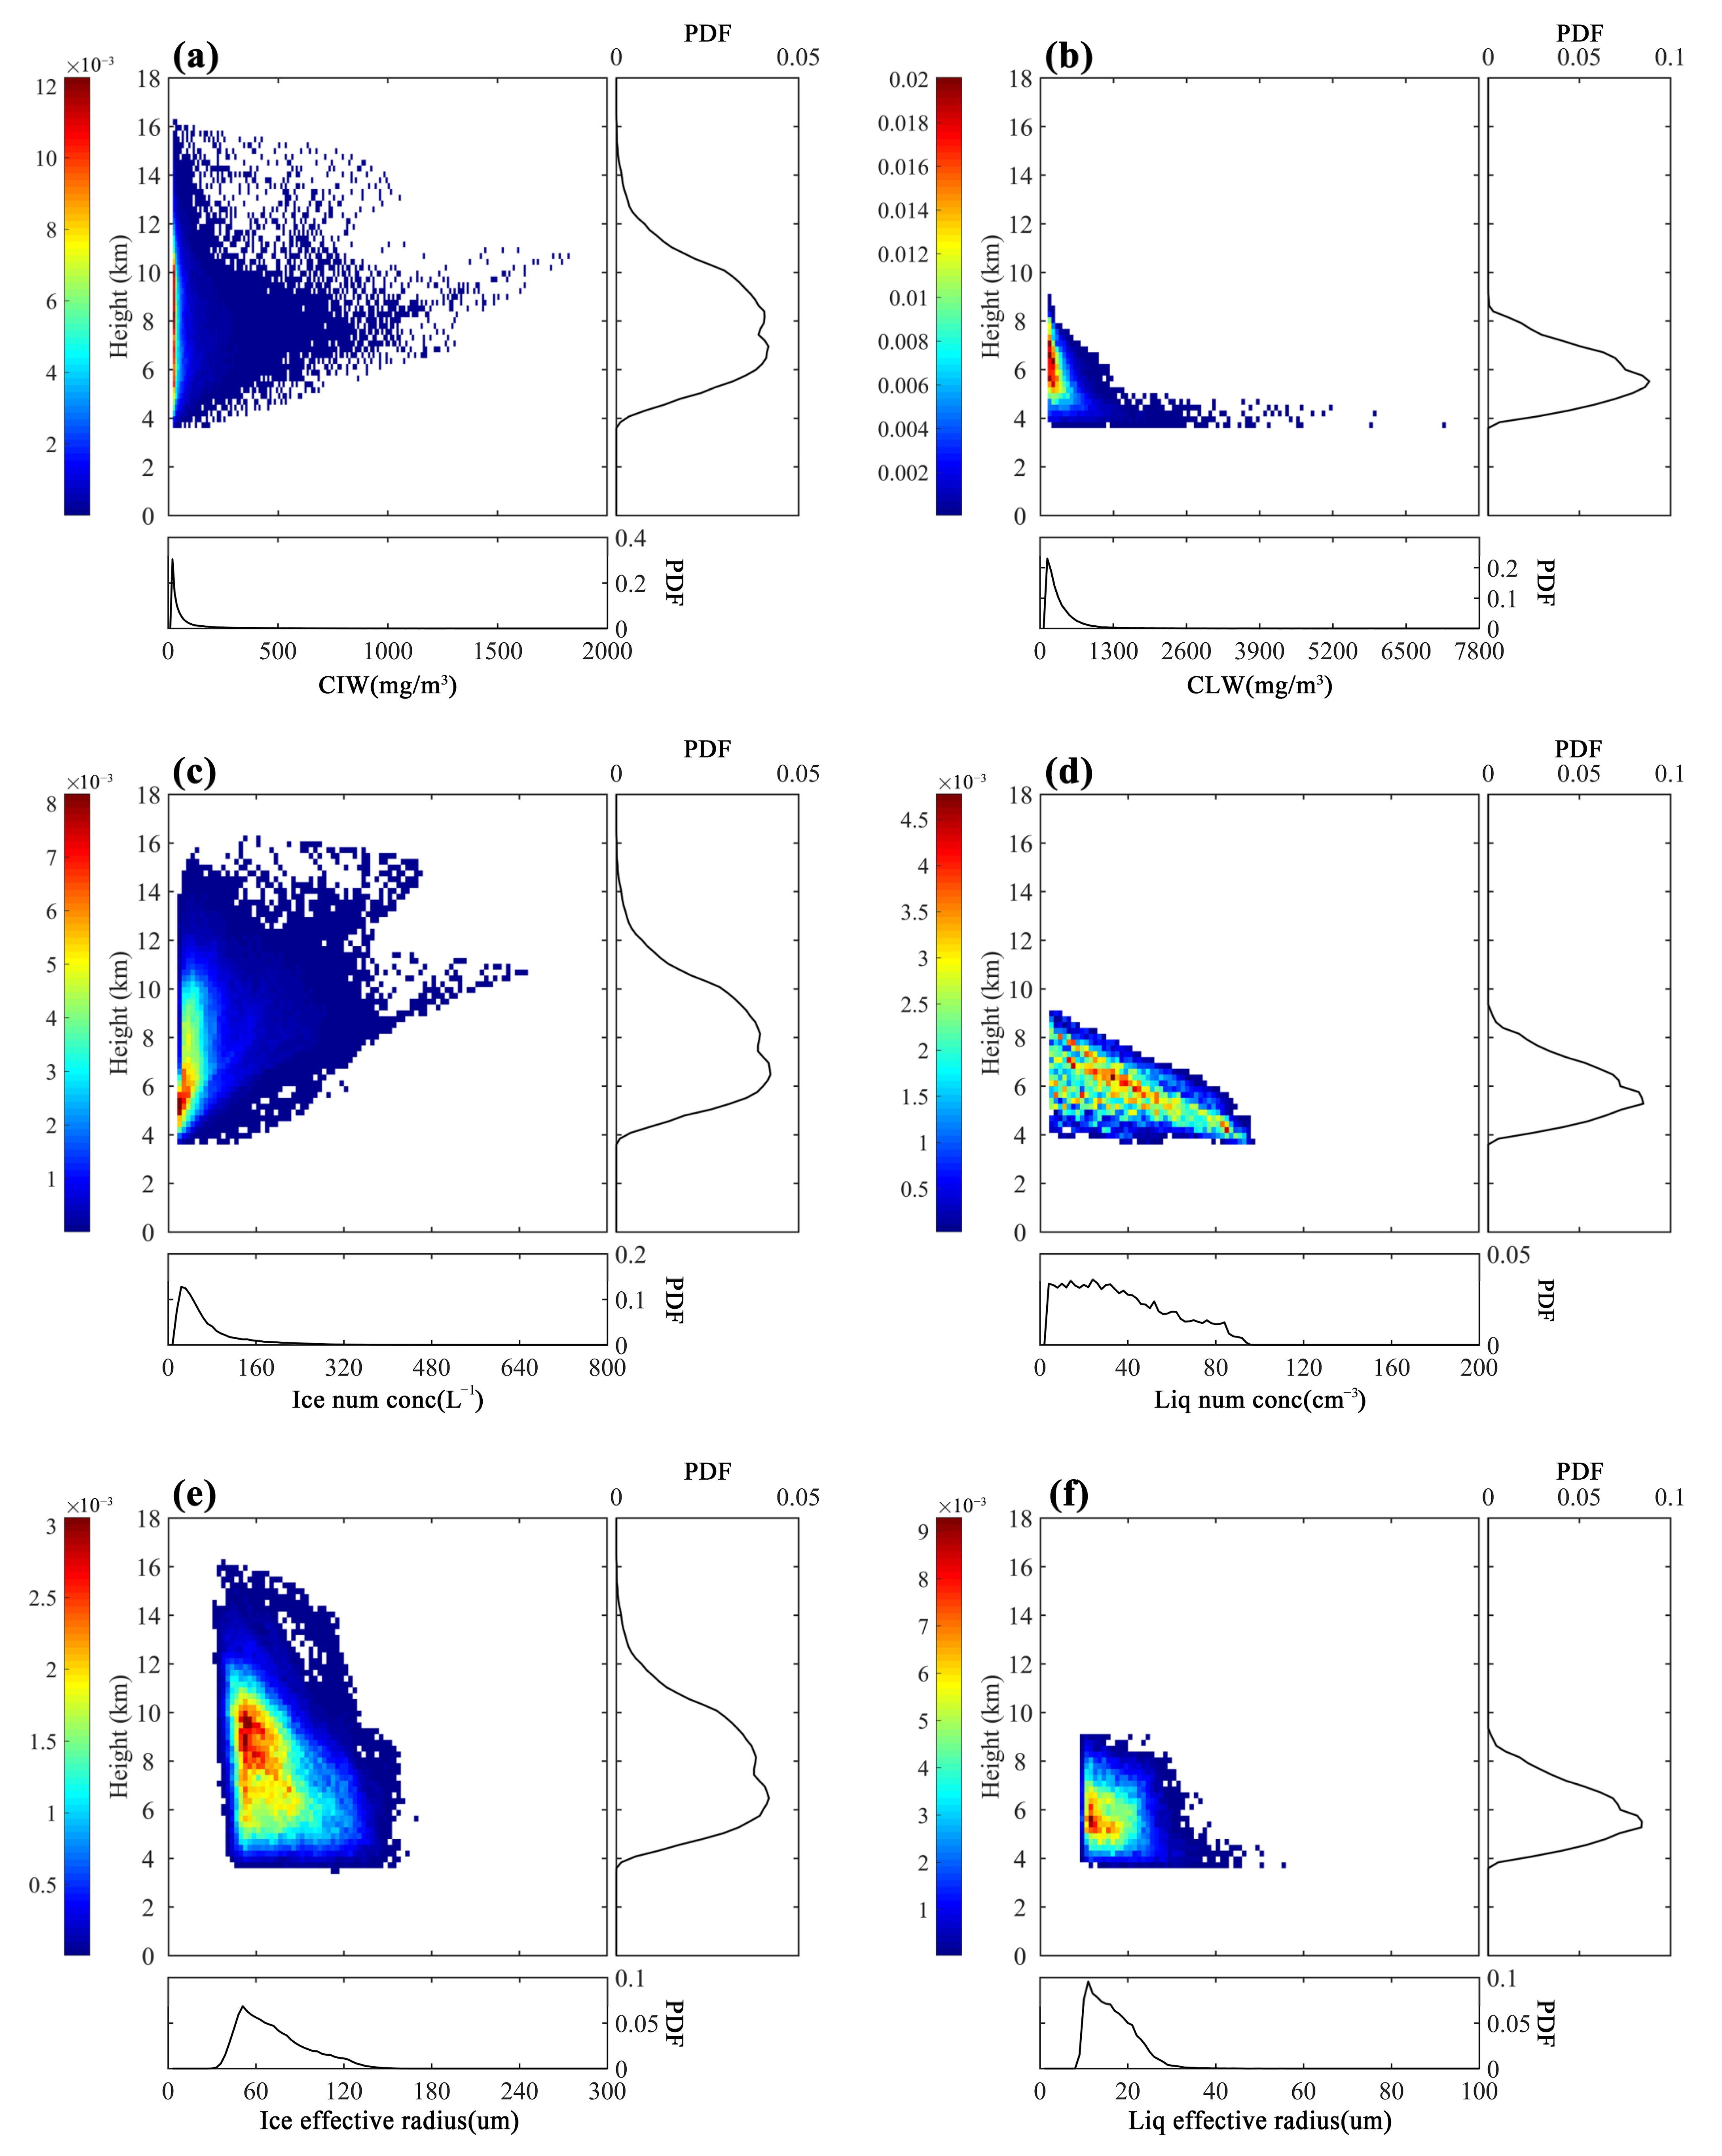
Figure 7 shows the spectrum distribution of cloud water content, particle concentration, and particle effective radius at different heights in QHL. The probability density peak of cloud ice water content in QHL is around 7–8 km. At this time, the ice water content is concentrated at 10–30 mg/m3, and the probability density peak of cloud liquid water content is around 6 km with a thin vertical distribution and is concentrated at 65–260 mg/m3 (Figure 7a,b). From the spectral distribution of particle concentration and equivalent radius, it can be seen that the spectral distribution peak of the ice particle concentration and particle equivalent radius is around 6–9 km, and the number of ice particles is 16–40 per liter. The high value of the equivalent radius of ice particles is concentrated in the range of 48–64 um. The spectral distribution peak of the liquid particle concentration and particle equivalent radius is at 6 km, the number of ice particles is 2–50 per cubic centimeter, and the corresponding particle size is 8–19 um. The concentration of ice particles occurs at a height of 6–10 km, which is slightly higher than that of liquid particles (5–7 km), and the liquid particle distribution height is more concentrated compared with that of ice particles (Figure 7c–f). The cloud ice and liquid water content vary widely, the particle concentration is high, and the particle size difference is obvious.
3.4.2. Vertical Structure of Different Cloud Types
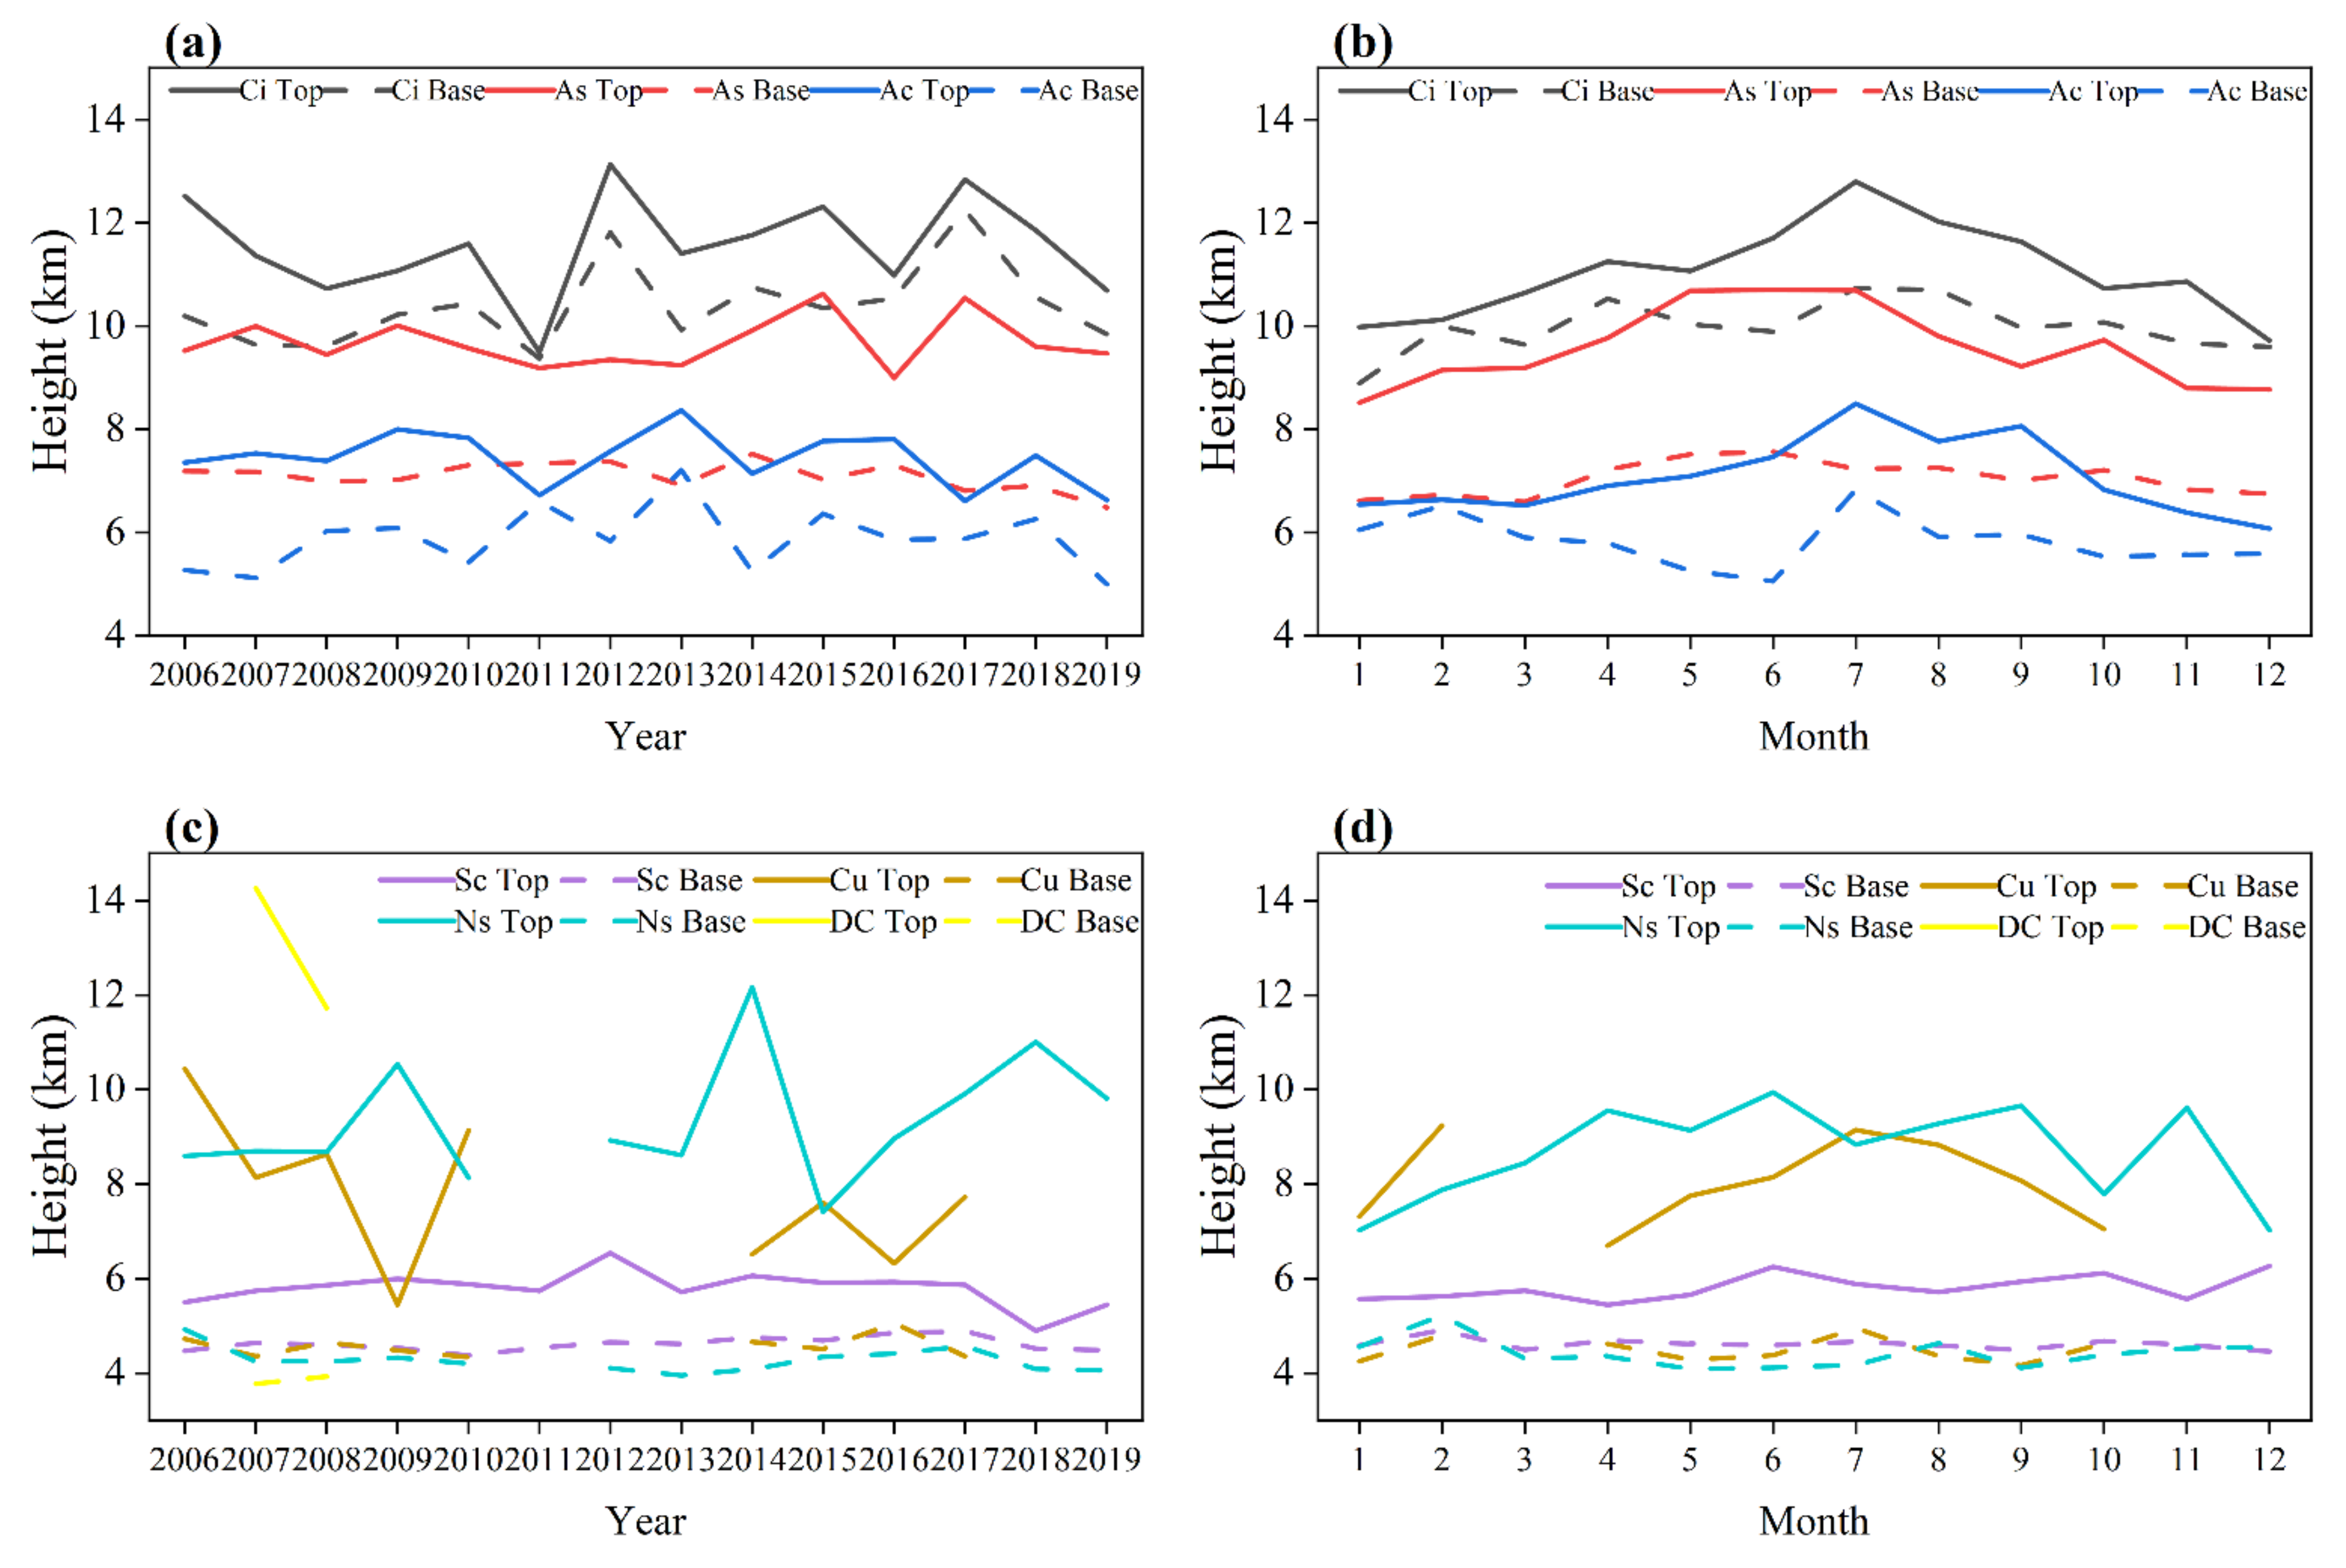
Figure 8 shows the distribution of the cloud top height and cloud base height of different kinds of clouds in QHL. CloudSat only observed DC in 2007 and 2008. Among the annual average cloud base heights of different cloud types, Ci has the highest cloud base height (10.4 km), followed by As (7.09 km), Ac (5.87 km), Sc (4.62 km), Cu (4.54 km), Ns (4.26 km), and DC (3.85 km). The annual average cloud thickness of different cloud types is the highest in DC (9.14 km), followed by Ns (5.07 km), Cu (3.34 km), As (2.58 km), Ac (1.57 km), Sc (1.18 km), and Ci (1.16 km). As has a low temperature, thick cloud layer, large range, and high cloud reflectivity. The cloud particles are mainly composed of ice crystals. Ns is thick, and the cloud particles are mainly composed of water droplets, accompanied by continuous rainfall or snowfall, which are usually formed by large-scale slow upward movement (Table 2). These characteristics are consistent with the dynamic and thermal effects of TP. It can be seen from Figure 8b,d that the cloud thickness and height have significant seasonal variation characteristics. The cloud thickness and height increase from May to September, which is due to the strong influence of water vapor and convective activities in summer. The thickness of Ci reaches the maximum in July (2.1 km) and the minimum in December (0.12 km). The thickness of DC is the maximum in August (10.5 km). According to Table 2, it can be seen that As contains ice particles, and the height and thickness in May–August correspond to the high values of cloud ice water content in Figure 6b, concentrated at a 6–10 km height.
3.5. Meteorological Elements and Circulation Situation
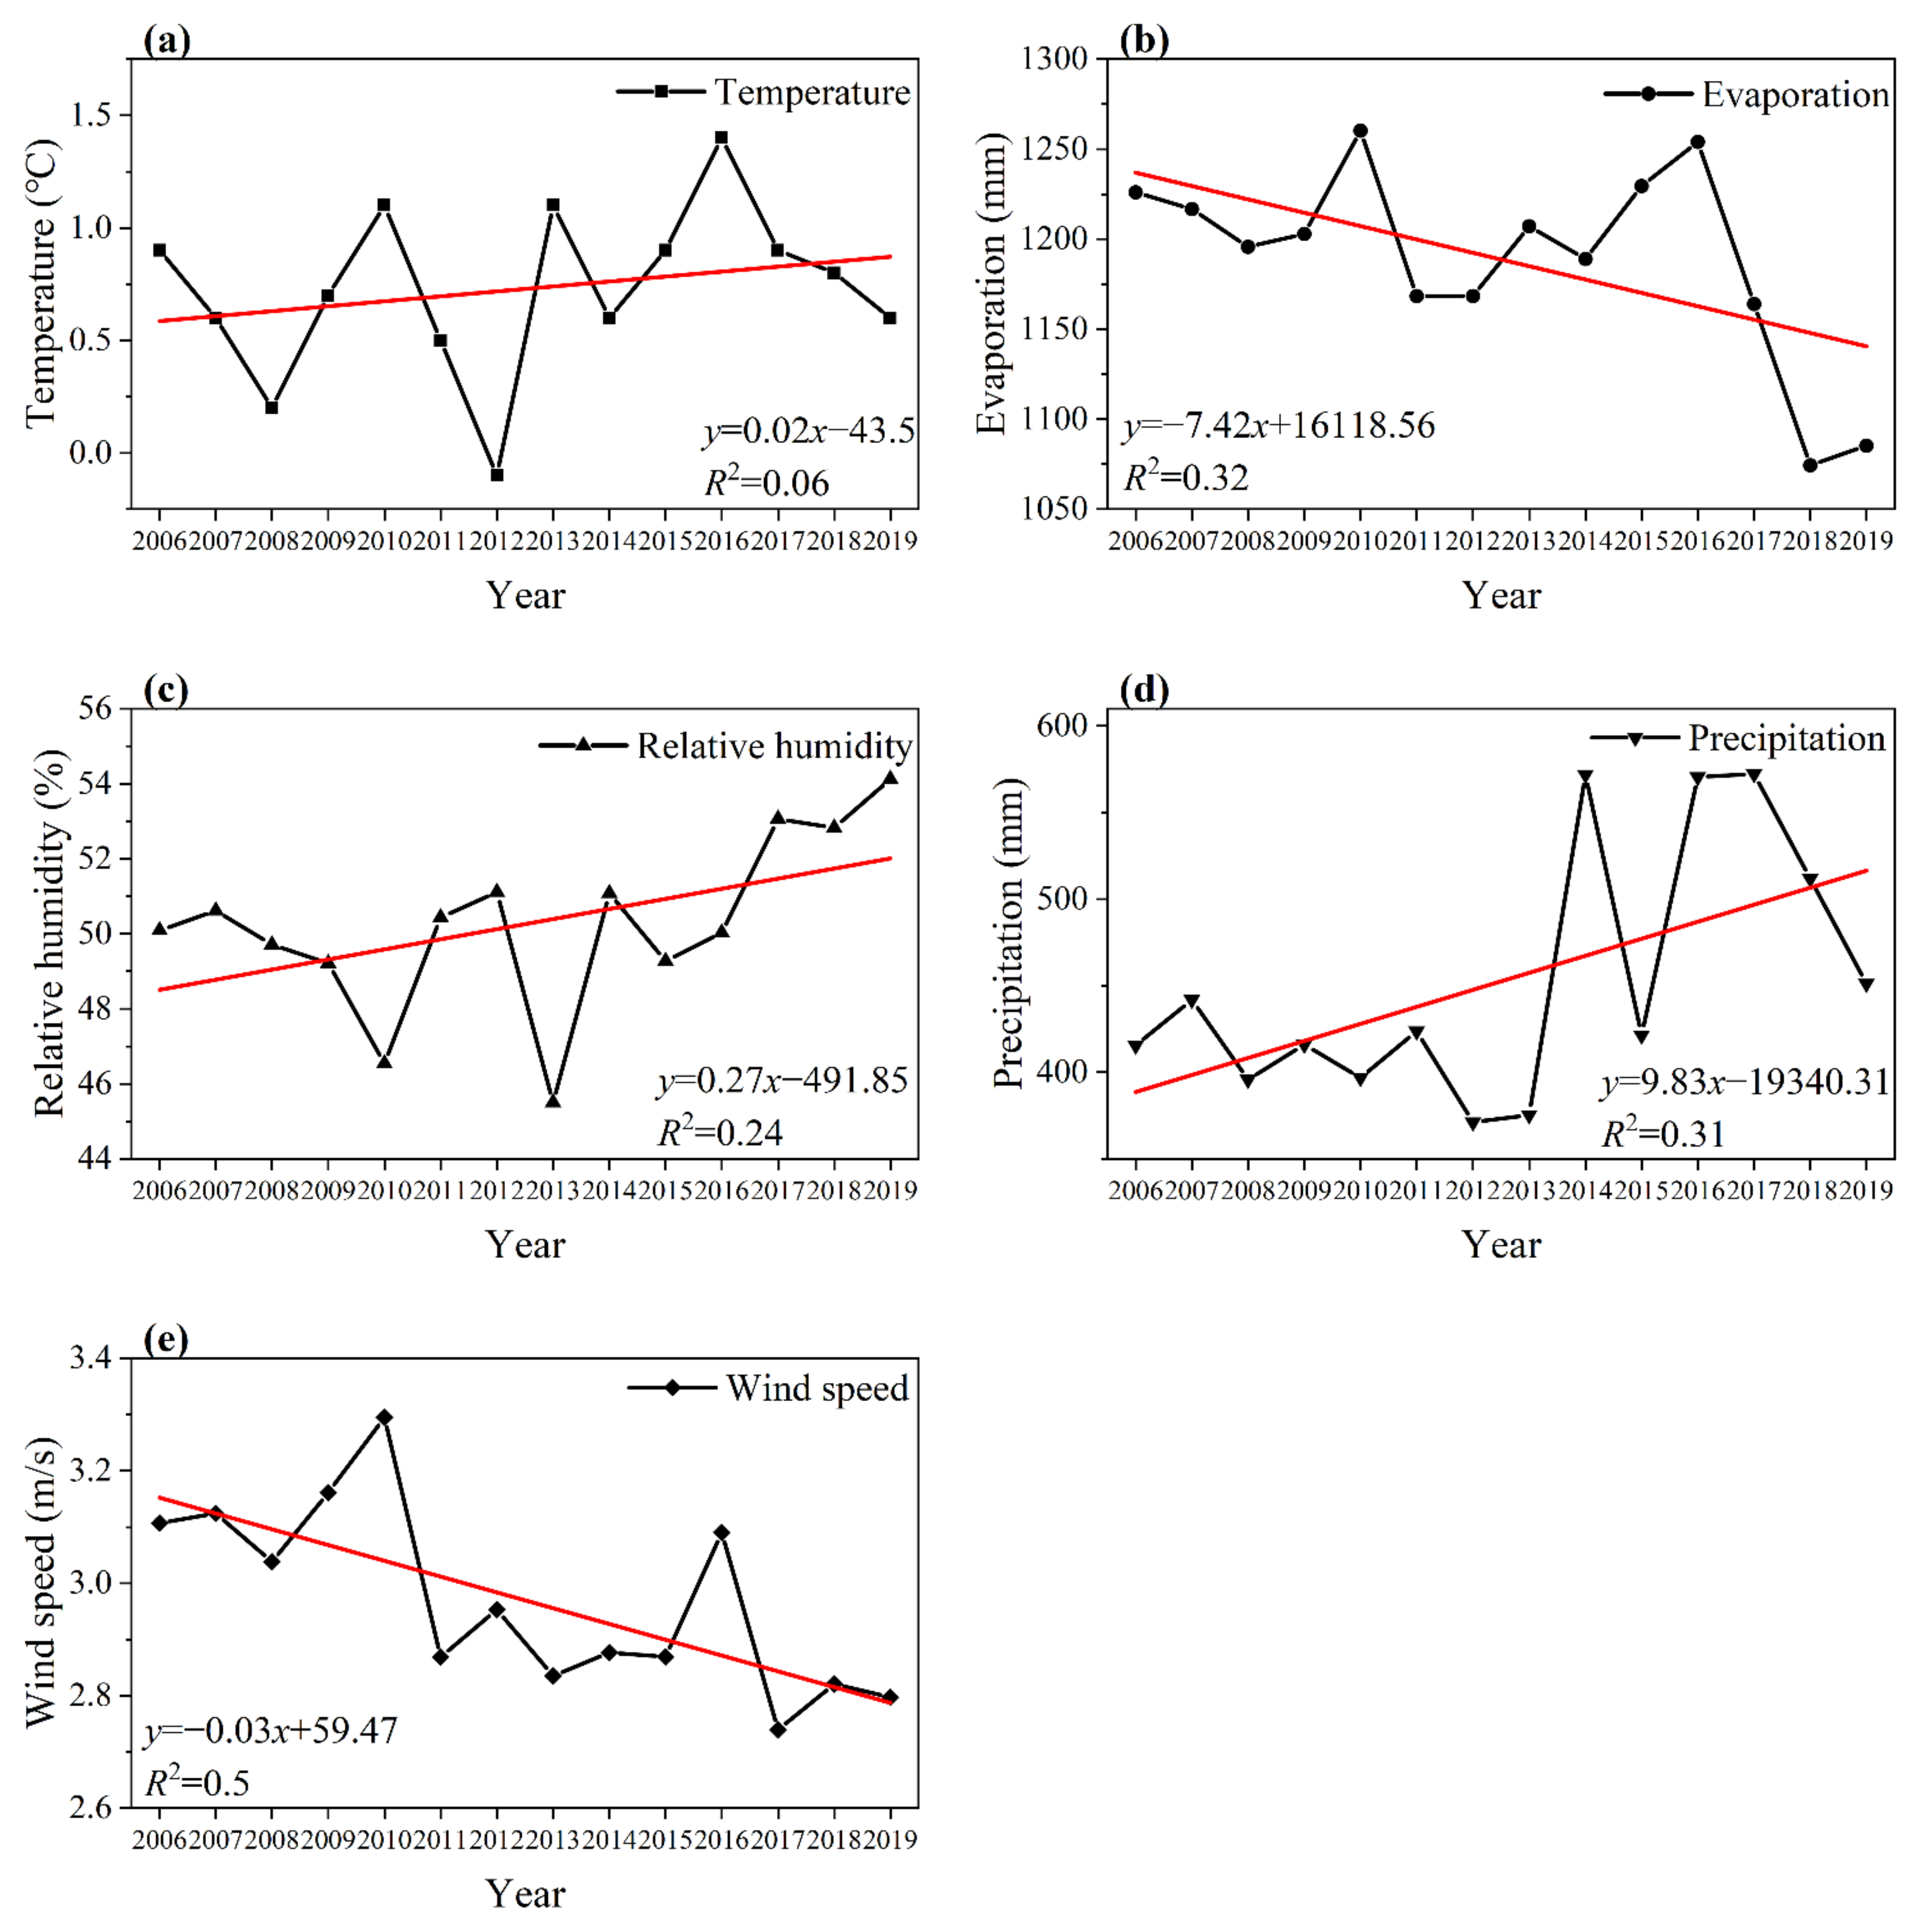
From 2006 to 2019, the annual average temperature in QHL is 0.7 °C, the annual average evaporation is 1188.7 mm, the annual average relative humidity is 50.26%, the annual average precipitation is 452.5 mm, and the annual average wind speed is 2.97 m/s. The temperature, relative humidity, and precipitation show an increasing trend, while the evaporation and wind speed show a decreasing trend (Figure 9). The lifting condensation level of QHL is calculated according to the formula of Lawrence [41]:
hLCL = (20 + Ts/5)(100 − Rh)
In the formula, hLCL is the lifting condensation level (unit: m), Ts is the ground temperature, and Rh is the relative humidity. From this calculation, the lifting condensation level (hLCL) in QHL is 1002.18 m. In other words, the low clouds begin to condense at the altitude of 1002.18 m relative to the ground, which is consistent with the distribution of the low cloud base height in Figure 8.
Pearson correlation analysis was used to analyze the correlation between the total cloud occurrence frequency, cloud water content, and meteorological elements (Table 4). Temperature, precipitation, and total cloud occurrence frequency are significantly negatively correlated, wind speed and total cloud occurrence frequency are significantly positively correlated, and both pass the significance t-test at the level of 0.05. The correlation between evaporation and relative humidity and total cloud occurrence frequency is not high. Evaporation is negatively correlated with cloud ice water content, and passes the significance test at the level of 0.01. The correlation between other meteorological elements and cloud water content is not high.
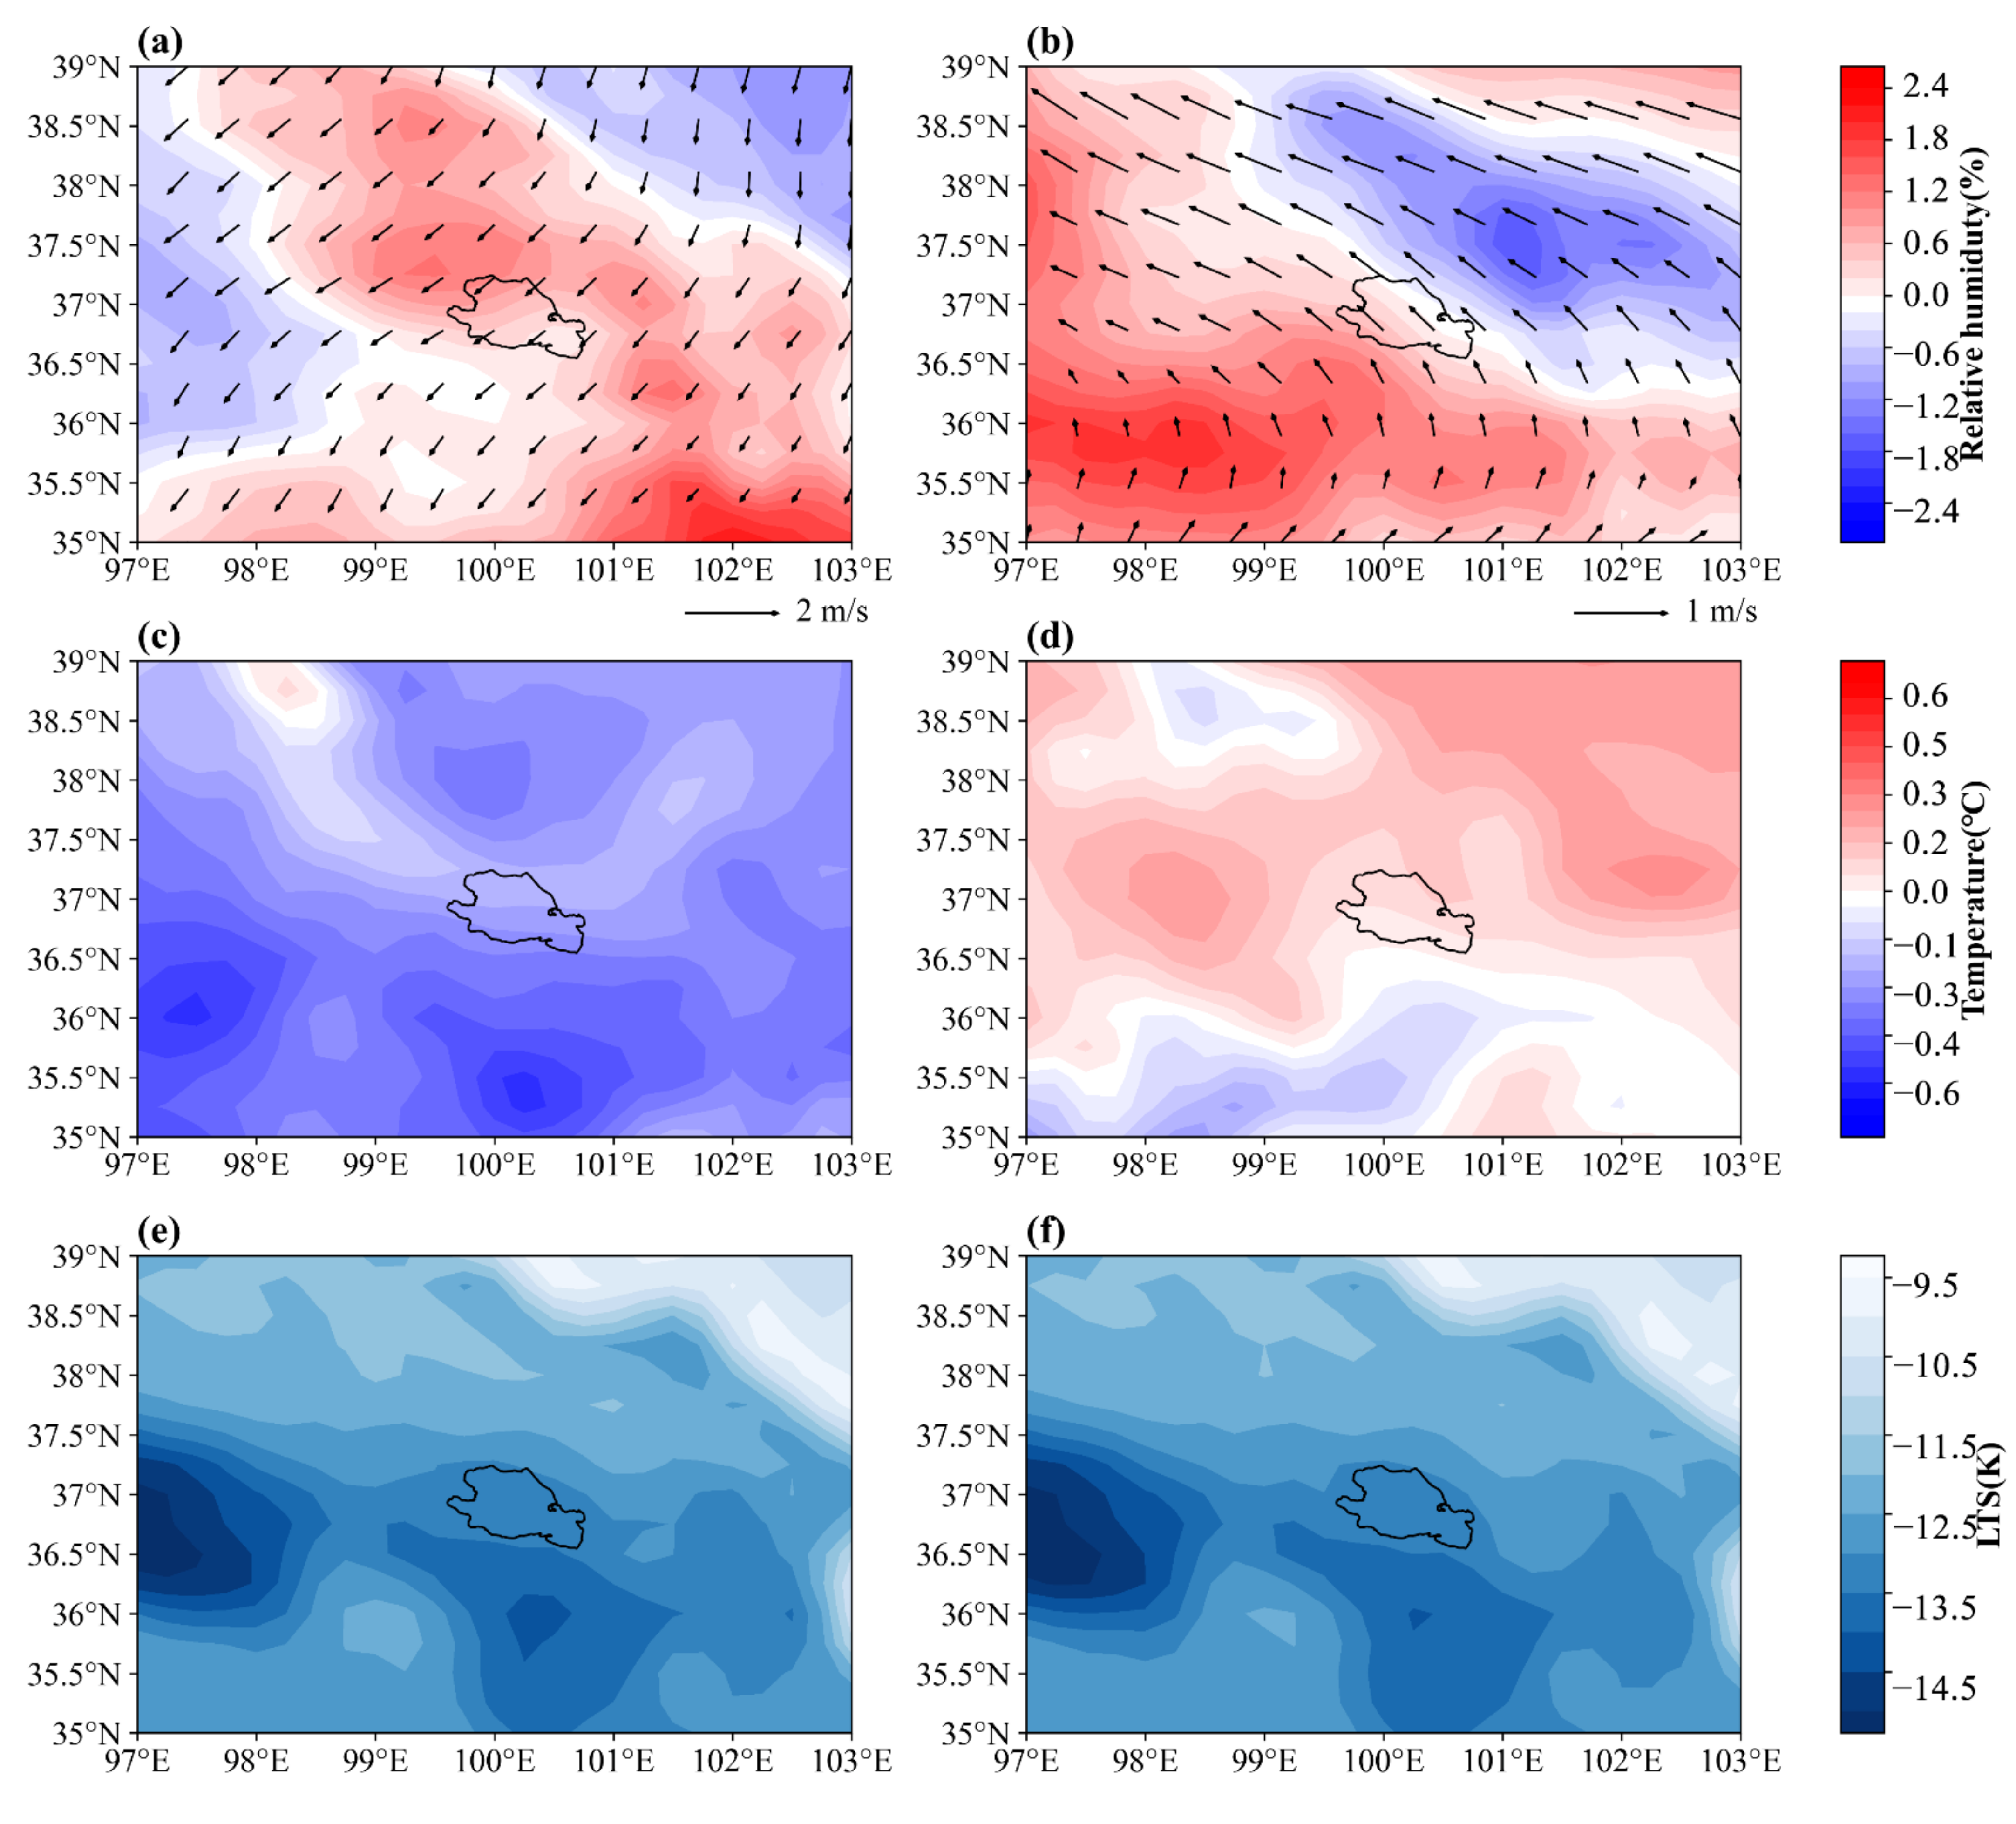
The total cloud occurrence frequency is highest in 2008 and lowest in 2017 (Figure 3a). By analyzing the anomaly values of the relative humidity field, wind field, vertical velocity field, and temperature field, Figure 10 displays the factors of circulation anomalies affecting the highest and lowest frequency of total cloud occurrence years. In 2008, the wind field anomaly is the northeast wind, which indicates that the northeasterly wind is stronger and is not conducive to transporting the water vapor from the south to the north. In 2017, the wind field anomaly is the southeast wind, which indicates that the southeast wind is stronger and is conducive to water vapor transport in the south. In 2008, the relative humidity is higher than the multi-year average. In 2017, the relative humidity in the northeast of QHL is lower than the average from 2006 to 2019, and that in the southwest is higher than the average from 2006 to 2019. Because the dominant cloud systems in QHL are As and Ns, the frequency of As is decreasing and the frequency of Ns is increasing (Table 3). The liquid water content in As is close to 0, while Ns contain liquid water (Table 2). Therefore, the increase in relative humidity in the area mainly affects the increase in the frequency of Ns. At the same time, the surface temperature in 2008 is lower than the multi-year average, and the surface temperature in 2017 higher than the multi-year average. The low-level stability in 2008 and 2017 is negative and there is no significant change, indicating that the static stability of QHL is high. Sun et al. [18] show that a decrease in the occurrence of these clouds could be caused by weakened atmospheric stability or circulation associated with the increase in surface air temperature and reduction of the meridional temperature gradient. The conclusions are drawn from the changing trend of meteorological elements in Figure 9, and the correlation between the occurrence frequency of total cloud and meteorological elements is relatively consistent. Therefore, it can be explained that the decrease in total cloud frequency in QHL is caused by the increase in temperature.
4. Discussion
The innovation of this article is to use CloudSat satellite data to analyze the cloud vertical characteristics and cloud water distribution in QHL. This is different from the previous few plateau stations and the lack of characteristic analysis of cloud vertical structure. This study is helpful to guide the development of artificial precipitation in the region.
The total cloud occurrence frequency decreased from 2006 to 2019, and this result is consistent with Duan et al. [42] and Zhang et al. [19]. Duan reported a decrease in daytime cloud cover of approximately 1%/10a during the last three decades over TP. Clouds are more distributed during the warm season than the cold season, and this finding may be due to a plentiful supply of moisture during the warm season [43]. Regional climate model results [44] have shown that the doubled global CO2 concentration could lead to prominent winter cloud amount decreases at higher elevations on the eastern TP, and the associated net effect of the change of radiation fluxes was advantageous to enhanced surface warming. The recent climate warming over the TP primarily results from the increasing anthropogenic greenhouse gas emissions [45]. The decrease in the total cloud occurrence frequency in QHL is caused by the rising temperature and the weakening of atmospheric stability in QHL (Figure 9 and Figure 10 and Table 4). The large-scale circulation over TP influences the local topographic circulation of QHL. Therefore, the change characteristics and trends of clouds in QHL and TP are similar. However, clouds in QHL still have their characteristics. Liu et al. [26] used CloudSat data to analyze the cloud characteristics over TP, and the results show that the occurrence frequency of clouds on TP is 35%, where the frequency of the low clouds is the highest at close to 21%, the frequency of the mid-level cloud is the second with 14%, and the frequency of high clouds is the lowest. The occurrence frequency of clouds in QHL has a unique characteristic. The occurrence frequency of the mid-level clouds is the highest, followed by the low clouds, and the occurrence frequency of the high clouds is the lowest, with occurrence frequencies of 19.6%, 10.4%, and 3.3%, respectively. In addition, the trend of the As occurrence frequency on the monthly scale is also unique, decreasing from February to July and increasing from July to December. The reason needs to be studied further.
In this study, the analysis of cloud water content focuses on the distribution of vertical height, while other studies of cloud water content mainly focus on the analysis of the cloud water path. The cloud phase and precipitation significantly affect the distribution characteristics of cloud water content in some regions. In high altitudes and mid-latitude-to-polar regions, the contribution of supercooled or mixed-phase clouds is significant. In the lower troposphere, precipitating clouds are frequent [46]. Later studies may analyze, in detail, the influence of cloud water content in different types of clouds on cloud phases and precipitation.
The 2B-CLDCLASS cloud type products used in this study are classified according to the different spectral characteristics, structure, and physical characteristics of clouds observed by CloudSat satellites, and according to the vertical and horizontal characteristics of clouds, cloud temperature, and whether there is precipitation and upward radiation observed by MODIS. Because QHL is located in the northeast of TP, its unique terrain, thermal characteristics, and water vapor circulation are different from those of plain land and ocean areas in distinguishing high, mid-level, and low clouds. With the small spatial scale of QHL, coupled with the limitations of satellite observation, CloudSat cannot completely reflect the spatial distribution of cloud cover in QHL. The atmospheric cloud radiative effect affects the high cloud fraction [47], and the influence of the cloud radiation effect on the regional energy budget and cloud characteristics in QHL needs to be further analyzed and studied.
Figure 3, Figure 9 and Table 3 used linear fitting to analyze the changing trend of data. Because the data used in this paper are based on CloudSat satellite data, the available data period is from 2006 to 2019, a total of 14 years. Besides, As and Ns are dominant cloud types over QHL, and the R-squared value in their linear propensity equation is much larger than that of the other cloud types. Therefore, when analyzing the annual average change of the clouds and meteorological elements, the R-squared value is low due to the small number of samples, but the linear fitting equation can still indicate the changing trend of the elements on the temporal scale.
5. Conclusions
Based on CloudSat satellite data from 2006 to 2019, the occurrence frequency, cloud characteristics, and vertical structure of different clouds in QHL are analyzed in detail, and the following main conclusions are drawn:
- The occurrence frequency of clouds in QHL is 33%, the occurrence frequency of the mid-level clouds is the highest, followed by the low clouds, and the occurrence frequency of the high clouds is the lowest, with the occurrence frequencies of 19.6%, 10.4%, and 3.3%, respectively. The occurrence frequency of the total clouds in QHL is decreasing and is low in winter and high in summer. The As occurrence frequency is high in winter and low in summer. As and Ns are the dominant types of QHL cloud systems.
- The annual average ice water content and the annual average liquid water content of QHL are 62.21 mg/m3 and 263.66 mg/m3, respectively. The annual cloud ice water content is concentrated, and the annual liquid water content is dispersed. April to September is the period of high cloud ice water content. The monthly average cloud water content is high from April to September, which is related to the enhancement of the summer monsoon and plateau convective activities.
- The vertical distribution of cloud water content in QHL has obvious seasonal variation, which shows that the content of cloud ice and liquid water is higher in summer and autumn than in winter. The highest value of vertical cloud fraction distribution in QHL is from March to June, at a height of 7–11 km, corresponding to the increase in Ci and Ac. The mixed-phase clouds are at a height of 4–8 km and the ice clouds are above 8 km. The time and height of high values of particle equivalent radius and particle concentration are consistent with the high values of cloud water content. The vertical distribution of ice particles is relatively dispersed (4–16 km), and the vertical distribution of liquid particles is relatively concentrated (4–9 km). The average equivalent radius of ice particles is larger than that of liquid particles. The probability of large particle concentration in QHL is small. Different types of clouds have a maximum thickness in June and July.
- Temperature and precipitation are significantly negatively correlated with the occurrence frequency of the total clouds, and wind speed is significantly positively correlated with the occurrence frequency of the total clouds. The occurrence frequency of the total clouds in 2008 and 2017 is related to the ground temperature in that year. The decrease in total cloud occurrence frequency is caused by the increase in temperature in QHL.
Author Contributions
Conceptualization, L.L. and M.S.; methodology, L.L.; software, L.L.; validation, L.L. and J.M.; formal analysis, L.L.; investigation, L.L.; writing—original draft preparation, L.L., M.S. and J.M.; writing—review and editing, L.L., M.S. and J.M.; funding acquisition, M.S. All authors have read and agreed to the published version of the manuscript.
Funding
This study was funded by the Gansu Province Education Science and Technology Innovation Project (No. 2021QB-019); the National Natural Science Foundation of China (No. 42161027); and the 2020 Postgraduate Research Funding Project of Northwest Normal University (No. 2020KYZZ001156).
Institutional Review Board Statement
Not applicable.
Informed Consent Statement
Not applicable.
Data Availability Statement
CloudSat data are available at http://www.cloudsat.cira.colostate.edu/data_dist/OrderData.php (accessed on 26 April 2021); surface meteorological data are available at http://data.cma.cn/en (accessed on 30 April 2021); ERA5 data are available at http://www.ecmwf.int/datasets (accessed on 30 April 2021).
Conflicts of Interest
The authors declare no conflict of interest.
References
- Hoegh-Guldberg, O.; Jacob, D.; Bindi, M.; Brown, S.; Camilloni, I.; Diedhiou, A.; Djalante, R.; Ebi, K.; Engelbrecht, F.; Guiot, J.; et al. Impacts of 1.5 °C Global Warming on Natural and Human Systems; Global Warming of 1.5 °C: An IPCC Special Report; IPCC Secretariat: Geneva, Switzerland, 2018; pp. 175–311. [Google Scholar]
- Weber, H.; Riffler, M.; Nõges, T.; Wunderle, S. Lake ice phenology from AVHRR data for European lakes: An automated two-step extraction method. Remote Sens. Environ. 2016, 174, 329–340. [Google Scholar] [CrossRef]
- Benson, B.J.; Magnuson, J.J.; Jensen, O.P.; Card, V.M.; Hodgkins, G.; Korhonen, J.; Livingstone, D.M.; Stewart, K.M.; Weyhenmeyer, G.A.; Granin, N.G. Extreme events, trends, and variability in Northern Hemisphere lake-ice phenology (1855–2005). Clim. Chang. 2012, 112, 299–323. [Google Scholar] [CrossRef]
- Dong, H.M.; Song, Y.G. Shrinkage history of Lake Qinghai and causes during the last 52 years. In Proceedings of the 2011 International Symposium on Water Resource and Environmental Protection, Xi’an, China, 20–22 May 2011; Volume 1, pp. 446–449. [Google Scholar] [CrossRef]
- Wan, W.; Xiao, P.F.; Feng, X.Z.; Li, H.; Ma, R.H.; Duan, H.T.; Zhao, L.M. Monitoring lake changes of Qinghai-Tibetan Plateau over the past 30 years using satellite remote sensing data. Chin. Sci. Bull. 2014, 59, 1021–1035. [Google Scholar] [CrossRef]
- Zhao, L.; Wang, S.Y.; Meyer, J. Inter-Decadal climate variations controlling the water level of Lake Qinghai over the Tibetan Plateau. J. Hydrometeorol. 2017, 18, 3013–3025. [Google Scholar] [CrossRef]
- Yang, G.Q.; Zhang, M.; Xie, Z.H.; Li, J.Y.; Ma, M.G.; Lai, P.Y.; Wang, J.B. Quantifying the Contributions of Climate Change and Human Activities to Water Volume in Lake Qinghai, China. Remote Sens. 2022, 14, 99. [Google Scholar] [CrossRef]
- Kropáček, J.; Maussion, F.; Chen, F.; Hoerz, S.; Hochschild, V. Analysis of ice phenology of lakes on the Tibetan Plateau from MODIS data. Cryosphere 2013, 7, 287–301. [Google Scholar] [CrossRef]
- Stowasser, M.; Hamilton, K.; Boer, G.J. Local and global climate feedbacks in models with differing climate sensitivities. J. Clim. 2006, 19, 193–209. [Google Scholar] [CrossRef]
- Dessler, A.E. A determination of the cloud feedback from climate variations over the past decade. Science 2010, 330, 1523–1527. [Google Scholar] [CrossRef]
- Mason, B.J. The role of clouds in the radiative balance of the atmosphere and their effects on climate. Contemp. Phys. 2002, 43, 1–11. [Google Scholar] [CrossRef]
- Medeiros, B.; Stevens, B.; Held, I.M.; Zhao, M.; Williamson, D.L.; Olson, J.G.; Bretherton, C.S. Aquaplanets, climate sensitivity, and low clouds. J. Clim. 2008, 21, 4974–4991. [Google Scholar] [CrossRef]
- Tompkins, A.M. Impact of temperature and humidity variability on cloud cover assessed using aircraft data. Q. J. R. Meteorol. Soc. 2003, 129, 2151–2170. [Google Scholar] [CrossRef]
- Liu, Y.; Weng, D.M. Climatological study of temperature effects of cloud-radiative forcing in the earth-atmospheric system over China. Acta Meteorol. Sin. 2002, 60, 766–773. [Google Scholar]
- Wild, M.; Folini, D.; Hakuba, M.Z.; Schär, C.; Seneviratne, S.I.; Kato, S.; Rutan, D.; Ammann, C.; Wood, E.F.; König-Langlo, G.; et al. The energy balance over land and oceans: An assessment based on direct observations and CMIP5 climate models. Clim. Dyn. 2015, 44, 3393–3429. [Google Scholar] [CrossRef]
- Houghton, J.T.; Ding, Y.; Griggs, D.J.; Noguer, M.; Dai, X.; Maskell, K.; Johnson, C.A. Climate Change 2001: The Scientific Basis: Contribution of Working Group I to the Third Assessment Report of the Intergovernmental Panel on Climate Change; Cambridge University Press: Cambridge, UK, 2001. [Google Scholar]
- Stephens, G.L.; Vane, D.G.; Boain, R.J.; Mace, G.G.; Sassen, K.; Wang, Z.; Mitrescu, C. The CloudSat mission and the A-Train: A new dimension of space-based observations of clouds and precipitation. Bull. Am. Meteorol. Soc. 2002, 83, 1771–1790. [Google Scholar] [CrossRef]
- Sun, B.M.; Groisman, P.Y. Cloudiness variations over the former Soviet Union. Int. J. Climatol. 2000, 20, 1097–1111. [Google Scholar] [CrossRef]
- Zhang, X.Q.; Peng, L.L.; Zheng, D.; Tao, J. Variation of total cloud amount and its possible causes over the Qinghai-Xizang Plateau during 1971–2004. Acta Geogr. Sin. 2007, 62, 959. [Google Scholar] [CrossRef]
- Weng, D.M. Comparison between total cloudiness from satellite cloud pictures and ground observations over China. J. Appl. Meteorol. 1998, 9, 32–37. [Google Scholar]
- Wang, J.; Jian, B.D.; Wang, G.Y.; Zhao, Y.X.; Li, Y.R.; Letu, H.S.; Zhang, M.; Li, J.M. Climatology of Cloud Phase, Cloud Radiative Effects and Precipitation Properties over the Tibetan Plateau. Remote Sens. 2021, 13, 363. [Google Scholar] [CrossRef]
- Peng, J.; Zhang, H.; Li, Z.Q. Temporal and spatial variations of global deep cloud systems based on CloudSat and CALIPSO satellite observations. Adv. Atmos. Sci. 2014, 31, 593–603. [Google Scholar] [CrossRef]
- Li, J.; Huang, J.; Stamnes, K.; Wang, T.; Lv, Q.; Jin, H. A global survey of cloud overlap based on CALIPSO and CloudSat measurements. Atmos. Chem. Phys. 2015, 15, 519–536. [Google Scholar] [CrossRef]
- Tang, Y.H.; Zhou, Y.Q.; Cai, M.; Ma, Q.R. Global distribution of clouds based on CloudSat and CALIPSO combined observations. Trans. Atmos. Sci. 2020, 43, 917–931. [Google Scholar] [CrossRef]
- Zhang, X.; Duan, K.Q.; Shi, P.H. Cloud vertical profiles from CloudSat data over the eastern Tibetan Plateau during summer. Chin. J. Atmos. Sci. 2015, 39, 1073–1080. (In Chinese) [Google Scholar] [CrossRef]
- Liu, J.J.; Chen, B.D. Cloud occurrence frequency and structure over the Qinghai-Tibetan Plateau from CloudSat observation. Plateau Meteor. 2017, 36, 632–642. (In Chinese) [Google Scholar] [CrossRef]
- Im, E.; Wu, C.; Durden, S.L. Cloud profiling radar for the CloudSat mission. IEEE Aerosp. Electron. Syst. Mag. 2005, 20, 15–18. [Google Scholar] [CrossRef]
- Stephens, G.L.; Vane, D.G.; Tanelli, S.; Im, E.; Durden, S.; Rokey, M.; Reinke, D.; Partain, P.; Mace, G.G.; Austin, R.; et al. CloudSat mission: Performance and early science after the first year of operation. J. Geophys. Res. 2008, 113, D00A18. [Google Scholar] [CrossRef]
- Mace, G.G.; Zhang, Q.Q. The CloudSat radar-lidar geometrical profile product (RL-GeoProf): Updates, improvements, and selected results. J. Geophys. Res. Atmos. 2014, 119, 9441–9462. [Google Scholar] [CrossRef]
- Sassen, K.; Wang, Z. Classifying clouds around the globe with the CloudSat radar: 1-year of results. Geophys. Res. Lett. 2008, 35, L04805. [Google Scholar] [CrossRef]
- Austin, R.T.; Heymsfield, A.J.; Stephens, G.L. Retrieval of ice cloud microphysical parameters using the CloudSat millimeter-wave radar and temperature. J. Geophys. Res. 2009, 114, D00A23. [Google Scholar] [CrossRef]
- Yuter, S.E.; Houze, R.A. Three-dimensional kinematic and microphysical evolution of Florida cumulonimbus. Part III: Vertical mass transport, maw divergence, and synthesis. Mon. Weather Rev. 1995, 123, 1921–1940. [Google Scholar] [CrossRef]
- Sindhu, K.D.; Bhat, G.S. Comparison of CloudSat and TRMM radar reflectivities. J. Earth Syst. Sci. 2013, 122, 947–956. [Google Scholar] [CrossRef]
- Warren, S.G.; Eastman, R.M.; Hahn, C.J. A survey of changes in cloud cover and cloud types over land from surface observations, 1971–1996. J. Clim. 2007, 20, 717–738. [Google Scholar] [CrossRef] [Green Version]
- Liu, Y.B.; Hu, Z.J.; You, L.G. A study of the frontal snowfall in Zhungeer basin of Xinjiang in winter Part II: Theoretical discussion. J. Appl. Meteorol. Sci. 1988, 2, 159–168. [Google Scholar]
- Yanai, M.; Li, C.F.; Song, Z.S. Seasonal heating of the Tibetan Plateau and its effects on the evolution of the Asian summer monsoon. J. Meteorol. Soc. Jpn. J. Meteorol. Soc. Jpn. Ser. II 1992, 70, 319–351. [Google Scholar] [CrossRef]
- Nayak, M. CloudSat Anomaly Recovery and Operational Lessons Learned. In Proceedings of the SpaceOps 2012 Conference, Stockholm, Sweden, 11–15 June 2012. [Google Scholar] [CrossRef]
- Guan, W.N.; Hu, H.B.; Ren, X.J.; Yang, X.Q. Subseasonal zonal variability of the western Pacific subtropical high in summer: Climate impacts and underlying mechanisms. Clim. Dyn. 2019, 53, 3325–3344. [Google Scholar] [CrossRef]
- Zhu, L.J.; Jin, J.M.; Liu, X.; Tian, L.; Zhang, Q.H. Simulations of the impact of lakes on local and regional climate over the Tibetan Plateau. Atmos. Ocean 2018, 56, 230–239. [Google Scholar] [CrossRef]
- Yan, Y.F.; Liu, Y.M.; Lu, J.H. Cloud vertical structure, precipitation, and cloud radiative effects over Tibetan Plateau and its neighboring regions. J. Geophys. Res. Atmos. 2016, 121, 5864–5877. [Google Scholar] [CrossRef]
- Lawrence, M.G. The relationship between relative humidity and the dewpoint temperature in moist air: A simple conversion and applications. Bull. Am. Meteorol. Soc. 2005, 86, 225–234. [Google Scholar] [CrossRef]
- Duan, A.M.; Wu, G.X. Change of cloud amount and the climate warming on the Tibetan Plateau. Geophys. Res. Lett. 2006, 33, L22704. [Google Scholar] [CrossRef]
- Wu, G.M.; He, B.; Duan, A.M.; Liu, Y.M.; Yu, W. Formation and variation of the atmospheric heat source over the Tibetan Plateau and its climate effects. Adv. Atmos. Sci. 2017, 34, 1169–1184. [Google Scholar] [CrossRef]
- Chen, B.; Chao, W.C.; Liu, X. Enhanced climatic warming in the Tibetan Plateau due to doubling CO2: A model study. Clim. Dyn. 2003, 20, 401–413. [Google Scholar] [CrossRef]
- Duan, A.M.; Wu, G.X.; Zhang, Q.; Liu, Y.M. New proofs of the recent climate warming over the Tibetan Plateau as a result of the increasing greenhouse gases emissions. Chin. Sci. Bull. 2006, 51, 1396–1400. [Google Scholar] [CrossRef]
- Lee, S.; Kahn, B.H.; Teixeira, J. Characterization of cloud liquid water content distributions from CloudSat. J. Geophys. Res. 2010, 115, D20203. [Google Scholar] [CrossRef]
- Harrop, B.E.; Hartmann, D.L. The role of cloud radiative heating within the atmosphere on the high cloud amount and top-of-atmosphere cloud radiative effect. J. Adv. Model. Earth Syst. 2016, 8, 1391–1410. [Google Scholar] [CrossRef]
Figure 1.
The geographical location of Qinghai Lake and distribution of meteorological stations.

Figure 2.
Technology roadmap.

Figure 3.
(a,b) Annual and monthly average cloud occurrence frequency in QHL from 2006 to 2019.

Figure 4.
(a,b) Annual and monthly average frequency of different clouds.

Figure 5.
(a,b) Annual and monthly average cloud ice water content; (c,d) Annual and monthly average cloud liquid water content.
Figure 5.
(a,b) Annual and monthly average cloud ice water content; (c,d) Annual and monthly average cloud liquid water content.

Figure 6.
Vertical structure of pentad mean cloud characteristic parameters in QHL. (a) Sum of cloud ice water and liquid water content; (b,c) cloud ice and liquid water content; (d) cloud fraction; (e,f) cloud ice and liquid particle concentration; (g,h) cloud ice and liquid particle effective radius.

Figure 7.
The normalized contoured frequency by altitude diagram (CFAD) and probability distribution functions (PDF) of (a,b) cloud ice and liquid water content; (c,d) cloud ice and liquid particle concentration; (e,f) cloud ice and liquid particle effective radius.
Figure 7.
The normalized contoured frequency by altitude diagram (CFAD) and probability distribution functions (PDF) of (a,b) cloud ice and liquid water content; (c,d) cloud ice and liquid particle concentration; (e,f) cloud ice and liquid particle effective radius.

Figure 8.
(a,b) Annual and monthly average top and cloud base heights of Ci, As, and Ac; (c,d) annual and monthly average top and cloud base heights of Sc, Cu, Ns, and DC. The solid line represents the height of cloud top, and the dotted line represents the height of cloud base.
Figure 8.
(a,b) Annual and monthly average top and cloud base heights of Ci, As, and Ac; (c,d) annual and monthly average top and cloud base heights of Sc, Cu, Ns, and DC. The solid line represents the height of cloud top, and the dotted line represents the height of cloud base.

Figure 9.
Meteorological elements of QHL from 2006 to 2019. (a) Temperature; (b) evaporation; (c) relative humidity; (d) precipitation; (e) wind speed.
Figure 9.
Meteorological elements of QHL from 2006 to 2019. (a) Temperature; (b) evaporation; (c) relative humidity; (d) precipitation; (e) wind speed.

Figure 10.
(a,b) Composites of 500 hPa annual mean relative humidity and wind field anomalies in 2008 and 2017; (c,d) surface annual mean temperature anomalies in 2008 and 2017; (e,f) low-level stability in 2008 and 2017.
Figure 10.
(a,b) Composites of 500 hPa annual mean relative humidity and wind field anomalies in 2008 and 2017; (c,d) surface annual mean temperature anomalies in 2008 and 2017; (e,f) low-level stability in 2008 and 2017.


Table 1.
Data product descriptions.
| Data set | Product Code/Station Name | Product Name |
|---|---|---|
| CloudSat data | 2B-GEOPROF-LIDAR | Cloud fraction; Top-base-height of cloud |
| 2B-CLDCLASS | Cloud types; Top-base-height of each cloud | |
| 2B-CWC-RO | Cloud water content; Cloud particle effective radius; Cloud particle concentration | |
| Datasets of daily values of terrestrial climate information for China (V3.0) | Gangcha station, Qapqia station | Temperature; Evaporation; Relative humidity; Precipitation; Wind speed |
| ERA5 reanalysis data | U, V-component of wind; Relative humidity; Temperature |
Table 2.
Basic characteristics of different types of clouds.
| Cloud Class | Cloud Bottom Height/km | Rainfall Properties | Horizontal Scale/km | Vertical Scale | Liquid Water Content |
|---|---|---|---|---|---|
| Cirrus (Ci) | >7 | None | 1~103 | Medium | 0 |
| Altostratus (As) | 2~7 | None | 103 | Medium | Near 0, mainly ice particle |
| Altocumulus (Ac) | 2~7 | May produce virga | 103 | Light or medium | >0 |
| Stratocumulus (Sc) | 0~2 | May produce drizzle or snowfall | 103 | Light | >0 |
| Cumulus (Cu) | 0~3 | May produce drizzle or snowfall | 1 | Light or medium | >0 |
| Nimbostratus (Ns) | 0~4 | Continuous rain or snow | 50~103 | Thick | >0 |
| Deep Convective (DC) | 0~3 | May produce heavy rainfall or hail | 10~50 | Thick | >0 |
Table 3.
Annual average change rate of cloud water content and different types of clouds.
| Annual Average Change Rate | R2 | |
|---|---|---|
| Ci | −0.56%/a | 0.14 |
| As | 0.1%/a | 0.001 |
| Ac | −1.06%/a | 0.37 |
| Sc | −0.17%/a | 0.01 |
| Cu | 0.12%/a | 0.03 |
| Ns | 1.62%/a | 0.37 |
| Cloud ice water content | 3.06 mg m−3/a | 0.21 |
| Cloud liq water content | −2.46 mg m−3/a | 0.06 |
Table 4.
Correlation analysis between total cloud occurrence frequency, cloud water content, and meteorological elements.
Table 4.
Correlation analysis between total cloud occurrence frequency, cloud water content, and meteorological elements.
| Annual Average | Total Cloud Frequency | Cloud Ice Water | Cloud Liq Water |
|---|---|---|---|
| r | r | r | |
| Temperature | −0.46 * | −0.23 | 0.29 |
| Evaporation | 0.05 | −0.62 ** | 0.44 |
| Relative humidity | −0.1 | 0.35 | −0.25 |
| Precipitation | −0.59 * | 0.14 | 0.05 |
| Wind speed | 0.58 * | −0.38 | 0.27 |
** Correlation is significant at the 0.01 level, * Correlation is significant at the 0.05 level (Two-tail).
Publisher’s Note: MDPI stays neutral with regard to jurisdictional claims in published maps and institutional affiliations. |
© 2022 by the authors. Licensee MDPI, Basel, Switzerland. This article is an open access article distributed under the terms and conditions of the Creative Commons Attribution (CC BY) license (https://creativecommons.org/licenses/by/4.0/).
Share and Cite
MDPI and ACS Style
Li, L.; Sun, M.; Mei, J. Variation and Influencing Factors of Cloud Characteristics over Qinghai Lake from 2006 to 2019. Sustainability 2022, 14, 11935. https://doi.org/10.3390/su141911935
AMA Style
Li L, Sun M, Mei J. Variation and Influencing Factors of Cloud Characteristics over Qinghai Lake from 2006 to 2019. Sustainability. 2022; 14(19):11935. https://doi.org/10.3390/su141911935
Chicago/Turabian StyleLi, Lin, Meiping Sun, and Jing Mei. 2022. "Variation and Influencing Factors of Cloud Characteristics over Qinghai Lake from 2006 to 2019" Sustainability 14, no. 19: 11935. https://doi.org/10.3390/su141911935
Note that from the first issue of 2016, this journal uses article numbers instead of page numbers. See further details here.