
Ecological Distribution Patterns of Wild Grasses and Abiotic Factors

 ,
,  , and
, and
Abstract
:1. Introduction
2. Methodology
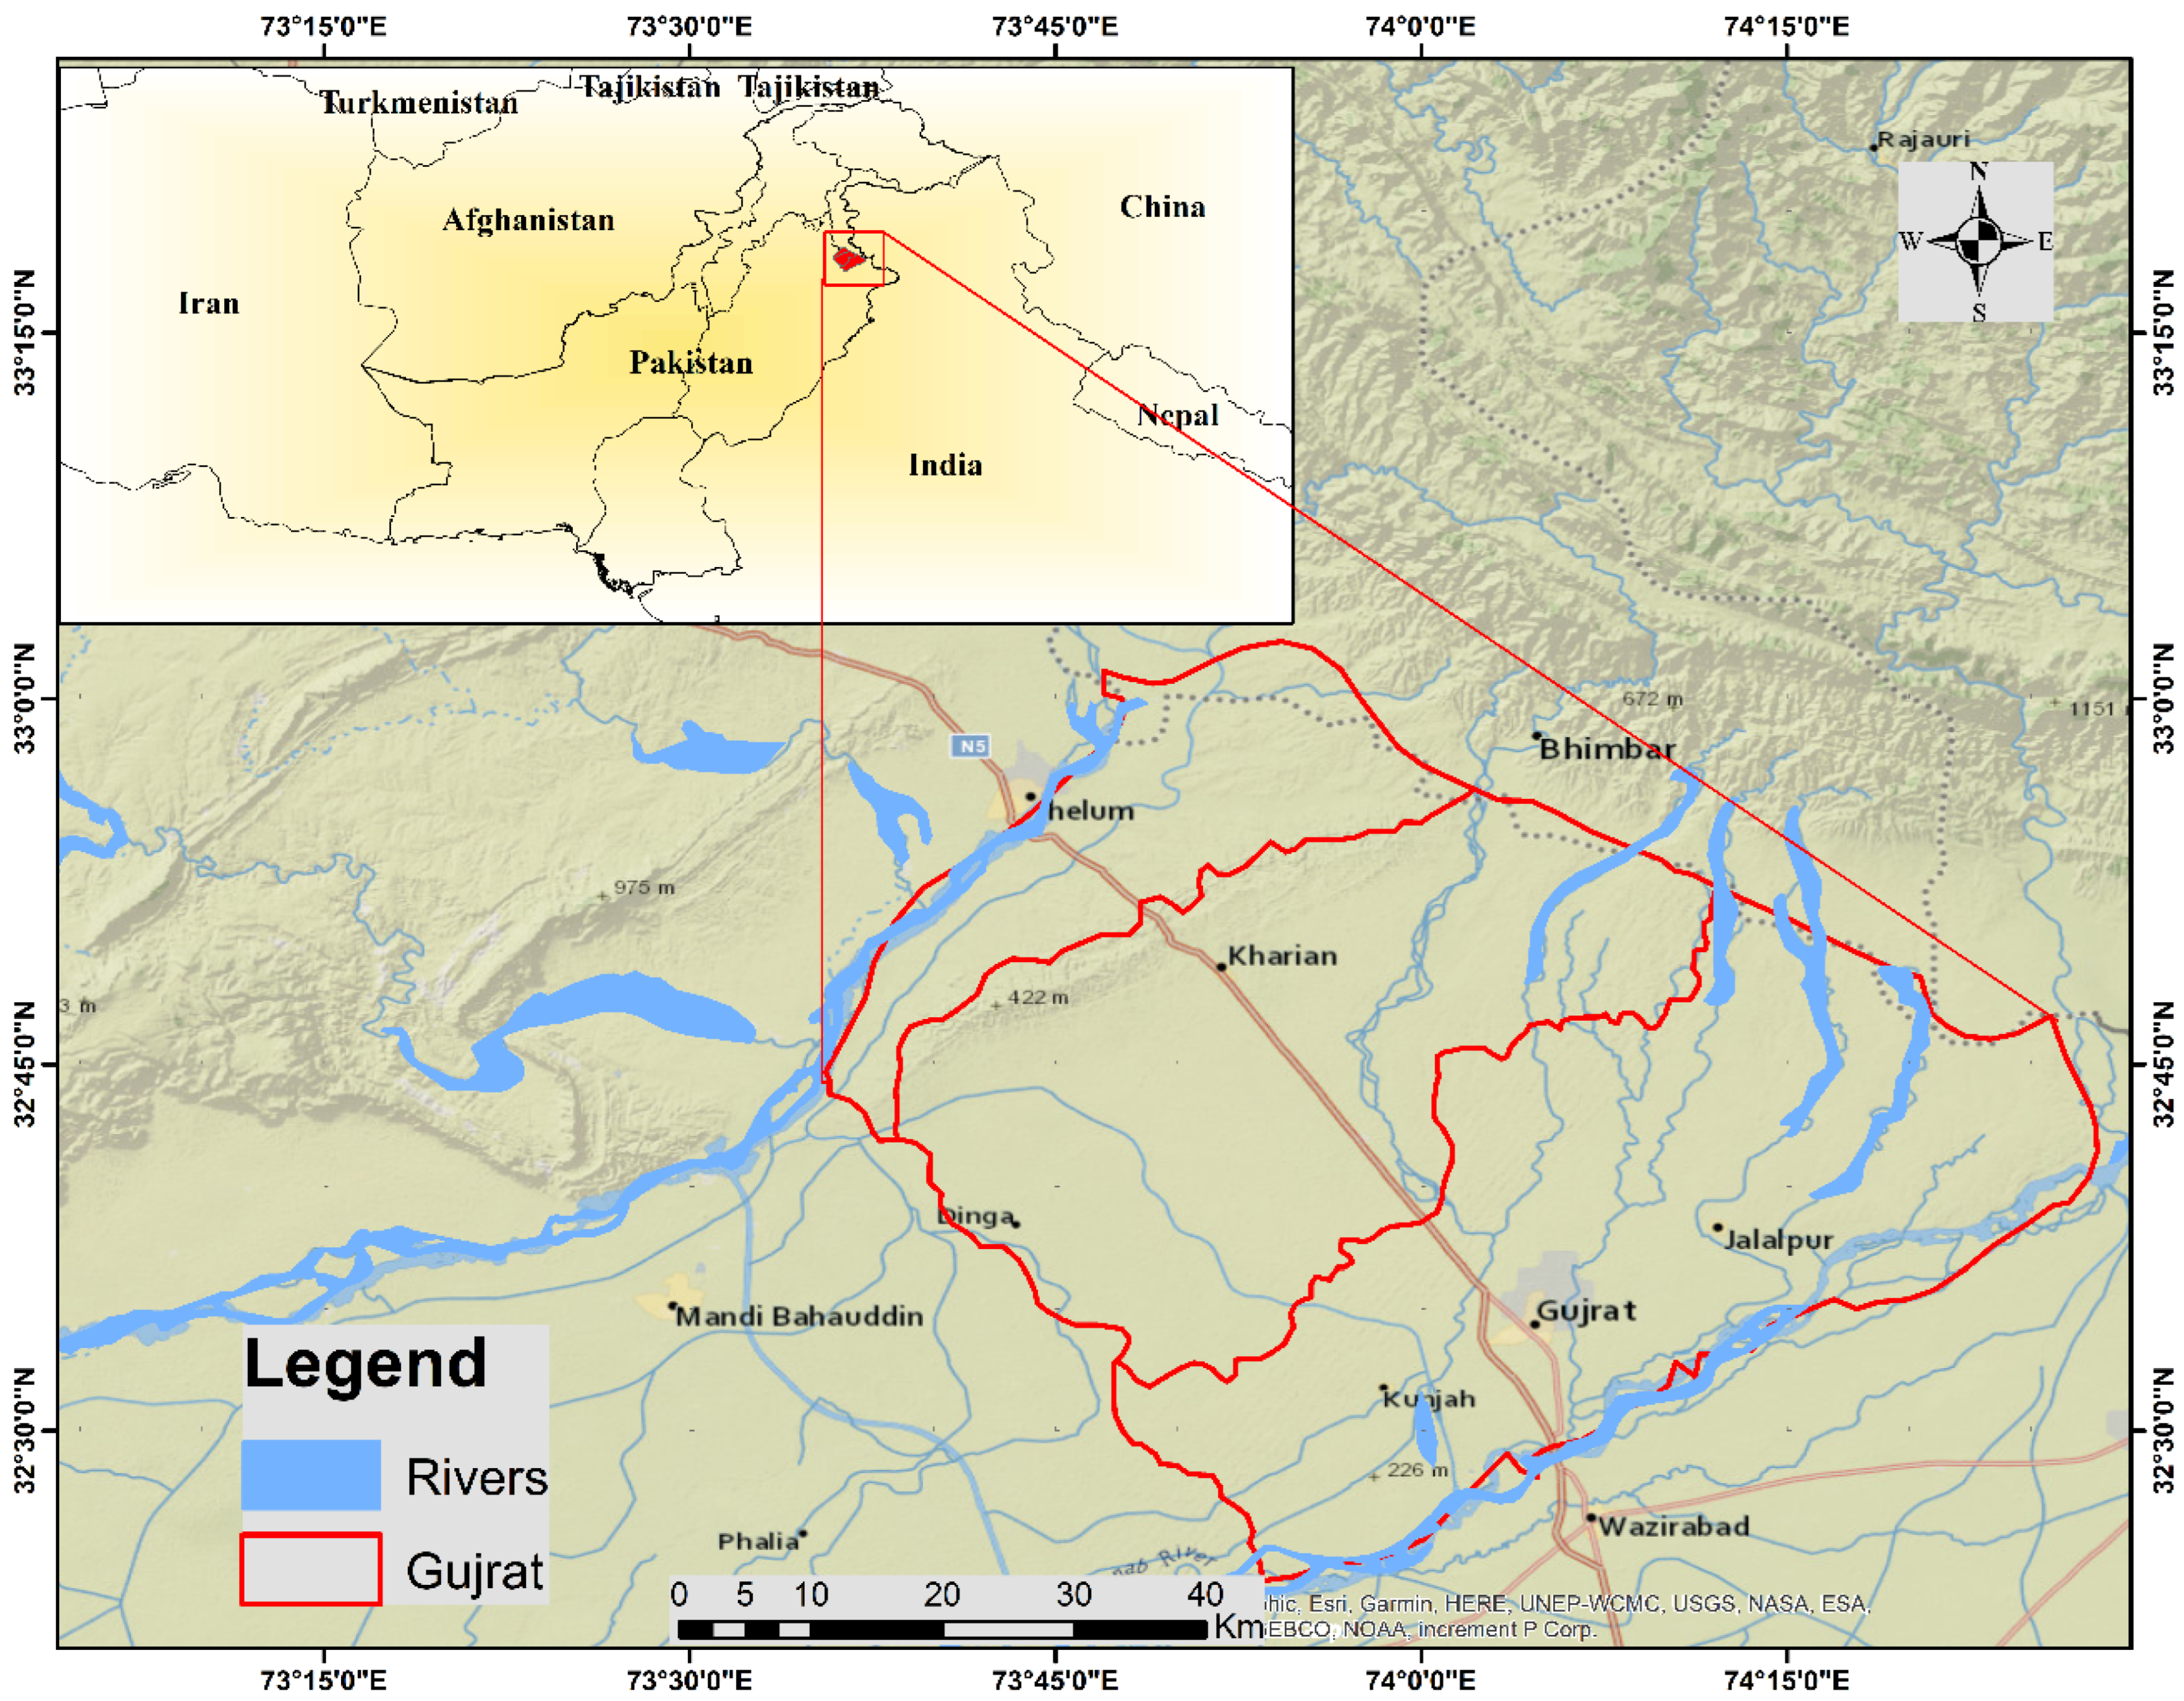
2.1. Study Area
2.2. Vegetation Sampling
2.3. Soil Sampling
2.4. Ordination Analysis
2.5. Data Analysis
3. Results
3.1. Species Composition and Funtional Trait Diversity
3.2. Vegetation Classification of the Recorded Species
Cluster Analysis of Wild Grasses
- Group 1
- b.
- Group 2
- c.
- Group 3
- d.
- Group 4
3.3. Diversity Indices
3.4. DCA Ordination Plot of Species
3.5. CCA Ordination of Wild Grasses
4. Discussion
5. Conclusions
Supplementary Materials
Author Contributions
Funding
Institutional Review Board Statement
Informed Consent Statement
Data Availability Statement
Acknowledgments
Conflicts of Interest
References
- Weiss, K.C.B.; Ray, C.A. Unifying functional trait approaches to understand the assemblage of ecological communities: Synthesizing taxonomic divides. Ecography (Cop.) 2019, 42, 2012–2020. [Google Scholar] [CrossRef]
- Shaheen, H.; Khan, S.M.; Harper, D.M.; Ullah, Z.; Allem Qureshi, R. Species Diversity, Community Structure, and Distribution Patterns in Western Himalayan Alpine Pastures of Kashmir, Pakistan. Mt. Res. Dev. 2011, 31, 153. [Google Scholar] [CrossRef]
- Haq, S.M.; Singh, B.; Bashir, F.; Farooq, A.J.; Singh, B.; Calixto, E.S. Exploring and understanding the floristic richness, life-form, leaf-size spectra and phenology of plants in protected forests: A case study of Dachigam National Park in Himalaya, Asia. Shengtai Xuebao/Acta Ecol. Sin. 2021, 41, 479–490. [Google Scholar] [CrossRef]
- Khan, W.; Khan, S.M.; Ahmad, H.; Alqarawi, A.A.; Shah, G.M.; Hussain, M.; Abd Allah, E.F. Life forms, leaf size spectra, regeneration capacity and diversity of plant species grown in the Thandiani forests, district Abbottabad, Khyber Pakhtunkhwa, Pakistan. Saudi J. Biol. Sci. 2018, 25, 94–100. [Google Scholar] [CrossRef]
- Afza, R.; Ahmad, H.; Saqib, Z.; Marwat, K.B.; Khan, J. Spatial analysis of vascular flora of Ayubia National Park, KPK, Pakistan: A classical example of moist temperate Himalaya. Pakistan J. Bot. 2018, 50, 1499–1508. [Google Scholar]
- Khan, A.M.; Qureshi, R.; Saqib, Z. Multivariate analyses of the vegetation of the western Himalayan forests of Muzaffarabad district, Azad Jammu and Kashmir, Pakistan. Ecol. Indic. 2019, 104, 723–736. [Google Scholar] [CrossRef]
- Iqbal, M.; Khan, S.M.; Ahmad, Z.; Hussain, M.; Shah, S.N.; Kamran, S.; Manan, F.; Ul Haq, Z.; Ullah, S. Vegetation classification of the margalla foothills, islamabad under the influence of edaphic factors and anthropogenic activities using modern ecological tools. Pakistan J. Bot. 2021, 53, 1831–1843. [Google Scholar] [CrossRef]
- Abbas, Z.; Khan, S.M.; Alam, J.A.N.; Abideen, Z.; Ullah, Z. Plant communities and anthropo-natural threats in the shigar valley, (Central karakorum) Baltistan-Pakistan. Pakistan J. Bot. 2020, 52, 987–994. [Google Scholar] [CrossRef]
- Ullah, Z.; Ahmad, M.; Mulk Khan, S. Phytogeographic analysis and diversity of grasses and sedges (Poales) of Northern Pakistan. Pakistan J. Bot. 2015, 47, 93–104. [Google Scholar]
- Harun, N.; Chaudhry, A.S.; Shaheen, S.; Ullah, K.; Khan, F. Ethnobotanical studies of fodder grass resources for ruminant animals, based on the traditional knowledge of indigenous communities in Central Punjab Pakistan. J. Ethnobiol. Ethnomed. 2017, 13, 56. [Google Scholar] [CrossRef] [PubMed]
- Husain, T.; Hussain, A.; Ahmed, M. Studies of vegetative behavior and climatic effects on some pasture grasses growing wild in Pakistan. Pakistan J. Bot. 2009, 41, 2379–2386. [Google Scholar]
- Alam, N.; Olsthoorn, T.N. Punjab scavenger wells for sustainable additional groundwater irrigation. Agric. Water Manag. 2014, 138, 55–67. [Google Scholar] [CrossRef]
- Masood, N.; Farooqi, A.; Zafar, M.I. Health risk assessment of arsenic and other potentially toxic elements in drinking water from an industrial zone of Gujrat, Pakistan: A case study. Environ. Monit. Assess. 2019, 191, 95. [Google Scholar] [CrossRef] [PubMed]
- Majeed, M.; Tariq, A.; Haq, S.M.; Waheed, M.; Anwar, M.M.; Li, Q.; Aslam, M.; Abbasi, S.; Mousa, B.G. A Detailed Ecological Exploration of the Distribution Patterns of Wild Poaceae from the Jhelum District (Punjab), Pakistan. Sustainability 2022, 14, 3786. [Google Scholar] [CrossRef]
- Haq, S.M.; Malik, Z.A.; Rahman, I.U. Quantification and characterization of vegetation and functional trait diversity of the riparian zones in protected forest of Kashmir Himalaya, India. Nord. J. Bot. 2019, 37. [Google Scholar] [CrossRef]
- Ur Rahman, A.M.J.A.D.; Khan, S.M.; Saqib, Z.; Ullah, Z.; Ahmad, Z.; Ekercin, S.; Mumtaz, A.S.; Ahmad, H. Diversity and abundance of climbers in relation to their hosts and elevation in the monsoon forests of murree in the himalayas. Pakistan J. Bot. 2020, 52, 601–612. [Google Scholar] [CrossRef]
- Majeed, M.; Bhatti, K.H.; Amjad, M.S. Impact of climatic variations on the flowering phenology of plant species in jhelum district, punjab, pakistan. Appl. Ecol. Environ. Res. 2021, 19, 3343–3376. [Google Scholar] [CrossRef]
- Khan, M.; Khan, S.M.; Ilyas, M.; Alqarawi, A.A.; Ahmad, Z.; Abd Allah, E.F. Plant species and communities assessment in interaction with edaphic and topographic factors; an ecological study of the mount Eelum District Swat, Pakistan. Saudi J. Biol. Sci. 2017, 24, 778–786. [Google Scholar] [CrossRef]
- Lü, X.T.; Hu, Y.Y.; Wolf, A.A.; Han, X.G. Species richness mediates within-species nutrient resorption: Implications for the biodiversity–productivity relationship. J. Ecol. 2019, 107, 2346–2352. [Google Scholar] [CrossRef]
- Rasheed, S.; Khan, S.M.; Ahmad, Z.; Mustafa, G.; Haq, Z.U.; Shah, H.; Ansari, L.; Jatt, T. Ecological assessment and indicator species analyses of the Cholistan desert using multivariate statistical tools. Pakistan J. Bot. 2022, 54. [Google Scholar] [CrossRef]
- Abdullah, M.; Ahmad Khan, R.; Yaqoob, S.; Ahmad, M. Community structure of browse vegetation in Cholistan rangelands Pakistan. Pakistan J. Agric. Sci. 2013, 50, 237–247. [Google Scholar]
- Jafari, M.; Chahouki, M.A.Z.; Tavili, A.; Azarnivand, H.; Amiri, G.Z. Effective environmental factors in the distribution of vegetation types in Poshtkouh rangelands of Yazd Province (Iran). J. Arid Environ. 2004, 56, 627–641. [Google Scholar] [CrossRef]
- Paudel, S.; Vetaas, O.R. Effects of topography and land use on woody plant species composition and beta diversity in an arid Trans-Himalayan landscape, Nepal. J. Mt. Sci. 2014, 11, 1112–1122. [Google Scholar] [CrossRef]
- Gonzalez, P.; Neilson, R.P.; Lenihan, J.M.; Drapek, R.J. Global patterns in the vulnerability of ecosystems to vegetation shifts due to climate change. Global Ecol. Biogeogr. 2010, 19, 755–768. [Google Scholar]
- Shujaul Mulk Khan, S.P.H.A.H.S.D.H. Vegetation Dynamics in the Western Himalayas, Diversity Indices and Climate Change. Sci. Technol. Dev. (PCST J. ) 2012, 31, 232–243. [Google Scholar]
- Khan, S.A.; Khan, S.M.; Ullah, Z.; Ahmad, Z.; Alam, N.; Shah, S.N.; Khan, R.; Zada, M. Phytogeographic classification using multivariate approach; a case study from the Jambil valley swat, Pakistan. Pakistan J. Bot. 2020, 52, 279–290. [Google Scholar] [CrossRef]
- Ilyas, M.; Qureshi, R.; Ziaul-Haq, I.U.H.; Munir, M.; Munazir, M.; Maqssod, M. Ecological evaluation of existing plant resources of Manrai Hills, Swat, Pakistan using multivariate analysis. Pakistan J. Bot. 2020, 52, 1727–1736. [Google Scholar] [CrossRef]
- Rahman, I.U.R.; Afzal, A.; Iqbal, Z.; Ijaz, F.; Ali, N.; Asif, M.; Alam, J.; Majid, A.; Hart, R.; Bussmann, R.W. First insights into the floristic diversity, biological spectra and phenology of manoor valley, Pakistan. Pakistan J. Bot. 2018, 50, 1113–1124. [Google Scholar]
- Shaheen, H.; Qureshi, R.A.; Shinwari, Z.K. Structural diversity, vegetation dynamics and anthropogenic impact on lesser Himalayan subtropical forests of Bagh district, Kashmir. Pakistan J. Bot. 2011, 43, 1861–1866. [Google Scholar]
- Ilyas, M.; Qureshi, R.; Akhtar, N.; Ziaul-Haq, Z.; Khan, A.M. Floristic diversity and vegetation structure of the remnant subtropical broad leaved forests from Kabal Valley, Swat, Pakistan. Pakistan J. Bot. 2018, 50, 217–230. [Google Scholar]
- Addo-Fordjour, P.; Rahmad, Z.B. Environmental factors associated with liana community assemblages in a tropical forest reserve, Ghana. J. Trop. Ecol. 2015, 31, 69–79. [Google Scholar] [CrossRef]
- Majeed, M.; Bhatti, K.H.; Amjad, M.S.; Abbasi, A.M.; Bussmann, R.W.; Nawaz, F.; Rashid, A.; Mehmood, A.; Mahmood, M.; Khan, W.M.; et al. Ethno-veterinary uses of poaceae in Punjab, Pakistan. PLoS ONE 2020, 15, e0241705. [Google Scholar] [CrossRef]
- Ahmed, M.; Husain, T.; Sheikh, A.H.; Hussain, S.S.; Siddiqui, M.F. Phytosociology and structure of Himalayan forests from different climatic zones of Pakistan. Pakistan J. Bot. 2006, 38, 361–383. [Google Scholar]
- Ahmad, F.; Khan, M.A.; Ahmad, M.; Zafar, M.; Nazir, A.; Marwat, S.K. Taxonomic studies of grasses and their indigenous uses in the salt range area of Pakistan. African J. Biotechnol. 2009, 8, 231–249. [Google Scholar] [CrossRef]
- Kutal, D.; Kunwar, R.M.; Baral, K.; Sapkota, P.; Sharma, H.P.; Rimal, B. Factors that influence the plant use knowledge in the middle mountains of Nepal. PLoS ONE 2021, 16, e0246390. [Google Scholar] [CrossRef]
- Nowak, A.; Nowak, S.; Nobis, M.; Nobis, A. Vegetation of solid rock faces and fissures of the alpine and subnival zone in the Pamir Alai mountains (Tajikistan, Middle Asia). Phytocoenologia 2014, 44, 81–101. [Google Scholar] [CrossRef]
- Fuentes-Lillo, E.; Lembrechts, J.J.; Cavieres, L.A.; Jiménez, A.; Haider, S.; Barros, A.; Pauchard, A. Anthropogenic factors overrule local abiotic variables in determining non-native plant invasions in mountains. Biol. Invasions 2021, 23, 3671–3686. [Google Scholar] [CrossRef]
- Yemataw, Z.; Tesfaye, K.; Zeberga, A.; Blomme, G. Exploiting indigenous knowledge of subsistence farmers’ for the management and conservation of Enset (Ensete ventricosum (Welw.) Cheesman) (musaceae family) diversity on-farm. J. Ethnobiol. Ethnomed. 2016, 12, 34. [Google Scholar] [CrossRef] [PubMed]
- Bocksberger, G.; Schnitzler, J.; Chatelain, C.; Daget, P.; Janssen, T.; Schmidt, M.; Thiombiano, A.; Zizka, G. Climate and the distribution of grasses in West Africa. J. Veg. Sci. 2016, 27, 306–317. [Google Scholar] [CrossRef]
- Zakharova, L.; Meyer, K.M.; Seifan, M. Trait-based modelling in ecology: A review of two decades of research. Ecol. Modell. 2019, 407, 108703. [Google Scholar] [CrossRef]
- Brown, L.R.; du Preez, P.J.; Bezuidenhout, H.; Bredenkamp, G.J.; Mostert, T.H.C.; Collins, N.B. Guidelines for phytosociological classifications and descriptions of vegetation in southern Africa. Koedoe 2013, 55, 1–10. [Google Scholar] [CrossRef]
- Majeed, M.; Tariq, A.; Anwar, M.M.; Khan, A.M.; Arshad, F.; Mumtaz, F.; Farhan, M.; Zhang, L.; Zafar, A.; Aziz, M.; et al. Monitoring of land use–Land cover change and potential causal factors of climate change in Jhelum district, Punjab, Pakistan, through GIS and multi-temporal satellite data. Land 2021, 10, 1026. [Google Scholar] [CrossRef]
- Nafeesa, Z.; Haq, S.M.; Bashir, F.; Gaus, G.; Mazher, M.; Anjum, M.; Rasool, A.; Rashid, N. Observations on the floristic, life-form, leaf-size spectra and habitat diversity of vegetation in the Bhimber hills of Kashmir Himalayas. Shengtai Xuebao/Acta Ecol. Sin. 2021, 41, 228–234. [Google Scholar] [CrossRef]
- Kunwar, R.M.; Fadiman, M.; Thapa, S.; Acharya, R.P.; Cameron, M.; Bussmann, R.W. Plant use values and phytosociological indicators: Implications for conservation in the Kailash Sacred Landscape, Nepal. Ecol. Indic. 2020, 108, 105679. [Google Scholar] [CrossRef]
- Saslis-Lagoudakis, C.H.; Klitgaard, B.B.; Forest, F.; Francis, L.; Savolainen, V.; Williamson, E.M.; Hawkins, J.A. The use of phylogeny to interpret cross-cultural patterns in plant use and guide medicinal plant discovery: An example from pterocarpus (leguminosae). PLoS ONE 2011, 6, e22275. [Google Scholar] [CrossRef]
- Rashid, I.; Haq, S.M.; Lembrechts, J.J.; Khuroo, A.A.; Pauchard, A.; Dukes, J.S. Railways redistribute plant species in mountain landscapes. J. Appl. Ecol. 2021, 58, 1967–1980. [Google Scholar] [CrossRef]
- Lenoir, J.; Gégout, J.C.; Marquet, P.A.; De Ruffray, P.; Brisse, H. A significant upward shift in plant species optimum elevation during the 20th century. Science 2008, 320, 1768–1771. [Google Scholar] [CrossRef]
- Fatima, S.; Ahmad, F.; Hameed, M.; Ahmad, R. Ecology and species association of grass species in response to altitudinal gradient in the Potohar region. Pakistan J. Bot. 2018, 50, 41–49. [Google Scholar]
- O’Neill, A.R.; Badola, H.K.; Dhyani, P.P.; Rana, S.K. Integrating ethnobiological knowledge into biodiversity conservation in the Eastern Himalayas. J. Ethnobiol. Ethnomed. 2017, 13, 21. [Google Scholar] [CrossRef]
- Khan, A.M.; Qureshi, R.; Saqib, Z.; Habib, T. A novel study of the interrelationship of seasonality, satellite data and weed compositional changes of the agro-ecological system of Gujrat, Pakistan. Appl. Ecol. Environ. Res. 2018, 16, 2995–3018. [Google Scholar] [CrossRef]
- Dray, S.; Pélissier, R.; Couteron, P.; Fortin, M.J.; Legendre, P.; Peres-Neto, P.R.; Bellier, E.; Bivand, R.; Blanchet, F.G.; De Cáceres, M.; et al. Community ecology in the age of multivariate multiscale spatial analysis. Ecol. Monogr. 2012, 82, 257–275. [Google Scholar] [CrossRef]
- Edwards, S.E.; Martz, K.E.; Rogge, A.; Heinrich, M. Edaphic and phytochemical factors as predictors of equine grass sickness cases in the UK. Front. Pharmacol. 2010, 1, 122. [Google Scholar] [CrossRef]
- Matama-Kauma, T.; Schulthess, F.; Le Rü, B.P.; Mueke, J.; Ogwang, J.A.; Omwega, C.O. Abundance and diversity of lepidopteran stemborers and their parasitoids on selected wild grasses in Uganda. Crop Prot. 2008, 27, 505–513. [Google Scholar] [CrossRef]
- Garcia, R.J.F.; Longhi-Wagner, H.M.; Pirani, J.R.; Meirelles, S.T. A contribution to the phytogeography of Brazilian campos: An analysis based on Poaceae. Rev. Bras. Botânica. 2009, 32, 703–713. [Google Scholar] [CrossRef] [Green Version]


| Diversity Indices | Group 1 | Group 2 | Group 3 | Group 4 |
|---|---|---|---|---|
| Dominance_D | 0.05 | 0.07 | 0.12 | 0.067 |
| Simpson_1-D | 0.94 | 0.92 | 0.87 | 0.93 |
| Shannon_H | 3.08 | 2.75 | 2.48 | 2.8 |
| Evenness_e^H/S | 0.68 | 0.74 | 0.46 | 0.73 |
| Menhinick | 1.65 | 1.21 | 1.33 | 1.01 |
| Margalef | 5.26 | 3.52 | 4.22 | 3.54 |
| Equitability_J | 0.89 | 0.90 | 0.76 | 0.90 |
| Fisher_alpha | 8.36 | 5.13 | 6.31 | 4.95 |
| Berger-Parker | 0.13 | 0.11 | 0.26 | 0.11 |
| Axes | 1 | 2 | 3 | 4 |
|---|---|---|---|---|
| Eigen values | 0.495 | 0.385 | 0.358 | 0.321 |
| Species-environment associations | 0.833 | 0.806 | 0.789 | 0.755 |
| Accumulative percentage variance of wild grasses data | 3 | 5.3 | 7.4 | 9.4 |
| Accumulative percentage variance of species-environment relation | 18.2 | 32.3 | 45.4 | 57.2 |
| Total inertia | 16.642 | |||
| Sum of all eigen values | 16.642 | |||
| Sum of all canonical eigenvalues | 2.726 | |||
| Monte-Carlo test | ||||
| Test of significance of first canonical axis: eigenvalue | 0.495 | |||
| F-ratio | 2.085 | |||
| p-value | 0.0300 | |||
| Test of significance of total canonical axes; Trace | 2.726 | |||
| F-ratio | 1.211 | |||
| p-value | 0.0140 | |||
Publisher’s Note: MDPI stays neutral with regard to jurisdictional claims in published maps and institutional affiliations. |
© 2022 by the authors. Licensee MDPI, Basel, Switzerland. This article is an open access article distributed under the terms and conditions of the Creative Commons Attribution (CC BY) license (https://creativecommons.org/licenses/by/4.0/).
Share and Cite
Tassadduq, S.S.; Akhtar, S.; Waheed, M.; Bangash, N.; Nayab, D.-e.-; Majeed, M.; Abbasi, S.; Muhammad, M.; Alataway, A.; Dewidar, A.Z.; et al. Ecological Distribution Patterns of Wild Grasses and Abiotic Factors. Sustainability 2022, 14, 11117. https://doi.org/10.3390/su141811117
Tassadduq SS, Akhtar S, Waheed M, Bangash N, Nayab D-e-, Majeed M, Abbasi S, Muhammad M, Alataway A, Dewidar AZ, et al. Ecological Distribution Patterns of Wild Grasses and Abiotic Factors. Sustainability. 2022; 14(18):11117. https://doi.org/10.3390/su141811117
Chicago/Turabian StyleTassadduq, Syeda Saba, Shamim Akhtar, Muhammad Waheed, Nazneen Bangash, Durr-e- Nayab, Muhammad Majeed, Sanaullah Abbasi, Murad Muhammad, Abed Alataway, Ahmed Z. Dewidar, and et al. 2022. "Ecological Distribution Patterns of Wild Grasses and Abiotic Factors" Sustainability 14, no. 18: 11117. https://doi.org/10.3390/su141811117