Review

Artificial Intelligence Technologies for Forecasting Air Pollution and Human Health: A Narrative Review

by
Shankar Subramaniam
1,*,
Naveenkumar Raju
2,
Abbas Ganesan
1,
Nithyaprakash Rajavel
1,
Maheswari Chenniappan
1,
Chander Prakash
3,4,*,
Alokesh Pramanik
5,
Animesh Kumar Basak
6 and
Saurav Dixit
7,8,*
1
Department of Mechatronics Engineering, Kongu Engineering College, Erode 638060, India
2
Department of Mechanical Engineering, Kongu Engineering College, Erode 638060, India
3
School of Mechanical Engineering, Lovely Professional University, Phagwara 144411, India
4
Division of Research and Development, Lovely Professional University, Phagwara 144411, India
5
School of Civil and Mechanical Engineering, Curtin University, Bentley, WA 6102, Australia
6
Adelaide Microscopy, The University of Adelaide, Adelaide, SA 5005, Australia
7
Division of Research & Innovation, Uttaranchal University, Dehradun 248007, India
8
World-Class Research Center for Advanced Digital Technologies, Peter the Great St. Petersburg Polytechnic University, 195251 Saint Petersburg, Russia
*
Authors to whom correspondence should be addressed.
Sustainability 2022, 14(16), 9951; https://doi.org/10.3390/su14169951
Submission received: 31 May 2022 / Revised: 18 July 2022 / Accepted: 8 August 2022 / Published: 11 August 2022
(This article belongs to the Special Issue Innovations in Sustainable Manufacturing Management)

Abstract

:
Air pollution is a major issue all over the world because of its impacts on the environment and human beings. The present review discussed the sources and impacts of pollutants on environmental and human health and the current research status on environmental pollution forecasting techniques in detail; this study presents a detailed discussion of the Artificial Intelligence methodologies and Machine learning (ML) algorithms used in environmental pollution forecasting and early-warning systems; moreover, the present work emphasizes more on Artificial Intelligence techniques (particularly Hybrid models) used for forecasting various major pollutants (e.g., PM2.5, PM10, O3, CO, SO2, NO2, CO2) in detail; moreover, focus is given to AI and ML techniques in predicting chronic airway diseases and the prediction of climate changes and heat waves. The hybrid model has better performance than single AI models and it has greater accuracy in prediction and warning systems. The performance evaluation error indexes like R2, RMSE, MAE and MAPE were highlighted in this study based on the performance of various AI models.

1. Introduction

Air is a vital need for all life on Earth’s existence and development. With the fast advancement of contemporary industry and transportation, the exponential growth of urbanization and the human population, air pollution has become a worldwide problem [1]. Poor air quality not only has an impact on people’s lives and jobs but also impedes economic development and causes climate change [2]. On behalf of the World Health Organization (WHO) report, the presence of tiny particulates in outdoor air pollution is more dangerous than previously considered [3]. According to the WHO, air pollution kills around 7 million people each year (WHO, 2005). In 2016, outdoor air pollution (mostly Particulate Matter) caused 5.2 million early deaths globally in urban and rural regions (WHO, 2018). Deaths from air pollution and related hazards were found to be highest (15%) in South and East Asia. Developing nations such as India have also witnessed a 14% increase in mortality between 1990 and 2017, despite a drop in the incidence of deaths attributable to air pollution [4]. Figure 1 represents the effects of anthropogenic pollution on the environment and humans. Man-made causes of pollution, such as the use of fossil fuels, deforestation, and transportation emissions, not only create air pollution but also contribute to global climate change.
Human health and life quality, which are determined by environmental psychosocial, physical, biological, and social characteristics, are factors in environmental health [5]. Climate changes lead to alterations in weather and temperature pattern. Although these changes are natural, humans have been the dominant contributor to climate change since the 19th century, primarily to the burning of fossil fuels which generates CO2. Ahmed et al. determined the regional and periodic change of CO2 and Particulate matter in the important Libyan city of Misurata and the measurements were made during the months of November and February once every three days [6]. The results were very useful to understand the regional and periodical characteristics of air pollution. Cetin et al. evaluated the regional and temporal changes in air pollution and measured the CO2 concentration and particulate matter concentration in various regions of Bursa city. The results of the study revealed that the CO2 was statistically not significant with respect to the season but the Particulate matter shows, statistically, a 99.9% confidence level by season [7]. In the Turkish case study, the author examined the variation in the indoor CO2 concentration in the examination hall and the findings indicate that indoor CO2 levels are higher than 1500 ppm while the start of exams of threshold value within 10 min [8]. In another interesting study, the authors examined the Pb and Cr pollution in the capital city of Turkiye by collecting topsoil samples from 50 regions; thus, it is clear that air pollution is very dangerous to the environment and ecosystem. The earth is currently warming faster than at any other time in recorded history. Warmer temperatures are shifting weather patterns and disturbing nature’s normal equilibrium. As a result of climate change, storms, floods, cold spells, and heat waves are expected to have a greater socioeconomic impact. Heat Waves (HWs) are expected to grow increasingly strong and common as a result of man-made climate change. HWs are clearly major events that can induce fast changes in biodiversity patterns as well as ecosystem structure and functioning as a result of human climate change [9]. To overcome the above-mentioned issues, it is very important to forecast air pollution, weather conditions, and climate changes to implement an early-warning system.
Artificial Intelligence is used to imitate the human mind’s problem-solving and decision-making abilities. Figure 2 shows the relationship between Artificial Intelligence methods, Machine Learning algorithms, and Deep Learning algorithms. To limit public exposure risks due to pollution, AI should be used as an important method for environmental pollution forecasting and which helps policymakers to develop better policies in the case of environmental protection [10]. AI can manage complicated and non-linear interactions between spatial-temporal factors, which makes it a better method for air pollution predicting and forecasting [11]; it offers an outstanding capacity for tracking the current pollution condition and demonstrates a precise and quick method for identifying pollution hotspot areas. Deep learning is a subset of the AI method which is also used for forecasting and predicting extreme weather conditions. The important ability of AI is the easy management of a lot of data and real-world complex problems; further, it increases the accuracy in the case of weather forecasting and modelling which helps policymakers and decision-makers [12].

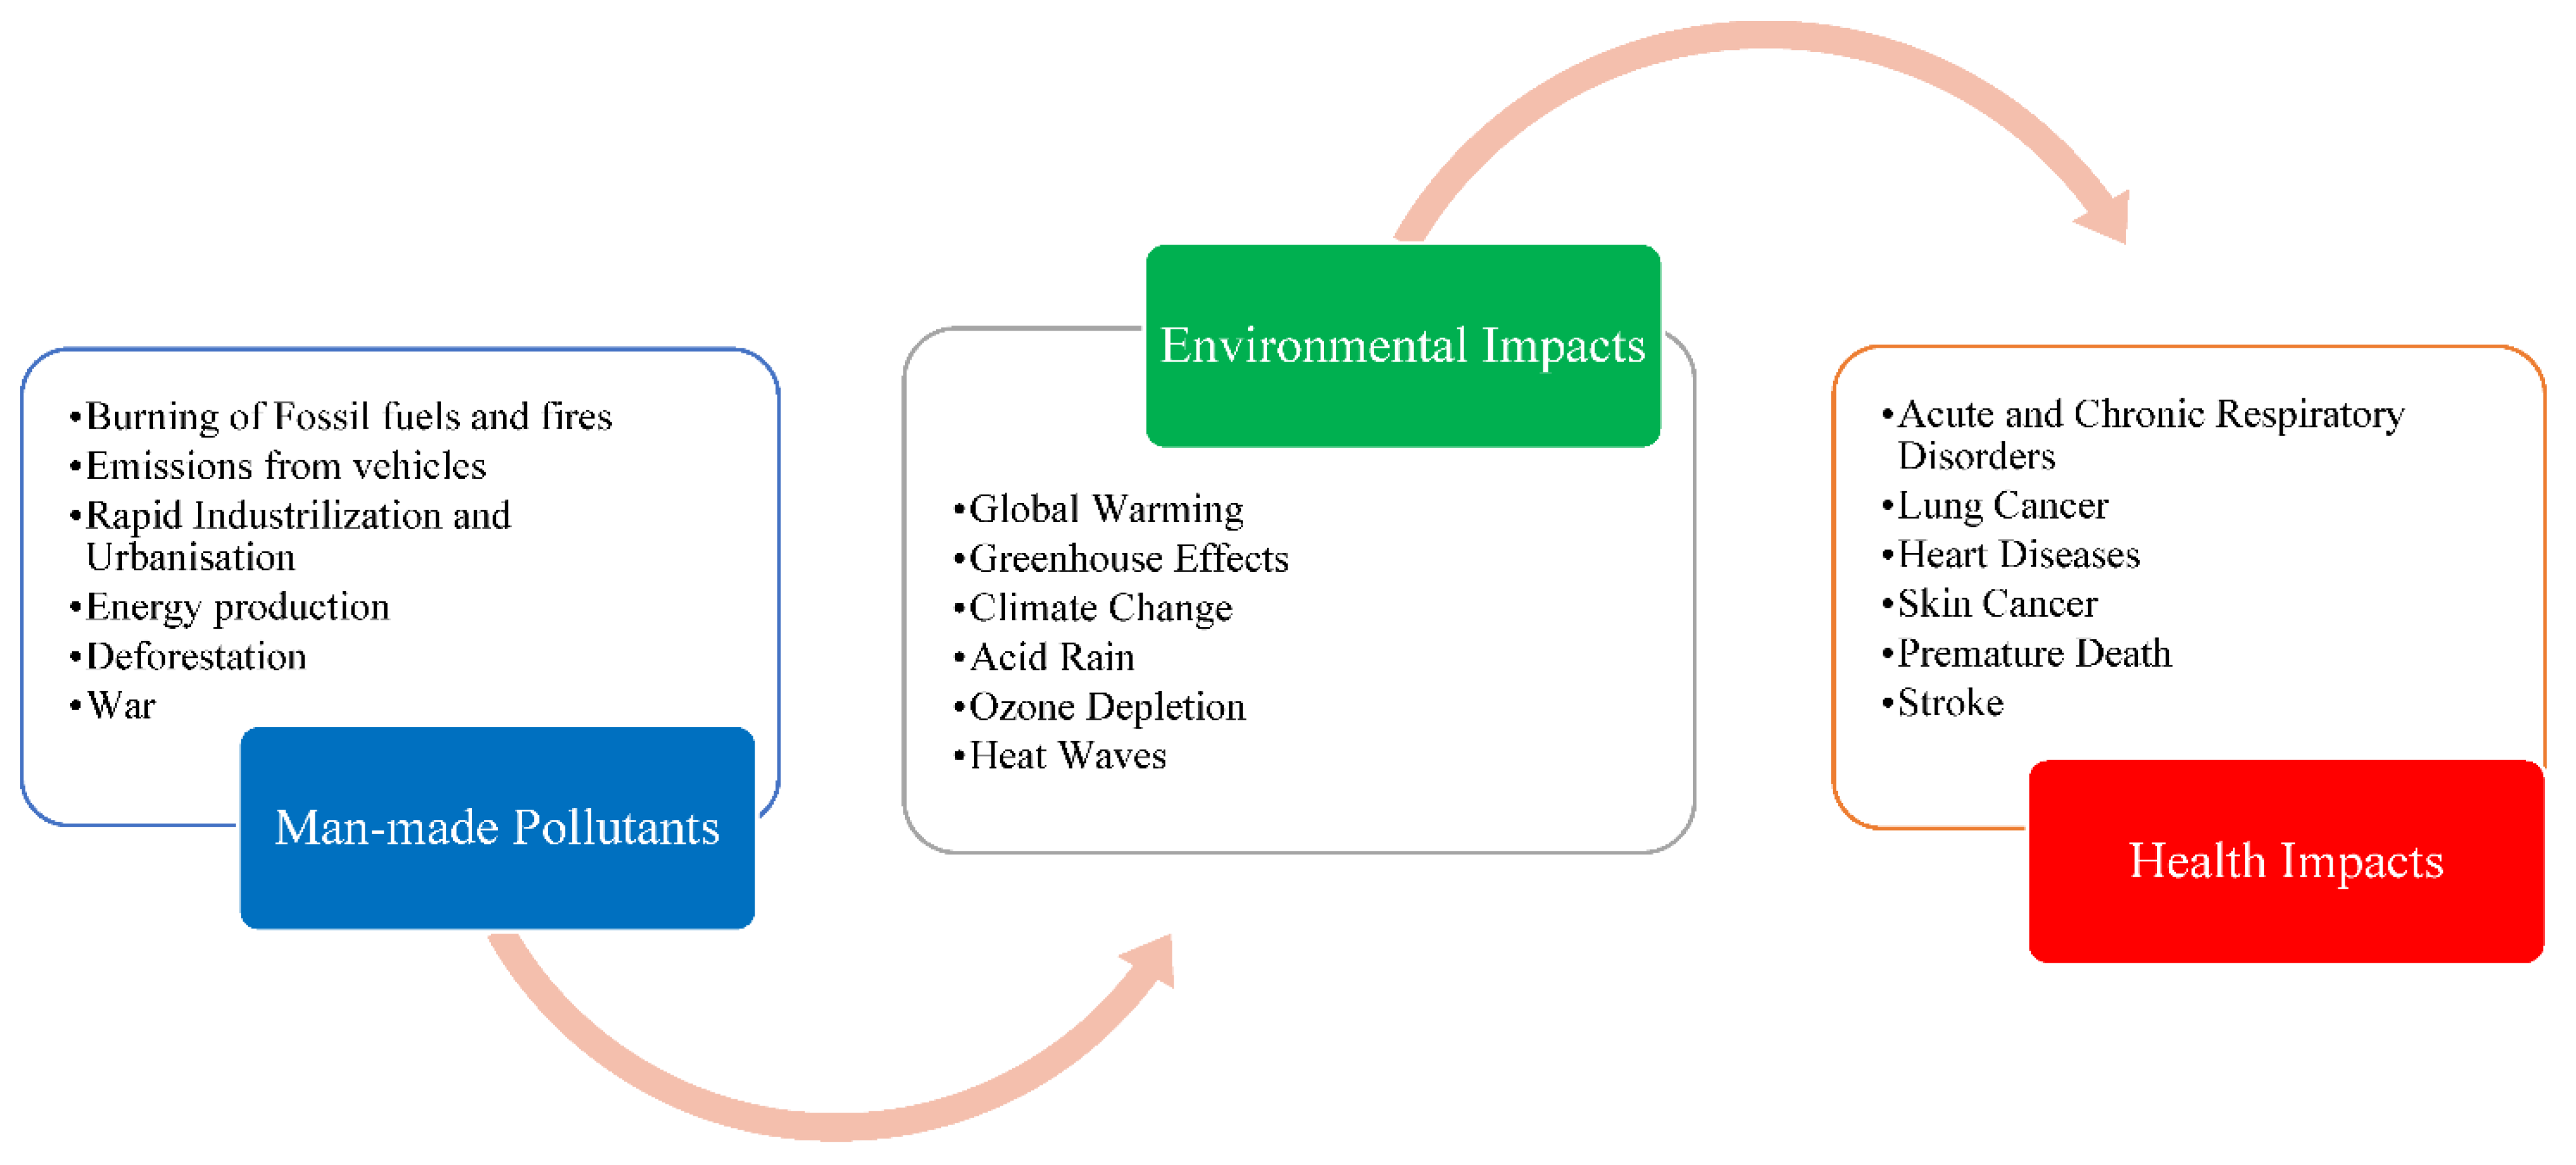
1.1. Sources and Impacts of Pollutants on Environmental and Human Health

In many parts of the world, air pollution is a bigger crisis due to its direct impact not only on environmental health but also on human health, which leads to various environmental crises and notably health crises such as early death, respiratory illness, stroke, cardiovascular disease and etc. [13]. Natural and anthropogenic activity generates a harmful and toxic mixture of particles and gases that are emitted into the atmosphere which leads to several crises [14]. Natural calamities such as sudden occurrences of forest fires and volcanic eruptions emitted toxic pollutants such as SO2, CO2, NO2, Carbon monoxide, and Particulate emission [15]. Nowadays, due to increased industry and automotive gas emissions, atmospheric air has become more poisonous, contaminating the air we breathe. The main air pollutants include CO2, NO2, SO2, CO, and particulate matter, all of which have adverse effects on the ecosystem and individuals. Figure 3 represents the major air pollutants and their causes on the environment and humans. Various major air pollutants lead to the environmental atmosphere causing the greenhouse effect, ozone reduction, and photochemical smog, aggravating the environment and producing significant environmental disasters [16], which are responsible for several severe health issues (i.e., chronic disease) [17]. Volcanic eruptions and industrial growth are the major causes of sulphur dioxide (SO2). The presence of SO2 in the atmosphere may also contribute to acid rain, which harms the ecosystem, and also leads toa worsening of the human respiratory system [18].
The burning of fuels in industry and transportation is the major cause of Nitrogen dioxide emissions [3,17]. NO2 exposure results in adverse effects on human individuals and ecosystems, resulting in a rise in lung disease prevalence. The ozone gas at ground level causes severe health impacts to humans due to its high oxidizing capabilities [3]. When we are exposed to air pollution for an extended period, our pulmonary function suffers significantly. Lung cancer, asthma and chronic obstructive pulmonary disease can all be caused by a decline in pulmonary function [4,17]. According to studies, particles with a diameter of 10 µm can pass through the respiratory tract, whereas particles with a diameter of less than 5 µm can penetrate the deep section of the bronchioles [18]. Furthermore, particles smaller than 1µm can enter the alveoli [17]. Poor air quality may impair cognition and contribute to mental illnesses [17,18]. As a consequence, reducing air pollution can be an effective way to combat the diseases indicated above while also benefiting society [3,19]. Air quality forecasting, monitoring, and early warning systems, as preventive measures, form the foundation for successful pollution control measures and the development of environmental laws to improve air quality, and it is very helpful in designing sustainable smart cities, environmental sustainability, and pollution control management. As preventive measures, air quality forecasting, early warning systems and monitoring are the foundation for successful pollution control measures and the development of environmental laws to improve air quality and it is very helpful in designing sustainable smart cities, environment sustainability and pollution control management.

1.2. Current Status of Research on Environmental Pollution Forecasting Techniques

Air pollution is an inescapable fact of life; it is well known that the effects of environmental pollution are more severe than those of soil and water pollution [19]. Governments all across the world are attempting to improve air quality by enacting various environmental laws. Without a question, most developed countries want to use AI technologies and approaches in their environmental policy today. The forecasting models may be classified into three categories: physical models, statistical models, and AI models; it primarily studies weather phenomena and meteorological conditions for the physical forecasting model. Chemical transport models (CTM) aim to construct a mathematical model that describes chemical and meteorological processes in the atmosphere, focusing on the emission, transport, and mixing of air pollutant concentrations [20]. The enormous number of computations required by physical models is one of their key restrictions, and the quality of these deterministic techniques is dependent on a vast quantity of information and data from pollution sources [21]. Compared with the statistical model, the physical model is easy to use and simple to calculate [22].
Figure 4 represents the classifications of different air pollution forecasting models. Traditional statistical models for air pollution forecasting include the autoregressive integrated moving average (ARIMA) [20], and the grey model (GM) [23]. The statistical models work by describing the link between variables based on feasibility and statistical average, and forecasting accuracy is tough to achieve. To perform effective PM2.5 forecasting, Auto-Regressive Integrated Moving Average (ARIMA) model was previously utilized [22,24]. Regional characteristics in statistical models can be complicated, chaotic, and extremely nonlinear [25] and nonlinear fitting is one of the drawbacks of these models [22]. According to several academic studies, AI models outperform physical forecasting methods and statistical models [26]. To tackle complicated issues, AI replicates human vision, learning, and reasoning. Artificial Intelligence includes machine learning as a subset. Machine learning performs well in classification and regression series, and it is widely regarded as one of the best methods in pollutant forecasting because of its great resilience and accuracy. An artificial neural network is a regularly used predictor that models nonlinear series by simulating the human brain and nervous system [3]. For environmental pollution prediction, generally used AI techniques such as Back Propagation Neural Network (BPNN), Extreme Learning Machine (ELM), Long Short-Term Memory (LSTM), the generalized regression neural network (GRNN), Gated Recurrent Unit (GRU), the wavelet neural network (WNN) and other models are Fuzzy logic model and Support Vector Machine (SVM). Furthermore, deep learning models based on forecasting algorithms are capable of performing functions with numerous layers. Recently, considerable work has been expended in reviewing and researching the properties of various types of intelligent prediction models in the field of air quality. Because of these constraints, it was commonly assumed that no one predictor could be competent for all aspects of modelling and that there was no single intelligent technique suitable for all individual difficulties.
In general, hybrid models relate to the combination of not just different algorithms or techniques, but also the advantages of each component, resulting in increased performance [27]. The different Hybrid AI models for pollutant forecasting are represented in Table 1.
Artificial intelligence (AI) has recently emerged as the most widely used technology tool for regulating and mitigating the detrimental effects of various air pollutants, generating considerable interest in the disciplines of atmospheric and medical science [38]. Many researchers have utilized AI approaches as a better healthcare decision support device to detect, manage, and cure illnesses caused by air pollution [19]. AI is one such instrument, with tremendous potential to expedite climate change mitigation and adaptation methods in sectors such as energy, land use, and disaster response; however, several bottlenecks and hurdles now exist that prevent AI from reaching its full potential in this area [39].

1.3. The Main Contributions of the Study

This narrative review study gives insights into the present status of Artificial Intelligence use in air quality monitoring systems and air quality forecasts that have been produced to date (January 2015–June 2022). The article’s major goal is to look into various artificial intelligence technologies that are utilized for air quality monitoring, early warning systems and air quality prediction; this study focuses in particular on the most extensively utilized AI and ML methods in air pollution forecasting. Furthermore, numerous hybrid models are being emphasized because of their superior performance over single predictors. Artificial intelligence may also be employed in digital healthcare and chronic airway disease diagnosis. Overall, the goal of this project is to examine research on air pollution that use artificial intelligence and machine learning methods and get a general knowledge of relevant techniques based on performance criteria. The present study also emphasized various pollutants and its forecasting techniques. In addition, the role of machine learning and artificial intelligence in diagnosing pulmonary illnesses and COVID-19 induced by air pollution is discussed. The present literature is examined in light of several research concerns and AI-based technologies. In addition, the use of AI approaches to anticipate climate change and heat waves is also discussed.

2. Methods

The paper follows the format of a classic narrative review. Although this is not a full systematic review, the aspects of identifying literature sources and search methodologies, as well as study selection, are taken into account; however, the search results and references were disclosed, so that the reader may make an informed decision. Because this topic is still in its early stages, the authors included abstracts as part of the discussion in this narrative review.
For identifying papers from well-known research journals and publications, a literature search was undertaken using academic and science databases (e.g., Google Scholar, PubMed, Science Direct, Springer, IEEE explore, Scopus, and Web of Science). The keywords that were chosen for these literary analyses were: “Artificial Intelligence”, “Machine learning”, “Fuzzy Logic”, “Air Pollution”, “Artificial Intelligence in air pollution forecasting”, Artificial Intelligence in Air quality monitoring”, Artificial Intelligence and Human health”, Machine Learning in digital health care”, “Environment”, “Climate change”, Global warming”, “Air quality monitoring”, Air pollution Prediction”, “Support vector machine”, “Environmental health”, “Artificial neural network”, “Deep learning”, “random forest”, “generalized additive models”, “gradient boosting machines”, “xgboost”, “decision trees”, “Heat waves forecasting”, “causes of climate change and global warming”, “Hybrid AI models for air quality forecasting”, “Application of artificial intelligence and machine learning”, “Gaseous pollutants”, “Ozone concentration forecasting using AI techniques”, “NO2 and SO2 forecasting using AI techniques, “AI-based Particulate matters forecasting”, “Early warning systems”, “Diagnosis of Chronic air way diseases by AI and ML methods”, Greenhouse Gas emission”, “Causes of air pollutants on environment and human “and “Hybrid and Novel AI models for air pollution forecasting.
The following peer-reviewed international journals were used to choose the papers for this review paper: Environmental Science and Pollution Research, Atmospheric Environment, Atmospheric Research, Environmental Monitoring and Assessment, Journal of Hydrology, Environmental Geochemistry and Health, Atmospheric Pollution Research, Buildings and Environment, Buildings, Journal of forecasting, Health and technology, Journal of Cleaner Production, Engineering Applications of Artificial Intelligence, Environmental Modelling and Assessment, Environmental pollution, International Journal of Environmental Research and Public health, Journal of Environmental Engineering and Science, Journal of Environmental Management, Journal of Environmental Protection and Ecology, Computers in Industry, Applied Soft Computing, Computational Intelligence and Neuroscience, Diagnostics, Environmental Science and Policy, Lung Cancer, International Journal of Medical Sciences, Earth Science Informatics, Journal of Big data, Journal of Ambient Intelligence and Humanized Computing, Journal of Medical Internet Research, Journal of Marine Systems, Sustainability, Aerosol and Air Quality Research, Environmental Modeling and Software, Remote Sensing of Environment, Science of Total Environment and Atmospheric Environment.
The discovery of relevant publications’ techniques was repeated until the citation trails were no longer apparent. In addition, the reference lists of the selected research articles were searched in order to find additional references. Each relevant article’s title, abstract, keywords, and conclusion were carefully examined to verify that they aligned with the literature review’s goal. Second, the selected articles’ content was analyzed to assess their applicability. The review period was set to run from January 2015 through June 2022. The review includes only papers written in English; this review covered only research articles dealing with Artificial Intelligence and Air Pollution Forecasting, Artificial Intelligence and Human Health, Climate Change, and Artificial Intelligence; this review research only included papers published in peer-reviewed journals; all other publications, such as conference papers and reports, were eliminated.

3. Potential Application of AI for Air Pollution Control

Artificial intelligence had a tough ride during the twentieth century; however, the growth of the internet in the twenty-first century is allowing AI to reach its full potential; this potential can only be restricted by the unknown limit of AI itself. The rise of artificial intelligence is one of the most spectacular advances in the scientific world, attracting the interest of practically all disciplines of study (AI). Artificial intelligence technology might be utilized to monitor air quality and regulate pollution. A great number of studies have found that AI technology can help with environmental pollution control. The use of AI technology to model complicated environmental problems is becoming more prevalent in the environmental industry, particularly in air quality regulation. Artificial intelligence is one of the most sophisticated technologies, and it is employed in practically every sector. As a result, using artificial intelligence in environmental monitoring is the best option, and its anticipated value is the most accurate [40]. Instead of simple machine learning and artificial intelligence approaches, most researchers and writers now use advanced and complex algorithms for early warning systems, air quality prediction and environmental quality monitoring. Alimissis et al. [41] investigated two ways for modelling urban air pollution using interpolation; it gives a great capacity for tracking the present pollution scenario and demonstrates a precise and quick method for identifying pollution hotspot areas [19].

Various AI Techniques for Air Quality Forecasting and Monitoring System

An air quality monitoring system lays the framework for air quality forecasting and traceability, and more accurate air quality forecasting is made possible by improved monitoring data. Air quality forecasting is an effective approach to protecting human health by providing advanced warnings of harmful air pollution [42]. Accurate forecasting of air quality is extremely important for the environment and persons dealing with real-world air pollution. Cities and people can respond to air pollution warnings in before by decreasing traffic, restricting outdoor activities and shutting down industries [43]. Many countries have pollution early warning systems. As a result, all governments should emphasize air pollution forecasting as a foundation for pollution warning and control systems [15].
Numerous forecasting models, mostly for pollution concentrations, have been proposed [38]. Based on their concepts, forecasting models may be divided into three types: statistical forecasting models, numerical forecasting models, and machine learning models [38]. Because of their simplicity, statistical models might be employed in air quality forecasting; they can anticipate pollutant concentrations in the future only by evaluating the link between pollutant concentration and climatic parameters in previous data, without knowing the sources of pollution [38]. The Markov model, grey model (GM), autoregressive integrated moving average model (ARIMA) [44], and multiple linear regression model (MLR) are examples of general statistical models [38]. Artificial intelligence includes machine learning. Because of its high resilience and error tolerance, machine learning works well in regression and classification problems, and it is commonly recognized as one of the most effective approaches to pollutant forecasting. A combination of AI algorithms was allegedly used to anticipate air pollutants and develop air quality monitoring and early-warning systems [45]. Many AI algorithms have been proposed and used to forecast air quality. To demonstrate AI techniques for predicting various levels of air pollution, vast amounts of historical pollutant data and temporal factorsare required [15]. AI-based estimates of air quality and pollution are gaining momentum as a result of climate change and urbanization. According to a recent study, AI-augmented models are superior for univariate time series data forecasting.
Mauro et al. utilized the ARIMA statistical model for air quality forecasting. ARIMA was compared to ML algorithms such as SVR and ANN. The results showed a significant improvement in prediction quality [46]. ANN has been demonstrated to be especially successful for increasingly complicated jobs. ANN models also use a complex algorithm that has been successfully used to predict air pollution [47]. Elangasinghe et al. [48], established anartificial neural network air pollutant prediction model capable of fully capturing the time fluctuation of pollutant concentrations under defined conditions by extracting key information from daily accessible meteorological parameters. Pardo and Malpica [49] utilized a double-layered LSTM neural network to predict the Madrid air quality model. Deeper LSTM networks enhance prediction accuracy while increasing computational cost and time [50]. Song et al. [51] proposed a hybrid model based on LSTM and Kalman filtering to estimate the concentration of various air quality components [52]. Qi et al. [53], propose a hybrid model for PM2.5 air quality forecasting that incorporates graph convolutional networks and LSTM (GC-LSTM). The time-space mapping information includes historical meteorological parameters, geographical characteristics, and other time-series properties [54].
A spatiotemporal convolution-long short-term memory neural network extension (C-LSTME) model was introduced by Wen et al. [19,55]. Furthermore, climatic and particulate data are used to enhance forecast outcomes [56]; however, both weather and temporal features model frameworks need a massive series of data records, considerably increasing the suggested technique’s time complexity. Zeng et al. [57] developed a novel predicting model for the concentration of PM2.5 that combines the nested LSTM (NLSTM) neural network and the extended stationary wavelet transform (ESWT) [20,50]. To improve prediction performance, the suggested technique blends deep learning technology, namely layered LSTM neural networks, with a modified SWT based on the artificial intelligence method SWT [50]. In Turkey, Güler Dincer et al. developed a unique Fuzzy K-Medoid clustering approach to predict SO2 concentration [15,58]. Random forest regressor (RFR), decision tree regressor (DTR), and Linear regression (LR) approaches are utilised in another investigation to predict air pollution [59]. The results indicated that the RFR outperformed the LR and DTR on the given data set. Althuwaynee et al. assessed the air pollution hazard by using decision tree algorithms and evaluated the correlation clusters of PM10 and other pollutants [60]. Shaziayani et al. [61], predicted the concentration of PM10 for the next day by using a tree-based machine learning approach (the models have boosted regression trees, random forest and decision tree algorithms). The study of Wang and Kong developed air quality predictive modelling based on improved decision tree algorithms to enhance the prediction accuracy and time performance [62]. By using air mass trajectory analysis, the daily approximate PM2.5 concentration prediction accuracy was improved by introducing ANN techniques by Feng et al. [21]. Yan et al. [63] employed GRNN to forecast PM2.5 concentration values in three Chinese urban clusters. For precise forecasting of the PM2.5 level in the urbanized area, the GRNN technique could be very useful and reliable.
Mo et al. created a revolutionary air quality early-warning system based on artificial intelligence and superior data preprocessing technologies [38]. The prediction model was built using the potent swarm intelligence method: The improved Complete Ensemble Empirical Mode Decomposition with Adaptive Noise (ICEEMDAN) [20,57], Whale Optimization Algorithm (WOA) and the efficient ANN Extreme Learning Machine (ELM) [20,38,57]. The prediction findings were then further examined using the fuzzy comprehensive assessment approach, which provided intuitive air quality information and appropriate measures [38]. The simulation results demonstrated that the proposed ICEEMDAN-WOA-ELM model outperformed previous models and that the ICEEMDAN decomposition technique, in conjunction with the WOA optimization approach, played major roles in increasing neural network prediction accuracy [38]. Because of its accuracy and efficacy, this planned air quality early-warning system is expected to play an important role in the future [38]. To examine the present pollutant levels, Amuthadevi et al., employed Deep Learning Long-Short-Term Memory (DL-LSTM), Neuro-Fuzzy and Statistical Multilevel Regression such as Non-Linear Artificial Neural Network (ANN). The findings demonstrated that DL-LSTM outperforms ANN, Neuro-fuzzy, and regression methods [46]. Qi et al. [53], developed a hybrid model that employs a graph convolutional neural network to discover geographical correlations from surrounding air quality and meteorological data, as well as an RNN model to account for temporal dependency. Similarly, Du et al. [64], created a hybrid deep learning model for air pollution forecasting that includes both a convolution neural network and an RNN model for spatial-temporal modelling. Neither model, however, has generated high-resolution estimates for locations with limited air quality measurements. The data-driven Granger Causality technique is a more advanced data-driven approach for pollution assessment [65]; it achieves 82% accuracy by predicting air quality at high spatial-temporal resolution using data from four domains, including transportation, meteorology, pollutant exposure, and urban morphology [66].
Bekker et al. [67] used CNN-LSTM to predict the hourly prediction of PM2.5 concentration in Beijing, China, using a spatial-temporal feature by incorporating meteorological data, historical pollutant data, and PM2.5 concentration in neighbouring stations [68]; they investigated the performance differences across Deep Learning algorithms such as CNN, GRU, Bi-LSTM, Bi-GRU, LSTM and a hybrid CNN-LSTM model. Experiment findings show that their “hybrid CNN-LSTM multivariate” technique makes more accurate predictions than any of the classic models stated and outperforms them in predictive performance [67]. The hybrid AI techniques are more reliable and accurate in terms of developing early-warning systems and environmental pollution monitoring. Table 2 depicts several Artificial Intelligence models and Machine Learning technologies used in environmental pollution forecasting, as well as performance evaluation criteria. The authors determined the linear and nonlinear relationships between the air pollution index (API) and meteorological factors in the two Chinese cities of Xi’an and Lanzhou using correlation analysis and artificial neural networks (ANNs; incorporating wavelet ANNs [WANNs]). Both the WANN and ANN models successfully replicated the APIs in Xi’an and Lanzhou, although the WANN model outperformed the ANN during the forecasting phase (R = 0.8037 for Xi’an and R = 0.7742 for Lanzhou; R = 0.8846 and R = 0.8906 respectively). Wavelet-ANN, Wavelet-ARIMA, and Wavelet-SVM are three hybrid models that were created to predict the 2016 PM2.5 trends in five Chinese cities (Beijing, Chengdu, Guangzhou, Shanghai and Taiyuan). The authors investigated the meteorological impacts and restriction during COVID-19 lockdown, and reduction in NO2 and PM2.5 using generalized additive models including meteorological parameters and multi-temporal variations was used to quantify the impact from each factor on NO2 and PM2.5 [68]. GAM helpful tool for estimating the air quality responses to human activities because they can balance fitting performance and have good interpretability [68]. Karl Ropkins and James Tete investigated the impacts of COVID-19 lockdown on air quality trends across UK by using break point-segment methods and the results showed that the NO and NO2 decreased up to 32% to 50% near roadsides during lockdown whereas the O3 concentration increased 20% during lock-down across UK; moreover, the PM10 (5.9 to 6.3 μg/m3) and PM2.5(3.9 to 5.0 μg/m3) concentration Increased at both urban and rural areas station [69]. Jasper et al. [70], explored global assessment of non-linear correlations between atmospheric processes and daily ground-level NO2, PM10, PM2.5, and O3 observations were captured in city- and pollutant-specific XGBoost models for over 700 cities, while weather, seasonality, and trends were taken into account; this study specifically employed XGBoost, an eXtreme Gradient Boosting technique based on decision trees [70]. XGBoost is a gradient boosting machine adaption that does additive optimisation in functional space. The author mentioned limitation as smaller nations lacked the assessment criteria of XGBoost models for a multi-model ensemble forecast, resulting in bigger observed variances [71]. Pardo et al. conducted a case study at urban traffic sites in Spain to estimating changes in air pollution levels as a result of the COVID-19 lockdown by using Multiple Linear Regression (MLR) models with seasonal and meteorological predictors and the Q-Q Mapping post-correction enhances model performance and predicts severe condition [69]. Meaningful climate science requires collecting huge amounts of data on many different variables such as temperature and humidity, but working with such massive data sets is challenging across different geographical areas due to unavailability of datasets, climatic condition and seasonal variations. Due to its accuracy and predictive capability, the hybrid model, which is based on data decomposition, the ensemble approach, and spatial-temporal approaches, surpasses the others. In terms of pollution forecasts, the Hybrid models outperformed other models. Environmental epidemiology can benefit significantly from geoAI technologies’ ability to incorporate large amounts of big spatial and temporal data in a variety of formats, as well as their computational effectiveness, flexibility in algorithms and workflows to account for important aspects of spatial (environmental) processes, such as spatial nonstationarity, and scalability to model other environmental exposures across different geographic areas. GeoAI techniques can be used to overcome issues with environmental exposure modelling, such as computational processing and time inefficiencies (especially when massive data are combined with extensive geographic research areas), as well as data-related limitations that affect spatial and temporal resolution.
Numerous research have demonstrated that traditional statistical methods are less accurate than artificial intelligence technology in terms of prediction accuracy. Artificial neural networks (ANN) can manage massive volumes of data sets, implicitly identify complicated nonlinear relationships between dependent and independent factors, and detect all possible interactions between predictor variables, among other major advantages. Traditional AI performance outperforms statistical approaches but falls short of the hybrid model. According to reports, many researchers employ an individual ANN technique or a hybrid method that includes ANN (e.g., adaptive network-based fuzzy inference system (ANFIS) and fuzzy neural network (FNN) since it is simple to design and have a high level of accuracy [57]. There are, however, many different machine learning techniques, and determining which one is optimal for the task at hand can be difficult. In other words, if additional factors are examined or a hybrid model is developed and used, the forecasting model will perform better [15]. Finally, the hybrid framework provides benefits in prediction stability, prediction accuracy, and air pollution warning accuracy. Although there is no perfect way to predict air quality, hybrid models beat single models; however, the intricacy of model building raises the computational cost. Because of the structure, hybrid models with complicated frameworks frequently require extra computational time [20].

4. Various Air Pollutants Forecasting Based on AI Techniques

As stated in Section 1.1, air pollution has several negative consequences on both the environment and human health. Air quality forecasting is an effective approach of protecting human health by providing advanced warning of harmful air pollution [42]. CO2, NO2, SO2, CO, and particulate matter are the most common air pollutants, and they all have harmful impacts on the environment and human health. Academics researchersare interested in building improved and trustworthy air pollution prediction systems owing to Artificial intelligence [19]. The most successful intelligent predictors for air pollution forecasting are the Artificial Neural Network, Fuzzy Logic, Support Vector Machine, and Deep Neural Network. Recently, artificial neural networks have revealed a slew of possibilities for air pollution predicting [19]. Because of its benefits over traditional AI approaches, fuzzy logic is frequently used as a prediction technique in the field of atmospheric air pollution forecasting [19,70]. Throughout the preceding two decades, SVM has been regularly employed in combination with other ML approaches to predict several aircontaminants such as CO, SO2, O3, and Particulate matters [19]. In this section, particulate matter and gaseous pollutants forecasting methods are reviewed based on the suitability and performance; this section provides a brief primer on pollutants and its suitable AI technologies for forecasting.

4.1. Ozone Concentration Forecasting Using AI Techniques

Ozone is a form of poisonous gas that can cause harmful effects to living beings when it is present on the earth’s surface due to its high oxidizing properties [20]; it is possible to produce upper respiratory tract lesions and skin, eye, and nose irritation at high concentrations [20]. Agricultural harvests are harmed by high O3 concentrations, and agricultural plantation loss may get worse in the future [20,54]. Murillo et al. utilized ANN and SVR technologies to construct a multi-pollutant prediction technique [19]. The AI methods were built using four climatic variables and hourly pollution concentrations as inputs. To reduce the computing complexity of the suggested technique, a metaheuristic algorithm known as the Particle Swarm Algorithm was utilized. The results revealed that the SVR-PSO approach performed well throughout all seasons [71]. Zhou et al. used a new dual-scale ensemble learning model with error debugging in two highly polluted Chinese cities (i.e., Taiyuan and Shanghai) to estimate daily ozone levels using a multi-decomposition method and intelligent algorithm optimization [70]. The proposed model’s RMSE values for low levels of ozone are 2.5319 and 3.2069, respectively, whereas the RMSE values for high levels of ozone are 2.8451 and 3.8702. According to the authors, the suggested innovative model outperforms the comparison models [70]. Chattopadhyay et al. adopted a fuzzy binary relation-based approach to study the air pollution over Kolkata, India, throughout the transitional phase between post-monsoon to winter [71]. Based on findings, the overall AQI over the polluted study zone from post-monsoon to winter had influenced by NO2 and O3 [71]. To anticipate NO2, O3, SO2, and CO concentration, the authors was using Semi-experimental regression (SER) model and ANFIS model [72]. According to the performance metrics of both models, the ANFIS outperforms regression models in forecasting time series data [72]. Mishra and Goyal used three artificial intelligence-based modelling strategies to anticipate O3 level in metropolitan city zone: Neuro-Fuzzy, ANN, and MLR [23]. In addition, the NF model was shown to outperform the ANN and MLR models in terms of forecasting accuracy [23]. Alimissis et al. [52], was recently evaluated the predictions of NO2, O3, NO, CO and SO2 concentration levels using ANN and MLR models. According to the findings of the study, there is enough statistical proof to suggest, the ANN model outperforms the MLR technique in terms of predicting accuracy. Furthermore, the authors sought to find two empirical correlations for predicting O3 concentrations in Zrenjanin, Serbia, using multiple linear regressions and gene expression programming [99]. The GEP has a correlation value of 0.82 and RMSE value of 13.52, whereas MLR has an RMSE value of 0.61 and a correlation coefficient of 21.28 [99]. GEP is more reliable and reasonable for calculating ozone concentrations, according to the findings [99]. Fuzzy logic-based algorithms have recently made great progress in predicting gaseous pollutants [93]. The findings showed that the ANFIS model performed statistically well in terms of R2 and RMSE values. In addition, when it comes to gaseous pollutant predictions, ANN models outperform MLR.

4.2. Carbon Monoxide Forecasting Using AI Techniques

Hemoglobin reacts with CO in the human body to generate carboxyhemoglobin (CO-Hb) [100] which reduces oxygen-carrying capacity in the blood and can be lethal if exposed to large concentrations in a short period. Carbon monoxide poisoning is especially hazardous for newborns, the elderly, and anybody with heart or pulmonary issues [99,101]. As a result, anticipating carbon monoxide levels in the atmosphere is critical for implementing an early-warning system. The performance of a novel SVM-based pre-diction models integrated with partial least squares (PLS) to estimate CO concentrations level was evaluated by Yeganeh et al. [23,102]. According to their findings, the PLS-SVM ensemble technique performs better and produced satisfactory results [23,102]. Similarly, Moazami et al. [103] developed a suitable method for measuring the ambiguity of support vector regression (SVR), ANN, and ANFIS for CO forecasting, and the findings revealed that uncertainty of CO predicting using SVR models has acceptable range [103]. Another noteworthy study was carried out by Jain and Khare, who employed a neuro-fuzzy model to predict CO for two different locations in Delhi [104]. Ten factors were considered: cloud cover, air pressure, humidity, daylight hours, temperature, mixing height, wind direction, wind speed, and vehicle count [23,104]. The Neuro-fuzzy model accurately computed CO at complex urban levels, according to the modelling findings, with an index of agreement (IA) in the 0.88–0.93 range [23,104]. The 1-day ahead forecasting of daily CO concentration levels using ANN and ANFIS models was investigated by Noori et al. [105]. According to the uncertainty analysis, the ANN model predicted daily CO concentrations more accurately than the ANFIS model [105].
According to the findings of the preceding investigations, each forecasting model is unique in its ability to anticipate carbon monoxide concentration. AI-based forecasting models outperform and have greater prediction accuracy. Overall, the ANN, SVR, and Fuzzy logic forecasting models would be the best and most reliable choice for carbon monoxide forecasting.

4.3. Carbon Dioxide Forecasting Using AI Techniques

CO2 is the principal cause of global warming because of its heat-trapping characteristics; therefore it must be decreased or eliminated. Environmentally severe CO2 increases (5000 ppm) may endanger human health. Carbon dioxide lowers the pH of blood serum, resulting in acidosis, and it also causes respiratory and cardiovascular illnesses [100]. As a result, it is critical to developing an adequate CO2 emission forecasting model. Sohn et al., used an ANN to predict major pollutants, including total hydrocarbons (THC), ozone (O3), nitrous oxide (NO), sulphur dioxide (SO2), methane (CH4), and carbon monoxide (CO) and nitrogen dioxide (NO2) [19,99]. Ahmadi et al. [81] used ANN to predict carbon dioxide emissions in five Middle Eastern countries in their study. Carbon dioxide emissions, the most important GHG (Green House Gas), are calculated for five Middle Eastern countriesusing a GMDH (General Method of Data Handling) ANN [81]. The results show that the ANN techniques is accurate enough to estimate carbon dioxide emissions, whereas the GMDH model’s R2 values and average absolute relative error are 0.9998 and 2.3% respectively [81]; it displays the model’s accuracy in projecting CO2 emissions. Norhayati and Rashid (2017) used the ANFIS model to estimate CO2 emissions from a clinical waste incineration plant using real-world data; they discovered that the ANFIS model accurately predicts carbon emissions [101]. Qader et al. [102] used a range of strategies, including Gaussian Process Regression and Holt’s methods, nonlinear autoregressive model for predicting CO2 emissions, to try to predict Bahrain’s area CO2 emissions [102]. The neural network model has the lowest RMSE of all the models, with a value of 0.206 [102]. Based on the RMSE values, the studies revealed that the neural network time series nonlinear autoregressive model performed better for forecasting CO2 emissions [102]. Wei et al. constructed a model for estimating carbon emission intensity based on factor analysis (i.e., particle swarm optimization) and an upgraded extreme learning machine in recent work. The suggested model, according to the author, properly forecasts carbon emission intensity [31]. Overall, the neural network has shown to be a reliable prediction and forecasting approach in a variety of fields. Because of its approximation capability, multi-layer perceptron ANN were quickly adopted in time series forecasting and presented as a method to manage classification challenges. The neural network-based methodology is one of the most often used approaches for forecasting time series such as CO2 emissions [102]. Even if the link is nonlinear, neural network-based techniques forecasting models are likely to perform efficiently.

4.4. NO2 and SO2 Forecasting Using AI Techniques

The majority of NO2 emissions are caused by the burning of fossil fuels in industry and transportation [16]. NO2 is also thought to be a key contributor to acid rain. Furthermore, NO2 exposure results in adverse effects on human individuals and ecosystems, resulting in a rise in lung disease prevalence. SO2 and NO2 are two major air pollutants that largely contribute to acid rain. Acid rain may affect water, land, vegetation, buildings, and people’s health. As a result, developing an effective model for SO2 and NO2 predicting and warning is crucial. Slini et al. proposed an ANN technique for predicting ozone, NO2, and CO concentrations on an hourly basis. According to their findings, the NO2-based ANN model had a high standard deviation of 0.614 and a low R values of 0.45 [19,103]. To anticipate PM and SO2 concentrations in Tianjin and Shanghai province of China, Xu et al., created a hybrid prediction models based on a meta-heuristic approach called Grey wolf optimizer [19,79]. Similarly, author investigated the effectiveness of a PCA-based ANN model and MLR model in estimating NO2 concentrations [19,104]. The ANN techniques were developed and validated using meteorological and air quality data [19,104]. The PCA-ANN method is more accurate than the MLR algorithms based on correlation coefficient which had low values of 0.81 [19,104]. For one-step-ahead prediction of SO2 and PM10, Wang et al., suggested two separate hybrid adaptive forecasting models, and their findings revealed that integrating ANN and SVM techniques offered higher air quality forecasting performance than single statistical techniques [19,105]. Brunelli et al. proposed a forecaster based on a recurrent neural network (Elman model) for forecasting daily maximum O3, SO2, CO, PM10, and NO2 concentrations in Palermo, Italy. According to the authors, the Elman model produces minimal values of MSE, MAE, and RMSE [106].
Seyedeh et al. examined the effectiveness of Multi-layer Perceptron (MLP)and Multiple Linear Regression (MLR) for forecasting SO2 content in Tehran’s air [107]. For the forecast of SO2 daily concentration, they used the meteorological parameter, time parameter, urban green space information and urban traffic data as input parameters. MLR technique had RMSE and R2 values are 6.025 and 0.708 respectively, whereas MLP model had RMSE and R2 values are 0.42 and 0.9. The study’s findings revealed that there was sufficient statistical evidence to suggest that the ANN model’s predicting ability was superior to the MLR model [107]. Recently, Zhu et al. [36] developed a two-step hybrid model for SO2 and NO2 forecasting in four cities in central China, based on CEEMD (Complementary Ensemble Empirical Mode Decomposition), SVR (Support Vector Regression), GWO (Grey Wolf Optimizer algorithm) and CS (Cuckoo Search algorithm). The suggested model and other known techniques are compared using performance evaluation criteria such as MAE, RMSE and MAPE in the method selection and assessment method. According to the authors, the suggested novel hybrid model CEEMD-CS-GWO-SVR, which used SVR-CS for low-frequency data and SVR-GWO for high-frequency data, demonstrated greater accuracy and was the best model for SO2 and NO2 prediction [36]. Liu et al. [89] using discrete wavelet transform and LSTM network, suggested a novel approach for forecasting daily average of Tianjin regional NO2 concentration prediction. Five primary air pollutants, significant historical data and meteorological data were chosen as input factors to achieve efficient NO2 concentration forecast the next day. The prediction performance of the suggested AI techniques was estimated to Gated Regression Unit (GRU), Support Vector Regression (SVR) and single LSTM model, and the value of MAPE was used for performance evaluation. The MAPE dropped from 17.85 percent to 11.58 percent when compared to the single LSTM model, but the RMSE and MAE increased to 5.9291 and 4.3377 respectively. The suggested model structure, according to the author, is better suited for estimating NO2 concentration in Tianjin [89].

4.5. Particulate Matter Forecasting Using AI Techniques

According to a medical research, PM damages the human respiratory, cardiovascular, neurological, and immunological systems, as well as DNA, to varying levels [108]. As a result, developing an efficient PM forecasting and warning model to communicate about the environmental status in the immediate hours is critical. For forecasting PM10 concentrations, Fernando et al. (2012) proposed a Multilayer Perceptron algorithm [19]. For the ANN, the IA, RMSE, R2 and MAE values were 0.77, 25.02, 0.38, 19.01 respectively [19]. The results showed that the ANN could accurately anticipate PM10 concentrations and perform well [109]. New methods for estimating PM2.5 concentrations in China were introduced by Cheng et al. (2019). The study offered three distinct hybrid algorithm models: wavelet-ANN, wavelet-SVM, and wavelet-ARIMA [19]. The suggested hybrid models prediction skills were compared to separate individual method like as SVM, ARIMA and ANN. The performance evaluation criteria such as RSME and MAE were performed to assess the chosen AI techniques forecasting prediction, and simulation results revealed that hybrid models surpassed individual AI techniques in terms of predicting capabilities and also precision accuracy [19,83].
Mirzadeh et al. [93] created a wavelet-AI hybrid model for predicting PM10 pollution concentrations in the short and medium run. The study’s findings revealed that wavelet-support vector regression and wavelet-adaptive neuro-fuzzy inference system techniques outperform with an accuracy level of about 96% and 99% than other models in daily forecasting and hourly forecasting. The AI techniques which are associated with wavelet transform shows greater performance than other single AI techniques and also Wavelet transform entertained an main role in enhancing the accuracy of AI techniques which enables them to predict PM concentration even at 10 µm [93]. In another work, the author successfully created a new hybrid model for predicting PM2.5 levels in outdoors and its use in assessing health consequences and economic losses. According to the authors, the suggested model not only provides early warning information but may also be employed in other systems such as health difficulties [91]. Furthermore, Augustine et al., proposed Ensemble machine learning approaches for predicting and forecasting PM2.5 concentrations (e.g., XGBoost-RF-ARIMA). The findings imply that hybrid models can be used to predict PM2.5 concentrations. The developed models show that machine learning approaches are effective at forecasting particulate matter concentrations and might be utilized to predict pollution in the atmosphere [92]. Extreme Boosting (XGBoost) is a scalable, distributed gradient-boosted decision tree (GBDT) machine learning framework. In the shanghai case study, the authors investigated the application XGBoost machine learning algorithm for predicting PM2.5 concentration and it performs better than WRF-Chem model [110]. In another work, Dotse et al. [32] presented a genetically optimized random forest—back propagation neural networks strategy for forecasting daily PM10 in Brunei Darussalam, a Southeast Asian country. The suggested approach, according to the author, might be utilized for real-time monitoring and control of Haze conditions. Contemporarily, Zhu et al. [33], recently proposed a hybrid forecasting for daily PM2.5 concentration called CEEMD-PSOGSA-SVR-GRNN model. Based on the experimental findings, the author stated that novel hybrid model was successful in forecasting PM2.5 and may also forecast additional pollutants. The author was the first to apply a combination of WPD (wavelet packet decomposition) and CEEMD (complementary ensemble empirical mode decomposition) to optimize for hourly PM2.5 concentration predicting [34]. For forecasting daily PM concentrations levels, Liu et al. [111] proposed the WPD-Bi-LSTM-SAE-NSGA-II, a hybrid multi-resolution multi-objective ensemble model based on Wavelet packet decomposition, Bidirectional long short-term memory, Non-dominated sorting genetic algorithm II and Stacked auto-encoder [20]. The suggested model outperformed the other benchmark models, according to the authors.
The researcher developed for hourly PM2.5 concentration prediction, Bai et al., presented ensemble empirical mode decomposition with long short-term memory neural network (EEMD-LSTM) [28]. The findings revealed that the E-LSTM techniques shown better performance the feed forward neural network individual and LSTMin terms of MAPE, Correlation coefficient and RMSE [28]. In China, Sun et al., developed a new hybrid technique on the basis of principle component analysis (PCA) and least squares support vector machine (LSSVM) enhanced by cuckoo search for daily concentration of PM2.5 level forecasts [29]. The results shows that the suggested technique outperforms a general regression neural network method and single LSSVM model and in PM2.5 concentration predictions [29]. As a result, the author’s suggested model has the effective to be used in air quality predicting techniques. Liu et al. [30], presented another interesting study in which they developed a unique hybrid technique for PM2.5 concentrations called WPD-PSO-BP-Adaboost. The WPD was successful in enhancing predicting performance; the Adaboost and PSO algorithms significantly enhanced forecasting precision; and the WPD-PSO-BP-Adaboost model outperformed all others in multi-step forecasting [30].
These findings show that hybrid models might be effective for predicting PM concentrations. Because of its precision, time series, and nonlinearity, most researchers favored AI models over statistical models in earlier studies. For particulate matter prediction, the majority of researchers recommended two hybrid models or single hybrid models. In addition, for more accurate particulate matter forecasting, hybrid models incorporating ensemble methods and data decomposition are very desirable and dependable. The study’s findings demonstrated that there was sufficient statistical support to claim that the ANN model’s predicting abilities for NO2 and SO2 pollutants were superior instead of the MLR model. Based on the previous studies, the ANN, SVR, and Fuzzy logic forecasting models would be the best and most reliable choice for carbon monoxide forecasting. The neural network has shown to be a reliable prediction and forecasting approach in a variety of fields. Because of its approximation capability, multi-layer perceptron ANN were quickly adopted in time series forecasting and presented as a method to man-age classification challenges. The neural network-based methodology is one of the most often used approaches for forecasting time series such as CO2 emissions. The emission inventories have reduced uncertainty since ANN-focused forecasting models are rapid and resource-efficient when it comes to making daily forecasts. Furthermore, the hybrid model outperforms single AI techniques in terms of prediction accuracy. The hybrid AI approaches were found to be favored and to be well suited for developing early-warning system and air quality monitoring.

5. Artificial Intelligence and Human Health

In the field of medicine, artificial intelligence has made great strides. Recently, artificial intelligence has aided in the improvement of the healthcare system’s capacity to recognize diseases such as cancer [112], infections [113], as well as the development of robots that do surgeries and correct diagnoses [114]. AI is especially used for sickness early detection and diagnosis, cancer detection, chronic condition control, drug formulation, robot-assisted surgery, health care delivery, and scientific testing and studies [115]. Artificial intelligence has made substantial progress in recent years, raising optimism in the field of disease detection. To identify vital signs and problems in the body, several wearable apps and technologies employ artificial intelligence methodologies; they can forecast the likelihood of a health problem before it occurs. The application of ML and AI approaches for predicting chronic lung airway problems is the major emphasis of this section. The impact and consequences of air pollution on human health was discussed and the effects of air pollution on COVID-19 infection and fatality was shortly discussed. Then, the focus was given to the use of artificial intelligence in health care system, particularly diagnosing respiratory issues, predicting and managing cardiopulmonary illness admission. The various AI and ML methods to track and control acute exacerbations as well as hospitalizations and fatality rate. Overall, it emphasizes an impact of air pollution on human health and importance of AI technologies in healthcare system; this part provides a brief primer on air pollution, human health and artificial intelligence.

Artificial Intelligence Technologies for Predicting Respiratory Diseases

Air pollution has a major and negative impact on human health, making it a worldwide threat to people’s well-being and health [116]. Air Pollution causes asthma and other air-borne illnesses, which have a severe impact on humanity. An accurate estimation of air pollution can assist to safeguard the public. Chronic airway diseases are prevalent, particularly in developing nations, and are characterized by airflow obstruction and inflammation. Asthma and Chronic obstructive pulmonary disease (COPD) have the largest death rates and economic impact globally. Any breathed environmental pollutants end up in the lungs as the primary body destination; these pollutants irritate the lungs, raise the risk of respiratory infections, and narrow the airways [117]. In 122 Chinese cities, there was a substantial positive correlation between newly confirmed COVID-19 cases and PM2.5, PM10, NO2, and O3 [118]. An extensive investigation conducted across the USA found a strong correlation between chronic exposure to PM2.5 and the probability of COVID-19 fatalities; this study demonstrated that long-term exposure to air pollution significantly raises the COVID-19 mortality rate, with an increase in PM2.5 exposure of just 1 µg/m3 being related with an 8% rise in COVID-19 fatality rates [119]. A study that gathered information from 25 Indian cities found a strong correlation between COVID-19 morbidity and PM2.5 levels [120]. Another recent research reinforced the hypothesis that air pollution contributes to SARS-CoV-2 mortality in England [121]. A clear connection between air pollution (PM2.5 and PM10) and COVIS-19 mortality was discovered in three French cities [111]. Infections with COVID-19 were found to be positively correlated with PM, AQI, and ground-level O3 in Italy [122]. Additionally, a substantial positive association between AQI, particularly PM2.5, and the daily COVID-19 deaths in Wuhan, China, was identified [123]. According to Lin et al., a high ambient CO concentration increases the likelihood of SARS-CoV-2 transmission [124]. Another study discovered that a large proportion of COVID-19 cases were in the most contaminated locations, the infected individuals needed to be admitted to the ICU, and the fatality rate in the polluted regions was twice as high as in the other regions [125]. Similar trends have been seen in the Czech Republic, where a greater proportion of COVID-19 diagnoses have been made in areas of Prague that are highly polluted. The greater COVID-19 spread rates in Lima, Peru, were associated to a history of chronic PM2.5 exposure [126]. Overall, the air pollution increases the risk of hospitalization and deaths from COVID-19.
In recent years, artificial intelligence (AI) has risen to prominence as the most extensively utilised technological tool for controlling and alleviating the harmful effects of various air pollutants, generating considerable interest in the fields of environmental and medical sciences [38]. To diagnose, monitor, and cure diseases related by air pollution, many researchers have used artificial intelligence approaches in healthcare decision-making tools [19]. Heuvelmans et al. developed a deep learning-based approach to simulate the progression of cancer cells in lungs using datasets of CT-scan images [127]. Nilashi et al., suggested a unique technique for identifying heart illnesses using Fuzzy logic and Support vector machine -based ensemble method [128]. Usmani et al. [116] explored connection between cardiopulmonary hospitalization and environmental pollution, and utilised artificial intelligence (AI) approaches to predict cardiorespiratory hospitalizations; they presented and compared the enhanced long short-term memory (ELSTM) model to existing AI approaches such as LSTM, DL, and vector autoregressive models (VAR). In terms of identifying and forecasting monthly hospitalization patterns, the suggested ELSTM model surpassed the LSTM and other approaches in the investigation [116]. To predict the weekly pulmonary related hospitalization due to environmental exposure, the author used SVR algorithm to examine the relationship between outdoor pulmonary illness admissions [129]. The findings reveal that air pollution is strongly linked to routine respiratory admissions, duration, and economical burden, and that SVR reliably predicts daily pulmonary illness admissions. As a consequence, AI techniques based on air pollution may predict cardiorespiratory hospitalization with high accuracy. Acute aggravation of chronic airway ailments accelerated increases the risk of mortality, lowers quality of life and disease progression. Air pollution, according to environmental exposure and response assessments, increases the chance of acute aggravation of chronic airway disorders [130]. Using data from the National Hospital and Ambulatory Medical Care Survey, Goto et al. [131] identified persons with COPD exacerbation; they evaluated 4 machine learning-based models (Random forest, Boosting, deep neural network, and Lasso regression) to traditional logistic regression using normally accessible triage data as predictors [131]. Here Boosting is an ensemble modeling technique that attempts to build a strong classifier from the number of weak classifiers to minimize training errors. One of the most well-known boosting algorithms is AdaBoost, which stands for “adaptative boosting algorithm” and was one of the first of its sort. The algorithms XGBoost, GradientBoost, and BrownBoost are more examples of boosting techniques. The results showed that machine learning models outperformed better. To track and control acute exacerbations as well as hospitalizations, artificial neural networks have been frequently implemented [132]. A time-sensitive prediction model based on an ANN that used clinical data in the particular time frame to predict asthma attacks was reported at a cohort study of 31,433 adult asthma diagnosed patients [133]. Guerra et al. [134], used recognized statistical approaches such as Cox regression analysis and logistic regression analysis to assess 27 scenarios for acute COPD exacerbation.
Polezer et al. employed artificial neural networks (i.e., Multilayer Perceptron (MLP), Echo State Networks (ESN) and Extreme Learning Machines (ELM)) to evaluate the negative influence of atmospheric air pollution on individual health [135]. Three well-known ANN were investigated to determine the impact of PM2.5, relative humidity, and temperature on respiratory hospitalizations. The impacts of airway pollutantson human health are extensively studied using statistical regression models. If there are inadequate datasets, linear statistical regression might underperform, and alternative data processing methods should be explored. According to the findings, ANN may be a more precise method for detecting the effects on respiratory health than statistical regression models, and it may be especially helpful when data is insufficient [135]. The possibility of artificial intelligence as a technique for providing an automated interpretation of PFT by replicating a physician’s cognitive abilities was identified. Topalovic et al. [136] developed a machine learning algorithms capable of diagnosing the most prevalent obstructive disorders with a 68% overall accuracy.
Although statistical regression models are simple to construct, they are frequently insufficient for estimating the impact of air pollution on human health, and ANN may offer a useful alternative technique. Many studies have used ML algorithms to treat COPD exacerbations of airway illnesses since ML-based techniques showed promise in improving prediction abilities; however, just a few papers have been published on AI use in analyzing the possible health effects of air pollution; however, in the diagnosis and treatment of severe respiratory illnesses, AI/ML approaches cannot yet completely substitute doctors. Despite the fact that machine learning method is constantly improving in the profession of medical field, use of AI in larger extent is severely constrained due to challenges in getting enough data, trials, and training [137]. Undoubtedly, AI has an important role to play in the healthcare offerings of the future.

6. Prediction of Climate Change Using AI and ML Techniques

Global warming and Climate change are heated topics in international community because of the harm they represent to long-term development [138]. Extreme exploitation of natural resources, as well as the burning up of fossil fuels and nonrenewable energy, pose serious environment risks, like drinking water scarcity, deforestation and climate change [139]. Since the weather changes because of human being activity, it gets critical to precisely predict weather occasions that could impact our own environment and wellness. Extreme oceanic heating phenomena, also called Marine Heat Waves, are usually becoming more frequently and extreme consequently of anthropogenic weather change [9]. Heatwaves are increasingly a lot more intense, longer and more frequent because global temperatures increase [56]. Excessive heatwaves exposure can damage the surroundings, human wellness, crops, and livestock [140]. MHWs have gotten much less attention than land-based heatwaves, leads to serious effects on marine creatures and ecosystems, along with substantial financial burdens. Acute exposure associated with marine creatures and ecosystems to incredibly great heat might cause irreparable harm or even nearby extinction of species, like widespread coral reefs bleaching, biodiversity die-offs, and financial deficits within the aquaculture and fisheries sectors [141]. AI, namely deep learning, can also be improves climate forecasting and forecasting extreme weather occurrences. Due to the fact their capability to include a lot more data and manage the real-world difficulty of climate, data processing for atmospheric and ocean dynamics, because well as ocean and atmospheric biochemistry, within their computations; this particular boosts the accuracy associated with weather and weather modeling, making more valuable in order to decision-makers [12]. Artificial intelligence (AI) can then build on discovered climate connections to provide enhanced warnings of approaching weather features, including extreme events. A few earlier works on heatwaves forecasting making use of AI approaches are usually covered with this section. Improving climate modelling and forecasting is one of AI’s most obvious climate change applications.
Due to changes in their prediction abilities driven by climate change, several extremely competent climate prediction techniques have shown low skill in recent decades [142]. Even with the most sophisticated machine learning (ML) algorithms, predicting any meteorological variable can be difficult [143]. Recent failures, on the other hand, are closely tied to climatic changes, which has caused most models to underperform because to their inadequacy to incorporate alternative sources of predictability that have arisen as a result of recent climate change [144]. With ML algorithms’ capacity to understand multivariate complicated processes, a variety of ML algorithms has been utilized to forecast numerous natural occurrences in recent years [145]. The ability of forecasts of sea surface temperature to predict MHW has only been examined in a small number of studies. One of the early attempts to forecast MHWs is the work by Jacox et al. [146]. Using eight different coupled climate models, the study attempted to assess the occurrence of four MHW events in the California Current System (CCS) between 2014 and 2016. Xiao et al. shown that ML algorithm namely the Deep Neural Network model, AdaBoost ensemble and Long short-term memory (LSTM) effective in forecasting daily SST (Sea Surface Temperature) [147]. Wolff et al. investigated the ability of the XGBoost, Long Short Term Memory (LSTM), Multi-layer Perceptron (MLP), gene (RF) and Generalized Additive Models (GAMs) to predict SST across 562 days [148].
Khan et al. used machine learning (ML) techniques such as artificial neural network, Support Vector Machines (SVM) and random forest to create a climate change robust heat wave prediction system for Pakistan. Throughout the validation period, SVM algorithms outperformed other ML models in predicting (Heat Wave Days) HWDs, with a R2 of 0.87 and NRMSE (Normalized Root Mean Square Error) of 36% [149]. The Australian Community Climate and Earth System Simulator Seasonal version 1 (ACCESS-S1) ocean-atmosphere model may be able to anticipate the 2020 marine heatwaves in the Great Barrier Reef on a sub-seasonal scale, according to research by Benthuysen et al. [150]. The model was able to accurately forecast the beginning of MHWs a week in advance, but it was unable to identify when the MHW would end [150]. In their recent study, the authors also investigated the usage of ACCESS-S2 for creating monthly MHW forecasts, which had a hit rate of up to 40% when projecting 4 months in advance. The need of creating more precise seasonal forecasts was stressed by the authors [151]. Much research has attempted to predict SST over the past ten years, ranging from ocean-climate models based on physical equations to more contemporary deep learning architectures like CNNs, Convolutional Long Short-Term Memory (Conv-LSTM) Networks [152]. The outcomes demonstrated that LSTM performed poorly when compared to other models because it was unable to detect the input dataset’s high-frequency fluctuations; it has been demonstrated in oceanography that RF is a reliable method for modelling time series data [148]. The RF (Random Forests) and SVM algorithms performed the best of all models, but the ensemble decomposition Hybrid models performed even better.

7. Conclusions

Air pollution and its impacts on human and environmental health are important challenges in the 21st century. Air quality forecasting and prediction is an efficient way of preventing humans from pollution exposure by implementing early-warning systems. In recent decades, artificial intelligence technologies have gained popularity in the field of environmental pollution control, and they have been considered an efficient alternative to dealing with the complexities of unexpected and real-world complexity of environmental concerns. This paper focused on the different Artificial Intelligence technologies and Machine Learning algorithms utilized in environmental pollution forecasting and early warning systems; this work started by reviewing the sources and effects of dangerous air pollutants on the ecosystem and individuals, as well as the existing scenario of environmental pollution forecasting tools. The uses of AI techniques and ML algorithms in forecasting main pollutants (O3, CO, CO2, NO2, SO2, and PM-Particulate Matters) are then discussed, as are the applications of AI approaches in human health and climate prediction. The following conclusions are presented based on the application of AI technology and ML algorithms in pollution forecasting, public health, and climate challenges.
From the previous studies, it is clearly evident that AI-based techniques have been widely used for pollution casting and have demonstrated substantial potential for high-precision prediction. The enormous number of computations required by physical models (for example, chemical transport models) is one of their key restrictions, and the quality of these deterministic techniques is dependent on a vast quantity of data and information from pollution sources. In comparison to the statistical model, the physical model is easier to compute and use; however, these models need a vast quantity of historical data and are heavily reliant on the time series technique. Regional characteristics in statistical models can be complicated, chaotic, and extremely nonlinear. To model nonlinear series, ANN is a more common and evolving variant for air pollution prediction. ANN requires fewer rigorous statistical constraints are needed, complicated nonlinear interactions may be modelled, and many algorithms can be trained. The hybrid ANN model has a wider variety of capabilities due to the integration of many methodologies into a single computational model than single ANN model. SVM (Least square support vector machine) and Fuzzy logic (Adaptive Neuro-fuzzy interference system) have enhanced their capability to handle with complicated temporal factors and boost accuracy. Because of its benefits over standard AI approaches, fuzzy logic has been widely employed as a prognostic tool in the field of air pollution forecasting and additionally it able to higher fault tolerance, handle uncertainty, ability to build non-linear functions of arbitrary complexity. Furthermore, models of adaptive neuro-fuzzy inference systems (ANFIS) have been utilised to anticipate pollutants such as nitrogen oxides (NOx), carbon dioxide CO2 or PM2.5 and PM10. For instance, the support vector regression, radial basis function (RBF), adaptive network based fuzzy inference system (ANFIS), back propagation neural network (BPNN), non-linear autoregressive with exogenous inputs neural network (NARX) and Elman recurrent neural network models have been used to air quality forecasting. Deep learning models such as CNN and LSTM performed better in terms of forecast accuracy. The hybrid architecture has benefits in terms of prediction accuracy, prediction stability and air pollution warning efficiency, and hybrid models demonstrated synergistic effects, although at the expense of computational weight. In general, hybrid models refer to the integration of not only various algorithms or methodologies but also it includes the benefits of each single component, which results in improved performance. Because of its superior performance and prediction, the hybrid model is a credible alternative for policymakers seeking to develop air quality and early warning. SD-LSSVR-CPSOGSA, other nonlinear forecasting sectors that can benefit from the hybrid technique include electricity demand forecasting, air transport demand forecasting and nuclear energy consumption forecasting. Traditional AI performance outperforms statistical approaches but falls short of the hybrid model. The findings of multi-model data decomposition and ensemble approaches give a range and indication of prediction resilience, which helps to enhance the accuracy of chemical weather and air quality forecasting. Forecasting performance improves when spatiotemporal elements, meteorological parameters, and geographical considerations are considered. Using multiple data division approaches to combine linear and nonlinear models would be an excellent tool for forecasting daily PM2.5 concentrations, and the Wavelet (ANN, LSTM) transform is effective for capturing temporal features of PM2.5 concentration at different temperature and relative humidity scales. The majority of the available work focuses on estimating PM2.5 concentrations in densely populated metropolitan areas since it not only causes cardiac diseases but also causes intracellular oxidative stress, mutagenicity/genotoxicity, and inflammatory reactions. Many studies have used ML algorithms to treat acute exacerbations of airway illnesses since ML-based techniques showed promise in improving prediction abilities. The efficient methods for predicting heatwaves and climatic changes are Long Short Term Memory networks, Multi-layer Perceptron, XGBoost, Random Forest and Generalized Additive Models.
Forecasting air pollution should use different methods depending on the location and the contaminants. Furthermore, there is no single optimum method for making the most accurate forecast. Because of their limitations, it is widely assumed that none of the predictor can be adequate for all parts of modelling, and there was no particular intelligent strategy fit for all special situations. A short dataset may prevent an AI model from achieving the requisite accuracy, whereas a huge dataset may make the training process computationally expensive; however, a tendency towards replacing conventional mathematical approaches with AI technology is rising due to the relatively fast and dependable response, which should not be undervalued. Finally, the most of the publications analyzed used various performance indicators to assess the predictive validity of the models; however, more research should be done to explore at other areas of model performance, like structural and replicative validity. Although, the researchers did not focus on other environmental pollution such as water pollution and land pollution in this paper, it is important to highlight the negative impact of those pollution on environment and human health. In the future study, the researcher should discuss the artificial intelligence methodologies for forecasting and early-warning system of water pollution and land pollution. In addition, challenges with meteorology-dependent emissions (e.g., wildfires, dust storms, pollen, VOC, secondary aerosols, and climate forcers) necessitated additional research efforts in online monitoring and assessment of emissions using remote sensing observations, crowdsourcing data, and machine learning and artificial intelligence methods.

Author Contributions

Conceptualization, S.S., N.R. (Naveenkumar Raju), A.G., N.R. (Nithyaprakash Rajavel), M.C., C.P., A.P., A.K.B. and S.D.; methodology, S.S. and N.R. (Naveenkumar Raju); writing—A.G., N.R. (Nithyaprakash Rajavel), M.C., S.S., A.P., A.K.B. and S.D. All authors have read and agreed to the published version of the manuscript.

Funding

This research was funded by Ministry of Science and Higher Education of the Russian Federation as part of the World-class Research Center program: Advanced Digital Technologies: contract No. 075-15-2022-311 dated 20.04.2022 and Indian Council For Medical Research (ICMR), grant number 5/8-4/30/ENV/2020-NCD-II.

Institutional Review Board Statement

Not applicable.

Informed Consent Statement

Not applicable.

Data Availability Statement

Not applicable.

Conflicts of Interest

The authors declare no conflict of interest.

References

  1. Zhou, Y.; Zhao, X.; Lin, K.-P.; Wang, C.-H.; Li, L. A Gaussian process mixture model-based hard-cut iterative learning algorithm for air quality prediction. Appl. Soft Comput. 2019, 85, 105789. [Google Scholar] [CrossRef]
  2. Kampa, M.; Castanas, E. Human health effects of air pollution. Environ. Pollut. 2008, 151, 362–367. [Google Scholar] [CrossRef]
  3. Aayush, K.; Vishal, D.; Hammad, N.; Manu, K. Application of artificial intelligence in curbing air pollution: The case of India. Asian J. Manag. 2020, 11, 285–290. [Google Scholar] [CrossRef]
  4. Mannucci, P.M.; Franchini, M. Health effects of ambient air pollution in developing countries. Int. J. Environ. Res. Public Health 2017, 14, 1048. [Google Scholar] [CrossRef]
  5. Asha, P.; Natrayan, L.; Geetha, B.; Beulah, J.R.; Sumathy, R.; Varalakshmi, G.; Neelakandan, S. IoT enabled environmental toxicology for air pollution monitoring using AI techniques. Environ. Res. 2022, 205, 112574. [Google Scholar] [CrossRef]
  6. Elsunousi, A.A.M.; Sevik, H.; Cetin, M.; Ozel, H.B.; Ozel, H.U. Periodical and regional change of particulate matter and CO2 concentration in Misurata. Environ. Monit. Assess. 2021, 193, 707. [Google Scholar] [CrossRef] [PubMed]
  7. Cetin, M.; Onac, A.K.; Sevik, H.; Sen, B. Temporal and regional change of some air pollution parameters in Bursa. Air Qual. Atmos. Health 2019, 12, 311–316. [Google Scholar] [CrossRef]
  8. Cetin, M. A Change in the Amount of CO2 at the Center of the Examination Halls: Case Study of Turkey. Stud. Ethno-Med. 2016, 10, 146–155. [Google Scholar] [CrossRef]
  9. Hobday, A.J.; Alexander, L.V.; Perkins, S.E.; Smale, D.A.; Straub, S.C.; Oliver, E.C.; Benthuysen, J.A.; Burrows, M.T.; Donat, M.G.; Feng, M. A hierarchical approach to defining marine heatwaves. Prog. Oceanogr. 2016, 141, 227–238. [Google Scholar] [CrossRef]
  10. Jerrett, M.; Arain, A.; Kanaroglou, P.; Beckerman, B.; Potoglou, D.; Sahsuvaroglu, T.; Morrison, J.; Giovis, C. A review and evaluation of intraurban air pollution exposure models. J. Expo. Sci. Environ. Epidemiol. 2005, 15, 185–204. [Google Scholar] [CrossRef] [PubMed]
  11. Fernández, J.D.; Vico, F. AI methods in algorithmic composition: A comprehensive survey. J. Artif. Intell. Res. 2013, 48, 513–582. [Google Scholar] [CrossRef]
  12. Lee, D.; Kang, S.; Shin, J. Using deep learning techniques to forecast environmental consumption level. Sustainability 2017, 9, 1894. [Google Scholar] [CrossRef]
  13. Ong, B.T.; Sugiura, K.; Zettsu, K. Dynamically pre-trained deep recurrent neural networks using environmental monitoring data for predicting PM2.5. Neural Comput. Appl. 2016, 27, 1553–1566. [Google Scholar] [CrossRef]
  14. Kemp, A.C.; Horton, B.P.; Donnelly, J.P.; Mann, M.E.; Vermeer, M.; Rahmstorf, S. Climate related sea-level variations over the past two millennia. Proc. Natl. Acad. Sci. USA 2011, 108, 11017–11022. [Google Scholar] [CrossRef]
  15. Bai, L.; Wang, J.; Ma, X.; Lu, H. Air pollution forecasts: An overview. Int. J. Environ. Res. Public Health 2018, 15, 780. [Google Scholar] [CrossRef]
  16. Najjar, Y.S. Gaseous pollutants formation and their harmful effects on health and environment. Innov. Energy Policies 2011, 1, 1–8. [Google Scholar] [CrossRef]
  17. Han, X.; Liu, Y.; Gao, H.; Ma, J.; Mao, X.; Wang, Y.; Ma, X. Forecasting PM2.5 induced male lung cancer morbidity in China using satellite retrieved PM2.5 and spatial analysis. Sci. Total Environ. 2017, 607, 1009–1017. [Google Scholar] [CrossRef] [PubMed]
  18. Zhu, F.; Ding, R.; Lei, R.; Cheng, H.; Liu, J.; Shen, C.; Zhang, C.; Xu, Y.; Xiao, C.; Li, X. The short-term effects of air pollution on respiratory diseases and lung cancer mortality in Hefei: A time-series analysis. Respir. Med. 2019, 146, 57–65. [Google Scholar] [CrossRef] [PubMed]
  19. Masood, A.; Ahmad, K. A review on emerging artificial intelligence (AI) techniques for air pollution forecasting: Fundamentals, application and performance. J. Clean. Prod. 2021, 322, 129072. [Google Scholar] [CrossRef]
  20. Liu, H.; Yan, G.; Duan, Z.; Chen, C. Intelligent modeling strategies for forecasting air quality time series: A review. Appl. Soft Comput. 2021, 102, 106957. [Google Scholar] [CrossRef]
  21. Feng, X.; Li, Q.; Zhu, Y.; Hou, J.; Jin, L.; Wang, J. Artificial neural networks forecasting of PM2.5 pollution using air mass trajectory based geographic model and wavelet transformation. Atmos. Environ. 2015, 107, 118–128. [Google Scholar] [CrossRef]
  22. Liu, H.; Yang, R. A spatial multi-resolution multi-objective data-driven ensemble model for multi-step air quality index forecasting based on real-time decomposition. Comput. Ind. 2021, 125, 103387. [Google Scholar] [CrossRef]
  23. Zhou, J.-H.; Zhao, J.-G.; Li, P. Study on gray numerical model of air pollution in wuan city. In Proceedings of the 2010 International Conference on Challenges in Environmental Science and Computer Engineering, Wuhan, China, 6–7 March 2010; pp. 321–323. [Google Scholar]
  24. Zhang, L.; Lin, J.; Qiu, R.; Hu, X.; Zhang, H.; Chen, Q.; Tan, H.; Lin, D.; Wang, J. Trend analysis and forecast of PM2.5 in Fuzhou, China using the ARIMA model. Ecol. Indic. 2018, 95, 702–710. [Google Scholar] [CrossRef]
  25. Chaloulakou, A.; Saisana, M.; Spyrellis, N. Comparative assessment of neural networks and regression models for forecasting summertime ozone in Athens. Sci. Total Environ. 2003, 313, 1–13. [Google Scholar] [CrossRef]
  26. Chen, X.; Yin, L.; Fan, Y.; Song, L.; Ji, T.; Liu, Y.; Tian, J.; Zheng, W. Temporal evolution characteristics of PM2.5 concentration based on continuous wavelet transform. Sci. Total Environ. 2020, 699, 134244. [Google Scholar] [CrossRef]
  27. Gu, Y.; Li, B.; Meng, Q. Hybrid interpretable predictive machine learning model for air pollution prediction. Neurocomputing 2022, 468, 123–136. [Google Scholar] [CrossRef]
  28. Bai, Y.; Zeng, B.; Li, C.; Zhang, J. An ensemble long short-term memory neural network for hourly PM2.5 concentration forecasting. Chemosphere 2019, 222, 286–294. [Google Scholar] [CrossRef] [PubMed]
  29. Sun, W.; Sun, J. Daily PM2.5 concentration prediction based on principal component analysis and LSSVM optimized by cuckoo search algorithm. J. Environ. Manag. 2017, 188, 144–152. [Google Scholar] [CrossRef]
  30. Liu, H.; Jin, K.; Duan, Z. Air PM2.5 concentration multi-step forecasting using a new hybrid modeling method: Comparing cases for four cities in China. Atmos. Pollut. Res. 2019, 10, 1588–1600. [Google Scholar] [CrossRef]
  31. Sun, W.; Huang, C. Predictions of carbon emission intensity based on factor analysis and an improved extreme learning machine from the perspective of carbon emission efficiency. J. Clean. Prod. 2022, 338, 130414. [Google Scholar] [CrossRef]
  32. Dotse, S.-Q.; Petra, M.I.; Dagar, L.; De Silva, L.C. Application of computational intelligence techniques to forecast daily PM10 exceedances in Brunei Darussalam. Atmos. Pollut. Res. 2018, 9, 358–368. [Google Scholar] [CrossRef]
  33. Zhu, S.; Lian, X.; Wei, L.; Che, J.; Shen, X.; Yang, L.; Qiu, X.; Liu, X.; Gao, W.; Ren, X. PM2.5 forecasting using SVR with PSOGSA algorithm based on CEEMD, GRNN and GCA considering meteorological factors. Atmos. Environ. 2018, 183, 20–32. [Google Scholar] [CrossRef]
  34. Gan, K.; Sun, S.; Wang, S.; Wei, Y. A secondary-decomposition-ensemble learning paradigm for forecasting PM2.5 concentration. Atmos. Pollut. Res. 2018, 9, 989–999. [Google Scholar] [CrossRef]
  35. Wu, Q.; Lin, H. Daily urban air quality index forecasting based on variational mode decomposition, sample entropy and LSTM neural network. Sustain. Cities Soc. 2019, 50, 101657. [Google Scholar] [CrossRef]
  36. Zhu, S.; Qiu, X.; Yin, Y.; Fang, M.; Liu, X.; Zhao, X.; Shi, Y. Two-step-hybrid model based on data preprocessing and intelligent optimization algorithms (CS and GWO) for NO2 and SO2 forecasting. Atmos. Pollut. Res. 2019, 10, 1326–1335. [Google Scholar] [CrossRef]
  37. Liu, H.; Duan, Z.; Chen, C. A hybrid multi-resolution multi-objective ensemble model and its application for forecasting of daily PM2.5 concentrations. Inf. Sci. 2020, 516, 266–292. [Google Scholar] [CrossRef]
  38. Mo, X.; Zhang, L.; Li, H.; Qu, Z. A novel air quality early-warning system based on artificial intelligence. Int. J. Environ. Res. Public Health 2019, 16, 3505. [Google Scholar] [CrossRef]
  39. Stein, A.L. Artificial intelligence and climate change. Yale J. Regul. 2020, 37, 890. [Google Scholar]
  40. Liu, X.; Lu, D.; Zhang, A.; Liu, Q.; Jiang, G. Data-Driven Machine Learning in Environmental Pollution: Gains and Problems. Environ. Sci. Technol. 2022, 56, 2124–2133. [Google Scholar] [CrossRef]
  41. Alimissis, A.; Philippopoulos, K.; Tzanis, C.; Deligiorgi, D. Spatial estimation of urban air pollution with the use of artificial neural network models. Atmos. Environ. 2018, 191, 205–213. [Google Scholar] [CrossRef]
  42. Titus, J.G. Greenhouse effect, sea level rise, and barrier islands: Case study of Long Beach Island, New Jersey. Coast. Manag. 1990, 18, 65–90. [Google Scholar] [CrossRef]
  43. Fan, C.; Gu, H.; Jiang, H. Industrial air pollution treatment efficiency and its regional difference in China. Ecol. Econ. 2016, 32, 170–174. [Google Scholar]
  44. Zhang, H.; Zhang, W.; Palazoglu, A.; Sun, W. Prediction of ozone levels using a Hidden Markov Model (HMM) with Gamma distribution. Atmos. Environ. 2012, 62, 64–73. [Google Scholar] [CrossRef]
  45. Park, S.; Kim, M.; Kim, M.; Namgung, H.-G.; Kim, K.-T.; Cho, K.H.; Kwon, S.-B. Predicting PM10 concentration in Seoul metropolitan subway stations using artificial neural network (ANN). J. Hazard. Mater. 2018, 341, 75–82. [Google Scholar] [CrossRef]
  46. Amuthadevi, C.; Vijayan, D.; Ramachandran, V. Development of air quality monitoring (AQM) models using different machine learning approaches. J. Ambient. Intell. Humaniz. Comput. 2021. [Google Scholar] [CrossRef]
  47. Guo, Q.; He, Z.; Li, S.; Li, X.; Meng, J.; Hou, Z.; Liu, J.; Chen, Y. Air pollution forecasting using artificial and wavelet neural networks with meteorological conditions. Aerosol Air Qual. Res. 2020, 20, 1429–1439. [Google Scholar] [CrossRef]
  48. Elangasinghe, M.A.; Singhal, N.; Dirks, K.N.; Salmond, J.A. Development of an ANN–based air pollution forecasting system with explicit knowledge through sensitivity analysis. Atmos. Pollut. Res. 2014, 5, 696–708. [Google Scholar] [CrossRef]
  49. Pardo, E.; Malpica, N. Air quality forecasting in Madrid using long short-term memory networks. In Proceedings of the International Work-Conference on the Interplay Between Natural and Artificial Computation, Corunna, Spain, 19–23 June 2017; pp. 232–239. [Google Scholar]
  50. Zeng, Y.; Chen, J.; Jin, N.; Jin, X.; Du, Y. Air quality forecasting with hybrid LSTM and extended stationary wavelet transform. Build. Environ. 2022, 213, 108822. [Google Scholar] [CrossRef]
  51. Song, X.; Huang, J.; Song, D. Air quality prediction based on LSTM-Kalman model. In Proceedings of the 2019 IEEE 8th Joint International Information Technology and Artificial Intelligence Conference (ITAIC), Chongqing, China, 24–26 May 2019; pp. 695–699. [Google Scholar]
  52. Zhu, D.; Cai, C.; Yang, T.; Zhou, X. A machine learning approach for air quality prediction: Model regularization and optimization. Big Data Cogn. Comput. 2018, 2, 5. [Google Scholar] [CrossRef]
  53. Qi, Y.; Li, Q.; Karimian, H.; Liu, D. A hybrid model for spatiotemporal forecasting of PM2.5 based on graph convolutional neural network and long short-term memory. Sci. Total Environ. 2019, 664, 1–10. [Google Scholar] [CrossRef] [PubMed]
  54. Lobell, D.B.; Gourdji, S.M. The influence of climate change on global crop productivity. Plant Physiol. 2012, 160, 1686–1697. [Google Scholar] [CrossRef] [PubMed]
  55. Wen, C.; Liu, S.; Yao, X.; Peng, L.; Li, X.; Hu, Y.; Chi, T. A novel spatiotemporal convolutional long short-term neural network for air pollution prediction. Sci. Total Environ. 2019, 654, 1091–1099. [Google Scholar] [CrossRef]
  56. Pachauri, R.K.; Allen, M.R.; Barros, V.R.; Broome, J.; Cramer, W.; Christ, R.; Church, J.A.; Clarke, L.; Dahe, Q.; Dasgupta, P.; et al. Climate Change 2014: Synthesis Report. Contribution of Working Groups I, II and III to the Fifth Assessment Report of the Intergovernmental Panel on Climate Change; IPCC: Geneva, Switzerland, 2014. [Google Scholar]
  57. Ye, Z.; Yang, J.; Zhong, N.; Tu, X.; Jia, J.; Wang, J. Tackling environmental challenges in pollution controls using artificial intelligence: A review. Sci. Total Environ. 2020, 699, 134279. [Google Scholar] [CrossRef]
  58. Dincer, N.G.; Akkuş, Ö. A new fuzzy time series model based on robust clustering for forecasting of air pollution. Ecol. Inform. 2018, 43, 157–164. [Google Scholar] [CrossRef]
  59. Shivakumar, S.; Shastry, K.A.; Singh, S.; Pasha, S.; Vinay, B.; Sushma, V. Machine Learning-Based Air Pollution Prediction. In Recent Advances in Artificial Intelligence and Data Engineering; Springer: Singapore, 2022; pp. 17–27. [Google Scholar]
  60. Althuwaynee, O.F.; Balogun, A.L.; Al Madhoun, W. Air pollution hazard assessment using decision tree algorithms and bivariate probability cluster polar function: Evaluating inter-correlation clusters of PM10 and other air pollutants. GIScience Remote Sens. 2020, 57, 207–226. [Google Scholar] [CrossRef]
  61. Shaziayani, W.N.; Ul-Saufie, A.Z.; Mutalib, S.; Mohamad Noor, N.; Zainordin, N.S. Classification Prediction of PM10 Concentration Using a Tree-Based Machine Learning Approach. Atmosphere 2022, 13, 538. [Google Scholar] [CrossRef]
  62. Wang, Y.; Kong, T. Air quality predictive modeling based on an improved decision tree in a weather-smart grid. IEEE Access 2019, 7, 172892–172901. [Google Scholar] [CrossRef]
  63. Yan, D.; Kong, Y.; Ye, B.; Xiang, H. Spatio-temporal variation and daily prediction of PM2.5 concentration in world-class urban agglomerations of China. Environ. Geochem. Health 2021, 43, 301–316. [Google Scholar] [CrossRef]
  64. Du, S.; Li, T.; Yang, Y.; Horng, S.-J. Deep air quality forecasting using hybrid deep learning framework. IEEE Trans. Knowl. Data Eng. 2019, 33, 2412–2424. [Google Scholar] [CrossRef]
  65. Zhu, J.Y.; Sun, C.; Li, V.O. Granger-causality-based air quality estimation with spatio-temporal (ST) heterogeneous big data. In Proceedings of the 2015 IEEE Conference on Computer Communications Workshops (INFOCOM WKSHPS), Hong Kong, China, 26 April–1 May 2015; pp. 612–617. [Google Scholar]
  66. Li, V.O.; Lam, J.C.; Han, Y.; Chow, K. A Big Data and Artificial Intelligence Framework for Smart and Personalized Air Pollution Monitoring and Health Management in Hong Kong. Environ. Sci. Policy 2021, 124, 441–450. [Google Scholar] [CrossRef]
  67. Bekkar, A.; Hssina, B.; Douzi, S.; Douzi, K. Air-pollution prediction in smart city, deep learning approach. J. Big Data 2021, 8, 161. [Google Scholar] [CrossRef]
  68. Gilik, A.; Ogrenci, A.S.; Ozmen, A. Air quality prediction using CNN+LSTM−based hybrid deep learning architecture. Environ. Sci. Pollut. Res. 2022, 29, 11920–11938. [Google Scholar] [CrossRef]
  69. González-Pardo, J.; Ceballos-Santos, S.; Manzanas, R.; Santibáñez, M.; Fernández-Olmo, I. Estimating changes in air pollutant levels due to COVID-19 lockdown measures based on a business-as-usual prediction scenario using data mining models: A case-study for urban traffic sites in Spain. Sci. Total Environ. 2022, 823, 153786. [Google Scholar] [CrossRef] [PubMed]
  70. Rahman, M.M.; Shafiullah, M.; Rahman, S.M.; Khondaker, A.N.; Amao, A.; Zahir, M. Soft computing applications in air quality modeling: Past, present, and future. Sustainability 2020, 12, 4045. [Google Scholar] [CrossRef]
  71. Murillo-Escobar, J.; Sepulveda-Suescun, J.; Correa, M.; Orrego-Metaute, D. Forecasting concentrations of air pollutants using support vector regression improved with particle swarm optimization: Case study in Aburrá Valley, Colombia. Urban Clim. 2019, 29, 100473. [Google Scholar] [CrossRef]
  72. Yang, Z.; Wang, J. A new air quality monitoring and early warning system: Air quality assessment and air pollutant concentration prediction. Environ. Res. 2017, 158, 105–117. [Google Scholar] [CrossRef]
  73. Zaman, N.A.F.K.; Kanniah, K.D.; Kaskaoutis, D.G. Estimating particulate matter using satellite based aerosol optical depth and meteorological variables in Malaysia. Atmos. Res. 2017, 193, 142–162. [Google Scholar] [CrossRef]
  74. Wang, D.; Wei, S.; Luo, H.; Yue, C.; Grunder, O. A novel hybrid model for air quality index forecasting based on two-phase decomposition technique and modified extreme learning machine. Sci. Total Environ. 2017, 580, 719–733. [Google Scholar] [CrossRef]
  75. Li, C.; Zhu, Z. Research and application of a novel hybrid air quality early-warning system: A case study in China. Sci. Total Environ. 2018, 626, 1421–1438. [Google Scholar] [CrossRef] [PubMed]
  76. Wang, C.; Ye, Z.; Yu, Y.; Gong, W. Estimation of bus emission models for different fuel types of buses under real conditions. Sci. Total Environ. 2018, 640, 965–972. [Google Scholar] [CrossRef] [PubMed]
  77. Zhou, Y.; Chang, F.-J.; Chang, L.-C.; Kao, I.-F.; Wang, Y.-S.; Kang, C.-C. Multi-output support vector machine for regional multi-step-ahead PM2.5 forecasting. Sci. Total Environ. 2019, 651, 230–240. [Google Scholar] [CrossRef] [PubMed]
  78. Wang, J.; Niu, T.; Wang, R. Research and application of an air quality early warning system based on a modified least squares support vector machine and a cloud model. Int. J. Environ. Res. Public Health 2017, 14, 249. [Google Scholar] [CrossRef]
  79. Xu, Y.; Du, P.; Wang, J. Research and application of a hybrid model based on dynamic fuzzy synthetic evaluation for establishing air quality forecasting and early warning system: A case study in China. Environ. Pollut. 2017, 223, 435–448. [Google Scholar] [CrossRef] [PubMed]
  80. Li, T.; Li, X.; Wang, L.; Ren, Y.; Zhang, T.; Yu, M. Multi-model ensemble forecast method of PM2.5 concentration based on wavelet neural networks. In Proceedings of the 2018 1st International Cognitive Cities Conference (IC3), Okinawa, Japan, 7–9 August 2018; pp. 81–86. [Google Scholar]
  81. Ahmadi, M.H.; Jashnani, H.; Chau, K.-W.; Kumar, R.; Rosen, M.A. Carbon dioxide emissions prediction of five Middle Eastern countries using artificial neural networks. Energy Sources Part A Recovery Util. Environ. Eff. 2019. [Google Scholar] [CrossRef]
  82. Bai, Y.; Li, Y.; Zeng, B.; Li, C.; Zhang, J. Hourly PM2.5 concentration forecast using stacked autoencoder model with emphasis on seasonality. J. Clean. Prod. 2019, 224, 739–750. [Google Scholar] [CrossRef]
  83. Cheng, Y.; Zhang, H.; Liu, Z.; Chen, L.; Wang, P. Hybrid algorithm for short-term forecasting of PM2.5 in China. Atmos. Environ. 2019, 200, 264–279. [Google Scholar] [CrossRef]
  84. Kamińska, J.A. A random forest partition model for predicting NO2 concentrations from traffic flow and meteorological conditions. Sci. Total Environ. 2019, 651, 475–483. [Google Scholar] [CrossRef]
  85. Masood, A.; Ahmad, K. A model for particulate matter (PM2.5) prediction for Delhi based on machine learning approaches. Procedia Comput. Sci. 2020, 167, 2101–2110. [Google Scholar] [CrossRef]
  86. Pak, U.; Ma, J.; Ryu, U.; Ryom, K.; Juhyok, U.; Pak, K.; Pak, C. Deep learning-based PM2.5 prediction considering the spatiotemporal correlations: A case study of Beijing, China. Sci. Total Environ. 2020, 699, 133561. [Google Scholar] [CrossRef]
  87. Zeinalnezhad, M.; Chofreh, A.G.; Goni, F.A.; Klemeš, J.J. Air pollution prediction using semi-experimental regression model and Adaptive Neuro-Fuzzy Inference System. J. Clean. Prod. 2020, 261, 121218. [Google Scholar] [CrossRef]
  88. Chattopadhyay, G.; Chattopadhyay, S.; Midya, S.K. Fuzzy binary relation based elucidation of air quality over a highly polluted urban region of India. Earth Sci. Inform. 2021, 14, 1625–1631. [Google Scholar] [CrossRef]
  89. Liu, B.; Zhang, L.; Wang, Q.; Chen, J. A novel method for regional NO2 concentration prediction using discrete wavelet transform and an LSTM network. Comput. Intell. Neurosci. 2021, 2021, 6631614. [Google Scholar] [CrossRef]
  90. Ren, M.; Sun, W.; Chen, S. Combining machine learning models through multiple data division methods for PM2.5 forecasting in Northern Xinjiang, China. Environ. Monit. Assess. 2021, 193, 476. [Google Scholar] [CrossRef]
  91. Du, P.; Wang, J.; Yang, W.; Niu, T. A novel hybrid fine particulate matter (PM2.5) forecasting and its further application system: Case studies in China. J. Forecast. 2022, 41, 64–85. [Google Scholar]
  92. Ejohwomu, O.A.; ShamsideenOshodi, O.; Oladokun, M.; Bukoye, O.T.; Emekwuru, N.; Sotunbo, A.; Adenuga, O. Modelling and Forecasting Temporal PM2.5 Concentration Using Ensemble Machine Learning Methods. Buildings 2022, 12, 46. [Google Scholar] [CrossRef]
  93. Mirzadeh, S.; Nejadkoorki, F.; Mirhoseini, S.; Moosavi, V. Developing a wavelet-AI hybrid model for short-and long-term predictions of the pollutant concentration of particulate matter10. Int. J. Environ. Sci. Technol. 2022, 19, 209–222. [Google Scholar] [CrossRef]
  94. Cho, J.H.; Moon, J.W. Integrated artificial neural network prediction model of indoor environmental quality in a school building. J. Clean. Prod. 2022, 344, 131083. [Google Scholar] [CrossRef]
  95. Kurnaz, G.; Demir, A.S. Prediction of SO2 and PM10 air pollutants using a deep learning-based recurrent neural network: Case of industrial city Sakarya. Urban Clim. 2022, 41, 101051. [Google Scholar] [CrossRef]
  96. Conibear, L.; Reddington, C.L.; Silver, B.J.; Chen, Y.; Knote, C.; Arnold, S.R.; Spracklen, D.V. Sensitivity of air pollution exposure and disease burden to emission changes in China using machine learning emulation. GeoHealth 2022, 6, e2021GH000570. [Google Scholar] [CrossRef]
  97. Ma, W.; Yuan, Z.; Lau, A.K.; Wang, L.; Liao, C.; Zhang, Y. Optimized neural network for daily-scale ozone prediction based on transfer learning. Sci. Total Environ. 2022, 827, 154279. [Google Scholar] [CrossRef]
  98. Kapoor, N.R.; Kumar, A.; Kumar, A.; Kumar, A.; Mohammed, M.A.; Kumar, K.; Kadry, S.; Lim, S. Machine learning-based CO2 prediction for office room: A pilot study. Wirel. Commun. Mob. Comput. 2022, 2022, 9404807. [Google Scholar] [CrossRef]
  99. Sohn, S.H.; Oh, S.C.; Yeo, Y.-K. Prediction of air pollutants by using an artificial neural network. Korean J. Chem. Eng. 1999, 16, 382–387. [Google Scholar] [CrossRef]
  100. Robertson, D. The rise in the atmospheric concentration of carbon dioxide and the effects on human health. Med. Hypotheses 2001, 56, 513–518. [Google Scholar] [CrossRef]
  101. Norhayati, I.; Rashid, M. Adaptive neuro-fuzzy prediction of carbon monoxide emission from a clinical waste incineration plant. Neural Comput. Appl. 2018, 30, 3049–3061. [Google Scholar] [CrossRef]
  102. Qader, M.R.; Khan, S.; Kamal, M.; Usman, M.; Haseeb, M. Forecasting carbon emissions due to electricity power generation in Bahrain. Environ. Sci. Pollut. Res. 2022, 29, 17346–17357. [Google Scholar] [CrossRef]
  103. Slini, T.; Karatzas, K.; Moussiopoulos, N. Correlation of air pollution and meteorological data using neural networks. Int. J. Environ. Pollut. 2003, 20, 218–229. [Google Scholar] [CrossRef]
  104. Mishra, D.; Goyal, P. Development of artificial intelligence based NO2 forecasting models at TajMahal, Agra. Atmos. Pollut. Res. 2015, 6, 99–106. [Google Scholar] [CrossRef]
  105. Wang, P.; Liu, Y.; Qin, Z.; Zhang, G. A novel hybrid forecasting model for PM10 and SO2 daily concentrations. Sci. Total Environ. 2015, 505, 1202–1212. [Google Scholar] [CrossRef]
  106. Brunelli, U.; Piazza, V.; Pignato, L.; Sorbello, F.; Vitabile, S. Two-days ahead prediction of daily maximum concentrations of SO2, O3, PM10, NO2, CO in the urban area of Palermo, Italy. Atmos. Environ. 2007, 41, 2967–2995. [Google Scholar] [CrossRef]
  107. Shams, S.R.; Jahani, A.; Kalantary, S.; Moeinaddini, M.; Khorasani, N. The evaluation on artificial neural networks (ANN) and multiple linear regressions (MLR) models for predicting SO2 concentration. Urban Clim. 2021, 37, 100837. [Google Scholar] [CrossRef]
  108. Lubinski, W.; Toczyska, I.; Chcialowski, A.; Plusa, T. Influence of air pollution on pulmonary function in healthy young men from different regions of Poland. Ann. Agric. Environ. Med. 2005, 12, 1–4. [Google Scholar] [PubMed]
  109. Fernando, H.J.; Mammarella, M.; Grandoni, G.; Fedele, P.; Di Marco, R.; Dimitrova, R.; Hyde, P. Forecasting PM10 in metropolitan areas: Efficacy of neural networks. Environ. Pollut. 2012, 163, 62–67. [Google Scholar] [CrossRef] [PubMed]
  110. Ma, J.; Yu, Z.; Qu, Y.; Xu, J.; Cao, Y. Application of the XGBoost machine learning method in PM2.5 prediction: A case study of Shanghai. Aerosol Air Qual. Res. 2020, 20, 128–138. [Google Scholar] [CrossRef]
  111. Liu, Y.; Ning, Z.; Chen, Y.; Guo, M.; Liu, Y.; Gali, N.K.; Sun, L.; Duan, Y.; Cai, J.; Westerdahl, D. Aerodynamic analysis of SARS-CoV-2 in two Wuhan hospitals. Nature 2020, 582, 557–560. [Google Scholar] [CrossRef]
  112. Iqbal, M.J.; Javed, Z.; Sadia, H.; Qureshi, I.A.; Irshad, A.; Ahmed, R.; Malik, K.; Raza, S.; Abbas, A.; Pezzani, R. Clinical applications of artificial intelligence and machine learning in cancer diagnosis: Looking into the future. Cancer Cell Int. 2021, 21, 270. [Google Scholar] [CrossRef]
  113. Jain, K. Artificial intelligence applications in handling the infectious diseases. Prim. Health Care Open Access 2020, 10, 351. [Google Scholar]
  114. Shademan, A.; Decker, R.S.; Opfermann, J.D.; Leonard, S.; Krieger, A.; Kim, P.C. Supervised autonomous robotic soft tissue surgery. Sci. Transl. Med. 2016, 8, 337ra64. [Google Scholar] [CrossRef]
  115. Datta, S.; Barua, R.; Das, J. Application of artificial intelligence in modern healthcare system. In Alginates—Recent Uses of This Natural Polymer; IntechOpen: London, UK, 2020. [Google Scholar]
  116. Usmani, R.S.A.; Pillai, T.R.; Hashem, I.A.T.; Marjani, M.; Shaharudin, R.; Latif, M.T. Air pollution and cardiorespiratory hospitalization, predictive modeling, and analysis using artificial intelligence techniques. Environ. Sci. Pollut. Res. 2021, 28, 56759–56771. [Google Scholar] [CrossRef]
  117. Pfeffer, P.E.; Mudway, I.S.; Grigg, J. Air pollution and asthma: Mechanisms of harm and considerations for clinical interventions. Chest 2021, 159, 1346–1355. [Google Scholar] [CrossRef]
  118. Xie, J.; Zhu, Y. Association between ambient temperature and COVID-19 infection in 122 cities from China. Sci. Total Environ. 2020, 724, 138201. [Google Scholar] [CrossRef]
  119. Wu, X.; Nethery, R.; Sabath, B.; Braun, D.; Dominici, F. Exposure to air pollution and COVID-19 mortality in the United States: A nationwide cross-sectional study. medRxiv 2020. [Google Scholar] [CrossRef]
  120. Mele, M.; Magazzino, C. Pollution, economic growth, and COVID-19 deaths in India: A machine learning evidence. Environ. Sci. Pollut. Res. 2021, 28, 2669–2677. [Google Scholar] [CrossRef] [PubMed]
  121. Travaglio, M.; Yu, Y.; Popovic, R.; Selley, L.; Leal, N.; Martins, L. Links between air pollution and COVID-19 in England. medRxiv 2020, 268, 115859. [Google Scholar] [CrossRef] [PubMed]
  122. Zoran, M.A.; Savastru, R.S.; Savastru, D.M.; Tautan, M.N. Assessing the relationship between ground levels of ozone (O3) and nitrogen dioxide (NO2) with coronavirus (COVID-19) in Milan, Italy. Sci. Total Environ. 2020, 740, 140005. [Google Scholar] [CrossRef]
  123. Jiang, Y.; Xu, J. The association between COVID-19 deaths and short-term ambient air pollution/meteorological condition exposure: A retrospective study from Wuhan, China. Air Qual. Atmos. Health 2021, 14, 1–5. [Google Scholar] [CrossRef]
  124. Lin, S.; Wei, D.; Sun, Y.; Chen, K.; Yang, L.; Liu, B.; Huang, Q.; Paoliello, M.M.B.; Li, H.; Wu, S. Region-specific air pollutants and meteorological parameters influence COVID-19: A study from mainland China. Ecotoxicol. Environ. Saf. 2020, 204, 111035. [Google Scholar] [CrossRef] [PubMed]
  125. Frontera, A.; Cianfanelli, L.; Vlachos, K.; Landoni, G.; Cremona, G. Severe air pollution links to higher mortality in COVID-19 patients: The “double-hit” hypothesis. J. Infect. 2020, 81, 255–259. [Google Scholar] [CrossRef] [PubMed]
  126. Santos, V.C.; Oliveira, A.E.R.; Campos, A.C.B.; Reis-Cunha, J.L.; Bartholomeu, D.C.; Teixeira, S.M.R.; Lima, A.P.C.; Ferreira, R.S. The gene repertoire of the main cysteine protease of Trypanosomacruzi, cruzipain, reveals four sub-types with distinct active sites. Sci. Rep. 2021, 11, 18231. [Google Scholar] [CrossRef]
  127. Heuvelmans, M.A.; van Ooijen, P.M.; Ather, S.; Silva, C.F.; Han, D.; Heussel, C.P.; Hickes, W.; Kauczor, H.-U.; Novotny, P.; Peschl, H. Lung cancer prediction by Deep Learning to identify benign lung nodules. Lung Cancer 2021, 154, 1–4. [Google Scholar] [CrossRef]
  128. Nilashi, M.; Ahmadi, H.; Manaf, A.A.; Rashid, T.A.; Samad, S.; Shahmoradi, L.; Aljojo, N.; Akbari, E. Coronary heart disease diagnosis through self-organizing map and fuzzy support vector machine with incremental updates. Int. J. Fuzzy Syst. 2020, 22, 1376–1388. [Google Scholar] [CrossRef]
  129. Zhou, H.; Wang, T.; Zhou, F.; Liu, Y.; Zhao, W.; Wang, X.; Chen, H.; Cui, Y. Ambient air pollution and daily hospital admissions for respiratory disease in children in Guiyang, China. Front. Pediatrics 2019, 7, 400. [Google Scholar] [CrossRef] [PubMed]
  130. Park, Y.; Lee, C.; Jung, J.Y. Digital Healthcare for Airway Diseases from Personal Environmental Exposure. Yonsei Med. J. 2022, 63, S1–S13. [Google Scholar] [CrossRef]
  131. Goto, T.; Camargo, C.A., Jr.; Faridi, M.K.; Yun, B.J.; Hasegawa, K. Machine learning approaches for predicting disposition of asthma and COPD exacerbations in the ED. Am. J. Emerg. Med. 2018, 36, 1650–1654. [Google Scholar] [CrossRef] [PubMed]
  132. Moustris, K.P.; Douros, K.; Nastos, P.T.; Larissi, I.K.; Anthracopoulos, M.B.; Paliatsos, A.G.; Priftis, K.N. Seven-days-ahead forecasting of childhood asthma admissions using artificial neural networks in Athens, Greece. Int. J. Environ. Health Res. 2012, 22, 93–104. [Google Scholar] [CrossRef] [PubMed]
  133. Xiang, Y.; Ji, H.; Zhou, Y.; Li, F.; Du, J.; Rasmy, L.; Wu, S.; Zheng, W.J.; Xu, H.; Zhi, D. Asthma exacerbation prediction and risk factor analysis based on a time-sensitive, attentive neural network: Retrospective cohort study. J. Med. Internet Res. 2020, 22, e16981. [Google Scholar] [CrossRef]
  134. Guerra, B.; Haile, S.R.; Lamprecht, B.; Ramírez, A.S.; Martinez-Camblor, P.; Kaiser, B.; Alfageme, I.; Almagro, P.; Casanova, C.; Esteban-González, C. Large-scale external validation and comparison of prognostic models: An application to chronic obstructive pulmonary disease. BMC Med. 2018, 16, 33. [Google Scholar] [CrossRef] [PubMed]
  135. Polezer, G.; Tadano, Y.S.; Siqueira, H.V.; Godoi, A.F.; Yamamoto, C.I.; de André, P.A.; Pauliquevis, T.; de Fatima Andrade, M.; Oliveira, A.; Saldiva, P.H. Assessing the impact of PM2.5 on respiratory disease using artificial neural networks. Environ. Pollut. 2018, 235, 394–403. [Google Scholar] [CrossRef] [PubMed]
  136. Topalovic, M.; Laval, S.; Aerts, J.-M.; Troosters, T.; Decramer, M.; Janssens, W.; Belgian Pulmonary Function Study investigators. Automated interpretation of pulmonary function tests in adults with respiratory complaints. Respiration 2017, 93, 170–178. [Google Scholar] [CrossRef]
  137. Mekov, E.; Miravitlles, M.; Petkov, R. Artificial intelligence and machine learning in respiratory medicine. Expert Rev. Respir. Med. 2020, 14, 559–564. [Google Scholar] [CrossRef]
  138. Akif, M.; Asumadu, S. Science of the total environment investigation of environmental Kuznets curve for ecological footprint: The role of energy and financial development. Sci. Total Environ. 2019, 650, 2483–2489. [Google Scholar]
  139. Maiwada, N.A.; Abdulkarim, H.; Usman, A.; Abdullahi, S. The role of renewable energy in mitigating deforestation and climate change in Nigeria. J. Nat. Sci. Res. 2014, 4, 2225. [Google Scholar]
  140. Shahid, S. Rainfall variability and the trends of wet and dry periods in Bangladesh. Int. J. Climatol. 2010, 30, 2299–2313. [Google Scholar] [CrossRef]
  141. Wernberg, T.; Smale, D.A.; Tuya, F.; Thomsen, M.S.; Langlois, T.J.; De Bettignies, T.; Bennett, S.; Rousseaux, C.S. An extreme climatic event alters marine ecosystem structure in a global biodiversity hotspot. Nat. Clim. Chang. 2013, 3, 78–82. [Google Scholar] [CrossRef]
  142. Gao, M.; Wang, B.; Yang, J.; Dong, W. Are peak summer sultry heat wave days over the Yangtze–Huaihe River basin predictable? J. Clim. 2018, 31, 2185–2196. [Google Scholar] [CrossRef]
  143. Yue, L.; Juying, J.; Bingzhe, T.; Binting, C.; Hang, L. Response of runoff and soil erosion to erosive rainstorm events and vegetation restoration on abandoned slope farmland in the Loess Plateau region, China. J. Hydrol. 2020, 584, 124694. [Google Scholar] [CrossRef]
  144. Wang, B.; Xiang, B.; Li, J.; Webster, P.J.; Rajeevan, M.N.; Liu, J.; Ha, K.-J. Rethinking Indian monsoon rainfall prediction in the context of recent global warming. Nat. Commun. 2015, 6, 7154. [Google Scholar] [CrossRef] [PubMed]
  145. Ali, M.; Prasad, R. Significant wave height forecasting via an extreme learning machine model integrated with improved complete ensemble empirical mode decomposition. Renew. Sustain. Energy Rev. 2019, 104, 281–295. [Google Scholar] [CrossRef]
  146. Jacox, M.G.; Tommasi, D.; Alexander, M.A.; Hervieux, G.; Stock, C.A. Predicting the evolution of the 2014–2016 California Current System marine heatwave from an ensemble of coupled global climate forecasts. Front. Mar. Sci. 2019, 6, 497. [Google Scholar] [CrossRef]
  147. Xiao, C.; Chen, N.; Hu, C.; Wang, K.; Gong, J.; Chen, Z. Short and mid-term sea surface temperature prediction using time-series satellite data and LSTM-AdaBoost combination approach. Remote Sens. Environ. 2019, 233, 111358. [Google Scholar] [CrossRef]
  148. Wolff, S.; O’Donncha, F.; Chen, B. Statistical and machine learning ensemble modelling to forecast sea surface temperature. J. Mar. Syst. 2020, 208, 103347. [Google Scholar] [CrossRef]
  149. Khan, N.; Shahid, S.; Ismail, T.B.; Behlil, F. Prediction of heat waves over Pakistan using support vector machine algorithm in the context of climate change. Stoch. Environ. Res. Risk Assess. 2021, 35, 1335–1353. [Google Scholar] [CrossRef]
  150. Benthuysen, J.A.; Smith, G.A.; Spillman, C.M.; Steinberg, C.R. Subseasonal prediction of the 2020 Great Barrier Reef and Coral Sea marine heatwave. Environ. Res. Lett. 2021, 16, 124050. [Google Scholar] [CrossRef]
  151. Spillman, C.M.; Smith, G.A.; Hobday, A.J.; Hartog, J.R. Onset and decline rates of marine heatwaves: Global trends, seasonal forecasts and marine management. Front. Clim. 2021. [Google Scholar] [CrossRef]
  152. Saxena, N. Efficient downscaling of satellite oceanographic data with convolutional neural networks. SIGSPATIAL Spec. 2021, 12, 46–47. [Google Scholar] [CrossRef]
Figure 1. Potential Relationship between Man-made Pollutants, Environmental Impacts and Health Impacts.
Sustainability 14 09951 g001
Figure 2. Relationship between Artificial Intelligence, Machine Learning and Deep Learning.
Sustainability 14 09951 g002
Figure 3. Major Air Pollutants and their Sources and Effects.
Sustainability 14 09951 g003
Figure 4. Different Methods of Air Pollution Forecasting.
Sustainability 14 09951 g004
Table 1. Various Hybrid AI models for Environmental pollution forecasting.
S. NoHybrid AI ModelsPollutant
Forecasting
Ref.
1Ensemble empirical mode decomposition—Least squares support vector machine (EEMD-LSSVM)PM2.5[28]
2Principal component analysis—Cuckoo search—Least squares support vector machine (PCA-CS-LSSVM)PM2.5[29]
3Wavelet packet decomposition—Particle swarm optimization—Backpropagation neural network—Adaptive Boosting (WPD-PSO-BNN-Adaboost)PM2.5[30]
4Particle swarm optimization—Extreme learning machine (PSO-ELM)CO2[31]
5Genetic algorithm—Random forest—Backpropagation neural network (GA-RF-BPNN)PM10[32]
6Complementary empirical mode decomposition—Particle swarm optimization and gravitational search algorithm—Support vector regression—Generalized regression neural network (CEMD-PSOGSA-SVR-GRNN)PM2.5[33]
7Wavelet packet decomposition—complete ensemble empirical mode decomposition with adaptive noise—Least squares support vector regression—chaotic particle swarm optimization method and gravitation search algorithm (WPD-CEEMD-LSSVR-CPSWOM-GSA)PM2.5[34]
9Variational mode decomposition—Sample entropy—Least squares support vector machine (VMD-SE-LSSVM)AQI[35]
10Complementary empirical ensemble mode decomposition—Cuckoo search—Grey wolf optimizer- support vector machine (CEEMD-CS-GWO-SVM)NO2& SO2[36]
11Wavelet packet decomposition (WPD)—Bidirectional Long Short-Term Memory (Bi-LSTM)—Stacked auto encoder
Non-dominated Sorting Genetic Algorithm II (NSGA-II).
PM2.5[37]
Table 2. Various AI methods and Machine learning algorithms and its performance evaluation criteria for air pollution forecasting.
S.NoYearCountry/
Study Area
Input Parameters for AI Forecasting ModelsProposed AI
Models
Output Parameters of AI ModelsComparative ModelsAir Pollutants ExaminedData ResolutionsPerformance Evaluation CriteriaMain ConclusionRef.
R2MAERMSEMAPE (%)
12017Xian, ChinaHistorical concentration of PM2.5, NO2., SO2,CO, O3, PM2.5 & PM10MCSDE-
CEEMD-ENN
NO2, SO2 PM10 PM2.5, CO, O3,SVM, ARIMANO2
SO2
Daily 1.87 (SO2)
1.91(NO2)
The Proposed hybrid model showed better performance and accuracy for NO2 and SO2 forecasting. For NO2, the MAPE mean of Model A approximately equals to 7.8%, while the maximum MAPE value of the single-optimization model approximately equals to 10.8%, and the difference is almost 3 percentage points. Obviously, the double-optimization model has better prediction accuracy than other models.[72]
22017MalaysiaSpatial and temporal features and Pollutant dataMLPNNPM10 ConcentrationsANNPM10Hourly0.71 11.615.13Based on the values ofMAPE, RMSE, andR2 error indexes, it is very clear that the proposed model is suitable for PM10 concentration forecasting specifically.[73]
32017Beijing & Shanghai, ChinaRoutine AQI SeriesCEEMD-VMD-DE-ELMAir Quality IndexGRNN
VMD-ELM
Daily 2.653.66
(Beijing)
3.27
(Shanghai)
The ensemble-based Hybrid model showed better accuracy in predicting the daily air quality index.
A novel two-phase decomposition technique is proposed for the AQI series decomposition.The ELM model optimized by DE algorithm has a strong function approximation ability.
[74]
42018Guangzhou, ChinaHistorical pollutant concentration of NO2, SO2, PM10, PM2.5, CO, O3ICEEMDAN-ICA-ELMNO2., SO2, CO, O3, PM2.5 & PM10CEEMD-VMD-ICA-ELMPM10, NO2Daily0.915 (PM10)
0.937 (NO2)
8.1673
(PM10)
4.6579(NO2)
According to the author, the proposed hybrid is reliable for NO2 and PM10 forecasting; moreover, a hybrid model composed of the theory of “decomposition and ensemble”, an extreme learning machine and an advanced heuristic algorithm was developed for pollution contaminant prediction; it provides deterministic and interval forecasting for tackling the uncertainty of future air quality.[75]
52018ChinaVehicle passing and emission dataMLPNNCO, NO2,
and CO2
MLRCO, NO2,
and CO2
Short-term0.781 0.0922.58ANN techniques showed better stability and accuracy than MLR method; this approach does not require very exhaustive information about air pollutants, and it has the ability to allow the nonlinear relationships between very different predictor variables.[76]
62018Seoul, South KoreaOutdoor Pollutant concentrationMLPNNPM10 Level PM10Hourly0.816..5624.89 MLPNN algorithm is a best method to forecast hourly PM10 concentrations in subway stations.
ANN model showed a high correlation between the predicted and actual measured values and it was able to predict 67∼80% of PM at 6 subway station. In addition, we found that platform shape and depth influenced the model performance.
[45]
72019Beijing, ChinaPollutant data and temporal featuresCNN-LSTMNNPM2.5 concentrationsLSTMPM2.5Short-term & Hourly (1 h–24 h) 12.0810.68The proposed model has better performance than single LSTM method for PM2.5 concentration forecasting.
The present model achieves more accurate and stable air quality predicting different spatiotemporal scales.
[55]
82019TaiwanMeteorological data and pollutant dataSVMConcentrations of PM2.5 PM2.5Short-term0.8652 0.1322 SVM showed somewhat accuracy in PM2.5 forecasting but the author doesn’t compare with ANN models.
MM-SVM model overcomes the instabilities of spatiotemporal forecasting.
MM-SVM identifies heterogeneities in air pollutant-generating mechanisms and seasons.
The proposed model increases multi-step-ahead PM2.5 forecasts accuracy and applicability.
[77]
92017ChinaThe pollutant concentration data PCA-CS-LSSVM
Hybrid model
PM2.5 concentrationsSingle
GRNN
LSSVM,
PM2.5Daily 18.8414.4712.56The proposed model suitable for PM2.5 forecasting; it exhibits better performance over single method.
PCA is adopted to extract original features and reduce dimension for input selection.
[29]
102017ChinaDaily AQI SeriesNovel Hybrid model CEEMD-VMD-DE-ELMAQI ForecastingVMD-DE-ELM;
CEEMD-VMD-ELM
VMD-ELM;
CEEMD-ELM, CEEMD-DE-ELM
Air Quality IndexWeekly 2.533.275.09It has proven to be a highly promising method for forecasting other complicated time series, such as wind speed andPM2.5 concentration level.
The complementary ensemble empirical mode decomposition (CEEMD) is utilized to decompose the AQI series into a set of intrinsic mode functions (IMFs) with different frequencies.
[74]
112017ChinaNO2, SO2, CO, O3, PM2.5, PM10CEEMD-BBODE-LSSVMNO2, SO2, CO, O3, PM2.5, PM10LSSVM, EEMD-LSSVM, CEEMD-LSSVMSO2, NO2, CO, O3, PM10, PM2.5Hourly & DailyPM2.5
0.9012(July)
0.997(August)
0.996(September)
0.996(October)
PM2.5
0.8377(July)
0.8584(August)
0.5329(September)
0.9656(October)
PM2.5
1.5264(July)
1.2814(August)
0.7836(September)
1.6485(October)
PM2.5
3.86(July)
3.0(August)
2.55(September)
3.87(October)
Potential AI hybrid model for air quality early warning system.
The results revealed that proposed Hybrid models performs better than other comparison models.
Decomposed the data into the wavelet coefficients and used different NN to individual prediction, then combined the few predictors in the ensemble.
[78]
122017Tianjin & Shangha, Chinahourly PM2.5, PM10 and SO2 data collected from Tianjin and Shanghai in ChinaNovel Hybrid Model- CEEMD-GWOPM2.5, PM10 and SO2CEEMD-PSO-ERNN, EEMD-GWO-ERNN.PM2.5, PM10 and SO2Hourly PM2.5
2.7154
(Tianjin)
1.6241
(Shanghai)
PM2.5
5.8808
(Tianjin)
2.6888
(Shanghai)
PM2.5
6.1993
(Tianjin)
3.5593
(Shanghai)
Hybrid model used in this study, more reliable in forecasting particles and gases in urban areas.
Fuzzy synthetic evaluation is used to determine air quality and primary pollutants.
Proposed early warning system is great suitable for monitoring air quality.
[79]
132017Xi’an and Jinan, ChinaPollution concentrations of PM2.5, PM10, O3, CO, NO2, SO2MCSDE-CEEMD-ENN Hybrid ModelPM2.5, PM10, O3, CO, NO2, SO2 concentrationsGRNN,
ENN
PM2.5, PM10, O3, CO, NO2, SO2Daily & Weekly 2.42 4.87The proposed model showed best accuracy and stability.
In the air quality assessment module, fuzzy comprehensive evaluation is used to determine the main pollutants and evaluate the degree of air pollution more scientifically.
New air quality monitoring and early warning system, including an assessment module and forecasting module.
[72]
142018GreeceData from real urban air quality monitoring network in Athens, GreeceFeed Forward Neural Network (FFNN) modelO3, CO, NO2, SO2, NOANN compared with MLRO3, CO, NO2, SO2, NOShort-termO3
0.41(MLR)
0.44
(FFNN)
O3
12.57(MLR)
11.88(FFNN)
O3
16.6(MLR)
16.4(FFNN)
ANN is superior than MLR
Enhanced FFNN model with RM and GM to assess the possible correlation between different input variables for improving forecast accuracy.
[41]
152018TurkeyTime series of Weekly SO2 concentrationNew Fuzzy Time Series (FTS) model based on the Fuzzy K-Medoid (FKM)
clustering algorithm
SO2Gustafson-Kessel (GKF) clustering algorithm & FTS models based fuzzy c-means (FCMF)SO2Weekly 11.01–(FKMF);
43.24–(GKF);
57.57–(FCMF)
The suggested approach produces the most accurate predicting results, particularly for temporal series.The potential superiority of the proposed model is to be a robust technique for outliers and abnormal observations.[58]
162018Brunei DarussalamMeteorological data and Daily PM10 concentration dataHybrid model
(RF-GA-BPNN)
PM10 concentration in Brunei, Southeast AsiaBPNNPM10Daily 2.62974.0057 Suitable forecasts for PM10 exceedances during haze episodes.
The models which considered the geographic factor performed better than the models which unconsidered.
[32]
172018Shenyang and Chengdu, China,Time series of PM2.5 concentration dataSD-LSSVR-CPSOGSA method (Hybrid Model)PM2.5 concentrationCEEMD-LSSVR-PSOGSA;
CEEMD-LSSVR-CPSOGSA,
WPT-LSSVR-PSOGSA,
PM2.5Hourly 5.1060
(Shenyang)
3.7760
(Chengdu)
5.3553
(Shenyang)
5.5217
(Chengdu)
According to authors, the new method is powerful techniques for PM2.5 concentration level forecasting; moreover, the forecasts of the MM-SVM are found better consistent with observations than those of any single S-SVM in both training and testing stages[34]
182018ChinaPollutants concentration data from major citiesHybrid model
(ICEEMDAN-ICA-ELM)
NO2, CO, PM2.5,PM10, O3 concentrationsARIMA, GRNN,
PSO-ELM, ICA-ELM,
EMD-ICA-ELM
CO,
NO2,
SO2,
PM,
O3
Daily92.3657-
[EMD-
ICA-ELM]
97.0030-
[Proposed Model]
4.3940-[EMD-ICA-ELM]
2.6340-
[Proposed Model]
5.7511-
[EMD-ICA-ELM]
3.590-
[Proposed Model]
14.2788
[EMD-ICA-ELM]
7.9725-
[Proposed Model]
Based on the results, the proposed hybrid model shows better performance and accuracy than other benchmark models.
Provided a method of analyzing the change of pollutants’ concentration in the condition of lacking practical pollution data.
[75]
192018Beijing, ChinaPM2.5 concentration data from Beijing stationWavelet Neural Network Ensemble MethodPM2.5BPNN,
RBFNN,
Elman Model,
T-S Fuzzy
PM2.5Lomg-term0.89(24 h)
0.74(48 h)
0.64(72 h)
47.9 (24 h)
52.4 (48 h)
76.2 (72 h)
The proposed forecast method shows better performance than other benchmarking models.
Suitable for forecast PM2.5 concentration but effect of WNN model decreased by extension of time.Using wavelet transform to realize feature extraction and characterization of air pollutants.
[80]
202018Fuzhou,
China
Pollutants data and temporal data from 2014–2016ARIMAPM2.5, PM10, SO2, NO2 PM2.5Daily 56.1272.94 The ARIMA model is well recognized as a sophisticated and frequently applied statistical technique for evaluating and forecasting time series data.
The ARIMA results showed that PM2.5 concentrations experienced seasonal fluctuations over the two years, which were higher in the cold periods and lower in the corresponding warm periods, ranging from 23 to 52 μg/m3 and from 19 to 31 μg/m3, respectively.
[24]
212018USATemporal features and weather conditionMulti-Tasking Learning AlgorithmO3, PM2.5, SO2Standard Frobenius norm regularization, nuclear norm regularizationPM2.5, SO2Hourly0.3365 85.94 The results showed proposed Hybrid model has better performance over other comparison models. The proposed parameter-reducing formulations and consecutive-hour-related regularizations achieve better performance than existing standard regression models and existing regularizations[52]
222018ChinaSO2, O3,
NO2, CO & PM10
CEEMD-PSOGSA-SVR-GRNN
Hybrid model
PM2.5CEEMD-GSA-SVR;
CEEMD-GWO-SVR
PSOGSA-SVR;
EEMD-PSOGSA-SVR;
PM2.5Daily 3.0997
(Chongqing)
3.0148
(Harbin)
3.9374
(Chongqing)
4.0263
(Harbin)
8.63
(Chongqing)
9.71
(Harbin)
The results showed proposed Hybrid model has better performance over other comparison models.
The proposed theory can be used to effectively forecast other pollutions.
Proposed
CEEMD-PSOGSA-SVR-GRNN model is effective for PM2.5 forecasting with different characteristics of climate, terrain and pollution sources.
[33]
232019Middle Eastern CountriesConsumption of fossil fuels, including coal, oil and natural gasGMDH ANN ModelCO2 CO2Short-term0.9998 2.3Suitable for CO2 emissions forecasting.
The average absolute relative error and the R-squared values of the GMDH model are 2.3% and 0.9998, respectively; these values demonstrate the precision of the model in forecasting emissions of CO2.
[81]
242019Chongqing,
China
mean temperature, relative humidity, wind speed &precipitationDL-SSAE modelPM2.5 concentrationSL-FFNN,PM2.5Hourly0.92224.4329.85 Good model for hourly PM2.5 concentration forecasting.
Kendall correlation coefficient method is employed to search inherent relationships between PM2.5 concentrations and meteorological parameters within 1-h ahead for each seasonal time series.
The models which considered the geographic factor performed better than the models which unconsidered.
[82]
252019China77 meteorological variables and PM2.5 concentrations and in Beijing.EEMD-LSTM Hybrid ModelPM2.5
concentration
Single LSTM
FFNN
PM2.5Hourly 12.077
(Nangzhanguan)
13.938
(Shunyixincheng)
19.604
(Nangzhanguan)
16.929
(Shunyixincheng)
According to author, the proposed model had better performance in hourly PM2.5 concentration forecasting.
The proposed model has mean absolute percentage error (19.604% and 16.929%), root mean square error (12.077 μg/ m3 and 13.983 μg/ m3), and correlation coefficient criteria (0.994 and 0.991) respectively.
[28]
262019China (Beijing,
Chengdu,
Guangzhou,
Shanghai,
Taiyuan)
Time series of PM2.5 concentrationsHybrid models (Wavelet-ANN, Wavelet-ARIMA and
Wavelet-SVM)
Short-term
PM2.5
Pollutant level
ARIMA,
ANN,
SVM
PM2.5Short-term(Beijing)
0.8768
0.9199
0.8570
(Beijing)
24.20
19.82
27.02
(Beijing)
32.87
26.43
36.11
Hybrid models (Wavelet-ANN, Wavelet-ARIMA & Wavelet-SVM) can forecast short-term PM2.5 concentrations in China.
In particular, Wavelet-ARIMA can more accurately capture the mutational points of PM2.5 concentrations, which can provide effective information support for generating warnings about atmospheric pollution.
[83]
272019ChinaTemporal values and PM2.5 valuesDAQFF
(Deep Air Quality Forecasting Framework) model
PM2.5 concentrationARIMA,
SVR,
RNN,
CNN
PM2.5Hourly 25.01(1–6 h)
61.75
(25–48 h)
46.49(1–6h )
80.061
(25–48 h)
The proposed model showed lower RMSE values and exhibited good performance than others.
Proposed novel deep learning model for air quality (mainly PM2.5) forecasting, which learns the spatial-temporal correlation features and interdependence of multivariate air quality related time series data by hybrid deep learning architecture.
[64]
282019PolandTraffic flow, Temperature, Relative humidityRF- based partition modelNO2 concentrationsClassic
RF model
NO2Hourly & Daily0.82 57.5 The traffic flow has greater impact on NO2 in low concentration ranges.
A new RF-based partition model improves the description of NO2 concentrations.
The value of R2 is increased from 0.60 to 0.82
[84]
292019China
(Shanghai, Chongqing, Shenyang and Kunming)
Time series of PM2.5 concentrations datasetsWPD-PSO-BP-Adaboost
Hybrid model
PM2.5
concentrations
CEEMDAN-ICA-ELM;
EEMD-GRNN
PM2.5Hourly0.86Case I-
13.98
Case II-
10.13
Case I
20.18
Case II-
15.98
Case I-
23.75
Case II-
15.32
Among the all models, the developed Hybrid model performs better in multi-step forecasting.
The PSO and Adaboost algorithm is adopted to optimize the BPNN.
The WPD is adopted to decompose the raw PM2.5 data into high-frequency subseries and low-frequency subseries.
[30]
302019Jing-Jin-Ji region of ChinaTime series
Of PM2.5, PM10, NO2, SO2, CO and O3
Novel
Hybird(ICEEMDAN-WOA-ELM-FCE)model
PM2.5
concentration
ARMA, GRNN, ELM, GA-ELM, WOA-ELM and EEMD-WOA-ELMSix Major PollutantsDaily (Tianjin)
0.0613
(Shijiazhuang)
0.0469
(Tianjin)
0.0834
(Shijiazhuang)
0.0606
(Tianjin)
6.4375
(Shijiazhuang)
5.8451
The results showed proposed Hybrid model has better performance over other comparison models.
The proposed system is believed to play an important role in air pollution control.
[38]
312019ColombiaPollutant concentrations, temporal featuresSVR-PSO modelNO2, SO2, CO, O3, PM10, and PM2.5.ANNNO2, SO2, CO, O3, PM10
PM2.5
Yearly The input datasets of temporal features enhance the performance of suggested model.
The developed forecasting system, performance robustly throughout the year even during rainy or dry seasons.
[71]
322019ChinaHistorical data and meteorological dataHybrid Model
GCN-LSTM
PM2.5 forecastingMLR,
FNN,
LSTM
PM2.5Hourly0.72 for
72 h prediction
115 for
72 h prediction
Considering spatiotemporal dependency can improve model performance.
The proposed model showed better performance especially for long-term prediction.
[53]
332019Central ChinaAir pollutants time series, temperature, meteorological factorsModel-C
(CEEMD-SVR-CS-GWO)
NO2 and SO2
concentrations
CEEMD-GWO-GWO-SVR;
CEEMD-GWO-CS-SVR;
CEEMD-CS-CS-SVR;
NO2,
SO2
Short term & Hourly 2.17(NO2)6.99(NO2)5.78(SO2)
7.87(NO2)
According to author, the developed hybrid model is reliable and usefulfor NO2 and SO2 forecasting.
Specially, the hybrid model CEEMD-CS-GWO-SVR, the low-frequency data using the SVR-CS and the high frequency data using SVR-GWO, is the best model for the prediction of NO2 and SO2 for the cities in Central China.
[36]
342020ChinaPollutants concentration time seriesA novel Hybrid AI modelPM2.5 level PM2.5Daily The proposed model showed better performance in Daily PM2.5 concentration forecasting.The BiLSTM algorithm is designed as the base forecasting model for multi-resolution data.
The bivariate kernel density estimation algorithm is utilized for the probabilistic prediction.
[37]
352020DelhiMeteorological and pollutant parameters (2016–2018)SVM and ANN machine learning approachesPM2.5
concentration
PM2.5Short-term0.856-
(ANN),
0.730-
(SVM)
ANN shows better prediction accuracy than SVM for PM2.5 prediction.
The simulated PM2.5 values and the target data showed the best fit with a high correlation coefficient (R) value of 0.856.
[85]
362020Beijing,
China
Meteorological andHistoric Air quality data from 384 monitoring station, ChinaCNN-LSTM MLP,
LSTM
PM2.5Daily 3.0073.8550.027Mutual information estimator and CNN-LSTM model is proposed for predict the next day’s daily average PM2.5 concentration in Beijing City.
CNN-LSTM model inputs the STFV(spatiotemporal feature vector) as an inlet and predicts PM2.5 concentration through deep learning.
[86]
372020Tehran, IranPollutant data time series collected from monitoring system in TehranANFISNO2, O3, SO2, and COSER modelNO2, O3, SO2, and COShort-term & Hourly0.8686, 0.8011, 0.8350 and 0.7640 ANFIS has been shown to be more accurate in forecasting air quality.
Proposed interval prediction method and ANF to address the uncertainty of PMs according to the pollutant emission distribution.
[87]
382019Taipei City of Taiwanmeteorological and air quality factors (2010–2016)MM-SVM Single-output SVM modelPM2.5Hourly The proposed model enhance accuracy of PM2.5 prediction.
MM-SVM identifies heterogeneities in air pollutant generating mechanisms and seasons.
MM-SVM increas multi-step-ahead PM2.5 forecasts accuracy and applicability.
[77]
392020Chengdu,
China
Temporal characteristics
(2014–2017)
Continuous wavelet transform AlgorithmsTemporal features and PM2.5 concentration PM2.5Hourly 0.88760.2153 Wavelet transform is powerful to capture the temporal features of PM2.5 concentration at different scales.[26]
402020Xi’an and Lanzhou, ChinaPast 3 days’ API (Air Pollution Index)WANNAir Pollution IndexANNAir Pollution IndexNext daysR = 0.8906 for Lanzhou
R = 0.8846 for Xi’an
Bayesian regularization was applied as a training algorithm, the WANN and ANN models accurately reproduced the APIs in both Xi’an and Lanzhou, although the WANN model (R = 0.8846 for Xi’an and R = 0.8906 for Lanzhou) performed better than the ANN (R = 0.8037 for Xi’an and R = 0.7742 for Lanzhou) during the forecasting stage.[47]
412021TamilNadu
India
Meteorological parameters
and historical pollutant
concentration from last 5 years
DL-LSTMPM2.5, PM10, NO2, SO2, CO, O3.ANN,
SMR
(Statistical
Multilevel
Regression),
Neuro-Fuzzy
CO,
SO2,
NOx,
O3
24 h0.8951
0.8872
0.8602
0.8785
0.1256
0.1230
0.1123
0.1462
11.98
8.81
8.99
8.12
The concentration level of contaminants is predicted with the deviation of R2 in the range of 0.71–0.89. The results proved that DL-LSTM suits well when comparing to the ANN, Neuro-fuzzy and regression algorithms.[46]
422021Beijing, ChinaPM2.5 concentration data setsHybrid
CNN-LSTM
PM2.5 concentrationLSTM, Bi-LSTM, GRU, Bi-GRU, CNNPM2.5Hourly (24 h)0.979–7 day9.034–7 day16.625–7 day More accurate prediction than all listed traditional models. The Proposed model can effectively extract the temporal and spatial features of the data through CNN and LSTM, and it also has high accuracy and stability.[67]
432021Kolkatta,
India
Fuzzy binary relation based methodOverall AQI, O3, NO2,
PM2.5 and AQI
Hourly During the shift from post-monsoon to winter, NO2 and O3 impacted the total AQI over the severely polluted zone.
A fuzzy binary relation based approach is implemented to O3,
NO2 and PM2.5 and the overall air quality index (AQI).
[88]
442021Tianjin,
China
Historical pollutant concentration data seriesDWT-LSTM modelUrban
NO2 concentration in the Next day
SVR,
GRU,
LSTM
NO2Next day 4.33775.921111.5884More reliable for predicting NO2 concentration in urban areas.
The results showed that the MAPE increased from 11.58% to 13.54%, proving that the meteorological index correlated with the concentration of air pollutants.
[89]
452021Northern Xinjiang, ChinaMeteorological and air pollutant data in Jan & Aug from 2015–2019.BPANN and MLRDaily PM2.5 concentrationEvaluated by
Hold-out methods
and Leave-One-Out Cross-Validation method
PM2.5Daily0.87(January)
0.946(August)
Using multiple data division approaches to combine linear and nonlinear models would be an excellent tool for forecasting daily PM2.5 concentrations.
The correlation coefficient (R) for the validation set of the optimal combination model was about 0.87 in January and 0.946 in August.
[90]
462022ChinaTemperature, humidity, average wind speed and previous day PM2.5 concentration.GRNNPM2.5 concentration PM2.5Hourly GRNN method is very useful to predict 1-day-ahead PM2.5 concentration.
The annual mean PM2.5 concentration Beijing–Tianjin–Hebei, the Yangtze River Delta and the Pearl River Delta are 35.39 µg/m3, 53.72 µg/m3 and 78.54 µg/m3, respectively.
[63]
472022ChinaPM2.5 concentration datasets and clinical datasetsNew
Hybrid Model (TVF-EMD, HHO and ELM)
PM2.5 concentration and application in health issues. PM2.5Daily & Weekly Suitable for forecasting PM2.5 concentration and application in health issues due to PM2.5 pollutants.
Harris hawks optimization algorithm is introduced to tune the extreme learning machine model with high prediction accuracy.
[91]
482022UKTemporal features,
Temperature and Humidity
Ensemble ML method
[XGBoost-All,
RF-All]
Temporal PM2.5 concentrationsXGBoostPM2.5Short-term 1.572.1876 The performance of multivariate models outperforms than univariate model.
Two key findings emerged from this study: (1) meteorological
factors are useful for the forecasting of PM2.5 concentration, and
(2) ensemble models
(96-RF-ARIMA) generate a more reliable forecast of PM2.5 concentration when compared with standalone algorithms.
[92]
492022IranPM10 concentration time seriesW-ANFIS,
W-SVR
Short-term and long-term PM10 concentrationANN,
SVR
PM10Daily0.789 1.975 W-ANFIS has 99% accuracy and
W-SVR has 96% accuracy in daily PM10 forecasting than other model.
[93]
502022ChinaMeteorological data
and Long history of air pollutants data
Hybrid LSTM and ESWT MethodPM2.5 concentration PM2.5Hourly0.9903.4565.57911.61The proposed hybrid model is suitable for PM2.5 forecasting.
The proposed model has R2 and RMSE value of 0.990 and 5.579.
[50]
512022Italy Artificial Neural NetworkPM10, PM2.5, CO2ANNPM10, PM2.5,
CO2
PM10–0.4645
PM2.5–0.6646
CO2–0.8816
Developing an integrated model based on artificial neural network (ANN) in a school building.
The predicted RMSE value of 0.8816 for CO2, 0.4645 for PM10, and 0.6646 for PM2.5.
[94]
522022(Industry city) Sakarya, TurkeyPollution Data from air monitoring center of Minisitry of Environment and UrbanizationDeep learning based recurrent neural networkPM10, SO2 PM10, SO2 0.67–0.88 2.84–14.09 PM10 and SO2 pollution analysis and COVID-19 pandemic effects in Sakarya province.[95]
532022China Machine learning EmulationPM2.5, O3 PM2.5, O3Annualy The predicted value estimate that PM2.5 exposure was 47.4 μg/m3 and O3 exposure was 43.8 ppb, associated with 2,189,700 premature deaths per year, primarily from PM2.5 exposure (98%).[96]
542022Hongkong, China Transfer Learning-LSTM (TL-LSTM)O3 O3Daily (8 h)Increases 0.684 to 0.783 Reduced from 1.36 × 10⁻² to 1.05 × 10⁻². The coefficient of determination (R2) increased from 0.684 to 0.783 and the mean square error (MSE) reduced from 1.36 × 10⁻² to 1.05 × 10⁻².
Other photochemically active regions can use TL-LSTM to help with O3 pollution predictions and management.
[97]
552022IndiaReal-time measurements of indoor CO2, number of occupants, area per person, outdoor temperature, outer wind speed, relative humidity, and air quality index.Machine learning based CO2 predictionCO2ANN, SVM, DT, GPR, LR, EL, optimized GPR, optimized EL, optimized DT, optimized SVMCO2 0.98874 When it comes to prediction accuracy, the optimised GPR model outperforms the other chosen models. The study’s findings showed that the improved GPR model has the highest prediction accuracy for CO2 concentration, with values for RMSE, MAE, NS, and a20-index of 0.98874, 4.20068 ppm, 3.35098 ppm, 0.9817, and 1, respectively.[98]
Publisher’s Note: MDPI stays neutral with regard to jurisdictional claims in published maps and institutional affiliations.

