
Integrating Vulnerable Road User Safety Criteria into Transportation Asset Management to Prioritize Budget Allocation at the Network Level

Abstract
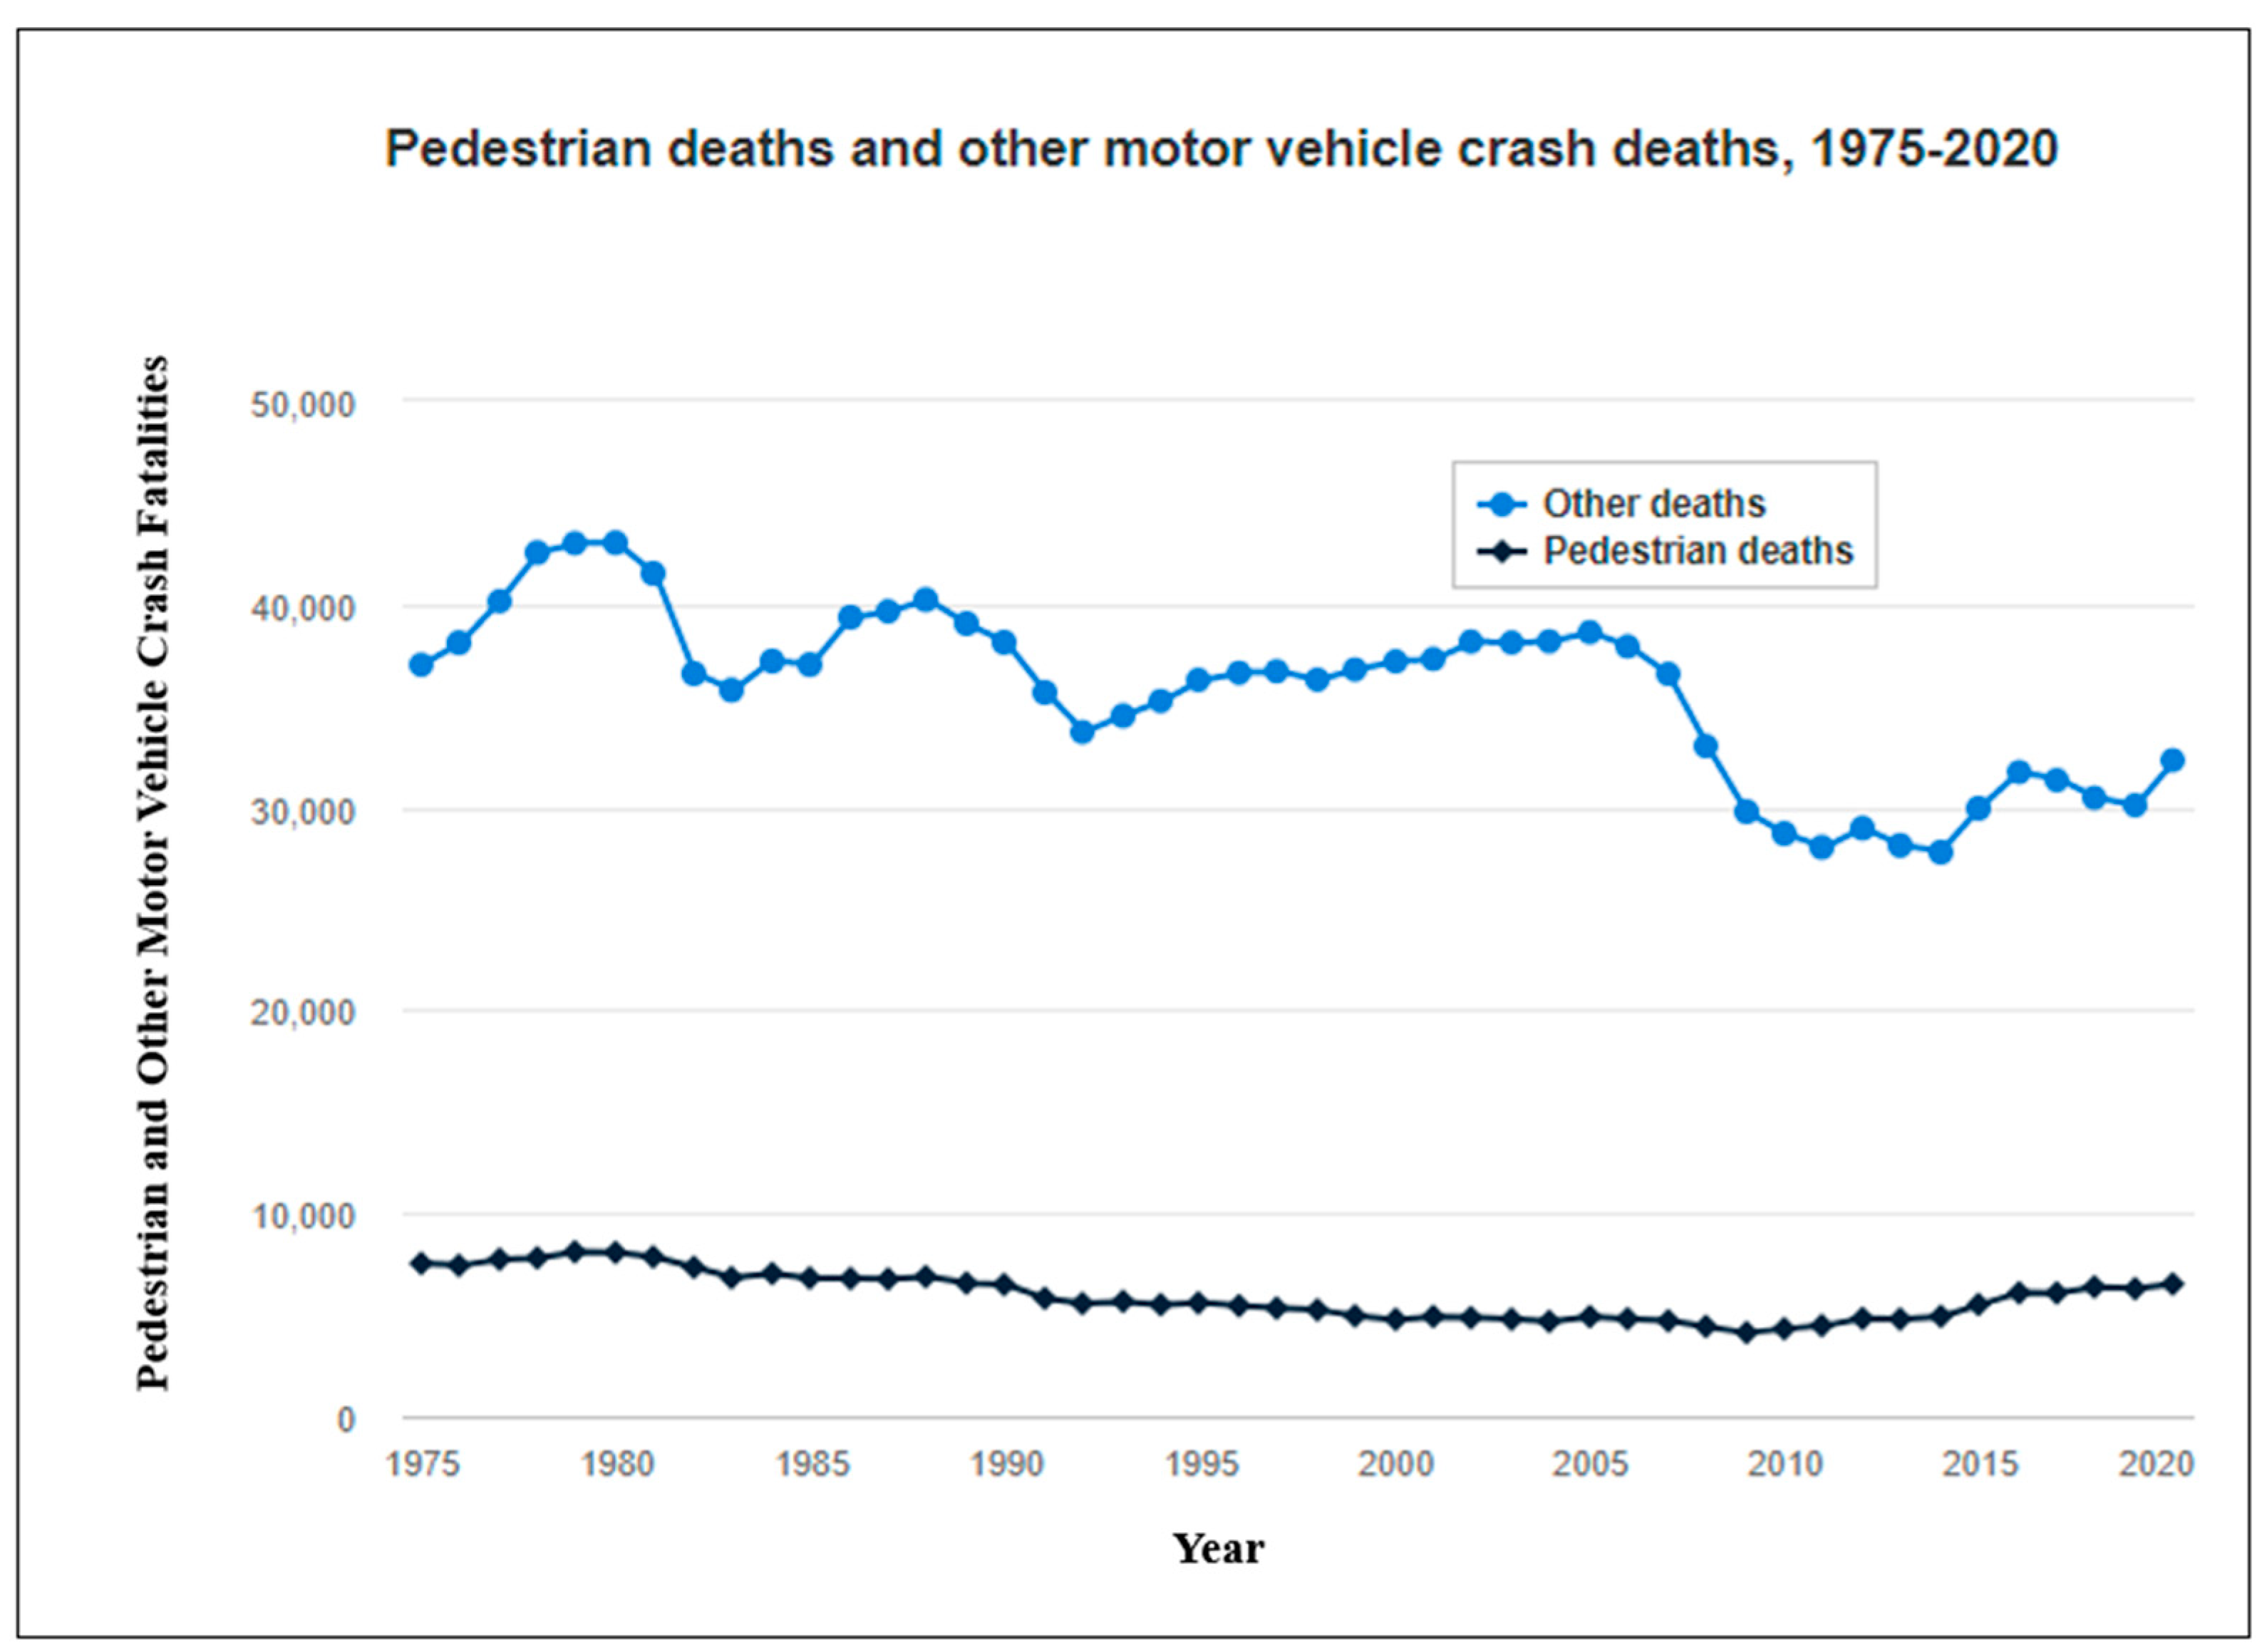
:1. Introduction
2. Literature Review
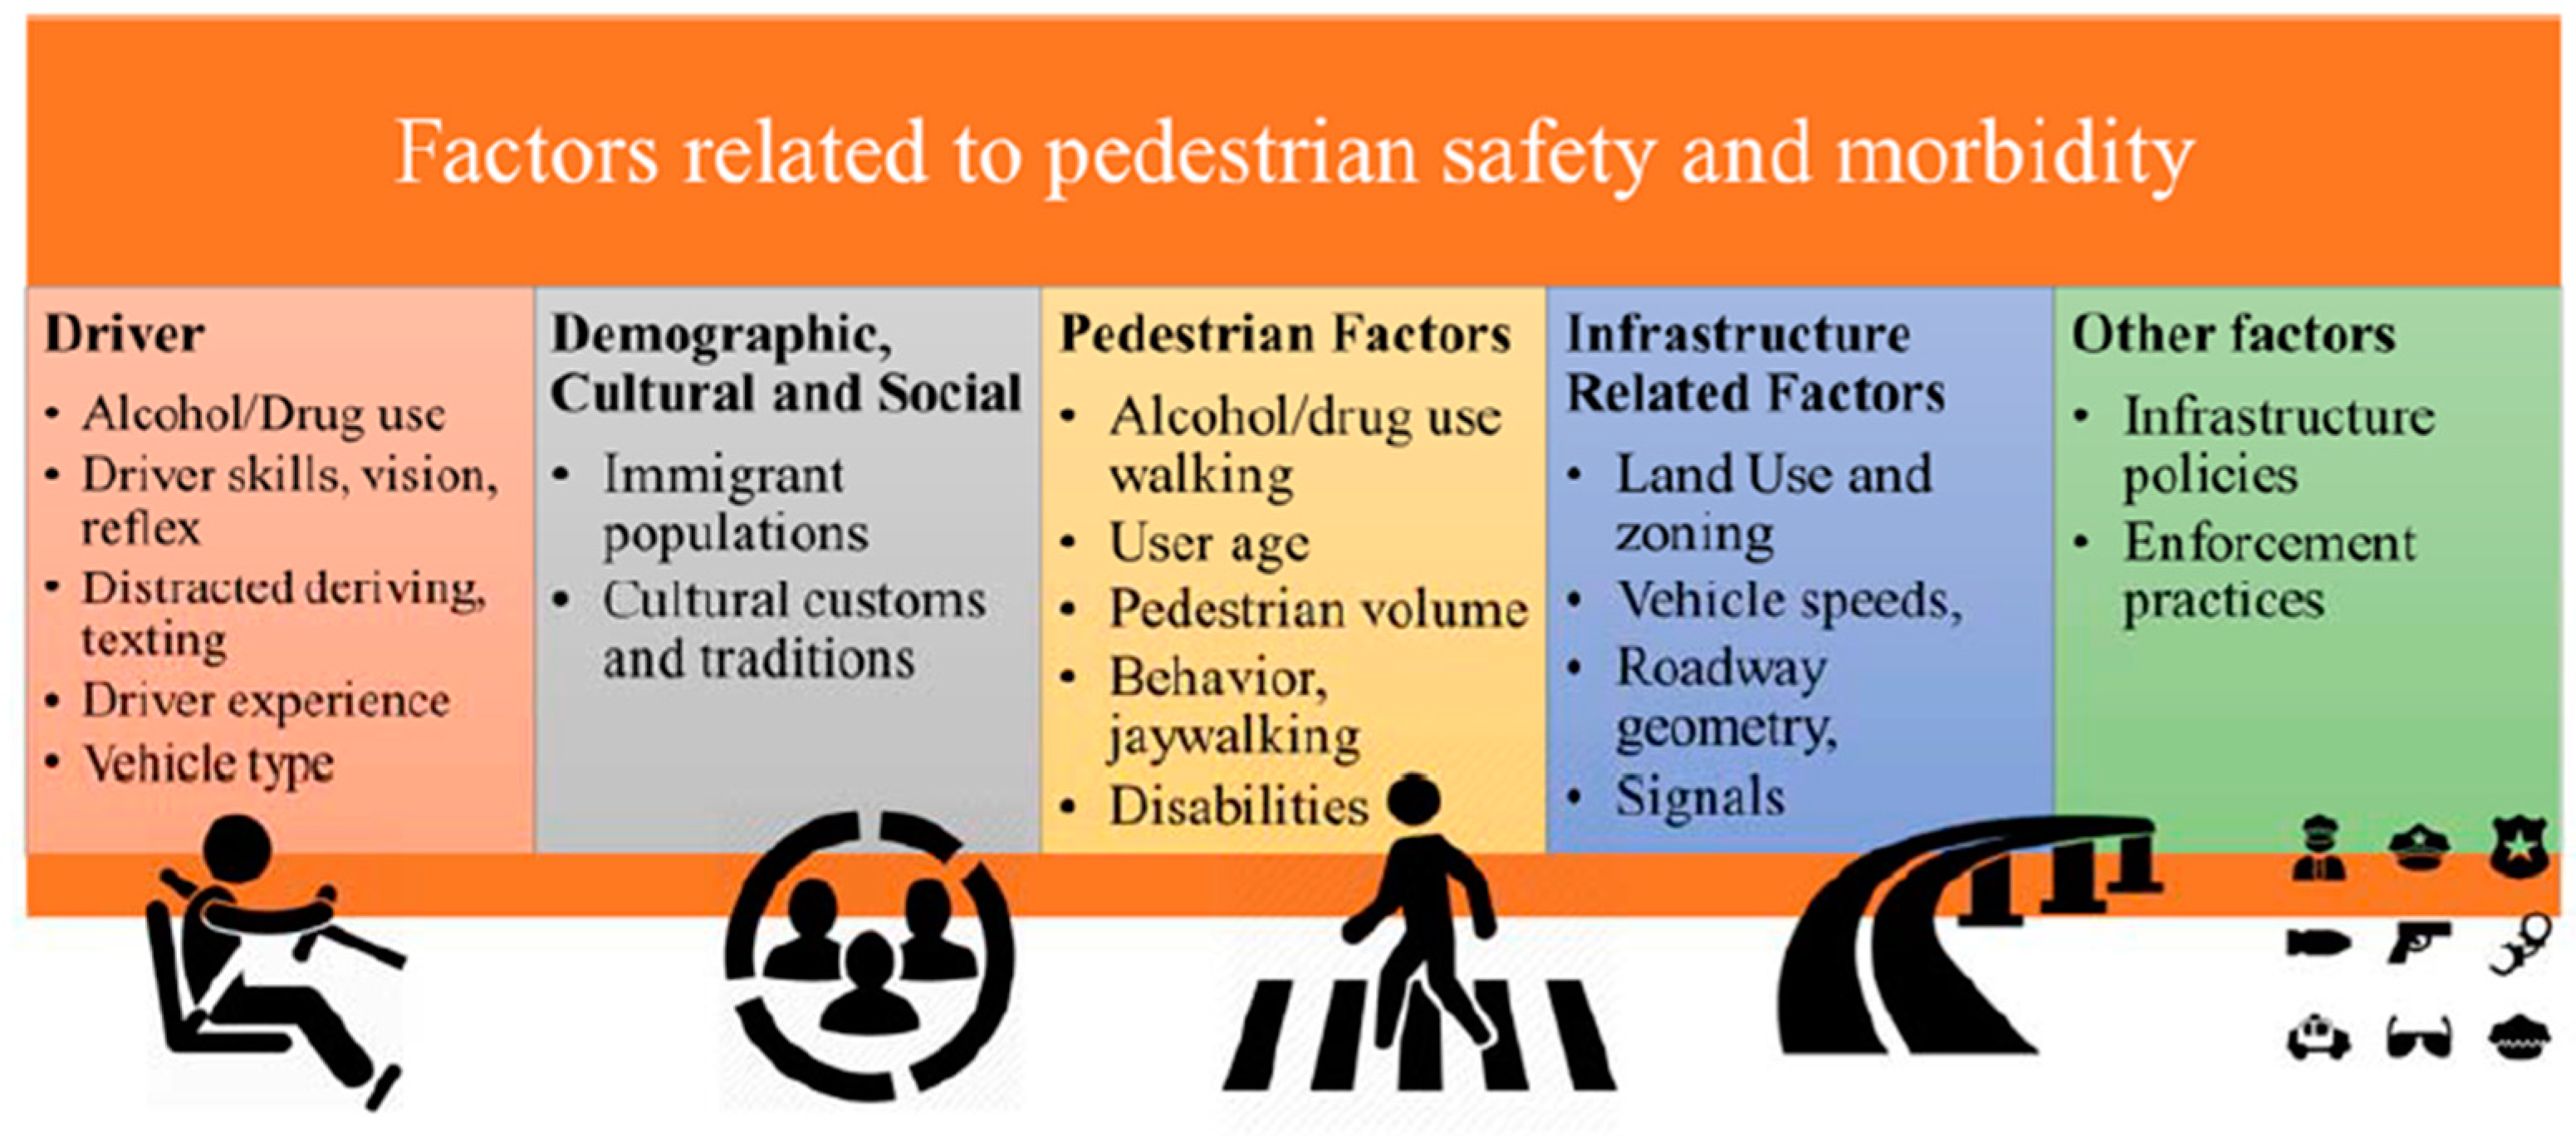
2.1. Factors Influencing Pedestrian Safety
2.2. Safety Indices
- VRUSI—Vulnerable Road User Safety Index;
- PLOC—Pedestrian Level of Comfort;
- PLTS—Pedestrian Level of Traffic Stress;
- Ped ISI—Pedestrian Intersection Safety Index.
- PLOC 1—Suitable for almost all pedestrians, including children trained to safely cross intersections.
- PLOC 2 —Suitable for most adult pedestrians, but demanding more attention than might be expected from children.
- PLOC 3—Suitable for older children, with little or no parental supervision.
- PLOC 4—Mostly suitable for adults and children with parental supervision [16].
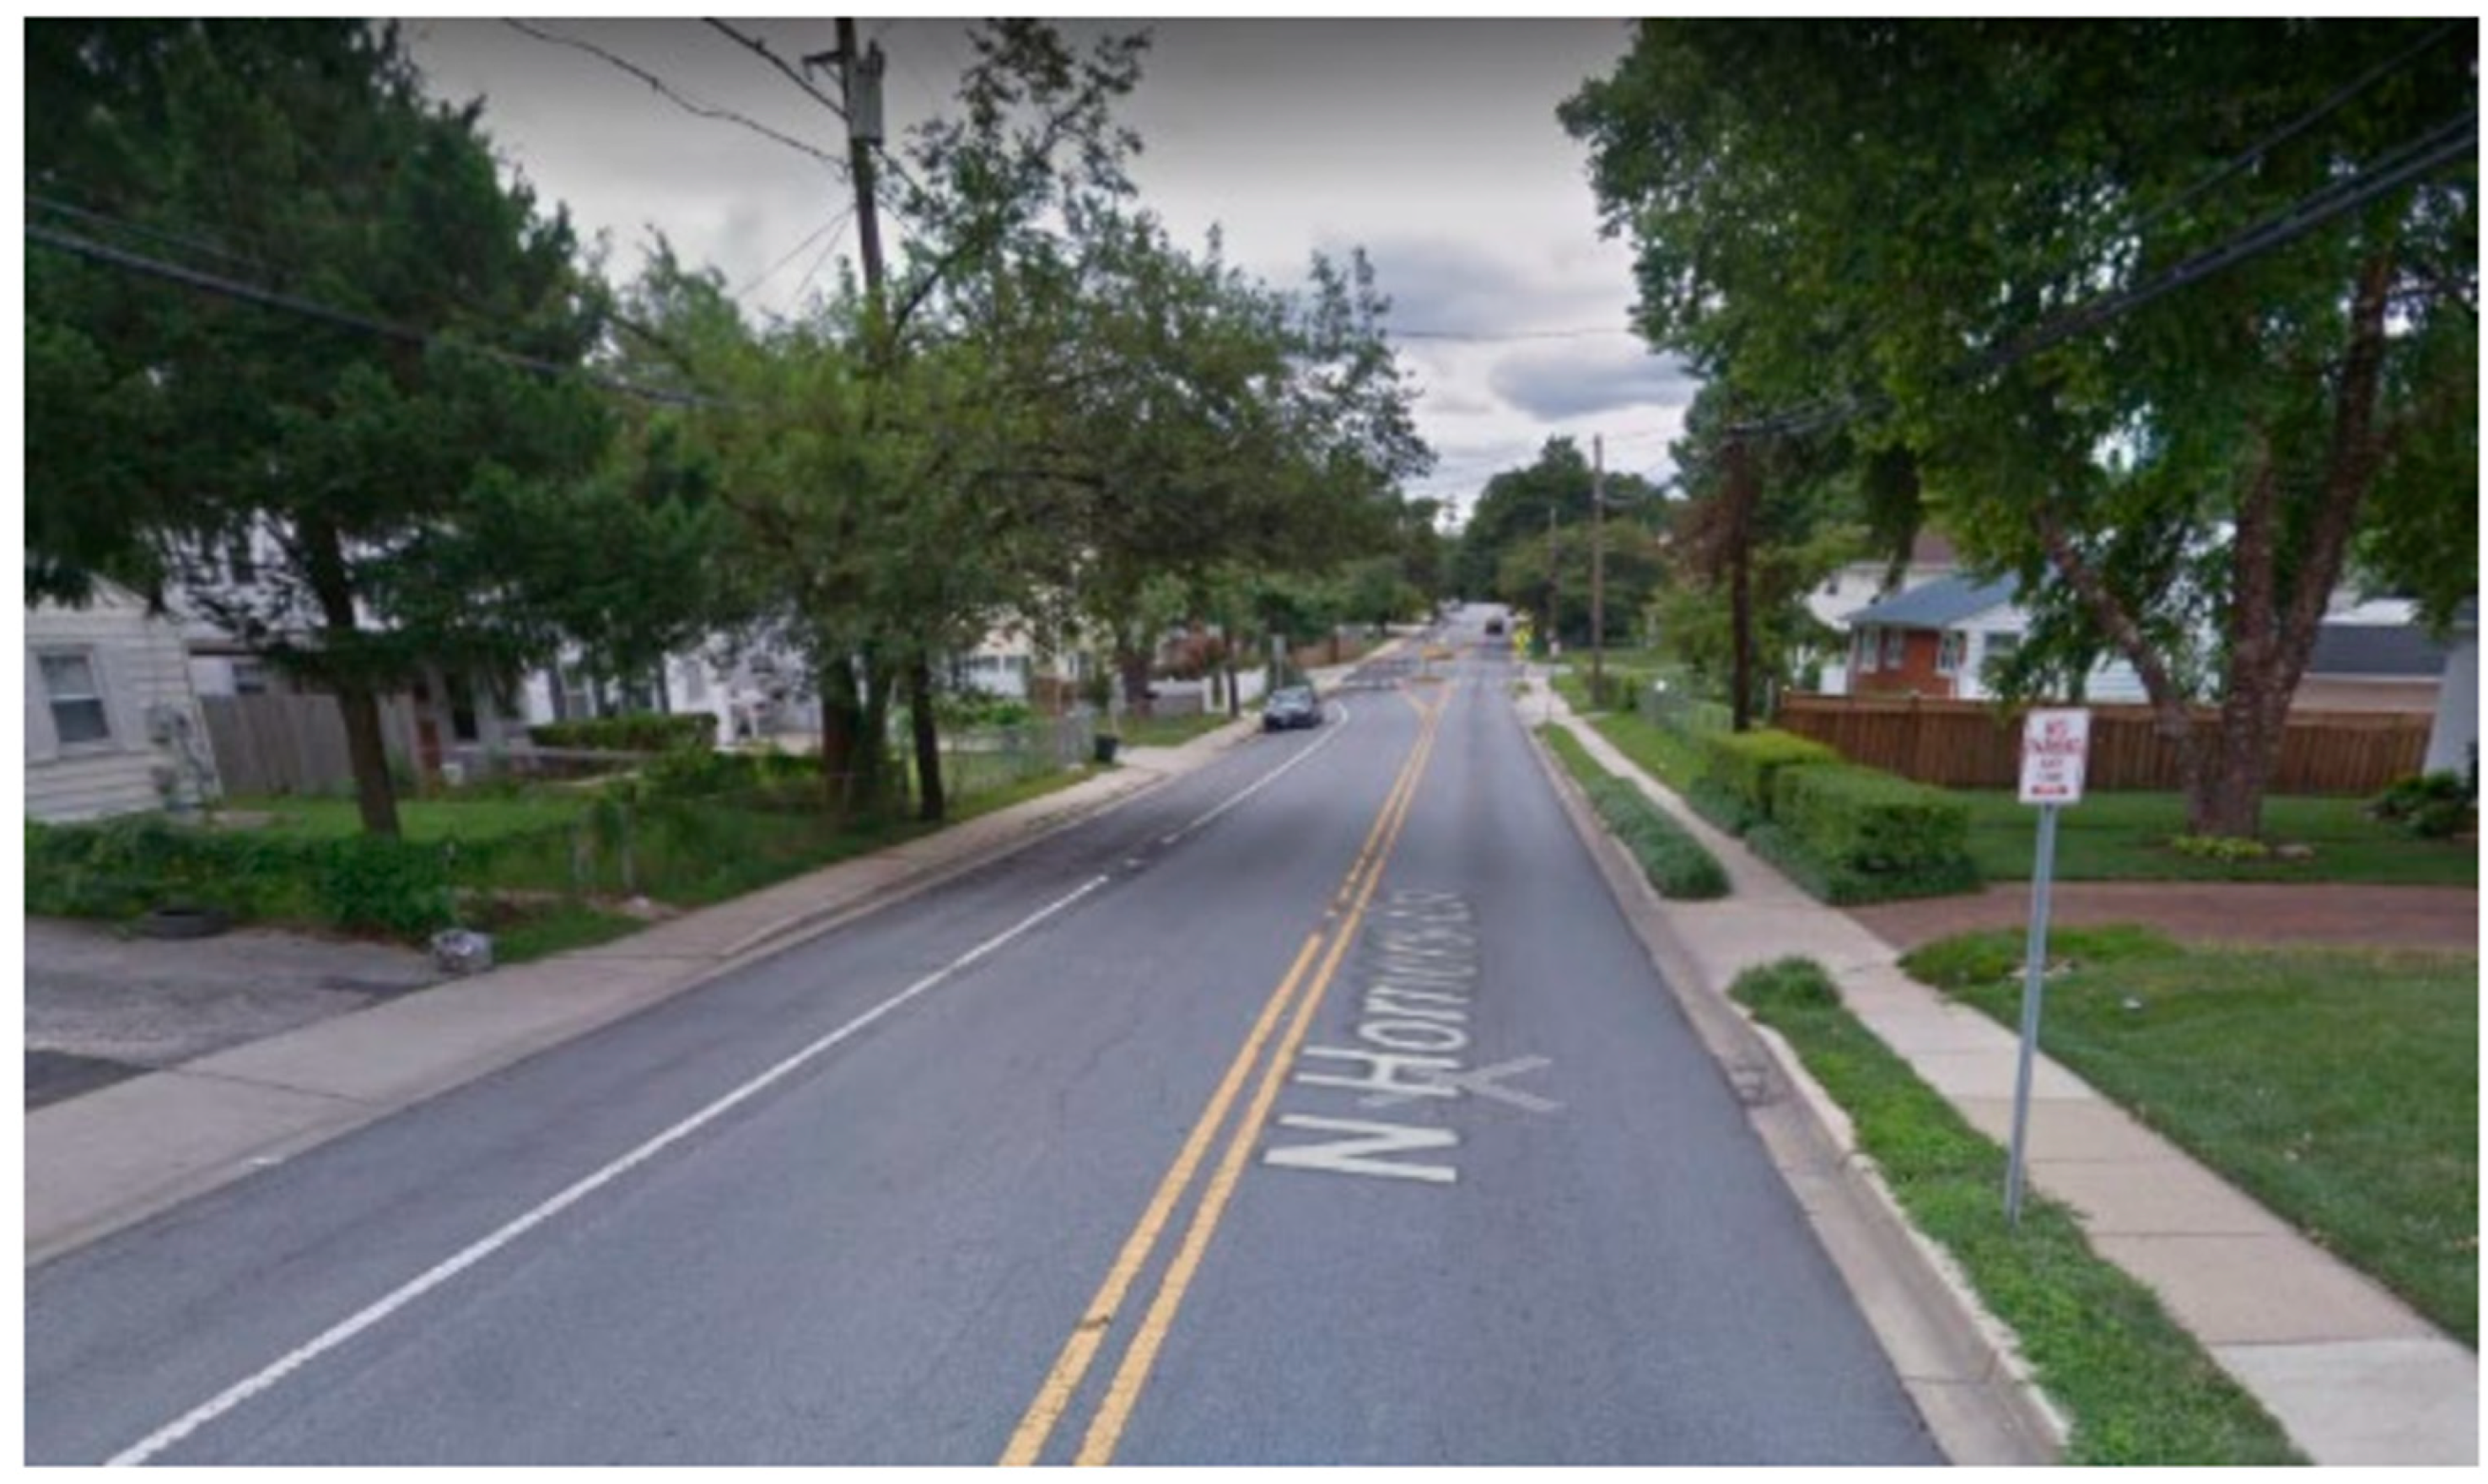
- “408 North Horners Lane, Rockville
- Left: Non-urban area, primary residential, 4-foot pathway, no buffer, designated parking lane, 25 mph, good condition.
- Score: 2—Somewhat Comfortable.
- Right: Non-urban area, primary residential, 3.5-foot pathway, 2-foot buffer, no on-street separation, 25 mph, good condition.
- Score: 2—Somewhat Comfortable” [39].
- PLTS 1—little to no traffic stress; it requires little attention to the traffic situation.
- PLTS 2—little traffic stress, but it requires more attention to the traffic situation for young children. This intersection is suitable for children over 10 years old, teens, and adults.
- PLTS 3—moderate stress, and it is suitable for adults. An able-bodied adult would feel uncomfortable, but safe using this facility.
- PLTS 4—high traffic stress [16].
3. Methodology to Incorporate VRU Safety Criteria into TAM
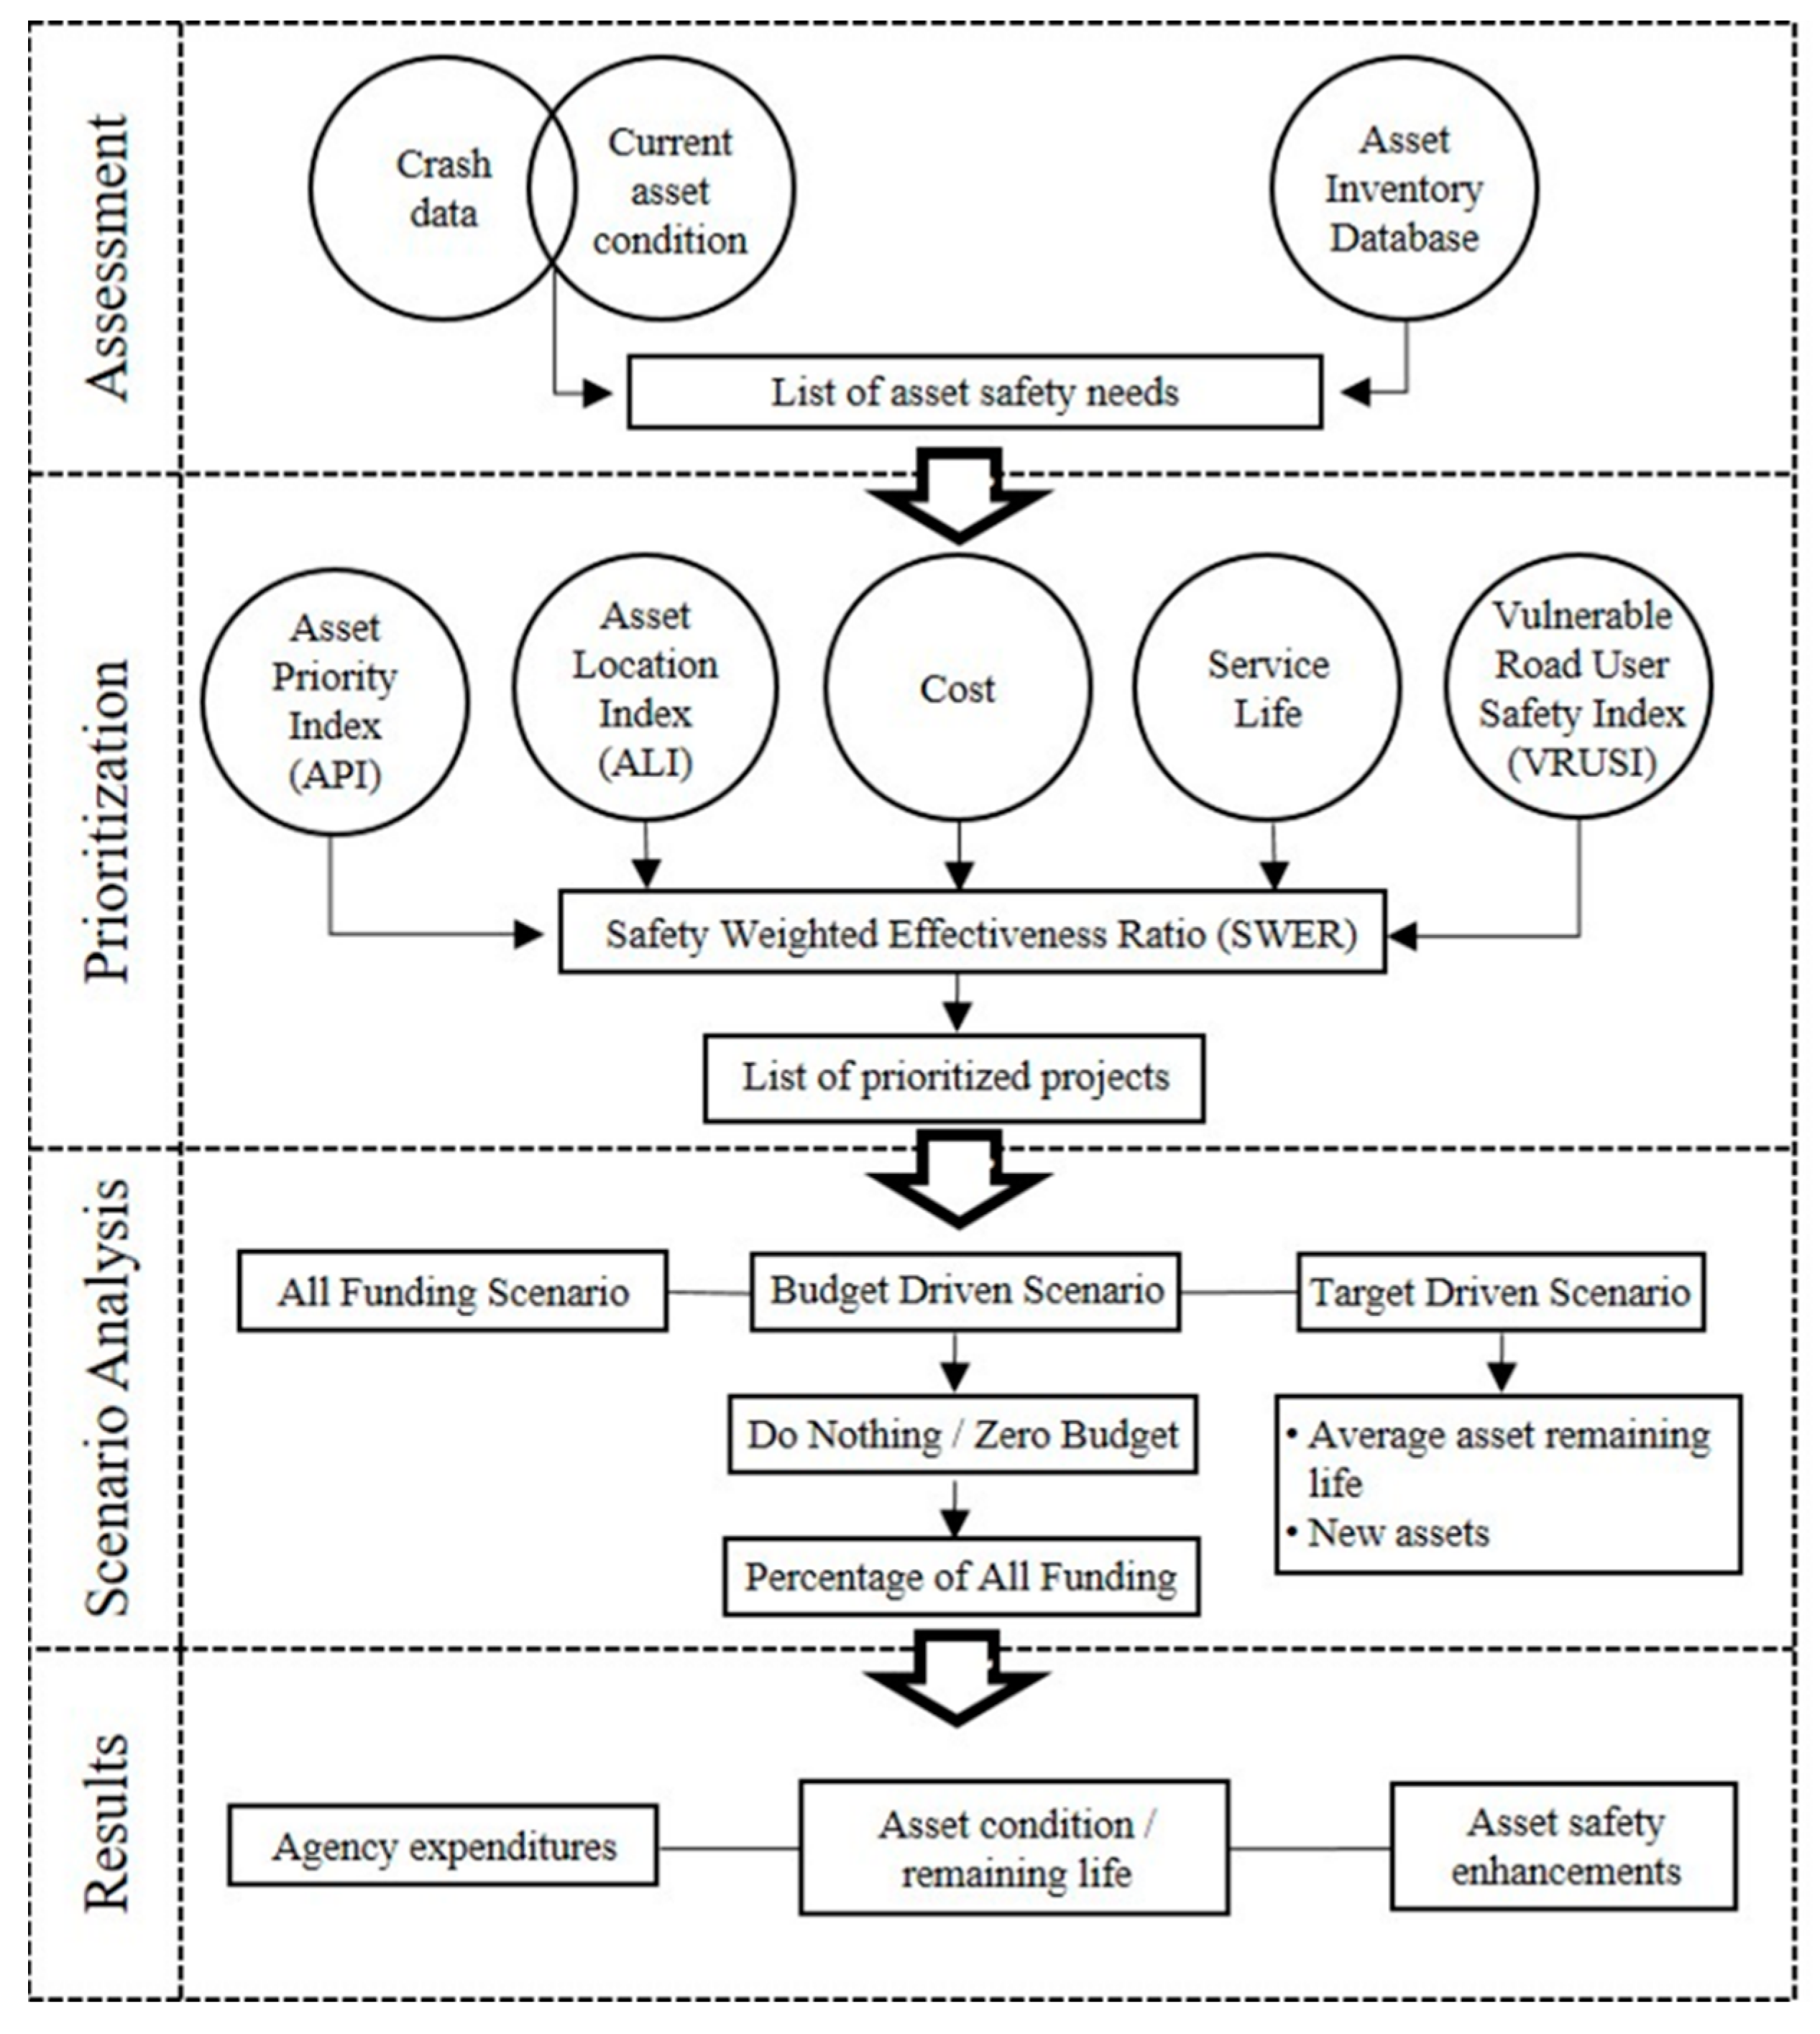
3.1. VRU-TAM Framework Overview
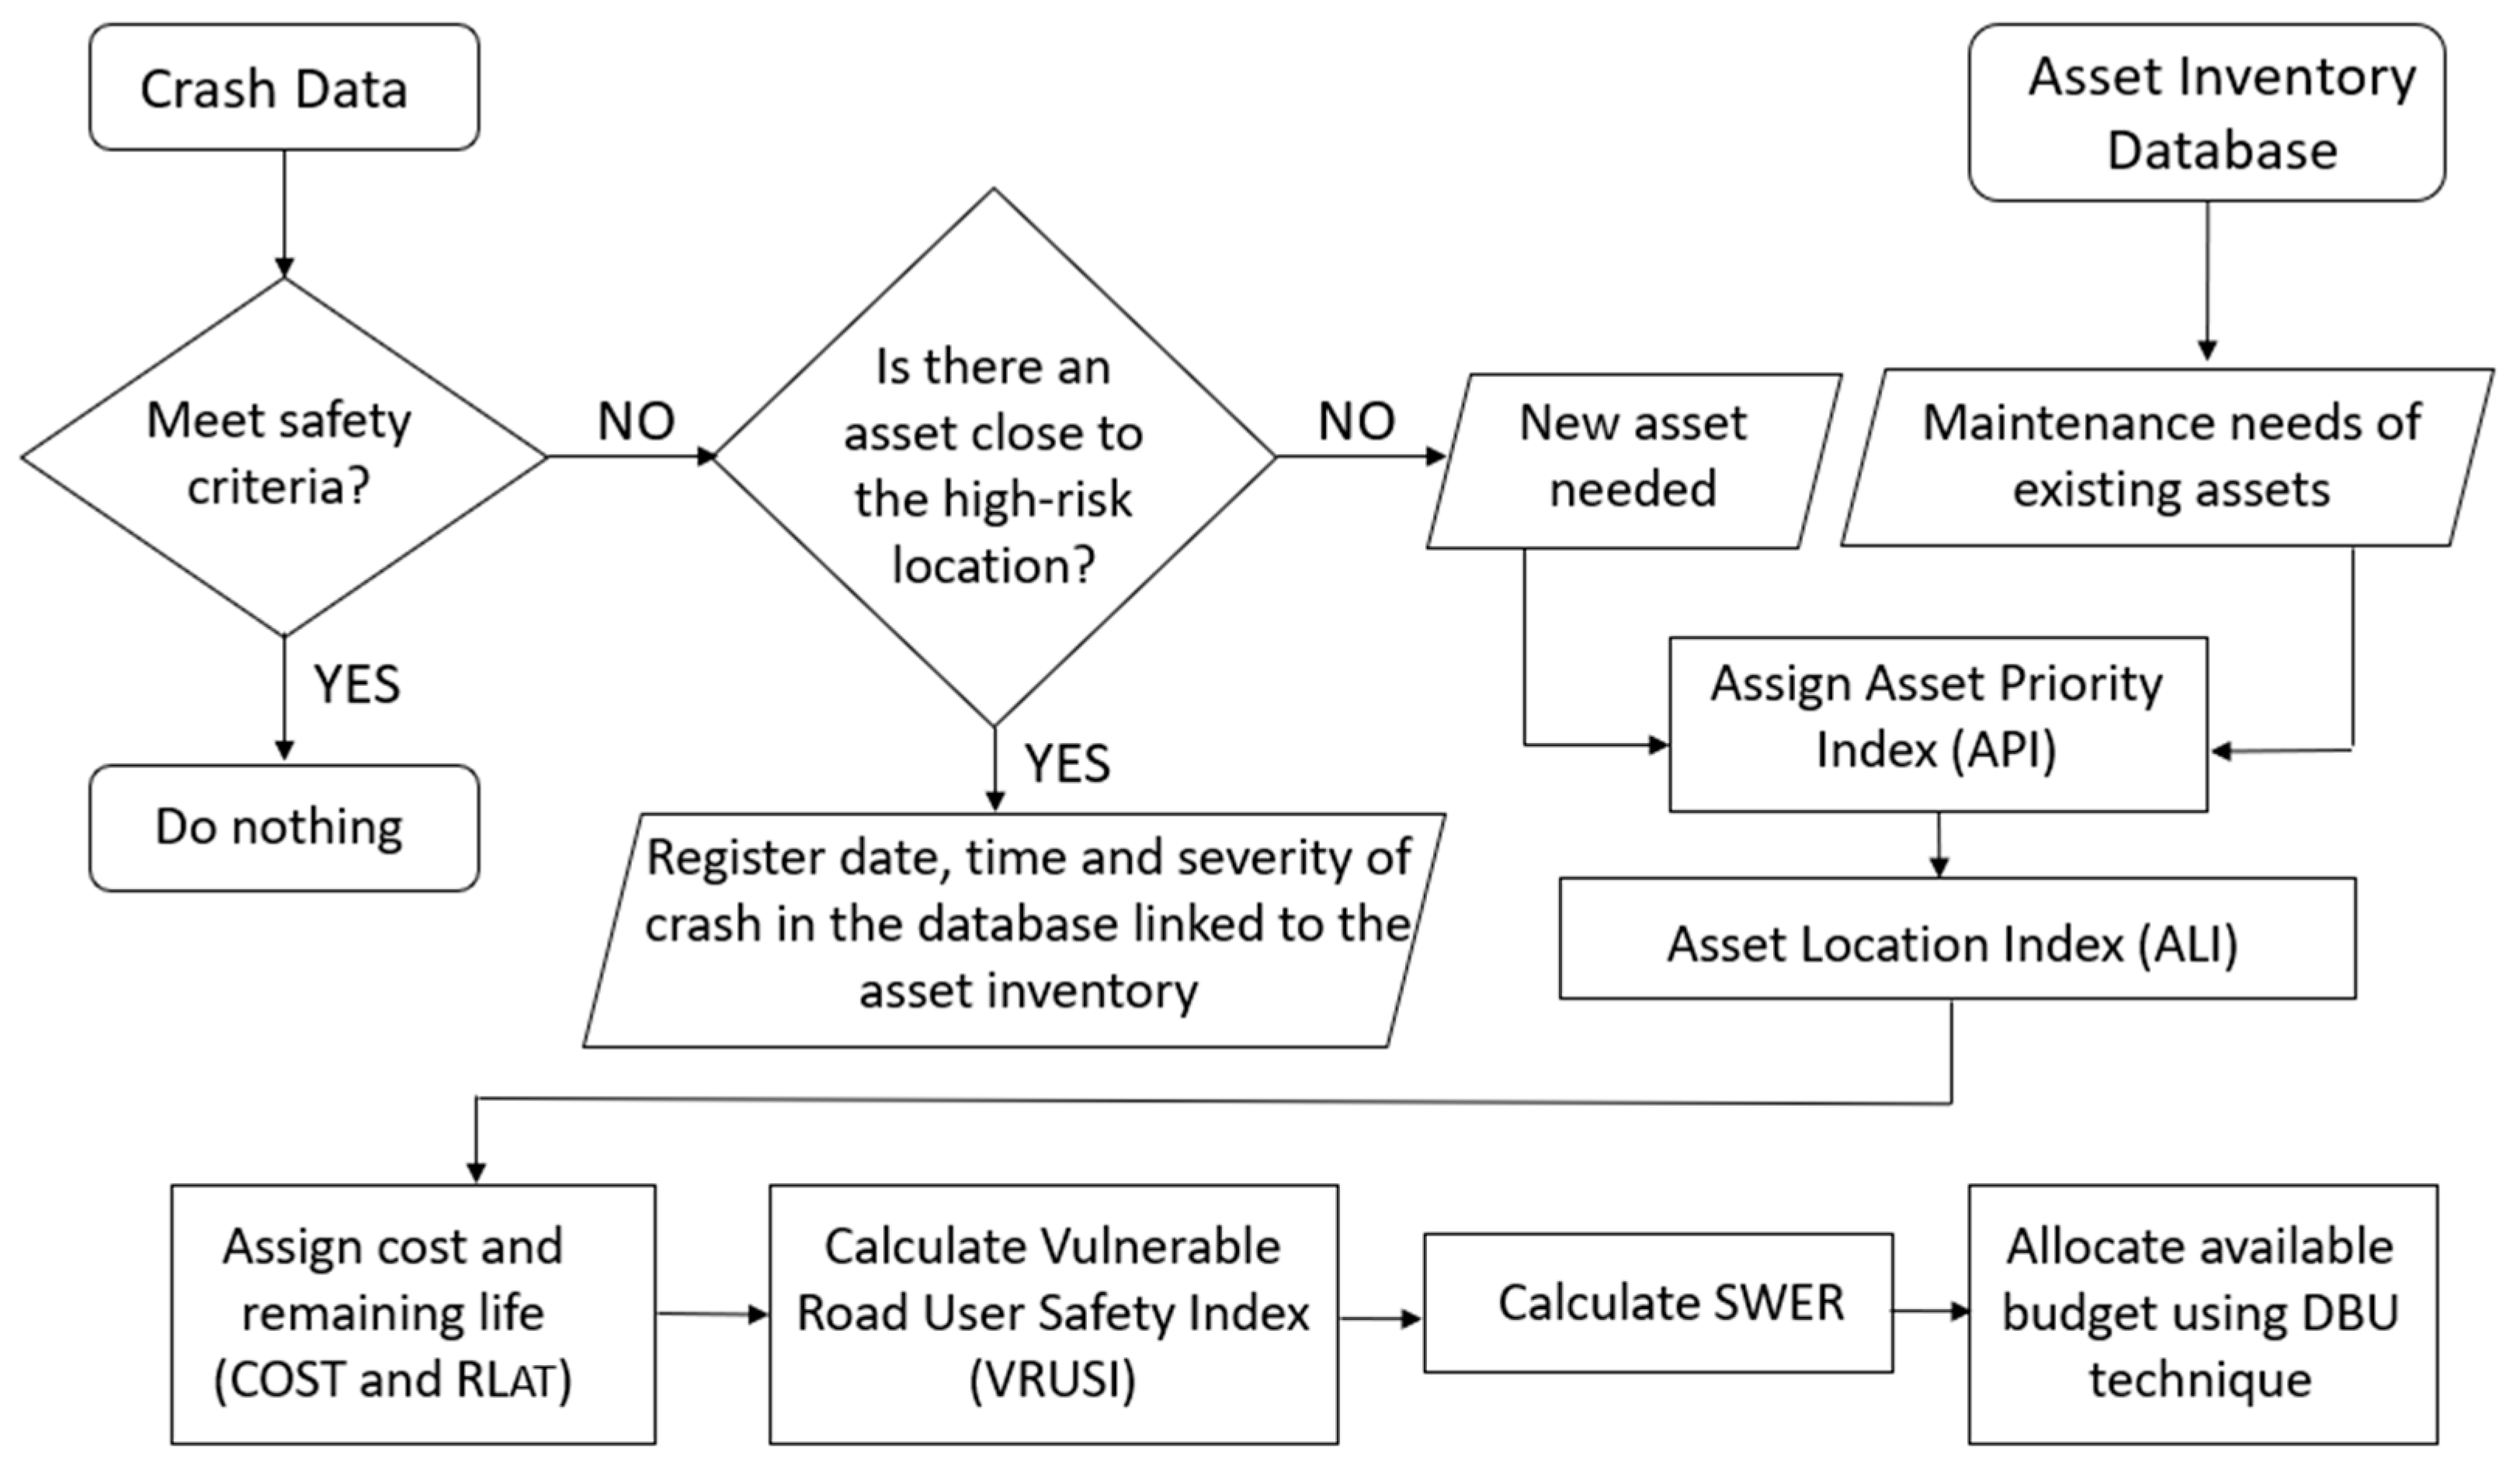
3.2. Method to Prioritize Assets Based on Pedestrian Safety
- API—Asset Priority Index;
- ALI—Asset Location Index;
- EUAC—Equivalent Uniform Annual Cost;
- RLAT—Remaining Service Life After Treatment;
- VRUSI—Vulnerable Road User Safety Index.
- VRUSI—Vulnerable Road User Safety Index;
- PLOC—Pedestrian Level of Comfort;
- PLTS—Pedestrian Level of Traffic Stress;
- PED ISI—Pedestrian Intersection Safety Index.
- n—years of analysis, equals to RLAT or number of years from first analysis year to year of treatment;
- f—inflation rate (in percentage);
- COSTF—inflated costs or unit costs at the year of analysis. The future inflated costs are calculated with equation 6 where COSTP in the present unit cost at the first year of analysis.
4. Data for Scenario Analysis
- Scenario 1—All funding baseline scenario. All funds are allocated to address the budget needs for new crosswalks and their maintenance. The need for new crosswalks is identified for sections with existing crosswalk characteristics above the desired crosswalk spacing, which is set up to 300 ft. Maintenance of crosswalk markings is scheduled every 3 years.
- Scenario 2—Do nothing baseline scenario. No funds are allocated to the crosswalks in the sections.
- Scenario 3—available budget is 85% of the total 10-year budget needs.
- Scenario 4—available budget is 70% of the total 10-year budget needs.
- Scenario 5—available budget is 50% of the total 10-year budget needs.
- Scenario 6—available budget is 35% of the total 10-year budget needs.
5. Results and Discussion
6. Conclusions
- Assessment—To identify safety improvements based on crash data and the condition of the assets in the inventory database.
- Prioritization—To rank projects using the safety-weighted effectiveness ratio (SWER), in combination with the dynamic bubble up technique (DBU), for budget allocation.
- Scenario Analysis—To evaluate the effects of budget-driven and target-performance driven scenarios.
- Results—The summary of agency expenditures, maintenance costs, and remaining service life.
Author Contributions
Funding
Institutional Review Board Statement
Informed Consent Statement
Data Availability Statement
Acknowledgments
Conflicts of Interest
References
- World Health Organization (WHO). Summary. In Global Status Report on Road Safety; WHO: Geneva, Switzerland, 2018. [Google Scholar]
- Barnes, S.C. Car Accident Trends and Statistics for 2022. 2022. Available online: https://www.hooverrogers.com/posts/car-accident-statistics-2022 (accessed on 29 May 2022).
- United States Department of Transportation USDOT. Policy Priorities-Roadway (2015) Fatalities. 2017. Available online: https://www.transportation.gov/transition/policy-priorities (accessed on 29 May 2022.).
- U.S. Department of Transportation. Moving Ahead for Progress in the 21st Century Act (MAP-21); U.S. Department of Transportation: Washington, DC, USA, 2015.
- U.S. Department of Transportation. Fixing America’s Surface Transportation Act or "FAST Act"; U.S. Department of Transportation: Washington, DC, USA, 2022.
- National Safety Council (NSC). Road to Zero: A Plan to Eliminate Roadway Deaths; NCS: Itasca, IL, USA, 2022. [Google Scholar]
- Toward Zero Deaths. The National Strategy Vision is a Highway System Free of Fatalities. 2022. Available online: https://www.towardzerodeaths.org/ (accessed on 29 May 2022).
- Vision Zero Network. What is Vision Zero? 2022. Available online: https://visionzeronetwork.org/about/what-is-vision-zero/ (accessed on 29 May 2022).
- Insurance Institute for Highway Safety (IIHS). Fatality Facts 2020 Pedestrians. 2022. Available online: https://www.iihs.org/topics/fatality-statistics/detail/pedestrians (accessed on 29 May 2022).
- Governors Highway Safety Association (GHSA). New Projection: U.S. Pedestrian Deaths Jumped in First Half of 2021; GHSA: Washington, DC, USA, 2022. [Google Scholar]
- U.S. Department of Transportation. Safe Streets and Roads for All (SS4A) Grant Program; U.S. Department of Transportation: Washington, DC, USA, 2022.
- Infrastructure Investment & Jobs Act. Analysis & Timeline of ARTBA Leadership on the Road to Reauthorization; American Road & Transportation Builders Association: Washington, DC, USA, 2021.
- Federal Highway Administration (FHWA). Asset Management Overview; United States Department of Transportation (USDOT): Washington, DC, USA, 2007.
- Governors Highway Safety Association GHSA. Pedestrian Traffic Fatalities by State. 2020 Preliminary Data; GHSA: Washington, DC, USA, 2021. [Google Scholar]
- Heinonen, J.A.; Eck, J.E. Pedestrian Injuries and Fatalities, Problem Oriented Guides for Police Problem-Specific Guides Series, Guide No. 51; Office of Community Oriented Policing Services, U.S. Department of Justice: Washington, DC, USA, 2007.
- Chang, C.M.; Rodriguez, E. Vulnerable Road User Safety Enhancements for Transportation Asset Management. In Center for Transportation, Environment, and Community Health (CTECH). Final Report; U.S. Department of Transportation: Washington, DC, USA, 2019. [Google Scholar]
- Roundsari, B.; Mock, C.; Kaufman, R.; Grossman, D.; Henary, B.; Crandall, J. Pedestrian crashes: Higher injury severity and mortality rate for light truck vehicles compared with passenger vehicles. Inj. Prev. 2004, 10, 154–158. [Google Scholar] [CrossRef] [PubMed] [Green Version]
- Zegeer, Z.; Sandt, L.; Scully, M.; Ronkin, M.; Cynecki, M.; Lagerwey, P.; Chaney, H.; Schroeder, B.; Snyder, E. How to Develop a Pedestrian Safety Action Plan; National Highway Traffic Safety Administration (NHTSA): Washington, DC, USA, 2009.
- Park, N.; Deakin, E.; Lee, J.S. Perception-Based Walkability Index to Test Impact of Microlevel Walkability on Sustainable Mode Choice Decisions. In Transportation Research Record: Journal of the Transportation Research Board; No. 2464; Transportation Research Board of the National Academies: Washington, DC, USA, 2014. [Google Scholar]
- Texas Department of Transportation (TxDOT). Texas Motor Vehicle Crash Statistics-2017. In Crash Contributing Factors; TxDOT: Austin, TX, USA, 2017. [Google Scholar]
- Lee, C.; Hellinga, B.; Saccomanno, F. Evaluation of variable speed limits to improve traffic safety. Transp. Res. Part C Emerg. Technol. 2006, 14, 213–228. [Google Scholar] [CrossRef]
- Garder, P.E. The impact of speed and other variables on pedestrian safety in Maine. Accid. Anal. Prev. 2004, 36, 533–542. [Google Scholar] [CrossRef]
- Sandt, L.; Thomas, L.; Langford, K.; Nabors, D. A Resident’s Guide for Creating Safer Communities for Walking and Biking; Federal Highway Administration (FHWA): Washington, DC, USA, 2015.
- Washington State Department of Transportation (WSDOT). People Power WSDOT on the Move to Improve Active Transportation. In Gray Notebook: Quarterly Performance Analysis of WSDOT’s Multimodal Systems and Programs; WSDOT: Washington, DC, USA, 2020. [Google Scholar]
- Groeger, L. Unsafe at Many Speeds. Article Retrieved from ProPublica. 2016. Available online: https://www.propublica.org/article/unsafe-at-many-speeds (accessed on 29 May 2022).
- Fitzpatrick, K.; Brewer, M.; Avelar, R. Driver Yielding at Traffic Control Signals, Pedestrian Hybrid Beacons, and Rectangular Rapid-Flashing Beacons in Texas. Transp. Res. Rec. J. Transp. Res. Board 2014, 2463, 46–54. [Google Scholar] [CrossRef]
- Palamara, P.; Broughton, M. An Investigation of Pedestrian Crashes at Traffic Intersections in the Perth Central Business District; Curtin-Monash Accident Research Center, Faculty of Health Sciences Curtin University: Bentley, Australia, 2012. [Google Scholar]
- North Carolina Department of Transportation (NCDOT). North Carolina Pedestrian and Bicycle Crash Data Tool; University of North Carolina Highway Safety Research Center (HSRC): Chapel Hill, NC, USA, 2018.
- City of San Francisco, Better Streets Plan, 2010. In Policies and Guidelines for the Pedestrian Realm; City of San Francisco: San Francisco, CA, USA, 2018.
- National Cooperative Highway Research Program NCHRP. A Guide for Reducing Collisions Involving Bicycles. In Guidance for Implementation of the AASHTO Strategic Highway Safety Plan; Transportation Research Board: Washington, DC, USA, 2008; Volume 18. [Google Scholar]
- Senserrick, T.; Boufous, S.; Rome, L.; Ivers, R.; Stevenson, M. Detailed Analysis of Pedestrian Casualty Collisions in Victoria, Australia. J. Traffic Inj. Prev. 2014, 15 (Suppl. S1), S197–S205. [Google Scholar] [CrossRef] [PubMed]
- Loukaitou-Sideris, A.; Liggett, R.; Sung, H. Death on the Crosswalk: A Study of Pedestrian-Automobile Collisions in Los Angeles. J. Plan. Educ. Res. 2007, 26, 338–351. [Google Scholar] [CrossRef]
- United States Department of Transportation (USDOT). Summary Report. In Pedestrian and Bicyclist Road Safety Assessments; USDOT: Washington, DC, USA, 2015. [Google Scholar]
- National Cooperative Highway Research Program NCHRP. A Guide for Reducing Collisions Involving Older Drivers. In Guidance for Implementation of the AASHTO Strategic Highway Safety Plan; Transportation Research Board: Washington, DC, USA, 2004; Volume 9. [Google Scholar]
- National Cooperative Highway Research Program NCHRP. A Guide for Reducing Collisions Involving Pedestrians. In Guidance for Implementation of the AASHTO Strategic Highway Safety Plan; Transportation Research Board: Washington, DC, USA, 2004; Volume 10. [Google Scholar]
- California Department of Transportation (CALTRANS); Federal Highway Association (FHWA); Safe Transportation Research and Education Center (SafeTREC). Local Roadway Safety-Version 1.6. Manual for California’s Local Road Owners. CALTRANS; 2022. Available online: https://dot.ca.gov/-/media/dot-media/programs/local-assistance/documents/hsip/2022/lrsm2022.pdf (accessed on 29 May 2022).
- National Highway Traffic Safety Administration (NHTSA). Traffic Safety Facts 2015, Data: Pedestrians; National Highway Traffic Safety Administration: Washington, DC, USA, 2017.
- City of Encinitas. Active Transportation Plan. In Administrative Draft; City of Encinitas: Encinitas, CA, USA, 2018. [Google Scholar]
- Montgomery County Planning Department. Montgomery County’s Pedestrian Plan; Pedestrian Level of Comfort Methodology. 2020. Available online: https://montgomeryplanning.org/planning/transportation/pedestrian-planning/pedestrian-master-plan/ (accessed on 29 May 2022).
- Oregon Department of Transportation (ODOT). Planning Section Transportation Planning Analysis Unit. Analysis Procedures Manual; Version 2; Transportation Development Division: Salem, OR, USA, 2018.
- Federal Highway Administration (FHWA), Pedestrian and Bicyclist Intersection Safety Indices; United States Department of Transportation: Washington, DC, USA, 2007.
- Federal Highway Administration (FHWA), Coordinating, Developing and Delivering Highway Transportation Innovations. Available online: https://www.fhwa.dot.gov/publications/research/safety/pedbike/pedisi.cfm (accessed on 29 May 2022).
- Chang, C.M.; Vavrova, M. Vulnerable User Road Safety Enhancements for Transportation Asset Management; American Society of Civil Engineers (ASCE): Reston, VA, USA, 2016. [Google Scholar]
- Virginia Department of Transportation (VDOT). Guidelines for the installation of Marked Crosswalks; FHWA/VTRC 05-R18; Federal Highway Association: Harrisburg, PA, USA, 2004.
- Chang, C. Development of a Multi-Objective Strategic Management Approach to Improve Decisions for Pavement Management Practices in Local Agencies. Dissertation; Texas A&M University: College Station, TX, USA, 2007. [Google Scholar]
- Federal Highway Administration (FHWA). Status of the Nation’s Highways, Bridges, and Transit: Conditions & Performance; United States Department of Transportation: Washington, DC, USA, 2013.
- Federal Highway Administration (FHWA). Performance Based Planning and Programming Guidebook; United States Department of Transportation: Washington, DC, USA, 2013.


| Ped ISI = 2.372 − 1.867SIGNAL − 1.807STOP + 0.335THRULNS + 0.018SPEED + 0.006(MAINADT*SIGNAL) + 0.238COMM | (2) | |
|---|---|---|
| where: | ||
| Ped ISI | Safety index value (pedestrian) | |
| SIGNAL | Signal-controlled crossing | 0 = no; 1 = yes |
| STOP | Stop sign-controlled crossing | 0 = no; 1 = yes |
| THRULNS | Number of through lanes on street being crossed (both directions) | 1, 2, 3, … |
| SPEED | 85th percentile speed of street being crossed | Speed in miles per hour |
| MAINADT | Main street traffic volume | ADT in thousands |
| COMM | Predominant land use on surrounding area is commercial development (i.e., retail, restaurants) | 0 = not predominantly commercial area 1 = predominantly commercial area |
| Section ID | Average Daily Traffic | Number of Crashes | Block Length (ft.) | API | ALI | VRUSI | SWER |
|---|---|---|---|---|---|---|---|
| 1-C-1 | 1300 | - | 1000 | 0.8 | 1 | 3.90 | 8.59 |
| 1-C-N | 1300 | 2 | 1000 | 1 | 1 | 5.90 | 2.95 |
| 2-C-1 | 8000 | - | 560 | 0.8 | 0.55 | 4.61 | 5.54 |
| 3-C-1 | 12,200 | - | 600 | 0.8 | 0.55 | 4.64 | 5.57 |
| 3-C-N | 12,200 | 2 | 600 | 1 | 1 | 6.64 | 3.32 |
| 4-C-1 | 9900 | - | 1000 | 0.8 | 0.55 | 4.62 | 5.55 |
| 4-C-N | 9900 | 2 | 1000 | 1 | 1 | 6.62 | 3.31 |
| 7-C-N | 12,000 | 3 | 620 | 1 | 1 | 6.64 | 3.32 |
| 9-C-N | 8400 | 2 | 230 | 1 | 1 | 6.62 | 18.52 |
| 10-C-N | 4100 | 2 | 880 | 1 | 0.55 | 6.16 | 1.85 |
| Scenario 1 All Funding | Scenario 2 Do Nothing | |||||||
|---|---|---|---|---|---|---|---|---|
| Year | Cost of New Crosswalks (USD) | Cost of Maintenance (USD) | Average RLAT (Years) | Improved Crosswalks (%) | Cost of New Cross-walks (USD) | Cost of Maintenance (USD) | Average RLAT (Years) | Improved Crosswalks (%) |
| 2022 | 7840 | 0 | 2.00 | 100 | 0 | 0 | 1.0 | 0 |
| 2023 | 3920 | 1020 | 2.30 | - | 0 | 0 | 0.0 | 0 |
| 2024 | 0 | 340 | 1.70 | - | 0 | 0 | 0.0 | 0 |
| 2025 | 0 | 1360 | 1.90 | - | 0 | 0 | 0.0 | 0 |
| 2026 | 0 | 1700 | 2.40 | - | 0 | 0 | 0.0 | 0 |
| 2027 | 0 | 340 | 1.70 | - | 0 | 0 | 0.0 | 0 |
| 2028 | 0 | 1360 | 1.90 | - | 0 | 0 | 0.0 | 0 |
| 2029 | 0 | 1700 | 2.40 | - | 0 | 0 | 0.0 | 0 |
| 2030 | 0 | 340 | 1.70 | - | 0 | 0 | 0.0 | 0 |
| 2031 | 0 | 1360 | 1.90 | - | 0 | 0 | 0.0 | 0 |
| Scenario | Available Budget or Agency Cost (USD) | Percentage of New Crosswalks at the End of the Analysis (%) | Average Remaining Life (Years) | Critical Remaining Life (Year) | Critical Backlog (Year) | Backlog at the End of 2030 (USD) |
|---|---|---|---|---|---|---|
| 3 | 18,000 (85%) | 83 | 1.94 | 1.44 (2023) | $2300 (2023) | 1960 |
| 4 | 15,000 (70%) | 67 | 1.84 | 1.38 (2023) | $4260 (2023) | 4260 |
| 5 | 10,700 (50%) | 50 | 1.41 | 0.86 (2026) | $6900 (2025) | 6560 |
| 6 | 7500 (35%) | 33 | 1.32 | 0.83 (2026) | $8860 (2027) | 8860 |
Publisher’s Note: MDPI stays neutral with regard to jurisdictional claims in published maps and institutional affiliations. |
© 2022 by the authors. Licensee MDPI, Basel, Switzerland. This article is an open access article distributed under the terms and conditions of the Creative Commons Attribution (CC BY) license (https://creativecommons.org/licenses/by/4.0/).
Share and Cite
Chang, C.M.; Vavrova, M.; Mahnaz, S.L. Integrating Vulnerable Road User Safety Criteria into Transportation Asset Management to Prioritize Budget Allocation at the Network Level. Sustainability 2022, 14, 8317. https://doi.org/10.3390/su14148317
Chang CM, Vavrova M, Mahnaz SL. Integrating Vulnerable Road User Safety Criteria into Transportation Asset Management to Prioritize Budget Allocation at the Network Level. Sustainability. 2022; 14(14):8317. https://doi.org/10.3390/su14148317
Chicago/Turabian StyleChang, Carlos M., Marketa Vavrova, and Syeda Lamiya Mahnaz. 2022. "Integrating Vulnerable Road User Safety Criteria into Transportation Asset Management to Prioritize Budget Allocation at the Network Level" Sustainability 14, no. 14: 8317. https://doi.org/10.3390/su14148317