How Natural Gas Infrastructure Affects Carbon Emission Indicators in Guangdong Province?


1
Department of Economics and Management, Wenhua College, Wuhan 430074, China
2
School of Economics and Business Management, Central China Normal University, Wuhan 430074, China
*
Author to whom correspondence should be addressed.
Sustainability 2022, 14(13), 8104; https://doi.org/10.3390/su14138104
Submission received: 30 May 2022
/
Revised: 27 June 2022
/
Accepted: 30 June 2022
/
Published: 2 July 2022
(This article belongs to the Section Energy Sustainability)
Abstract
:As a public infrastructure, the West to East Natural Gas Pipeline Project (WENGPP), acting as a key supplier of energy, has adopted a potential approach to reduce CE by expanding Natural gas (NG) power in the developed areas in China. However, the literature pertaining to the effects of the efforts made by WENGPP to reduce CE remains scant. Therefore, this study applied the causal inference framework—Regression Discontinuity Design (RDD) to the Guangdong province, which was chosen as a case in point that provides empirical evidence related to the nexus between WENGPP and CE. Remarkably, our results disclosed that WENGPP had caused the total volume of CE in Guangdong province to decline notably. Both short and long-term emission inhibition effects approximated 10.68–14.96%. We revealed two CE reduction mechanisms: (i) through the low-carbon emission trade-off effect, wherein NG consumers were able to gain emission advantages under policy pressure; and (ii) through price comparison effect, where high combustion efficiency of NG consumers combined with low energy consumption costs could provide the incentive of promoting the optimization of regional emission structure. The article suggests a substitutable channel upgrading public energy infrastructure to improve the low-carbon alternative process, to policy makers.
1. Introduction
The impact of ecological changes and associated disasters caused by global warming is frequently felt. Nations around the world are initiating action to cope with the challenges posed by global warming. However, a majority of developing countries are faced with the dilemma of choosing between development and emission reduction. On the one hand, the prosperity of most developing countries depends on the development of the dirty industrial sector [1,2,3], in which process energy supply and consumption is crucial [4,5]. On the other hand, the increase in energy consumption required for industrial production directly leads to large emissions measurable in terms of tons [6], which not only diverge from environmentally beneficial greenhouse gas emission reduction, but also leads to a sustainable development crisis that constantly undermines the quality of economic development [7].
It is obvious that environmental issues have been increasingly causing crises and disasters, thereby affecting the goals set by middle- and- low-income countries (MLIC) to achieve sustainable growth, as proposed by the United Nations [8,9,10]. The impact of environmental externality, wherein, CE poses the most serious externality challenge [11,12], is a difficult issue that developing countries have been unable to solve at the present time [13]. Emission of Greenhouse gases, 75% of which consists of carbon dioxide, is a direct cause of global warming [14]. The use of fossil energy for human activities is closely associated with CE (Ali, et al., 2021) [15], the global warming trend precipitated by the use of fossil energy threatens the entire human environment [16]. Unlike the emissions of common pollutants, the warming caused by CE threatens all human society, in both developed as well as developing countries [17]. Full coverage of such environmental externalities necessitates all countries to actively combat global warming [18]. The Kyoto Protocol and the Paris Climate Agreement have been signed successively, wherein the signatory countries are expected to fulfill the main responsibility of CE inhibition, via confinement of the warming trend to 2 °C every century.
However, considering the overall scale of existing greenhouse gases, the current trend seen in global warming is expected to continue, as newly added CE keeps increasing year by year, bringing new CE reduction pressure. Based on the positive nexus between rapid economic growth and CE, emerging economies are replacing traditionally industrialized countries as the new entity, which acts as the main source of CE, with China becoming the world’s largest CE emitting economy with a share of 27.8% of the current CE (the data come from BP Statistical Yearbook of World Energy, 2019), bringing it under great pressure to reduce emissions. China is the largest developing country as well as the second largest economy worldwide, and thus its carbon reduction efforts may largely determine whether global CE curtailment targets can be achieved or not. The Chinese government signed the Kyoto Protocol in 2016 and pledged to reduce carbon dioxide levels by 18% per unit GDP by 2035. It also set the strategic goal of peaking carbon dioxide levels by 2030 as well as achieving carbon neutrality by 2060. Prior to this (since 2011), China had written the energy conservation and emission reduction (ECER) objective into the target responsibility of local governments, and implemented a series of emission reduction policies, which has attracted a great deal of attention and discussion [19].
As an open and developing industrialized economy, China established a manufacturing sector, which provides large amounts of export oriented manufactured goods to ensure long-term and rapid economic growth [20]. Nonetheless, China is highly dependent on coal and other traditional fossil energy sources [21], resulting in energy consumption on a huge scale, thereby driving the scale of CE upwards [22]. Reducing CE effectively while ensuring economic growth is a dilemma that confronts the Chinese government. This issue is heatedly debated by environmentalists, environmental scientists, environmental policy researchers and energy economics experts around the world [6,23,24,25,26,27,28,29].
Therefore, an examination of empirical evidence obtained from Guangdong province, which is a core region of China’s foreign investment and trade export, as well as an economically developed region, may help explore the effect of China’s energy policy implementation to solve the CE issue. There is a dramatic gap between the economic development capabilities of different regions in China, due to the vastness of the territory involved. Exports are primarily concentrated in the Pearl River Delta and Yangtze River Delta, leaving different regions to face diverse development and emission reduction pressures. Guangdong province is China’s largest export base and one of its fastest growing regions. As the biggest beneficiary of rapid industrialization, Guangdong province faces unprecedented pressure to cut emissions while achieving economic growth. China will continue to follow the trend of globalization, deepen opening-up and promote further development of its export-oriented economy. Reducing CE while maintaining rapid economic growth is a particularly acute problem confronting Guangdong province. This study investigated the public policy of WENGPP to deduce whether policy makers are promoting the low-carbon emission trade-off of NG by providing a public energy infrastructure, and subsequently utilized the RDD identification method to evaluate the long-term emission reduction effects of such policy implementation.
Developing, as well as developed, countries face disparate basic conditions when dealing with the pressure of ECER under the challenges posed by climate change. Developed countries, in particular, possess sufficient economic strength to cope with the high cost of emission reduction [30], and have thus initiated a range of environmentally applicable technological innovations, including adopting a clean production mode and large-scale popularization of zero-carbon emission energy sources, such as nuclear power, wind power and photovoltaic to replace traditional fossil energy sources [31]. With respect to CE reduction technology, they have actively carried out carbon burial and carbon sequestration to reduce surface carbon stocks. However, developing countries can neither afford the high costs of switching to cleaner production, nor assume the technological risks that need to be taken to reduce CE.
In contrast, rapid economic development in developing countries, is often accompanied by energy supply- and energy production-linked investments with growing energy consumption demands in economically open regions. To meet the needs of economic growth, it is necessary for governments to introduce a wider range of energy sources via large investments in energy infrastructure. However, with increasing ECER awareness prevalent in the society at large, developing countries have come to realize that increased energy consumption required for industrial production intuitively leads to large-scale emissions measured in terms of tons [32], which not only diverges from environmental responsibilities associated with greenhouse gas emission reduction, but also erodes the quality of economic development associated with the sustainable development crisis [33]. Limited by the technological path dependence of polluting production mode, most developing countries have no choice but to adopt gradual improvements to transform the high CE production in traditional industrial sectors into a low CE gray production mode, so as to maintain economic growth and to accumulate the economic strength needed to increase CE reduction at the next step. Sustainable growth is not only reflected in the gradual reduction in environmental pressure, but also by the stable growth rates achieved and the continuously adjusting industrial structure.
China vigorously constructed a large-scale program, WENGPP, from 2000 to 2017 to provide a backbone network supply for the large-scale popularization of NG in economically developed areas. NG pipelines were delivered from NG producing areas in western China to economically developed areas in eastern China, via a three-stage construction process, while NG importing pipelines from Central Asia were also connected, thereby forming sufficient network coverage to ensure that NG would be supplied to energy-short regions in China. Similar to those of most developing countries, China’s developed coastal regions with their export-oriented economic layouts have become poles of growth that promote rapid economic development. In reality, economic growth is closely linked with energy consumption. There is a strong demand for energy in economically developed areas, leading to the formation of an energy supply gap caused by the large amounts of exports processed, thereby creating a massive need for power that has to be purchased from abroad. Guangdong province accounts for the largest proportion of China’s exports, with its overseas trade volume reaching CNY 8.26803 trillion and its GDP reaching CNY 12.436967 trillion, accounting for 21.1% and 12.2% of China’s trade volume, respectively. Nevertheless, this province has had an energy supply shortage for a long time. WENGPP, which was connected to Guangdong province in 2012, successfully provided massive amounts of NG that were needed for the economic development of this region. Thus, the project displays extremely positive environmental externalities, which resulted in the substitution of NG for coal and other high CE energy sources, and effectively reduced CE levels in Guangdong province.
However, while a limited portion of the available literature focuses on emission reduction effects of WENGPP, a majority focuses on restrictive emission policies introduced by the Chinese government. Conversely, the restrictive environmental governance policies directed at CE attracted most of the attention of the public as well as researchers, while on the other hand, Porter’s hypothesis of weak environmental policy was also supported by sufficient evidence [34]. Emission restriction policies force enterprises to seek and implement environmental technology innovations, where the government effectively provides market incentives to promote the improvement of emission reduction efficiency via institutional arrangements, such as emission trading ETS [35,36]. During the initial stages of WENGPP implementation, China did not realize the important effect of ECER, and thus the construction of NG pipelines was often regarded as a public policy pertaining to energy rather than a policy aimed at reducing environmental emissions [37]. Notwithstanding the gradual development of consensus on CE reduction, increasing attention is being paid to a series of policy effects on low-carbon alternatives [38].
NG supply provided by the government exerts multiple policy effects, including price comparison effects based on low-cost energy and low-carbon emission trade-off effects attributable to the NG alternative. According to Porter’s strong hypothesis, implementation of this policy tool exerted an economic effect [39]. Although there is no significant comparative advantage associated with the price of NG, its combustion efficiency reaches 90%, which is more than twice that of coal (40%). Due to lower power utility costs associated with it, NG is considered the low-cost choice for industrial and civil energy. It confers a noticeable cost trade-off advantage as well as a much lower emission advantage, compared to widely used coal. The International Energy Agency indicates that CE generated by NG power generation is 0.39–0.44 kg/kwh, which is far less than that generated by coal (0.88–0.90 kg/kwh). Therefore, once NG is transported to Guangdong province, the market initiative replacement incentive will become sufficient, and CE reduction will become an activity with strong positive exogeneity. However, due to the limited availability of NG and the popularity of pipeline access, NG cannot be widely used. As Guangdong province lies far away from the NG supplier regions of western China, the energy shortage has limited further development of its local economy. WENGPP not only brings more extensive energy supply to Guangdong province, but also continues to play the crucial role of low-carbon emission trade-off via the introduction of NG, reducing the scale of regional CE.
At present, the limited literature focuses on the effect of WENGPP. Most studies concentrate on evaluating the corresponding social and economic benefits from the perspective of technology and engineering [40,41,42], and do not pay serious attention to the effect of CE restraint brought on by WENGPP. Wu et al. [43] investigated the ECER effect of WENGPP on central provinces, but did not provide empirical evidence that yields a convincing solution to the inquiry [44], as to whether WENGPP effectively reduces the total scale of regional CE by focusing on energy transmission in developed regions.
2. Literature Review
2.1. Economic Development, Energy Consumption and Low-Carbon Policy Implementation
A literature review, which covers various views that are pertinent to the nexus between WENGPP and CE, is provided. The theory of Environmental Kuznets Curve (EKC) and existing empirical results both indicate that the growth of per capita income brought about by economic development is inevitably accompanied by an increase in environmental emissions, including CE [45]. CE is highly dependent on the impact of economic growth [46,47,48]. Existing empirical evidence uncovers a close nexus between growing energy consumption and increasing CE, which constitutes a transmission chain as follows: regional economic development brings about a growth in energy consumption, which, however, is limited by the level of local resource conditions and technologies, and thus the convolution of expansion cannot be realized. Sustainable economic growth results in a strong energy demand that intuitively raises existing CE. Substantial empirical evidence from China, the United States and the European Union suggests that in regions where hybrid energy is highly dependent on fossil fuels, a rise in emissions triggered by economic growth is inevitable [48,49,50]. In such cases, many countries and regions adopt emission reduction policy goals aimed at decreasing the intensity and scale of EC resulting from rapid development of heavy industry [51,52], and implement stricter emission standards, hoping to regulate excessive CE associated with enterprises, and promoting these enterprises to invest more resources for the purpose of achieving low-carbon technology innovation.
Academics are divided on whether raising emission standards and limiting the intensity and scale of emissions policy tools would solve the issues at hand. Solid theoretical support exists for governmental intervention in CE policy. Porter proposed a well-known hypothesis that environmental policy constraints may enable enterprises to achieve technological innovations in their effort to adapt to regulations [39], which directly yield competitive advantages. The weak Porter hypothesis regards the market price mechanism as the implementation mechanism of environmental regulation. In addition, the policy tool guides the pollution behavior of enterprises by changing the price signal. While the strong Porter hypothesis holds that enterprises can immediately benefit from environmental regulation policies and obtain market excess returns, rather than being stimulated by market price mechanisms such as government correction taxes, emission reduction subsidies and license transfer income.
Subsequent studies indicated that, in reality, a host of regulatory policies are realized by distorting the market price mechanism [53,54], and therefore firms tend to evade policies pushing environmental constraints by avoiding price differences [55]. It is hard to observe direct motivation by firms to choose carbon decoupling. Few cases show that enterprises may adapt to the original policy-maker based intentions of achieving low-carbon transformation [56]. International investment moves dirty production to developing countries with laxer emission regulations, for which ample empirical evidence exists in the form of CE transfer [50]. Pollution shelter hypothesis has become the consensus of academia [57]. This concept involves the degradation of environmental and emission standards of economic open regions during the process of realizing their own rapid economic growth compounded by overdrawing environmental carrying capacity and exporting the production transfer of the dirty sector abroad. The gap in environmental emission policy pressure between different countries constitutes a vital driving force in international production transformation.
2.2. Emission Reduction Technology Route and the Choice of Developing Countries
Different levels of development that exist among economies affect the intensity of environmental emission policy pressures. Developing countries and developed countries have completely disparate approaches to dirty production transformation. When faced with environmental pressures, economies choose various and innovative ways to restrain CE. Developed countries were able to afford the high cost of technological transformation, which involves transforming dirty sectors into clean sectors [58], and even adopt market price to expel dirty production from their countries to achieve carbon transfer. More recently, major developed economies have been exploring the process of implementing cleaner production and conducting leapfrog cleaner production innovation. Germany has closed the last coal factory, while France has achieved nuclear power generation, and Denmark as well as Norway are actively building offshore wind power. These countries show a relatively low share of fossil energy consumption and are optimistic about the progress of decoupling carbon from their economic developments.
In some instances, counterpart developing countries do not possess the capacity to undertake the cost of technological innovation from dirty to clean. Therefore, it is more feasible for them to realize gray innovation. Acemoglu et al. [53] pointed out that the innovation foundation and innovation capacity of developing countries are weak, and radical clean technology innovation is risky. Thereby, low-carbon transformation of the original industrial sectors with high emission intensity is more feasible [59]. Numerous empirical studies have shown that many dirty industrial sectors in developing countries that strive to reduce emission intensity and improve the intensity of energy consumption choose gray Innovation [60,61,62,63,64].
In developing countries, abundant policy tools are employed to motivate producers to achieve the innovation transformation from dirty to gray, in terms of environmental regulation policies. Effective mitigation is often the result of a series of policies. During the early stages, tax, CE restriction and emission reduction subsidies, which distort the market price and encourage the emission reduction behavior of enterprises or punish high CE activities, act as continuous incentives for CE reduction. In recent years, market-oriented means of tradable emission permits and CE exchanges have been continuously implemented [65], and policy makers considered whether more market-oriented means can promote dirty innovation of enterprises and stimulate the potential of emission reduction [66,67]. However, few policy tools provided by the government can act as a positive incentive for low-carbon transformation by enterprises immediately. Negative incentives are usually implemented via higher emission restraint standards, and the price signal of market mechanism is used to force enterprises to passively upgrade low-carbon technology.
Above all, we put forward:
Hypothesis 1.
WENGPP access effectively reduced rising total volume of CE in Guangdong.
2.3. Emission Reduction Characteristics and Realization Mechanism of Natural Gas Pipeline Project
Unlike the general gray line, replacement coal by NG is not only an incremental technological advance in reducing emissions, but also one that burns more efficiently than other fossil fuels with a lower cost. Large-scale substitution of NG may verify both strong and weak versions of Porter’s hypothesis [39]. Despite the disparity in NG consumption prices in Europe, North America and Asia, regardless of the price of various policy penalties, it is cheap to drive but expensive to transport, and far more productive than coal and crude oil. Therefore, NG has net price advantage in the energy market over other fossil fuels. Nonetheless, based on the high technical requirements and high cost of NG pipe network construction, it has become a kind of social public goods, which inhibits the popularization of numerous industries and civil applications. In other words, NG delivery services and direct large-scale utilization of NG provided by policy makers can allow market mechanisms to encourage enterprises to transform their energy consumption in the process of Gray Production replacement without additional pressure from emission constraint policy tools. Therefore, low-carbon innovation is actively implemented.
Unlike the general gray line, replacement of coal by NG is not only an incremental technological advance in reducing emissions, but also one that leads to more efficient burn than other fossil fuels with a lower cost. Large-scale substitution with NG may enable both strong and weak versions of Porter’s hypothesis to be verified [38]. Despite the disparities between NG consumption prices in Europe, North America and Asia, and regardless of the prices of various policy penalties, it is cheaper to drive but expensive to transport, and far more productive than coal and crude oil. Therefore, NG is associated with a net price advantage over other fossil fuels in the energy market. Nonetheless, based on high technical requirements and high costs of NG pipe network construction, it has become a source for social or public welfare, which inhibits the popularization in various industries and civil applications. In other words, NG delivery services and direct large-scale utilization of NG provided by policy makers may allow market mechanisms to encourage enterprises to transform their energy consumption in the process of gray production replacement without additional pressure from emission constraint policy tools. Thereby, low-carbon innovation is actively implemented.
For most developing countries, it is easier to achieve gray technology progress via NG replacement within the environmental emission reduction process. However, most countries face difficulties in achieving universal use of NG due to various political environments and economic accumulation levels. Recently, three primary controversies pertaining to the query as to whether large-scale popularization of NG application affects environmental optimization and emission reduction have surfaced. Firstly, the large-scale popularization of NG depends on whether low-carbon emission trade-off effect or price comparison effect plays a leading role; Secondly, should the CE reduction process be dominated by cleaner production or gray production; and lastly, is the market-oriented implementation mechanism of NG substitution more advantageous than the government-dominated implementation mechanism. The above empirical research results are limited by practice and study instruments, and although the construction of WENGPP in China provides great research evidence, it attracts only limited attention from scholars, due to which current literature coverage of this issue remains scant.
In general, literature discussing WENGPP derives from the empirical and factual regularity summary of the Environmental Kuznets Curve (EKC) in policy practice from developing countries. Under the combined effect of government based administrative forces and market price mechanism of environmental regulation, the practical effect of various environmental policy instruments has attracted the attention of the theoretical circle, whereas the low-carbon emission trade-off effect driven by policy coercion has not reached the expectation of policy makers. NG substitution provides a rare piece of special evidence, which indicates that market mechanism may directly encourage enterprises to adopt ECER, although few results have been analyzed from the point of view of a public policy experiment. This study considers the provision of NG transmission and access by the government as a public policy tool. Existing research on NG transportation are more focused on the efficiency of renewable energy production and engineering technology, whereas empirical analyses of its social and economic impact are scant. Existing literature, in particular, has failed to find the uniqueness of WENGPP, a special public policy provision in China.
Given the above analyses, we propose the following mechanism hypothesis:
Hypothesis 2.
WENGPP could reduce total volume of energy consumption to restrict the CE.
Hypothesis 3.
WENGPP could decrease the CE by weakening total energy consumption intensity (TEC/GDP).
Hypothesis 4.
Optimizing the local emission structure of four main CE industrial sectors led WENGPP to restrict the CE.
Globally, the attributes of scale economies result in the requirement of huge amounts of capital and long execution times that span the tenure of policy makers while building and operating national pipelines, making them unsustainable in most developing countries. By contrast, since the reformation and opening up, the continued stability of Chinese governance has enabled long-term planning and finalization of key energy and environmental policy instruments. Economic policies, such as WENGPP, represent quasi-natural experiments. Therefore, this study adopts the RDD method to evaluate the impact of WENGPP on Guangdong province, thereby providing new empirical evidence for existing literature.
3. Methods and Data
3.1. Background
The objective of the WENGPP was to extend the NG transmission network from western to eastern China, delivering large amounts of fuel from gas-rich producing regions in the west to economically developed as well as densely populated regions in east and central China. The first phase of the project, which lasted from 2000 to 2004, stretched across 10 provinces from Xinjiang in the west to Shanghai in the east. The Yangtze River Delta region has benefited from the arrival of WENGPP, which effectively alleviated energy shortage. China’s tough Yangtze River Delta and Pearl River Delta are both economically developed, and densely populated areas open to the whole world. Guangdong’s energy shortage did not benefit from the first stage of WENGPP at that time. This is borne out by a famous case, which involves an incident that occurred in 2008, during which period the international oil price rose to a record high and the domestic coal price soared, compelling the government of Guangdong province to come to Shanxi province and other energy-exporting provinces to purchase coal at a high price to ensure power operation. Therefore, Guangdong province had a strong reason for connecting WENGPP. The second phase of WENGPP is mainly connected to Guangdong province and was fully connected to Hong Kong by the end of 2012, effectively alleviating energy scarcity in Guangdong province.
However, scholars hold different opinions on the nexus between WENGPP and CE. On the one hand, the traditional theory based on EKC contends that WENGPP connection would improve regional economic development. The growth of GDP per capita will lead to increased energy consumption as well as CE, which is termed the expansion of energy consumption effect in this study. Guangdong province represents a typical relatively developed area in a developing country, and its industrial system is export oriented. A developed economy needs to experience inter-regional competition for foreign direct investment (FDI). Hence, Guangdong province operates a large number of overseas industries with high energy consumption and high CE, forming trade carbon transfer. Massive use of NG is likely to accelerate trade carbon transfer, thereby increasing total local CE and its intensity, which further increases the scale of CE.
In contrast, an increasing number of scholars cite the gray innovation transformation plan to contend that, in reality, many environmental regulations and market incentive mechanisms will promote enterprises to choose low-carbon emission reduction paths. Government-led pipeline delivery service is a public product, and heavy consumption of NG in access areas will reduce high CE by coal. Raw coal can be replaced by NG as an industrial and civil fuel in developing countries without complicated technological upgrading. The replacement process is faster than the rate of GDP growth, exactly, and connecting WENGPP can degrade CE, which is called low-carbon emission trade-off effect in this study.
Therefore, assessing the causal effect of WENGPP connectivity on CE in Guangdong province is a novel attempt at addressing the above stated controversies.
3.2. Methods
WENGPP connectivity is regarded as a quasi-natural experiment in this study, while RDD is adopted as the main method that can be used to identify the causal effect between WENGPP and CE. Guangdong’s WENGPP connection may be regarded as a government public policy tool for implementation. Existing discussions of the environmental policy have been limited to taxes, regulations, emission permits and trading for a long period. Actually, the public services provided by the government also show traits similar to those of policy tools. Combined with other policy tools, environmental promotion between the government, markets and enterprises can be more effectively realized. Based on the property of low technical difficulty and low-cost of NG to coal replacement on the equipment, it may be expected that a wide policy diffusion effect will be formed in a short period following the connection. Referring to Imbens and Lemieux, we add discontinuous point impact from policy variables, while retaining the continuous distribution of other influencing variables of carbon emissions in Guangdong province near the policy discontinuous point. The Local Average Treatment Effect (LATE) of WENGPP could be identified through observing the discontinuous point jumping degree of outputs [68,69]. The RDD model sets as a precise time discontinuous point, owing to the WENGPP treatment beginning at a particular threshold in 2012 in accordance with the definition of a running variable argued by Hausman and Rapson [70]. Therefore, the cut-off connected by WENGPP in Guangdong province (defined as policy D, which is a zero/one binary discrete variable) in 2012 is regarded as the precise time discontinuous point, while the macro index of national economic development in Guangdong province is taken as the continuous covariable, and the structural index of its main industrial energy consumption, recorded as energy consumption traits. According to the RDD model, the total carbon emissions (TCE) of Guangdong province is a discontinuous function driven by the above continuous variables. Before and after 2012, it is affected by whether WENGPP is connected or not (D = 0 or 1), and the discontinuous jump generated under the continuous drive of macroeconomic aggregate and energy structure constitutes the causal effect of the policy. The measurement expression is:
3.3. Variables and Data
In order to analyze the impact of WENGPP on carbon emission reduction, based on the existing literature, the variables can be divided into two categories. One is the macroeconomic indicators of local economic development, which affect the total energy consumption and CE, including GDP per capita (AGDP), population (Pop), the second industry increased value (SII), total trade value (TTV), and the total fixed assets investment (Fix). Another consists of local energy consumption structure, specifically, total energy consumption, total carbon emissions, carbon emissions from total raw coal, crude oil, natural gas and cement (see Table 1).
The existing literature indicates that, to analyze the impact of WENGPP on CE reduction, the variables may be divided into two categories: one is the macroeconomic indicators of local economic development, which affect the total energy consumption and CE, including GDP per capita (AGDP), population (Pop), the second industry increased value (SII), total trade value (TTV), and the total fixed assets investment (Fix). The other consists the of local energy consumption structure, specifically, total energy consumption, total carbon emissions, carbon emissions from total raw coal, crude oil, natural gas and cement (Table 1).
The literature pertaining to the association between energy consumption and CE has been drawing more attention in recent years. It is evident that as more energy is consumed, more CE will be discharged [71]. However, CE intensity is also associated with the type of energy source. Diverse fossil consumption preferences are shown in different areas on account of economic development level as well as factor endowment. According to the EKC, CE has an “inverted U shaped” relationship with income, disclosing that an economically developed area may prefer to reduce its CE through a low-carbon approach [45]. Therefore, the purpose of this study is to evaluate the mechanism of WENGPP that restricts CE in Guangdong, a highly affluent region.
3.3.1. Local Carbon Emissions and Total Energy Consumption
Referring to previous literature, we first took local carbon emissions as the explained variable [72], which is a proper indicator that intuitively reflects the quality of the environment. To further examine the accuracy of our previous assumption that WENPGG lowers total energy consumption to reduce CE, we changed our output variable to total energy consumption (TEC) as well as energy intensity (energy consumption index per unit output value, which is calculated by dividing total energy consumption by the GDP) [44,73]. In the short-term, the price comparison effect was more significant with a lower NG price. The panel data of CE, total energy consumption as well as energy intensity of Guangdong province was obtained mainly from the EPS global statistics data center, National Bureau of Statistics of China (NBSC) and China Energy Statistics Yearbook.
3.3.2. Macroeconomic Indicators
This article selected available macroeconomic variables that affect CE. Following the methods of Grossman and Krueger [45], this study adopted AGDP, Pop, SII, TTV, and Fix as control variables. According to Elliott et al., foreign trade may reduce energy intensity by facilitating technology spillovers. AGDP reflects the level of local economic development. Fix represents the industrialization level [74], where prosperous regions usually have a high fix asset investment. The above macroeconomic indicators were collected from Statistical Yearbook of Chinese cities and China Energy Statistics Yearbook.
3.3.3. Energy Consumption Structure
Based on the available studies, we sort out four types of fuel as the main energy consumption structure, which are coal, crude oil, natural gas and cement. With the connection of WENGPP in Guangdong province, the large amount of NG input means the previous energy would be replaced, and the structure of energy consumption would change. Therefore, this paper will further explore which formal energy would be substituted most significantly by the NG as well as the new energy consumption structure.
In this paper, the provincial panel data in Guangdong province is used as the research sample, and the sample period span is 23 years (1997–2020). All major indicators are included in order to avoid the omission of variable bias, and investigate comprehensively the changes of CE intensity during the implementation of the WENGPP. In terms of original data, which comes from the EPS database, State Statistics Bureau, Statistical Yearbook of Chinese cities, and China Energy Database. All of them are logarithmic to close the gap between values and avoid the role of any of them being over-identified. The descriptive statistical analysis of variables is shown in Table 1.
4. Results and Discussion
This section may be divided by subheadings. It should provide a concise and precise description of the experimental results, their interpretation, as well as the experimental conclusions that can be drawn.
4.1. Estimating the Effects of WENGPP on TCE
4.1.1. Basic Regression Discontinuity Design (RDD)
Given Formula (1), we estimated the manner in which WENGPP reduced the total emission of Guangdong province, which plays a crucial role in China. The basic empirical results of the impact of WENGPP on TCE are shown (Figure 1). Based on the RDD, we documented a year span of three bandwidths (50, 100, 200). All depicted a similar steep rising trend until the discontinuous point was reached, following which the discontinuous point declines and maintains a slow increasing pace. A plot of the results of the Wald test sans any control variables, (Table 2) shows that the regular span (100-span) of bandwidth as well as the 50-span of bandwidth passed the 1% significance level. Hypothesis 1 has been proofed that WENGPP access effectively reduced the rising total volume of CE in Guangdong.
These empirical results demonstrated that CE was continuously growing until the implementation of WENGPP, which slowed the ascent. This indicated that NG, when used widely, may effectively lower the level of CE. Some literature revealed a negative correlation between energy intensity and the energy price index [75,76]. After WENGPP was connected to the Guangdong province, most regimes tended to choose the cheaper NG as an energy substitute for coal, which can avoid cost associated losses [77] and also restrain CE. However, CE would doubtlessly continue to grow with sustained and high NG consumption.
4.1.2. RDD Estimation with Control Variables
Concerning the possibility of over-identifying the estimated results, we added the control variables, LnAGDP, Lnpop, LnSII, Lnfix, and LnTTV, to examine robustness. The RD result obtained after controlling the macroeconomic indicators, which is similar to the previous result (Figure 1), is shown (Figure 2). The Wald test of the regular span of bandwidth (Table 3) was significant at the 1% level, thereby verifying the robustness of our original results. It was revealed that the average treatment effect (ATE) of reducing emission approximated 10.68% in the short-term and 19.06% in the long-term.
4.2. Robustness Tests
We tested the robustness of the above stated empirical results using the “Multinomial kernel test”. Firstly, we performed a “High order polynomial test” to confirm the robustness of RDD estimation results. Secondly, we changed the “kernel estimation test” using rectangular kernel estimators to replace default triangle estimators, to verify the robustness of our major conclusions. The results indicated that altering kernel estimators made no difference to the basic estimating results at all, which supported our initial conclusion. In addition, we also tested covariate continuity to ensure that the assumption of covariates being continuous was accurate, thereby avoiding endogeneity, which could affect our estimation.
4.2.1. Multinomial Kernel Test
- Triangular kernel test
A default triangle-kernel test was used to judge the robustness of the conclusion. In order to accurately test the above results, we conducted triangular kernel tests of the order 1–4, respectively (Figure 3). The test results were robust, demonstrating that based on any order of the triangle-kernel test, the trend would always rise steadily before the discontinuous point appears, and then again rise steadily until the discontinuous point dips, the findings of which were consistent with our conclusions.
4.2.2. Rectangular Kernel Test
To ensure the robustness of the empirical results, we substituted the rectangular kernel test for the triangular kernel test of the order 1–4 (Figure 3). Similarly, the results were consistent with our expectation that the whole trend as well as the discontinuous point jump direction in the figure would be the same as those of the former, triangle-kernel test results. Thus, the robustness of our conclusions was consolidated via two kinds of kernel tests.
- 2.
- Covariate continuity test
We further conducted a covariate continuity test to exclude the impact of endogeneity. Firstly, we tested one of the main covariates, GDP per capita (LnAGDP). The results illustrated that LnAGDP had no obvious downward dip, and therefore could be considered as continuous (Figure 4a–c). The results showed that under the regular bandwidth span, the Wald test passed significantly at the 1% level (Table 4). Under the 200 span of bandwidth, the Wald test was insignificant at the 11% level (p ~ 0.11). The optimal bandwidths of the regular span, the short 50 span, and the long 200 span were 2.74, 1.37, 5.47 years, respectively. Thus, the evidence did not indicate that the covariate LnAGDP was discontinuous.
Subsequently, we tested the other covariates (Lnpop, LnSII, Lnfix, LnTTV) to observe their continuities. The test results of the covariate Lnfix are shown (Figure 4g–i). The three bandwidth types all showed an absolutely continuous trend without any noticeable jump, the results of which were consistent with our expectations. The optimal bandwidths of Ln fix were 4.87 (regular span), 2.43 (50 span), 9.76 (200 span), respectively, wherein the level of 50 span was significant at the 1% level (Table 4).
Similarly, the test results demonstrated that the covariate Lnpop was also sequential (Figure 4d–f). The discontinuous point does not show any apparent jump in any direction. Its optimal bandwidth of regular span, which was 2.74, passed the significance test at the 1% level. Therefore, there was no evidence to indicate that the covariates were discontinuous. Besides, with respect to the other covariates, LnSII and LnTTV, the former passed the Wald test at 1% significance level under all three types of bandwidths test (Table 4); the optimal bandwidths were 4.24 (regular), 2.12 (50), and 8.48 (200), respectively, (Figure 4m–o). Notwithstanding, none of the bandwidths of LnTTV were noticeable, whereas the bandwidth of regular span was insignificant at the 11.9% level. According to Elliott [78], foreign trade may decrease energy intensity, and therefore, energy consumption may be inhibited by LnTTV.
Overall, all covariates, except LnTTV, passed the covariate continuity test. These test results, as well as the RDD empirical results, are consistent with the above shown kernel tests, thereby strongly supporting the robustness of our original conclusions.
5. Further Analysis
The baseline results shed light on the remarkable inhibiting effect exerted on TCE in Guangdong province by the WENGPP connection in 2012. This policy effect can be divided into two possible influence approaches. Firstly, it achieves scale control of emissions via scale control of energy consumption, referred to as “energy consumption control effect.” Secondly, the “intensive emission effect”, which improves combustion efficiency via a trade-off between low-carbon energy and the advancement of gray technology innovation, leads to a reduction in emission intensity. In the next stage, we constructed a RDD framework consisting of two primary indicators, TCE and energy intensity, to investigate whether an emission reduction effect can be achieved via any one of these mechanisms. On the above basis, we will further discuss whether there is a structural effect leading to a periodic reduction in regional TCE, by identifying changes in the emission ratio structure of the four industrial sectors that mainly produce TCE in Guangdong province.
5.1. Approach of Total Energy Consumption (TEC)
Adjusting the scale of energy consumption usually causes a reduction in TCE. However, it is evident that an exogenous shock or a significant reduction in TEC, which occurred in Guangdong during the observation period, interfered with our major conclusions. A trend in the large-scale use of NG can be established in terms of the connectivity policy of NG pipelines. The effect of expanding total NG use counteracts the effect of emission reduction due to improved combustion efficiency, thereby increasing the total energy consumption of Guangdong.
To further analyze how WENGPP affects energy consumption, which restrains TCE, we shifted the explained variable into TEC. We still adopted the RDD method to conduct the empirical test, and also the time node of policy intervention in 2012. Even the control variables remained the same as those in the previous study. As shown in Figure 5, with respect to the three kinds of span bandwidths, the red line indicates that initially the TEC increased rapidly, and then rose steadily until the discontinuous point was reached, upon which the discontinuous point dipped and then ascended slowly.
The bandwidths of both regular span and 200 span passed the Wald test at significance levels of 5% and 1%, respectively (Table 5); the optimal bandwidth under the 200 span bandwidth was 6.83-years. These empirical results clearly indicated that prior to policy intervention, TEC showed a dramatic increase by rising to a peak of 19.5. However, the descent in TEC, which followed the policy intervention of 2012, indicated that there was a substitution between coal and NG in the short-term. For gas input provinces, such as Guangdong, it is preferable to use NG in terms of purchasing costs as well as environmental protection [79,80], and thus TEC saw a decrease for a short period. Correspondingly, the empirical results showed that TCE had declined remarkably (Figure 1 and Figure 2), which was a result consistent with that of hypothesis 2. All results (Figure 1, Figure 2 and Figure 5) also indicated that implementing the WENGPP had exerted a positive effect on ECER [43]. Hypothesis 2 has been proofed.
5.2. Approach of Energy Intensity (TEC/GDP)
Reduction in energy intensity attenuates TCE via intensive economic development. The association between energy intensity and TCE has attracted much attention. In China, the primary cost of energy, including that of NG, is strictly regulated via government supervision. It is certain that energy efficiency will decline under such regulation, accompanied by a simultaneous increase in energy intensity [44]. Therefore, an investigation of the manner in which energy intensity affects TCE was felt to be warranted.
Under the span of the three bandwidths, the trend of lines was almost analogous (Figure 6). Prior to policy intervention, the red solid line drops smoothly, at which point the discontinuous point rises, and finally the green dotted line descends along a similar slope. It is evident that NG substitutes for coal for a short period. The continuous decrease that occurs later indicates that the price comparison effect inspires firms to employ low-cost energy for production purposes as much as possible. Compared with earlier research [59], the results which were revealed is more clearly insignificant. Although the LATE results were insignificant under the 200 years span of bandwidth, the coefficient was positive, revealing that the higher the energy intensity, the higher the TCE was (Table 6); a result which met our expectations. Hypothesis 3 has not been proofed.
5.3. Structural Changes in TCE from Major Industrial Sectors
There are four main types of CE sources in industrial sectors. Industrial changes in the emission structure of TCE sectors may lead to the overall decline of regional CE, which often stem from the market or policy impact of their respective industries. Based on the above results, it is clear that implementation of WENGPP will noticeably reduce CE, but as to how the mechanism affects the CE, information is limited in the existing literature [81,82]. Thereby, this paper tries to further explore how the WENGPP affects the four main types of CE sources, including raw coal, crude oil, natural gas and cement.
Figure 7a–c demonstrate the results of CE from total raw coal under three types of year span bandwidths. Firstly, the red solid line rapidly grows, then the discontinuous point jumps downwards, and later the green dotted line flattens smoothly. It can be seen that CE from raw coal is down, indicating the amount of coal consumption is declined, and WENGPP plays a mission-critical role in ECER. The Wald test results are obtained in Table 7, and the bandwidth is passed at 1% significance level under the 200 span.
The CE results of crude oil and cement under three bandwidths spanning varying numbers of years, respectively, are shown (Figure 7d–i). Although their specific curves differ, the overall trends are same, where both curves rise dramatically and then dip down at the break point. However, for crude oil, a gentle rise is seen, whereas for cement, a dramatic increase close to the previous slope was observed. The robustness tests for crude oil and cement showed that under the 200 span, crude oil was significant at the 10% level, while cement was significant at the 5% level (Table 7).
The above three sources of CE all displayed a discontinuous point drop, indicating that CE generated by these three energy structures was reduced during WENGPP implementation, which reduction may be regarded as a trade-off effect work out. We speculated that it was caused by the increase in NG consumption, as mentioned in Section 4.1 of the empirical analysis.
As shown in Figure 7j–l under a bandwidth with a regular year span, CE generated by NG declines gently at first, and then increases rapidly until the discontinuous point jumps upward and rises slowly. This shows that during WENGPP implementation, NG consumption increases along a continuous growth trend. Under the 50-year span bandwidth, the discontinuous point dips and then rises slowly, which responds to an important high between the price comparison effect and the low-carbon emission trade-off effect in part 1. Empirical results indicate that the low-carbon emission trade-off effect is predominant. If the price comparison effect prevails for regimes that are sensitive to cost, the consumption of cheaper NG would rise sharply for gas input provinces during short bandwidth periods. Therefore, we considered the low-carbon emission trade-off effect to be the main cause. As the government initially requires a period to evaluate the effect of NG substitution on ECER, the policy involves a lag phase. The discontinuous point dips under the 200-year span bandwidth. With respect to establishing long-term ECER, clean energy, which produces less CE, must be vigorously developed. Although NG exerts a low-carbon emission trade-off effect and a price comparison effect compared with traditional coal power generation, it is not as effective as clean energy. Given China’s stated goal of achieving carbon peak and carbon neutrality by 2060, clean energy will be the preferred option of the government. Finally, both the 50-year span bandwidth and the 200-year span bandwidth passed the Wald test at 1% and 5% significance level (Table 7), wherein the optimal bandwidths were 2.95-years and 11.80-years, respectively. Thus, Hypothesis 4 has been proofed.
6. Discussion
The above empirical results demonstrated that WENGPP is a policy instrument that could effectively restrain CE in Guangdong, wherein the inhibiting mechanism is reflected in two ways. Firstly, the CE levels associated with NG are lower than those of high carbon energy, such as coal, and produce a low-carbon emission trade-off effect under the same energy consumption scale. Secondly, the price comparison effect under the same energy consumption scale, which stems from the stable market price of NG as well as its combustion efficiency, is higher than that of coal. According to Porter’s strong hypothesis, by choosing NG as the primary energy source, enterprises would intuitively gain a cost advantage, thus creating a direct market performance incentive for emission reduction.
6.1. Low-Carbon Emission Trade-Off Effect of EC
An RDD identification strategy was applied to study CE of Guangdong, and simultaneously, 2012 was taken as the discontinuity point of WENGPP. Empirical results showed that a noticeable inhibition effect was exerted on CE. LATE results (Table 2) showed a short-term decrease of 14.77% and a long-term average inhibition effect of 12.50%, proving that the total effect of this policy instrument reduced the original CE in Guangdong. Comprehensive evaluation of emission reduction effect displayed that CE decreased significantly in the short-term and gradually under the medium-and-long-term bandwidth. The slope corresponding to CE growth trend after the discontinuity point of policy impact was generally flat, while effective emission reduction continued within a bandwidth extension period of 15.43 years (Figure 1). Continuous completion of the NG pipeline in each regional branch within the provinces [83,84], enabled the regional CE of Guangdong to benefit from the WENGPP policy tool, and continue vigorously, thereby promoting the low-carbon emission trade-off for a long time after 2012 [85]. A review of the above process indicated that it was a progressive technological process that enabled dirty production innovation to be realized [86], and that it not only sustains local economic growth but also upgrades traditional export-oriented manufacturing systems [87], thereby creating favorable conditions to effect cleaner production in China.
6.2. Price Comparison Effect and Energy Consumption Variation
To further verify the trends shown by changes in NG that are actively taking place in coal and crude oil, we analyzed the RDD results of emission sources of four major industrial sectors in Guangdong province (Figure 7 and Table 7). In addition to discontinuity point jump characteristics reported in the results, it was observed that the slope showing the growth of NG emissions after the discontinuity point in 2012 gradually steepened. Correspondingly, the slope changes of the other three types of energy also slowed down. The results of long bandwidth estimation showed that the price comparison effect played a crucial role in the long-term emission trends shown by NG, wherein the slope showed a sharp rise. This may be attributed to the fact that, although China’s NG price has been regulated by the government for a long time, a market price formation mechanism had not been established [88]. However, cyclic fluctuations in fossil energy (such as coal and crude oil) prices, as determined by the market, have resulted in the thermal energy price of NG becoming increasingly prominent, which encourages people to use NG more frequently [89]. The main reason for this phenomenon is that, in 2019, China began loosening market price controls for NG, inspiring market price mechanisms to regulate user behavior to better promote ECER [90]. After 2012, increasing stringent environmental emission standards, numerous restrictions on emission restriction policies, and implementation of market-oriented policy tools such as CE trading (ETS) in Guangdong in 2016, have all compelled firms to consciously choose cleaner energy. Alteration in the emission structures of major industrial sectors is mainly due to eliminated outdated capacity, due to China’s supply-side reforms, and the out-relocation of high emission industries based on the transformation and upgrading of the manufacturing industry in Guangdong province. They will not be discussed in detail here.
6.3. Implementation Mechanism of Low-Carbon Trade-Off of NG
To further analyze the dominant mechanism of WENGPP, we compared the empirical results of total CE, total energy consumption and CE intensity in Guangdong province. Our results showed that large-scale consumption of NG generates a more noticeable low-carbon emission trade-off effect than the price comparison effect, which confirmed the conclusions of Xu and Chen [59]. The implementation NG is oriented by the market and supported by the government that provides policy tools to public energy transportation services as well as subsidies for conversion costs. Therefore, Porter’s strong hypothesis is verified in the WENGPP connection process [39]. All enterprises and individuals that utilize NG replacement acquire a cheap energy supply, which forms intuitive market incentives, conferring a cost advantage to enterprises that use higher combustion efficiency and cleaner fuel [91]. Thereby, companies were able to spontaneously choose this gray technology innovation approach without enacting additional environmental restraint policies to impose inverted constraints by government [92]. Although it is cost-effective, a large number of businesses and residents, even in prosperous provinces such as Guangdong, cannot afford to use alternative low-carbon energy. Hence, the government continued to offer subsidies for gas equipment replacement and improvement until 2020 [93]. It is a common phenomenon in China, that WENGPP connected areas subsidize users who replace their original coal burning equipment during the renovation of NG pipelines [63]. Overall, the implementation mechanism underlying NG substitution is a mix of market-led and government-guided approaches, none of which should be neglected.
7. Conclusions
The main objective of this study was to adopt a precise method that could be used to evaluate the effect of WENGPP implementation in Guangdong on CE reduction. Widespread utilization of NG is considered as a gray technology innovation approach used by developing countries to address emission reduction pressures and adopt sustainable development measures. WENGPP is a public policy instrument that aids the government to promote the popularity of low-carbon energy across the country, via the construction of public infrastructure for energy transmission. Based on a quasi-natural experiment using RDD strategy, we made a causal inference regarding the effect of WENGPP policy on the scale of CE in Guangdong, an economically developed region of China. The results indicated that WENGPP not only alters the short-term and long-term growth trend of CE in Guangdong, but also provides an effective energy supply to Guangdong, enabling further implementation of a more stringent emission restriction system and promoting high-quality economic growth.
More specifically, in terms of the CE reduction mechanism, the impact of WENGPP applies mainly in two ways: (i) through the low-carbon emission trade-off effect, wherein consumers who adopted NG conversion are able to achieve lower CE levels and gain emission advantages under an increasingly strict policy constraint trend; and (ii) through price comparison effect, where high combustion efficiency of consumed NG combines with low energy consumption costs to reduce a proportion of the original high energy consumption, linked to sources such as coal and crude oil in the emission structure, thus gradually promoting the optimization of regional emission structure.
Most developing countries that face the pressures of emission reduction, should abandon dirty production and follow approaches similar to WENGPP that utilize NG and other low-carbon energies to realize gray production. However, generating clean power is too expensive for most less developed countries where technical barriers limit its introduction and adoption [94]. Under such circumstances, the example of NG substitution for purposes of emission reduction in Guangdong may provide an effective policy reference for developing countries, hoping to achieve emission reduction in economically developed areas [95].
Based on the above findings, policy makers in other developing countries may refer to these policy implications in order to improve the low-carbon emission trade-off strategy of emission reduction:
Firstly, policy makers should vigorously promote consumption of low-carbon energy such as NG. There is a need to complete the construction of energy transmission and distribution infrastructure at the national level. Moreover, the market advantage of low-carbon energy utilization will drive enterprises to spontaneously prefer NG, although the high cost of transportation facilities and the entire design of distribution grip is overwhelming meant for the private sector. The government only provides NG access services through long-term energy construction plans, which will significantly enhance the low-carbon emission trade-off effect.
Secondly, it is essential to rationalize the mechanism of market price via NG input in developing countries. Intercontinental differences that exist between NG prices worldwide lead to drastic fluctuations in NG costs. Thus, state-dominated NG purchases can greatly reduce its cost, whereas the rigidity of the domestic market price will lead to low efficiency or excessive use of NG, which is not conducive to the development of the domestic energy economy and CE reduction. A flexible domestic NG price market is an effective way to use market mechanisms, in a manner which encourages ECER.
Lastly, optimization of the local economic structure may initiate continuous improvement of emission structure. Developed regions should not only curb their own CE, but also prevent the relocation of energy-intensive and high emission industries from raising CE elsewhere. Therefore, maintaining the intensity of CE reduction policies in various places in China and reducing the formation of “pollution heaven“ may enable the benefits associated with the entire emission reduction effort to be realized.
This study analyzes the impact of WENGPP on the scale of CE in Guangdong province and reveals the mechanism and methodology leading to its realization. However, some limitations may affect these efforts. Firstly, Guangdong province was selected from the second batch of WENGPP connected provinces, although Jiangsu and other provinces in the Yangtze River Delta had already been connected to WENGPP since 2009. There is some doubt as to whether the ECER effect on Guangdong is representative, compared to the former 10 provinces and regions selected during the first phase of ventilation. If relevant data for the full sample of provinces in China are available for future evaluation, we will further explore the impact of WENGPP policy at the state-level and evaluate heterogeneity characteristics. Furthermore, the local government environmental accountability system was implemented in 2011, and the ECER policy was included in the government’s development goals. The policy effect will alter the implementation intensity of the original emission restriction policy tools. Moreover, after China signed the Paris Climate Agreement in 2016, a series of environmental regulations and market-oriented emission reduction tools, such as ETS were introduced. Whether the impact of these policies affected Guangdong needs further evaluation. Finally, theoretically, NG connection exerts a significant effect on regional CE, SO2 emissions and PM2.5 air particulate emissions. Research studies that further explore other environmental emission reduction effects caused by WENGPP connection, will expectedly enrich empirical evidence gathered from existing research.
Author Contributions
Conceptualization, C.C. and Z.Y.; methodology, C.C.; software, Z.Y.; validation, Z.Y.; formal analysis, Z.Y.; investigation, C.C.; resources, C.C.; data curation, Z.Y.; writing—original draft preparation, Z.Y.; writing—review and editing, C.C.; visualization, Z.Y.; supervision, Z.Y.; project administration, C.C.; funding acquisition, C.C. All authors have read and agreed to the published version of the manuscript.
Funding
This research is funded by Outstanding Young and Middle-aged Scientific and Technological Innovation Team project of Colleges and Universities in Hubei Province “Innovation and Entrepreneurship Performance Evaluation Research” (Project No.: T201940).
Institutional Review Board Statement
Not applicable.
Informed Consent Statement
Not applicable.
Data Availability Statement
Not applicable.
Acknowledgments
The authors would like to express gratitude to the editor and anonymous referees for their insightful and constructive comments. The work is supported by the Science Research Key Project of Wenhua College (NO. 2020Y13).
Conflicts of Interest
The authors declare no conflict of interest.
References
- Mendels, F.F. Proto-industrialization: The first phase of the industrialization process. J. Econ. Hist. 1972, 32, 241–261. [Google Scholar] [CrossRef]
- Berthélemy, J.C.; Söderling, L. The role of capital accumulation, adjustment and structural change for economic take-off: Empirical evidence from African growth episodes. World Dev. 2001, 29, 323–343. [Google Scholar] [CrossRef] [Green Version]
- Hidalgo, A.; Molero, J.; Penas, G. Technology and industrialization at the take-off of the Spanish economy: New evidence based on patents. World Pat. Inf. 2010, 32, 53–61. [Google Scholar] [CrossRef] [Green Version]
- Hondroyiannis, G.; Lolos, S.; Papapetrou, E. Energy consumption and economic growth: Assessing the evidence from Greece. Energy Econ. 2002, 24, 319–336. [Google Scholar] [CrossRef]
- Ozturk, I.; Acaravci, A. CO2 emissions, energy consumption and economic growth in Turkey. Renew. Sust. Energy Rev. 2010, 14, 3220–3225. [Google Scholar] [CrossRef]
- Zhang, X.P.; Cheng, X.M. Energy consumption, carbon emissions, and economic growth in China. Ecol. Econ. 2009, 68, 2706–2712. [Google Scholar] [CrossRef]
- Shafik, N. Economic development and environmental quality: An econometric analysis. Oxf. Econ. Papers 1994, 46, 757–773. [Google Scholar] [CrossRef]
- Shahbaz, M.; Nasreen, S.; Abbas, F.; Anis, O. Does foreign direct investment impede environmental quality in high-middle-and-low-income countries? Energy Econ. 2015, 51, 275–287. [Google Scholar] [CrossRef]
- Ulucak, R.; Bilgili, F. A reinvestigation of EKC model by ecological footprint measurement for high, middle and low income countries. J. Clean. Prod. 2018, 188, 144–157. [Google Scholar] [CrossRef]
- Guzel, A.E.; Arslan, U.; Acaravci, A. The impact of economic, social, and political globalization and democracy on life expectancy in low-income countries: Are sustainable development goals contradictory? Environ. Dev. Sustain. 2021, 23, 13508–13525. [Google Scholar] [CrossRef]
- Boyle, M.; Kiel, K. A survey of house price hedonic studies of the impact of environmental externalities. J. Real Estate Lit. 2001, 9, 117–144. [Google Scholar] [CrossRef]
- Schauer, M.J. Estimation of the greenhouse gas externality with uncertainty. Environ. Resour. Econ. 1995, 5, 71–82. [Google Scholar] [CrossRef]
- Ward, J.W.; Michalek, J.J.; Samaras, C. Air Pollution, Greenhouse Gas, and Traffic Externality Benefits and Costs of Shifting Private Vehicle Travel to Resourcing Services. Environ. Sci. Technol. 2021, 55, 13174–13185. [Google Scholar]
- Sanglimsuwan, K. The relationship between health and environment: Econometric Analysis. In Proceedings of the First International Conference on Interdisciplinary Research and Development, Bangkok, Thailand, 2–3 June 2011. [Google Scholar]
- Ali, M.U.; Gong, Z.; Ali, M.U.; Wu, X.; Yao, C. Fossil energy consumption, economic development, inward FDI impact on CO2 emissions in Pakistan: Testing EKC hypothesis through ARDL model. Int. J. Financ. Econ. 2021, 26, 3210–3221. [Google Scholar] [CrossRef]
- Li, H.; Li, B.; Lu, H. Carbon dioxide emissions, economic growth, and selected types of fossil energy consumption in China: Empirical evidence from 1965 to 2015. Sustainability 2017, 9, 697. [Google Scholar] [CrossRef] [Green Version]
- Solomon, S.; Plattner, G.K.; Knutti, R.; Friedlingstein, P. Irreversible climate change due to carbon dioxide emissions. Proc. Natl. Acad. Sci. USA 2009, 106, 1704–1709. [Google Scholar] [CrossRef] [Green Version]
- Weston, D. The Political Economy of Global Warming: The Terminal Crisis; Routledge: London, UK, 2014. [Google Scholar]
- Wang, S.; Li, Q.; Fang, C.; Zhou, C. The relationship between economic growth, energy consumption, and CO2 emissions: Empirical evidence from China. Sci. Total. Environ. 2016, 542, 360–371. [Google Scholar] [CrossRef]
- Xu, B.; Chen, W.; Zhang, G.; Wang, J.; Ping, W.; Luo, L.; Chen, J. How to achieve green growth in China’s agricultural sector. J. Clean. Prod. 2020, 271, 122770. [Google Scholar] [CrossRef]
- Zou, C.; Zhao, Q.; Zhang, G.; Xiong, B. Energy revolution: From a fossil energy era to a new energy era. Nat. Gas Ind. B 2016, 3, 1–11. [Google Scholar] [CrossRef] [Green Version]
- Yang, F.; Cheng, Y.; Yao, X. Influencing factors of energy technical innovation in China: Evidence from fossil energy and renewable energy. J. Clean. Prod. 2019, 232, 57–66. [Google Scholar] [CrossRef]
- Long, X.; Naminse, E.Y.; Du, J.; Zhuang, J. Nonrenewable energy, renewable energy, carbon dioxide emissions and economic growth in China from 1952 to 2012. Renew. Sust. Energy Rev. 2015, 52, 680–688. [Google Scholar] [CrossRef]
- Zhang, Y.J.; Da, Y.B. The decomposition of energy-related carbon emission and its decoupling with economic growth in China. Renew. Sust. Energy Rev. 2015, 41, 1255–1266. [Google Scholar] [CrossRef]
- Wang, Q.; Su, M.; Li, R. Toward to economic growth without emission growth: The role of urbanization and industrialization in China and India. J. Clean. Prod. 2018, 205, 499–511. [Google Scholar] [CrossRef]
- Han, X.; Xu, Y.; Kumar, A.; Lu, X. Decoupling analysis of transportation carbon emissions and economic growth in China. Environ. Prog. Sustain. 2018, 37, 1696–1704. [Google Scholar] [CrossRef]
- Hao, Y.; Huang, Z.; Wu, H. Do carbon emissions and economic growth decouple in China? An empirical analysis based on provincial panel data. Energies 2019, 12, 2411. [Google Scholar] [CrossRef] [Green Version]
- Wang, Q.; Jiang, R. Is China’s economic growth decoupled from carbon emissions? J. Clean. Prod. 2019, 225, 1194–1208. [Google Scholar] [CrossRef]
- Li, G.; Wei, W. Financial development, openness, innovation, carbon emissions, and economic growth in China. Energy Econ. 2021, 97, 105194. [Google Scholar] [CrossRef]
- Hirvonen, J.; Jokisalo, J.; Heljo, J.; Kosonen, R. Towards the EU emission targets of 2050: Cost-effective emission reduction in Finnish detached houses. Energies 2019, 12, 4395. [Google Scholar] [CrossRef] [Green Version]
- Xia, C.; Wang, Z. The effect of fossil fuel and hydropower on carbon dioxide emissions: EKC validation with structural breaks. J. Environ. Eng. Landsc. 2020, 28, 36–47. [Google Scholar] [CrossRef] [Green Version]
- Wang, Y.; Chen, L.; Kubota, J. The relationship between urbanization, energy use, and carbon emissions: Evidence from a panel of Association of Southeast Asian Nations (ASEAN) countries. J. Clean. Prod. 2016, 112, 1368–1374. [Google Scholar] [CrossRef]
- Wang, Q.; Zhao, M.; Li, R.; Su, M. Decomposition and decoupling analysis of carbon emissions from economic growth: A comparative study of China and the United States. J. Clean. Prod. 2018, 197, 178–184. [Google Scholar] [CrossRef]
- Lanoie, P.; Patry, M.; Lajeunesse, R. Environmental regulation and productivity: Testing the porter hypothesis. J. Prod. Anal. 2008, 30, 121–128. [Google Scholar] [CrossRef]
- Goulder, L.H.; Morgenstern, R.D.; Munnings, C.; Schreifels, J. China’s national carbon dioxide emission trading system: An introduction. Econ. Energy Environ Policy 2017, 6, 1–18. [Google Scholar] [CrossRef]
- Tang, L.; Wang, H.; Li, L.; Yang, K.; Mi, Z. Quantitative models in emission trading system research: A literature review. Renew. Sustain. Energy Rev. 2020, 132, 110052. [Google Scholar] [CrossRef]
- Asimakopoulos, K.; Grimalt-Alemany, A.; Lundholm-Høffner, C.; Gavala, H.N.; Skiadas, I.V. Carbon Sequestration through Syngas Biomethanation Coupled with H2 Supply for a Clean Production of Natural Gas Grade Biomethane. Waste Biomass Valori. 2021, 12, 6005–6019. [Google Scholar] [CrossRef]
- Wang, L.; Patel, P.L.; Yu, S.; Liu, B.; McLeod, J.; Clarke, L.E.; Chen, W. Win–win strategies to promote air pollutant control policies and non-fossil energy target regulation in China. Appl. Energy 2016, 163, 244–253. [Google Scholar] [CrossRef]
- Porter, M. American Green Strategy. Sci. Am. 1991, 264, 168. [Google Scholar] [CrossRef]
- Chen, W.; Li, H.; Wu, Z. Western China energy development and west to east energy transfer: Application of the Western China Sustainable Energy Development Model. Energy Policy 2010, 38, 7106–7120. [Google Scholar] [CrossRef]
- Zhou, X.J. Structural design of mountain tunnels in the 3rd pipeline project of natural gas transmission from west to east China. In Advanced Materials Research; Trans Tech Publications Ltd.: Bäch, Switzerland, 2014; pp. 217–220. [Google Scholar]
- Liu, E.; Kuang, J.; Peng, S.; Liu, Y. Transient operation optimization technology of gas transmission pipeline: A case study of west-east gas transmission pipeline. IEEE. Access 2019, 7, 112131–112141. [Google Scholar] [CrossRef]
- Wu, J.; Cui, C.; Guo, X. Impacts of the West–East Gas Pipeline Project on energy conservation and emission reduction: Empirical evidence from Hubei province in Central China. Environ. Sci. Pollut. Res. 2022, 29, 1–17. [Google Scholar]
- Shen, X.B.; Chen, Y.; Lin, B.Q. The impact of technological progress and industrial structure distortion on China’s energy intensity. Econ. Res. J. 2021, 7, 157–173. (In Chinese) [Google Scholar]
- Grossman, G.M.; Krueger, A.B. Economic growth and the environment. Q. J. Econ. 1995, 110, 353–377. [Google Scholar] [CrossRef] [Green Version]
- Selden, T.M.; Song, D. Environmental quality and development: Is there a Kuznets curve for air pollution emissions? J. Environ. Econ. Manag. 1994, 27, 147–162. [Google Scholar] [CrossRef]
- Vincent, J.R. Testing for environmental Kuznets curves within a developing country. Environ. Dev. Econ. 1997, 2, 417–431. [Google Scholar] [CrossRef]
- Kaika, D.; Zervas, E. The Environmental Kuznets Curve (EKC) theory—Part A: Concept, causes and the CO2 emissions case. Energy Policy 2013, 62, 1392–1402. [Google Scholar] [CrossRef]
- Diao, X.D.; Zeng, S.X.; Tam, C.M.; Tam, V.W. EKC analysis for studying economic growth and environmental quality: A case study in China. J. Clean. Prod. 2009, 17, 541–548. [Google Scholar] [CrossRef]
- Dogan, E.; Turkekul, B. CO2 emissions, real output, energy consumption, trade, urbanization and financial development: Testing the EKC hypothesis for the USA. Environ. Sci. Pollut. Res. 2016, 23, 1203–1213. [Google Scholar] [CrossRef]
- Xu, B.; Chen, J. How to achieve a low-carbon transition in the heavy industry? A nonlinear perspective. Renew. Sustain. Energy Rev. 2021, 140, 110708. [Google Scholar] [CrossRef]
- Dogan, E.; Inglesi-Lotz, R. The impact of economic structure to the environmental Kuznets curve (EKC) hypothesis: Evidence from European countries. Environ. Sci. Pollut. Res. 2020, 27, 12717–12724. [Google Scholar] [CrossRef]
- Acemoglu, D.; Aghion, P.; Bursztyn, L.; Hemous, D. The environment and directed technology change. Am. Econ. Rev. 2012, 102, 131–166. [Google Scholar] [CrossRef] [Green Version]
- Costantini, V.; Crespi, F.; Martini, C.; Pennacchio, L. Demand-pull and technology-push public support for eco-innovation: The case of the biofuels sector. Res. Policy 2015, 44, 577–595. [Google Scholar] [CrossRef]
- Abrell, J.; Rausch, S. Combining price and quantity controls under partitioned environmental regulation. J. Public Econ. 2017, 145, 226–242. [Google Scholar] [CrossRef] [Green Version]
- Li, F.; Xu, X.; Li, Z.; Du, P.; Ye, J. Can low-carbon technological innovation truly improve enterprise performance? The case of Chinese manufacturing companies. J. Clean. Prod. 2021, 293, 125949. [Google Scholar] [CrossRef]
- Mani, M.; Wheeler, D. In search of pollution havens? Dirty industry in the world economy, 1960 to 1995. J. Environ. Dev. 1998, 7, 215–247. [Google Scholar] [CrossRef]
- Soytas, U.; Sari, R.; Ewing, B.T. Energy consumption, income, and carbon emissions in the United States. Ecol. Econ. 2007, 62, 482–489. [Google Scholar] [CrossRef]
- Xu, R.; Xu, B. Exploring the effective way of reducing carbon intensity in the heavy industry using a semiparametric econometric approach. Energy 2022, 243, 123066. [Google Scholar] [CrossRef]
- Niu, S.; Ding, Y.; Niu, Y.; Li, Y.; Luo, G. Economic growth, energy conservation, and emissions reduction: A comparative analysis based on panel data for 8 Asian Pacific countries. Energy Pol. 2011, 39, 2121–2131. [Google Scholar] [CrossRef]
- Apergis, N.; Ozturk, I. Testing environmental Kuznets curve hypothesis in Asian countries. Ecol. Indicat. 2015, 52, 16–22. [Google Scholar] [CrossRef]
- Keho, Y. The impact of trade openness on economic growth: The case of Cote d’Ivoire. Cogent. Econ. Financ. 2017, 5, 1332820. [Google Scholar] [CrossRef]
- Liu, H.; Ou, X.; Yuan, J.; Yan, X. Experience of producing natural gas from corn straw in China. Resour. Conserv. Recy. 2018, 135, 216–224. [Google Scholar] [CrossRef]
- Anwar, A.; Siddique, M.; Dogan, E.; Sharif, A. The moderating role of renewable and non-renewable energy in environment-income nexus for ASEAN countries: Evidence from Method of Moments Quantile Regression. Renew. Energy 2021, 164, 956–967. [Google Scholar] [CrossRef]
- Goulder, L.H.; Schein, A.R. Carbon taxes versus cap and trade: A critical review. Clim. Chang. Econ. 2013, 4, 1350010. [Google Scholar] [CrossRef]
- Wang, P.; Dai, H.; Ren, S.; Zhao, D.; Masui, T. Achieving Copenhagen target through carbon emission trading: Economic impacts assessment in Guangdong Province of China. Energy 2015, 79, 212–227. [Google Scholar] [CrossRef]
- Aghion, P.; Dechezlepretre, A.; Hemous, D. Carbon taxes, path de-pendency and directed technology change: Evidence from the auto industry. J. Polit. Econ. 2016, 124, 1–51. [Google Scholar] [CrossRef] [Green Version]
- Imbens, G.W.; Lemieux, T. Regression discontinuity designs: A guide to practice. J. Econ. 2008, 142, 615–635. [Google Scholar] [CrossRef] [Green Version]
- Lee, D.S.; Lemieux, T. Regression discontinuity designs in economics. J. Econ. Lit. 2010, 48, 281–355. [Google Scholar] [CrossRef] [Green Version]
- Hausman, C.; Rapson, D.S. Regression discontinuity in time: Considerations for empirical applications (No. w23602). Natl. Bur. Econ. Res. 2017, 10, w23602. [Google Scholar] [CrossRef]
- Yang, Z.; Abbas, Q.; Hanif, I.; Alharthi, M.; Taghizadeh-Hesary, F.; Aziz, B.; Mohsin, M. Short-and long-run influence of energy utilization and economic growth on carbon discharge in emerging SREB economies. Renew. Energy 2021, 165, 43–51. [Google Scholar] [CrossRef]
- Wang, Y.; Yang, H.; Sun, R. Effectiveness of China’s provincial industrial carbon emission reduction and optimization of carbon emission reduction paths in “lagging regions”: Efficiency-cost analysis. J. Environ. Manag. 2020, 275, 111–221. [Google Scholar] [CrossRef]
- Wei, Y.X.; Sun, G.N.; Li, J. Energy consumption and economic growth in China based on technological progress: A Comparison of the two 30 Years. Resour. Sci. 2011, 33, 1338–1345. (In Chinese) [Google Scholar]
- Shuai, C.; Chen, X.; Wu, Y.; Tan, Y.; Zhang, Y.; Shen, L. Identifying the key impact factors of carbon emission in China: Results from a largely expanded pool of potential impact factors. J. Clean. Prod. 2018, 175, 612–623. [Google Scholar] [CrossRef]
- Hang, L.; Tu, M. The impacts of energy prices on energy intensity: Evidence from China. Energy Policy 2007, 35, 2978–2988. [Google Scholar] [CrossRef]
- Lin, B.; Du, Z. Promoting energy conservation in China’s metallurgy industry. Energy Policy 2017, 104, 285–294. [Google Scholar] [CrossRef]
- Wang, W.; Wang, D.; Ni, W.; Zhang, C. The impact of carbon emissions trading on the directed technical change in China. J. Clean. Prod. 2020, 272, 122891. [Google Scholar] [CrossRef]
- Elliott, R.J.; Sun, P.; Chen, S. Energy intensity and foreign direct investment: A Chinese city-level study. Energy Econ. 2013, 40, 484–494. [Google Scholar] [CrossRef]
- Hayhoe, K.; Kheshgi, H.S.; Jain, A.K.; Wuebbles, D.J. Substitution of natural gas for coal: Climatic effects of utility sector emissions. Climatic. Chang. 2002, 54, 107–139. [Google Scholar] [CrossRef]
- Mao, X.; Guo, X.; Chang, Y.; Peng, Y. Improving air quality in large cities by substituting natural gas for coal in China: Changing idea and incentive policy implications. Energy Policy 2005, 33, 307–318. [Google Scholar] [CrossRef]
- Glomsrød, S.; Taoyuan, W. Coal cleaning: A viable strategy for reduced carbon emissions and improved environment in China? Energy Policy 2005, 33, 525–542. [Google Scholar] [CrossRef] [Green Version]
- Wang, H.; Yang, Y.; Keller, A.A.; Li, X.; Feng, S.; Dong, Y.N.; Li, F. Comparative analysis of energy intensity and carbon emissions in wastewater treatment in USA, Germany, China and South Africa. Appl. Energy 2016, 184, 873–881. [Google Scholar] [CrossRef] [Green Version]
- Jiang, B.; Wenying, C.; Yuefeng, Y.; Lemin, Z.; Victor, D. The future of natural gas consumption in Beijing, Guangdong and Shanghai: An assessment utilizing MARKAL. Energy Policy 2008, 36, 3286–3299. [Google Scholar] [CrossRef]
- Xin-gang, Z.; Wen-bin, Z.; Hui, W.; Ying, Z.; Ying-zhuo, Z. The influence of carbon price on fuel conversion strategy of power generation enterprises—A perspective of Guangdong province. J. Clean. Prod. 2021, 305, 126749. [Google Scholar] [CrossRef]
- Zhang, C.; Tan, T. Analysis of the Impact of Energy Consumption on Economic Growth in Guangdong Province. IOP Conf. Ser. Earth Environ. Sci. 2020, 585, 012015. [Google Scholar] [CrossRef]
- Perrons, R.K.; Jaffe, A.B.; Le, T. Linking scientific research and energy innovation: A comparison of clean and dirty technologies. Energy Res. Soc. Sci. 2021, 78, 102122. [Google Scholar] [CrossRef]
- Navas-Alemán, L. The impact of operating in multiple value chains for upgrading: The case of the Brazilian furniture and footwear industries. World Dev. 2011, 39, 1386–1397. [Google Scholar] [CrossRef]
- Paltsev, S.; Zhang, D. Natural gas pricing reform in China: Getting closer to a market system? Energy Policy 2015, 86, 43–56. [Google Scholar] [CrossRef] [Green Version]
- Li, Y.; Chevallier, J.; Wei, Y.; Li, J. Identifying price bubbles in the US, European and Asian natural gas market: Evidence from a GSADF test approach. Energy Econ. 2020, 87, 104740. [Google Scholar] [CrossRef]
- Chai, J.; Zhang, X.; Lu, Q.; Zhang, X.; Wang, Y. Research on imbalance between supply and demand in China’s natural gas market under the double-track price system. Energy Econ. 2021, 155, 112380. [Google Scholar] [CrossRef]
- Kumari, S.; Bera, S. A decision analysis model for reducing carbon emission from coal-fired power plants and its compensatory units. J. Environ. Manag. 2022, 301, 113829. [Google Scholar] [CrossRef]
- Baskoro, F.R.; Takahashi, K.; Morikawa, K.; Nagasawa, K. (Multi-objective optimization on total cost and carbon dioxide emission of coal supply for coal-fired power plants in Indonesia. Socio-Econ. Plan. Sci. 2022, 81, 101185. [Google Scholar] [CrossRef]
- Xiong, W.; Yan, L.; Wang, T.; Gao, Y. Substitution effect of natural gas and the energy consumption structure transition in China. Sustainability 2020, 12, 7853. [Google Scholar] [CrossRef]
- Yaqoot, M.; Diwan, P.; Kandpal, T.C. Review of barriers to the dissemination of decentralized renewable energy systems. Renew. Sust. Energy Rev. 2016, 58, 477–490. [Google Scholar] [CrossRef]
- Jia, Z.; Wen, S.; Sun, Z. Current relationship between coal consumption and the economic development and China’s future carbon mitigation policies. Energy Policy 2022, 162, 112812. [Google Scholar] [CrossRef]
Figure 1.
Basic RDD estimate of TCE: (a) LnTCE100; (b) LnTCE50; (c) LnTCE200; (d) Bandwidth test.

Figure 2.
RDD on CE with control variables: (a) Bandwidth 100; (b) Bandwidth 50; (c) Bandwidth 200; (d) Bandwidth test.
Figure 2.
RDD on CE with control variables: (a) Bandwidth 100; (b) Bandwidth 50; (c) Bandwidth 200; (d) Bandwidth test.

Figure 3.
Triangle-kernel and rectangular–kernel tests of orders 1–4. (a–d) illustrated order 1, 2, 3 and 4 results of triangle-kernel tests; (e–h) illustrated order 1, 2, 3 and 4 results of rectangle-kernel tests.
Figure 3.
Triangle-kernel and rectangular–kernel tests of orders 1–4. (a–d) illustrated order 1, 2, 3 and 4 results of triangle-kernel tests; (e–h) illustrated order 1, 2, 3 and 4 results of rectangle-kernel tests.

Figure 4.
Covariable continuity test: (a) GDP per capita BW100; (b) GDP per capita BW50; (c) GDP per capita BW200; (d) Population BW100; (e) Population BW50; (f) Population BW200; (g) Fixed assets BW100; (h) Fixed assets BW50; (i) Fixed assets BW200; (j) Trade value BW100; (k) Trade value BW50; (l) Trade value BW200; (m) Second Industry BW100; (n) Second Industry BW50; (o) Second Industry BW200.


Figure 5.
RDD of TEC in Guangdong: (a) Bandwidth 100; (b) Bandwidth 50; (c) Bandwidth 200; (d) Bandwidth test.
Figure 5.
RDD of TEC in Guangdong: (a) Bandwidth 100; (b) Bandwidth 50; (c) Bandwidth 200; (d) Bandwidth test.

Figure 6.
RDD of energy intensity in Guangdong.

Figure 7.
RDD results of four industrial emissions in Guangdong province: (a) Raw coal bandwidth100; (b) Raw coal bandwidth 50; (c) Raw coal bandwidth 200; (d) Crude oil bandwidth 100; (e) Crude oil bandwidth 50; (f) Crude oil bandwidth 200; (g) Cement bandwidth100; (h) Cement bandwidth 50; (i) Cement bandwidth 200; (j) Natural gas bandwidth100; (k) Natural gas bandwidth 50; (l) Natural gas bandwidth 200.


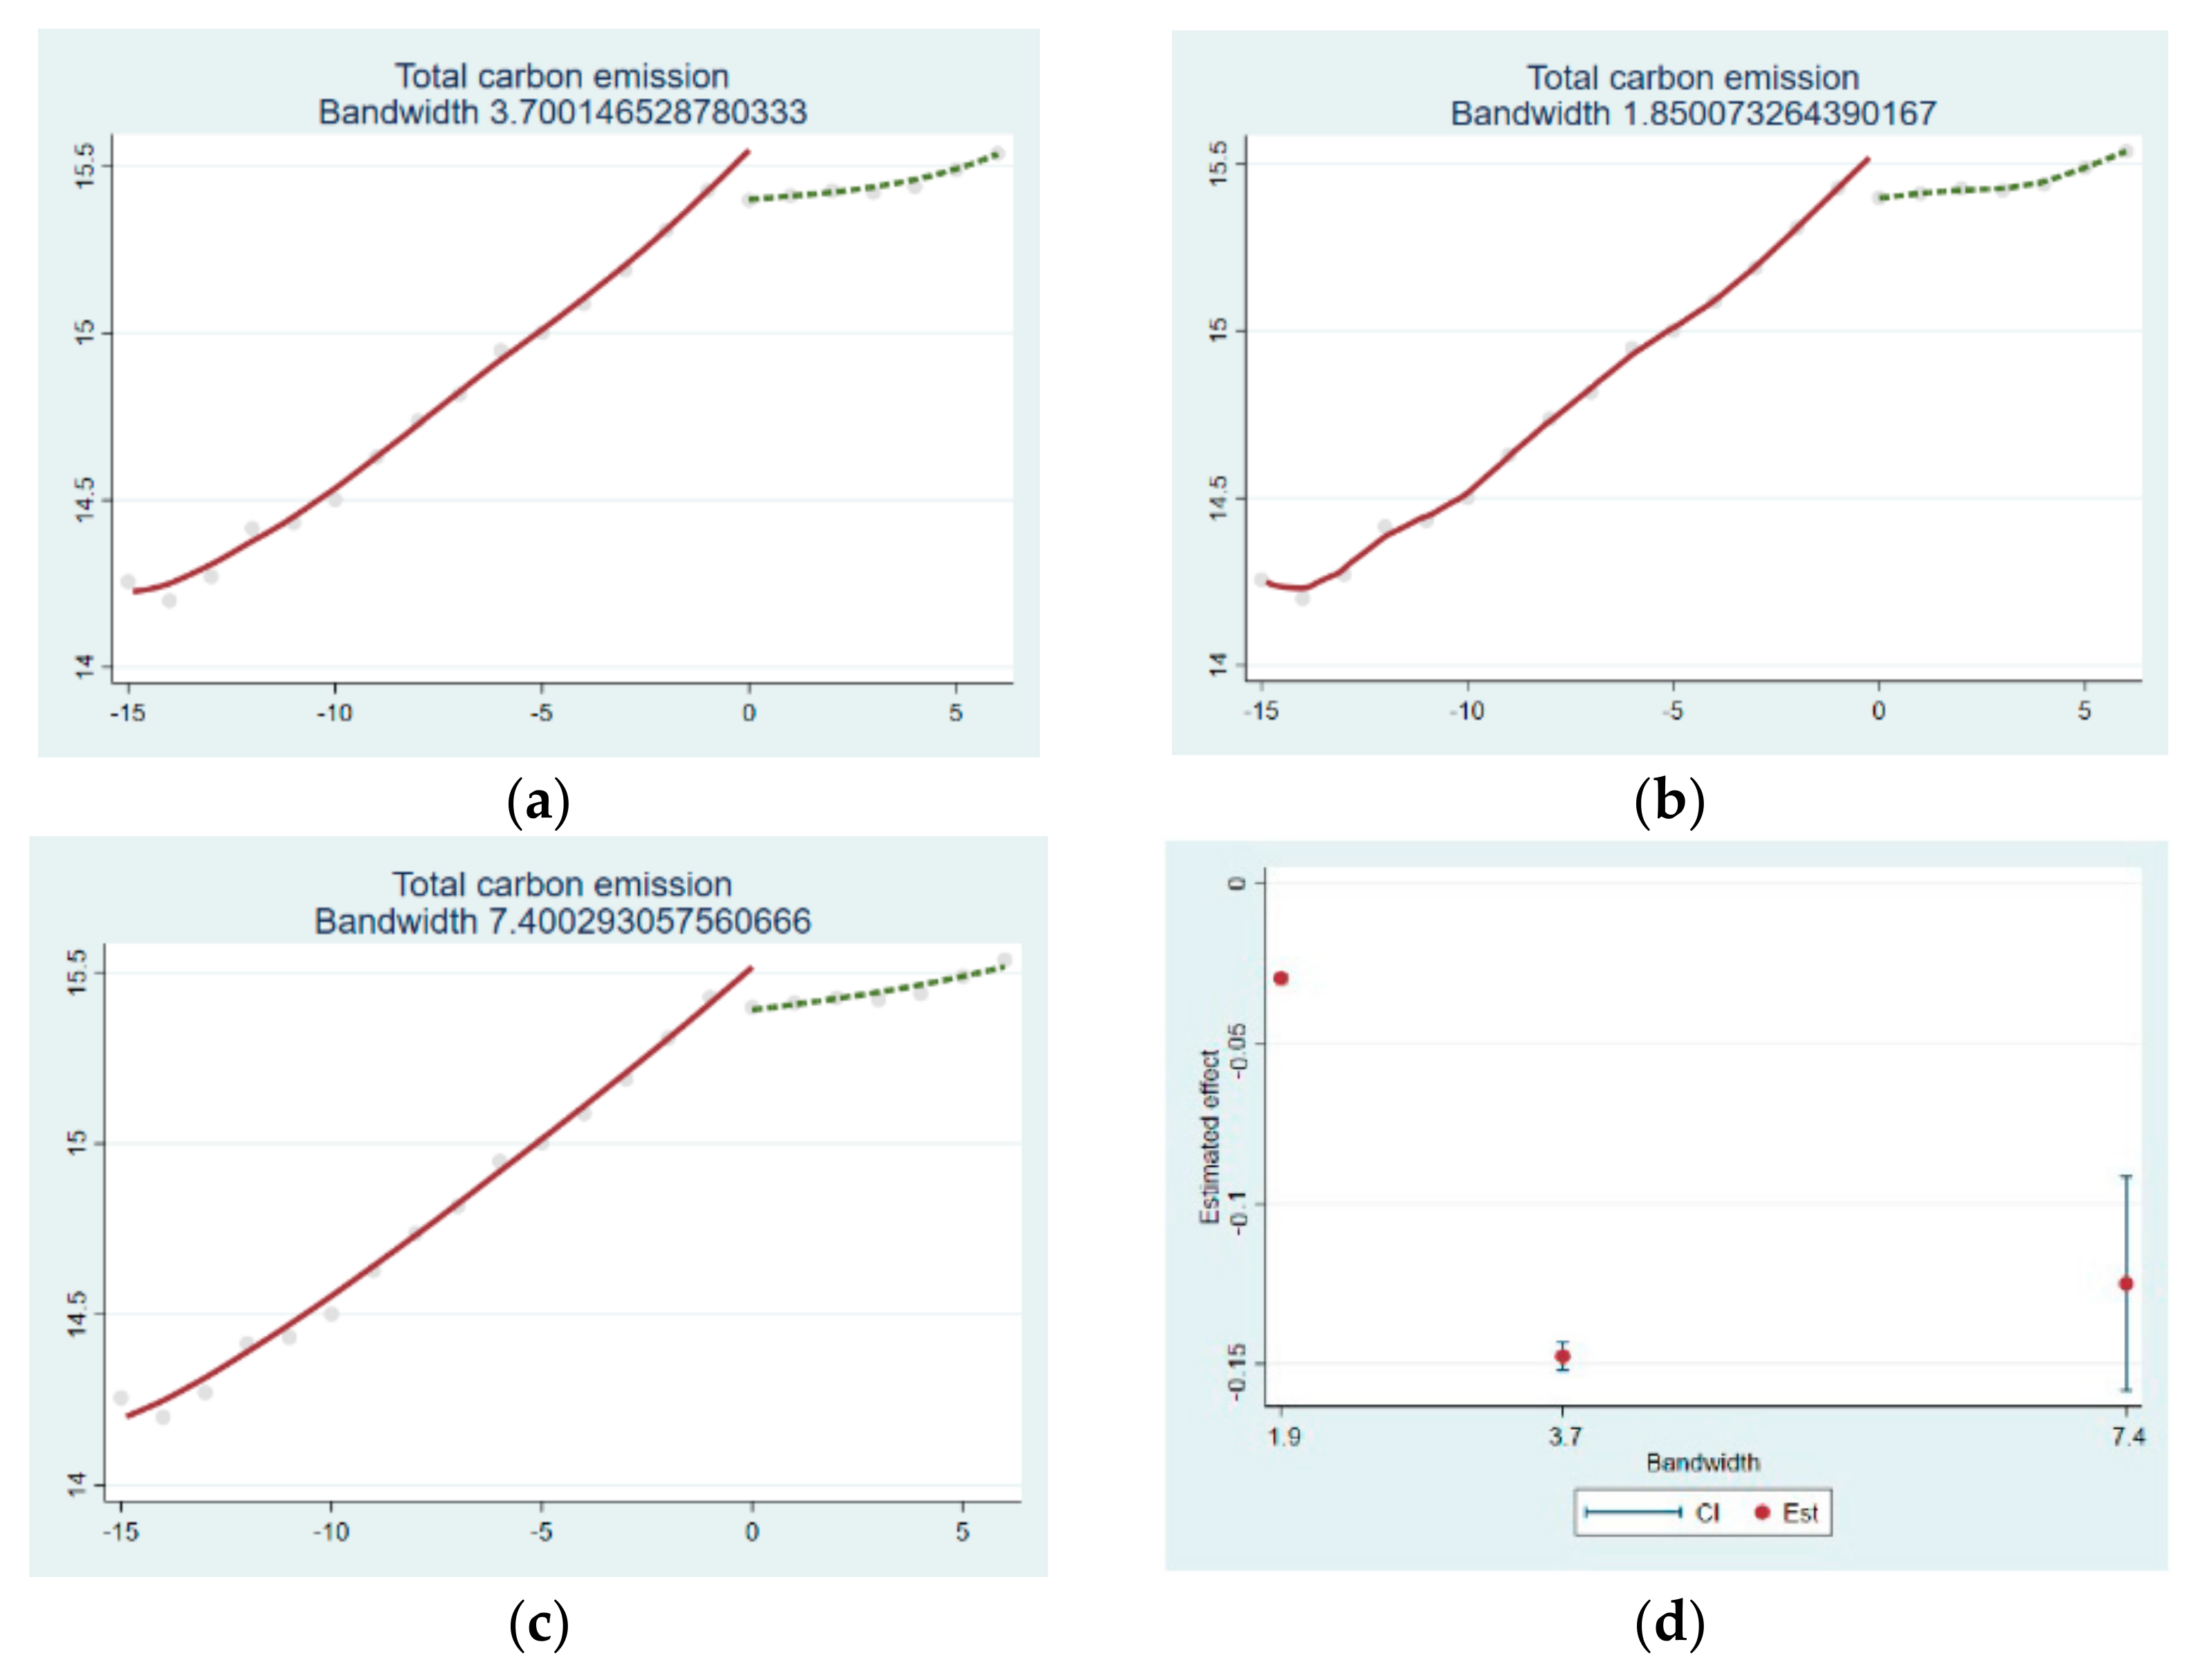
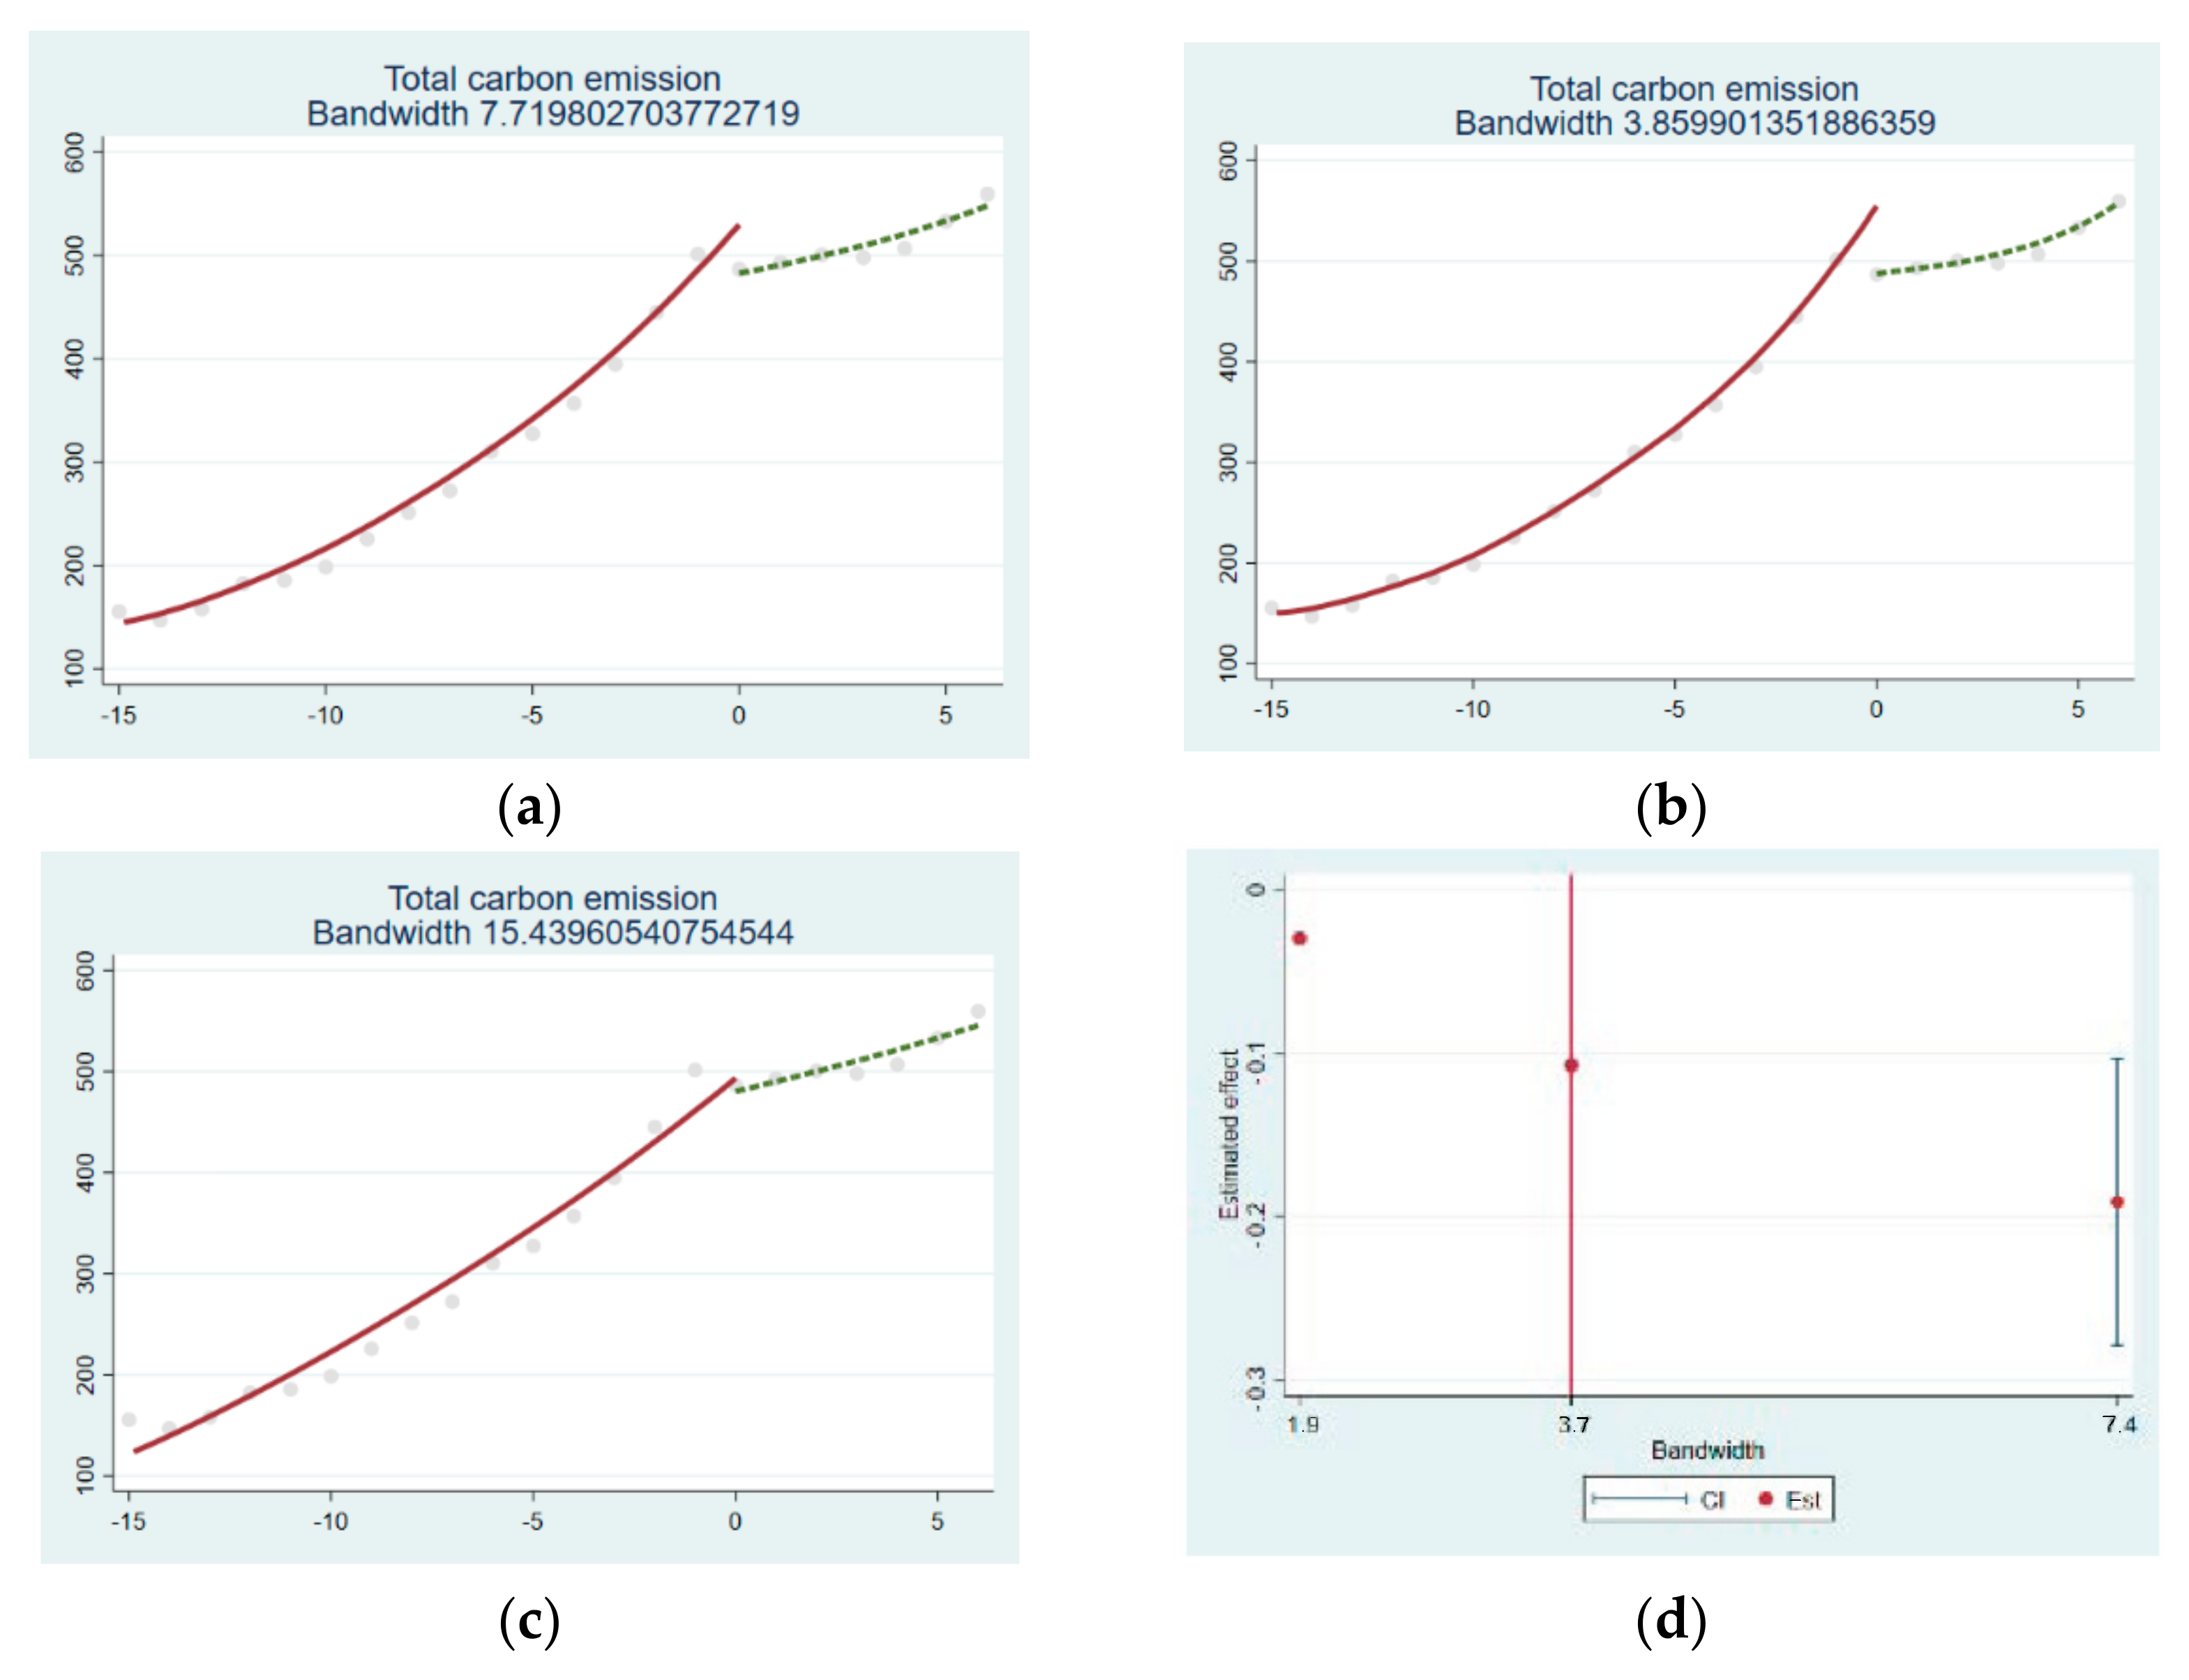
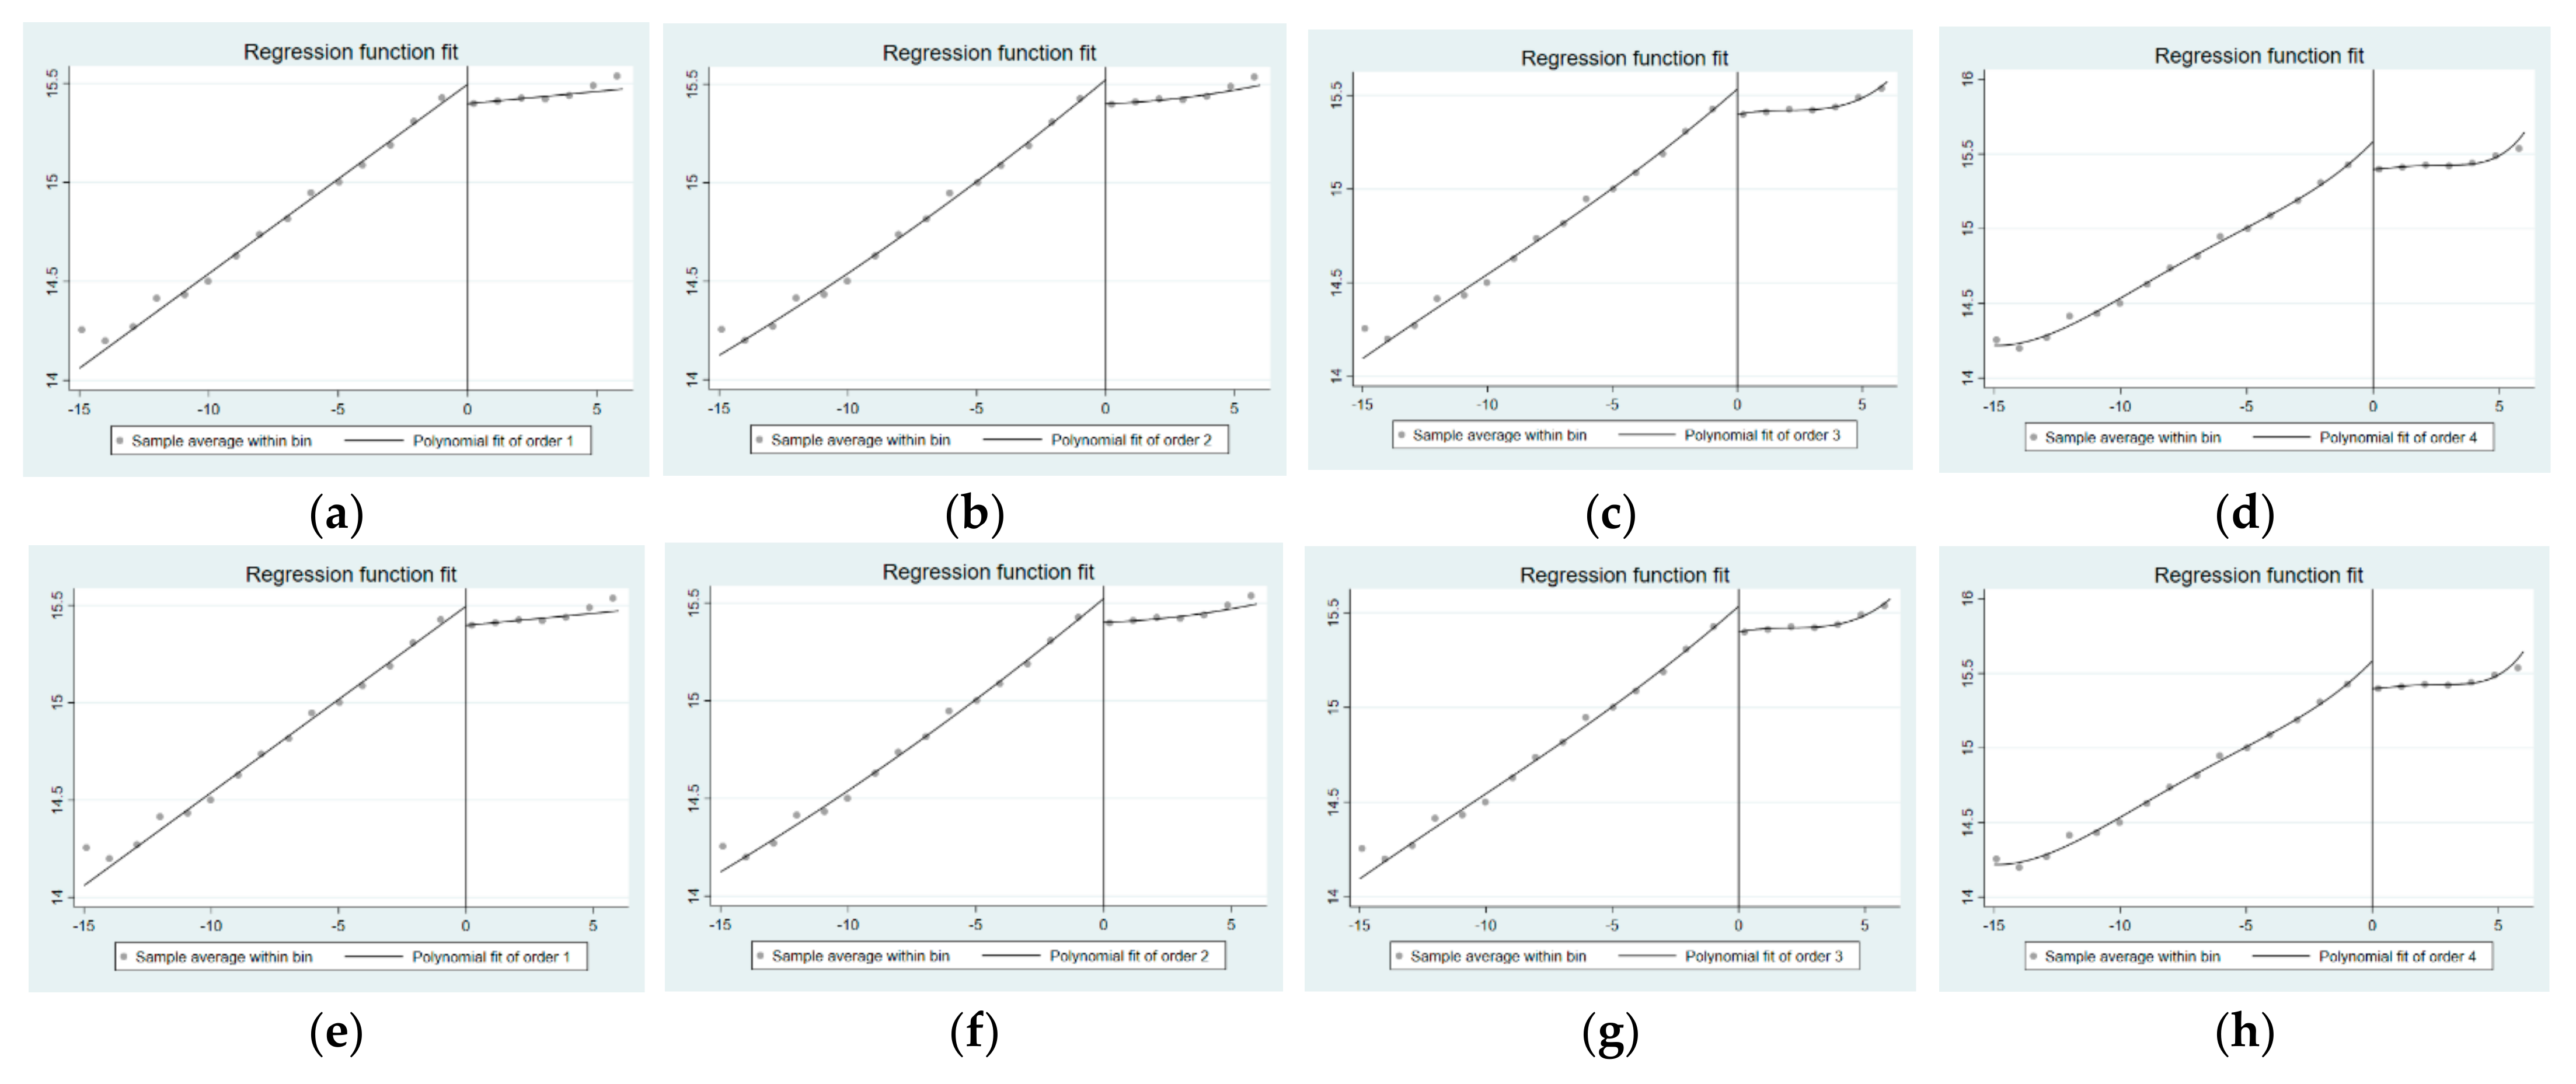
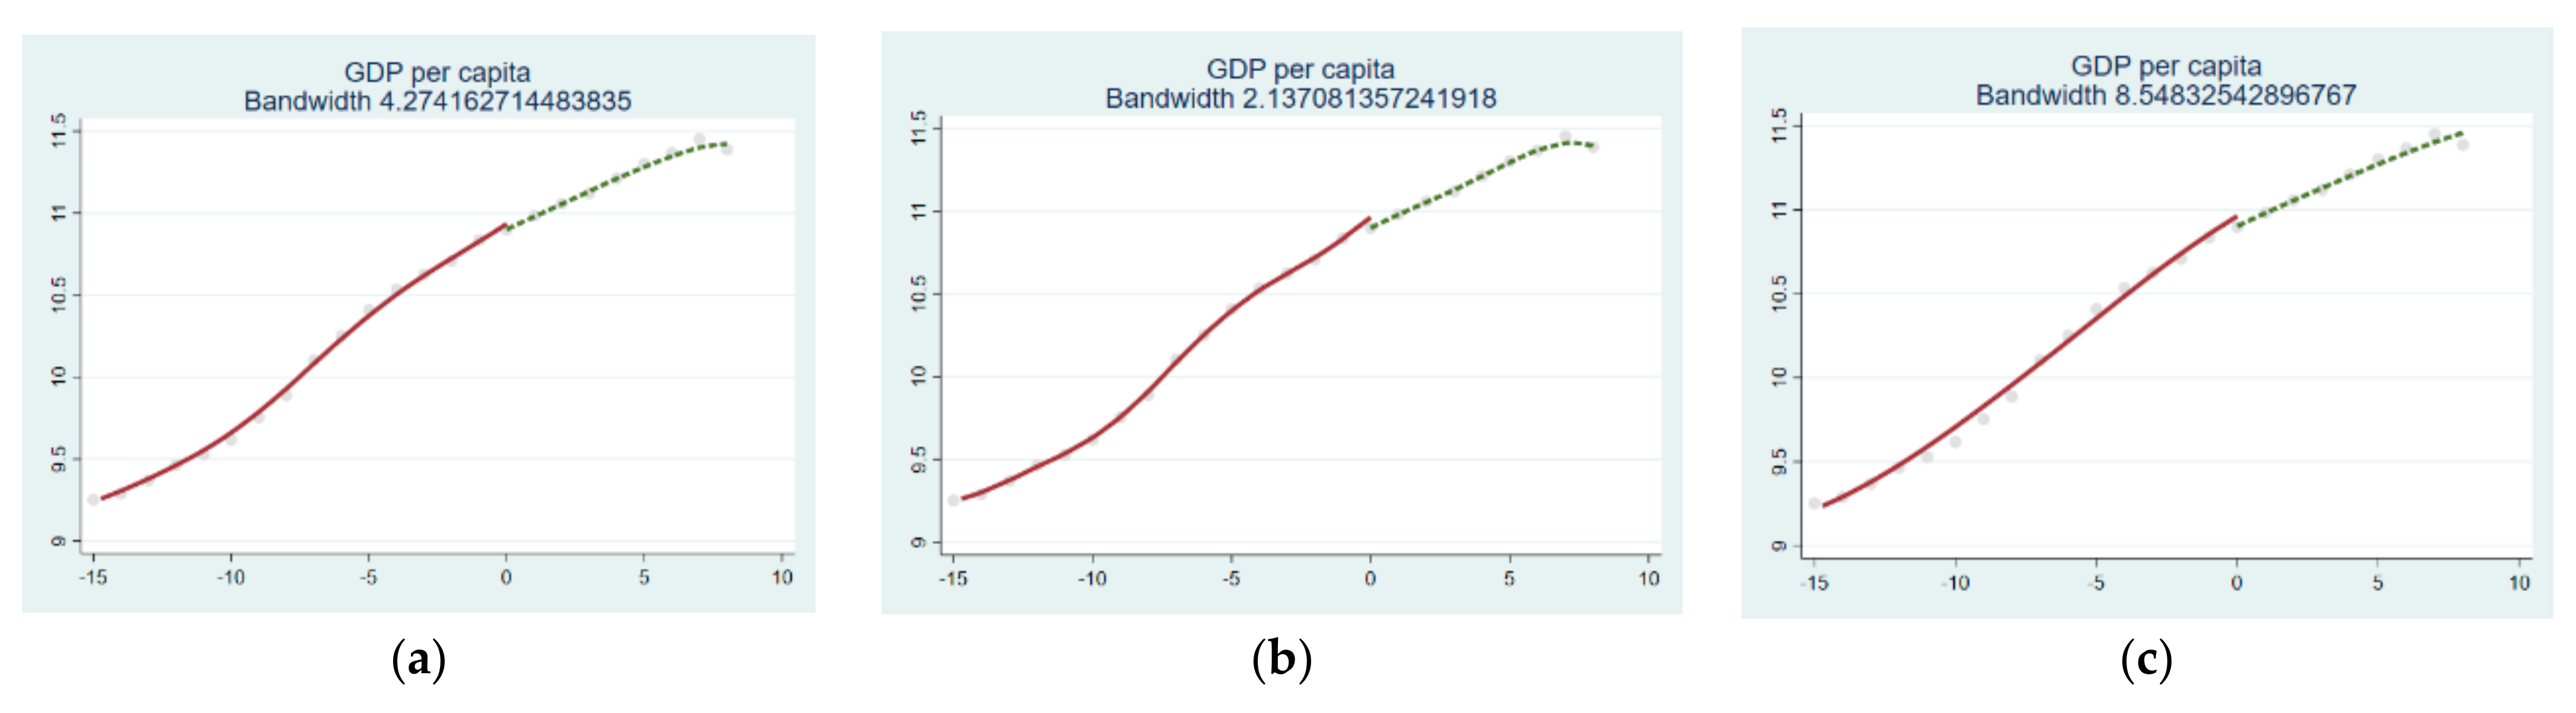
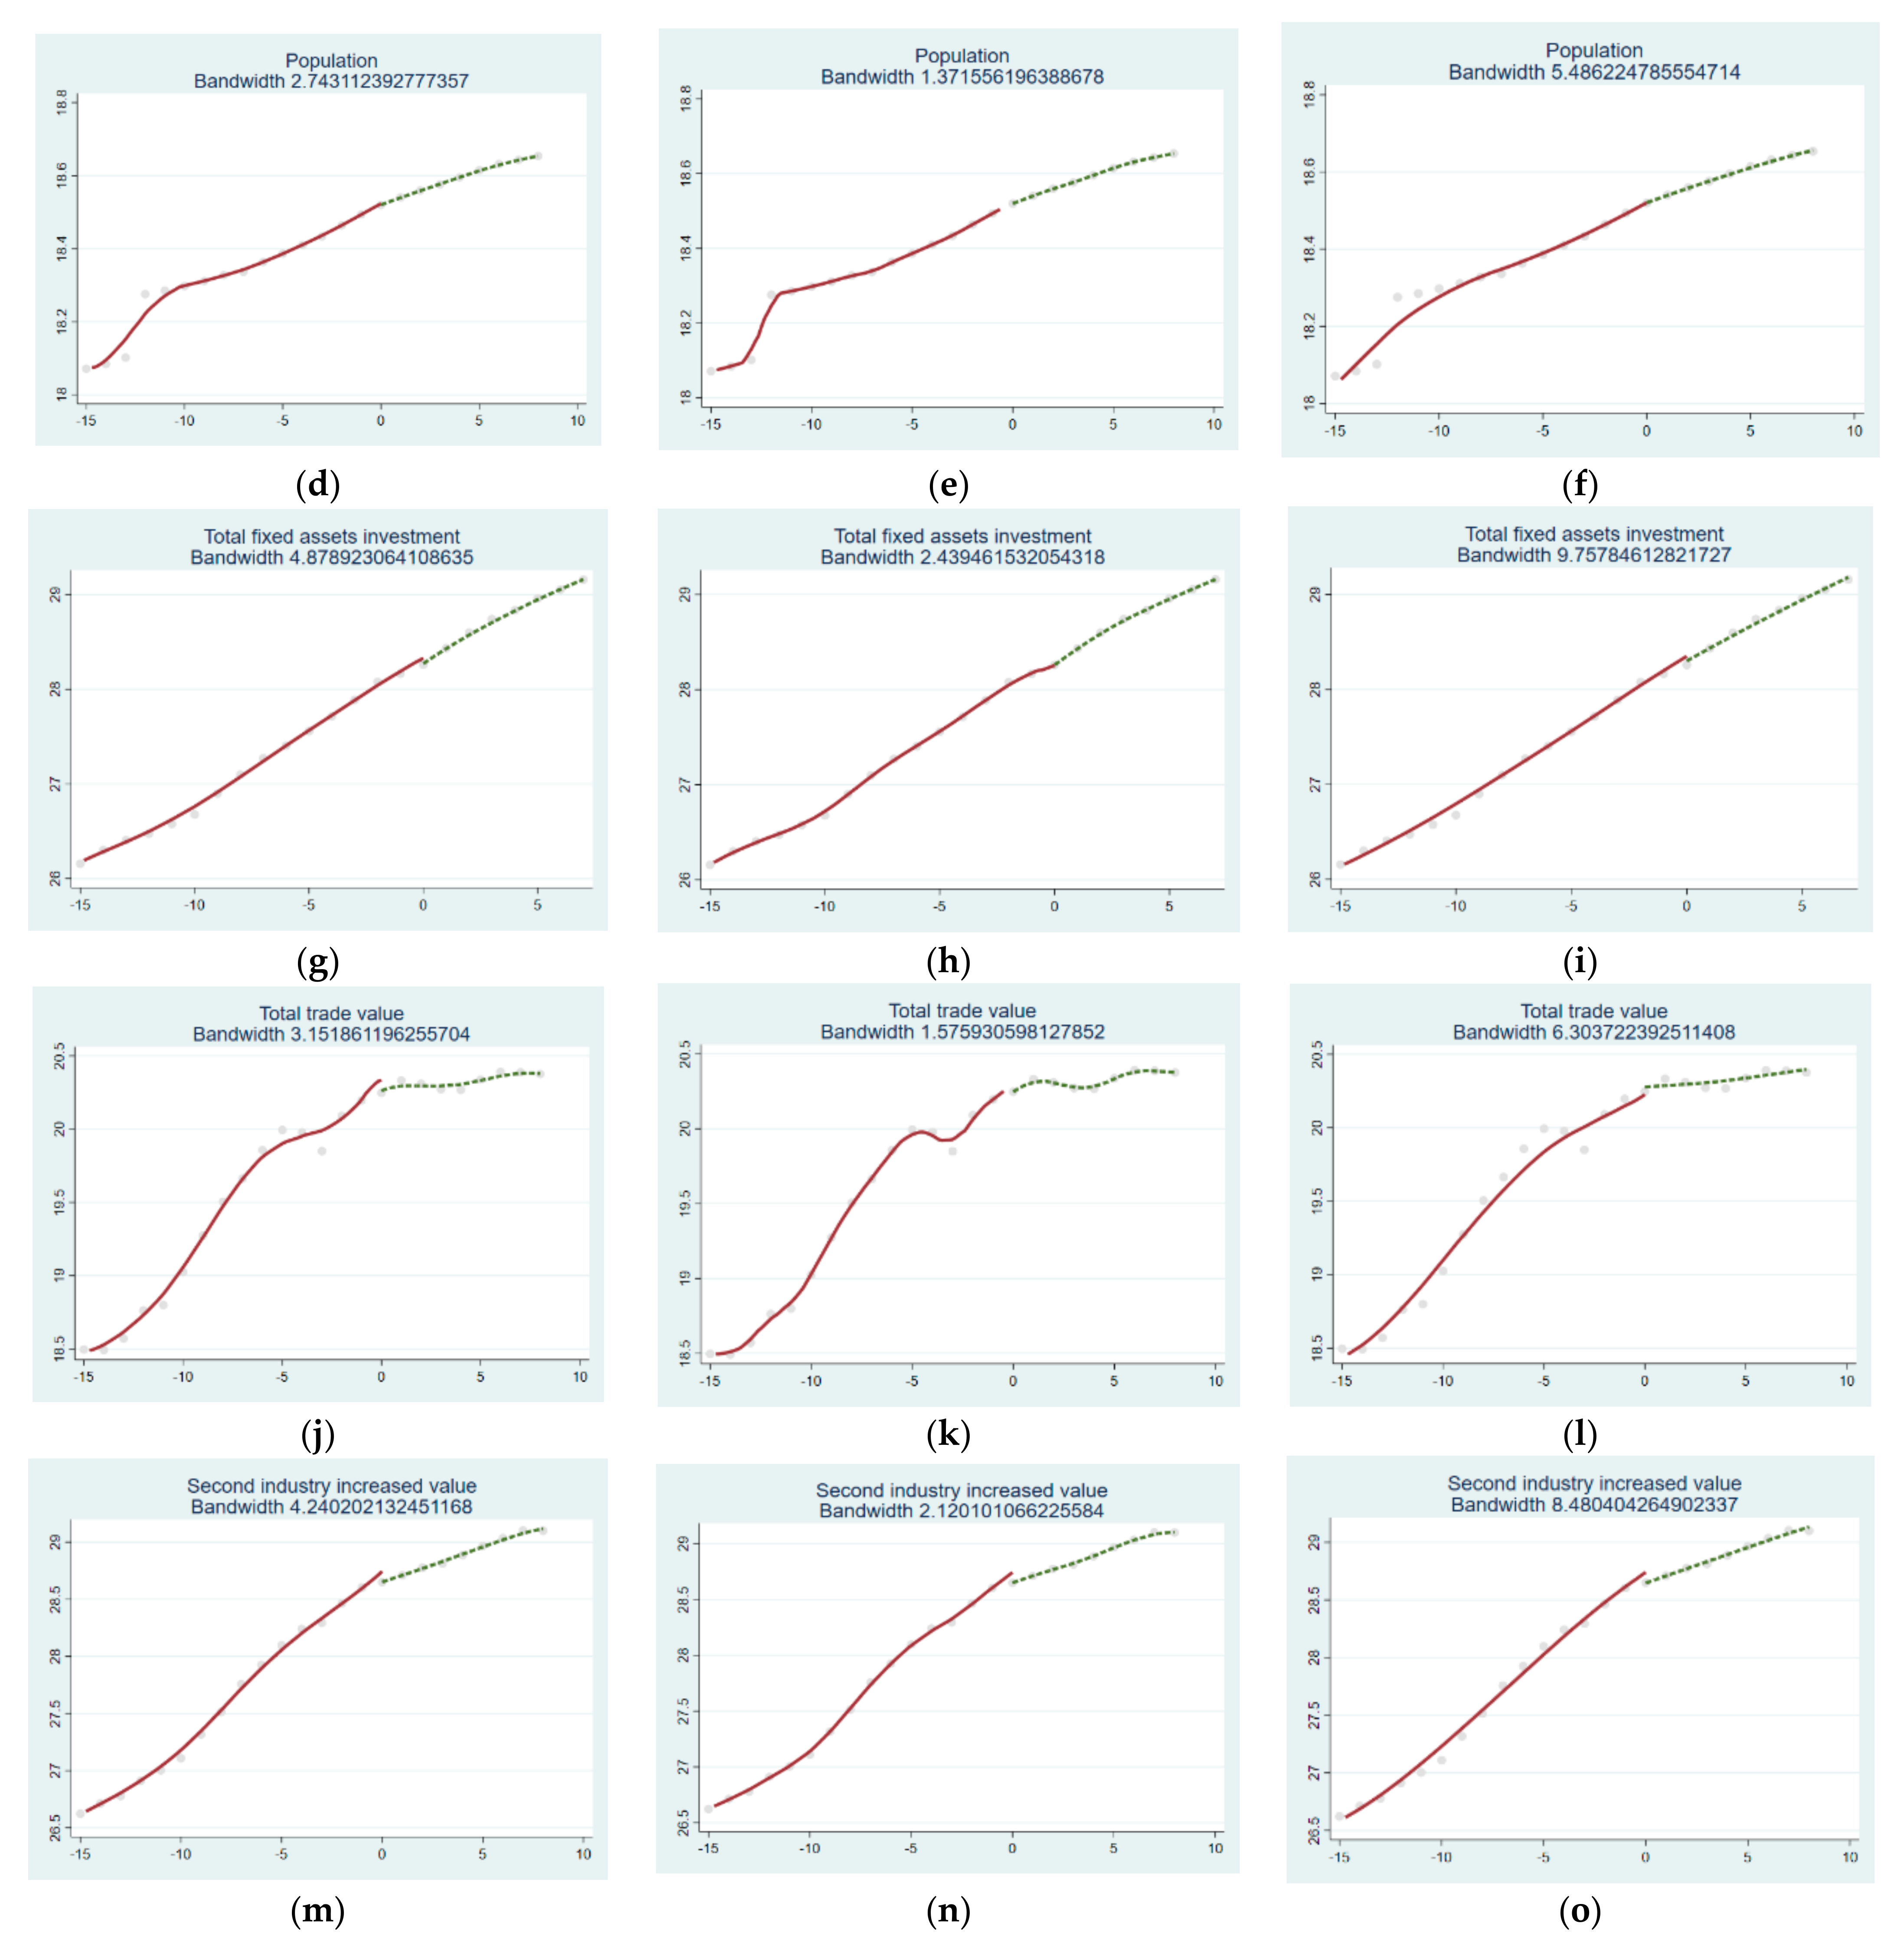
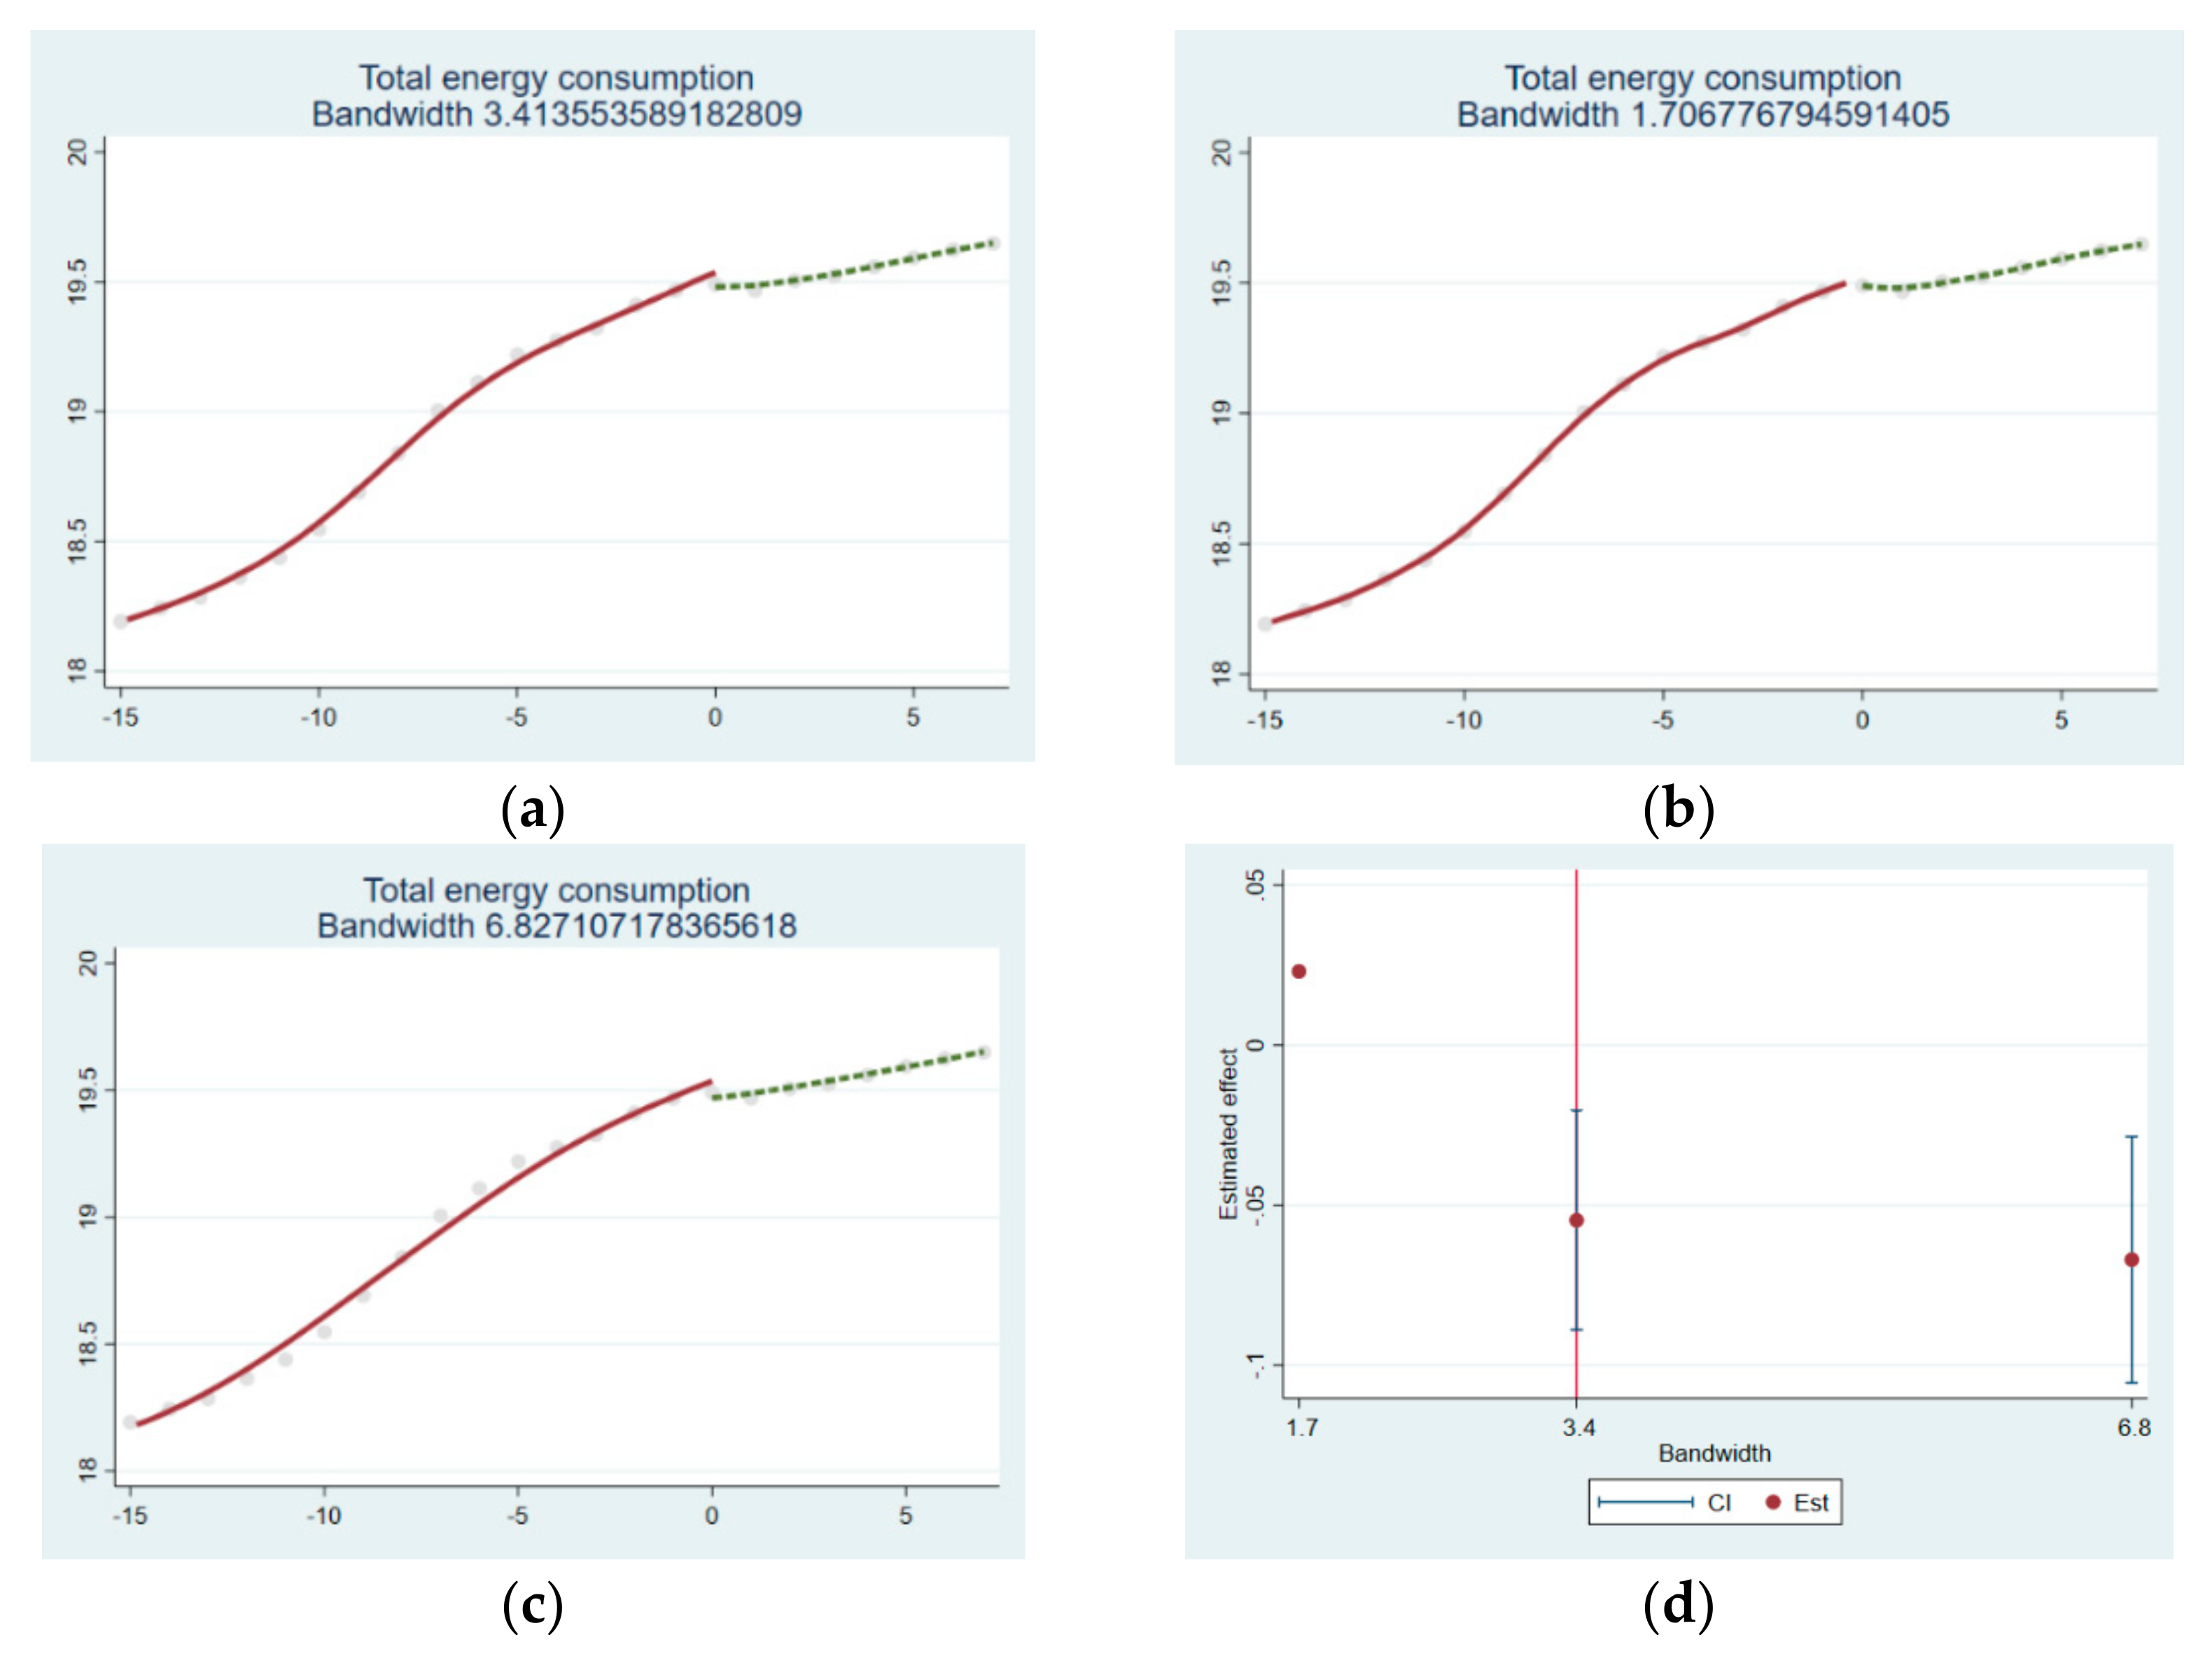
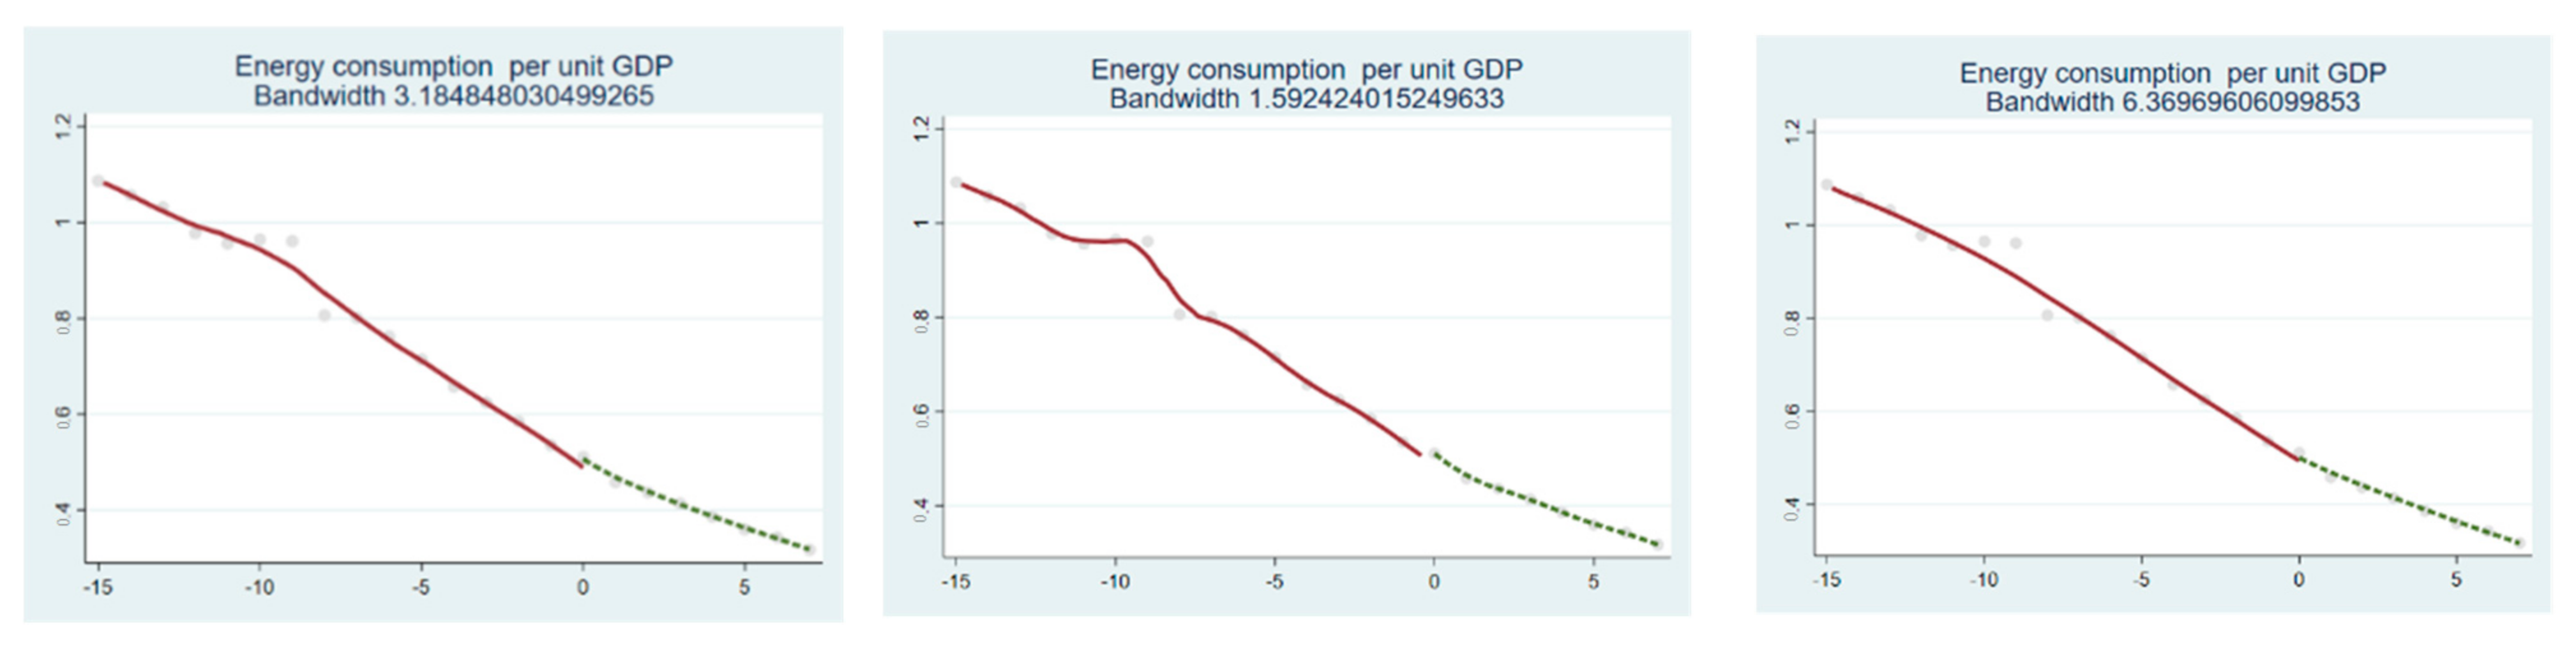
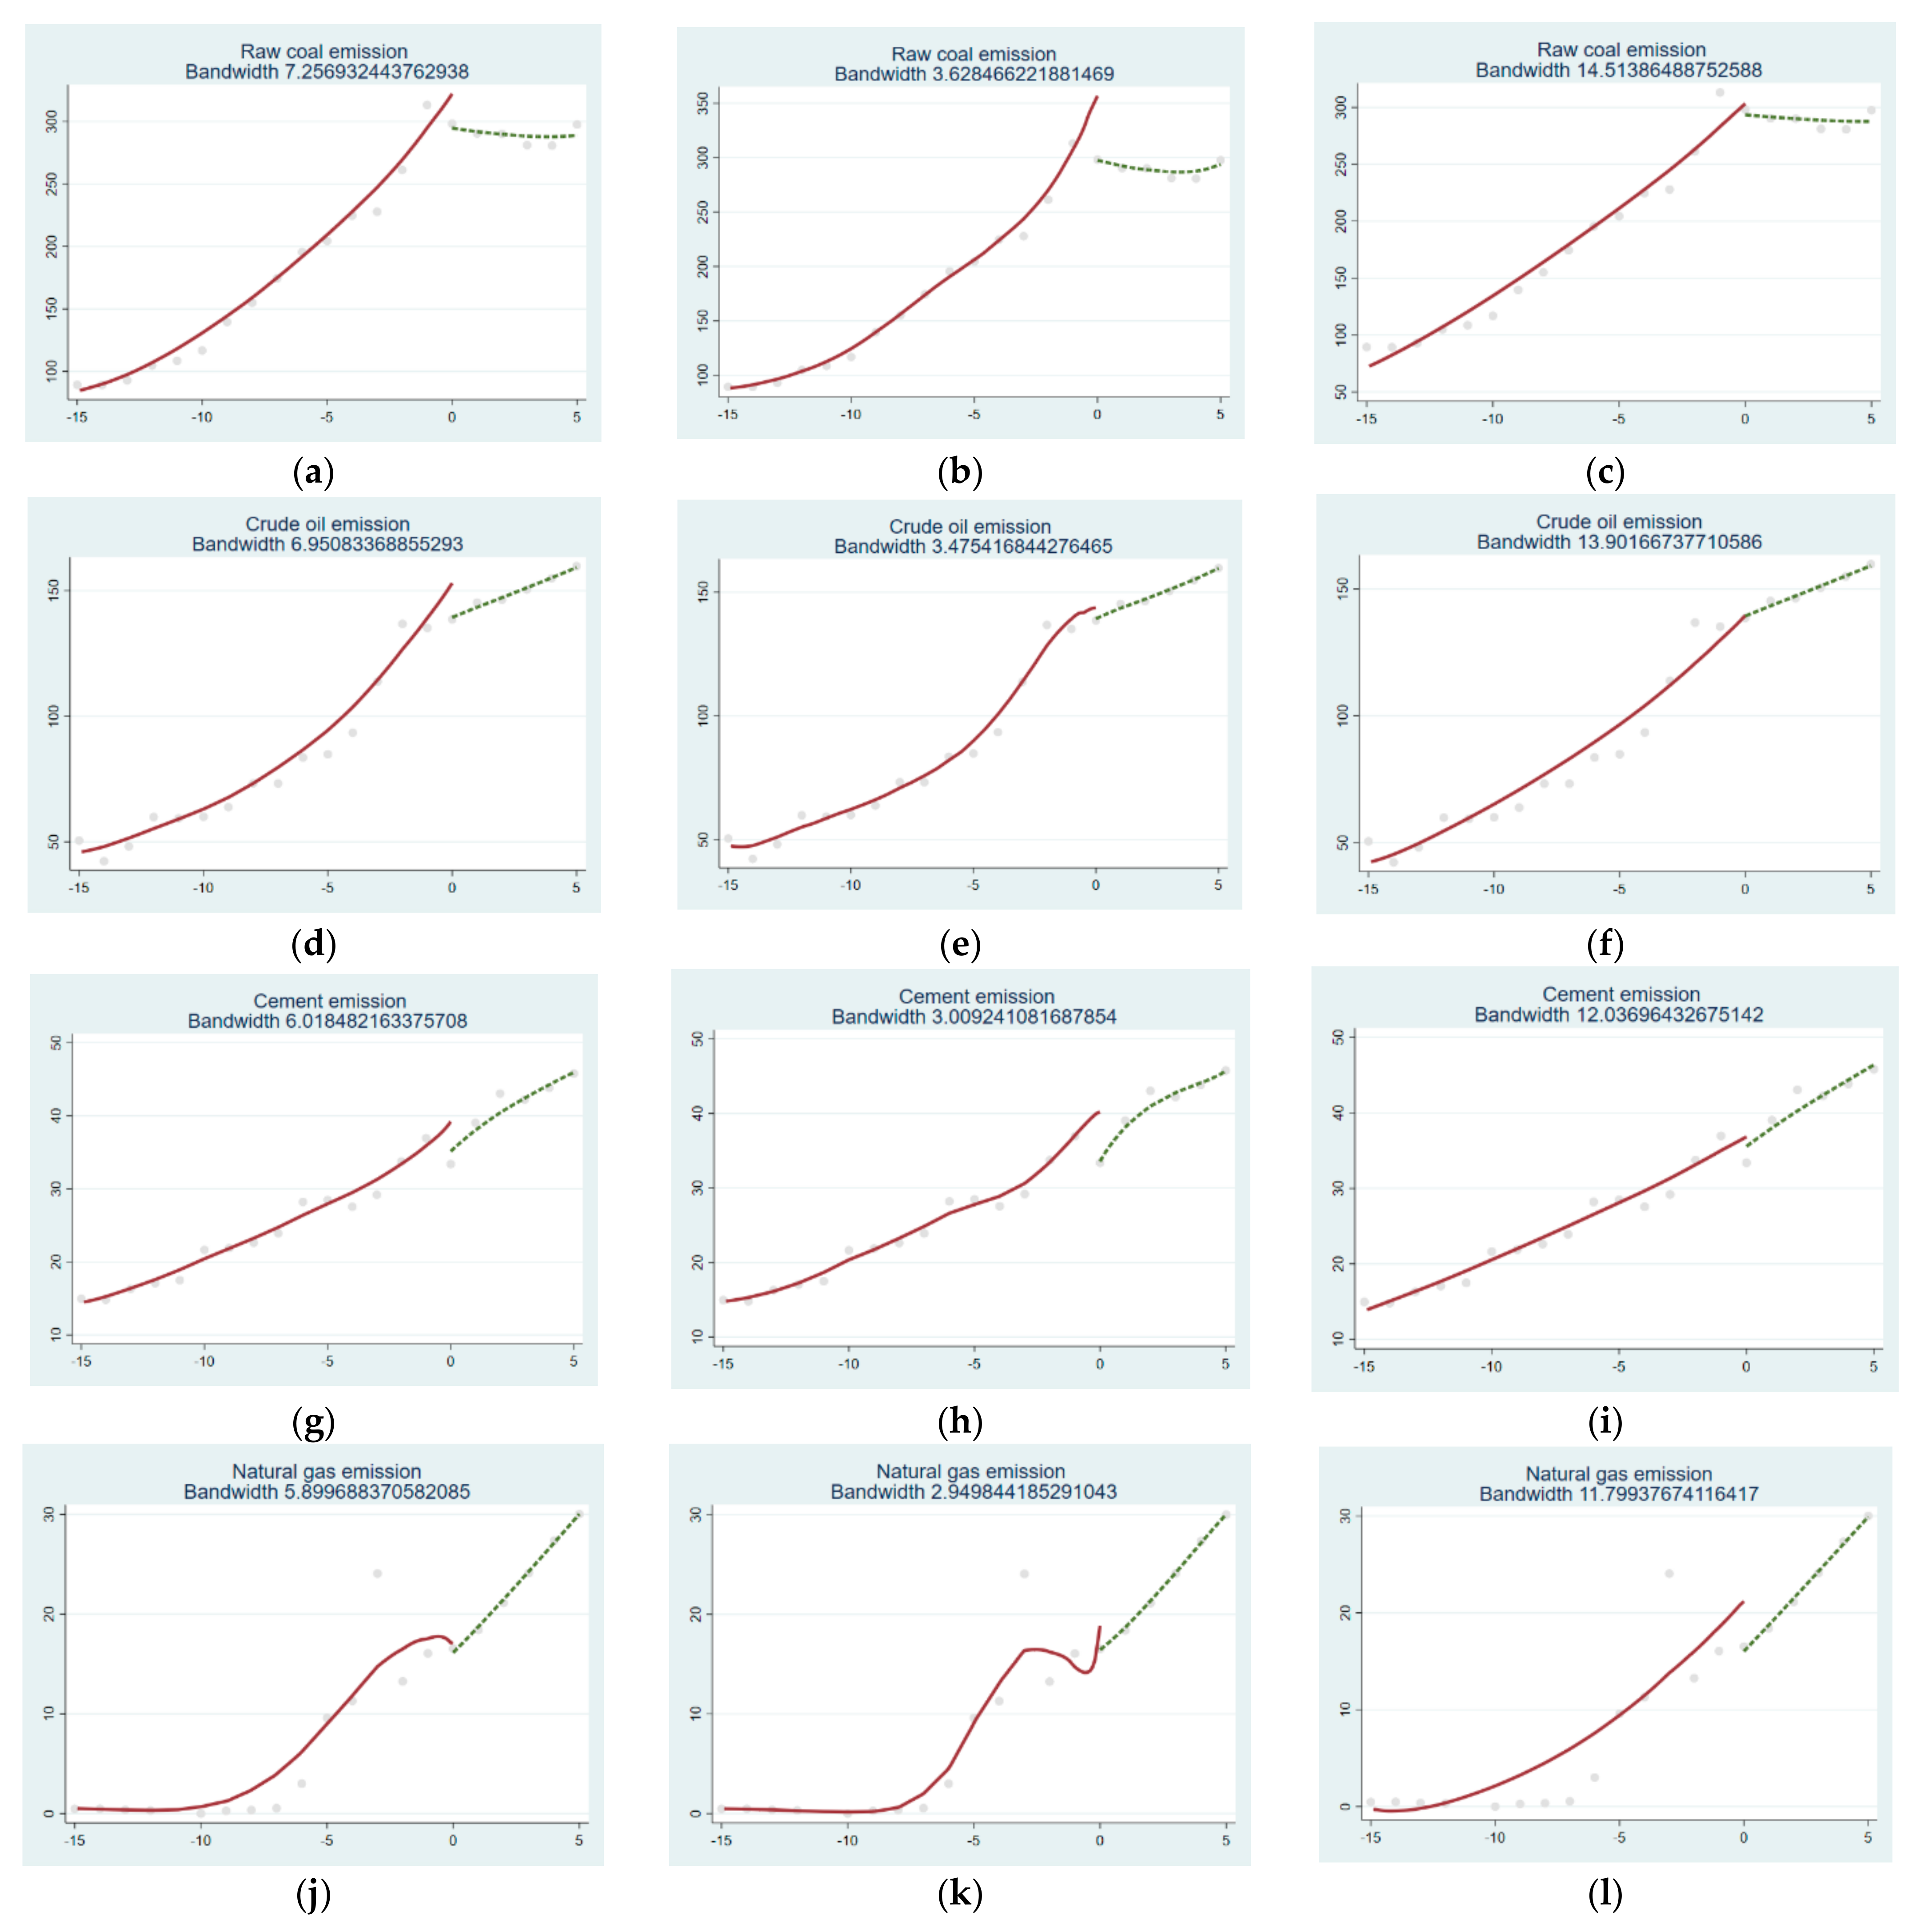
Table 1.
Descriptive statistics of variables.
| Variables Meaning | Variable | Per. Obs | Mean | Std. Dev. | Min | Max |
|---|---|---|---|---|---|---|
| Total carbon emission | LnTCE | 22 | 14.9702 | 0.4675 | 14.1996 | 15.5375 |
| Total energy consumption | LnTEC | 23 | 19.0793 | 0.5103 | 18.1916 | 19.6486 |
| Coal consumption | Lncoal | 23 | 18.5247 | 0.4720 | 17.7377 | 19.0326 |
| Crude consumption | Lncrude | 23 | 17.2525 | 0.4761 | 16.4383 | 17.8966 |
| Gasoline consumption | Lngasoline | 23 | 15.7981 | 0.6451 | 14.7823 | 16.5634 |
| Diesel consumption | Lndiesel | 23 | 16.3173 | 0.3578 | 15.5151 | 16.6346 |
| Gas consumption | Lngas | 21 | 12.4935 | 2.0438 | 9.4415 | 14.5391 |
| Fuel consumption | Lnfuel | 23 | 15.8022 | 0.5357 | 15.0208 | 16.5881 |
| Electric consumption | Lnelactri | 23 | 17.2142 | 0.6327 | 16.0335 | 18.0196 |
| Population | Lnpop | 24 | 18.4156 | 0.1762 | 18.0713 | 18.654 |
| Second industry increased value | LnSII | 24 | 28.0580 | 0.8558 | 26.6226 | 29.1023 |
| Total fixed assets investment | Lnfix | 23 | 27.6829 | 0.9789 | 26.1575 | 29.1591 |
| Total trade value | LnTTV | 24 | 19.7282 | 0.6811 | 18.4926 | 20.3906 |
| GDP per capita | LnAGDP | 24 | 10.4338 | 0.7521 | 9.2523 | 11.4529 |
Table 2.
LATE results of the three bandwidths of TCE.
| LnTCE | Coefficient | Std. Err. | z | P > |z| | [95% Conf. Interval] | |
|---|---|---|---|---|---|---|
| lwald | −0.1476624 | 0.0022365 | −66.02 | 0.000 | −0.1520459 | −0.1432789 |
| lwald50 | −0.0296764 | |||||
| lwald200 | −0.1249585 | 0.0170411 | −7.33 | 0.000 | −0.1583584 | −0.0915585 |
Table 3.
LATE results of the three bandwidths of TCE (with control variables).
| LnTCE | Coefficient | Std. Err. | z | P > |z| | [95% Conf. Interval] | |
|---|---|---|---|---|---|---|
| lwald | −0.1067923 | |||||
| lwald50 | −0.0296764 | |||||
| lwald200 | −0.1906477 | 0.044847 | −4.25 | 0.000 | −0.2785463 | −0.1027491 |
Table 4.
LATE results of covariables.
| LnAGDP | Coefficient | Std. Err. | z | P > |z| | [95% Conf. Interval] | |
|---|---|---|---|---|---|---|
| lwald | −0.0335 | 0.0136 | −2.47 | 0.014 | −0.0602 | −0.0069 |
| lwald50 | −0.0642 | 0.0009 | −71.25 | 0.000 | −0.0660 | −0.0624 |
| lwald200 | −0.0601 | 0.0177 | −3.40 | 0.001 | −0.0947 | −0.0254 |
| Lnpop | ||||||
| lwald | −0.0035 | 0.0003 | −11.76 | 0.000 | −0.0040 | −0.0029 |
| lwald50 | 0.0262 | |||||
| lwald200 | 0.0001 | 0.0020 | 0.03 | 0.974 | −0.0040 | 0.0040 |
| Lnfix | ||||||
| lwald | −0.0579 | 0.0379 | −1.53 | 0.127 | −0.1323 | 0.0164 |
| lwald50 | 0.0062 | 0.0018 | 3.50 | 0.000 | 0.0027 | 0.0097 |
| lwald200 | −0.0503 | 0.0381 | −1.32 | 0.187 | −0.1249 | 0.0244 |
| LnSII | ||||||
| lwald | −0.0934 | 0.0174 | −5.37 | 0.000 | −0.1275 | −0.0593 |
| lwald50 | −0.0929 | 0.0005 | −178.59 | 0.000 | −0.0939 | −0.0919 |
| lwald200 | −0.0937 | 0.0135 | −6.92 | 0.000 | −0.1202 | −0.0671 |
| LnTTV | ||||||
| lwald | −0.0735 | 0.0472 | −1.56 | 0.119 | −0.1661 | 0.0190 |
| lwald50 | 0.0511 | |||||
| lwald200 | 0.0504 | 0.0641 | 0.79 | 0.432 | −0.0752 | 0.1759 |
Table 5.
LATE results of the three bandwidths of TEC.
| LnTEC | Coefficient | Std. Err. | z | P > |z| | [95% Conf. Interval] | |
|---|---|---|---|---|---|---|
| lwald | −0.0547031 | 0.0174766 | −3.13 | 0.002 | −0.0889566 | −0.0204497 |
| lwald50 | 0.0230484 | |||||
| lwald200 | −0.0670122 | 0.0196167 | −3.42 | 0.001 | −0.1054602 | −0.0285642 |
Table 6.
LATE results of the three bandwidths of Energy intensity.
| TEC/GDP | Coefficient | Std. Err. | z | P > |z| | [95% Conf. Interval] | |
|---|---|---|---|---|---|---|
| lwald | −0.0078586 | |||||
| lwald50 | −0.0245448 | |||||
| lwald200 | 0.0007803 | 0.0234189 | 0.03 | 0.973 | −0.0451199 | 0.0466805 |
Table 7.
LATE results of the bandwidths of four industrial emissions.
| LnTRC | Coefficient | Std. Err. | z | P > |z| | [95% Conf. Interval] | |
|---|---|---|---|---|---|---|
| Lwald | −0.1626923 | |||||
| lwald50 | −0.0489464 | |||||
| lwald200 | −0.1286879 | 0.0341226 | −3.77 | 0.000 | −0.1955669 | −0.0618089 |
| LnTCO | ||||||
| lwald | −0.0849918 | |||||
| lwald50 | 0.0248423 | |||||
| lwald200 | −0.2011415 | 0.121422 | −1.66 | 0.098 | −0.4391243 | 0.0368413 |
| Lncement | ||||||
| lwald | 0.0827159 | |||||
| lwald50 | −0.1016088 | |||||
| lwald200 | −0.1141668 | 0.0559962 | −2.04 | 0.041 | −0.2239173 | −0.0044163 |
| LnTNG | ||||||
| lwald | 0.062884 | 0.2006543 | 0.31 | 0.754 | −0.3303913 | 0.4561592 |
| lwald50 | −0.1657795 | 0.0058137 | −28.52 | 0.000 | −0.1771741 | −0.1543849 |
| lwald200 | −1.030549 | 0.5199076 | −1.98 | 0.047 | −2.049549 | −0.0115492 |
Publisher’s Note: MDPI stays neutral with regard to jurisdictional claims in published maps and institutional affiliations. |
© 2022 by the authors. Licensee MDPI, Basel, Switzerland. This article is an open access article distributed under the terms and conditions of the Creative Commons Attribution (CC BY) license (https://creativecommons.org/licenses/by/4.0/).
Share and Cite
MDPI and ACS Style
Yan, Z.; Cui, C. How Natural Gas Infrastructure Affects Carbon Emission Indicators in Guangdong Province? Sustainability 2022, 14, 8104. https://doi.org/10.3390/su14138104
AMA Style
Yan Z, Cui C. How Natural Gas Infrastructure Affects Carbon Emission Indicators in Guangdong Province? Sustainability. 2022; 14(13):8104. https://doi.org/10.3390/su14138104
Chicago/Turabian StyleYan, Ziwei, and Chunying Cui. 2022. "How Natural Gas Infrastructure Affects Carbon Emission Indicators in Guangdong Province?" Sustainability 14, no. 13: 8104. https://doi.org/10.3390/su14138104
Note that from the first issue of 2016, this journal uses article numbers instead of page numbers. See further details here.