
VGEs as a New Platform for Urban Modeling and Simulation


1
School of Geography and Environment, Jiangxi Normal University, Nanchang 330022, China
2
Institute of Space and Earth Information Science, Chinese University of Hong Kong, Central Ave, Hongkong, China
3
Department of Information and Communication, Academy of Army Armored Forces, Beijing 100000, China
4
Department of Urban Planning and Design, Peking University Shenzhen Graduate School, Shenzhen 518055, China
5
Aerospace Information Research Institute, Chinese Academy of Sciences, Beijing 100094, China
6
Faculty of Computer Science and Information Engineering, Hubei University, Wuhan 430062, China
7
School of Architecture, Harbin Institute of Technology (Shenzhen), Shenzhen 518055, China
*
Author to whom correspondence should be addressed.
Sustainability 2022, 14(13), 7980; https://doi.org/10.3390/su14137980
Submission received: 31 May 2022
/
Revised: 22 June 2022
/
Accepted: 24 June 2022
/
Published: 30 June 2022
(This article belongs to the Special Issue The New Science of Cities and Urban Growth Sustainability)
Abstract
:The complexity of interrelationships between urban natural environments and human environments is increasing with rapid urbanization. This brings new challenges to urban modeling and simulation in simultaneously meeting the comprehensive needs of the dual integration of data and models, multi-type visualizations, human-centered simulation, geographic collaboration, and interactions between physical and virtual spaces. We here propose virtual geographic environments (VGEs) as a new platform of urban modeling and simulation. After discussing the evolution, definition, and features of VGEs, we design a VGE framework for urban system modeling and simulation. Two typical cases are provided to illustrate how VGEs support urban modeling and simulation on different scales: VGE-based collaborative modeling and the simulation of air pollution dispersion in the Pearl River Delta (PRD) urban agglomeration, and fire emergency crowd evacuation simulation. In the future, VGEs may also play an important role in digital twin cities and urban metaverses.
1. Introduction
Urban environments are primary centers of production and living, which hold over half of the world population. Understanding urban environments, exploring the mechanism of urban development, rationally developing the urban environment, promoting the harmonious coexistence of people and the environment, and realizing the sustainability of urban development are critical requirements of anthropogenic development.
Urban modeling and simulation are ideally suited for studying urban problems, such as urban energy simulation [1], urban train network modeling [2], urban dynamical modeling and simulation [3], urban sprawl and fiscal stress [4], and other issues. However, as urban environments develop, the relationships between urban natural environments and the human environment have become more complex, which brings new challenges. We here identify five of these challenges.
First, urban modeling and simulation require the dual support of data and models. The data, such as terrain data, object outlines, and building information model (BIM) data can be used to create a 3D geometric model for statically representing entities in urban environments [5,6,7,8]. The models, such as air pollution models [9], flood models [10], and crowd evacuation models [11] can be used to present urban physical processes. A comprehensive urban modeling and simulation system should integrate both data and models. However, the accurate coupling of data and models is often ineffective.
Second, an urban environment can be regarded as a complex system that is composed of human social activities and natural environments [12,13,14]. The coupling of these two components has also been considered. For instance, Gonzalez et al. studied urban development and human activities as factors in terrain stability [15], and Szolnoki et al. studied the cumulative impacts of human activities on urban garden soils [16]. Clearly understanding the coupling of human activity and the natural environment is important for accurate urban system modeling and simulation [17,18,19].
Third, the urban environment is dynamic and three-dimensional, thus, it is best visualized in a three-dimensional or a higher-dimensional way. Visualization methods in urban modeling and simulation systems have evolved from traditional two-dimensional [20] to three-dimensional and even higher dimensional [21,22]. Different sectors have different visualization needs, so visualization of the urban environment should be adaptable to meet the requirements of different users. Therefore, building an urban system with multiple visualization methods is of high value in supporting effective collaboration among multiple users. However, no such comprehensive visualization system currently exists.
Fourth, urban systems are complex, and cannot be effectively understood from a single perspective. Distributed collaborative research environments can support the effective integration of multi-disciplinary knowledge, multi-domain experts, and multi-department resources. The effort to achieve the collaboration has been carried out in city collaborative planning [23], collaborative governance [24], collaborative water management [25], and other applications. However, a complex urban system requires a comprehensive collaborative environment that can support collaboration among multiple disciplines, users, and departments from distributed locations.
Fifth, the recent technological development of digital twins has led to the construction of digital twin cities and towns and their methods mainly focus on two aspects. The first is the basic connotation and the concept of digital twin cities, digital twin towns, or digital twin urbans. For instance, Deren et al. defined digital twin cities and discussed the future development of smart cities based on digital twins [26]. The second is the application of digital twins in urban systems, such as digital twin-based urban planning [27,28] or facilities management [29]. However, these methods are still in their infancy, and there exist major challenges for the precise mapping of virtual space to real space, as well as the interaction between physical urban spaces and virtual urban spaces.
The above five challenges have separate technical solutions. The best way to simulate complex urban systems is to integrate all solutions into a comprehensive platform. We here propose a new platform for urban modeling and simulation based on virtual geographic environments, which can simultaneously meet the comprehensive needs of data and model integration, multi-type visualizations, human-centered simulation, geographic collaboration, and interaction between physical and virtual spaces.
2. Virtual Geographic Environments and Their Features
2.1. Evolution of Virtual Geographic Environments
In 1997, Michael Batty proposed “Virtual Geography (VG)” as geography was changing in subtle and dramatic ways in the rapid transition to a digital world. Batty contended that VG has components of space (the space within computers), cyberspace, and cyberplace [30]. The concept of VG revealed the value and significance of the coupling between computation and geography. A few years later, in 2001, driven by the development of virtual reality technology and the need for geography to extend into a digital world, Lin Hui and Jianghua Gong proposed the concept of Virtual Geographic Environments (VGEs) [31]. Since then, theories and methodologies, technologies, and applications of VGEs have advanced significantly.
Numerous evolution milestones of VGE have been established, including: (1) VGEs are a new language of geography [32], (2) The core of VGEs extends from geo-data only to the integration of geo-data, geo-models, geo-visualization, and geo-collaboration [33], (3) VGEs are efficient tools for spatial cognition [34], (4) VGEs are a new platform for complex geographic experiments [35], (5) VGEs provide a comprehensive platform for geographic knowledge engineering [36], (6) VGEs are a new generation of geographic analysis tool, and (7) VGEs are more than the digital twin of the physical geographical environments [37].
The evolution of VGEs has happened concurrently with the developments of computer and information technologies. The improvement of computing power, such as high-performance computation, makes it possible to rapidly calculate highly complex geographic models, thereby improving the efficiency of virtual geographic environments to simulate and analyze complex geographic processes [38]. The development of 3D engines and the improvement of visualization hardware have advanced VGEs from simple 3D to immersive 3D. The visualization performance can satisfy the demands of large scenes, high precision, high fidelity, and near real-time reporting. Human–computer interaction modes of virtual geographic environments have also advanced. The traditional keyboard and mouse are being replaced by voice, gestures, actions, and even brain waves, which vastly promote user immersion [39]. Big data methods have allowed massive data storage, management, and scheduling for VGEs. Cloud computing technology also serves VGE model management and organization. Artificial intelligence technology assists geospatial intelligent analysis in VGE. Internet of things (IoT) and fifth generation (5G) communication speed up the integration and interaction of virtual geographic environments with real geographic environments.
VGEs have found success in various areas such as crowd evacuation [40], group behavior simulation [40], water pollution control [41], lake basin hydrological processes simulation [42], the simulation of the spread of respiratory infectious diseases [43], three-dimensional forest growth [44], emergency risk assessment [45], aquatic ecological security evaluation [46], urban traffic decision analysis [47], flood routing simulation and scale effect analysis [48], air pollution dispersion [33], disaster risk assessment and mapping [49], high-speed railway engineering construction processes simulation [50], mapping and modeling human exposure to uriniferous mine waste [51], and 3D visualization and simulation of sea level rise [52]. Furthermore, the international conference and China national conference on VGE have been held four times and seven times, respectively. In 2008, a key laboratory of virtual geographical environments was established at Nanjing Normal University in China.
2.2. The Definition of Virtual Geographic Environments
Virtual geographic environments (VGEs) were unofficially proposed for the first time at the First International Symposium on Digital Earth in 1999 and have experienced several stages of evolution over the last 30 years [53], with its definition being modified alongside its rapid development. In general, VGEs refer broadly and collectively to all geographic environments that are not “real”. A VGE can be regarded as a computer-generated digital mapping of a real geographic environment or an imagined environment with geo-referenced locations for representing, modeling, computing, simulating, and analyzing geographical phenomena and processes [54,55]. The features of VGEs involve dual cores of data and models, multi-dimensional and multi-mode visualizations, multi-channel interactions, multi-type geo-collaborations, human-centered interactions across the virtual to the real, and other factors. Natural laws represented by spatial and temporal distribution patterns, evolutionary laws of geographic processes, and interaction mechanisms between geographic elements are the core concepts of virtual geographic environments [56] and are the driving forces behind the research and development of VGEs [57]. VGEs can achieve three main tasks in geoscientific research [58]: presenting contemporary geographic environments, reproducing and recovering historical geographic environments, and predicting and planning future geographic environments. VGEs are a new generation of a geographic language, a new platform for geographic experiments, a new tool for comprehensive geographic analysis, and a new framework for realizing the unification of space and time in the metaverse.
2.3. Features of Virtual Geographic Environments
2.3.1. Data and Models as Dual Cores
Data and models are the main information carriers and abstract forms of the real world in a digital environment. Data and models are two cores of the classic VGE framework that illustrate the increasing significance of urban modeling and simulation under data-intensive research paradigms. The capability of efficiently integrating and managing multi-source heterogeneous data and models makes VGE a powerful platform for digital geographic resource sharing and reusing [35]. The data environment and model environment are here introduced to depict a clear picture of a VGE dual core (Figure 1).
Geographic data (geo-data) is fundamental to geographic scene expression and geographic problem analysis. In a VGE, the core data environment is responsible for geo-data integration, management, and organization. A large volume of dynamic geo-data flows into VGEs. With the rapid development of photogrammetry and remote sensing technologies, Earth observation can be progressively carried out all day long and in all weather conditions [56]. Social data can reveal the urban environment and human activities and can be easily accessed with the support of distributed sensors under an Internet of Things (IoT) approach. The data environment of VGEs is designed to represent discrete entities and continuous phenomena as well as their changing geographic attributes and interaction information, indicating geographic knowledge from different perspectives [57]. VGEs construct a spatiotemporal unified data model to handle the unified representation of continuous and discrete geographic objects or phenomena where heterogeneous spatiotemporal data are parsed from semantic and structural layers [59]. These layers can link geographic information extracted and organized by the geometric algebra data model GA-MUC [60]. Geographic simulation and visualization in VGEs are facilitated by the development of data environments using massive spatiotemporal data scheduling, data acceleration, distribution mechanisms, and sharing mechanisms [59].
The analysis and simulation of dynamic geographic phenomena are critical in geographic research [61,62] and their key tools are geographic analysis and process models. Notably, the methods of VGEs are different from spatial analysis and statistical analysis algorithms employed by GIS systems, as geographic process models refer to models implemented for dynamic geographic process computing. The model environment in VGEs involves four important factors for geographic analysis and simulation, including model standard specification design, geographic modeling, model sharing and reuse, and model integration and implementation [35]. Model standard specification design handles the standardization of model semantic information and model running information. Geographic modeling establishes the basic geographic concept models and the computational models. Model sharing and reuse aim to optimize the utilization of model resources distributed throughout the network. Model integration involves the implementation of model storage, execution, and operation. The model environment of VGEs provides experts from different fields with an open workspace to create, share, reuse, and implement the distributed geographic analysis models. The combination of geographic process models in VGEs and GIS-based analyses enables new quantitative and systematic examinations of spatial and temporal patterns of dynamic geographic processes, improving the understanding of gradual geographic evolution [63]. Moreover, the geoscientific workflow management method in VGE using the intelligent version control of models and the geographic simulation procedure can be easily reproduced, promoting the sharing and reusing of geographic knowledge [64].
2.3.2. Coupling Human Activities
In a real geographic environment, there are a large number of various long-term, short-term, small-scale, and large-scale human behaviors, such as passing through an intersection with traffic lights, orderly queuing, going to and from school, taking public transportation to and from work, moving from one city to another, the economic behavior of the country, etc. These behaviors can be reconstructed and studied using VGEs. A primary interest of geography is the human–land relationship, which is also found in other disciplines derived from geographies, such as GIS (Geographic Information Science) and VGEs. Traditional GIS focuses on natural environment research, while a VGE is more concerned with the modeling of “human” factors. VGEs can construct a complete virtual human-environment relationship, which logically expands traditional GIS and forms a new generation of geographical language [32].
Human–environmental relationships in VGE can be divided into macro and micro relationships. Macro human–environment relationships consider human activities in the macro space, e.g., the world or a country, and over a long term. The micro human–environment relationship considers micro space more consistent with human individuals, e.g., a building, a block, etc., the interaction mechanisms between individuals, as well as the interaction mechanisms between human individuals and micro-environments. The overall trends, group characteristics, and laws are emphasized at the macro human–environment relationship level, while the micro scale considers individual heterogeneity of humans, and is more feasible to reproduce the detailed behaviors and activities of people; from this, the spatial-temporal law of individual behaviors can be studied and analyzed.
The basic concept of modeling human activities in VGEs is as follows (Figure 2). Spatial-temporal characteristics are abstracted to build a variety of human behavior models including data-driven models and rule-driven models, and then the human activities in the virtual geographical environments can be reproduced, which can further couple with the real human activities to carry out scenario simulations for prediction analysis of human activities.
2.3.3. Multi-Type Representations
The representation objects are VGE elements, which include geo-data, geo-processes, and geo-knowledge. These elements are first assigned standard codes by geo-coding under unified spatial coordinate systems. Then, data organization and scheduling mechanisms that consider geo-similarity rules and efficient rendering algorithms considering geographical features can be developed. Therefore, geographical environments, geographical processes, geographical features, and various cartographic generalizations can be reproduced in virtual geo-space, forming the geo-cognition-oriented VGE reconstruction modes.
Various tools and terminals including PCs, helmeted virtual reality (VR) terminals (i.e., HTC VIVE, Meta Oculus, Meta Quest), and helmeted augmented reality (AR) terminals (i.e., Microsoft HoloLens), can be employed and adapted to represent VGEs in 2D, 3D, and multi-dimensional dynamical ways. VGE applications based on helmeted VR terminals and AR terminals are very promising because of their immersion and interactivity. With the help of helmeted VR, users can experience virtual geographic content or interact with virtual elements in an immersive way; with the help of helmeted AR, virtual geographical environments, as well as their virtual contents, can be integrated with the physical environments to build mixed geographical environments. The physical geographical environments can be real spaces, for example, buildings, or a man-made or 3D-printed sand table. VGEs emphasize geo-analysis, geo-query, and geostatistics under geographic coordinate systems, which can be represented as Geo-2D, Geo-3D, Geo-VR, and Geo-AR. To match the above multi-type representations, different interaction modes can be employed. Keyboards and mice, interactive handles, joysticks, eye trackers, wearable devices, gestures, postures, or voices can all be employed for human and computer interaction for PC and immersive helmeted terminals.
VGE users can observe, experience, and understand virtual geographical environments, make their own predictions, and form understandings of geographic issues. This understanding can be further applied to observations, forming a cognitive cycle (Figure 3).
2.3.4. Supporting Geo-Collaboration
Geography is comprehensive and geographical issues are complex. Thus, the research of geographic issues requires collaborative works with multidisciplinary knowledge, multi-domain experts, and multi-departmental resources. These requirements can be supported by VGEs since they have functions of geographic collaboration or geo-collaboration that can be analyzed from multiple perspectives (Figure 4).
Geo-collaboration was defined by MacEachren et al. as “group work about geographic scale problems facilitated by geospatial technologies” [65], who also defined four modes of geo-collaboration according to spatial and temporal dimensions. Spatially, the key distinction is between collaborators who were co-located (same-place collaboration) and those located remotely (different-place collaboration). Temporally, collaboration was categorized as synchronous (same time) or asynchronous (different times). IoT technologies are also emerging as a new mode of geo-collaboration between physical and virtual systems, which is key for realizing digital twin geographic environments.
Geo-collaboration includes multi-disciplinary models, multi-domain data, and multi-departmental resources. Multi-disciplinary model collaboration means that disciplinary knowledge is integrated and cooperative. Multi-domain data represents geographic environments from multiple perspectives, which have different types, structures, and scales. In VGEs, multi-domain data are organized and managed under a unified spatiotemporal benchmark and can be visualized in a suitable form to support collaborative discussions. Multi-departmental resource collaboration means that multiple departments participate in geo-collaboration by sharing their own resources, such as equipment resources and computing power resources.
Geo-collaboration is a workflow involving multiple users. This workflow usually includes the initial configuration, data preparation and processing, problem modeling, model calculation, process simulation, result analysis, and conclusions. The users participating in the collaboration come from a wide range of fields, including government officials, scientific researchers, the public, and technicians. VGE meets all the requirements of this collaboration process. The running process of VGEs are workflows, which include various steps of geo-collaboration. VGEs are constructed for multiple roles to meet the needs of multi-domain users participating in the collaboration. VGEs support multi-type visualization, including 2D, 3D, VR, and others, which can adapt to the usage habits of various users and ensure professional understanding, accurate operation, and scientific explanation of geographic problems.
2.3.5. Interaction across Physical Environments and Virtual Environments
The interaction across virtual and physical environments based on VGEs refers to the fusion and interoperability of virtual and physical spaces that cover three levels of the virtual-physical connection. First, the geographic entities in the virtual environment dynamically represent the changing state of physical entities and the functions in the virtual environment rapidly quantify those changes that are not easily directly measured in the physical environment. Second, the operations of geographic entities in the virtual environment have the same influence on physical entities, namely, controlling the physical world through the digital world. Third, the actions or measurements conducted in the physical environment validate and realize the hypotheses in the virtual environment. The effects of VGE-based virtual–physical interactions depend on the spatial scale of geographic entities and the temporal scale of their evolutional process. The global and local effects of the spatiotemporal span should thus be considered when an interaction occurs in multiple physical–virtual environments.
VGEs exploit an expression environment, which is a systematic environment enabling multi-dimensional visualization, multi-channel perception, and multi-sensor services. Multi-channel perception supports the expression of geographic elements, interactions, and evolutionary processes through various visible and inductive channels, such as visual expression channels and sensible expression. In addition to physical devices such as virtual gloves and helmets, a series of flexible forms such as language and gestures are employed as interactive channels in VGEs to improve interactivity and enable more natural manipulation. Natural communication between a human and their virtual environment, such as answering a question, can be realized by VGEs equipped with geographic knowledge graphs [66]. This kind of novel approach can further improve the immersive and cognitive effects of VGEs. With advances in virtual reality (VR), augmented reality (AR), and mixed reality (MR), more vivid VGEs are expected to develop in the near future [67].
The difference between VGEs and virtual reality environments lies in real geographic features, mechanisms, and laws, which are integrated into VGEs for geographic problem-solving. VGEs are introduced for the reproduction of past or current geographic scenarios as well as for the prediction of future geographic phenomena [68]. These VGEs corresponding to the real-world support virtual geographic experiments where human–environment interactions can be represented, simulated, and analyzed. Therefore, the VGE is a promising platform for effective decision support by informing policymakers of a holistic understanding of urban systems (natural and social processes), their complex interactions, and how they respond to various changes [69].
3. Framework of VGE-Based Urban System Modeling and Simulation
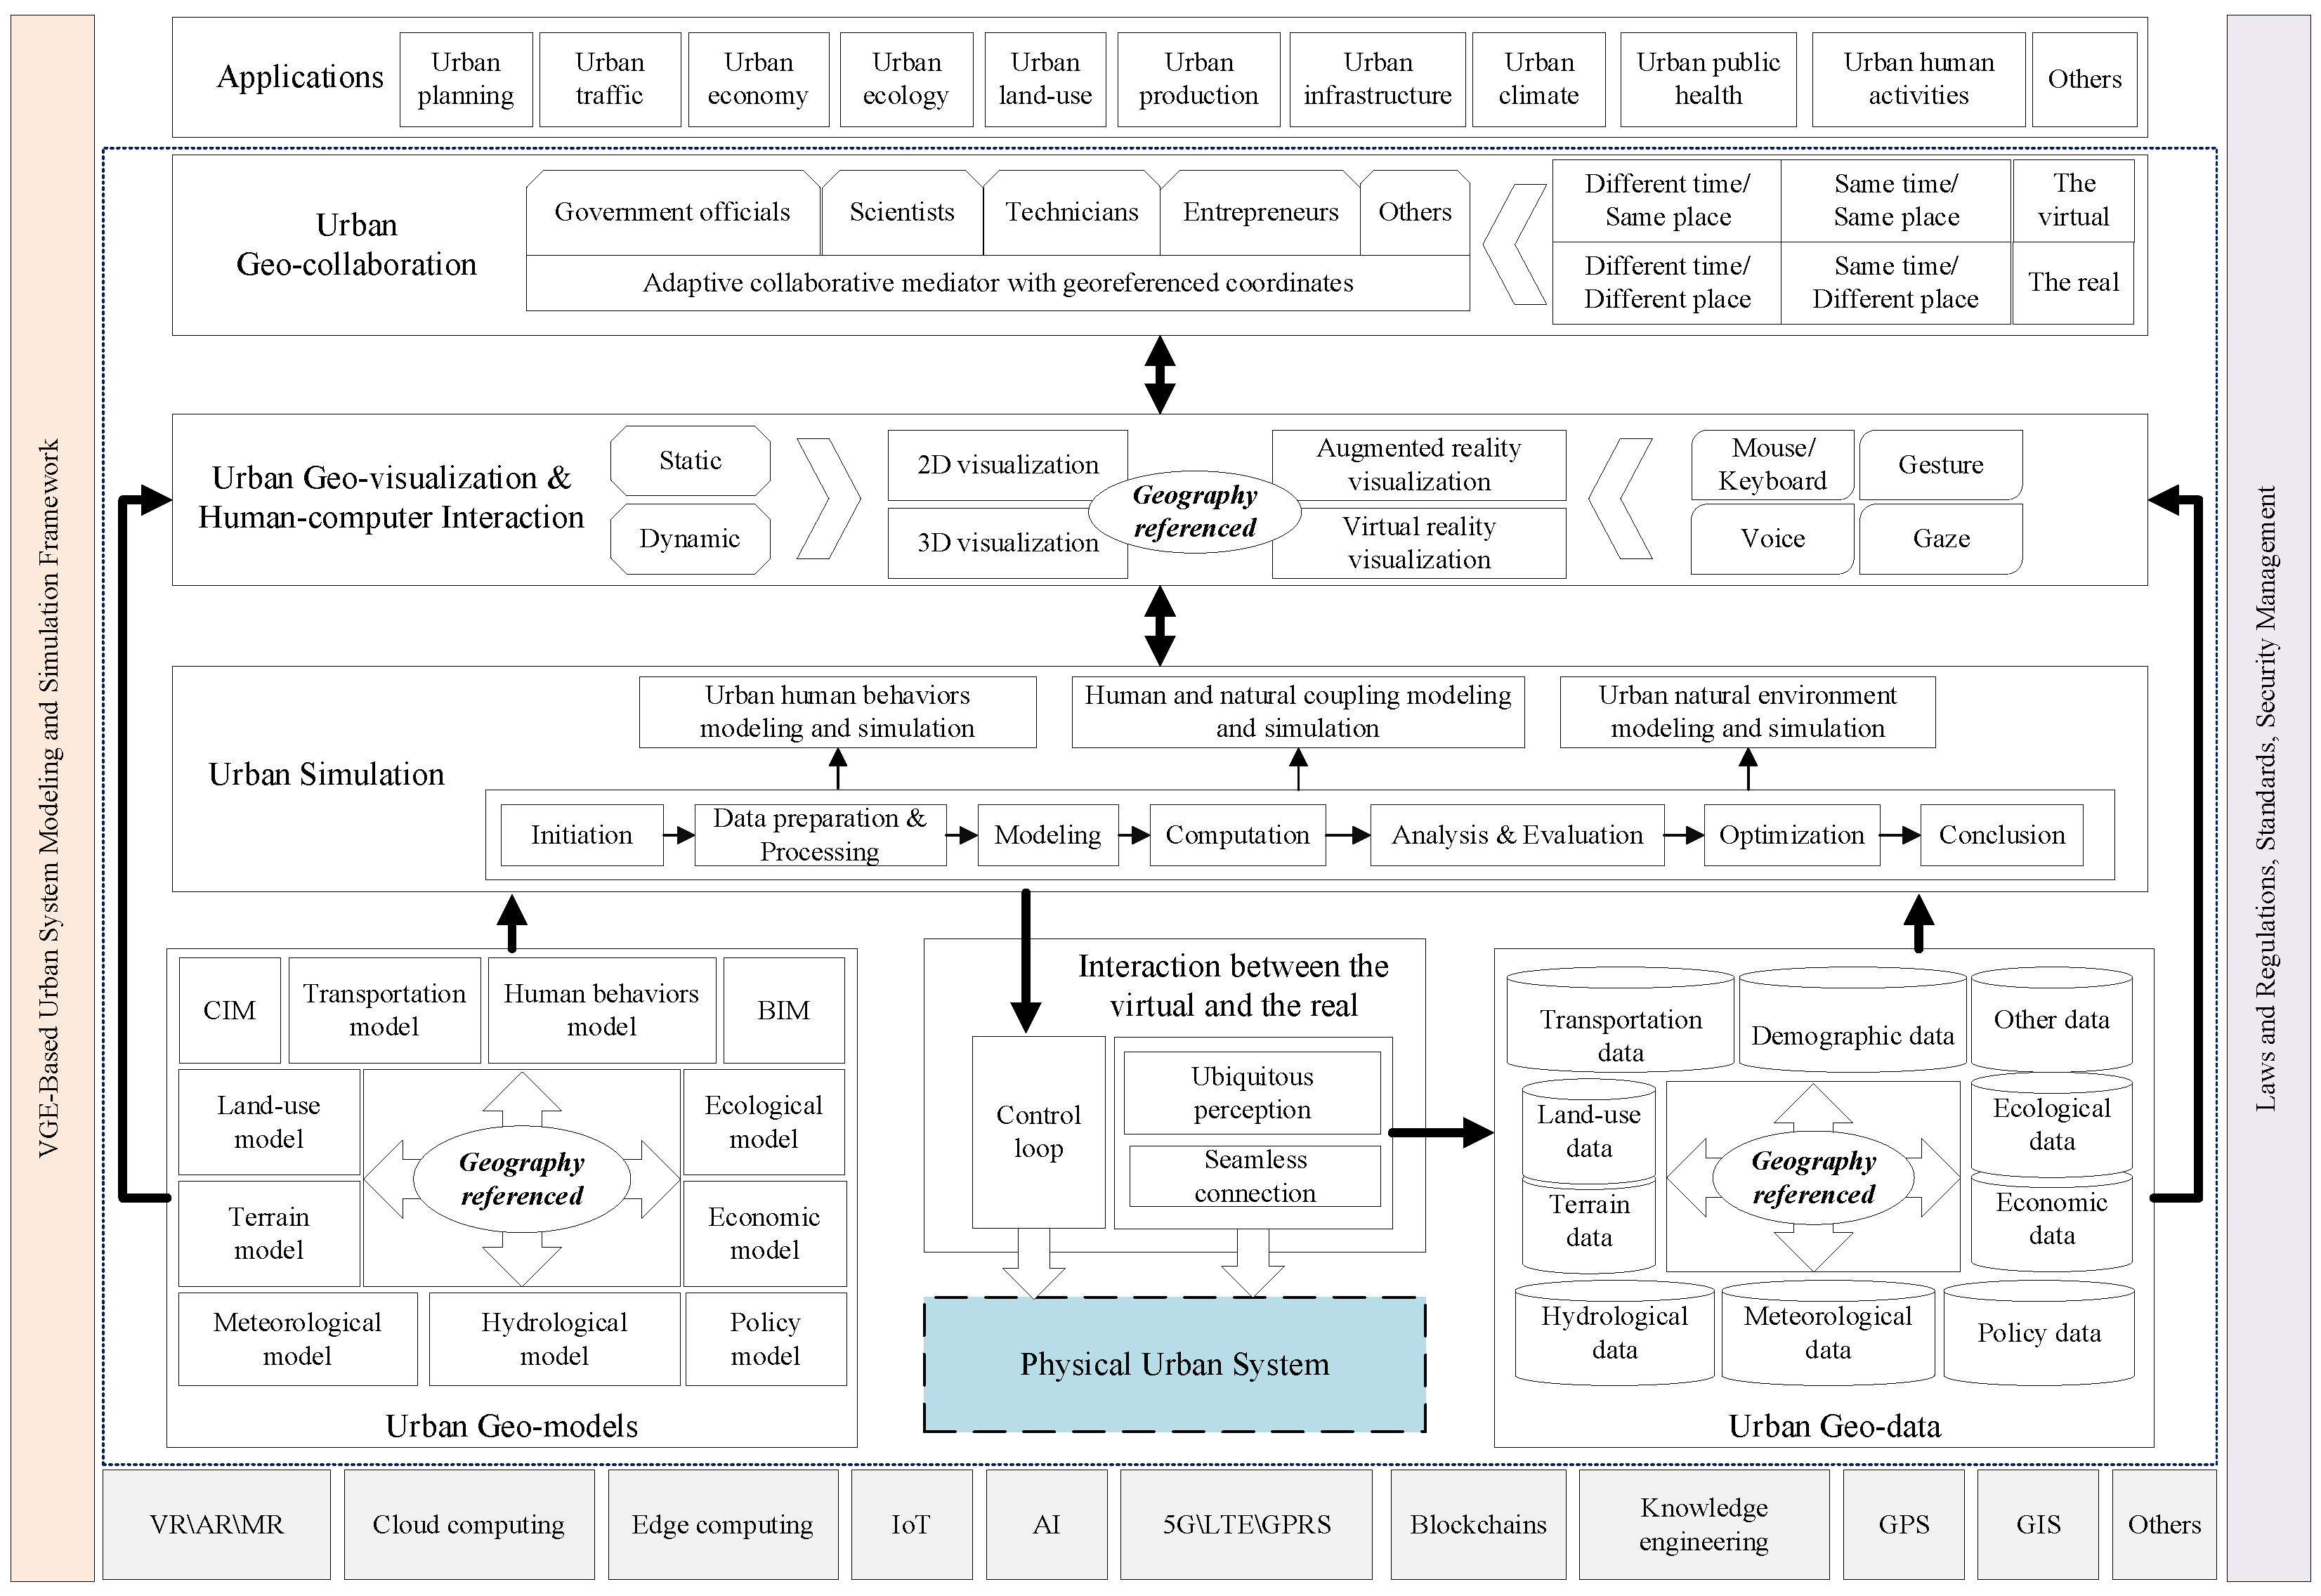
VGE-based urban system modeling and simulation (VGE-USMS) provides a significant opportunity to extend the ability of urban planning and governance. The framework of VGE-USMS contains five components (Figure 5), including urban geo-modeling, urban geo-data, urban simulation, urban geo-visualization, human-computer interaction, and urban geo-collaboration. Other ancillary technologies that support the framework involve virtual reality, cloud computing, fifth generation (5G) communication, the Internet of Things (IoT), building information models (BIM), artificial intelligence (AI), blockchains, global position systems (GPS), remote sensing, and geographic information systems (GIS). Standards, regulations, and security management are required at all levels to ensure the safe and efficient operation of a VGE-USMS platform.
- (1)
- Urban geo-data component.
The urban geo-data component is a summary of all kinds of geo-data resources concerned with city structure and status, which provides the data foundation for VGE-USMS. Data sources can be divided into basic terrain data, Earth observation data, IoT sensing data, social network data, and other data. Basic terrain data acts as the foundation to build urban geographic scenes, including vector maps, raster images, digital elevation models, and so on. Most Earth observation data comes from a wide range of remote sensing images such as hydrological data, metalogical data, and land use data. IoT sensing data are collected and reported by monitoring devices distributed all around cities, such as transportation data, air quality data, and ecological data. Social network data integrates the information from social media platforms such as Twitter, service systems such as mobile phone operators, and third-party application data, which can reveal diverse human activities in cities.
- (2)
- Urban geo-model component.
The urban geo-model component consists of scenario models and calculation models for VGE-USMS that provides the support to enhance the modeling and simulation ability of the framework. The scenario model is exploited to construct urban scenes based on a basic terrain model and it covers the city information model, the building information model, and other 3D models of geographical entities in the city. The calculation models involve a wide range of geo-referenced algorithms designed for various urban issues, e.g., geographic analysis models, spatial-temporal process models, transportation models, economic models, ecological models, human behavior models, and general AI models. With the flexible model management strategies in VGEs, these models can be adaptively coupled to facilitate the urban modeling from three aspects. The first is for urban state monitoring that calculates the urban state evaluation index under different policy scenarios. The second is for urban element deduction that evaluates the development and evolution of the core urban elements. The third is for urban decision support that simulates urban future policy adjustment and major project planning by modifying control indicators of urban models, dynamically updating planning schemes, and timely responding to new policies.
- (3)
- Urban simulation component.
The urban simulation component can extensively perform the simulation of urban system status from three levels: urban natural environments, urban human behaviors, and the coupling of human and nature. This three-level urban modeling and simulation are implemented by core VGE features and functions, including but not limited to perceptual interconnection, environment mapping, multidimensional modeling, spatial-temporal computing, simulation deduction, and evaluation. Perceptual interconnection refers to the real-time perception and interconnection control of all elements of a city, including identification analysis, intelligent perception, real-time monitoring, and collaborative control. Environment mapping refers to the establishment of multi-level and multi-dimensional mapping relationships between the real world and the virtual world, including state indicators, object management, attribute association, and feature extraction. Multidimensional modeling is a multi-dimensional digital representation of urban scenes, including event modeling, scene modeling, semantic modeling, and rule modeling. Spatial-temporal computing refers to multidimensional computing involving spatial-temporal characteristics, such as spatial-temporal analysis, spatial-temporal query, and spatial-temporal process calculation. Simulation inference includes semantic inference, rule inference, and scene inference, which support urban system modeling and simulation.
- (4)
- Urban geo-visualization component.
The urban geo-visualization component efficiently realizes multidimensional dynamic expressions of urban modeling results, achieving seamless mapping expression from the physical world to the digital world. A series of technologies are adopted such as virtual and real fusion, vast data rendering, 3D scene definition, and so on. The perception and cognition of urban simulation results can be enhanced using a variety of human-computer interaction modes and interactive application forms of different devices. Human-computer interaction modes include customized Web applications with VR/AR/MR-enabled interactions between virtual and real environments, and they are facilitated by a wide range of terminal devices such as personal computers, touch screens, wearable devices, and mobile terminals.
- (5)
- Urban geo-collaboration.
The urban geo-collaboration component enables various stakeholders of cities and researchers from different domains to collaboratively participate in urban modeling and simulation, such as government officials, scientists, businessmen, and the public. The unified geo-referenced coordinate system in VGEs allows participants to observe and analyze an urban system on different spatial-temporal scales to understand the urban problem from diverse points of view. A series of geo-collaboration mechanisms are provided to ensure efficient collaboration in urban modeling and simulation, including mechanisms for data collaboration, model collaboration, and visualization collaboration. This kind of geo-collaboration is a promising tool for allowing different stakeholders to achieve their shared goals in urban planning and governance.
The above components are supported by the VGE-USMS infrastructure consisting of technologies and digital facilities that support perception, connection, storage, and computation. The perception infrastructure includes IoT sensors, Earth observation equipment, GPS, RFID terminals, and other ubiquitous perception networks. The connectivity infrastructure includes advanced connectivity communication equipment, facilities, and systems such as the Internet of Things, 5G mobile communications, and ubiquitous awareness networks. The storage and computation are supported by advanced computing infrastructures such as cloud computing, fog computing, distributed computing, and edge computing, which construct an integrated computing resource pool for urban modeling and simulation.
4. Case Studies
VGE can be applied to urban modeling and simulation at multiple scales. Shenzhen, as one of the key cities of the Pearl River Delta (PRD) in China, has become a pioneer of introducing geographic information technology in urban development. From the earlier period of the digital city, planners and managers in Shenzhen kept on integrating multi-sourced natural, social, economic, and humanities information with heterogeneous spatial data in VGEs to provide platforms for both professional planners and the public. The following two cases describe how VGE supports urban modeling and simulation on different scales, which are VGE-based collaborative modeling and simulation of air pollution dispersion in the PRD urban agglomeration at the macro scale, and fire emergency crowd evacuation simulation at the micro scale.
4.1. VGE-Based Collaborative Modeling and Simulation of Air Pollution Dispersion in the PRD Urban Agglomeration
4.1.1. Background
The Pearl River Delta (PRD) is located in the central and southern part of Guangdong Province, China. It has nine cities and is a pioneer area of reform and openness in China. According to a World Bank report, the PRD surpassed Tokyo, Japan in 2010 to become the largest urban agglomeration in the world by population and area. Along with the two special administrative regions of Hong Kong and Macau, the Guangdong-Hong Kong-Macao Greater Bay Area is quickly becoming one of the four largest bay areas of the world alongside New York City, the San Francisco Bay Area, and the Tokyo Bay Area.
The rapid development of industries in the PRD has brought a significant impact on the regional environment, especially air pollution. Regional air pollution control requires effectively coordinated actions of all cities as well as the cooperation of multidisciplinary knowledge such as atmospheric science, environmental science, geographic science, and social science, as well as the participation of government departments, scientific research institutes, technicians, and the public. To address this important issue, a collaborative system based on VGEs is developed for the modeling and simulation of regional air pollution in the PRD urban agglomeration area.
4.1.2. The Architecture
The architecture of the VGE-based air pollution collaborative modeling and simulation system (VGE-APCMSS) is shown in Figure 6.
The VGE-APCMSS contains several modules, including a geo-data module, a geo-modelling and computation module, a geo-visualization module, a network communication and geo-collaboration module and an analysis and decision-making module. The entire system is structured as a star topology, with the center of system management node surrounded by a computational grid node to support MM5/SYSUM-based environmental circulation and air pollution dispersion modeling and computation, a 2D visualization node, a 3D visualization node, and users connected by a wide area network. The system management node takes many roles in the overall system, such as ① middleware to connect users and models in the computation environment; ② security to prevent attacks on the computational grid; ③ coordinator which detects and negotiates conflicts between multiple users; and ④ storage of shared data (both pollution source and model computation result). MM5/SYSUM, which is computationally intensive, is installed on the high-performance computation node (HPC-node) of the Chinese University of Hong Kong. The environmental data to support the running of MM5/SYSUM is also loaded on the HPC-node. MM5/SYSUM is controlled by a windows style of model operation interface, which can be integrated by using 2D geo-referencing visualization (2D geo-visualization) and 3D geo-referencing visualization (3D geo-visualization). Visualization nodes integrate geo-data with geo-model operations, pollution result transformations and geographical visualizations. The geographical visualizations in 2D and 3D environments include geo-model computation visualization, air pollution (both distribution and dispersion) visualization, analysis visualization, and collaboration visualization. The 2D geo-visualization environment and 3D geo-visualization environment are the system interfaces that can be distributed on a wide area network. Therefore, users both in the local area and abroad can select one type of interface to connect to the system, generate running commands for the geo-models, run geo-models on the HPC-node, collect computation results from the geo-models and visualize them, and make geo-collaborations during the execution of the above modeling and simulation steps. In this architecture, geo-collaborations happen when multiple users conduct collaborative compilations on air pollution sources, operate on the same models, or carry out simulations.
4.1.3. Results
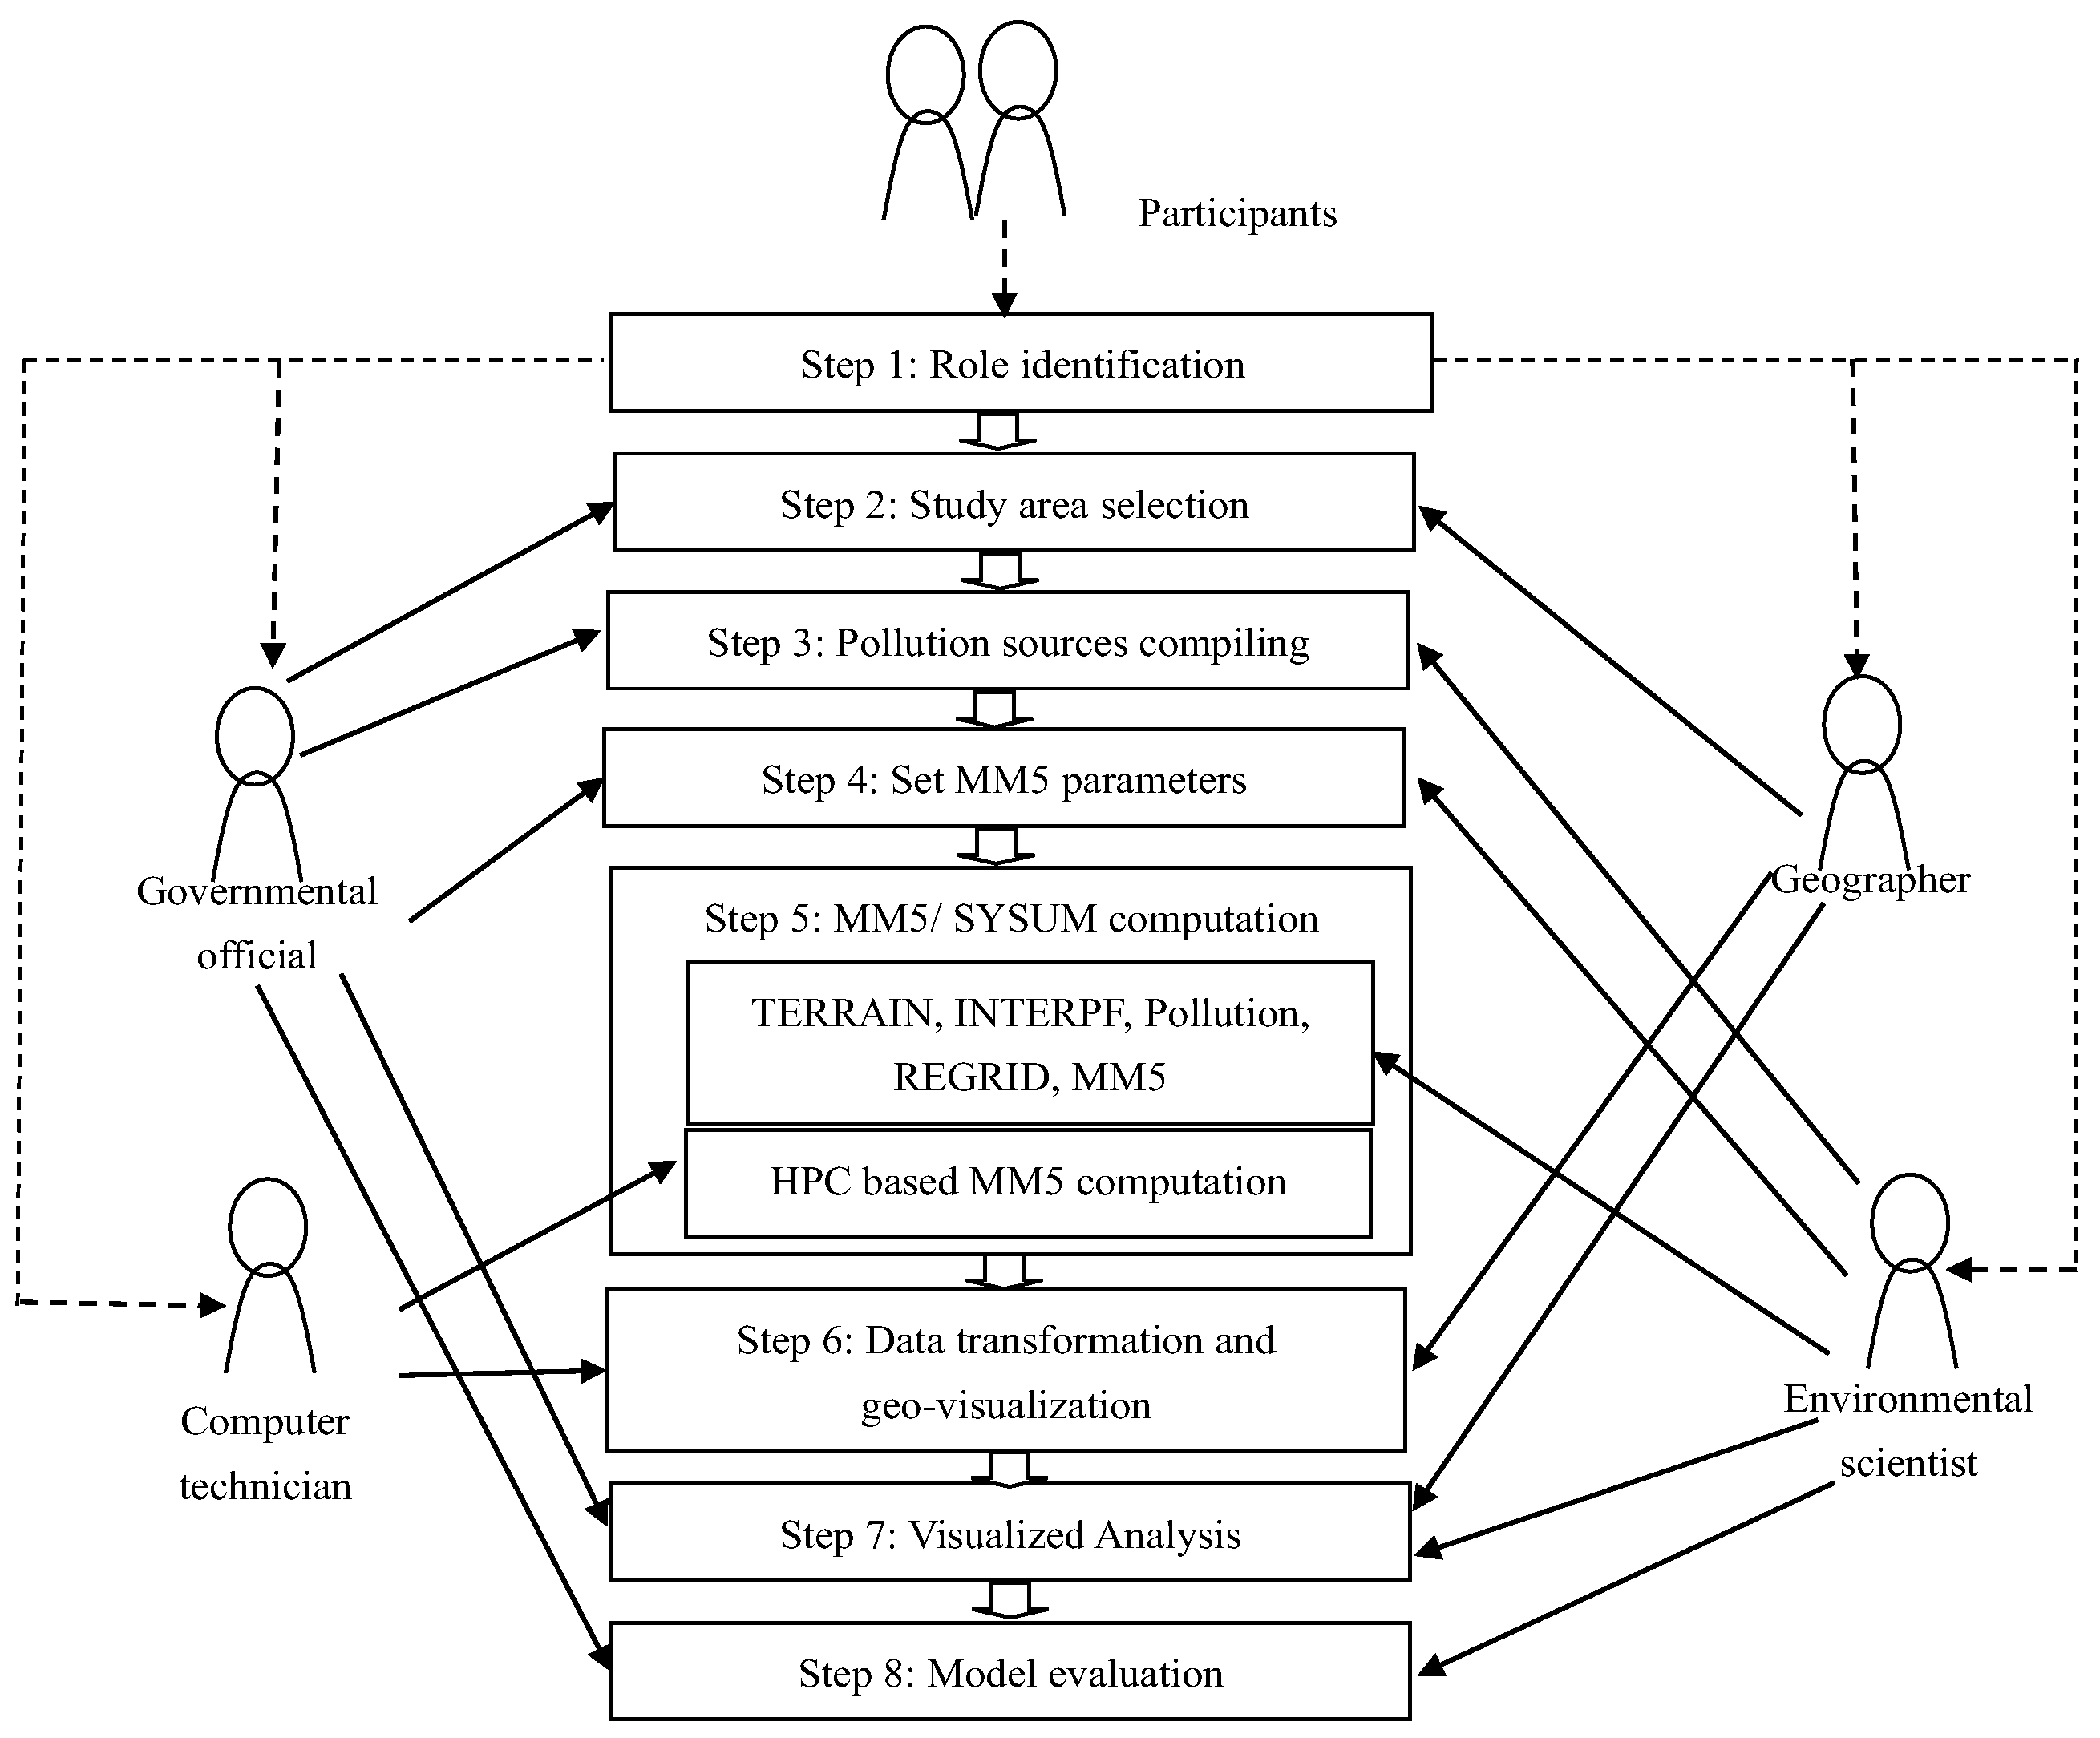
The top-down workflow of the VGE-APCMSS system is shown as Figure 7. Around the workflow are multiple participants who conduct geo-collaboration on air pollution source compilation, circulation and environmental modeling, data transformation, geo-visualization, and analysis. When a participant logs in to the system, he or she will be identified to be the social participant such as a governmental official, a geographer, a computer technician, or an expert such as an environmental scientist. The mode of geo-collaboration in Figure 7 is hybrid. Some steps are controlled by one participant, while some steps are conducted by multiple participants from cities located in the PRD region or beyond.
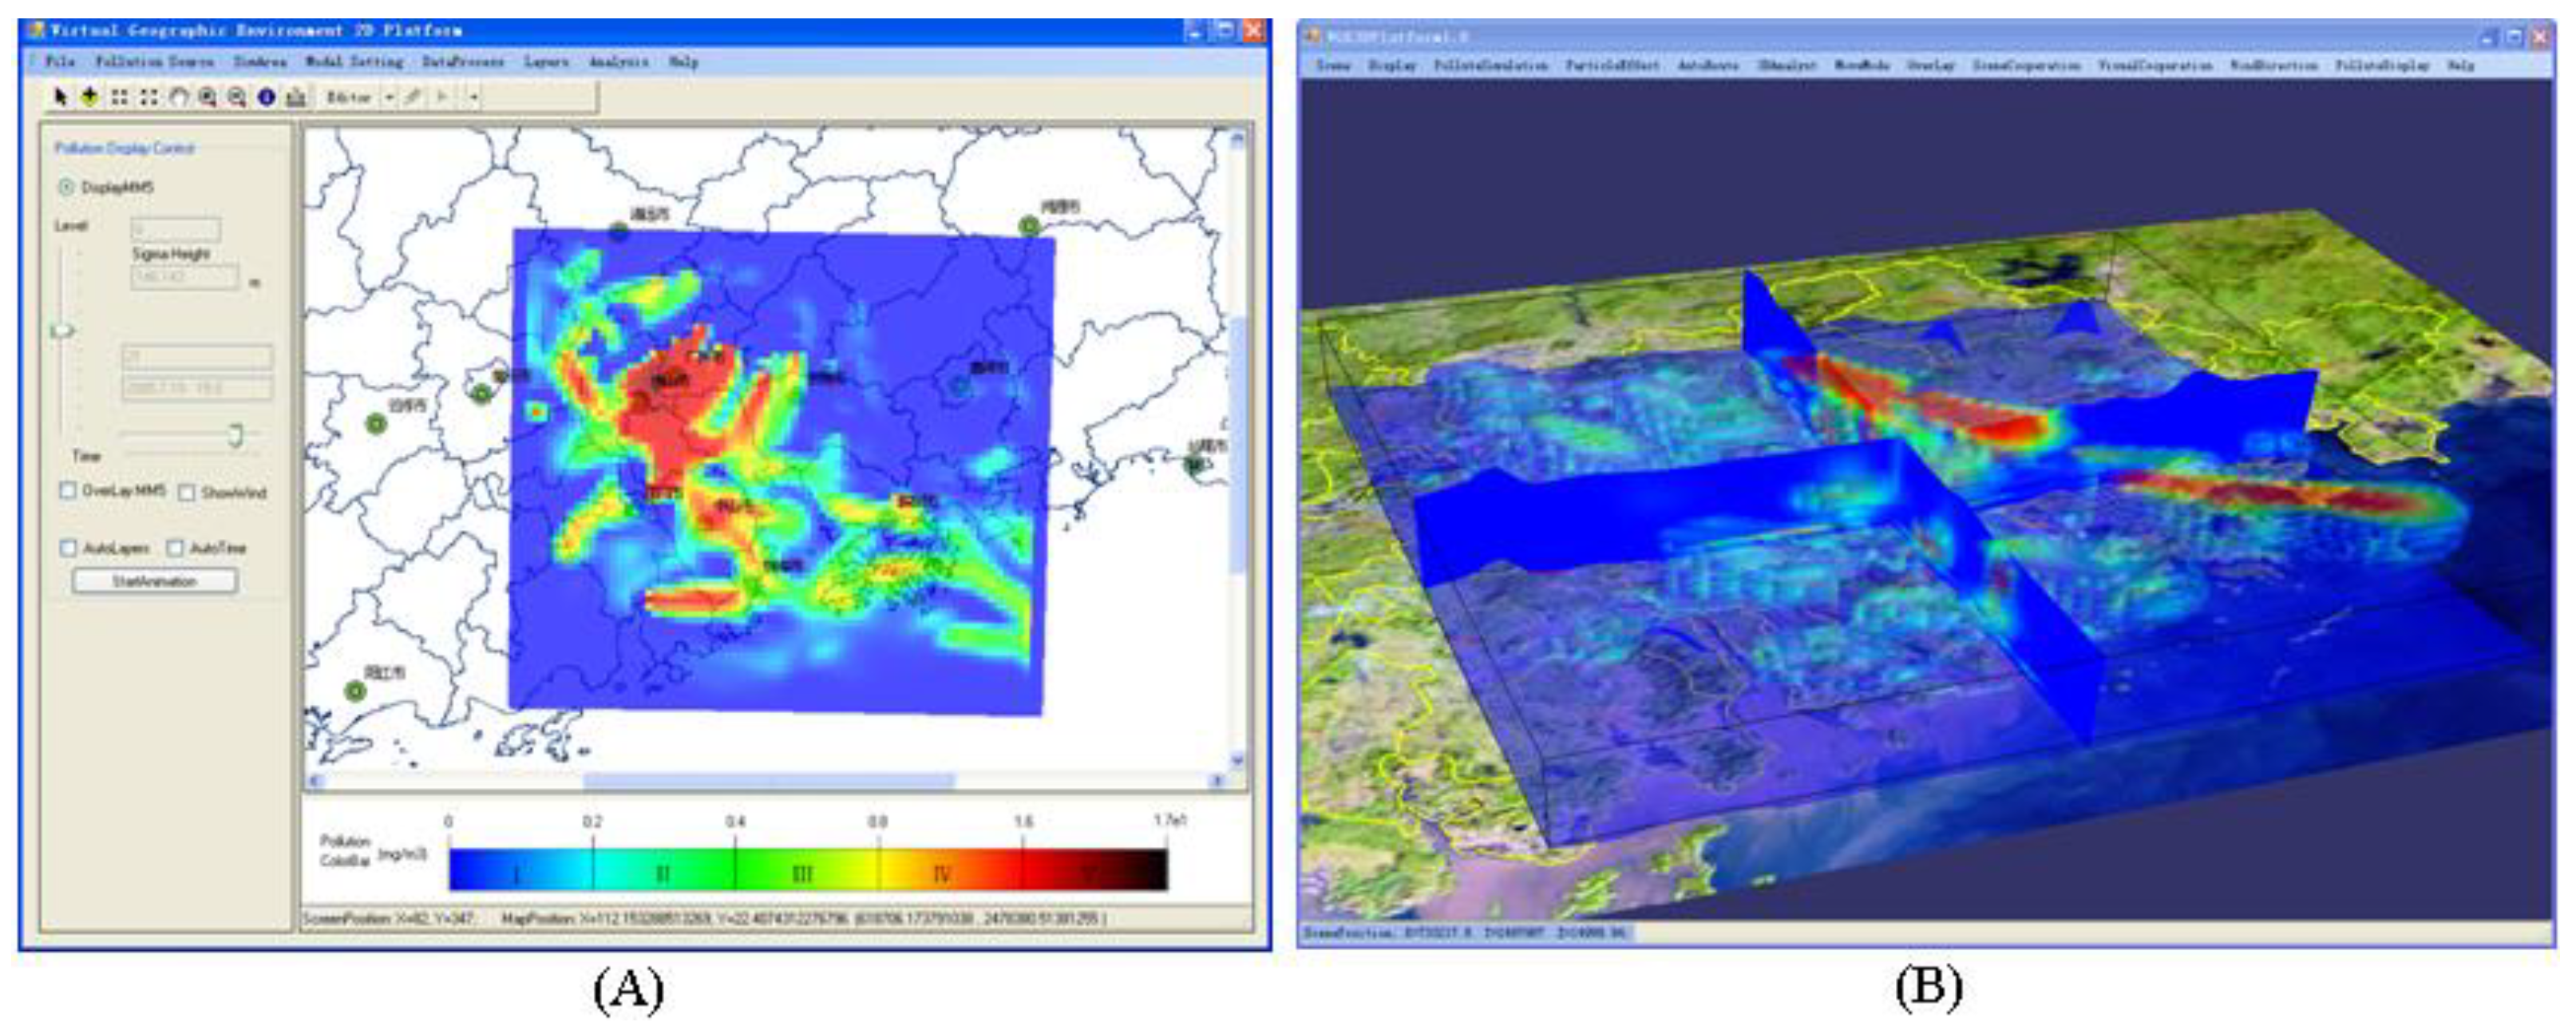
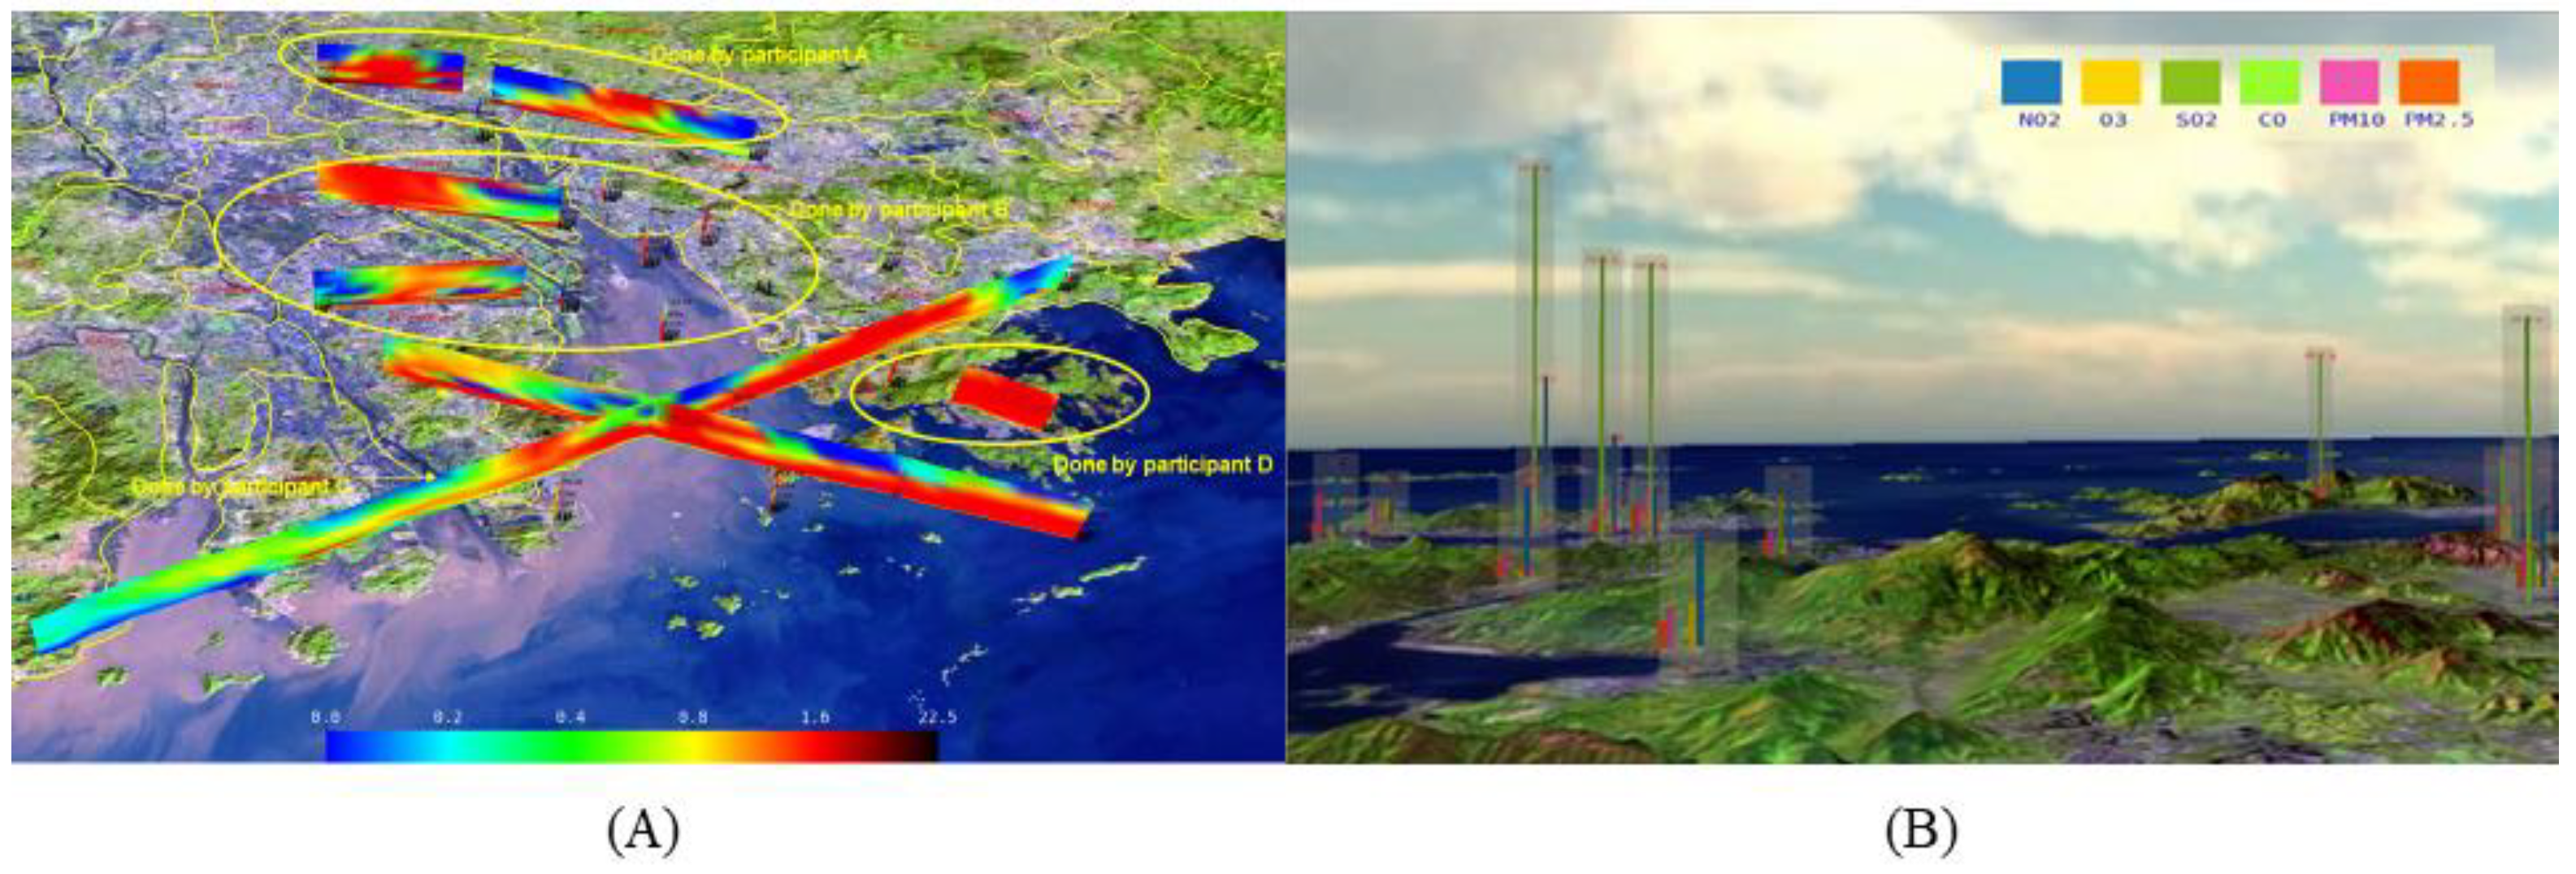
Two types of operation nodes are provided in order to adapt to different usage habits, a two-dimensional interface node (Figure 8A) and a three-dimensional interface node (Figure 8B) using geographic reference coordinates. The data and models behind the interfaces are shared, and all operations in the simulation loop are supported in both types of nodes. From geographically distributed locations, participants collaboratively conduct authorized steps and finally obtain pollution dispersion results. The results are geo-visualized in the interface shown in Figure 8. Figure 8A shows the air pollution layered output for the simulated layers and times on background maps. The layers can be displayed manually to analyze a single image or to create animations. Figure 8B displays volume rendering, transaction, and iso-surface images in a virtual geographical environment. Participants in the virtual environment may visually share their analyses and make collaborative analyses. Figure 9A shows four participants visually giving their analyses in the shared virtual geographic environment. Figure 9A shows the concentration values of various pollutants at key points in detail.
4.2. School Fire Emergency Crowd Evacuation Simulation
4.2.1. Background
In emergency situations such as fires, students need to be removed from schools as fast as possible, and emergency evacuation is therefore a major concern [70]. We now consider a three-floor classroom building of a primary school (Figure 10) as a case study. Figure 10a is the layout of the school campus. The three-floor classroom building is on the upper left of the campus, shown in Figure 10b. In the classroom building, there are two stairways, here called the left stairway and the right stairway. There are four classrooms on every floor named R1, R2, R3, and R4. The layout of a classroom is shown in Figure 10c. There are two doors (rear door and front door) by which the classroom connects with the floor corridor.
A school is a relatively small geographical environment, but we still need a high-dimensional virtual environment to express the crowd behavior and characteristics during an evacuation realistically. Therefore, a VGE framework is employed to construct a micro modeling and simulation system for school evacuations.
4.2.2. The Architecture
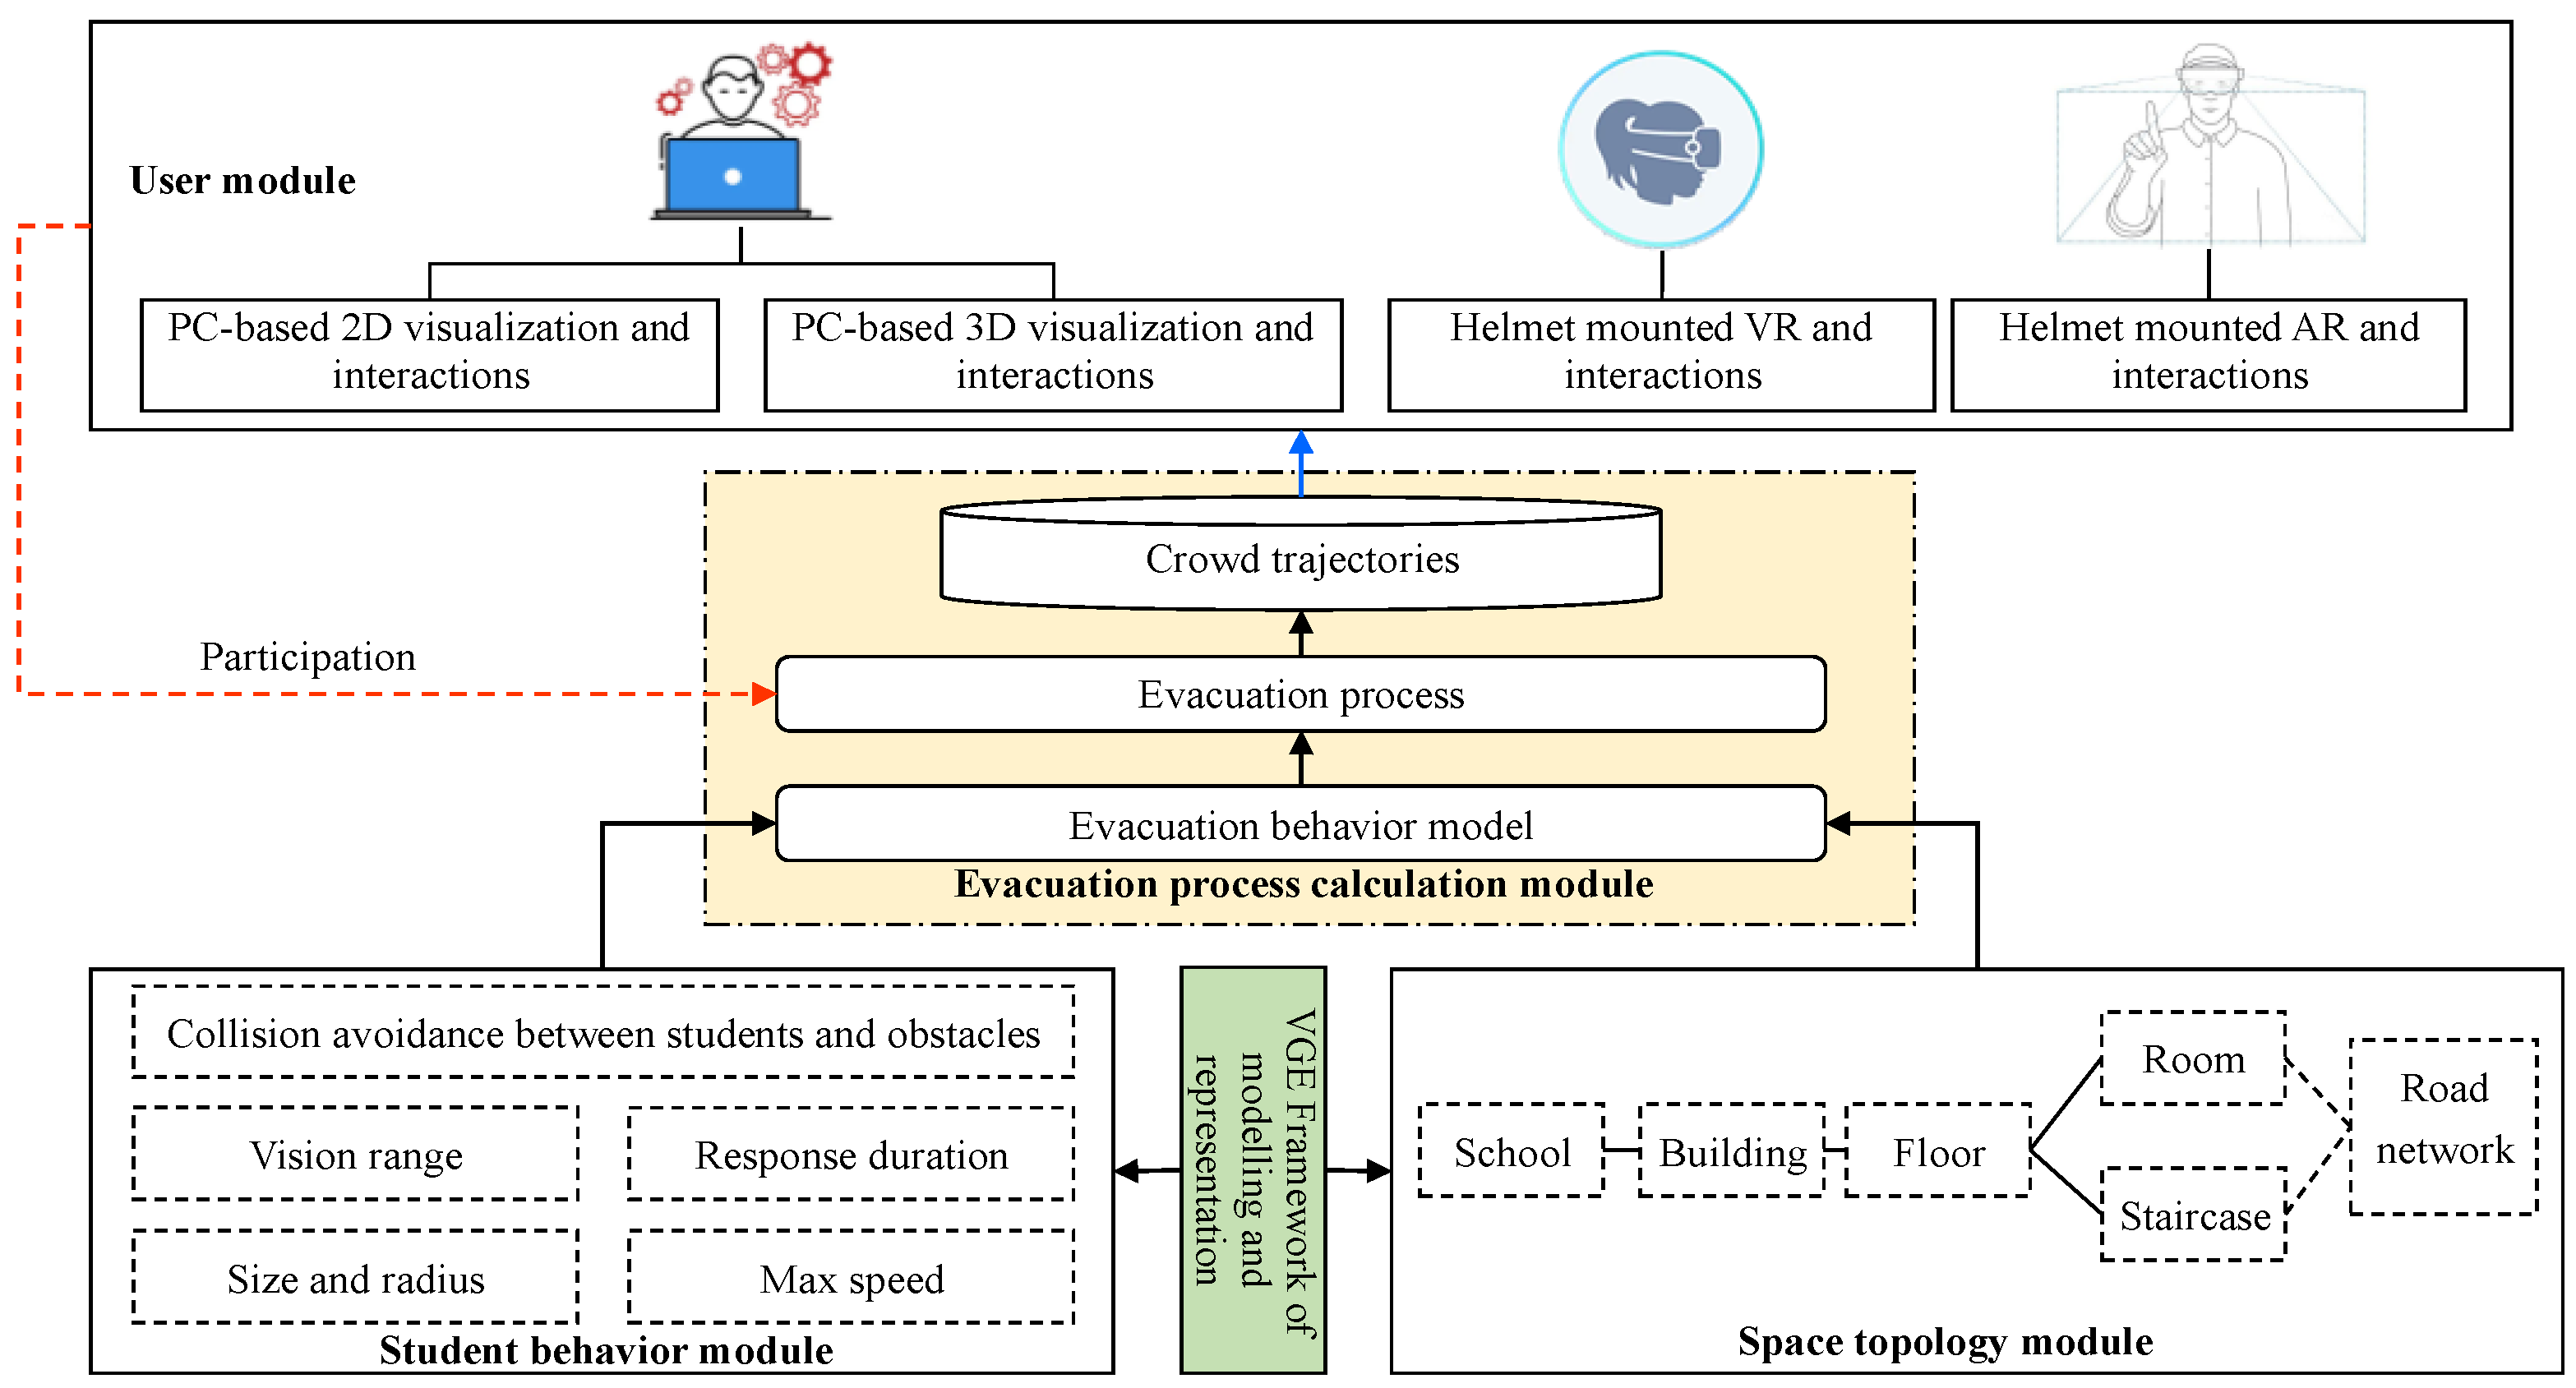
The VGE-based evacuation modeling and simulation system for schools consists of three modules (Figure 11):
(1) The micro human–land relationship modeling module. ① The school space is logically divided into components of campus, buildings, floors, rooms, staircases, the spatial shape and geometric boundary of each component are determined, and the topological relationship and connectivity of each component is built up and a three-dimensional micro road network is determined; ② the basic attributes of each student are abstracted, such as the maximum speed, the radius, etc. Then, the basic behavior of students is modeled to construct the collision avoidance behavior between students and between students and obstacles. These models and data are input to the calculation module.
(2) The evacuation process calculation module. The student interactions are calculated by the VGE behavior model. In this way, the evacuation behaviors of student groups can be reproduced, showing that the evacuation process always evolves from indoor to outdoor targets. Calculations of student positions are determined as follows: for student A, let the initial position be F and the target position be E, a path with many nodes from F to E can be determined based on a path finding algorithm such as A* or Dijkstra. We suppose the set of path nodes be J. At moment T, we suppose the position of A be PT, (1) retrieve the first node Jn in J as the target, (2) determine the desired velocity with the maximum speed pointing from Pt to Jn, (3) Find surrounding students and obstacles, take collision avoidance with these students and obstacles as the discriminant, and then calculate an optimal speed, VT, (4) We further suppose the time interval between T and T + 1 be dt, then the position at moment T + 1 can be calculated as PT + 1 = PT + dt ∙ VT, 5) If Jn has not been reached, Jn is still selected as the travel target. If Jn has been reached, the current first node of J is chosen as the target, and the steps of (1), (2), (3), and (4) are repeated until E has been reached.
(3) The visualization and interaction module. The calculation process, as well as the result data, can be used for the visualization and interaction of various terminals, including ① 2D visualization and interactions. In this visualization, the terminal is a PC, and abstract symbols (such as circles) are used to display and identify student locations and motion directions, abstract symbols (such as line segments) are used to identify the evolution and temporal and spatial distribution boundary of disasters, and 2D maps are used to identify the geometry of buildings. Users can use a keyboard or a mouse to interact with the calculation process; ② 3D visualization and interactions. In this visualization, the contents in the VGE are displayed, including three-dimensional buildings, three-dimensional student avatars and their postures, three-dimensional disaster processes, and spatiotemporal distributions. In this way, users can interact with virtual scenes and virtual processes of a VGE through keyboard and mouse input on a PC or can further interact with those in helmet-mounted VR and AR from a first-person perspective. For helmet-mounted VR, devices such as handles and data gloves can be used to interact with virtual scenes; for helmet-mounted AR, dynamic virtual processes (such as fire and crowd evacuation) can be integrated with real geographic scenes or real geographic sand tables, and interactions can be gestures and voice.
4.2.3. Results
The evacuation processes were simulated inside the multi-floor classroom building and outside on the ground. The simulated processes can be divided into the evacuation processes occurring in the classrooms, in the floor corridors, in the stairwell, and on the ground. Snapshots of the simulated process during these stages are compared with corresponding images acquired during a real drill for qualitative validation.
It was assumed that the students were studying in their classrooms; therefore, the first considered stage of the evacuation was in the classrooms. In the simulation, the evacuees began their evacuation from the locations at which they were studying. For each evacuee, the shortest route to the nearest door, either the front door (Figure 12 ②) or the rear door (Figure 12 ①), was chosen, and the evacuees followed these routes to escape from the classroom into the corridor (Figure 12 ③ and ④).
After the evacuees escaped from the classrooms through the front or rear doors, they entered the stairwell from different floors (Figure 13 ① and ②) and evacuated through the stairwell from higher levels to lower levels (Figure 13 ④) until they arrived at the ground (Figure 13 ③). When the evacuees converged in the corridor, the flow of people formed into two or three lines (Figure 13 ⑤) depending on the size and shape of the corridor. During this stage, the evacuees ran (Figure 13 ⑥) toward the nearest stairwell. In the stairwell, the evacuees walked (Figure 13 ⑧) downstairs in one or two lines (Figure 13 ⑦). At the landing of each flight, they would turn and continue their evacuation. All the patterns of evacuee flow and the motion states during the real and simulated processes were also similar.
5. Conclusions and Remarks
Urban environments are witnessing the coupling processes of natural geography and human geography while new challenges of modelling and simulation have been arisen. A comprehensive platform that integrates all-round geoscientific solutions appears to be the best option for complex urban systems simulation. VGEs provide a new type of tool for comprehensive urban modeling and simulation with advantages of dual-core data and modeling, multi-modal visualization, geographic collaboration, human-centric methods, and the improved interaction between virtual environment systems and physical environments.
Along with newly emerging technologies, VGEs will play a more profound role in urban modeling and simulation. The maturity of digital twin technology provides opportunities for building digital twin urban areas by mapping physical urban systems into the virtual urban systems and conducting interactions between real and virtual systems, which will significantly improve urban modeling and simulation. The application of the digital twin involves multiple disciplines such as architecture, engineering, finance, etc. However, in geoscience, VGE has been more than a digital twin of the physical geographic environments, because it can extensively fit well with the conceptual framework of the metaverse of geographic environments that have eight characteristics including identity, friends, immersive, low friction, variety, anywhere, economy, civility [37]. Consequently, VGE tends to be suitable to serve as a platform of digital twin urbans that supports urban modeling and simulation.
The concept of the “metaverse” emphasizes the intercommunication of human behavior in real and virtual environments. In the near future, people will live in a real urban environment as well as in a virtual urban environment, seamlessly switching between virtual and reality. This new relationship between human beings and the urban living environment can be realized by using a virtual geographic environment. VGEs emphasized a human-centered theory and built an avatar-based framework to realize the integration and communication between real people and virtual environments, and they contain a geographic reference, through which one can realize the unification of time and space with the real world and improve intercommunication between the virtual and the real.
Author Contributions
Formal analysis, H.L. and B.X.; Funding acquisition, H.L., B.X. and W.L.; Investigation, H.L., B.X., Y.C. and W.L.; Methodology, B.X., Y.C. and W.L.; Resources, L.Y. and J.H.; Software, B.X., Y.C. and W.L.; Supervision, H.L.; Writing—original draft, B.X., Y.C. and W.L.; Writing—review and editing, B.X., Y.C. and W.L. All authors have read and agreed to the published version of the manuscript.
Funding
This research was funded by the National Natural Science Foundation of China, grant numbers of 41771442, U1811464, 41971361, and 41271402); the National Key Technology R&D Program of China, grant numbers 2020YFC0833103.
Institutional Review Board Statement
Not applicable.
Informed Consent Statement
Not applicable.
Data Availability Statement
Not applicable.
Conflicts of Interest
The authors declare no conflict of interest.
References
- Aguilera, F.; Ossio, F. Residential archetypes in urban energy simulation models in Chile: Determining factors of residential energy consumption. Rev. De La Constr. 2017, 16, 527–536. [Google Scholar] [CrossRef] [Green Version]
- Wilson, N.; Fourie, C.J.; Delmistro, R. Mathematical and simulation techniques for modelling urban train networks. S. Afr. J. Ind. Eng. 2016, 27, 109–119. [Google Scholar]
- LiÉVano MartÍNez, F.; Olaya Morales, Y. Agent-Based Simulation Approach to Urban Dynamics Modeling. Dyna 2012, 79, 34–42. [Google Scholar]
- Yan, Y.; Liu, T.; Wang, N.; Yao, Y. Urban sprawl and fiscal stress: Evidence from urbanizing China. Cities 2022, 126, 103699. [Google Scholar] [CrossRef]
- Ding, W.L.; Zhu, X.J.; Xu, B.; Xu, Y.; Chen, K.; Wan, Z.X. The Interactive Modeling Method of Virtual City Scene Based on Building Codes. Ksii Trans. Internet Inf. Syst. 2021, 15, 74–89. [Google Scholar]
- Kim, S.; Kim, D.; Choi, S. CityCraft: 3D virtual city creation from a single image. Vis. Comput. 2020, 36, 911–924. [Google Scholar] [CrossRef]
- Wang, B.; Li, H.J.; Rezgui, Y.; Bradley, A.; Ong, H.N. BIM Based Virtual Environment for Fire Emergency Evacuation. Sci. World J. 2014, 589016. [Google Scholar] [CrossRef]
- Rashid, K.M.; Louis, J.; Fiawoyife, K.K. Wireless electric appliance control for smart buildings using indoor location tracking and BIM-based virtual environments. Autom. Constr. 2019, 101, 48–58. [Google Scholar] [CrossRef]
- Haq, M.A. SMOTEDNN: A Novel Model for Air Pollution Forecasting and AQI Classification. Cmc-Comput. Mater. Contin. 2022, 71, 1403–1425. [Google Scholar]
- Kobarfard, M.; Ola, R.F.; Zarghami, M.; Akbarpour, A. Evaluating the uncertainty of urban flood model using glue approach. Urban Water J. 2022, 19, 600–615. [Google Scholar] [CrossRef]
- Wu, W.H.; Li, J.H.; Yi, W.F.; Zheng, X.P. Modeling Crowd Evacuation via Behavioral Heterogeneity-Based Social Force Model. IEEE Trans. Intell. Transp. Syst. 2022. [Google Scholar] [CrossRef]
- Abel, J.R.; Gabe, T.M. Human Capital and Economic Activity in Urban America. Reg. Stud. 2011, 45, 1079–1090. [Google Scholar] [CrossRef] [Green Version]
- Wu, L.; Zhi, Y.; Sui, Z.W.; Liu, Y. Intra-Urban Human Mobility and Activity Transition: Evidence from Social Media Check-In Data. PLoS ONE 2014, 9, e97010. [Google Scholar]
- Li, R.; Tong, D.Q. Constructing human activity spaces: A new approach incorporating complex urban activity-travel. J. Transp. Geogr. 2016, 56, 23–35. [Google Scholar] [CrossRef]
- Gonzalez, A.O.O.; Navarro, A.R.; Salgado, R.M.; Nicieza, C.G.; Fernandez, M.I.A. Urban development and human activity as factors in terrain instability in Tijuana. Eng. Fail. Anal. 2012, 19, 51–62. [Google Scholar] [CrossRef]
- Szolnoki, Z.; Farsang, A.; Puskas, I. Cumulative impacts of human activities on urban garden soils: Origin and accumulation of metals. Environ. Pollut. 2013, 177, 106–115. [Google Scholar] [CrossRef]
- Wandersee, S.M.; An, L.; Lopez-Carr, D.; Yang, Y.Q. Perception and decisions in modeling coupled human and natural systems: A case study from Fanjingshan National Nature Reserve, China. Ecol. Model. 2012, 229, 37–49. [Google Scholar] [CrossRef]
- Liu, H.M.; Fang, C.L.; Fang, K. Coupled Human and Natural Cube: A novel framework for analyzing the multiple interactions between humans and nature. J. Geogr. Sci. 2020, 30, 355–377. [Google Scholar] [CrossRef]
- Wu, C.F.; Chen, S.H.; Cheng, C.W.; Trac, L.V. Climate Justice Planning in Global South: Applying a Coupled Nature-Human Flood Risk Assessment Framework in a Case for Ho Chi Minh City, Vietnam. Water 2021, 13, 2021. [Google Scholar] [CrossRef]
- Wei, C.Y.; Jing, C.F.; Wang, S.Q.; Li, D.L. Urban Flood Visualization Framework Based on Spatial Grid. Sens. Mater. 2021, 33, 4579–4593. [Google Scholar] [CrossRef]
- Berger, M.; Bill, R. Combining VR Visualization and Sonification for Immersive Exploration of Urban Noise Standards. Multimodal Technol. Interact. 2019, 3, 34. [Google Scholar] [CrossRef] [Green Version]
- Zhi, G.Z.; Liao, Z.L.; Tian, W.C.; Wang, X.; Chen, J.X. A 3D dynamic visualization method coupled with an urban drainage model. J. Hydrol. 2019, 577, 123988. [Google Scholar] [CrossRef]
- Verster, B. Reimagining collaboration in urban planning through a social practice lens: Towards a conceptual framework. Town Reg. Plan. 2020, 76, 86–96. [Google Scholar] [CrossRef]
- Conti, D.d.M.; Guevara, A.J.d.H.; Heinrichs, H.; Silva, L.F.d.; Quaresma, C.C.; Beté, T.d.S. Collaborative governance towards cities sustainability transition. Urbe. Rev. Bras. De Gestão Urbana 2019, 11, e20190046. [Google Scholar] [CrossRef] [Green Version]
- Mariano, D.J.K.; Alves, C.d.M.A. The application of role-playing games and agent-based modelling to the collaborative water management in peri-urban communities. RBRH 2020, 25, e25. [Google Scholar] [CrossRef]
- Deren, L.; Wenbo, Y.; Zhenfeng, S. Smart city based on digital twins. Comput. Urban Sci. 2021, 1, 11. [Google Scholar] [CrossRef]
- Dembski, F.; Woessner, U.; Letzgus, M.; Ruddat, M.; Yamu, C. Urban Digital Twins for Smart Cities and Citizens: The Case Study of Herrenberg, Germany. Sustainability 2020, 12, 2307. [Google Scholar] [CrossRef] [Green Version]
- Schrotter, G.; Huerzeler, C. The Digital Twin of the City of Zurich for Urban Planning. Pfg-J. Photogramm. Remote Sens. Geoinf. Sci. 2020, 88, 99–112. [Google Scholar] [CrossRef] [Green Version]
- Bujari, A.; Calvio, A.; Foschini, L.; Sabbioni, A.; Corradi, A. A Digital Twin Decision Support System for the Urban Facility Management Process. Sensors 2021, 21, 8460. [Google Scholar] [CrossRef]
- Batty, M. Virtual geography. Futures 1997, 29, 337–352. [Google Scholar] [CrossRef]
- Jianhua, G.; Hui, L. Virtual Geographic Environments—Geographic Perspective of Online Virtual Reality; High Education Press: Beijing, China, 2001. [Google Scholar]
- Jia, F.L.; You, X.; Tian, J.P.; Song, G.M.; Xia, Q. Formal language for the Virtual Geographic Environment. Environ. Earth Sci. 2015, 74, 6981–7002. [Google Scholar] [CrossRef]
- Bingli, X.; Hui, L.; Chiu, L.; Hu, Y.; Zhu, J.; Hu, M.; Cui, W. Collaborative virtual geographic environments: A case study of air pollution simulation. Inf. Sci. 2011, 181, 2231–2246. [Google Scholar]
- Lin, H.; Hu, M.; Chen, M.; Zhang, F.; You, L.; Chen, Y. Cognitive Transformation from Geographic Information System to Virtual Geographic Environments. J. Geo-Inf. Sci. 2020, 22, 662–672. [Google Scholar]
- Lin, H.; Chen, M.; Lu, G. Virtual geographic environment: A workspace for computer-aided geographic experiments. Ann. Assoc. Am. Geogr. 2013, 103, 465–482. [Google Scholar] [CrossRef]
- You, L.; Lin, H. A Conceptual Framework For Virtual Geographic Environments Knowledge Engineering. In Proceedings of the 23rd Congress of the International-Society-for-Photogrammetry-and-Remote-Sensing (ISPRS), Prague, Czech Republic, 12–19 July 2016; pp. 357–360. [Google Scholar]
- Lin, H.; Xu, B.; Chen, Y.; Jing, Q.; You, L. The Virtual Geographic Environments: More Than the Digital Twin of the Physical Geographical Environments. In New Thinking in GIS; Higher Education Press: Beijing, China, 2022. [Google Scholar]
- Xu, B.; Lin, H.; Chiu, L.; Tang, S.; Cheung, J.; Hu, Y.; Zeng, L. VGE-CUGrid: An integrated platform for efficient configuration, computation, and visualization of MM5. Environ. Model. Softw. 2010, 25, 1894–1896. [Google Scholar] [CrossRef]
- Zhang, F.; Hu, M.; Che, W.; Lin, H.; Fang, C. Framework for Virtual Cognitive Experiment in Virtual Geographic Environments. ISPRS Int. J. Geo-Inf. 2018, 7, 36. [Google Scholar] [CrossRef] [Green Version]
- Huang, L.; Gong, J.; Li, W.; Xu, T.; Shen, S.; Liang, J.; Feng, Q.; Zhang, D.; Sun, J. Social Force Model-Based Group Behavior Simulation in Virtual Geographic Environments. ISPRS Int. J. Geo-Inf. 2018, 7, 79. [Google Scholar] [CrossRef] [Green Version]
- Rink, K.; Chen, C.; Bilke, L.; Liao, Z.L.; Rinke, K.; Frassl, M.; Yue, T.X.; Kolditz, O. Virtual geographic environments for water pollution control. Int. J. Digit. Earth 2018, 11, 397–407. [Google Scholar] [CrossRef]
- Gu, S.W.; Fang, C.Y.; Wang, Y.Q. Virtual Geographic Environment for WATLAC Hydrological Model Integration. In Proceedings of the IEEE 25th International Conference on Geoinformatics, Buffalo, NY, USA, 2–4 August 2017. [Google Scholar]
- Wang, W.H.; Xu, S.; Gong, J.H. Virtual geographic environment based intelligent simulation of SARS diffusion. In Proceedings of the International Conference on Management Science and Engineering, Sydney, Australia, 15–25 October 2005; pp. 682–686. [Google Scholar]
- Tang, L.Y.; Peng, X.M.; Chen, C.C.; Huang, H.Y.; Lin, D. Three-dimensional Forest growth simulation in virtual geographic environments. Earth Sci. Inform. 2019, 12, 31–41. [Google Scholar] [CrossRef]
- Yin, L.Z.; Zhu, J.; Li, Y.; Zeng, C.; Zhu, Q.; Qi, H.; Liu, M.W.; Li, W.; Cao, Z.Y.; Yang, W.J.; et al. A Virtual Geographic Environment for Debris Flow Risk Analysis in Residential Areas. ISPRS Int. J. Geo-Inf. 2017, 6, 377. [Google Scholar] [CrossRef] [Green Version]
- Wang, Z.Z.; Fang, C.Y.; Wang, Y.Q. Design of Aquatic Ecological Security Evaluation System Based on Virtual Geographic Environment. In Proceedings of the 7th International Conference on Manufacturing Science and Engineering (ICMSE), Zhuhai, China, 11–12 March 2017; pp. 51–54. [Google Scholar]
- Li, Y.H.; Xu, Z.J.; Zhang, J.Q.; Zhao, M. An Urban Traffic Decision Analysis Platform Based On Virtual Geographic Environments (VGEs). In Proceedings of the IEEE 5th International Conference on Information Science, Computer Technology and Transportation (ISCTT), Shenyang, China, 13–15 November 2020; pp. 540–543. [Google Scholar]
- Zhu, J.; Yin, L.; Wang, J.; Zhang, H.; Hu, Y.; Liu, Z. Dam-Break Flood Routing Simulation and Scale Effect Analysis Based on Virtual Geographic Environment. IEEE J. Sel. Top. Appl. Earth Obs. Remote Sens. 2015, 8, 105–113. [Google Scholar] [CrossRef]
- Avagyan, A.; Manandyan, H.; Arakelyan, A.; Piloyan, A. Toward a disaster risk assessment and mapping in the virtual geographic environment of Armenia. Nat. Hazards 2018, 92, 283–309. [Google Scholar] [CrossRef]
- Ning, X.W.; Zhu, Q.; Zhang, H.; Wang, C.J.; Han, Z.J.; Zhang, J.X.; Zhao, W. Dynamic Simulation Method of High-Speed Railway Engineering Construction Processes Based on Virtual Geographic Environment. ISPRS Int. J. Geo-Inf. 2020, 9, 292. [Google Scholar] [CrossRef]
- Winde, F.; Hoffmann, E.; Espina, C.; Schuz, J. Mapping and modelling human exposure to uraniferous mine waste using a GIS-supported virtual geographic environment. J. Geochem. Explor. 2019, 204, 167–180. [Google Scholar] [CrossRef]
- Silva, D.S.E.; Fook, K.D.; dos Santos, A.L.S.; Borges, E.P.; Bezerra, D.D.S.; Conceicao, D.V. 3D Visualization and Simulation Module based on Virtual Geographic Environments for Sea Level Rise on Ponta da Areia Beach—Sao Luis, Maranhao, Brazil. In Proceedings of the 9th International Conference on Advanced Geographic Information Systems, Applications, and Services (GEOProcessing), Nice, France, 19–23 March 2017; pp. 81–84. [Google Scholar]
- Chen, M.; Lin, H.; Lu, G. Virtual geographic environments. In International Encyclopedia of Geography: People, the Earth, Environment and Technology: People, the Earth, Environment and Technology; Wiley: Hoboken, NJ, USA, 2016; pp. 1–11. [Google Scholar]
- Lin, H.; Chen, M.; Lu, G.; Zhu, Q.; Gong, J.; You, X.; Wen, Y.; Xu, B.; Hu, M. Virtual geographic environments (VGEs): A new generation of geographic analysis tool. Earth-Sci. Rev. 2013, 126, 74–84. [Google Scholar] [CrossRef] [Green Version]
- Lin, H.; Gong, J. Exploring virtual geographic environments. Geogr. Inf. Sci. 2001, 7, 1–7. [Google Scholar] [CrossRef]
- Wan, G.; Lin, H.; Zhu, Q.; Liu, Y. Virtual Geographical Environment. In Advances in Cartography and Geographic Information Engineering; Springer: Berlin/Heidelberg, Germany, 2021; pp. 443–477. [Google Scholar]
- Lü, G. Geographic analysis-oriented virtual geographic environment: Framework, structure and functions. Sci. China Earth Sci. 2011, 54, 733–743. [Google Scholar] [CrossRef]
- Chen, M.; Lin, H.; Kolditz, O.; Chen, C. Developing Dynamic Virtual Geographic Environments (VGEs) for Geographic Research; Springer: Berlin/Heidelberg, Germany, 2015; Volume 74, pp. 6975–6980. [Google Scholar]
- Lü, G.; Yu, Z.; Zhou, L.; Wu, M.; Sheng, Y.; Yuan, L. Data environment construction for virtual geographic environment. Environ. Earth Sci. 2015, 74, 7003–7013. [Google Scholar] [CrossRef]
- Yuan, L.; Lü, G.; Luo, W.; Yu, Z.; Yi, L.; Sheng, Y. Geometric algebra method for multidimensionally-unified GIS computation. Chin. Sci. Bull. 2012, 57, 802–811. [Google Scholar] [CrossRef] [Green Version]
- Goodchild, M.F.; Glennon, A. Representation and computation of geographic dynamics. In Understanding Dynamics of Geographic Domains; CRC Press: Boca Raton, FL, USA, 2008; pp. 31–48. [Google Scholar]
- Yuan, M.; Miller, H.; Han, J. Knowledge discovery of geographic dynamics in spatiotemporal data. In Geographic Data Mining and Knowledge Discovery, 2nd ed.; CRC Press: Boca Raton, FL, USA, 2009; pp. 347–366. [Google Scholar]
- Napieralski, J.; Harbor, J.; Li, Y. Glacial geomorphology and geographic information systems. Earth-Sci. Rev. 2007, 85, 1–22. [Google Scholar] [CrossRef]
- Chen, Y.; Lin, H.; Xiao, L.; Jing, Q.; You, L.; Ding, Y.; Hu, M.; Devlin, A.T. Versioned geoscientific workflow for the collaborative geo-simulation of human-nature interactions—A case study of global change and human activities. Int. J. Digit. Earth 2021, 14, 510–539. [Google Scholar] [CrossRef]
- MacEachren, A.M. Cartography and GIS: Extending collaborative tools to support virtual teams. Prog. Hum. Geogr. 2001, 25, 431–444. [Google Scholar] [CrossRef] [Green Version]
- Jiang, B.; Tan, L.; Ren, Y.; Li, F. Intelligent interaction with virtual geographical environments based on geographic knowledge graph. ISPRS Int. J. Geo-Inf. 2019, 8, 428. [Google Scholar] [CrossRef] [Green Version]
- Chen, M.; Lin, H. Virtual Geographic Environments (VGEs): Originating from or beyond Virtual Reality (VR)? Taylor & Francis: Abingdon, UK, 2018; Volume 11, pp. 329–333. [Google Scholar]
- Lin, H.; Batty, M. Virtual geographic environments: A primer. In Virtual Geographic Environments; Science Press: Beijing, China, 2009; pp. 1–10. [Google Scholar]
- Kelly, R.A.; Jakeman, A.J.; Barreteau, O.; Borsuk, M.E.; ElSawah, S.; Hamilton, S.H.; Henriksen, H.J.; Kuikka, S.; Maier, H.R.; Rizzoli, A.E. Selecting among five common modelling approaches for integrated environmental assessment and management. Environ. Model. Softw. 2013, 47, 159–181. [Google Scholar] [CrossRef]
- Li, W.; Li, Y.; Yu, P.; Gong, J.; Shen, S.; Huang, L.; Liang, J. Modeling, simulation and analysis of the evacuation process on stairs in a multi-floor classroom building of a primary school. Phys. A Stat. Mech. Its Appl. 2017, 469, 157–172. [Google Scholar] [CrossRef]
Figure 1.
The core framework of the data and model environments in VGEs.

Figure 2.
Framework of human activities modeling in VGEs.

Figure 3.
The framework of multi-type representations of VGEs.

Figure 4.
Framework of geo-collaboration.

Figure 5.
The overall framework of VGE-based urban system modeling and simulation.

Figure 6.
The architecture of VGE-APCMSS.

Figure 7.
Collaborative air pollution dispersion simulation in PRD with VGE-APCMSS.

Figure 8.
Two types of interfaces for collaborative simulation ((A) shows air pollution dispersion visualization in 2D environment; (B) shows air pollution dispersion in 3D environment).
Figure 8.
Two types of interfaces for collaborative simulation ((A) shows air pollution dispersion visualization in 2D environment; (B) shows air pollution dispersion in 3D environment).

Figure 9.
Collaborative analysis in a virtual geographic environment ((A) shows collaborative analysis on pollution profiles; (B) shows collaborative analysis on pollution components at points).
Figure 9.
Collaborative analysis in a virtual geographic environment ((A) shows collaborative analysis on pollution profiles; (B) shows collaborative analysis on pollution components at points).

Figure 10.
The layout of the case-study school. (a) real picture of the 3-floor building; (b) a plan view of a classroom; (c) A plan view of the school.
Figure 10.
The layout of the case-study school. (a) real picture of the 3-floor building; (b) a plan view of a classroom; (c) A plan view of the school.

Figure 11.
The architecture of VGE based evacuation modeling and simulation system for the school.

Figure 12.
Simulated evacuation from a classroom. (a) Time a; (b) Time b; ①moving to the front door; ② moving to the rear door; ③ evacuating from the front door; ④ evacuating from the rear door.
Figure 12.
Simulated evacuation from a classroom. (a) Time a; (b) Time b; ①moving to the front door; ② moving to the rear door; ③ evacuating from the front door; ④ evacuating from the rear door.

Figure 13.
Snapshots of simulated evacuations and real drills. (a) The overall simulated evacuation process; (b) evacuating through a floor corridor in the real drill; (c) evacuating through a floor corridor in the simulation; (d) walking downstairs in the real drill; (e) walking downstairs in the simulation; ① evacuees from the 3rd floor; ② evacuees from the 2nd floor; ③ evacuees arrived at the ground; ④ evacuating through the stairwell; ⑤ evacuees con-verged in the corridor; ⑥ evacuees ran toward the nearest stairwell; ⑦ evacuees evacuated in one or two lines; ⑧ evacuees walked downstairs;.

Figure 14.
VGE-based display and interactions on helmeted VR devices.

Figure 15.
VGE-based display and interactions on a 3D-printed teaching building. (a) the real scene of a 3D printed building; (b) the scene augmented with virtual crowd and disaster process.
Figure 15.
VGE-based display and interactions on a 3D-printed teaching building. (a) the real scene of a 3D printed building; (b) the scene augmented with virtual crowd and disaster process.

Publisher’s Note: MDPI stays neutral with regard to jurisdictional claims in published maps and institutional affiliations. |
© 2022 by the authors. Licensee MDPI, Basel, Switzerland. This article is an open access article distributed under the terms and conditions of the Creative Commons Attribution (CC BY) license (https://creativecommons.org/licenses/by/4.0/).
Share and Cite
MDPI and ACS Style
Lin, H.; Xu, B.; Chen, Y.; Li, W.; You, L.; He, J. VGEs as a New Platform for Urban Modeling and Simulation. Sustainability 2022, 14, 7980. https://doi.org/10.3390/su14137980
AMA Style
Lin H, Xu B, Chen Y, Li W, You L, He J. VGEs as a New Platform for Urban Modeling and Simulation. Sustainability. 2022; 14(13):7980. https://doi.org/10.3390/su14137980
Chicago/Turabian StyleLin, Hui, Bingli Xu, Yuting Chen, Wenhang Li, Lan You, and Jie He. 2022. "VGEs as a New Platform for Urban Modeling and Simulation" Sustainability 14, no. 13: 7980. https://doi.org/10.3390/su14137980
Note that from the first issue of 2016, this journal uses article numbers instead of page numbers. See further details here.