
The Impact of Environmental Information Disclosure on Environmental Governance Satisfaction


1
School of Economics and Management, Zhejiang Sci-Tech University, Hangzhou 310018, China
2
Silk and Fashion Culture Research Center of Zhejiang Province, Zhejiang Sci-Tech University, Hangzhou 310018, China
3
School of Economics and Management, Zhejiang A&F University, Hangzhou 310018, China
4
Fashion Department, DongHai Academy, Collaborative Innovation Center of Port Economy, Ningbo University, Ningbo 315211, China
*
Authors to whom correspondence should be addressed.
Sustainability 2022, 14(13), 7888; https://doi.org/10.3390/su14137888
Submission received: 10 May 2022
/
Revised: 24 June 2022
/
Accepted: 26 June 2022
/
Published: 28 June 2022
Abstract
:Recently, environmental information disclosure has increasingly become a popular rural environmental governance policy. Environmental governance satisfaction can reflect the government’s policy effect, and it is also residents’ subjective evaluation of environmental quality. This paper uses field questionnaire data in rural areas and establishes an ordered logit model to study the relationship between environmental information disclosure and residents’ satisfaction. The empirical results show that rural environmental information disclosure has a significant positive impact on residents’ satisfaction with environmental governance. Further research found that the impact process occurred through the mediating variable of residents’ evaluation of the surrounding ecological environment. In addition, residents’ knowledge of environmental protection has a moderating effect on the relationship between environmental information disclosure and satisfaction. Therefore, in rural environmental governance, local governments can increase environmental information disclosure to improve residents’ satisfaction and participation.
1. Introduction
With the rapid development of economy, environmental problems are becoming increasingly complex. Governments actively call for environmental protection and improve their environmental governance tools through innovation. With the advancement of technology and the establishment of transparent rules, information disclosure has gradually become an environmental governance policy welcomed by the government. At present, more than 60 countries and regions worldwide have established government information disclosure systems [1]. China’s environmental governance system is also evolving. Combined with China’s development status, the three aspects of agriculture, rural areas and rural residents [2] have always affected China’s economic development and people’s lives. China has vigorously carried out rural construction projects [3] and environmental improvement in recent years. Local governments have creatively put forward governance goals related to industrial prosperity, ecological livability, a civilization, effective governance and affluent lives. Information disclosure has become the key to promoting environmental management and better development in rural areas.
The theoretical research on environmental information disclosure has made significant progress. As a new environmental governance tool, government environmental information disclosure is important for establishing government transparency. Improving government transparency or information disclosure can effectively improve environmental governance performance [4,5]. In environmental governance, the government is the main body of information disclosure and faces public supervision. The government needs to provide broader and higher standards of environmental information disclosure to optimize environmental policies and ecological governance systems. In promoting the construction of new countryside, it is of great theoretical significance to study rural environmental governance and information disclosure [6,7]. Governments at all levels of the country attach great importance to the power of the rural environment, and actively carry out the management of rural environment. In this process, resident satisfaction has become an important indicator to measure the performance of government governance [8,9]. Rural residents’ satisfaction with environmental governance is a result of their actual life experience, which can reflect their satisfaction with their need for good environmental management. In general, striving to improve the satisfaction of rural residents in environmental management has become an important task in promoting the development of rural areas. However, there is still a lack of systematic research on the impact of government environmental information disclosure on residents’ satisfaction in rural areas.
To make up for the insufficiency of existing research, this paper takes rural residents as the research object to explore the relationship between environmental information disclosure and residents’ satisfaction. During the research process, an ordered logit model was established for estimation. This paper further studies the mediating effect of residents’ evaluation of ecological environment on information disclosure and satisfaction. At the same time, the residents’ environmental protection knowledge is used as a moderator variable to explore. The contribution of this paper is that the research ideas and methods are based on rural reality and have firm policy and practical significance for rural areas. At the same time, the research adopts the provincial survey data of China in 2021 and conducts the corresponding robustness test and heterogeneity analysis. It enhances the credibility and timeliness of research findings and complements existing relevant research.
The rest of this paper is organized as follows. Section 2 analyzes the existing research on environmental information disclosure and environmental governance satisfaction and puts forward the research hypothesis of this paper. Section 3 points out the source of the survey data, the design of the variables and the empirical analysis model. Section 4 presents and analyzes specific empirical results. Section 5 presents the research conclusions and puts forward corresponding policy implications.
2. Literature Review and Hypotheses
2.1. Environmental Information Disclosure
There is a certain relationship between government environmental governance and the choice of environmental policy tools. Research on environmental governance policies plays a vital role in the government’s future environmental management [10]. In the past decade, China has made great strides in environmental information disclosure [11]. For government departments, environmental information disclosure is an essential means to improve environmental management [12]. The public can supervise the government’s use of environmental resources and improve the government’s environmental governance efficiency [13]. From the perspective of the public, the disclosure of environmental information strengthens the connection between the government and the public on environmental governance, which is conducive to expanding participation in environmental governance.
In the process of rural environmental governance, government environmental information disclosure plays an important role. Some scholars have used empirical evidence to prove that the disclosure of government environmental information reflects local environmental performance and improves the effectiveness of government environmental governance decisions [14,15]. When specific to a particular environmental field, some scholars found that information disclosure effectively reduces the concealment and underreporting of air pollution by innovatively examining the impact of environmental information disclosure on government air pollution control [16,17]. Therefore, establishing the environmental information disclosure system effectively improves the effect of environmental governance by increasing the government’s environmental protection expenditure and expanding investment in infrastructure. Diamastuti, E et al. emphasized government responsibility in rural environmental governance [18]. As a significant part of the government’s environmental governance policy, environmental information disclosure helps rural residents understand the environmental conditions in the area where they live, protects their environmental rights and improves their enthusiasm and initiative for rural environmental protection.
In addition, public participation is an integral part of a modern environmental governance system. Public participation is also closely related to government environmental information disclosure [19]. The government takes environmental information disclosure as its leading role and has established a widely supervised public opinion network. Past practice was long characterized by the pattern of “government initiative, enterprise passiveness, and public immobility”. That is, there is a lack of government supervision and a lack of corporate responsibility in environmental governance [20]. This environmental governance model has achieved sound governance effects in the short term. However, due to the lack of adequate public participation [21], there continue to be some problems in environmental governance. For example, there are still problems with transparency and public participation principles [22]. Through empirical research, some scholars have found that, if public participation is incorporated into the government environmental governance system, it can effectively improve the quality of governance and the level of the environment [23,24,25]. Therefore, the disclosure of government environmental information greatly influences the participation of local and even other regional residents in environmental governance and further promotes the public’s participation in environmental management by enhancing residents’ trust in the government and their environmental awareness.
2.2. Environmental Governance Satisfaction
China’s rural environmental governance has achieved specific results. However, due to the complexity of rural ecological and environmental problems, relying only on the government’s governance model does not meet environmental governance needs in rural areas. Improving the living environment requires the leadership and involvement of local government and enterprises, residents, communities, NGOs and other stakeholders to perform their responsibilities to build a “multiple governance” landscape [26,27,28]. As the direct beneficiaries of rural environmental governance, rural residents play an important role through their satisfaction with the effect of the local government’s environmental governance effects. Rural residents are the main body of constructing the rural living environment and the leading force building attractive, environmentally sound villages. A government-led model with extensive participation of rural residents can be established by improving rural living environments. Through research on participatory environmental management in rural China, Xie Lei found that residents’ involvement in environmental governance is beneficial to government agencies [29]. Therefore, research on rural residents’ environmental governance satisfaction plays a significant role in the ecological environment governance system.
In rural areas, residents’ satisfaction with rural ecological environment governance is based on certain environmental information and comes from all aspects of production and life. Environmental issues and environmental disclosures affect residents’ life satisfaction or subjective well-being [30,31]. For example, air quality and rural greening all play a significant part in the living environment of residents; that is, clean and fresh air quality, good rural greening and maintenance will directly affect rural residents’ satisfaction with the improvement of the living environment [32]. Of course, environmental pollution in rural areas also reduces residents’ well-being and satisfaction [33]. Yi Wang et al. used structural equation modeling to examine the effects of environmental governance in 12 underdeveloped counties and towns in eastern China from the perspective of rural livability and residents’ satisfaction [34]. Therefore, in rural environmental governance, residents’ environmental satisfaction has become an essential indicator for evaluating the environmental governance performance of grassroots local governments.
In promoting the improvement of the national environmental governance system, public participation has increasingly become a key element. With improved public participation awareness, the public’s satisfaction with environmental governance has become a valuable part of evaluating the government’s ecological environmental governance. Greenstone and Hanna pointed out that strong public support can make environmental regulations successful, even in weak institutional settings [35]. The effectiveness of the public participation process and results will significantly improve their satisfaction with environmental governance and the government’s environmental governance effect [36]. Jae-hyuck Lee et al. studied the environmental impact assessment of residents in the process of public participation [37]. By analyzing the government’s environmental measures, Zhu DM found that residents’ environmental impact assessments can influence public participation [38]. At the same time, some scholars have shown that the public’s recognition of the environment plays a vital role in their evaluation of the government [39]. Therefore, the improvement of public participation in environmental governance awareness and behavior helps to promote the optimization of the government’s environmental governance work, thereby enhancing residents’ satisfaction with environmental governance.
2.3. Environmental Information Disclosure and Environmental Governance Satisfaction
Some scholars have researched the impact of government environmental regulation and environmental information transparency on residents’ satisfaction with environmental governance. For example, Meng-Meng Geng et al. found that environmental regulation has a significant positive impact on residents’ satisfaction with environmental governance [40]. The positive relationship between environmental regulation and satisfaction with environmental governance is affected when the public’s environmental awareness is further considered. Chen Jiusong et al. also confirmed that environmental information disclosure has a significant positive impact on residents’ well-being, and this impact depends on the credibility of information [41]. It can be seen from this that the government increases the transparency of environmental information in rural areas, realizes the timeliness and transparency of information, provides a platform for rural residents to understand and participate in environmental governance, and has a specific positive impact on the improvement of residents’ satisfaction with environmental governance. Therefore, exploring the effects of government environmental information disclosure on residents’ satisfaction with environmental governance has become an important direction in current economic research.
However, there is not enough empirical research on the relationship between environmental information disclosure and residents’ satisfaction with environmental governance. The research scope is mainly concentrated in the whole country or a particular city, and research on rural areas is relatively lacking. For example, based on the data of the 2015 China Social Comprehensive Survey (CGSS2015), Zhang, Y et al. demonstrated that the transparency of government environmental information has a significant positive impact on satisfaction with environmental governance [42]. There are few studies on rural areas, and the relationship between environmental information disclosure and residents’ satisfaction with environmental governance in rural areas has not been systematically analyzed. Because of the deficiencies of existing research, this paper explores the impact of government environmental information disclosure on residents’ satisfaction in rural areas against the backdrop of the Rural Revitalization Strategy from a practical perspective.
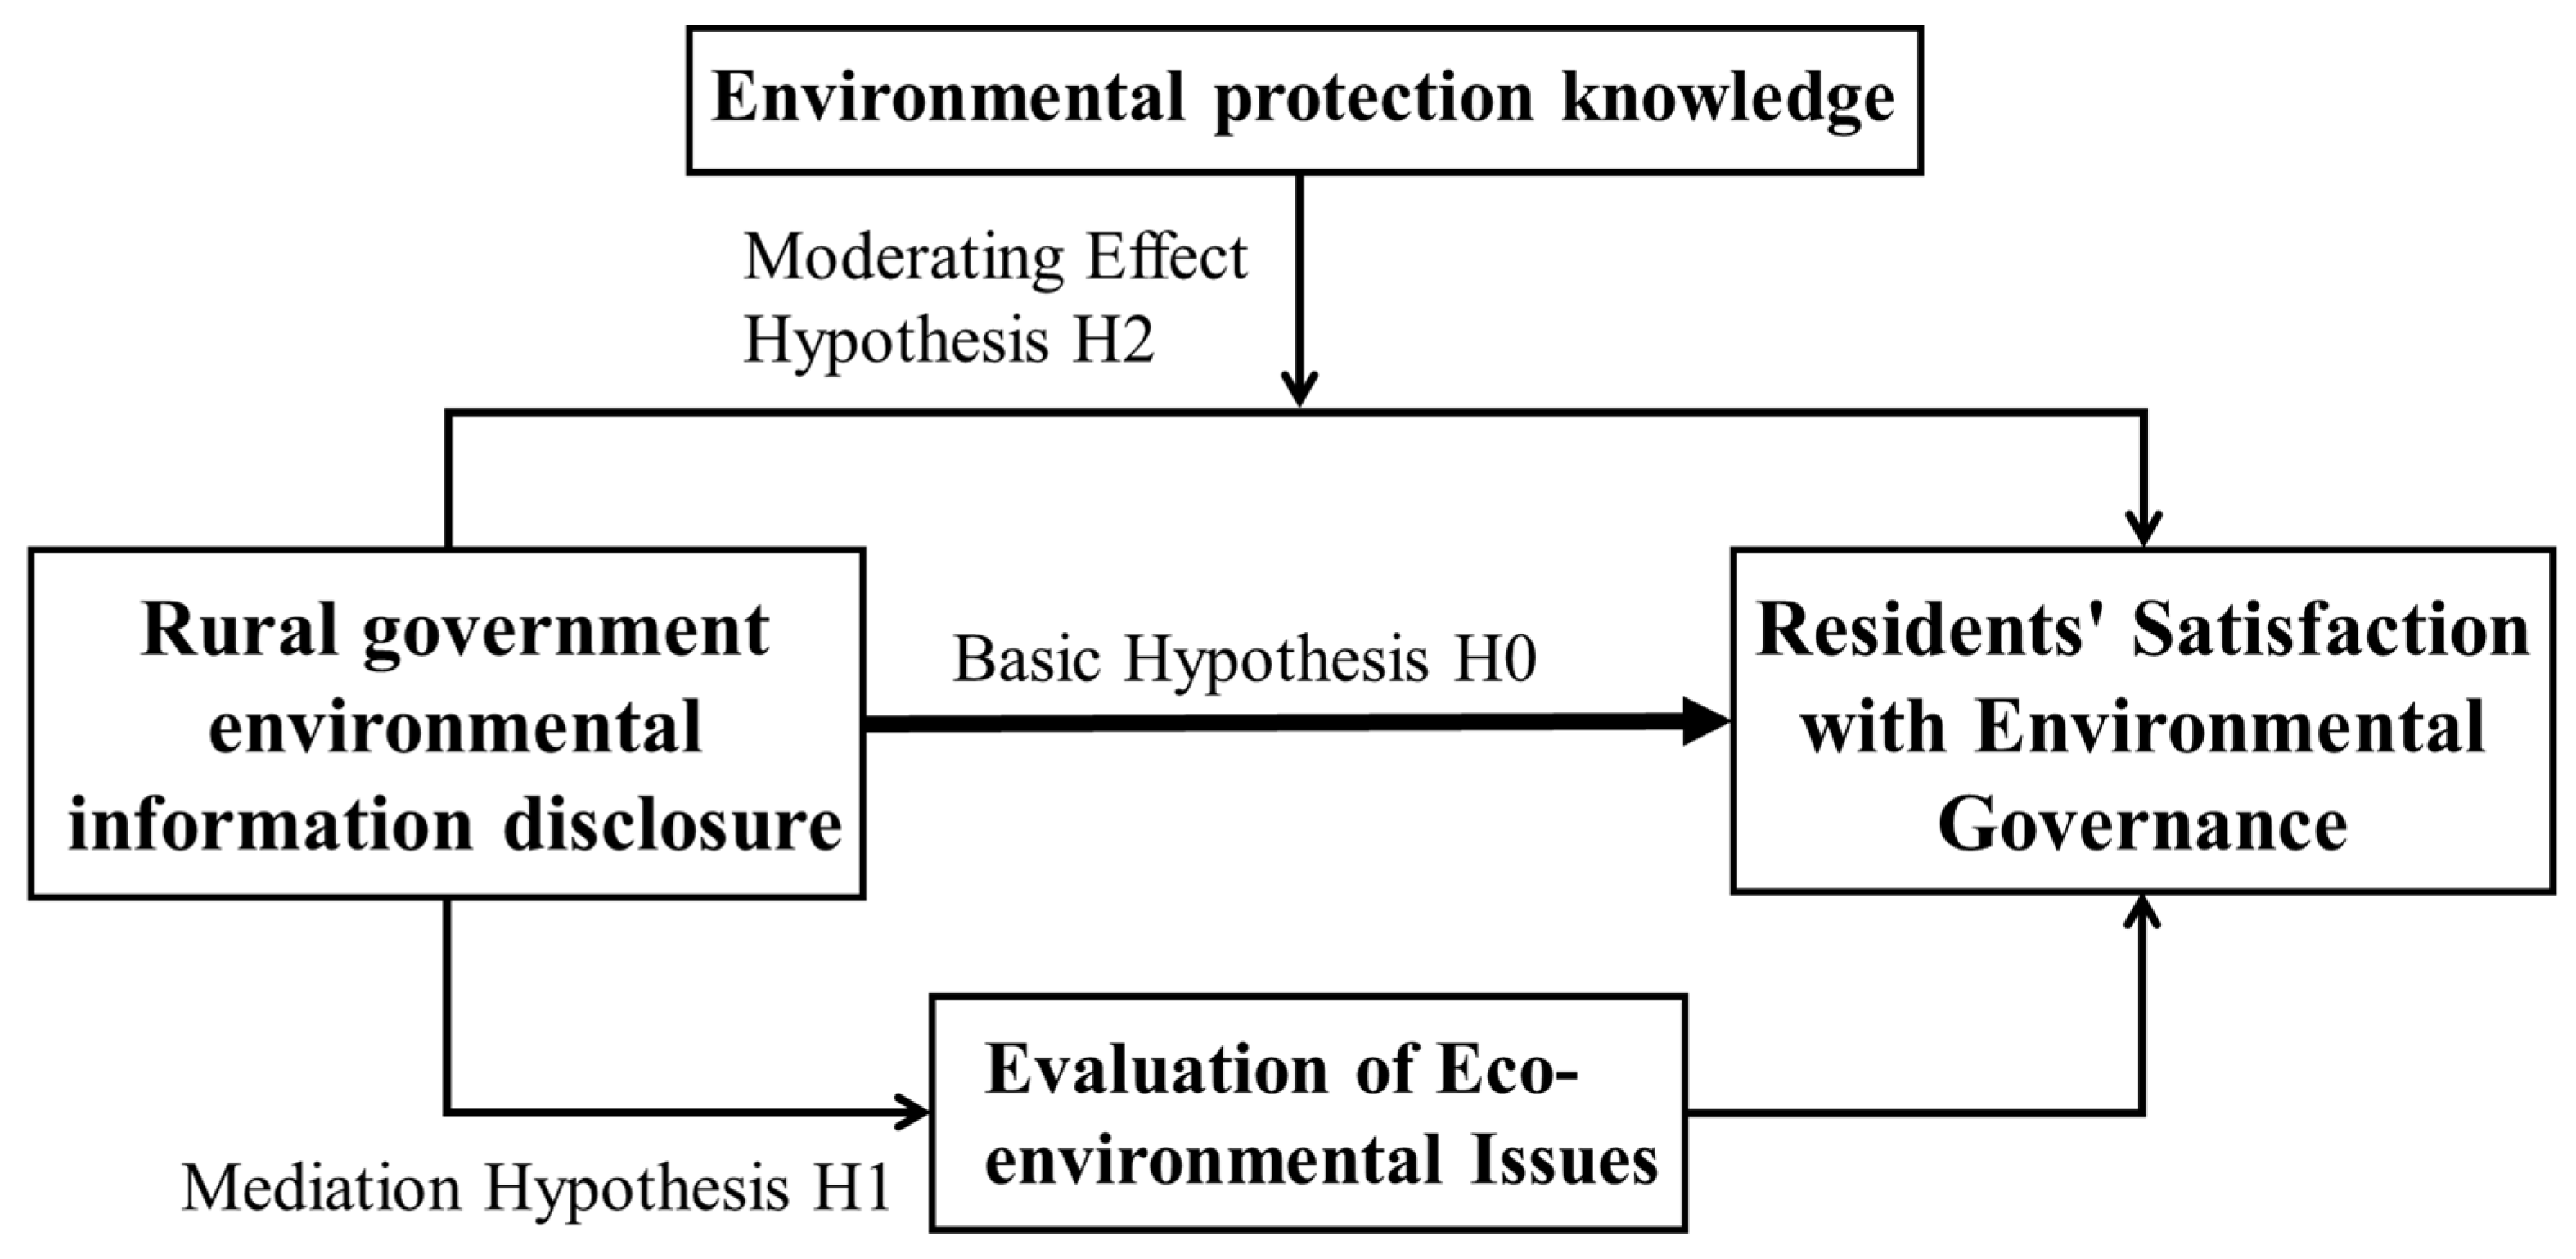
Based on the above literature review, environmental governance satisfaction is an objective indicator that reflects the degree of government information disclosure. The greater the degree of government environmental information disclosure, the greater the understanding of rural residents on environmental policies. As a result, residents may show higher levels of satisfaction. At the same time, public participation plays an important role in the disclosure of government environmental information. Residents’ evaluation of environmental issues is a form of public participation in environmental governance. It is possible to study further the mediating role of residents’ evaluation of surrounding ecological and environmental problems in the relationship between environmental information disclosure and satisfaction. In addition, the residents’ environmental awareness was used as a moderating variable. It can study the influence of residents’ own environmental protection knowledge differences on the relationship between environmental information disclosure and satisfaction. The theoretical framework of this paper is shown in Figure 1. In summary, this paper proposes the following hypotheses:
Hypothesis 0 (H0).
Rural government environmental information disclosure has a significant positive impact on residents’ satisfaction with environmental governance.
Hypothesis 1 (H1).
The evaluation by residents in rural areas of surrounding ecological and environmental issues plays a mediating role in the impact of government environmental information disclosure on residents’ satisfaction with environmental governance.
Hypothesis 2 (H2).
The environmental protection knowledge of residents in rural areas has a moderating effect on the relationship between government environmental information disclosure and residents’ satisfaction with environmental governance.
3. Data, Variables, and Models
3.1. Questionnaire Design and Data Sources
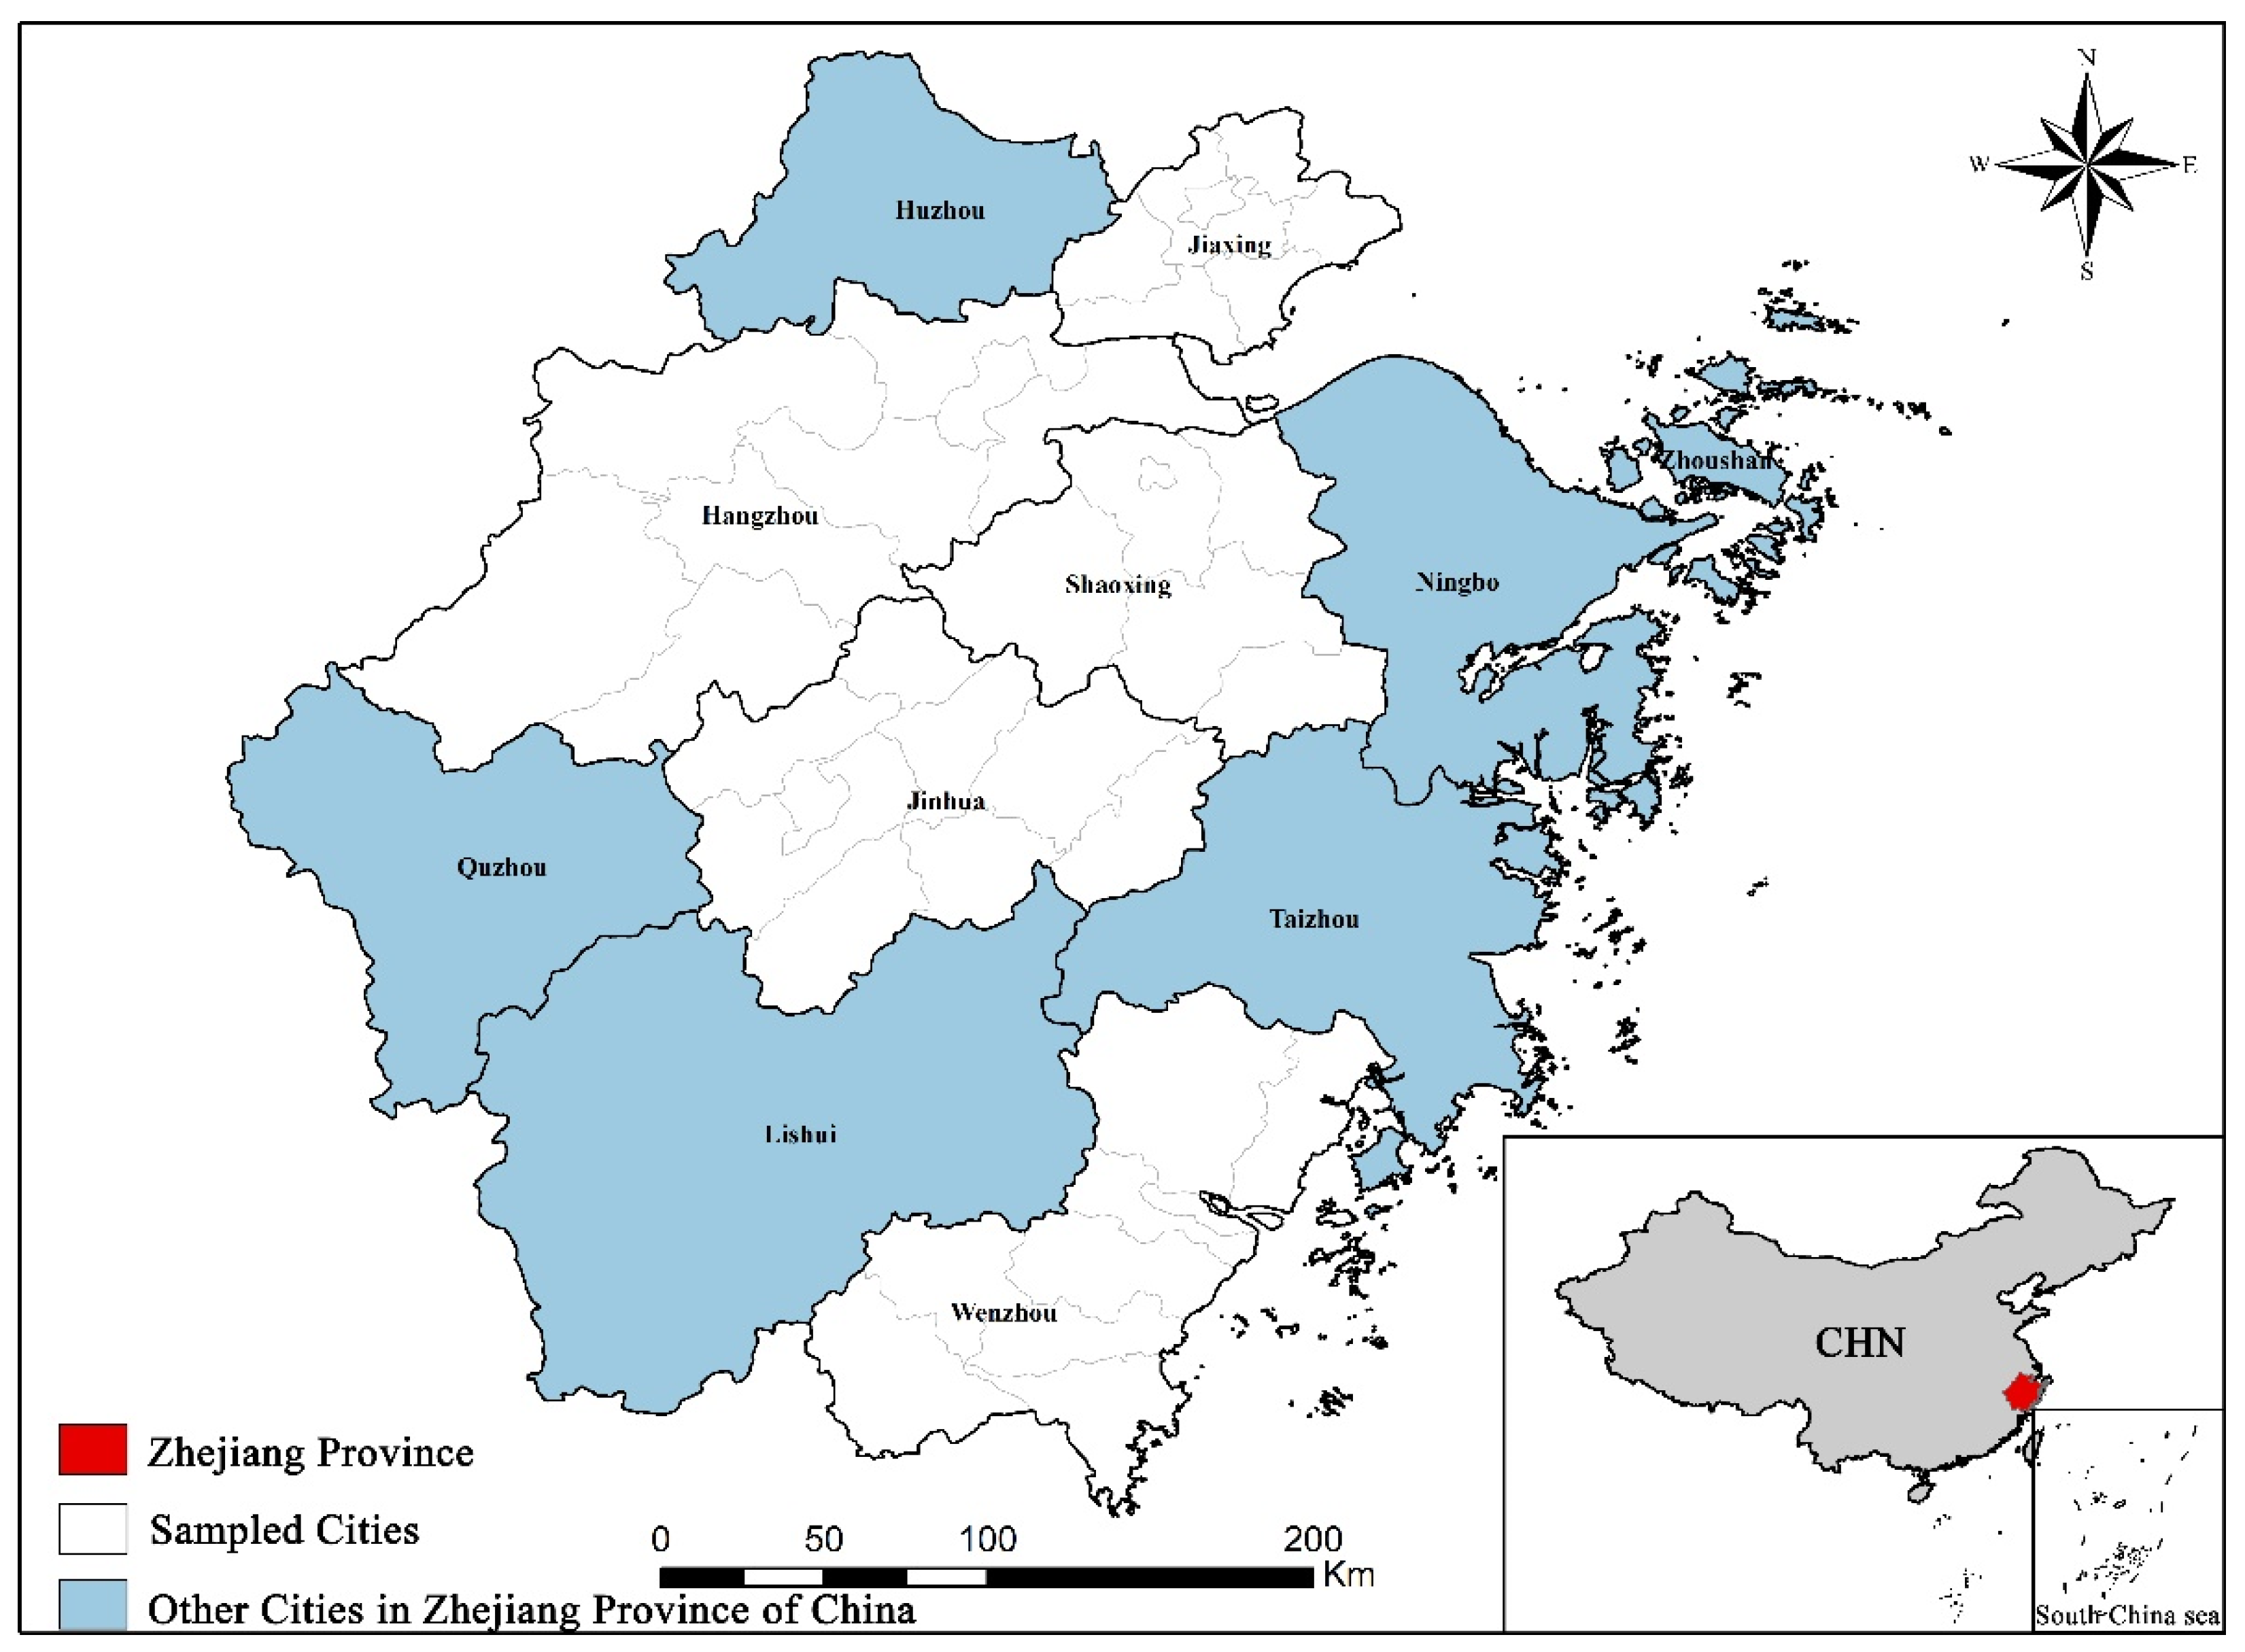
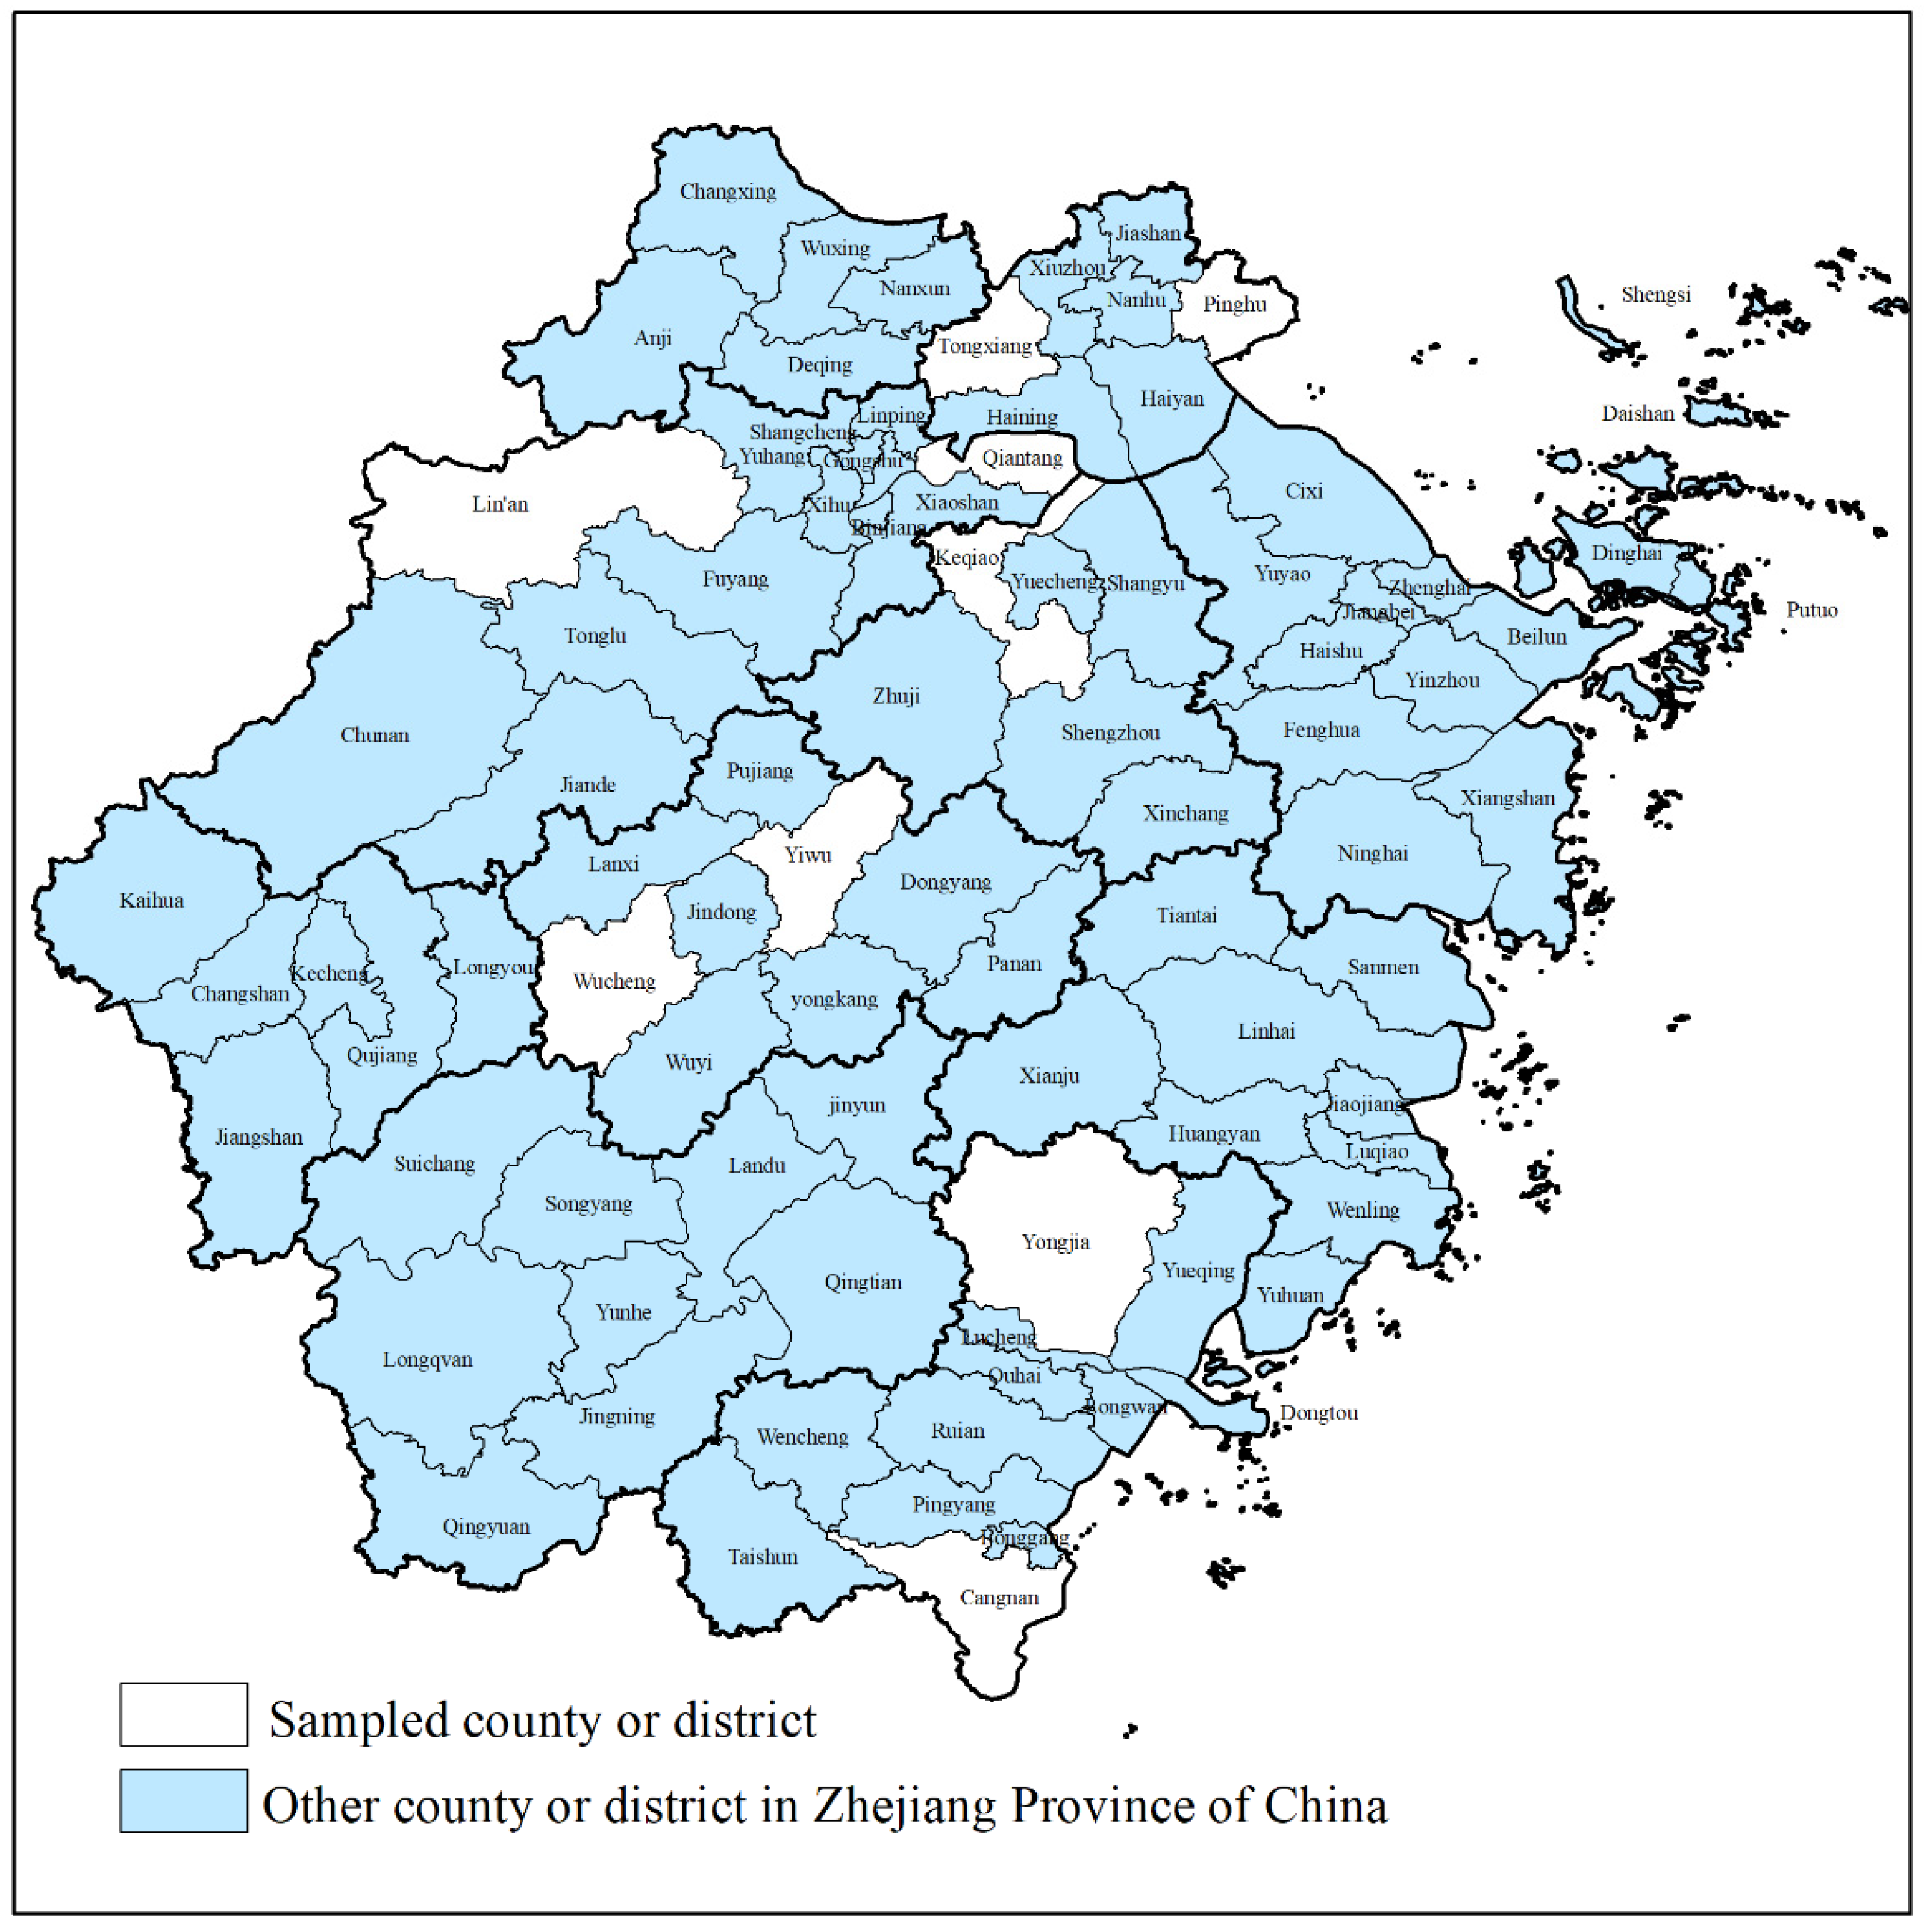
This paper uses a field questionnaire to obtain data. When designing the questionnaire, we strictly follow the functionality, versatility, and efficiency of questionnaire design. Considering the feasibility and actual situation, the scope of investigation in this paper is Zhejiang Province in China. As shown in Figure 2 and Figure 3, the survey area involves the rural areas of 11 prefecture-level cities, including Hangzhou, Ningbo, Jiaxing and Wenzhou. Due to the large scale, wide distribution and complex sampling structure of rural areas in Zhejiang Province, this paper adopts a multistage mixed sampling method. According to the characteristics of different stages, a variety of random sampling methods are comprehensively used to carry out the survey. The first stage is based on the per capita GDP of prefecture-level cities and extracts prefecture-level cities under the jurisdiction of Zhejiang Province by stratification. In the second stage, the codes of districts, counties and county-level cities in the prefecture-level cities were selected, and simple random sampling was carried out using relevant statistical software. In the third stage, administrative villages were selected by simple random sampling. Finally, the survey subjects were randomly selected in the determined rural areas and the questionnaires were distributed.
A total of 807 questionnaires were distributed in this survey, and 807 questionnaires were returned. After processing the missing values and outliers in the sample data, there were 703 valid questionnaires, and the effective rate of the questionnaires was 87.11%.
3.2. Variable Design and Analysis
3.2.1. Explained Variable
The explained variable studied in this paper is “residential environmental governance satisfaction”, which is represented by “satisfaction”. The questionnaire asked the respondents, “Are you satisfied with the current local ecological environmental governance and protection policies?” The answer options are quantified using a seven-level Likert scale. The 1–7 scale indicates satisfaction ranging from very dissatisfied to very satisfied. According to the answers, 1–7 points are given. The larger the value is, the higher the respondents’ satisfaction with local environmental governance.
3.2.2. Explanatory Variable
The core explanatory variable studied in this paper is “government environmental information disclosure in rural areas”, which is represented by disclosure 1 and disclosure 2. As the influencing factor of government environmental information disclosure is difficult to measure, this paper reflects the government’s environmental information disclosure degree by investigating rural residents’ understanding of the national government’s rural revitalization strategy and environmental governance policies. The higher the rural residents’ knowledge of the government’s strategies and measures, the greater the degree of government environmental information disclosure. Therefore, two questions were set in the questionnaire, namely, “Do you understand the national rural revitalization strategy?” and “Do you understand the construction of the ‘Poetry and Painting Zhejiang’ Garden in your province?” to investigate rural residents’ understanding of the degree of government policies, which positively reflects the degree of government environmental information disclosure. The quantification rules for the options for answering the two questions are the same as the explained variables. 1–7 means that the level of understanding ranges from very little to a very high level of experience. The larger the value is, the greater the respondents understand the complementary strategies and policies; that is, the greater the disclosure of government environmental information and the greater the transparency of environmental protection.
3.2.3. Moderating Variable
The moderating variable considered in this paper is knowledge of environmental protection. It is believed that the difference in the level of residents’ knowledge of environmental protection will impact the relationship between government environmental information disclosure and residents’ satisfaction with environmental governance. Therefore, the questionnaire contained whether it is recognized that “practicing the concept of environmental protection can achieve long-term sustainable development” and assigned a value from 1 to 7 that corresponds to the degree of recognition from very low to very high.
3.2.4. Mediating Variable
It is assumed above that the disclosure of government environmental information will affect residents’ satisfaction with environmental governance by affecting residents’ attitudes and evaluations of environmental pollution problems in the surrounding areas. Therefore, the mediating variable studied in this paper is residents’ evaluation of the surrounding environmental pollution. The corresponding question in the questionnaire is “What changes have occurred in the ecological environment near your residence?” The evaluation of residents is assigned from 1 to 7 from gradually worse to gradually better.
3.2.5. Control Variable
Considering that the individual characteristics of residents may have an impact on the relationship between the explained variable and the explanatory variable, this paper controls for age, gender, marital status, occupation, workplace, education level, average annual household income and average annual household consumption. The individual characteristics of these seven respondents were used as control variables. Age refers to the resident’s full year of age at the time of the survey, in which 1 means 16–20 years old, 2 means 21–30 years old, 3 means 31–40 years old, 4 means 41–50 years old, 5 means 51–60 years old, and 6 means over 60 years old. When describing gender and marital status, 1 = married woman, 2 = unmarried woman, 3 = married men, and 4 = unmarried men. Occupations are divided into eight categories: 1 = farming, 2 = enterprises with pollution emissions, 3 = enterprises with no pollution emissions, 4 = students, 5 = social organizations or groups, 6 = party and government organs and institutions engaged in nonenvironmental protection work, 7 = party and government organs and institutions working on the environmental protection system, and 8 = others. Workplace is a dummy variable, 1 for indoors and 2 for outdoor. The educational level is reorganized into below primary school, junior high school, high school/secondary school/technical school, junior college, undergraduate, and master’s degree or above, and assigns 1–6, respectively. The average annual household income and annual household consumption are assigned the same value, in which 1 means less than 50,000, 2 means 50,000 to 100,000, 3 means 100,000 to 200,000, 4 means 200,000 to 300,000, 5 means 300,000 to 400,000, 6 means 400,000 to 500,000, and 7 means more than 500,000.
Descriptive statistical analysis of each variable is carried out in Table 1 below.
3.3. Model Settings
At present, scholars’ research methods on satisfaction include the structural equation model, human impact assessment (HIA) model, multilayer linear regression model and so on [43,44,45]. Since the questionnaire data are used in this paper, the explained and explanatory variables are all ordinal variables, so the ordinal logit method is used for estimation, and the least squares (OLS) method is also used for estimation and comparison. OLS estimation is used to study the impact of government environmental information disclosure on residents’ satisfaction with environmental governance based on controlling a series of related variables. At the same time, considering the characteristics of the data, the ordered logit model is further used to test the impact of government environmental information disclosure on residents’ satisfaction with environmental governance. To test Hypothesis H0, the following equation models are constructed.
- Basic Model Settings
- Ordered Logit Model Settings
- Mediating Effect Model
This paper uses Baron and Kenny’s three-step model to test the mediation effect [46]. First, the explanatory variables and the explained variables are regressed. Then, we examine the relationship between explanatory variables and mediator variables. Finally, the mediator variable is regressed as the control variable. We observe the significance of the coefficients at each step. To test Hypothesis H1, the mediation effect model equation is as follows:
- Moderating Effect Model
The moderating effect test in this paper is divided into two steps. First, the explanatory variables and moderator variables are regressed on the explained variables. Then, the interaction term between the explanatory variable and the moderator variable is added to regress the explained variable. To test Hypothesis H2, the moderating effect model equation is as follows:
4. Empirical Results Analysis
4.1. Basic Empirical Results
Before the model analysis, correlation analysis was performed on the variables selected by the model. As shown in Table 2, the correlation between the explained variable and the core explanatory variable is relatively high, with coefficients of 0.384 and 0.453, respectively. The correlation between the explained variable and the control variable is not high, except for the control variable age (age), and the absolute value of the correlation coefficient of other variables is less than 0.1. Therefore, the model setting is more reasonable.
In the study of the impact of environmental information disclosure on residents’ satisfaction with environmental governance, the OLS and ordered logit models were used for analysis to observe whether the two results were consistent. This paper uses stata15 for OLS regression and ordinal logit regression. Table 3 below reports the OLS and ordered logit estimation results of the impact of government environmental information disclosure on residents’ satisfaction with environmental governance. Among them, column (1) and column (3) are the results of OLS and ordered logit, respectively. Columns (2) and (4) represent robust estimation results for OLS and ordered logit.
The estimation results show that after controlling for a series of related variables, the two explanatory variables (disclosure1 and disclosure2) have a positive influence on the explained variable (satisfaction), and both are statistically significant at the 1% level. This indicates that government environmental information disclosure has a significant positive impact on residents’ satisfaction with environmental governance. The higher the degree of environmental information disclosure of the rural government, the better the residents understand the government’s environmental governance policies, and the higher the satisfaction of environmental governance. Therefore, Hypothesis H0 of this paper is verified.
In addition to the core explanatory variables, the test results of most of the control variables are also in line with theoretical expectations and reality. For example, residents’ satisfaction with environmental governance is significantly negatively correlated with their average annual household consumption. Families with higher average annual consumption have higher requirements for living standards and, of course, higher requirements for their living environment. Therefore, satisfaction with the current local environmental governance will be relatively lower.
4.2. Marginal Effects of Explanatory Variables
Drawing on the experience and practice of similar studies, this paper continues to explain the parameters based on the ordered logit estimation combined with the marginal effect results [47,48]. Table 4 reports the marginal effects of explanatory variables under different thresholds. Under the condition of controlling other variables unchanged, the influence of marginal changes of the explanatory variables on the explained variables is studied, i.e., marginal analysis in economics. As shown in the table below, the two explanatory variables (disclosure1 and disclosure2) are both significant at the 1% level within the 7-point threshold of residents’ environmental governance satisfaction ranging from 2 to 7. It is shown that the more rural residents know about the relevant policies and measures of government environmental governance, the greater the degree of government environmental information disclosure, and the higher the residents’ satisfaction with environmental governance. This result is also consistent with Hypothesis H0.
Specifically, taking the degree of understanding of the national rural revitalization strategy (disclosure1) as an example, as shown in Column (1). Every time the government’s environmental information disclosure expands by one degree, the probability of rural residents being “very dissatisfied” with environmental governance will decrease by 0.1%, the probability of being “dissatisfied” will decrease by 0.2%, the probability of being “relatively dissatisfied” will decrease by 0.7%, the probability of an “average” rural residents being will decrease by 2.6%, the probability of being “relatively satisfied” will decrease by 1.8%, the probability of being “satisfied” will increase by 3.2%, and the probability of being “very satisfied” will increase by 2.2%. That is, if the government in rural areas increases the degree of environmental information disclosure, it will reduce residents’ dissatisfaction with environmental governance and improve their satisfaction.
4.3. Robustness Check
4.3.1. Step-by-Step Addition of Control Variables
By controlling different variables, we observe whether the influence of explanatory variables on the explained variables changes. The robustness of our results can be demonstrated if the effect is always positive. The steps are as follows: (1) Regress the respondents’ age (age), gender and marital status (sex), occupation (occ) and workplace (wp) as control variables. (2) Continue to add the educational level (edu) of the respondents as a control variable for regression. (3) Continue to add the respondents’ average annual household income (income) for regression. (4) Finally, add the respondents’ average annual household consumption (cons) for the regression.
The number of control variables gradually increased from 4 to 7. From the regression results in the Table 5 below, the two explanatory variables (disclosure1, disclosure2) still have a significant positive relationship with residents’ satisfaction with environmental governance, and both are significantly positive at the 1% level. This shows that the empirical results are robust.
4.3.2. Explanatory Variable Substitution
To further improve the reliability and credibility of the research results in this paper, we continue to use the method of replacing explanatory variables for robustness testing. The question “Do you know about ‘Beautiful China’” was used in the questionnaire to replace “Do you know about the construction of the Great Garden of Poetry and Painting Zhejiang” in this province, that is, replace the explanatory variable of “disclosure2” with “disclosure”. The construction of “Beautiful China” is more universal and represents the government’s higher-level environmental governance policy. It can also be considered to include the environmental governance behavior of the provincial government in Zhejiang Province. As shown in Table 6 below, after replacing an explanatory variable with one with wider applicability, Columns (1), (2), (3) and (4) represent the OLS estimation and the ordered logit estimation. The empirical results still make the impact of government environmental information disclosure (disclosure1, disclosure) on residents’ environmental governance satisfaction (satisfaction) significantly positive at the 1% level. This is consistent with the previous results, which further demonstrates the robustness of the results of this study.
4.4. Heterogeneity Analysis
4.4.1. Educational Heterogeneity Test
Education promotes individual development and enables people to gradually form concepts, attitudes, and behaviors that adapt to modern economic life. Education is related to people’s well-being, and the development of education is crucial to national economic development and social progress. Some scholars have found that well-educated individuals enjoy more job resources in the labor market [49]. People with higher education levels tend to have greater job demands, and these demands further influence their job satisfaction. Therefore, differences in educational attainment will have an impact on individual satisfaction in related aspects. Based on this, this paper focuses on educational level as a control variable and studies the issue that the impact of government environmental information disclosure on residents’ satisfaction with environmental governance varies with educational levels.
As shown in Table 7, disclosure 1 and disclosure 2 are used as core explanatory variables. Age (age), gender and marital status (sex), occupation (occ), workplace (wp), average annual household income (income), and average annual household consumption (cons) were selected as control variables to measure residents’ satisfaction with environmental governance (satisfaction) heterogeneity analysis.
The regression results show that, when the education level of the respondents in Columns (2) and (4)–(6) is junior high school, high school/secondary school/technical school, junior college, undergraduate, or master’s degree or above, government environmental information disclosure has a significant positive impact on rural residents’ satisfaction with environmental governance. At the same time, for respondents whose education level is high school/secondary school/technical school, age has a significant positive impact on residents’ environmental governance satisfaction, and the workplace has a significant negative impact on residents’ environmental governance satisfaction. For respondents with a college education, their occupation has a significant negative impact on residents’ satisfaction with environmental governance. For respondents with a bachelor’s degree in education, the average annual household income has a significant positive impact on residents’ satisfaction with environmental governance, and the average annual household consumption has a significant negative impact on environmental governance satisfaction. Therefore, in the process of rural environmental governance, different levels of education will have a differentiated impact on residents’ degree of satisfaction. Government departments can increase the popularity of environmental information so that more residents with low education levels can understand environmental policies and participate more actively in environmental governance.
4.4.2. Heterogeneity Test of Average Annual Household Income
With the development of the social economy, different rural areas have achieved different levels of development; differentiated development, in turn, will bring about different living standards among rural residents. In a study of young teachers’ lives and job satisfaction, Cerci and Dumludag found that emphasizing income comparisons had a negative impact on life satisfaction [50]. In the process of environmental governance, residents with different income levels and different living standards may have different levels of satisfaction with rural environmental governance. Therefore, this paper studies the problem that the influence of government environmental information disclosure on residents’ satisfaction with environmental governance varies with different living standards through the average annual income level of residents’ families. As shown in Table 8, disclosure 1 and disclosure 2 are still used as core explanatory variables; the age of the respondents (age), gender and marital status (sex), occupation (occ), workplace (wp), education level (edu) and annual household consumption (cons) are used as control variables.
The regression results show that, when the average annual household income of the respondents in Columns (1)–(6) is less than CNY 500,000, environmental information disclosure has a significant positive impact on environmental governance satisfaction. As shown in Column (7), when the average annual household income of the respondents exceeds CNY 500,000, government environmental information disclosure hurts rural residents’ satisfaction. It can be found that for the vast majority of residents, increasing the degree of government environmental information disclosure can effectively improve their environmental governance satisfaction. However, for residents who are more affluent and have higher living standards, their environmental governance satisfaction requirements are higher. Merely improving the degree of environmental information disclosure may not meet their needs. Instead, the government is also required to have more diversified and innovative ways of environmental governance in order to achieve the satisfaction of rural residents.
4.5. Mediation Effect
To further explore the impact mechanism of environmental information disclosure on environmental governance satisfaction, this paper continues to test the mediating effect of residents’ evaluation of surrounding ecological and environmental issues on the relationship between the two. The empirical results are shown in Table 9 below. Column (2) shows that the explanatory variable (disclosure2) has a significant positive impact on the mediator variable (evaluate), indicating that the greater the degree of environmental information disclosure, the better the residents’ understanding of the government’s environmental governance, and the greater they will generally believe the surrounding ecological environment issues are gradually improving, thus giving a positive evaluation. Column (1) shows that the mediating variable (evaluate) has a significant positive impact on the explained variable (satisfaction), indicating that, when residents believe that the surrounding ecological environment problems are gradually improving, their satisfaction with the environmental governance will increase more. Therefore, according to the judgment standard of the mediating variable, the evaluation of rural residents on the surrounding environmental pollution as a mediating variable will play a role in the relationship between government environmental information disclosure and residents’ satisfaction with environmental governance. Hypothesis H1 of this paper is verified.
If the intermediary variable of residents’ evaluation of ecological and environmental problems continues to be controlled as a control variable, as shown in Column (3), government environmental information disclosure still has a significant positive impact on residents’ satisfaction with environmental governance. This shows that the mediating variable only produces a partial mediating effect. Therefore, in the process of environmental governance, the rural government has improved residents’ evaluation of the surrounding ecological and environmental issues. Residents generally believe that the ecological environment and the living environment are gradually improving, thus increasing their satisfaction with environmental governance.
4.6. Moderating Effect
The theoretical analysis shows that residents’ knowledge of environmental protection may moderate the relationship between environmental information disclosure and residents’ satisfaction with environmental governance. According to the test path of the moderating effect model, the empirical results are shown in Table 10. Column (1) is the regression result when there is no interaction term; Columns (2) and (3) indicate that, when the moderating variable of environmental protection knowledge (awareness) is added, the interaction term between environmental information disclosure and centralized environmental protection knowledge (disclosure1a_c, disclosure2a_c) are all significantly positive. It shows that environmental protection understanding as a moderating variable has a positive moderating effect on the relationship between the explained variable residents’ satisfaction with environmental governance and the explanatory variable government environmental information disclosure. Therefore, Hypothesis H2 of this paper is verified.
Specifically, due to the existence of the adjustment variable of residents’ knowledge of environmental protection, environmental information disclosure has different degrees of influence on satisfaction. When residents’ knowledge of environmental protection is strong, the impact of government environmental information disclosure on their satisfaction is greater. When residents’ environmental protection knowledge is weak, the impact of environmental information disclosure on their satisfaction is relatively small. Therefore, in the process of environmental governance in rural areas, the level and effect of environmental governance can be effectively improved by improving residents’ awareness of environmental protection.
5. Conclusions, Implications and Discussion
This paper uses 2020–2021 field questionnaire data to investigate the impact of rural environmental information disclosure on residents’ satisfaction with environmental governance. Based on empirical research, it is found that after controlling for a series of variables, government environmental information disclosure in rural areas has a significant positive impact on residents’ satisfaction with environmental governance. Further exploration found that the impact of government environmental information disclosure on residents’ satisfaction with environmental governance acts through the mediating variable of residents’ evaluation of surrounding ecological and environmental issues. At the same time, residents’ knowledge of environmental protection has a moderating effect on the relationship between government environmental information disclosure and residents’ environmental governance satisfaction. When residents’ environmental protection knowledge is stronger, the greater the impact of government environmental information disclosure on their environmental governance satisfaction.
The above research conclusions have some important policy implications. At present, China’s rural areas are in the process of innovation and transformation, and they are also facing the important challenge of developing environmental governance and protection schemes. Improving the rural environment and building livable villages are related to the basic well-being of rural residents and the construction of rural society. Improving rural residents’ satisfaction with environmental governance is an important goal of rural environmental governance. The governance of the rural ecological environment and humanistic environment is a long-term and arduous battle. Residents need to understand and trust the government to achieve the goal of rural environmental governance, and it is also related to the improvement of rural residents’ satisfaction with environmental governance. Therefore, (1) in the process of environmental governance, local governments can enhance residents’ awareness of local governance measures by promoting rural government environmental information disclosure, increasing environmental protection transparency and enhancing residents’ understanding of the government’s environmental governance measures, all of which will promote a sense of participation and identity. (2) When the government manages the environment, it should pay attention to the suggestions and evaluations of rural residents on ecological and environmental issues to truly improve the quality and level of residents’ lives, improve the satisfaction of the population and contribute to the construction of a new countryside. (3) Rural areas should increase publicity and mobilization efforts, actively guide and cultivate good living habits of rural residents and improve residents’ awareness of environmental protection. Starting from the details and proceeding slowly, we will strive to create a comfortable and livable living environment with a good atmosphere in which the people care about the environment.
At present, most of the existing research on information disclosure are carried out from the perspective of enterprises, such as that off Die Wu et al. [51]. Environmental information disclosure can be divided into enterprise perspective [52] and government perspective. We study environmental governance from the government level. We use questionnaires to measure respondents’ understanding of environmental governance policies to reflect the government’s openness of environmental information. Unlike most studies of urban areas, the study area of this paper is rural. This is a further expansion of the research scope of government environmental information disclosure. At the same time, the residents’ environmental evaluation and environmental protection cognition are also included in the research variables, which enriches the final research results. However, due to data limitations, we did not examine all rural areas in China, and the representativeness needs to be further optimized. In short, rural environmental governance is a necessary way to promote the development of rural areas. It is believed that through the comprehensive management of the rural ecological environment and human settlements, the vision of comprehensive development of the rural economy and significant improvement of people’s living standards will soon be realized.
Author Contributions
Conceptualization, Y.Y.; methodology, Y.Y.; software, L.S.; validation, Y.L. (Yi Li); formal analysis, Y.Y.; investigation, Y.L. (Yi Li); data curation, L.S.; writing—original draft preparation, L.S.; writing—review and editing, Y.Y.; visualization, L.S.; supervision, Y.L. (Yuwen Li); project administration, Y.L. (Yi Li); funding acquisition, Y.L. (Yi Li). All authors have read and agreed to the published version of the manuscript.
Funding
This research was funded by Zhejiang Provincial Philosophy and Social Sciences Planning Project (22NDQN228YB); Major projects of Humanities and Social Sciences in Zhejiang Province (2021QN058); Soft Science Research Project of Zhejiang Province (2022C25030); The Fundamental Research Funds of Zhejiang Sci-Tech University (2021Y008); Zhejiang Provincial Natural Science Foundation of China (LQ22G030014 and LY21G030017); Humanities and Social Sciences cultivation project of Ningbo University(XPYQ21007); “Pioneer” and “Leading Goose” R&D Program of Zhejiang (2022C01130); Zhejiang Ecological Civilization Institute of Zhejiang Provincial Key Research Base of Philosophy and Social Sciences(20JDZD076); the Key Project of Zhejiang Provincial Natural Science Foundation of China (LY21G030004); Undergraduate teaching reform research and curriculum construction cultivation project of School of economics and management of Zhejiang Sci-Tech University (jgkcjs202202); Educational reform research project of School of economics and management of Zhejiang Sci-Tech University; the National College Students’ Innovative Entrepreneurial Training Program of China (202010338020); Science and Technology Innovation Activity Plan of college students in Zhejiang Province (2021R406039).
Institutional Review Board Statement
Not applicable.
Informed Consent Statement
Not applicable.
Data Availability Statement
Not applicable.
Acknowledgments
We greatly appreciate useful discussion with Yuting Zhu and Ningze Yang of Zhejiang Sci-Tech University. We are very grateful to Jing Wen from East China Normal University and Lingyu Wang from Ningbo University for their help in making the map.
Conflicts of Interest
The authors declare no conflict of interest.
References
- Kosajan, V.; Chang, M.; Xiong, X.Y.; Feng, Y.; Wang, S.W. The design and application of a government environmental information disclosure index in China. J. Clean Prod. 2018, 202, 1192–1201. [Google Scholar] [CrossRef]
- An, X. A New Perspective to Solve the Issues Concerning “Agriculture, Rural Areas, and Farmers”—Economics Analyses and Policy Proposals. Seoul J. Econ. 2006, 19, 313–328. [Google Scholar]
- Wan, J.J.; Su, Y.; Zan, H.L.; Zhao, Y.T.; Zhang, L.Q.; Zhang, S.Y.; Dong, X.Y.; Deng, W. Land Functions, Rural Space Governance, and Farmers’ Environmental Perceptions: A Case Study from the Huanjiang Karst Mountain Area, China. Land 2020, 9, 134. [Google Scholar] [CrossRef]
- Oates, G.; Moradi-Motlagh, A. Is voluntary disclosure of environmental performance associated with actual environmental performance? Evidence from Victorian local governments, Australia. Australas. J. Environ. Manag. 2016, 23, 194–205. [Google Scholar] [CrossRef]
- Zhang, S.J.; Wang, L. The influence of government transparency on governance efficiency in information age: The environmental governance behavior of Guangdong, China. J. Enterp. Inf. Manag. 2021, 34, 446–459. [Google Scholar] [CrossRef]
- Wang, J.; Liu, P. Study on Environmental Pollution and Governance in Rural Development. Fresenius Environ. Bull. 2019, 28, 9218–9222. [Google Scholar]
- Fugui, L.; Bing, X.; Bing, X. Improving public access to environmental information in China. J. Environ. Manag. 2008, 88, 1649–1656. [Google Scholar] [CrossRef]
- Labaria, E.C.; Gotangco, C.K.; Caleda, M.J. Framing the Role of and Defining Criteria for Usefulness of Citizen Satisfaction Surveys in Local Urban Environmental Management: The Case of the Local Government Unit of Quezon City, Philippines. Environ. Urban. ASIA 2017, 8, 214–229. [Google Scholar] [CrossRef]
- Zhong, Y.; Chen, Y.G.; Feng, F.; Wang, K.M. Urban Government Performance in the Eyes of Chinese Urban Residents. Asian J. Soc. Sci. 2015, 43, 299–322. [Google Scholar] [CrossRef]
- Zhang, D.; Fan, F.; Park, S.D. Network Analysis of Actors and Policy Keywords for Sustainable Environmental Governance: Focusing on Chinese Environmental Policy. Sustainability 2019, 11, 4068. [Google Scholar] [CrossRef] [Green Version]
- Zhang, L.; Mol, A.P.J.; Yang, S. Environmental Information Disclosure in China: In the Era of Informatization and Big Data. Front. Law China 2017, 12, 57–75. [Google Scholar]
- Zhao, L.; Chen, L.Y. Research on the Impact of Government Environmental Information Disclosure on Green Total Factor Productivity: Empirical Experience from Chinese Province. Int. J. Environ. Res. Public Health 2022, 19, 729. [Google Scholar] [CrossRef] [PubMed]
- Zhang, H.; Xu, T.T.; Feng, C. Does public participation promote environmental efficiency? Evidence from a quasi-natural experiment of environmental information disclosure in China. Energy Econ. 2022, 108, 105871. [Google Scholar] [CrossRef]
- Sun, D.X.; Zeng, S.X.; Chen, H.Q.; Meng, X.H.; Jin, Z.Z. Monitoring effect of transparency: How does government environmental disclosure facilitate corporate environmentalism? Bus. Strateg. Environ. 2019, 28, 1594–1607. [Google Scholar] [CrossRef]
- Zhu, X.Y.; Zhu, Y.L.; Meng, X.H. Government Environmental Information Disclosure and Environmental Performance: Evidence from China. Sustainability 2021, 13, 6854. [Google Scholar] [CrossRef]
- Chen, L.J.; Zhang, J.L.; You, Y. Air pollution, environmental perceptions, and citizen satisfaction: A mediation analysis. Environ. Res. 2020, 184, 109287. [Google Scholar] [CrossRef]
- Feng, Y.; Chen, H.; Chen, Z.J.; Wang, Y.; Wei, W.D. Has environmental information disclosure eased the economic inhibition of air pollution? J. Clean Prod. 2021, 284, 125412. [Google Scholar] [CrossRef]
- Diamastuti, E.; Muafi, M.; Fitri, A.; Faizaty, N.E. The Role of Corporate Governance in the Corporate Social and Environmental Responsibility Disclosure. J. Asian Financ. Econ. Bus. 2021, 8, 187–198. [Google Scholar]
- Yin, H.; Huang, Y.X.; Wang, K.M. How Do Environmental Concerns and Governance Performance Affect Public Environmental Participation: A Case Study of Waste Sorting in Urban China. Int. J. Environ. Res. Public Health 2021, 18, 9947. [Google Scholar] [CrossRef]
- Eaton, S.; Kostka, G. Central Protectionism in China: The “Central SOE Problem” in Environmental Governance. China Q. 2017, 231, 685–704. [Google Scholar] [CrossRef] [Green Version]
- Ge, T.; Hao, X.L.; Li, J.Y. Effects of public participation on environmental governance in China: A spatial Durbin econometric analysis. J. Clean Prod. 2021, 321, 129042. [Google Scholar] [CrossRef]
- Johnson, T. Public participation in China’s EIA process and the regulation of environmental disputes. Environ. Impact Assess. Rev. 2020, 81, 106359. [Google Scholar] [CrossRef]
- Huang, R.B.; Chen, D.P. Does Environmental Information Disclosure Benefit Waste Discharge Reduction? Evidence from China. J. Bus. Ethics 2015, 129, 535–552. [Google Scholar] [CrossRef]
- Kabiri, N. Public participation, land use and climate change governance in Thailand. Land Use Pol. 2016, 52, 511–517. [Google Scholar] [CrossRef]
- Wu, L.H.; Ma, T.S.; Bian, Y.C.; Li, S.J.; Yi, Z.Q. Improvement of regional environmental quality: Government environmental governance and public participation. Sci. Total Environ. 2020, 717, 137265. [Google Scholar] [CrossRef] [PubMed]
- Chen, Y.X.; Zhang, J.; Tadikamalla, P.R.; Gao, X.T. The Relationship among Government, Enterprise, and Public in Environmental Governance from the Perspective of Multi-Player Evolutionary Game. Int. J. Environ. Res. Public Health 2019, 16, 3351. [Google Scholar] [CrossRef] [Green Version]
- Prado, C. Just community participation and Border environmental governance: A view from the Border 2020 program. J. Environ. Pol. Plan. 2019, 21, 662–674. [Google Scholar] [CrossRef]
- Greenspan, I.; Cohen-Blankshtain, G.; Geva, Y. NGO Roles and Anticipated Outcomes in Environmental Participatory Processes: A Typology. Nonprofit Volunt. Sect. Q. 2022, 51, 633–657. [Google Scholar] [CrossRef]
- Xie, L. Environmental governance and public participation in rural China. China Inf. 2016, 30, 188–208. [Google Scholar] [CrossRef]
- Ortega-Gil, M.; Cortes-Sierra, G.; ElHichou-Ahmed, C. The Effect of Environmental Degradation, Climate Change, and the European Green Deal Tools on Life Satisfaction. Energies 2021, 14, 5839. [Google Scholar] [CrossRef]
- Wang, J.X.; Wang, Y.J.; Sun, C.C.; Chen, X.H. Does mandatory air quality information disclosure raise happiness? Evidence from China. Energy Econ. 2021, 94, 105094. [Google Scholar] [CrossRef]
- Wu, Y.Z.; Xu, Z.Y. Massive-scale visual information retrieval towards city residential environment surveillance. J. Vis. Commun. Image Represent. 2020, 70, 102739. [Google Scholar] [CrossRef]
- Li, J.M.; Yu, S.F.; Xu, Z.H. Does environmental pollution weaken the positive effect of government public expenditure on residents’ subjective well-being? A case study in China. Energy Environ. 2022. [Google Scholar] [CrossRef]
- Wang, Y.; Zhu, Y.M.; Yu, M.J. Evaluation and determinants of satisfaction with rural livability in China’s less-developed eastern areas: A case study of Xianju County in Zhejiang Province. Ecol. Indic. 2019, 104, 711–722. [Google Scholar] [CrossRef]
- Greenstone, M.; Hanna, R. Environmental Regulations, Air and Water Pollution, and Infant Mortality in India. Am. Econ. Rev. 2014, 104, 3038–3072. [Google Scholar] [CrossRef] [Green Version]
- Guo, J.; Bai, J.H. The Role of Public Participation in Environmental Governance: Empirical Evidence from China. Sustainability 2019, 11, 4696. [Google Scholar] [CrossRef] [Green Version]
- Jae-hyuck, L.; Kyung-hee, S.; Jong-mun, P.; Choong-gon, K.; Kongjang, C. Communication problems and alternatives in the process of collecting resident opinions for environmental impact assessment through text mining: A case study of the Dangjin landfill in Korea. Environ. Impact Assess. Rev. 2022, 95, 106781. [Google Scholar] [CrossRef]
- Zhu, D.M. Effects and Drawbacks of Environmental Impact Assessment in Avoiding NIMBY. Ekoloji 2018, 27, 149–154. [Google Scholar]
- Li, D.X.; Kim, S.; Lee, Y.K.; Griffin, M. Sustainable Environmental Development: The Moderating Role of Environmental Identity. Asian J. Soc. Psychol. 2016, 19, 298–310. [Google Scholar] [CrossRef]
- Geng, M.M.; He, L.Y. Environmental Regulation, Environmental Awareness and Environmental Governance Satisfaction. Sustainability 2021, 13, 3960. [Google Scholar] [CrossRef]
- Chen, J.S.; Wang, S.Y.; Wan, L. Does government environmental governance information disclosure improve residents’ subjective well-being? Evidence from China. J. Environ. Plan. Manag. 2022, 1–23. [Google Scholar] [CrossRef]
- Zheng, Y.; Yang, R.Y. Environmental Regulation, Public Participation and Happiness: Empirical Research Based on Chinese General Social Survey of 2015. Appl. Ecol. Environ. Res. 2019, 17, 9317–9332. [Google Scholar] [CrossRef]
- He, D.S.; Miao, J.; Lu, Y.; Song, Y.M.; Chen, L.; Liu, Y. Urban greenery mitigates the negative effect of urban density on older adults’ life satisfaction: Evidence from Shanghai, China. Cities 2022, 124, 103607. [Google Scholar] [CrossRef]
- Pollnac, R.B.; Carothers, C.; Seara, T.; Poggie, J.J. Evaluating impacts of marine governance on human communities: Testing aspects of a human impact assessment model. Environ. Impact Assess. Rev. 2019, 77, 174–181. [Google Scholar] [CrossRef]
- Li, X.M.; Liu, H. The Influence of Subjective and Objective Characteristics of Urban Human Settlements on Residents’ Life Satisfaction in China. Land 2021, 10, 1400. [Google Scholar] [CrossRef]
- Baron, R.M.; Kenny, D.A. The moderator-mediator variable distinction in social psychological research: Conceptual, strategic, and statistical considerations. J. Pers. S. Psychol. 1986, 51, 1173–1182. [Google Scholar] [CrossRef]
- Frondel, M.; Vance, C.J. Interpreting the outcomes of two-part models. Appl. Econ. Lett. 2012, 19, 987–992. [Google Scholar] [CrossRef] [Green Version]
- Norton, E.C.; Dowd, B.E. Log Odds and the Interpretation of Logit Models. Health Serv. Res. 2018, 53, 859–878. [Google Scholar] [CrossRef]
- Solomon, B.C.; Nikolaev, B.N.; Shepherd, D.A. Does Educational Attainment Promote Job Satisfaction? The Bittersweet Trade-offs Between Job Resources, Demands, and Stress. J. Appl. Psychol. 2022, 107, 1227–1241. [Google Scholar] [CrossRef]
- Cerci, P.A.; Dumludag, D. Life Satisfaction and Job Satisfaction among University Faculty: The Impact of Working Conditions, Academic Performance and Relative Income. Soc. Indic. Res. 2019, 144, 785–806. [Google Scholar] [CrossRef]
- Wu, D.; Zhu, S.Z.; Memon, A.A.; Memon, H. Financial Attributes, Environmental Performance, and Environmental Disclosure in China. Int. J. Environ. Res. Public Health 2020, 17, 8796. [Google Scholar] [CrossRef] [PubMed]
- Wu, D.; Memon, H. Public Pressure, Environmental Policy Uncertainty, and Enterprises’ Environmental Information Disclosure. Sustainability 2022, 14, 6948. [Google Scholar] [CrossRef]
Figure 1.
The theoretical model of this paper.

Figure 2.
Prefecture-level cities in Zhejiang Province of China.

Figure 3.
Counties and districts in Zhejiang Province of China.


Table 1.
Descriptive statistics of variables.
| Variable Name | Variable Symbol | Obs | Mean | Std. Dev. | Min | Max |
|---|---|---|---|---|---|---|
| Residents’ Satisfaction with Environmental Governance | satisfaction | 703 | 5.239 | 1.193 | 1 | 7 |
| The degree of understanding of the National Rural Revitalization Strategy | disclosure1 | 703 | 4.435 | 1.718 | 1 | 7 |
| The degree of understanding of the construction of the “Poetry and Painting Zhejiang” large garden in Zhejiang Province | disclosure2 | 703 | 3.737 | 1.834 | 1 | 7 |
| Residents’ knowledge of environmental protection | awareness | 703 | 6.518 | 0.911 | 1 | 7 |
| Residents’ evaluation of surrounding ecological and environmental problems | evaluate | 703 | 5.381 | 1.013 | 1 | 7 |
| Age | age | 703 | 2.555 | 1.408 | 1 | 6 |
| Gender and marital status | sex | 703 | 2.383 | 1.074 | 1 | 4 |
| Profession | occ | 703 | 4.607 | 2.182 | 1 | 8 |
| Workplace | wp | 703 | 1.131 | 0.337 | 1 | 2 |
| Education Level | edu | 703 | 3.849 | 1.382 | 1 | 6 |
| Average annual household income | income | 703 | 3.191 | 1.441 | 1 | 7 |
| Average annual household consumption | cons | 703 | 2.383 | 1.197 | 1 | 7 |
Table 2.
Variable correlation coefficient table.
| Variables | (1) | (2) | (3) | (4) | (5) | (6) | (7) | (8) | (9) | (10) |
|---|---|---|---|---|---|---|---|---|---|---|
| satisfaction | 1.000 | |||||||||
| disclosure1 | 0.384 | 1.000 | ||||||||
| disclosure2 | 0.453 | 0.638 | 1.000 | |||||||
| age | 0.123 | 0.027 | 0.115 | 1.000 | ||||||
| sex | −0.008 | −0.032 | −0.051 | −0.303 | 1.000 | |||||
| occ | 0.022 | 0.071 | 0.090 | 0.066 | −0.068 | 1.000 | ||||
| wp | 0.004 | −0.089 | 0.017 | 0.432 | −0.001 | −0.203 | 1.000 | |||
| edu | −0.075 | 0.130 | −0.011 | −0.648 | 0.211 | −0.007 | −0.434 | 1.000 | ||
| income | 0.005 | 0.140 | 0.061 | −0.211 | 0.163 | 0.096 | −0.207 | 0.286 | 1.000 | |
| cons | −0.068 | 0.064 | 0.065 | −0.239 | 0.140 | 0.047 | −0.191 | 0.270 | 0.749 | 1.000 |
Table 3.
The impact of environmental information disclosure on satisfaction.
| (1) | (2) | (3) | (4) | |
|---|---|---|---|---|
| VARIABLES | Satisfaction | Satisfaction | Satisfaction | Satisfaction |
| disclosure1 | 0.113 *** | 0.113 *** | 0.220 *** | 0.220 *** |
| (0.0308) | (0.0337) | (0.0548) | (0.0583) | |
| disclosure2 | 0.230 *** | 0.230 *** | 0.401 *** | 0.401 *** |
| (0.0284) | (0.0305) | (0.0521) | (0.0545) | |
| age | 0.0461 | 0.0461 | 0.116 * | 0.116 |
| (0.0398) | (0.0414) | (0.0703) | (0.0715) | |
| sex | 0.0583 | 0.0583 | 0.0942 | 0.0942 |
| (0.0393) | (0.0401) | (0.0694) | (0.0716) | |
| occ | −0.0197 | −0.0197 | −0.0367 | −0.0367 |
| (0.0189) | (0.0203) | (0.0341) | (0.0381) | |
| wp | −0.226 | −0.226 | −0.402 | −0.402 |
| (0.140) | (0.157) | (0.256) | (0.300) | |
| edu | −0.0698 * | −0.0698 * | −0.110 | −0.110 |
| (0.0396) | (0.0392) | (0.0694) | (0.0703) | |
| income | 0.0760 * | 0.0760 * | 0.130 * | 0.130 |
| (0.0425) | (0.0437) | (0.0764) | (0.0837) | |
| cons | −0.153 *** | −0.153 *** | −0.246 *** | −0.246 ** |
| (0.0505) | (0.0523) | (0.0911) | (0.100) | |
| Constant | 4.358 *** | 4.358 *** | ||
| (0.324) | (0.343) | |||
| Observations | 703 | 703 | 703 | 703 |
Note: Standard errors in parentheses; ***, **, * indicate significance at the 1%, 5% and 10% levels.
Table 4.
Marginal effects of explanatory variables at different thresholds.
| (1) | (2) | |
|---|---|---|
| VARIABLES | disclosure1 | disclosure2 |
| 1._predict | −0.001 * | −0.001 * |
| (0.000) | (0.001) | |
| 2._predict | −0.002 *** | −0.004 *** |
| (0.001) | (0.001) | |
| 3._predict | −0.007 *** | −0.013 *** |
| (0.002) | (0.003) | |
| 4._predict | −0.026 *** | −0.047 *** |
| (0.007) | (0.007) | |
| 5._predict | −0.018 *** | −0.033 *** |
| (0.005) | (0.006) | |
| 6._predict | 0.032 *** | 0.058 *** |
| (0.009) | (0.009) | |
| 7._predict | 0.022 *** | 0.039 *** |
| (0.006) | (0.006) | |
| Observations | 703 | 703 |
Note: Standard errors in parentheses; ***, * indicate significance at the 1% and 10% levels.
Table 5.
Robustness test of stepwise addition of control variables.
| (1) | (2) | (3) | (4) | |
|---|---|---|---|---|
| VARIABLES | Satisfaction | Satisfaction | Satisfaction | Satisfaction |
| disclosure1 | 0.113 *** | 0.123 *** | 0.124 *** | 0.113 *** |
| (0.0332) | (0.0333) | (0.0335) | (0.0337) | |
| disclosure2 | 0.223 *** | 0.220 *** | 0.220 *** | 0.230 *** |
| (0.0302) | (0.0300) | (0.0301) | (0.0305) | |
| age | 0.0971 *** | 0.0555 | 0.0553 | 0.0461 |
| (0.0353) | (0.0417) | (0.0418) | (0.0414) | |
| sex | 0.0521 | 0.0565 | 0.0594 | 0.0583 |
| (0.0395) | (0.0395) | (0.0405) | (0.0401) | |
| occ | −0.0181 | −0.0187 | −0.0177 | −0.0197 |
| (0.0200) | (0.0201) | (0.0202) | (0.0203) | |
| wp | −0.155 | −0.212 | −0.219 | −0.226 |
| (0.152) | (0.153) | (0.154) | (0.157) | |
| edu | −0.0765 ** | −0.0729 * | −0.0698 * | |
| (0.0387) | (0.0390) | (0.0392) | ||
| income | −0.0174 | 0.0760 * | ||
| (0.0305) | (0.0437) | |||
| cons | −0.153 *** | |||
| (0.0523) | ||||
| Constant | 3.793 *** | 4.217 *** | 4.248 *** | 4.358 *** |
| (0.248) | (0.336) | (0.340) | (0.343) | |
| Observations | 703 | 703 | 703 | 703 |
| R-squared | 0.230 | 0.234 | 0.234 | 0.244 |
Note: Standard errors in parentheses; ***, **, * indicate significance at the 1%, 5% and 10% levels.
Table 6.
Robustness tests for substitution of explanatory variables.
| (1) | (2) | (3) | (4) | |
|---|---|---|---|---|
| VARIABLES | Satisfaction | Satisfaction | Satisfaction | Satisfaction |
| disclosure1 | 0.123 *** | 0.123 *** | 0.237 *** | 0.237 *** |
| (0.0410) | (0.0464) | (0.0714) | (0.0791) | |
| disclosure | 0.180 *** | 0.180 *** | 0.288 *** | 0.288 *** |
| (0.0396) | (0.0436) | (0.0683) | (0.0728) | |
| age | 0.0640 | 0.0640 | 0.155 ** | 0.155 ** |
| (0.0410) | (0.0426) | (0.0697) | (0.0708) | |
| sex | 0.0574 | 0.0574 | 0.0813 | 0.0813 |
| (0.0405) | (0.0413) | (0.0690) | (0.0709) | |
| occ | −0.0119 | −0.0119 | −0.0230 | −0.0230 |
| (0.0194) | (0.0204) | (0.0336) | (0.0364) | |
| wp | −0.159 | −0.159 | −0.300 | −0.300 |
| (0.144) | (0.154) | (0.250) | (0.275) | |
| edu | −0.0762 * | −0.0762 * | −0.104 | −0.104 |
| (0.0408) | (0.0406) | (0.0691) | (0.0701) | |
| income | 0.0450 | 0.0450 | 0.0688 | 0.0688 |
| (0.0437) | (0.0465) | (0.0763) | (0.0856) | |
| cons | −0.115 ** | −0.115 ** | −0.167 * | −0.167 * |
| (0.0518) | (0.0547) | (0.0901) | (0.0996) | |
| Constant | 4.271 *** | 4.271 *** | ||
| (0.335) | (0.347) | |||
| Observations | 703 | 703 | 703 | 703 |
Note: Standard errors in parentheses; ***, **, * indicate significance at the 1%, 5% and 10% levels.
Table 7.
Heterogeneity analysis of educational level.
| (1) | (2) | (3) | (4) | (5) | (6) | |
|---|---|---|---|---|---|---|
| VARIABLES | Satisfaction | Satisfaction | Satisfaction | Satisfaction | Satisfaction | Satisfaction |
| disclosure1 | 0.313 | 0.167 ** | 0.0806 | 0.310 *** | 0.0473 | 0.351 |
| (0.188) | (0.0805) | (0.0930) | (0.0656) | (0.0482) | (0.194) | |
| disclosure2 | 0.0639 | 0.186 ** | 0.192 ** | 0.116 * | 0.253 *** | 0.259 ** |
| (0.178) | (0.0831) | (0.0827) | (0.0599) | (0.0458) | (0.106) | |
| age | 0.0339 | 0.0860 | 0.206 ** | −0.0319 | −0.0374 | −0.0656 |
| (0.171) | (0.0872) | (0.0793) | (0.0907) | (0.0983) | (0.200) | |
| sex | 0.0151 | −0.0639 | 0.116 | 0.00191 | 0.105 * | −0.00335 |
| (0.158) | (0.114) | (0.106) | (0.0809) | (0.0608) | (0.249) | |
| occ | 0.0928 | 0.0112 | −0.0391 | −0.106 ** | −0.0164 | −0.0389 |
| (0.0913) | (0.0347) | (0.0366) | (0.0497) | (0.0497) | (0.154) | |
| wp | 0.418 | 0.116 | −1.306 *** | 0.227 | 0.554 * | −0.283 |
| (0.516) | (0.261) | (0.355) | (0.292) | (0.305) | (0.565) | |
| income | −0.414 * | −0.00170 | 0.0109 | 0.180 | 0.164 *** | 0.291 |
| (0.242) | (0.0883) | (0.118) | (0.128) | (0.0580) | (0.336) | |
| cons | 0.449 | 0.0179 | −0.192 | −0.187 | −0.257 *** | 0.144 |
| (0.341) | (0.0884) | (0.133) | (0.119) | (0.0791) | (0.471) | |
| Constant | 2.684 *** | 3.604 *** | 5.519 *** | 3.775 *** | 3.361 *** | 1.151 |
| (0.882) | (0.636) | (0.595) | (0.588) | (0.490) | (2.201) | |
| Observations | 49 | 108 | 97 | 111 | 322 | 16 |
| R-squared | 0.305 | 0.239 | 0.360 | 0.416 | 0.212 | 0.835 |
Note: Standard errors in parentheses; ***, **, * indicate significance at the 1%, 5% and 10% levels.
Table 8.
Heterogeneity test of average annual household income.
| (1) | (2) | (3) | (4) | (5) | (6) | (7) | |
|---|---|---|---|---|---|---|---|
| VARIABLES | Satisfaction | Satisfaction | Satisfaction | Satisfaction | Satisfaction | Satisfaction | Satisfaction |
| disclosure1 | 0.117 | 0.0878 | 0.118 | 0.181 ** | 0.117 | 0.156 | −0.180 |
| (0.106) | (0.0603) | (0.0716) | (0.0698) | (0.108) | (0.172) | (0.162) | |
| disclosure2 | 0.255 ** | 0.138 ** | 0.238 *** | 0.237 *** | 0.242 ** | 0.181 | −0.685 *** |
| (0.117) | (0.0583) | (0.0579) | (0.0627) | (0.104) | (0.154) | (0.111) | |
| age | 0.0251 | 0.0943 | 0.0219 | 0.0770 | −0.251 | 0.166 | −0.301 * |
| (0.138) | (0.0865) | (0.0841) | (0.0809) | (0.201) | (0.145) | (0.154) | |
| sex | −0.0434 | −0.00599 | 0.00384 | 0.147 * | 0.0418 | 0.193 | 0.417 ** |
| (0.191) | (0.0792) | (0.0740) | (0.0782) | (0.143) | (0.209) | (0.189) | |
| occ | 0.0214 | −0.00356 | −0.0445 | 0.0295 | 0.146 | −0.282 ** | 0.243 |
| (0.0679) | (0.0323) | (0.0417) | (0.0404) | (0.107) | (0.100) | (0.175) | |
| wp | 0.525 | −0.269 | −0.315 | −0.826 ** | −0.176 | −0.437 | |
| (0.350) | (0.231) | (0.411) | (0.381) | (0.949) | (0.495) | ||
| edu | 0.00209 | −0.00961 | −0.0850 | −0.00140 | −0.257 | −0.198 | 0.141 |
| (0.158) | (0.0838) | (0.0826) | (0.0743) | (0.209) | (0.228) | (0.211) | |
| cons | −0.0996 | −0.328 ** | −0.126 | 0.105 | 0.0650 | −0.0392 | −0.402 *** |
| (0.115) | (0.130) | (0.146) | (0.135) | (0.298) | (0.183) | (0.0888) | |
| Constant | 3.163 *** | 5.116 *** | 4.887 *** | 3.370 *** | 4.756 ** | 5.901 ** | 2.813 ** |
| (0.926) | (0.683) | (0.838) | (0.713) | (2.277) | (2.341) | (1.273) | |
| Observations | 68 | 163 | 228 | 143 | 44 | 26 | 31 |
| R-squared | 0.270 | 0.198 | 0.216 | 0.377 | 0.410 | 0.396 | 0.725 |
Note: Standard errors in parentheses; ***, **, * indicate significance at the 1%, 5% and 10% levels.
Table 9.
The mediating role of the evaluation of ecological environment issues.
| (1) | (2) | (3) | |
|---|---|---|---|
| VARIABLES | Satisfaction | Evaluate | Satisfaction |
| disclosure1 | 0.00136 | 0.114 *** | |
| (0.0329) | (0.0321) | ||
| disclosure2 | 0.122 *** | 0.189 *** | |
| (0.0305) | (0.0294) | ||
| age | 0.113 ** | 8.87 × 10⁻⁵ | 0.0460 |
| (0.0439) | (0.0405) | (0.0395) | |
| sex | 0.0502 | −0.0120 | 0.0622 |
| (0.0424) | (0.0352) | (0.0382) | |
| occ | 0.00447 | −0.0235 | −0.0120 |
| (0.0213) | (0.0177) | (0.0193) | |
| wp | −0.263 | 0.0410 | −0.240 |
| (0.165) | (0.133) | (0.152) | |
| edu | 0.00140 | −0.0477 | −0.0541 |
| (0.0422) | (0.0382) | (0.0380) | |
| income | 0.0703 | 0.0785 * | 0.0502 |
| (0.0486) | (0.0435) | (0.0444) | |
| cons | −0.116 * | −0.0737 | −0.128 ** |
| (0.0602) | (0.0491) | (0.0531) | |
| evaluate | 0.429 *** | 0.329 *** | |
| (0.0413) | (0.0386) | ||
| Constant | 2.845 *** | 5.129 *** | 2.670 *** |
| (0.416) | (0.323) | (0.382) | |
| Observations | 703 | 703 | 703 |
| R-squared | 0.160 | 0.059 | 0.318 |
Note: Standard errors in parentheses; ***, **, * indicate significance at the 1%, 5% and 10% levels.
Table 10.
The moderating effect of environmental protection knowledge.
| (1) | (2) | (3) | |
|---|---|---|---|
| VARIABLES | Satisfaction | Satisfaction | Satisfaction |
| disclosure1 | 0.107 *** | 0.1000 *** | 0.108 *** |
| (0.0347) | (0.0349) | (0.0348) | |
| disclosure2 | 0.231 *** | 0.233 *** | 0.227 *** |
| (0.0305) | (0.0304) | (0.0308) | |
| awareness | 0.0560 | 0.140 *** | 0.0775 |
| (0.0513) | (0.0534) | (0.0481) | |
| disclosure1a_c | 0.0982 *** | ||
| (0.0307) | |||
| disclosure2a_c | 0.0496 * | ||
| (0.0271) | |||
| age | 0.0456 | 0.0446 | 0.0460 |
| (0.0412) | (0.0414) | (0.0415) | |
| sex | 0.0603 | 0.0562 | 0.0577 |
| (0.0402) | (0.0395) | (0.0400) | |
| occ | −0.0216 | −0.0206 | −0.0212 |
| (0.0201) | (0.0202) | (0.0202) | |
| wp | −0.227 | −0.232 | −0.233 |
| (0.156) | (0.157) | (0.158) | |
| edu | −0.0727 * | −0.0740 * | −0.0705 * |
| (0.0391) | (0.0385) | (0.0388) | |
| income | 0.0774 * | 0.0764 * | 0.0681 |
| (0.0434) | (0.0424) | (0.0436) | |
| cons | −0.152 *** | −0.153 *** | −0.141 *** |
| (0.0523) | (0.0512) | (0.0524) | |
| Constant | 4.031 *** | 3.495 *** | 3.892 *** |
| (0.454) | (0.458) | (0.439) | |
| Observations | 703 | 703 | 703 |
| R-squared | 0.246 | 0.261 | 0.251 |
Note: Standard errors in parentheses; ***, * indicate significance at the 1% and 10% levels.
Publisher’s Note: MDPI stays neutral with regard to jurisdictional claims in published maps and institutional affiliations. |
© 2022 by the authors. Licensee MDPI, Basel, Switzerland. This article is an open access article distributed under the terms and conditions of the Creative Commons Attribution (CC BY) license (https://creativecommons.org/licenses/by/4.0/).
Share and Cite
MDPI and ACS Style
Yang, Y.; Shen, L.; Li, Y.; Li, Y. The Impact of Environmental Information Disclosure on Environmental Governance Satisfaction. Sustainability 2022, 14, 7888. https://doi.org/10.3390/su14137888
AMA Style
Yang Y, Shen L, Li Y, Li Y. The Impact of Environmental Information Disclosure on Environmental Governance Satisfaction. Sustainability. 2022; 14(13):7888. https://doi.org/10.3390/su14137888
Chicago/Turabian StyleYang, Yongliang, Liwen Shen, Yuwen Li, and Yi Li. 2022. "The Impact of Environmental Information Disclosure on Environmental Governance Satisfaction" Sustainability 14, no. 13: 7888. https://doi.org/10.3390/su14137888
Note that from the first issue of 2016, this journal uses article numbers instead of page numbers. See further details here.