
Effects of Agrivoltaic Systems on the Surrounding Rooftop Microclimate
by
 , ,
, ,
Jerome Wei Chiang Teng
1, 
Chew Beng Soh
2,
Shiddalingeshwar Channabasappa Devihosur
2,
Ryan Hong Soon Tay
3 and
Steve Kardinal Jusuf
2,* 1
Sustainable Infrastructure Engineering (Building Services) Progamme, Singapore Institute of Technology, 10 Dover Drive, Singapore 138683, Singapore
2
Engineering Cluster, Singapore Institute of Technology, 10 Dover Drive, Singapore 138683, Singapore
3
Food, Chemical and Biotechnology Cluster, Singapore Institute of Technology, 10 Dover Drive, Singapore 138683, Singapore
*
Author to whom correspondence should be addressed.
Sustainability 2022, 14(12), 7089; https://doi.org/10.3390/su14127089
Submission received: 4 May 2022
/
Revised: 8 June 2022
/
Accepted: 8 June 2022
/
Published: 9 June 2022
(This article belongs to the Special Issue Pro-environmental Decisions: Sustainable Use of Urban Rooftops)
Abstract
:Agrivoltaic systems have the potential to maximize the usefulness of spaces in building rooftops. Urban farming systems improve the microclimatic conditions, which are beneficial to solar photovoltaic (PV) systems, as they lower the operating temperatures, resulting in a higher operating efficiency. Microclimate simulations by means of ENVI-met simulation showed that between 0800 h and 1800 h, PV temperatures in the plot that has crops below the PV system were on average lower by 2.83 °C and 0.71 °C as compared without crops on a typical sunny and cloudy day, respectively. Hence, we may see PV efficiency performance improvement of 1.13–1.42% and 0.28–0.35% on a sunny day and cloudy day, respectively. Data collected from a physical prototype of an agrivoltaic system suggested that evaporative cooling was responsible for the reduction in ambient temperatures. The presence of crops growing underneath the PV canopy resulted in the agrivoltaic prototype generating between 3.05 and 3.2% more energy over the day as compared to a control system with no crops underneath.
1. Introduction
Immigration and urbanization have led cities to become more populated and denser. Land in cities is more valued due to competing demand for residential, industrial, and commercial needs, especially in the land-scarce city state of Singapore [1]. Due to the high cost of the land, low-value economic activities, such as agriculture, are economically unjustifiable. Hence, over 90% of food in the city state is imported and only less than 1% of the land is used for farming [2].
However, the COVID-19 pandemic lockdowns have disrupted the global food supply chain. This highlighted Singapore’s high dependence on imported food sources and its vulnerability to global supply impacts. In view of this, Singapore has set goals to increase local food production to produce 30 percent of the country’s nutritional needs by 2030, known as “30 by 30” goal [3].
It is indeed challenging to find the space necessary to grow the food needed to meet the nutritional needs of the city’s residents. Traditionally, agriculture activities require large swathes of arable land to grow food. To overcome this challenge, a tender was launched to convert multi-story carparks into urban farms for vegetables and other food crops [4].
On the other hand, Singapore is also counting on its high average solar irradiation of about 1580 kWh/m2 to meet the target set under Singapore Green Plan 2030 [5]. It is to quadruple solar energy deployment by 2030. From 2016 to Q1 of 2020, Singapore’s solar PV capacity has tripled from 125.5 MWp to 376.8 MWp [6]. Every parcel of land with ample sunlight, particularly building rooftops, is having solar photovoltaic (PV) systems installed to generate renewable energy in addition to the need for cooling tower and water storage tank placements. This implies that Singapore has even less space for agriculture owing to the increased land utilization by solar panel installations.
One potential solution to fully utilize the building rooftop spaces is to integrate agriculture with solar PV infrastructure, known as agrivoltaic systems. In an agrivoltaic system, the PV modules are located on the same surface as the crops [7]. A number of research works conducted outside Singapore showed the benefits of agrivoltaics on land productivity, improving water use efficiency and energy production systems [8,9,10,11].
In an agrivoltaic system, the crops have the ability to reduce the urban temperatures between 0.5 and 4 °C through the evapotranspiration process [12]. French agriculture technology company, Sun’Agri, has shown that their agrivoltaic system installed in the transitional Mediterranean climate of Durance Valley, France, lowered the ambient temperatures by 2–4 °C and reduced the water stress on the crops by 63% [13]. Barron-Gafford et al.’s study in the U.S. found the average daytime temperature to be cooler by 1.2 + 0.3 °C with the agrivoltaic system, although during the nighttime, the temperature was higher by 0.5 + 0.4 °C [14]. In Singapore, the effects of green roof plants’ evapotranspiration on PV module temperatures had been observed to lower the PV’s temperatures by 1 °C to 4 °C, depending on the amount of cloud cover [15].
As a result of lowering the air temperature, the integrated solar PV system can be expected to operate at a higher efficiency with the natural cooling from the evapotranspiration process of the crops growing beneath the PV panels, due to the inverse relationship between PV cell temperature and PV performance [16]. Typically, the temperature of PV modules can range from 40 °C to 60 °C in mid-day. In crystalline silicon solar cells, an increase of the PV temperature can reduce solar to electrical energy conversion efficiency by 0.4–0.5% K−1 [17]. This implies that if the temperature can be reduced by 5, the efficiency can be enhanced by 2.5 to 3% [18].
In the Singapore context, the crops are grown using technologies such as growing systems, such hydroponics systems, instead of conventional farming on soil, on which most of the mentioned studies are based. According to AlShrouf [19], hydroponic systems can save between 80 and 90% more water compared to conventional farming systems. This extends to fertilizer savings between 55 and 85%. The productivity of crops also increased by 100–250%; this means there is more yield per unit area of farm space. Another study by Barbosa et al. found that a hydroponic system growing lettuce can produce up to 11 ± 1.7-times higher yields compared to conventional systems [20].
The use of computer simulation, such as ENVI-met, to understand the impact of greenery on the surrounding microclimate and climate mitigation is very common. Ouyang et al. evaluated the thermal-radiative performance of the ENVI-met simulation and validated it with field measurements [21]. Cortes et al. simulated different greenery strategies including trees, grass, and green roofs regarding their impact in mitigating the urban heat island (UHI) effect [22]. Therefore, ENVI-met could be a useful simulation tool to evaluate the impact of crops on the surrounding microclimate.
The motivation of this study was driven by the fact that there is no research study on agrivoltaic systems that use hydroponic crop growing systems in tropical climates. Most studies were conducted in non-tropical climates with conventional growing methods on arable land.
This study consists of two parts. The first is a physical experiment, which involves collecting and analyzing the data collected from the agrivoltaic system planted with Romaine lettuce, which was placed in a “rooftop-like” environment. An analysis of the influence of an agrivoltaic system on the surrounding microclimate was carried out. Ambient temperature, relative humidity (RH), and incident solar radiation are the key microclimatic parameters that may influence the solar PV operating temperatures and, by extension, its performance.
The second part is a computer simulation with the ENVI-met software. The simulation involves modeling the physical prototype together with the surrounding environment. Actual weather data were input in the model. The intention of both a physical experiment and a computer simulation was to allow the validation of the simulated model and, then, potentially, enable the future adoption and integration of more agrivoltaic systems.
2. Methodology
2.1. Physical Experiment Setup
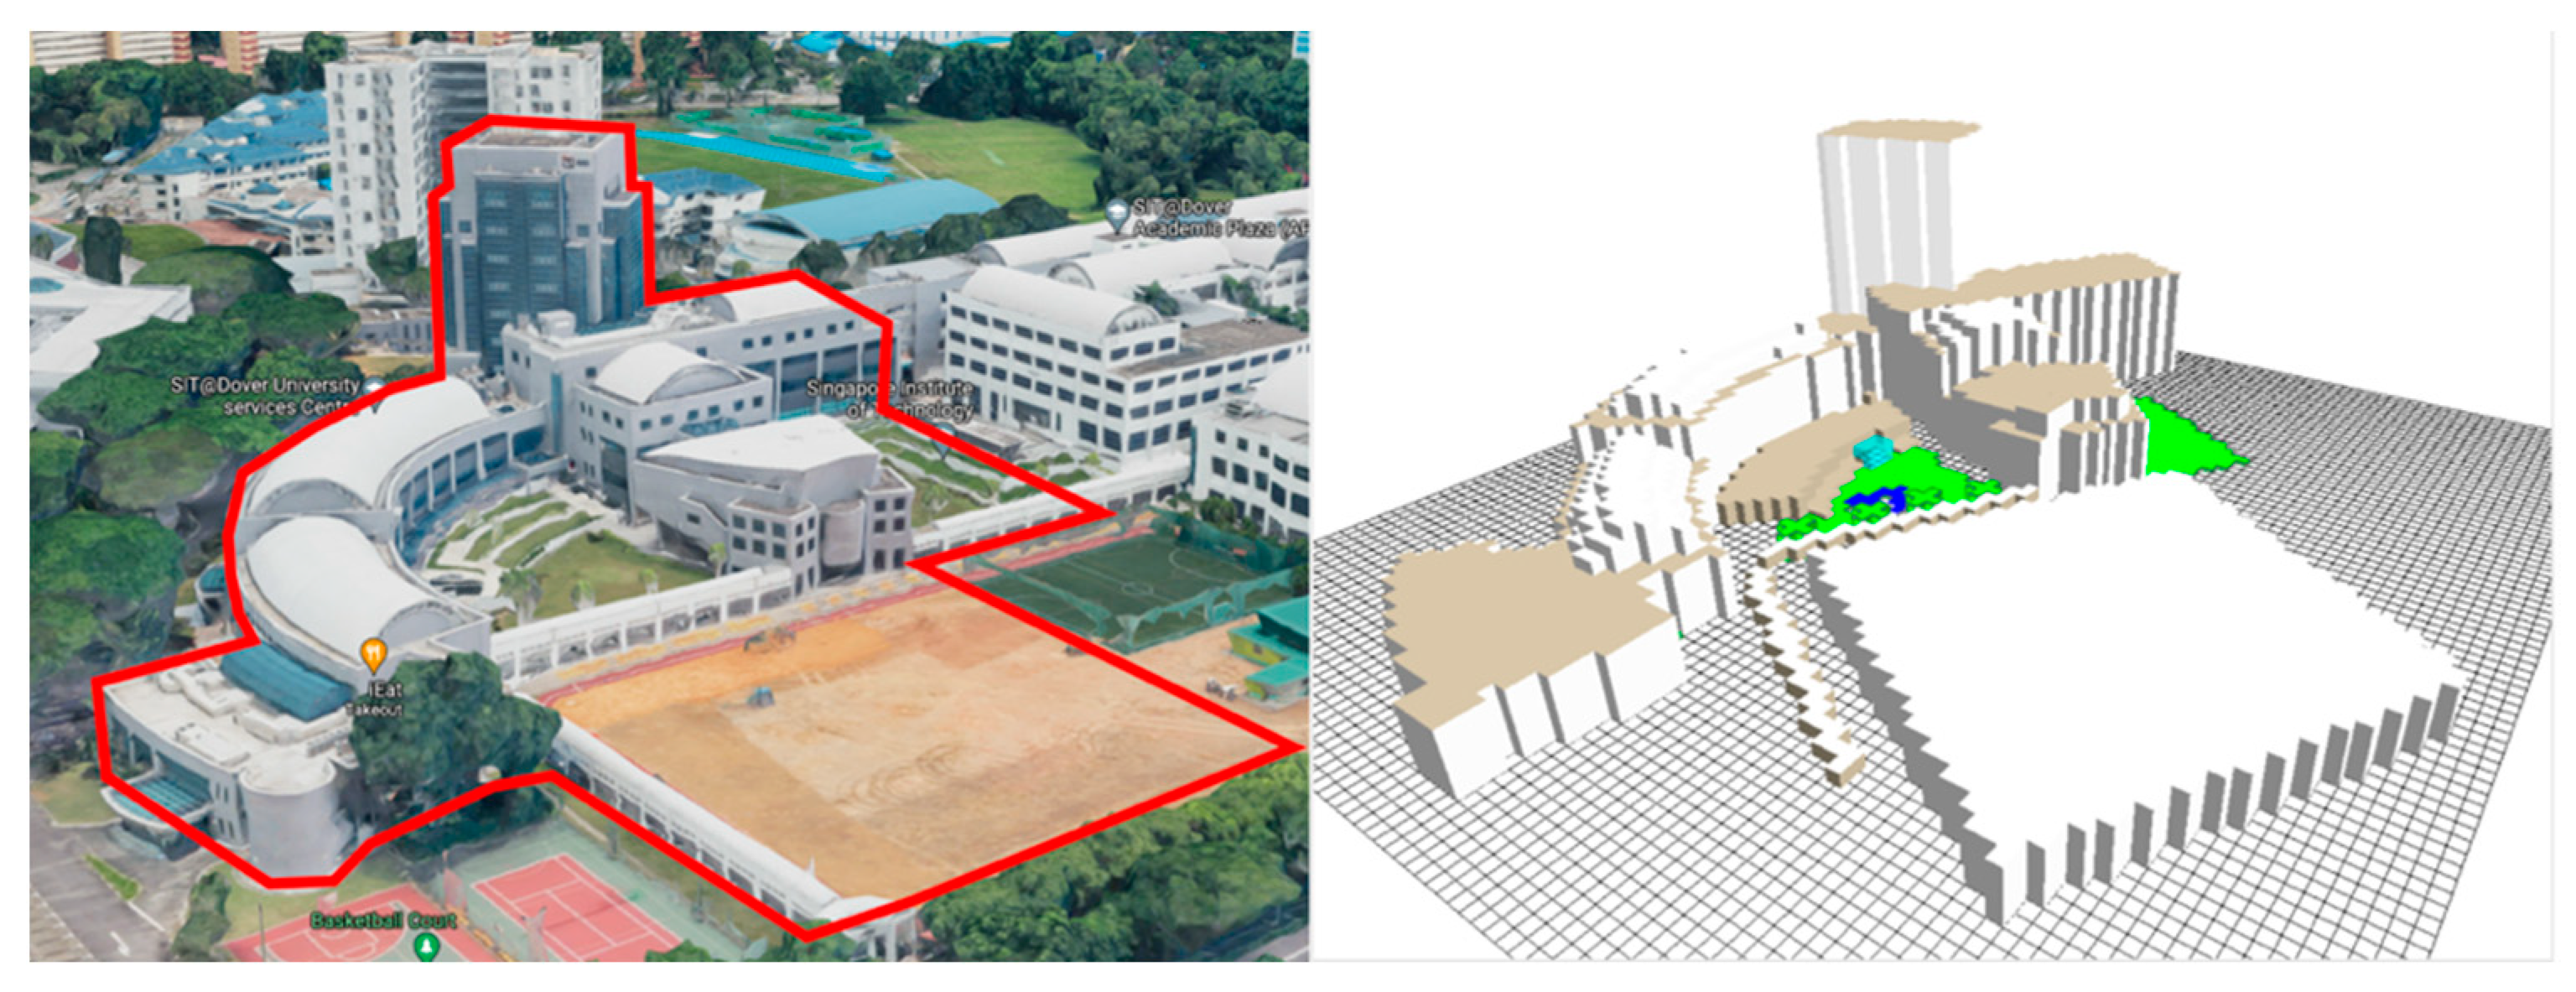
The site for the “rooftop agrivoltaic farm” is located at the Singapore Institute of Technology Dover (SIT@Dover) Campus. The agrivoltaics prototype was built on an open field, which has similar conditions to an open rooftop (Figure 1). The ground was cemented to mimic that of a typical rooftop in Singapore. Weather data of the site were collected by a weather station located on the roof of one of the buildings on the SIT Dover campus.
The agrivoltaic farm has two plots, Plot A and Plot B. Based on the solar study, the PV canopy was tilted at a 5° angle to optimize the amount of solar radiation captured at the site, as well as to prevent the gathering of dust by allowing rainwater to clean the PV panels. The hydroponic system used in the study is the Nutrient Film Technique (NFT) to circulate water and nutrients among the plants (Figure 2).
Each plot is covered by 2 × 10 units of PV panels (i.e., size 4 m × 10 m). Both plots were identical and had several sensors installed to monitor the microclimatic conditions. A pyranometer and surface temperature sensors were installed above the PV canopy. The top view of the PV modules superimposed with the NFT system is shown in Figure 3.
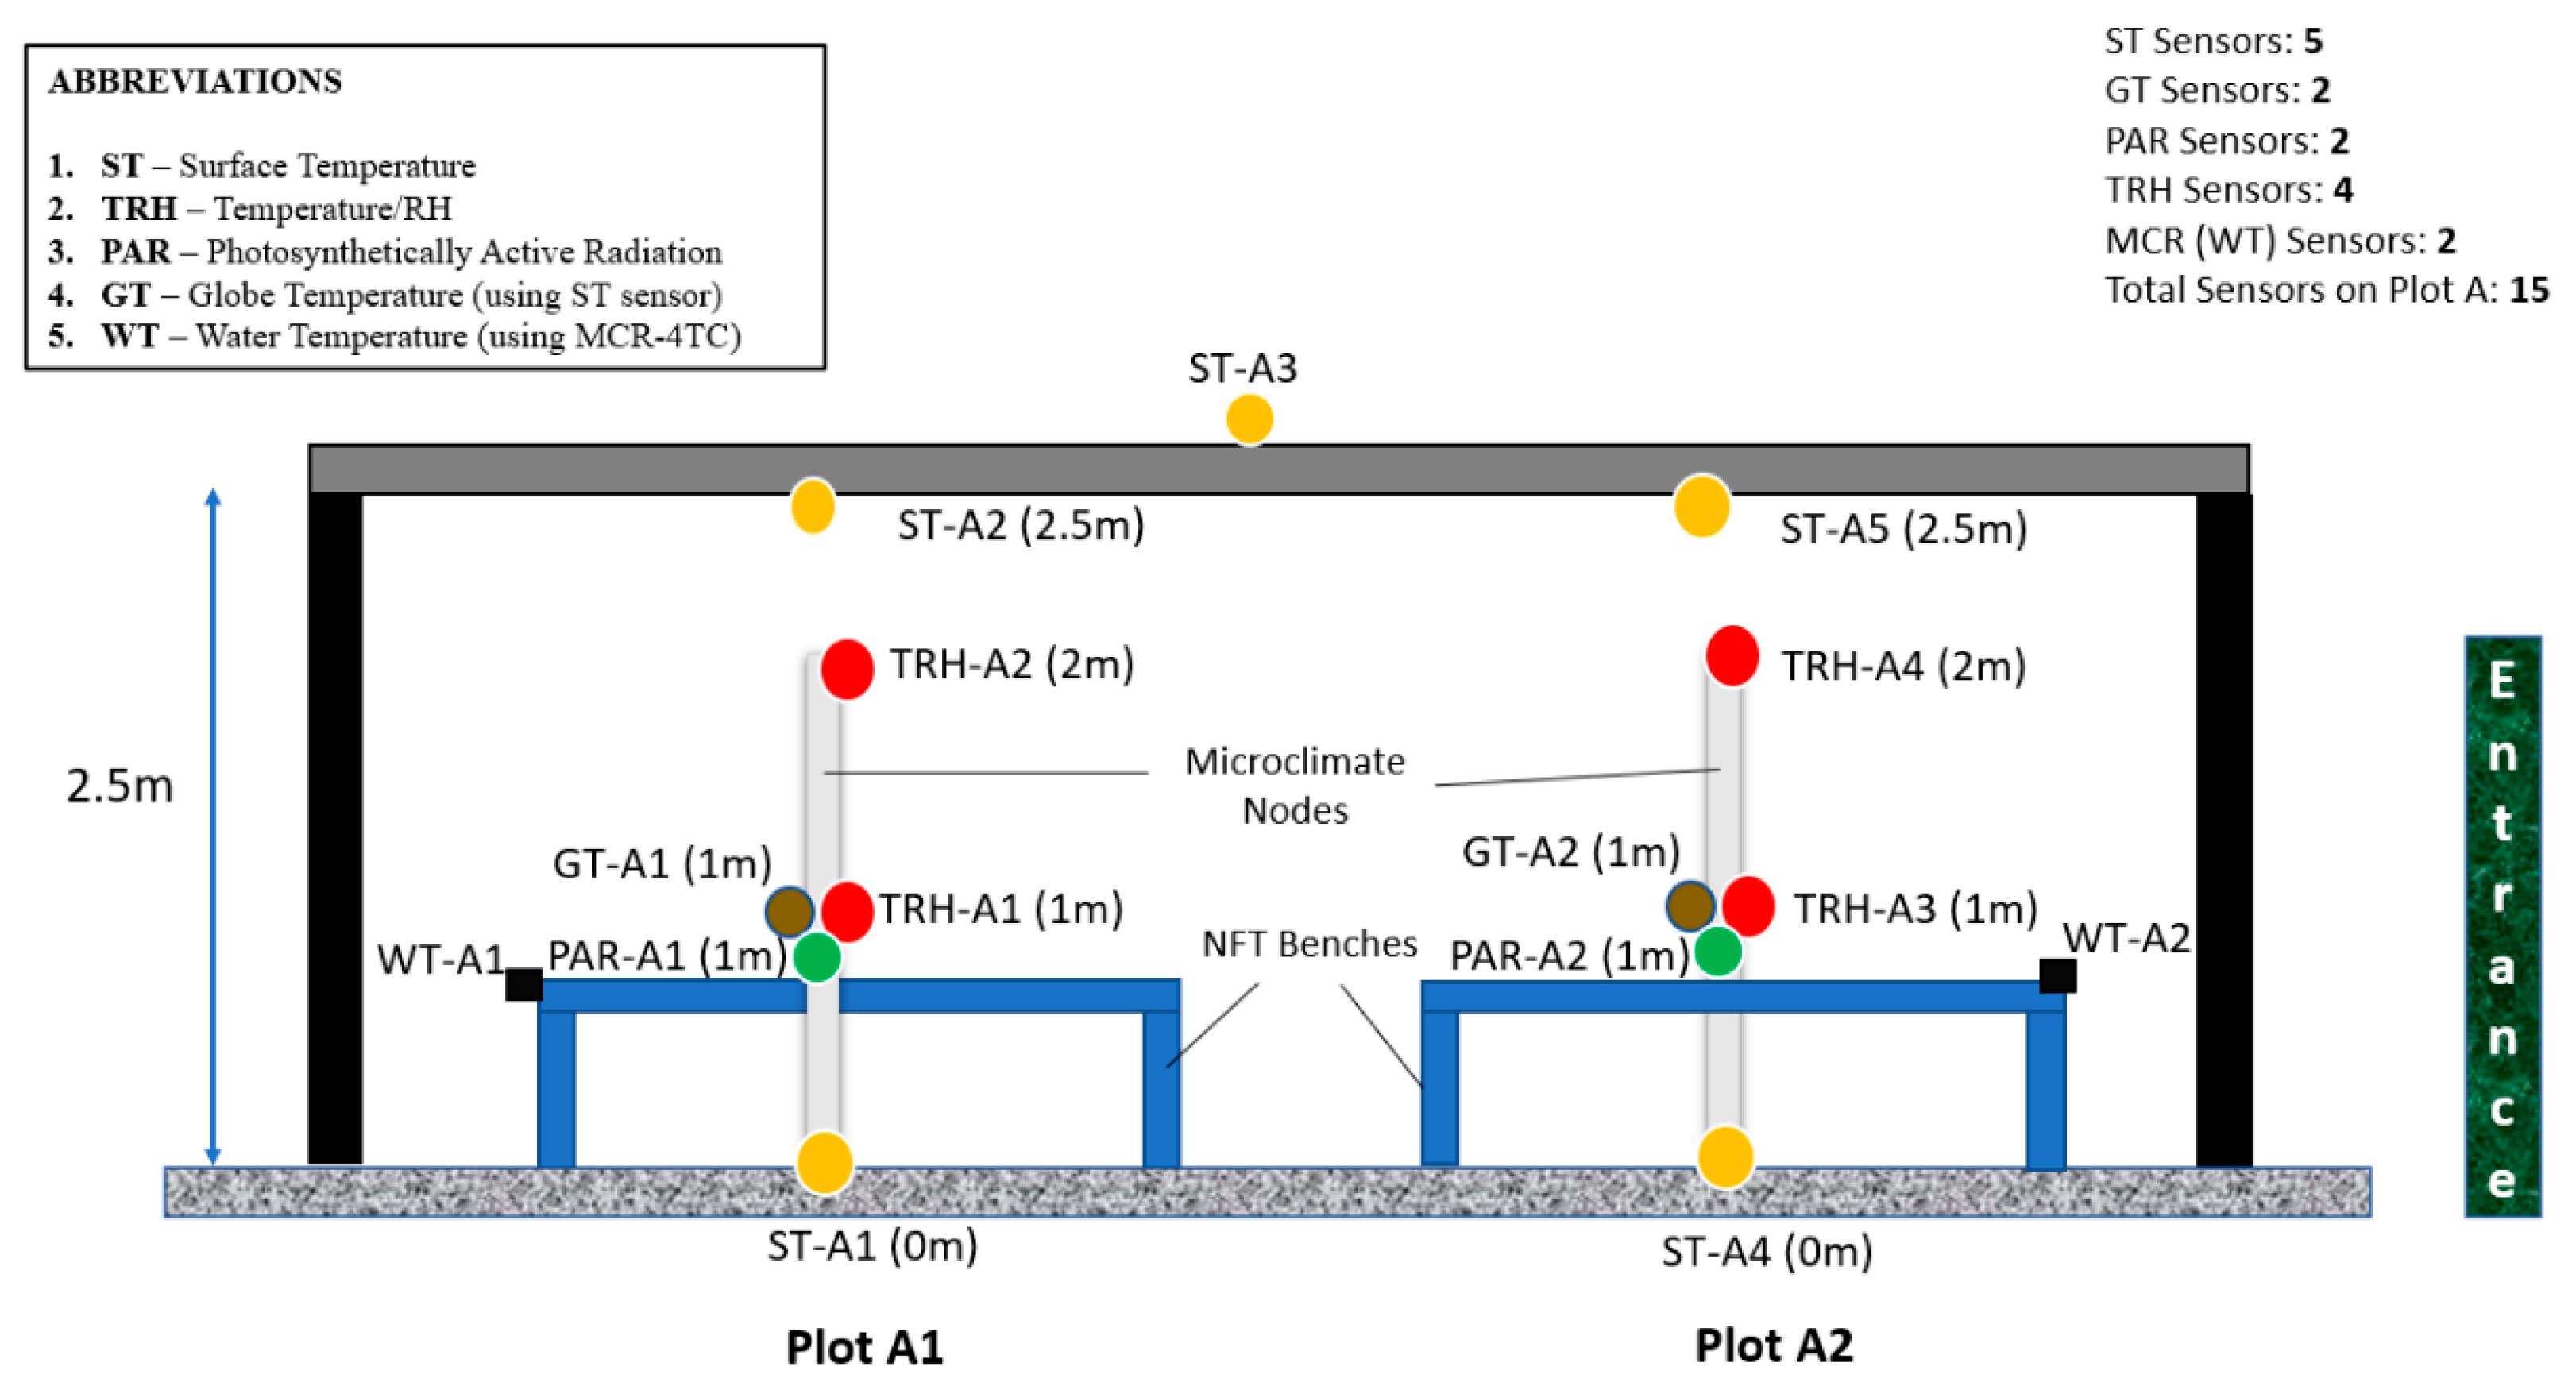
Ambient temperature and RH sensors were installed on a pole above the hydroponic system and below the PV canopy setup, as shown in Figure 4. Table 1 shows the various sensors installed, the corresponding specifications, and the parameters measured.
To study the effect of the crops on the microclimate, the collected data were analyzed and compared for the scenario with and without crops in two different weather conditions, during a sunny and a cloudy day. A sunny day on 15 July 2021 and a cloudy day on 13 July 2021 were chosen for the study. The hourly average insolation for the two days can be seen in Figure 5a,b, measured using a nearby weather station (Figure 5c).
Romaine lettuce was used in this experiment, which was germinated from seeds off-site and transplanted to the system when they reached approximately 3–5 cm tall. They were added to Plot A of the agrivoltaic system, while Plot B was kept empty. The hydroponic NFT system was operational and circulating nutrients among the crops in Plot A. A similar system was off in Plot B. Ambient temperature, RH, and insolation data were recorded. An image of both plots of the agrivoltaic farm is shown in Figure 5c. Figure 5d shows the image of the Romaine lettuces grown in Plot A. The data analysis was performed when the Romaine lettuces had a height between 10 and 15 cm.
2.2. ENVI-Met Model
A 3D model of the site was created based on existing plans of the site. The ENVI-met mesh size used for this study was 2 × 2 × 2 m, as shown in Figure 6. The mesh size used for this study was 2 × 2 × 2 m. Given the computational resources available and level of detail required, the 2 × 2 × 2 mesh size provided a sufficient resolution to analyze the microclimate around the agrivoltaic setup whilst completing the simulation in a reasonable time frame.
The weather recorded on 14 October 2019 and 15 November 2019 was found to be a good representation of a typical sunny and cloudy day, respectively. This was then used as boundary conditions in the ENVI-met simulations (Figure 7). The solar irradiance intensity had a range of 800 to 1000 W/m2 under direct sunlight during a sunny clear noon (Figure 7a), as compared to 400 to 500 W/m2 during a cloudy noon (Figure 7b). Table 2 shows the 24 h mean of the temperature and solar insolation of the respective days.
Simulation results produced from ENVI-met can be accurate to 95% and above of the actual measured values based on the incorporation of sensors to measure the microclimate conditions [23]. To model how the material responds to incoming thermal radiation, the reflectivity and emissivity values of the material were specified. Firstly, the energy of the incoming short-wave radiation converted into electricity must be discounted, as it was not reflected or absorbed by the material. The solar panel installed on site has a maximum efficiency of 20.7%. Therefore, 20% of the incoming short-wavelength radiation was discounted when defining the solar panel material properties. Anti-reflective coatings on solar panels can reduce total reflection in the 300–800 nm wavelengths to between 3 and 10% [24]. In the model, 5% of incoming short-wave radiation was assumed to be reflected off the solar panel and was specified in the material properties. The remaining 75% of incoming short-wavelength radiation was assumed to have been absorbed by the material.
Secondly, the glass-encapsulated solar cell has an emissivity of 90% in the mid-infrared spectrum and dips to 70% in the 10 µm wavelength [25]. The simulation assumed the solar panels have an overall emissivity of 80%.
Plants were also modelled in the simulation, as the evapotranspiration effect is of interest to us. Default ENVI-met plants were used for the palm trees and surrounding grass. A custom “hedge” element was created to simulate crops underneath the solar PVs. The height of the “hedge” was customized to be 1.3 m in height, and the leaf area density (LAD) between 0 m to 1 m was set to zero. The aim was to only have leaves between z = 1 m and 1.3 m in the simulation.
Using the ENVI-met model, six simulations were conducted to study the effects on the microclimate by the agrivoltaic system (Table 3).
Weather station data (Figure 5c), including ambient temperature, RH, wind speed, wind direction, and short-wave direct radiation, were input in the ENVI-met model at half-hour intervals. Other boundary conditions were estimated soil temperatures and estimated internal building temperatures.
3. Results
Data points for PV surface temperature, ambient temperature, and RH were collected from the on-site prototype and extracted from the simulation results. The results are presented in this section
3.1. Physical Experiment Results
Results gathered from the prototype (Figure 8) showed that the relative humidity with the hours of the day did not have any significant difference during the cloudy day, when the relative humidity was much higher. During the cloudy day (Figure 8b), RH remained high at 77–97% for both plots with and without crops. There was a dip to a lower range (50 ± 5%) during the dryer sunny day period between 1130 h and 1500 h; there was a higher relative humidity of about 2 to 3% for Plot A as compared to Plot B, as shown in Figure 8a.
As for the ambient temperatures between 1100 and 1430 h (Figure 9a), in Plot A (with crops), it was 0.3 to 0.7 °C lower than in Plot B (without crops). On the other hand, the surface temperature of the PV in Plot A was 2 °C to 4 °C lower as compared to Plot B (Figure 9b). This is significant as it affects the performance of the PV.
Due to the reduced RH, evaporation would be greater when the air is relatively dryer as compared to the cloudy day. We can expect the effect of evaporative cooling to be more pronounced and have a greater impact on the extent of the temperature reduction of the ambient temperature and the PV temperature.
Taking a closer look at the ambient and PV temperatures of the sunny day, the higher RH observed in Plot A between 1100 and 1600 h coincides with the drop in ambient and PV temperature, as shown in Figure 9. The difference in PV and ambient temperatures between the plots with and without crops was not significant during the cloudy day.
Readings were also taken from the power meter of the PV array inverter at the respective plots. The peak AC power generated was also higher in Plot A during both sunny and cloudy days (Table 4).
The AC power generated from the PV was plotted for both Plot A and Plot B for every 5 min interval between the time of 1200 and 1400 h. The result shows that the power harnessed from Plot A ranged from 5.5 to 6.0 kW, while that from Plot B ranged from 5.0 kW to 5.5 kW. There was a 5 to 8% improvement in the power generation assuming the cloud over does not vary much over both plots during noon.
3.2. ENVI-Met Simulation Results
From the simulation results, data at z = 1.8 m were extracted from the simulation results. The plane was cut at 1.8 m, which was below the PV canopy, but above the NFT hydroponic system in the model.
In the sunny day simulation, the peak ambient temperature occurred at 1300 h. It was 35.41 °C and 35.69 °C for the simulation with and without crops, respectively (Figure 10a). The average ambient temperature over the whole day was 28.61 °C with crops and 28.85 °C without the crops. On average, the ambient air temperature was cooler by 0.23 °C with crops simulated. The largest difference was at 1200 h, when the ambient temperature with crops was 0.52 °C cooler. The peak PV temperatures on the top (sunlit) surface of the PV panel were 65.73 °C and 70.03 °C for the simulation with and without crops, respectively (Figure 10c). On average, the PV temperature was cooler by 1.59 °C with crops simulated. The largest temperature difference was at 1300 h when the PV was 4.30 °C cooler with crops simulated.
In the cloudy day simulation, the peak ambient temperature occurred at 1500 h. It was 28.92 °C and 29.00 °C for the simulation with and without crops, respectively (Figure 10b). The average ambient temperature over the whole day was 26.38 °C with crops simulated and 26.56 °C without crops simulated. On average, the ambient air was cooler by 0.18 °C with crops simulated. The largest difference was at 0100 h when the ambient temperature with crops was 0.29 °C cooler. The peak PV temperatures on the top (sunlit) surface of the PV panel were 35.33 °C and 36.75 °C for the simulation with and without crops, respectively (Figure 10d). On average, over the entire day, the PV temperature was cooler by 0.29 °C with crops simulated. The largest temperature difference was at 1500 h when the PV was 1.42 °C cooler with crops simulated.
The peak insolation received at the PV surface during the sunny day and cloudy simulation was 1056.3 W/m2 and 389 W/m2 at 1200 h and 1500 h, respectively. This is consistent with the insolation data fed into the model.
4. Discussion
The data collected from the physical prototype showed that the differences in the temperatures were small. Evaporative cooling depends on the rate of evaporation. When RH is high, the rate of evaporation will decrease. Additionally, the crops in Plot A had not fully matured yet. Hence, their impact on the microclimate could be less pronounced.
In both data sets collected during the cloudy day and sunny day, RH remained high on the cloudy day (77–97%) relative to the sunny day (50 ± 5%). From the collected data, the effects of evaporative cooling were observed during the sunny day. When comparing Plot A and Plot B, there was an increase in RH in Plot A, which is indicative of evaporative cooling occurring between the hours of 1100 and 1600 h. The rise of RH in Plot A coincided with the drop in ambient and PV temperature relative to Plot B.
Plot A generated 1.07 kWh (3.05%) and 0.2 kWh (3.2%) more power than Plot B on the sunny day and cloudy day, respectively. These results suggest that evaporative cooling had an impact on the microclimate, which translated into improved PV performance. As the crops mature, the effect of evapotranspiration should become more obvious, and we can expect further improvements in the PV performance.
In the simulations, the sunny day simulation results showed that the agrivoltaic system with crops yielded the lowest average ambient temperature throughout the day. The peak reduction in ambient temperatures occurred at 1200–1300 h, where the temperatures were 36.1 °C, 35.7 °C, and 35.3 °C for the control, simulation without crops, and simulation with crops, respectively. The control had the highest peak ambient temperature at 1300 h. This could be because the control was an open area and was subjected to direct solar irradiance. The simulation with the crops showed promising results by lowering the ambient temperature. This aligns with the physical prototype and suggests that an agrivoltaic system is capable of lowering ambient temperatures in open areas such as fields or urban rooftops during a hot and sunny day with minimal airflow.
However, in the cloudy day simulation, results showed that the control simulation yielded the lowest ambient temperature throughout the day, which might be due to potential shading and stronger wind during the time period. This led to a lower temperature of the control as compared to the simulation without crops and simulation with crops, respectively. This can be attributed to the soil substrate in the control model. In the simulation with the agrivoltaic system, as well as the physical experiment, there was a concrete base. Concrete has a higher thermal mass and emissivity compared to soil. ENVI-met would have also simulated the evaporative effect of the soil. The combination of these factors could be counteracting the positive microclimate effects of the crops.
This would suggest that if a PV array is to be erected on a concrete base, the microclimate may be negatively affected. This hypothesis also concurs with a study by Barron-Gafford et al. [26]. In that study, the researchers conducted measurements and found that the temperatures of a PV plant could be up to 3–4 °C higher at night due to the reduced albedo and increased thermal mass, thereby altering how heat is absorbed, stored, and released.
However, it should be noted that between the simulations with and without crops, the simulation with crops showed lower ambient temperatures. This was true for both sunny and cloudy day simulations. Therefore, it would seem that the presence of crops is beneficial as it would help to negate the increased heat mass of the new structures and lower the ambient temperature.
Based on the simulation results, the positive impact on the microclimate was also translated to lowered PV temperatures. During the simulated daytime of 0800 h to 1800 h, PV temperatures were on average lower by 2.83 °C (6.18%) and 0.71 °C (2.51%) for the sunny and cloudy day, respectively. The performance of PV modules can be improved by 0.4–0.5% K−1 [4]. Hence, we may see an improved PV efficiency performance of 1.13–1.42% and 0.28–0.35% on a sunny day and cloudy day, respectively.
Limitations
Due to the limited timeframe of this project, the crops had not yet matured when the data of their impact on the microclimate was collected. The days selected for analysis (13 and 15 July 2021), whilst similar to the control days (14 October 2019 and 15 November 2019), were not an exact match.
A better set of weather data could be used to compare against the simulation in the future. This would have allowed for a more direct comparison between the simulation results and results from the physical experiment and provide more insights into the microclimate benefits of the agrivoltaic system.
5. Conclusions
Based on the simulations, the agrivoltaic system showed promise in improving the microclimatic conditions for open areas such as fields or rooftops. In both the sunny day and cloudy day simulations, the presence of crops below a PV canopy was predicted to be beneficial in bringing down the ambient temperatures as compared to just the PV canopy alone. The average ambient temperatures were predicted to drop by 0.23 °C and 0.18 °C on the sunny and cloudy day, respectively.
Simulations also predicted that lower ambient temperature would translate to lower PV module temperatures. During the day between 0800 and 1800 h, the PV temperatures were on average lower by 2.83 °C and 0.71 °C on the sunny and cloudy day, respectively.
Observations from the physical prototype align with the simulation findings. Temperature and RH data during the hot and sunny day suggest that evaporative cooling had an effect in reducing the ambient temperature and, then, the PV temperature. During the simulated daytime of 0800–1800 h, PV temperatures were on average lower by 2.83 °C (6.18%) and 0.71 °C (2.51%) for the sunny and cloudy day, respectively. The peak PV temperatures on the top (sunlit) surface of the PV panel were 65.73 °C and 70.03 °C for the simulation with and without crops, respectively. This explained that the data collected from the inverters reflect an improvement in performance. The plot with crops generated 3.05% and 3.2% more power than the plot without crops on the sunny day and cloudy day, respectively. From the analysis, we can draw the conclusion that the implementation of the agrivoltaic system helped generate more electrical energy through cooling due to the trans-evaporation of the crops. This was especially significant for the surface temperature of the solar panel.
Author Contributions
Conceptualization, J.W.C.T., C.B.S., R.H.S.T. and S.K.J.; methodology, J.W.C.T., C.B.S. and S.K.J.; software, J.W.C.T., C.B.S. and S.K.J.; validation, J.W.C.T., C.B.S. and S.C.D.; formal analysis, J.W.C.T.; investigation, J.W.C.T.; resources, S.C.D., R.H.S.T. and S.K.J.; data curation, J.W.C.T.; writing—original draft preparation, J.W.C.T. and C.B.S.; writing—review and editing, C.B.S., S.C.D. and S.K.J.; visualization, J.W.C.T. and S.C.D.; supervision, C.B.S. and S.K.J.; project administration, S.K.J.; funding acquisition, S.K.J. All authors have read and agreed to the published version of the manuscript.
Funding
This research was funded by Temasek Foundation Innovates CLG Ltd., Grant No. R-TFX-A403-0001.
Institutional Review Board Statement
Not applicable.
Informed Consent Statement
Not applicable.
Data Availability Statement
The data presented in this study are available on request from the corresponding author. The data are not publicly available due to commercial interest of authors, grantor and collaborator.
Conflicts of Interest
The authors declare no conflict of interest.
References
- Mok, W.K. Technology innovations for food security in Singapore: A case study of future food systems for an increasingly natural resource-scarce world. Trends Food Sci. Technol. 2020, 102, 155–168. [Google Scholar] [CrossRef] [PubMed]
- Singapore Food Agency. Food Farms. Available online: https://www.sfa.gov.sg/food-farming/food-farms/farming-in-singapore (accessed on 6 June 2022).
- Singapore Food Agency. 30 by 30. Available online: https://www.ourfoodfuture.gov.sg/30by30 (accessed on 6 June 2022).
- Liu, V. Nine Multi-Storey Carpark Rooftops in Singapore to Be Converted to Urban Farms. 2020. Available online: https://www.straitstimes.com/singapore/nine-multi-storey-carpark-rooftops-in-singapore-to-be-converted-to-urban-farms (accessed on 6 June 2022).
- Su, B.; Goh, T.; Ang, B.W.; Ng, T.S. Energy consumption and energy efficiency trends in Singapore: The case of a meticulously planned city. Energy Policy 2021, 161, 1–14. [Google Scholar] [CrossRef]
- Energy Market Authority, Singapore. Singapore Energy Statistics. 2021. Available online: https://www.ema.gov.sg/singapore-energy-statistics/Ch06/index6 (accessed on 6 June 2022).
- ADEME; I Care & Consult; Ceresco; Cetiac. Characterizing Photovoltaic Projects on Agricultural Land and Agrivoltaism. 2021. Available online: https://librairie.ademe.fr/energies-renouvelables-reseaux-et-stockage/4992-caracteriser-les-projets-photovoltaiques-sur-terrains-agricoles-et-l-agrivoltaisme.html (accessed on 6 June 2022). (In French).
- Dupraz, C.; Marrou, H.; Talbot, G.; Dufour, L.; Nogier, A.; Ferard, Y. Combining solar photovoltaic panels and food crops for optimising land use: Towards new agrivoltaic schemes. Renew. Energy 2011, 36, 2725–2732. [Google Scholar] [CrossRef]
- Agostini, A.; Colauzzi, M.; Amaducci, S. Innovative agrivoltaic systems to produce sustainable energy: An economic and environmental assessment. Appl. Energy 2021, 281, 116102. [Google Scholar] [CrossRef]
- Dinesh, H.; Pearce, J.M. The potential of agrivoltaic systems. Renew. Sustain. Energy Rev. 2016, 54, 299–308. [Google Scholar] [CrossRef] [Green Version]
- Amaducci, S.; Yin, X.; Colauzzi, M. Agrivoltaic systems to optimise land use for electric energy production. Appl. Energy 2018, 220, 545–561. [Google Scholar] [CrossRef]
- Qiu, G.-Y.; Li, H.-Y.; Zhang, Q.-T.; Chen, W.; Liang, X.-J.; Li, X.-Z. Effects of Evapotranspiration on Mitigation of Urban Temperature by Vegetation and Urban Agriculture. J. Integr. Agric. 2013, 12, 1307–1315. [Google Scholar] [CrossRef]
- Sun’Agri. Available online: https://sunagri.fr/en/project/the-la-pugere-experimental-station/ (accessed on 13 September 2021).
- Barron-Gafford, G.A.; Pavao-Zuckerman, M.A.; Minor, R.L.; Sutter, L.F.; Barnett-Moreno, I.; Blackett, D.T.; Thompson, M.; Dimond, K.; Gerlak, A.K.; Nabhan, G.P.; et al. Agrivoltaics provide mutual benefits across the food–energy–water nexus in drylands. Nat. Sustain. 2019, 2, 848–855. [Google Scholar] [CrossRef]
- Hendarti, R. The Influence of the Evapotranspiration Process of Green Roof Tops on PV Modules in the Tropics. Ph.D. Thesis, National University of Singapore, Singapore, 2013. [Google Scholar]
- Mahmoudinezhad, S.; Cotfas, D.T.; Cotfas, P.A.; Skjølstrup, E.J.; Pedersen, K.; Rosendahl, L.; Rezania, A. Experimental investigation on spectrum beam splitting photovoltaicethermoelectric generator under moderate solar concentrations. Energy 2022, 238, 121988. [Google Scholar] [CrossRef]
- AlShrouf, A. Hydroponics, Aeroponic and Aquaponic as Compared with Conventional Farming. American Scientific Research J. Eng. Technol. Sci. 2017, 27, 2313–4402. [Google Scholar]
- Barbosa, G.L.; Gadelha, F.D.; Kublik, N.; Proctor, A.; Reichelm, L.; Weissinger, E.; Halden, R.U. Comparison of Land, Water, and Energy Requirements of Lettuce Grown Using Hydroponic vs. Conventional Agricultural Methods. Int. J. Environ. Res. Public Health 2015, 12, 6879–6891. [Google Scholar] [CrossRef] [PubMed] [Green Version]
- Veldhuis, A.J.; Nobre, A.; Reindl, T.; Rüther, R.; Reinders, A.H.M.E. The Influence of Wind on the Temperature of PV Modules in Tropical Environments, Evaluated on an Hourly Basis. In Proceedings of the 2013 IEEE 39th Photovoltaic Specialists Conference (PVSC), Tampa, FL, USA, 16–21 June 2013; pp. 0824–0829. [Google Scholar]
- Huang, M.; Eames, P.; Norton, B. Thermal regulation of building-integrated photovoltaics using phase change materials. Int. J. Heat Mass Transf. 2004, 47, 2715–2733. [Google Scholar] [CrossRef]
- Ouyang, W.; Sinsel, T.; Simon, H.; Morakinyo, T.E.; Liu, H.; Ng, E. Evaluating the thermal-radiative performance of ENVI-met model for green infrastructure typologies: Experience from a subtropical climate. Build. Environ. 2022, 207, 10827. [Google Scholar] [CrossRef]
- Cortes, A.; Rejuso, A.J.; Santos, J.A.; Blanco, A. Evaluating mitigation strategies for urban heat island in Mandaue City using ENVI-met. J. Urban Manag. 2022, 11, 97–106. [Google Scholar] [CrossRef]
- Katsoulas, N.; Antoniadis, D.; Tsirogianni, I.L.; Labraki, E.; Bartzanas, T.; Kittas, C. Microclimatic effects of planted hydroponic structures in urban environment: Measurements and simulations. Int. J. Biometeorol. 2016, 61, 69–85. [Google Scholar] [CrossRef] [PubMed]
- Semenova, O.V.; Yuzova, V.A.; Patrusheva, T.N.; Merkushev, F.; Railko, M.Y.; Podorozhnyak, S.A. Antireflection and protective films for silicon solar cells. Mater. Sci. Eng. 2014, 66, 012049. [Google Scholar] [CrossRef]
- Riverola, A.; Mellor, A.; Alonso Alvarez, D.; Ferre Llin, L.; Guarracino, I.; Markides, C.N.; Paul, D.J.; Chemisana, D.; Ekins-Daukes, N. Mid-infrared emissivity of crystalline silicon solar cells. Sol. Energy Mater Sol. Cells 2018, 174, 604–615. [Google Scholar] [CrossRef] [Green Version]
- Barron-Gafford, G.A.; Minor, R.L.; Allen, N.A.; Cronin, A.D.; Brooks, A.E.; Pavao-Zuckerman, M.A. The Photovoltaic Heat Island Effect: Larger solar power plants increase local temperatures. Sci. Rep. 2016, 6, 35070. [Google Scholar] [CrossRef] [PubMed] [Green Version]
Figure 1.
Bird’s eye view of the site (Source Adapted from Google Earth) (left). Agrivoltaic experiment setup (right).
Figure 1.
Bird’s eye view of the site (Source Adapted from Google Earth) (left). Agrivoltaic experiment setup (right).

Figure 2.
Schematic floor plan diagram of the NFT system.

Figure 3.
Schematic top view of PV layout above the NFT system/bench (Note: A1–A8 and B1–B8 are PV structural column code for ease of identification).
Figure 3.
Schematic top view of PV layout above the NFT system/bench (Note: A1–A8 and B1–B8 are PV structural column code for ease of identification).

Figure 4.
Location of sensors in the plot.

Figure 5.
(a) Insolation measured during the sunny day (15 July 2021); (b) insolation measured during the cloudy day (13 July 2021); (c) the physical agrivoltaic farm setup with Plot A and Plot B on SIT@Dover Campus together with on-site weather station; (d) the Romaine lettuces that were planted at the site in Plot A.

Figure 6.
Buildings modelled (Source Adapted from Google Earth) (left); ENVI-met model (right).

Figure 7.
Measured insolation (w/m2) collected on: (a) 14 October 2019 (sunny day); (b) 15 November 2019 (cloudy day).
Figure 7.
Measured insolation (w/m2) collected on: (a) 14 October 2019 (sunny day); (b) 15 November 2019 (cloudy day).

Figure 8.
RH data collected from the prototype. (a) Data collected during the sunny day. (b) Data collected during the cloudy day.
Figure 8.
RH data collected from the prototype. (a) Data collected during the sunny day. (b) Data collected during the cloudy day.

Figure 9.
Sunny day ambient dry bulb (a), PV temperatures (b), and peak AC power meter reading from the inverter for Plot A with crops and Plot B without crops (c).
Figure 9.
Sunny day ambient dry bulb (a), PV temperatures (b), and peak AC power meter reading from the inverter for Plot A with crops and Plot B without crops (c).

Figure 10.
Simulated ambient air dry bulb temperatures extracted from: (a) sunny day simulation; (b) cloudy day simulation. Simulated PV surface temperatures extracted from; (c) sunny day simulation; (d) cloudy day simulation.
Figure 10.
Simulated ambient air dry bulb temperatures extracted from: (a) sunny day simulation; (b) cloudy day simulation. Simulated PV surface temperatures extracted from; (c) sunny day simulation; (d) cloudy day simulation.


Table 1.
Sensor specifications and measured parameters.
| Sensor | Specifications | Parameter(s) | Purpose |
|---|---|---|---|
| HOBO External Temperature/Relative Humidity Sensor Data Logger (MX2302A) | Accuracy: +/− 0.2 °C and +/− 2.5% Relative Humidity Range: −40 to 70 °C Resolution: 0.02 °C | Temperature (°C) and Relative Humidity (%) | Measures the microclimate ambient temperature and humidity at different heights (1 m and 2 m) |
| HOBO Type T Thermocouple Data Logger (UX100-014M) | Accuracy: ±0.6 °C Range: −260 to 400 °C Resolution: 0.02 °C | Surface Temperature (°C) | Measures surface temperature of surfaces (ground, solar panel backsheet, solar cell temperature) |
| HOBO Type T Thermocouple Data Logger (UX100-014M) | Accuracy: ±0.6 °C Range: −260 to 400 °C Resolution: 0.02 °C | Globe Temperature (°C) | Measures mean radiant temperature |
| Apogee Quantum Sensor (SQ-420) | Spectral Range: 370 nm to 650 nm Range: 10 to 60 °C Resolution: 0.1 µmol m−2 s−1 | Photosynthetically Active Radiation (µmol m−2 s−1) | Measures useful sunlight (PAR) captured by plants from visible light spectrum |
| MCR-4TC Multichannel recorder | Accuracy: ±(0.5 °C + 0.3% of reading) Range: −270 to 400 °C Resolution: 0.1 °C | Temperature (°C) | Measures water temperature at the end of the NFT gutters |
Table 2.
The 24 h mean of weather parameters.
| 14 October 2019 (Sunny Day) | 15 November 2019 (Cloudy Day) | ||||
|---|---|---|---|---|---|
| Temperature (°C) | Insolation (W/m2) | Relative Humidity (%) | Temperature (°C) | Insolation (W/m2) | Relative Humidity (%) |
| 29.96 | 253.15 | 72.58 | 27.60 | 98.43 | 82.89 |
Table 3.
Conditions of the 6 simulations conducted.
| Sunny Day Simulations | Cloudy Day Simulations |
|---|---|
| 1. Control (no PV, no crops) | 4. Control (no PV, no crops) |
| 2. With PV and without crops | 5. With PV and without crops |
| 3. With PV and crops | 6. With PV and crops |
Table 4.
Power meter readings from inverter output.
| Plot | 13 July 2021 (Cloudy Day) | 15 July 2021 (Sunny Day) | ||
|---|---|---|---|---|
| Yield (kWh) | Peak AC Power (kW) | Yield (kWh) | Peak AC Power (kW) | |
| Inverter A in Plot A | 6.38 | 1.68 | 36.09 | 6.06 |
| Inverter B in Plot B | 6.18 | 1.65 | 35.02 | 5.76 |
Publisher’s Note: MDPI stays neutral with regard to jurisdictional claims in published maps and institutional affiliations. |
© 2022 by the authors. Licensee MDPI, Basel, Switzerland. This article is an open access article distributed under the terms and conditions of the Creative Commons Attribution (CC BY) license (https://creativecommons.org/licenses/by/4.0/).
Share and Cite
MDPI and ACS Style
Teng, J.W.C.; Soh, C.B.; Devihosur, S.C.; Tay, R.H.S.; Jusuf, S.K. Effects of Agrivoltaic Systems on the Surrounding Rooftop Microclimate. Sustainability 2022, 14, 7089. https://doi.org/10.3390/su14127089
AMA Style
Teng JWC, Soh CB, Devihosur SC, Tay RHS, Jusuf SK. Effects of Agrivoltaic Systems on the Surrounding Rooftop Microclimate. Sustainability. 2022; 14(12):7089. https://doi.org/10.3390/su14127089
Chicago/Turabian StyleTeng, Jerome Wei Chiang, Chew Beng Soh, Shiddalingeshwar Channabasappa Devihosur, Ryan Hong Soon Tay, and Steve Kardinal Jusuf. 2022. "Effects of Agrivoltaic Systems on the Surrounding Rooftop Microclimate" Sustainability 14, no. 12: 7089. https://doi.org/10.3390/su14127089
Note that from the first issue of 2016, this journal uses article numbers instead of page numbers. See further details here.