
International Migration Drivers: Economic, Environmental, Social, and Political Effects
by
 , , , and
Aleksy Kwilinski
1,2,3,4,* ,
,
Oleksii Lyulyov
3 ,
,
Tetyana Pimonenko
3 ,
,
Henryk Dzwigol
5, 
Rafis Abazov
6,7 and
and
Denys Pudryk
4 1
Department of Management, Faculty of Applied Sciences, WSB University, 41-300 Dabrowa Gornicza, Poland
2
The London Academy of Science and Business, 120 Baker Street, London W1U 6TU, UK
3
Department of Marketing, Sumy State University, 40007 Sumy, Ukraine
4
Institute for International Cooperation Development, 24-26/1, Kazimierza Wielkiego Street, 61-863 Poznan, Poland
5
Department of Management, Faculty of Organization and Management, Silesian University of Technology, 26–28 Roosevelt Street, 41-800 Zabrze, Poland
6
The Earth Institute, Columbia University, 420 West, 118 Street, New York, NY 10027, USA
7
Kazakh National Agrarian Research University, 8 Abai Avenue, Almaty 050010, Kazakhstan
*
Author to whom correspondence should be addressed.
Sustainability 2022, 14(11), 6413; https://doi.org/10.3390/su14116413
Submission received: 23 February 2022
/
Revised: 29 April 2022
/
Accepted: 18 May 2022
/
Published: 24 May 2022
Abstract
:This paper evaluates the recent trends in international migration and different viewpoints (arguments and counterarguments) on global population movement and examines the impacts of the social, economic, ecological, and political determinants of regional and international migration. The paper aims to analyse and compare the causal relationships between international migration, on the one hand, and economic, ecological, and socio-politic dimensions of EU countries’ development, on the other. The authors consider the impact power of the above-mentioned dimensions on the long-term net migration for the potential candidates to access the EU. First, it identifies and justifies the object of research as the EU countries and the potential EU candidates. Second, the article provides a short literature review as the authors highlight that the EU countries had the highest share of all world migrants, according to the report of the U.N. Population Division. Third, it provides the background of materials collection and methods of the study of the analyses of the panel data for 2000–2018 using the FMOLS and DOLS. Fourth, it presents the results of the study having analysed the different concepts and theories, the authors single out the core economic, ecological, and socio-politic determinants of international migration: wages, unemployment rate, income inequality (measured by the Gini coefficient), corruption, and political stability (measured by World Government Indicators), CO2 emissions and material footprint per capita (measured by Sustainable Development Index). The discussion and conclusion section summarizes the findings of the research and evaluates the structural similarities and differences among the EU countries and potential candidates and if these similarities (or differences) cause them to respond similarly to the economic conditions and changes.
1. Introduction
Considering the UN Agenda 2030 for Sustainable Development (accepted by all EU countries and potential candidates to the EU), the world community determines the reduction of inequalities and improving of wellbeing of labour forces as milestone dimensions for future development. However, despite the economic growth of the EU nation-states, some countries (Bulgaria, Poland, Romania) had a decline of population [1]. In addition, the majority of the EU countries had negative birth rates and positive mortality rates [2], which could hinder reaching Sustainable Development Goals (SDGs). It should be noted that the 2030 Agenda of sustainable development goals (SDGs) highlighted human and intellectual resources as core drivers of social and economic development. The rapid economic development (SDG8) improved quality of life (SDG3) and increased household incomes (SDG1, SDG2), education levels and access to information literacy (SDG4). The improved welfare decreased corruption (SDG14) and mortality, primarily among children (SDG3), and extended green initiatives (SDG7, SDG12, SDG13). This led to rapid increases in new births of younger generations, which is the basis of a country’s economic development. Studies [3,4] highlighted that migration among young generations was a complex issue for developing countries. Young people seek comfortable conditions for self-development and creativity.
The research [5,6,7] has also identified that migration policy depends on a vast range of economic, ecological and social dimensions. Piper N. [8] emphasised that migration policy could influence the achievement of SDGs. Furthermore, another study [9] confirmed that migrants were core to attaining SDGs. However, Mitra R. and Singh P. [10] analysed migration issues and Indian perspectives on achieving SDGs and maintained that internal migration needed more regulation and attention from the government than international migration. Chinese scientists [11] confirmed that migration had a direct negative and an indirect positive impact on achieving SDGs due to economic development. Bas I. [12] highlighted that migration was one of the five significant global risks in attaining SDGs. Migration, especially among refugees, took its toll on all spheres (economic, ecological, and social).
In this case, the EU countries should pursue effective migration policies to attract highly skilled labour as a core force to boost the achievement of SDGs. The phenomenon of international migration, in contrast to such processes as mortality and fertility, is much more complex because it is a multidimensional phenomenon and is explained by various determinants both economic and non-economic.
On the one hand, migrants choose countries with stable political, economic and social development and suitable ecological conditions. On the other hand, the countries with political, economic and social imbalances become donors to developed countries, and in the long term, developing countries are left unable to guarantee the achievement of SDGs. Thus, migration could increase the inequality gaps between developed and developing countries.
The core goal of this paper is twofold: (1) to conduct bibliometric analysis with the purpose of identifying the core patterns in the research on migration policy and (2) to identify the impact of a country’s political, economic, social and environmental development on the net migration in the country.
The paper contains the following sections: Section 1 gives justification of the research; Section 2 overviews the literature and provides the bibliometric analysis to indicate the core determinants of the migration policy; the methodology in Section 3 explains the model and variables used to test the research hypothesis; Section 4 describes and interprets the research results; and Section 5 provides discussion and conclusions with recommendations.
2. Literature Review
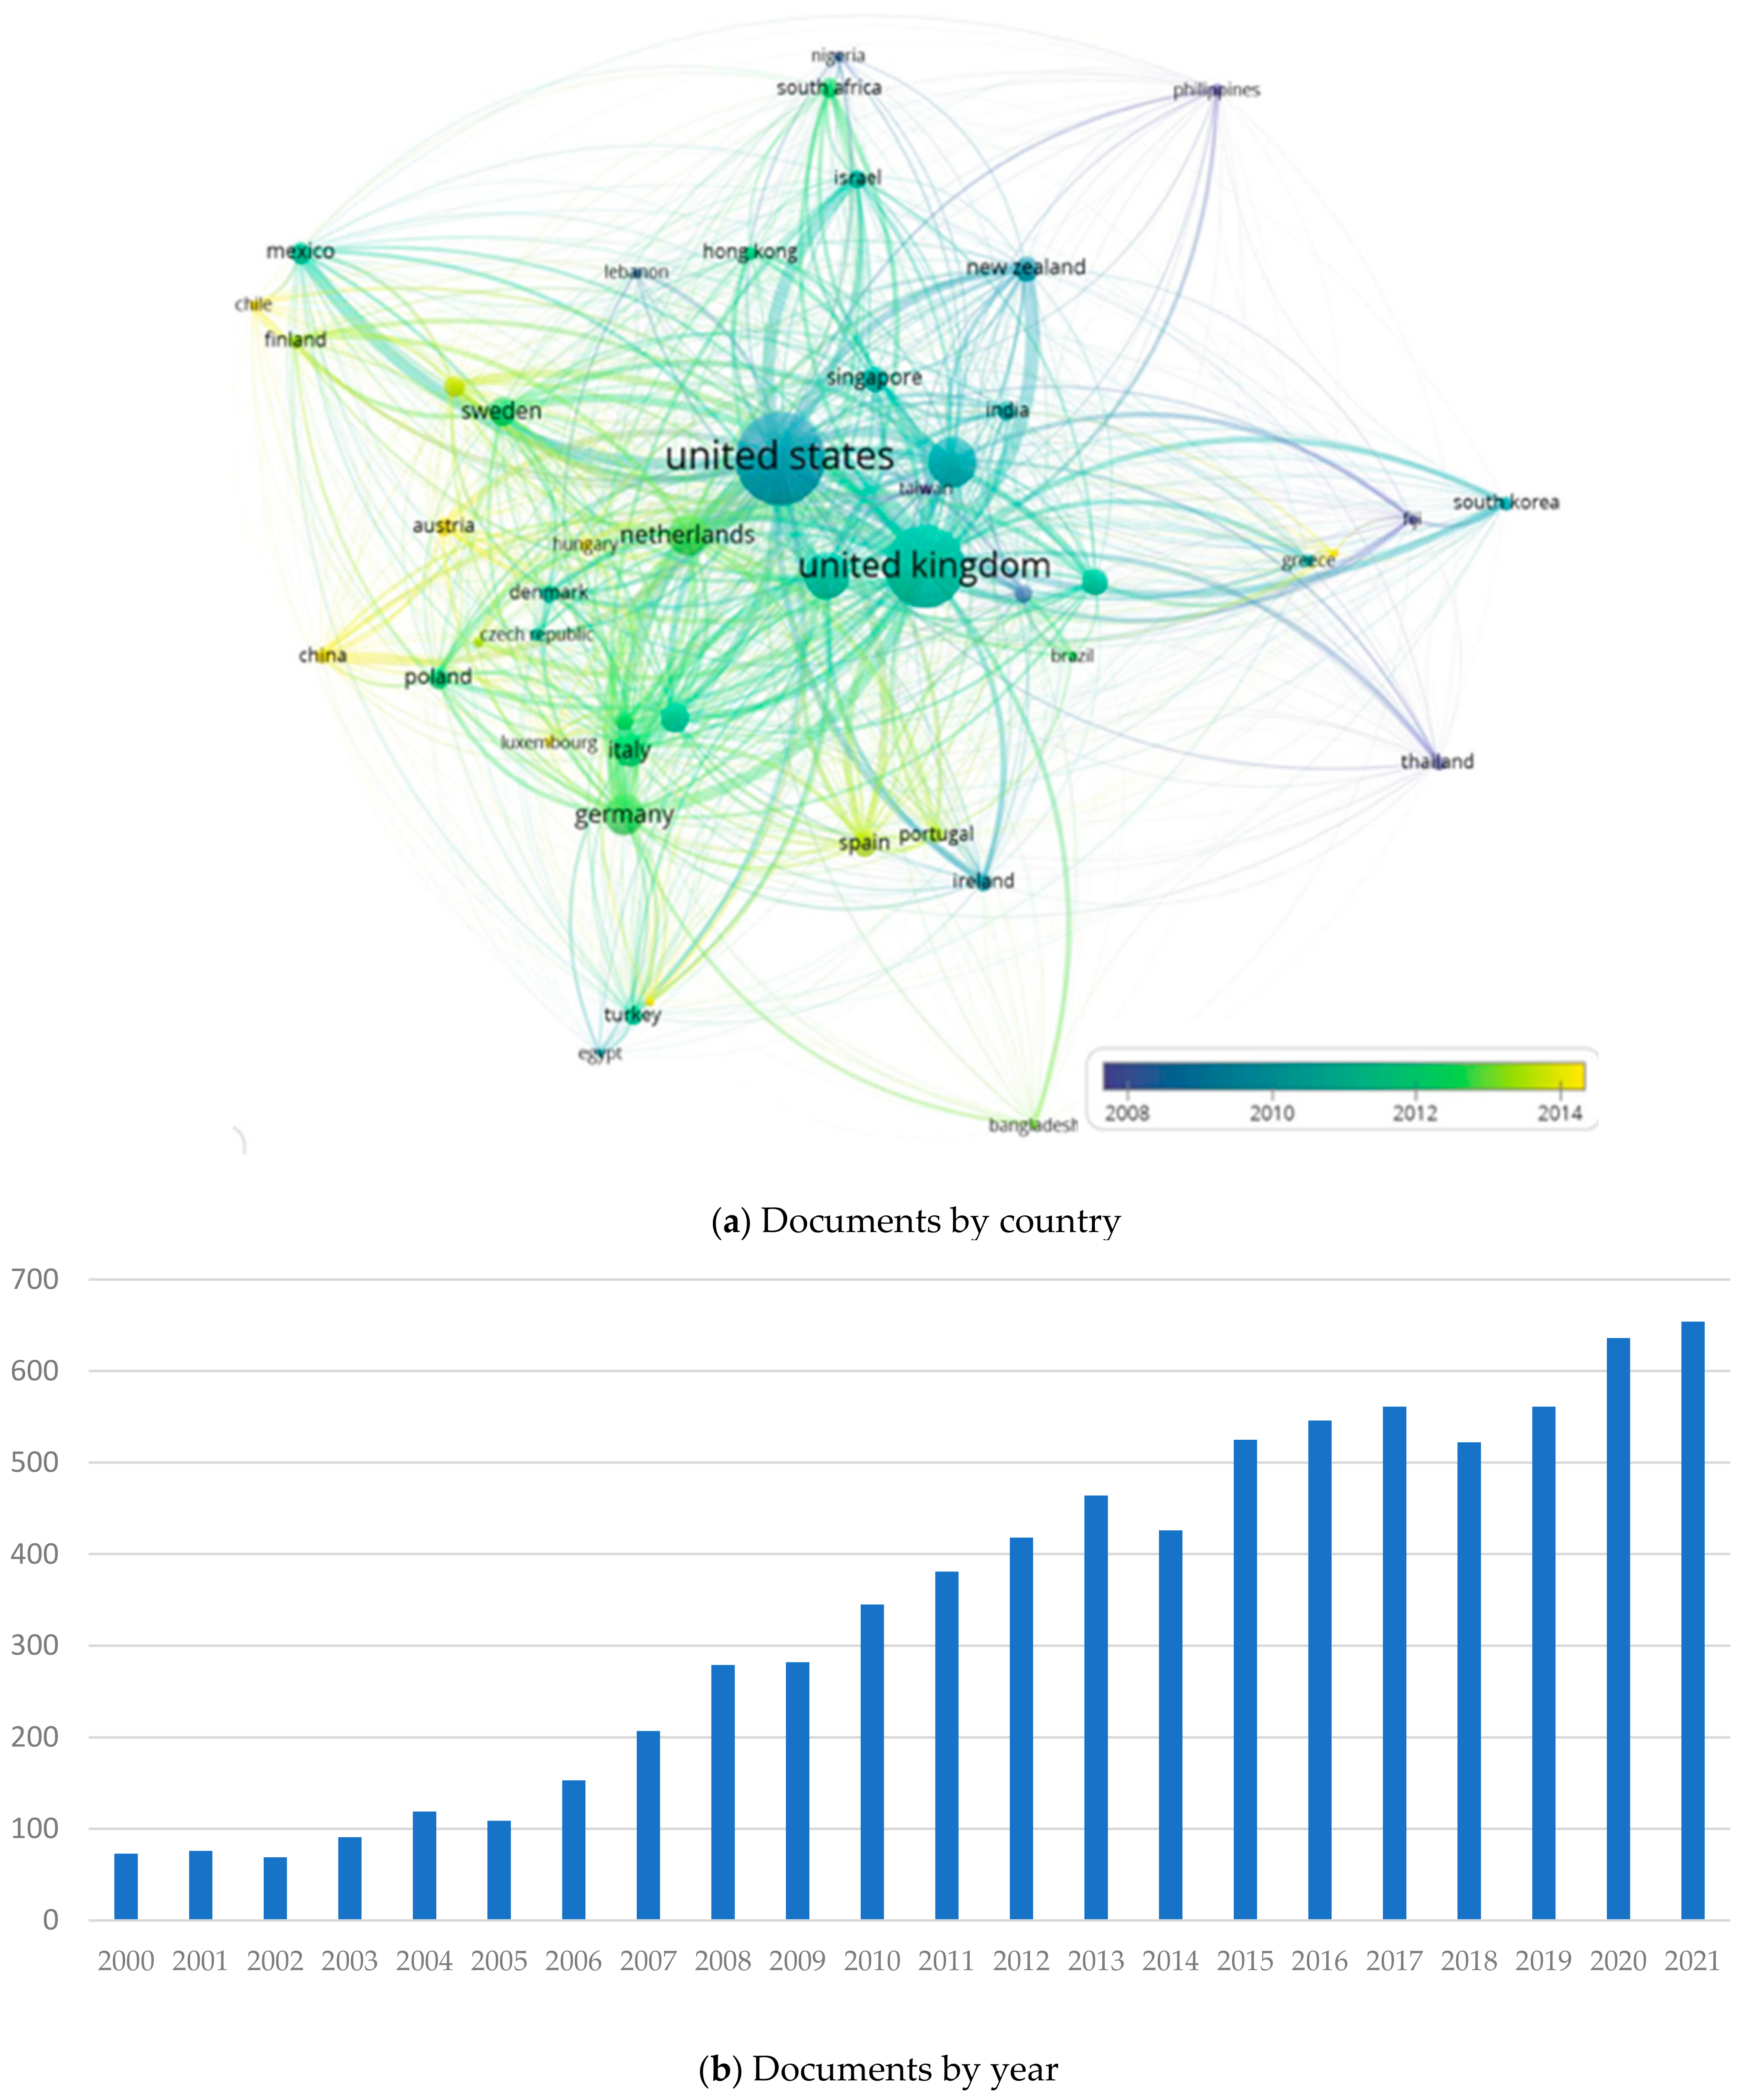
Recent studies indicate that between 2000 and 2021, the number of publications focusing on international migration increased dramatically. For example, authors affiliated with institutions in the EU and the USA published the largest share of the documents indexed in Scopus. One study [13] generalises the scientific background of migration issues and determines the current gaps; it confirms that issues related to regional and international migration were researched intensively in those countries. Since 2014, migration issues have been investigated by scientists from China, Australia, Chile, Spain, Finland and Portugal (Figure 1a). The Scopus scientific databases indexed 7 497 scientific documents on international migration (Figure 1b), and the number of documents has been increasing annually. The average annual growth rate of publications is 120%, which means that on average the growth accounted for 20% per year.
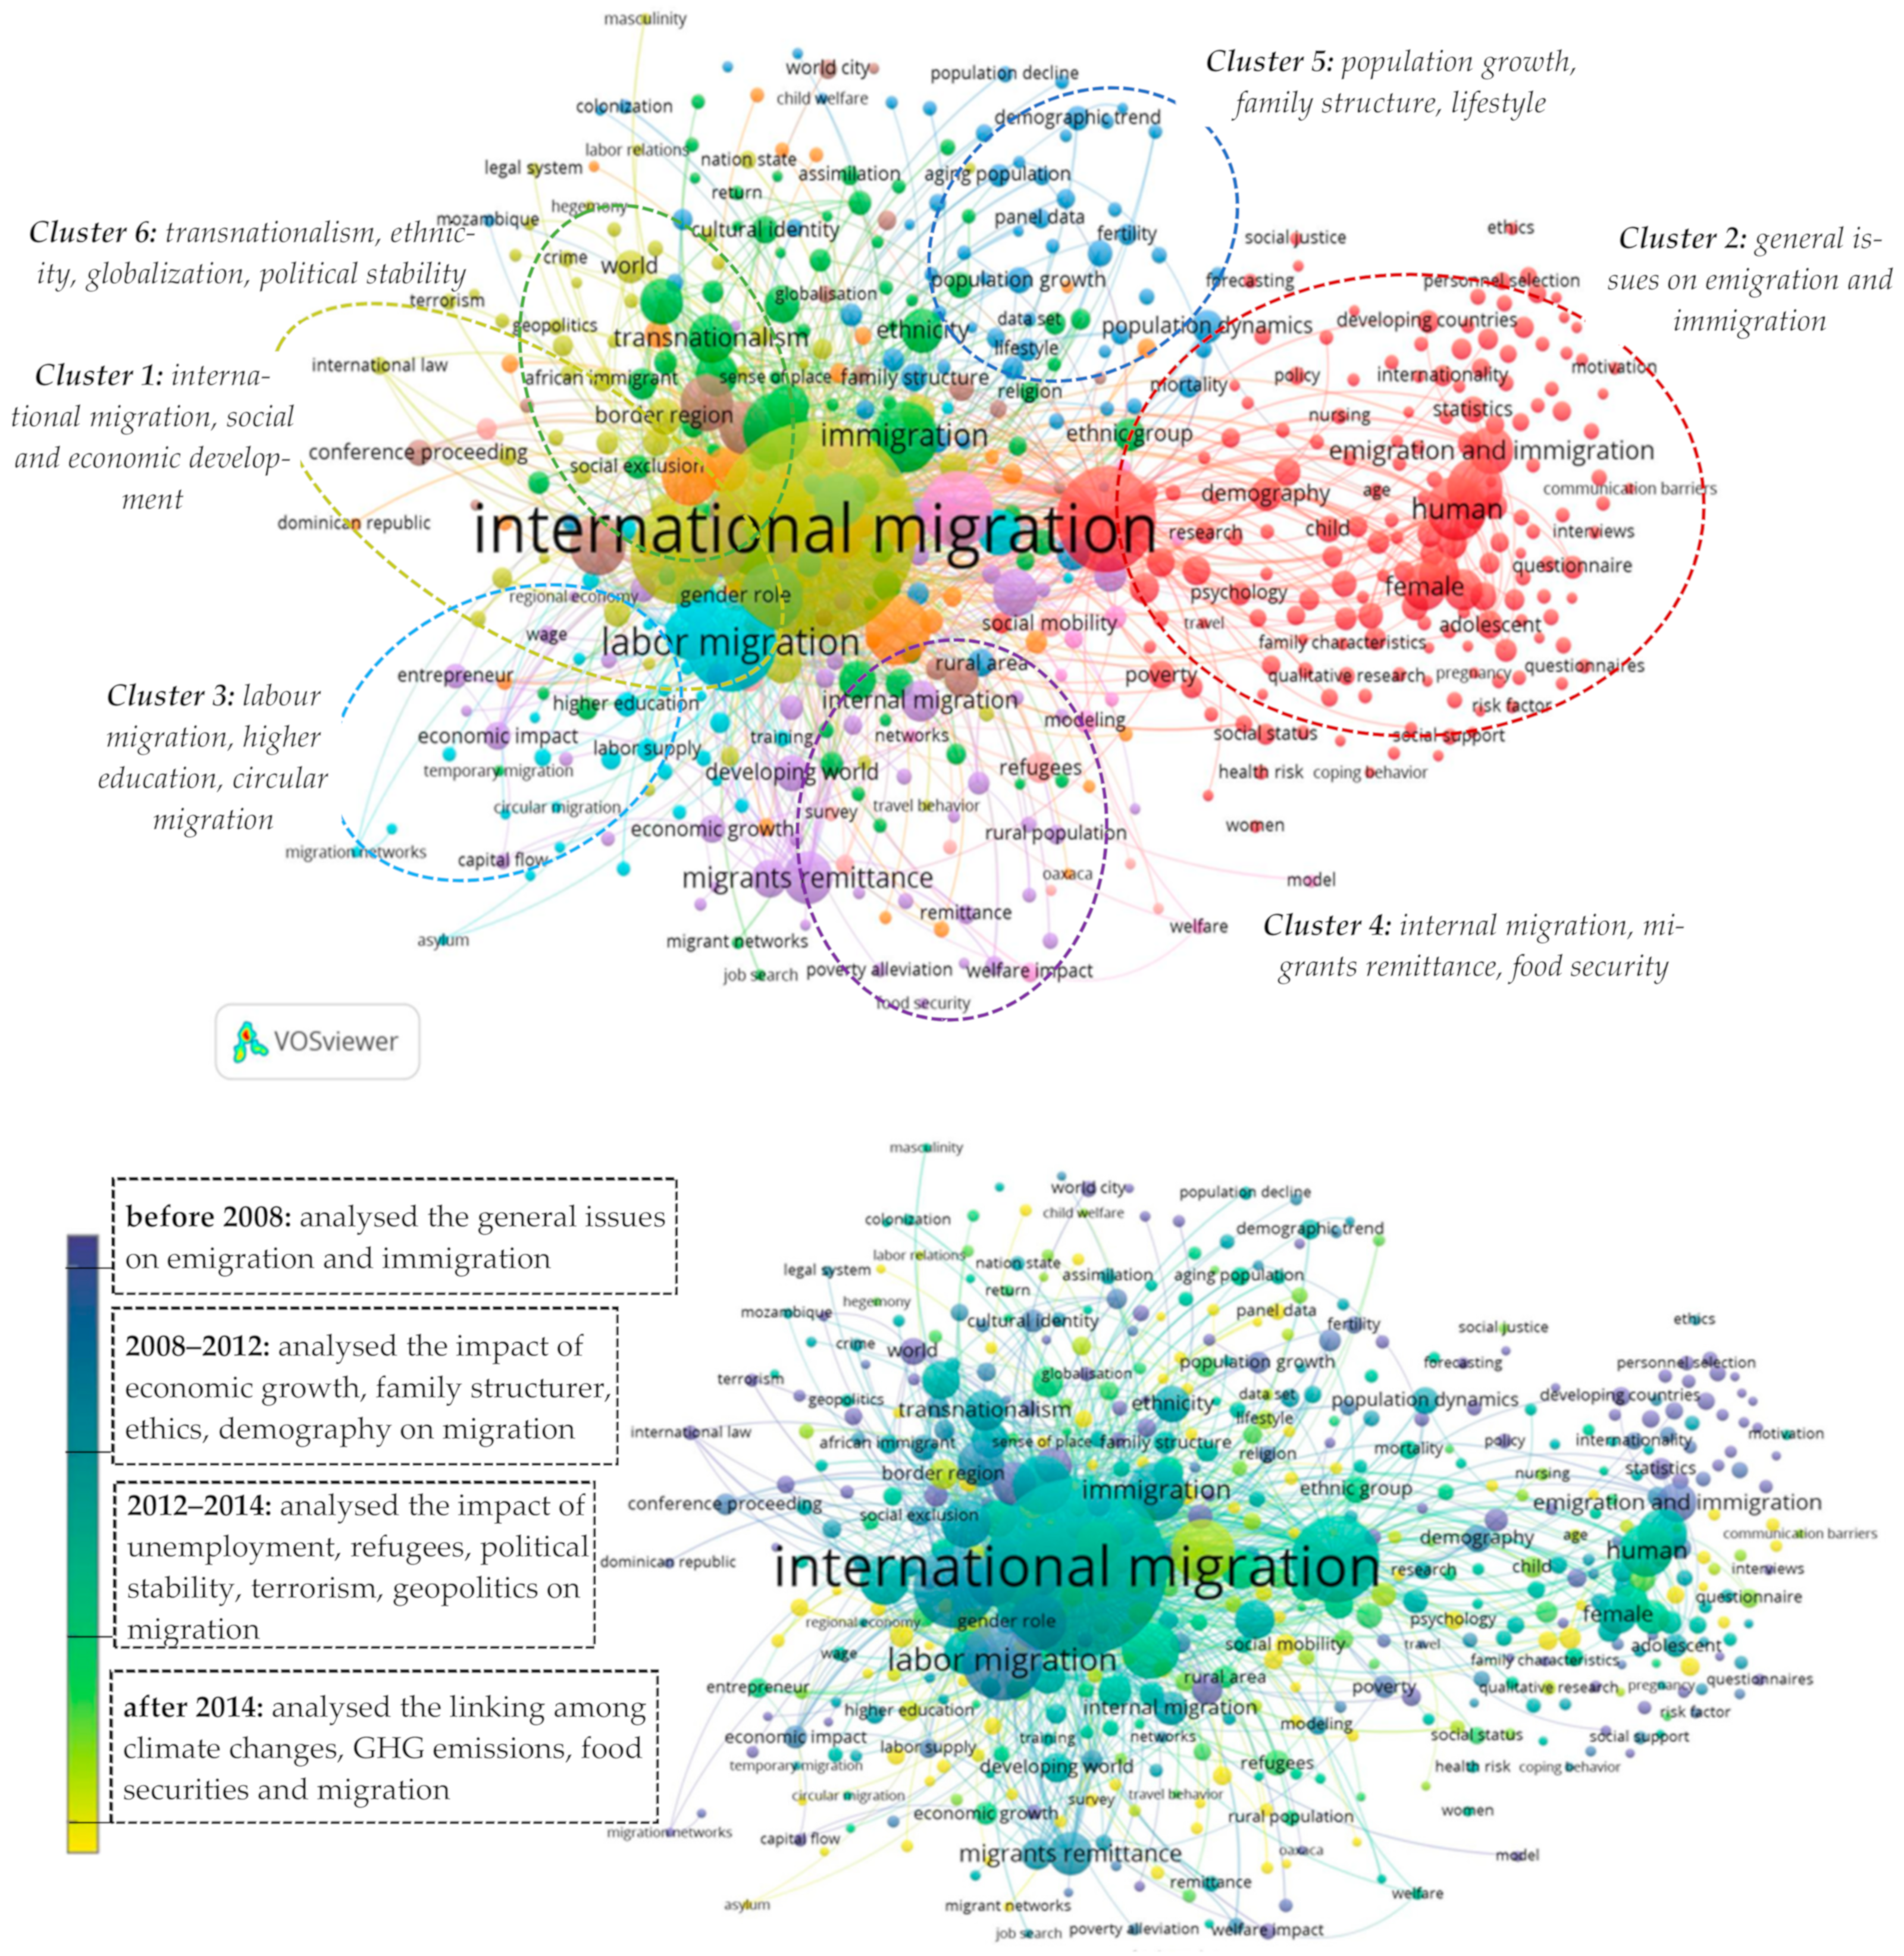
Findings of the bibliometric analysis (Figure 2) allowed determining 6 clusters and 4 evolution stages of economic research on migration process. The largest cluster in the figure (yellow) focuses on analysing international migration and social and economic development.
Refs. [14,15,16,17,18,19,20,21,22,23,24,25,26,27] confirm a statistically significant impact of Industry 4.0 on social development and migration. In [28], the authors indicate that an increase in a country’s market attractiveness leads to the decline of migration from such countries. The authors in the red cluster analyse the general issues relating to immigration and emigration. Durand J. and Massey D. S. [29], Roland B., Rubens A. and Eberle P. [30] highlight contradictions between the migration policies in destination countries and immigration in practice. At the same time, authors of another paper [31] study the impact of bilateral migration on the causes of military conflicts among countries. The third cluster, in blue, focuses on the analysis of the links between education and labour migration. In [27], the authors study the education impacts of the migration of Chinese and Indian students to Australia and highlight the positive impacts of migration on the number of highly qualified human resources in Australia. The impact of migration on youth unemployment and economic growth is studied by Narayan S. [28,32]. The gender aspects of international migration among students are analysed by Gunja S. and King R. [33]. Melitz J. and Toubal F. [34] research the language impacts on trade relations involving migration, applying the determinants of affinity and knowledge of one of the languages used by the migrants and indigenous people. The scientists use the gravity model and identify positive impacts for migrants’ product loyalty related to overcoming linguistic barriers and costs, thus emphasising the importance of the linguistic variables [34]. The green cluster focuses on the relationships among economic growth, globalization, political stability and migration. Strielkowski W., Nagy Z., Bilan Yu., Kharazishvili Y. and their co-authors [35,36,37,38,39] study the consequences of population outflow for the macroeconomic stability of countries. The scientists apply a regression model with such variables as: current account balances, foreign direct investment, migrant remittances, minimum wage, time and error. Their findings confirm the statistically significant relationship among macroeconomic indicators of the countries analysed and migrants’ remittances. The authors also note the vital role of the minimum wage of a country in its population’s decisions to emigrate to another country. Similar conclusions were reached in [40,41,42,43,44,45,46,47,48,49,50,51].
Based on the findings in Figure 2, authors analysed the general aspects of migration before 2008. After the period of 2008–2012, the papers focus on estimating the impacts of economic growth, family structure, ethics and demography on migration. The next stage of research is the links among unemployment, refugees, political stability, terrorism and migration (2012–2014). After 2014, authors analyse the casual relationships among climate change, GHG emissions, food security and migration. The findings confirm that migration is a complex process affected by numerous social, ecological, economic and political determinants.
At the same time, scientists have used different indicators (dependent, independent and control variables) and models to check the links among determinants and migration. Table 1 compiles the approaches to defining the determinants of migration.
Umit G. and Yaliniz M. [6] and Harshad D. [7] focus on analysing labour migration’s impacts on the economic development of the EU-15 countries. The primary negative impact is social service systems exhausted by the increased numbers of migrants workers in the EU-15 countries. In “Migration and Development: Dissecting the Anatomy of the Mobility Transition” [62], the authors highlight and prove a U-shaped relationship between migration and economic development. First, emigration increases, and then decreases when economic growth begins in the home country. Borjas G. [5] underlines that migration had a positive impact on economic development if the share of highly qualified workers was significant, and Jover J. and Díaz-Parra I. [63] maintained that migration could be the core force in gentrification, boosted cities’ tourism and economic development.
Along with the economic dimensions and determinants which manage migration flows, migration depends on natural and man-made factors [64]. In a study of OECD countries, ref. [65] confirmed that migration of highly educated labour had significant impacts on countries’ competitiveness and economic development: Talent migration was estimated using the Fragile States Index of The Human Flight and Brain Drain indicator and the brain gain sub-index of the Global Talent Competitiveness Index, and the empirical findings confirmed that talent migration influenced the macroeconomic indicators more than the social development indicators. The panel data of 35 developed cities in China [66] were analysed for the impacts of air pollution on foreign university student populations. They applied the OLS and 2SLS model to check the hypothesis for 10 years (from 2006 till 2016). The findings confirmed that the increase in air pollution led to a decline in foreign student bodies at Chinese universities. In this case, the government policy on regulating air pollution was the core element in attracting the foreign talented migrants. A similar conclusion was reached by Germani A., Scaramozzino P., Castaldo A. and Talamo G. [67], who confirmed that along with a vast range of other factors, ecological indicators also impacted on migration [68]. The authors applied panel threshold model regression to check the relationship between shares of emigrants in the population structure, urbanization and carbon dioxide emissions. The findings [68] confirmed that emigrants did not have statistically significant impacts on the relationships between urbanization and carbon dioxide emissions. It should be noted that the studies [69,70,71,72,73,74,75] confirmed the necessity of considering ecological indicators in developing countries’ policies for future development, involving migration policy.
The findings in [57] prove that political stability influences migration, but [55] confirms that political stability and migration are neutral to each other. At the same time, the conclusions in [76] confirm the negative impacts of migration on economic development.
Despite the powerful scientific background in investigating migration issues, a vast body of the literature focuses on analysing core dimensions (economic, ecological, and social) separately but not together. Separate, few investigators have analysed the Eastern bloc countries under the EU integration process. Furthermore, the literature review confirms that political determinants were not analysed in the research on migration processes. It should be noted that for Eastern bloc countries, political dimensions play the key role in the EU integration process and in the regulation of migration policy. In this case, it is topical to analyse the impacts of a country’s political, economic, social, and environmental development on the migration in the country.
Based on the results of analysis, the study aims to check the following hypothesis: the levels of a country’s political (H1), economic (H2), social (H3), and environmental (H4) development have effects on the net migrants in the country.
3. Materials and Methods
This study aimed to analyse the causal relationships between net migration and economic, social, political, and ecological determinants. Table 2 contains the variables for the analysis.
At the first stage, the authors performed the panel unit root test using Im, Pesaran, and Shin’s test [77]:
where takes the meaning of parameter migration and economic, social, ecological, and political determinants of the country development; is the first difference operator; = 0 for all i—the null hypothesis; and < 0 for at least one i—alternative hypothesis non-existent of a unit root.

Table 2.
Variables for the analysis (Source: developed by the authors).
| Variable | Indicator | Source |
|---|---|---|
| Net migration | Mig | Eurostat [78] |
| Indicators of the economic development | ||
| GDP per capita | GDP | World Development Indicators [79] |
| GNI per capita | GNI | |
| Indicators of the social development | ||
| Unemployment | Un | World Development Indicators [79] |
| Gross Average Monthly Wages by Indicator, Country and Year | Wag | |
| Indicators of the ecological development | ||
| CO2 per capita | CO2 | Sustainable Development Index [80] |
| Material Footprint per capita | FP | |
| Indicators of political levels of countries’ development | ||
| Control of Corruption | CC | World Government Indicators [81] |
| Political Stability and Absence of Violence/Terrorism | PS | |
Based on the empirical findings in [82], the authors used the long-run relationship model with panel cointegration technique [83]:
where α, β, γ, δ, θ, ρ, and ζ are the regression-evaluated parameters; Mig is net migration; indicators of the economic (GDP per capita (GDP), GNI per capita (GNI)), social (Unemployment (Un), Gross Average Monthly Wages by Indicator, Country and Year (Wag)), ecological (CO2 per capita (CO2); Material Footprint per capita (FP)) and political levels of countries’ development (Control of Corruption (CC), Political Stability and Absence of Violence/Terrorism (PS) using the data; μ is the error term; I = 1, …, N; t = 1,…, T.
Equation (2) allowed for checking the collinearity among data using the variance inflation factor (VIF). VIF indicated the impact of the regression coefficient on the standard error for each independent variable (how the standard error compares if this variable is uncorrelated with all other independent variables in the regression model). Individual VIFs are more significant than the total and the mean VIF. The scientist determined the following VIF thresholds: 10 and 20–40. Considering [84], this study used the threshold 10, meaning that if the VIF is less than 10, Equation (2) could be modified through eliminating the most strongly correlated factors.
At the next step, considering the papers by Pedroni [85,86], the authors checked the stability of the relationship between migration and the selected determinants using the Fully Modified OLS (FMOLS) and Dynamic OLS (DOLS) panel cointegration techniques. The authors checked the statistical hypothesis for Granger causality with the purpose of analysing the causal effects and functional ratio times series. That test allowed for estimating if one time series could forecast the other time series [87]. That test was based on solving the linear heterogeneous model:
where , , and indicate constant term, lag parameter and coefficient slope and and are times series.
The historical background of the Eastern bloc’s isolation from a free-market economy and a totalitarian political regime has had significant impacts on the current migration trends. The researchers analysed the panel data for 8 EU countries (Czech Republic, Estonia, Latvia, Lithuania, Hungary, Poland, Slovenia, Slovakia) and two countries in Eastern Europe (Moldova, Ukraine). Incorporating Moldova and Ukraine into the analysis was justified by two characteristics they shared with the developing EU countries (Latvia, Lithuania, Estonia): in the political arena, in 1990–1992, those countries started their political transformation from rejecting the Communist Party’s monopoly power; and in the economic arena, they executed the transition from centralized management to a market economy. Noting that Czech Republic, Estonia, Latvia, Lithuania, Hungary, Poland, Slovenia and Slovakia were accepted to the EU in 2004, the common European policies (economic, political, social, migration, etc.), supporting exports, attracting foreign direct investment, developing internal consumption and other European mechanisms triggered their economic development. Additionally, the Ukrainian and Moldavian governments declared that the EU integration should become the priority goal. Furthermore, all selected countries have the common geopolitical location.
4. Results
Table 3 shows the descriptive statistics (mean, standard deviation, and coefficient) for the variables selected for model (2). The annual dataset for the two groups of countries was obtained from the World Data Bank and Eurostat from 2000 to 2018. The number of observations for the EU countries (Model A) accounts for 152, and the number of post-Soviet countries (Model B) is 38.
The EU countries have better results compared with Ukraine and Moldova on all economic, social, ecological and political indicators. The average GDP, GNI and wages for Czech Republic, Estonia, Latvia, Lithuania, Hungary, Poland, Slovenia and Slovakia are five times higher than those for Moldova and Ukraine and 1.3 times higher than those for the UN. Furthermore, the indicators of the political efficiency of the EU countries had positive values which confirmed the strong governance performance for those countries. At the same time, a variation coefficient of more than 25% reflects variability and continual reformation in the countries under study.
The correlation matrix and variance inflation factors (VIFs) allowed for identifying the collinearity among the selected variables for both groups (A) and (B) (Table 4).
The findings in Table 4 confirmed that the following indicators had values higher than 10: for panel (A)—GDP (27.12), GNI (33.99), Wag (20.35); for panel (B)—GDP (72.44), GNI (33.73), Wag (30.98). The findings indicated that the factors with the strongest correlations should be eliminated. The re-specification of regression models (Equation (2)) with the removal of highly correlated variables allowed for eliminating the collinearity among the variables (Table 5).
The findings in Table 5 showed that the highest VIF was 3.85 for all re-specifications of the regression model. It was less than 10 and allowed for re-specification of the regression models used for estimating the cointegrating relationship. Table 6 shows the findings and the panel unit root tests for all chosen parameters of Formula (2).
The findings of the LLC test confirm that Mig, UN, and PS remained stationary for the EU countries, whereas for Ukraine and Moldova, only PS had stationarity. At the same time, the check of the first difference for all indicators of all countries was integrated to exclude the null hypothesis of non-stationarity. The findings were statistically significant at 1 and 5%. The results for the panel Pedroni cointegration tests (Panel PP, Panel ADF, Group PP and Group ADF statistics) are reported in Table 7.
The findings in Table 7 for the EU countries prove cointegration among variables at 5% level, as six among eleven indicators (within-dimension—panel PP-statistic, panel ADF-statistic, panel PP-statistic (weighted statistic), panel ADF-statistic (weighted statistic) reject the non-existence of the cointegration. This allowed for concluding that variables cointegrate and have the long-run relationship for one group of countries and for each element of panel data. The empirical data in Table 8 on the Kao panel cointegration tests have statistically significant values at 1%, which allows for rejecting a null hypothesis about non-cointegration.
The Pedroni panel cointegration tests (Table 7) and Kao panel cointegration tests (Table 8) allow for confirming the long-run cointegration among variables for the (B) group countries. The findings of FMOLS and DOLS are showed in Table 9. For the EU countries, GDP, GNI, UN, Wag, and CO2 have statistically significant impacts on migration in the FMOLS model at levels 1–10%. In the DOLS model, only indicators UN and CO2 have a statistically significant impact at 1%. The determination coefficient for both models was more than 60% (FMOLS—67%, DOLS—65%). The empirical results prove the theoretical model and have positive impacts on GDP and migration in both groups of countries: For the EU countries, an increase of GDP per capita increased migration by 0.08%, and the increase in group (B) countries was 0.40%.
Increases in UN also had positive, statistically significant impacts on Mig for the EU countries, justifying the EU policy on the free movement of goods, services, people and capital. The Schengen zone had a positive impact through cancelling the border controls: An increase in UN of 1% led to the outflow of workers-migrants. This provoked a decline of Mig by 0.17% for FMOLS and by 0.24% for DOLS. The findings from the Dumitrescu-Hurlin Granger causality test (Table 10) prove the non-existing causality from Mig and economic, political, ecological and social indicators, excluding CO2 for group (B) countries. In this case, there was no unidirectional causality from Mig to CO2. The findings of non-causality confirm that it did not allow using sufficient instruments for migration regulation.
The findings from the Dumitrescu-Hurlin Granger causality test (Table 10) for the EU countries prove the unidirectional causality from Wag to Mig, Mig to GDP, and Mig to UN. Despite a large number of established institutions and regulations, there is still a lack of new regulations and unambiguous decisions regarding dependencies and regulation of migration flows and processes of countries’ economic, social and environmental development.
5. Discussion and Conclusions
Our study suggests that international migration becomes an increasingly complex process which leads to population redistribution among countries and entails social and economic changes. One of the important factors is that developed countries face such serious issues as ageing and steep shrinking of the domestic labour market, while less developed countries face rapid overcrowding of the internal labour market. Those tendencies accelerate international migration flows and provoke growing instability in the migration process. Yet, many scholars fiercely debate if the increasing number of migrants leads to the positive or negative transformation of the social and economic and even environmental conditions of the populations in the receiving countries. The empirical results confirm the causal relationships between net migrants and countries’ economic, social, political and ecological development, and scholars [5,6,7,52] have similarly found that economic development impact on the migration process. However, researchers vary in interpreting those results. For example, Özden Ç., Christopher R. P., Maurice S. and Terrie L. W. suggest that migration has a statistically significant negative impact on economic growth. Furthermore, Fong E., Shibuya K., and Chen X. conclude that governments should stabilise their political climates first in order to attract talented foreign migrants. However, Shin G. empirically validates that political stability and migration are neutral to each other. Yet, all those scholars agree that international migration drives economic, social, and political developments, and that migration—if properly managed, stimulated, and regulated—could become a key factor for achieving the following goals (UN Agenda 2030):
- Goal 8 “Decent Work and Economic Growth” (creating new jobs, declining unemployment rate, increasing average wages, etc.);
- Goal 10 “Reduced Inequality” (decreasing inequality in all spheres);
- Goal 13 “Climate Action” (diminishing CO2 emissions, improving education on climate mitigation’s ways and etc.);
- Goal 16 “Peace, Justice and Strong Institutions” (declining corruption, developing transparent institutions, etc.).
Thus, as labour forces (which could be enlarged by attracting high-skilled migrants from some parts of the world to other regions) are a crucial determinant in achieving SDGs, the unequal distribution of labour leads to gaps in SDG achievement among developed and developing countries. In this case, the developed and developing countries should find the ways to provide convergent migration policies with the purpose of reducing the inequality gaps for highly skilled workforces. It allows for successful achievement of the SDGs by both developed and developing countries.
Despite the actual findings on the causal relationships between international migration on the one hand and economic, ecological and socio-political dimensions of the EU countries’ development on the other, this study had few limitations. International migration is an increasingly complex process that depends on a vast range of traditional and emerging causes and that generates both new opportunities and challenges. In this case, all countries focused on minimising challenges and using the new opportunities caused by migration to their benefit. In future studies of migration, scholars should use the extended list of the variables (urbanization, disaster damage, political freedom, intensive land use, religiousness, human rights, education, willingness to migrate, health challenges, etc.) in order for identifying more relevant and significant causal relationships, which could be the basis for developing relevant instruments for effectively regulating migration under the rubric of achieving SDGs.
Author Contributions
Conceptualization, A.K., O.L., T.P., H.D., R.A. and D.P.; methodology, A.K., O.L., T.P., H.D., R.A. and D.P.; software, A.K., O.L., T.P., H.D., R.A. and D.P.; validation, A.K., O.L., T.P., H.D., R.A. and D.P.; formal analysis, A.K., O.L., T.P., H.D., R.A. and D.P.; investigation, A.K., O.L., T.P., H.D., R.A. and D.P.; resources, A.K., O.L., T.P., H.D., R.A. and D.P.; data curation, A.K., O.L., T.P., H.D., R.A. and D.P.; writing—original draft preparation, A.K., O.L., T.P., H.D., R.A. and D.P.; writing—review and editing, A.K., O.L., T.P., H.D., R.A. and D.P.; visualization, A.K., O.L., T.P., H.D., R.A. and D.P.; supervision, A.K., O.L., T.P., H.D., R.A. and D.P.; project administration, A.K., O.L., T.P., H.D., R.A. and D.P.; funding acquisition, A.K., O.L., T.P., H.D., R.A. and D.P. All authors have read and agreed to the published version of the manuscript.
Funding
This research was funded by the grants from the Ministry of Education and Science of Ukraine (No. 0121U100468).
Institutional Review Board Statement
Not applicable.
Informed Consent Statement
Not applicable.
Data Availability Statement
Not applicable.
Acknowledgments
The authors are very grateful to the anonymous referees for their helpful comments and constructive suggestions.
Conflicts of Interest
The authors declare no conflict of interest.
References
- International Migrant Stock 2019: Wall Chart. Available online: https://reliefweb.int/report/world/international-migrant-stock-2019-wall-chart (accessed on 12 December 2021).
- Database Eurostat. Available online: https://ec.europa.eu/eurostat/data/database (accessed on 6 January 2022).
- Westin, C. Young people of migrant origin in Sweden. Int. Migr. Rev. 2003, 37, 987–1010. [Google Scholar] [CrossRef]
- Suciu, M.C.; Florea, C.A. An empirical study on the migration among young skilled and creative people. Amfiteatru Econ. J. 2017, 19, 727–741. [Google Scholar]
- Borjas, G.J. Immigration and Economic Growth (No. w25836). National Bureau of Economic Research, 2019. Available online: https://www.nber.org/system/files/working_papers/w25836/w25836.pdf (accessed on 3 February 2022).
- Umit, G.; Yaliniz, M. Immigration and Economic Growth in Europe and Their Spatial Allocation. Actual Probl. Econ. 2013, 150, 373–380. [Google Scholar]
- Harshad, D. Elementary investigation on Division of Labour—Part 2. Financ. Mark. Inst. Risks 2018, 2, 39–56. [Google Scholar] [CrossRef]
- Piper, N. Migration and the SDGs. Glob. Soc. Policy 2017, 17, 231–238. [Google Scholar] [CrossRef]
- Tulloch, O.; Machingura, F.; Melamed, C. Health, Migration and the 2030 Agenda for Sustainable Development. 2016. Available online: https://www.sloga-platform.org/wp-content/uploads/2020/06/Migration-and-the-2030-Agenda-for-Sustainable-Development.pdf#page=27 (accessed on 22 March 2022).
- Mitra, R.; Singh, P. SDG implementation: A policy analysis of internal migration in India. In Sustainable Development Goals and Migration; Routledge: New Delhi, India, 2021; pp. 68–83. [Google Scholar]
- Pan, Y.; Zhu, J.; Zhao, Z.; Li, Z.; Wu, J. The dual effects of population migration on the achievement of sustainable development goals in Tibet, China. Environ. Dev. Sustain. 2022, 3, 1–17. [Google Scholar] [CrossRef]
- Bas, İ.M. The Sustainable Development Goals (SDGs) and Migrants/Migration. In Refugee Crisis in International Policy—Volume III; Transnational Press: London, UK, 2022; pp. 59–75. [Google Scholar]
- Faggian, A.; Rajbhandari, I.; Dotzel, K.R. The interregional migration of human capital and its regional consequences: A review. Reg. Stud. 2017, 51, 128–143. [Google Scholar] [CrossRef]
- Calcagnini, G.; Marin, G.; Perugini, F. Labour flexibility, internal migration and productivity in Italian regions. Struct. Change Econ. Dyn. 2021, 57, 308–320. [Google Scholar] [CrossRef]
- Bilan, Y.; Rubanov, P.; Vasilyeva, T.; Lyeonov, S. The Influence of Industry 4.0 on Financial Services: Determinants of Alternative Finance Development. [Wpływ przemysłu 4.0 na usługi finansowe: Determinanty rozwoju alternatywnych finansów]. Pol. J. Manag. Stud. 2019, 19, 70–93. [Google Scholar] [CrossRef]
- Brimah, B.A.; Wahid, D.O.; Ayodeji, G.B.; Musa, I. Knowledge Management and its Effects on Financial Performance: Evidence from Dangote Flour Mills, Ilorin. Financ. Mark. Inst. Risks 2020, 4, 34–42. [Google Scholar] [CrossRef]
- Dzwigol, H.; Dzwigol–Barosz, M.; Kwilinski, A. Formation of Global Competitive Enterprise Environment Based on Industry 4.0 Concept. Int. J. Entrep. 2020, 24, 1–5. [Google Scholar]
- Dzwigol, H.; Dzwigol-Barosz, M.; Miskiewicz, R.; Kwilinski, A. Manager Competency Assessment Model in the Conditions of Industry 4.0. Entrep. Sustain. Issues 2020, 7, 2630–2644. [Google Scholar] [CrossRef]
- Dzwigol, H.; Dzwigol-Barosz, M. Sustainable Development of the Company on the Basis of Expert Assessment of the Investment Strategy. Acad. Strateg. Manag. J. 2020, 19, 1–7. [Google Scholar]
- Kuzior, A.; Kwilinski, A.; Tkachenko, T. Sustainable Development of Organizations Based on the Combinatorial Model of Artificial Intelligence. Entrep. Sustain. 2019, 7, 1353–1376. [Google Scholar] [CrossRef]
- Kuzior, A.; Kwilinski, A.; Tkachenko, T. Transparent Cognitive Technologies to Ensure Sustainable Society Development. J. Secur. Sustain. Issues 2019, 9, 561–570. [Google Scholar] [CrossRef]
- Tkachenko, V.; Kwilinski, A.; Klymchuk, M.; Tkachenko, I. The Economic-Mathematical Development of Buildings Construction Model Optimization on the Basis of Digital Economy. Manag. Syst. Prod. Eng. 2019, 27, 119–123. [Google Scholar] [CrossRef] [Green Version]
- Kwilinski, A.; Volynets, R.; Berdnik, I.; Holovko, M.; Berzin, P. E-Commerce: Concept and Legal Regulation in Modern Economic Conditions. J. Leg. Ethical Regul. Issues 2019, 22, 1–6. [Google Scholar]
- Miśkiewicz, R.; Wolniak, R. Practical Application of the Industry 4.0 Concept in a Steel Company. Sustainability 2020, 12, 5776. [Google Scholar] [CrossRef]
- Saługa, P.W.; Szczepańska-Woszczyna, K.; Miśkiewicz, R.; Chłąd, M. Cost of Equity of Coal-Fired Power Generation Projects in Poland: Its Importance for the Management of Decision-Making Process. Energies 2020, 13, 4833. [Google Scholar] [CrossRef]
- Key Migration Terms. International Organization for Migration. Available online: https://www.iom.int/key-migration-terms (accessed on 3 February 2022).
- George, T.; Hugo, G. The Transnational Migration Strategies of Chinese and Indian Students in Australia. Popul. Space Place 2017, 23, e2038. [Google Scholar] [CrossRef] [Green Version]
- Bondarenko, A.; Zakharkina, L.; Syhyda, L.; Saher, L. The Economic and Marketing Attractiveness of Countries: Measurement and Positioning in Terms of Economic Security. Int. J. Sustain. Dev. Plan. 2020, 15, 439–449. [Google Scholar] [CrossRef]
- Durand, J.; Douglas, S.M. Debacles on the Border: Five Decades of Fact-Free Immigration Policy. ANNALS Am. Acad. Polit. Soc. Sci. 2019, 684, 6–20. [Google Scholar] [CrossRef]
- Roland, B.; Rubens, A.; Eberle, P. Soft Skills and Job Opportunities of Migrants: Systemic Relationships in the Labour Market. Bus. Ethics Leadersh. 2017, 1, 5–21. [Google Scholar] [CrossRef]
- Docquier, F.; Ruyssen, I.; Schiff, M.W. International Migration: Pacifier or Trigger for Military Conflicts? J. Dev. Stud. 2017, 54, 1657–1679. [Google Scholar] [CrossRef]
- Narayan, S.S. Population Growths and Socio-Economic Development: An Analysis of Mettu Town of Ethiopia. SocioEcon. Chall. 2019, 3, 52–63. [Google Scholar] [CrossRef]
- Gunja, S.; King, R. Gendering International Student Migration: An Indian Case-Study. J. Ethn. Migr. Stud. 2017, 43, 1308–1324. [Google Scholar] [CrossRef]
- Melitz, J.; Toubal, F. Native Language, Spoken Language, Translation and Trade. J. Int. Econ. 2014, 93, 351–363. [Google Scholar] [CrossRef] [Green Version]
- Gordon, R.; Strielkowski, W.; Yu, B.; Yu, T. Migrant Remittances and Their Impact on the Economic Development of the Baltic States. Geogr. Pannonica 2018, 22, 165–175. [Google Scholar] [CrossRef]
- Bilan, Y.; Strielkowski, W. Migration in Post-Transition Economies: Immigration Surplus in Visegrad Group Countries. Int. J. Trade Glob. Mark. 2016, 9, 182. [Google Scholar] [CrossRef]
- Heidi, L.T. International Migration and FDI: Can Migrant Networks Foster Investments toward Origin Countries? Honor. Proj. 2019, 141. Available online: https://digitalcommons.iwu.edu/econ_honproj/141 (accessed on 3 January 2022).
- Dalevska, N.; Khobta, V.; Kwilinski, A.; Kravchenko, S. A Model for Estimating Social and Economic Indicators of Sustainable Development. Entrep. Sustain. Issues 2019, 6, 1839–1860. [Google Scholar] [CrossRef]
- Kharazishvili, Y.; Grishnova, O.; Kamińska, B. Standards of living in Ukraine, Georgia, and Poland: Identification and strategic planning. Virtual Econ. 2019, 2, 7–36. [Google Scholar] [CrossRef] [Green Version]
- Nagy, B.; Lívia, K. The Examination of Appearance of Income Inequality in Scientific Databases with Content Analysis. Bus. Ethics Leadersh. 2018, 2, 35–45. [Google Scholar] [CrossRef]
- Lewis, J.; Swannell, M. The Macroeconomic Determinants of Migration; Working Paper No. 729; Bank of England: London, UK, 25 May 2018. [Google Scholar] [CrossRef]
- Tanrikulu, F. Impact of International Migration on Patents, Innovation, Economy and Business Strategy. In Strategic Outlook for Innovative Work Behaviours; Springer: Berlin/Heidelberg, Germany, 2020; pp. 221–234. [Google Scholar]
- Campos, R.G.; Timini, J. An Estimation of the Effects of Brexit on Trade and Migration (31 May 2019). Banco de Espana Occasional Paper No. 1912. Available online: https://ssrn.com/abstract=3396986 (accessed on 6 January 2022).
- Berthou, A.; Haincourt, S.; Serve, M.E.; Estrada, A.; Roth, M.; Kadow, A. Assessing the Macroeconomic Impact of Brexit through Trade and Migration Channels. Available online: https://papers.ssrn.com/sol3/papers.ctfm?abstract_id=3523738 (accessed on 9 January 2022).
- The Model. NIESR. Available online: https://nimodel.niesr.ac.uk/ (accessed on 3 February 2022).
- Song, C.; Shi, S.; Chen, J.; Nijkamp, P.; Li, X. The Influence of Emigration on Tourism Outward Foreign Direct Investment: Evidence from China. J. Travel Res. 2019, 59, 631–641. [Google Scholar] [CrossRef]
- Tong Sarah, Y. Ethnic Networks in FDI and the Impact of Institutional Development. Rev. Dev. Econ. 2005, 9, 563–580. [Google Scholar] [CrossRef]
- Kahanec, M.; Pytliková, M.; Zimmermann, K.F. The Free Movement of Workers in an Enlarged European Union: Institutional Underpinnings of Economic Adjustment; Springer: Berlin/Heidelberg, Germany, 2016; Available online: https://link.springer.com/chapter/10.1007/978-3-662-45320-9_1 (accessed on 6 January 2022).
- Boubtane, E.; Jean-Christophe, D.; Christophe, R. Immigration and Economic Growth in the OECD Countries 1986–2006. Oxf. Econ. Pap. 2016, 68, 340–360. [Google Scholar] [CrossRef]
- Sysoyeva, L.; Kleinschmidt, H. Corruption and Migration Policy. EU Crisis Management Revisited. SocioEcon. Chall. 2017, 1, 48–53. [Google Scholar] [CrossRef] [Green Version]
- Alessandro, B.C.; Rossinelli, D. Fake News, Immigration, and Opinion Polarization. SocioEcon. Chall. 2017, 1, 59–72. [Google Scholar] [CrossRef] [Green Version]
- Iqbal, K.; Peng, H.; Hafeez, M. Khurshaid Analyzing the Effect of ICT on Migration and Economic Growth in Belt and Road (BRI) Countries. J. Int. Migr. Integr. 2019, 21, 307–318. [Google Scholar] [CrossRef]
- Arif, I. The determinants of international migration: Unbundling the role of economic, political, and social institutions. World Econ. 2020, 43, 1699–1729. [Google Scholar] [CrossRef]
- Shin, G. Direct and indirect impacts of liberal immigration policies on the inflow of multinationals in the US Economics Discussion Papers, No 2019-42. Kiel Institute for the World Economy, 2019. Available online: http://www.economics-ejournal.org/economics/discussionpapers/2019-42 (accessed on 6 February 2022).
- Alola, A.A. Carbon emissions and the trilemma of trade policy, migration policy and health care in the US. Carbon Manag. 2019, 10, 209–218. [Google Scholar] [CrossRef]
- Adedoyin, F.F.; Bello, A.A.; Abubakar, I.F.; Agabo, T.J. How does governance factors influence the trade impact of migration and capital flows in the EU? J. Public Aff. 2020, 21, e2207. [Google Scholar] [CrossRef]
- Fong, E.; Shibuya, K.; Chen, X. Migration among East and Southeast Asian Economies. Int. Migr. 2020, 58, 69–84. [Google Scholar] [CrossRef]
- Liang, S.; Yang, X.; Qi, J.; Wang, Y.; Xie, W.; Muttarak, R.; Guan, D. CO2 Emissions Embodied in International Migration from 1995 to 2015. Environ. Sci. Technol. 2020, 54, 12530–12538. [Google Scholar] [CrossRef]
- Mulholland, S.E.; Hernández-Julián, R. Does economic freedom lead to selective migration by education? J. Reg. Anal. Policy 2019, 43, 65–87. [Google Scholar]
- Sinoi, E.-A. The nexus between migration, innovation and economic development in EU-28. Ann. Univ. Oradea Econ. Sci. Ser. 2019, 28, 423–433. [Google Scholar]
- Price, C.E.; Feldmeyer, B. The Environmental Impact of Immigration: An Analysis of the Effects of Immigrant Concentration on Air Pollution Levels. Popul. Res. Policy Rev. 2011, 31, 119–140. [Google Scholar] [CrossRef]
- Hien, D.T.; Docquier, F.; Parsons, C.; Peri, G. Migration and Development: Dissecting the Anatomy of the Mobility Transition. J. Dev. Econ. 2018, 132, 88–101. [Google Scholar] [CrossRef] [Green Version]
- Jover, J.; Díaz-Parra, I. Who is the city for? overtourism, lifestyle migration and social sustainability. Tour. Geogr. 2022, 24, 9–32. [Google Scholar] [CrossRef]
- Paniagua, J.; Peiró-Palomino, J.; Picazo-Tadeo, A.J. Asylum migration in OECD countries: In search of lost well-being. Soc. Indic. Res. 2021, 153, 1109–1137. [Google Scholar] [CrossRef]
- Oliinyk, O.; Bilan, Y.; Mishchuk, H.; Akimov, O.; Vasa, L. The impact of migration of highly skilled workers on the country’s competitiveness and economic growth. Montenegrin J. Econ. 2021, 17, 7–19. [Google Scholar] [CrossRef]
- Liu, X.; Dong, X.; Li, S.; Ding, Y.; Zhang, M. Air pollution and high human capital population migration: An empirical study based on 35 major cities in china. Sustain. Prod. Consum. 2021, 27, 643–652. [Google Scholar] [CrossRef]
- Germani, A.R.; Scaramozzino, P.; Castaldo, A.; Talamo, G. Does air pollution influence internal migration? An empirical investigation on italian provinces. Environ. Sci. Policy 2021, 120, 11–20. [Google Scholar] [CrossRef]
- Zhang, T.; Song, Y.; Yang, J. Relationships between urbanization and CO2 emissions in china: An empirical analysis of population migration. PLoS ONE 2021, 16, e0256335. [Google Scholar] [CrossRef]
- Makieła, Z.J.; Kinelski, G.; Stęchły, J.; Raczek, M.; Wrana, K.; Michałek, J. Tools for Network Smart City Management—The Case Study of Potential Possibility of Managing Energy and Associated Emissions in Metropolitan Areas. Energies 2022, 15, 2316. [Google Scholar] [CrossRef]
- Czarnecka, M.; Kinelski, G.; Stefańska, M.; Grzesiak, M.; Budka, B. Social Media Engagement in Shaping Green Energy Business Models. Energies 2022, 15, 1727. [Google Scholar] [CrossRef]
- Drożdż, W.; Kinelski, G.; Czarnecka, M.; Wójcik-Jurkiewicz, M.; Maroušková, A.; Zych, G. Determinants of Decarbonization—How to Realize Sustainable and Low Carbon Cities? Energies 2021, 14, 2640. [Google Scholar] [CrossRef]
- Dacko-Pikiewicz, Z. Building a family business brand in the context of the concept of stakeholder-oriented value. Forum Sci. Oecon. 2019, 7, 37–51. [Google Scholar]
- Hussain, H.I.; Haseeb, M.; Kamarudin, F.; Dacko-Pikiewicz, Z.; Szczepańska-Woszczyna, K. The Role of Globalization, Economic Growth and Natural Resources on the Ecological Footprint in Thailand: Evidence from Nonlinear Causal Estimations. Processes 2021, 9, 1103. [Google Scholar] [CrossRef]
- Hussain, H.I.; Szczepańska-Woszczyna, K.; Kamarudin, F.; Anwar, N.A.M.; Saudi, M.H.M. Unboxing the black box on the dimensions of social globalisation and the efficiency of microfinance institutions in Asia. Oecon. Copernic. 2021, 12, 557–592. [Google Scholar] [CrossRef]
- Drożdż, W.; Mróz-Malik, O.; Kopiczko, M. The Future of the Polish Energy Mix in the Context of Social Expectations. Energies 2021, 14, 5341. [Google Scholar] [CrossRef]
- Özden, Ç.; Christopher, R.P.; Maurice, S.; Terrie, L.W. Where on Earth Is Everybody? The Evolution of Global Bilateral Migration 1960–2000. World Bank Econ. Rev. 2011, 25, 12–56. [Google Scholar] [CrossRef] [Green Version]
- Levin, A.; Lin, C.-F.; Chu, C.-S.J. Unit Root Tests in Panel Data: Asymptotic and Finite-Sample Properties. J. Econom. 2002, 108, 1–24. [Google Scholar] [CrossRef]
- Eurostat. Net Migration Plus Statistical Adjustment. Available online: https://ec.europa.eu/eurostat/databrowser/view/urt_gind3/default/table?lang=en (accessed on 15 December 2021).
- World Data Bank. World Development Indicators. Available online: https://databank.worldbank.org/data/reports.aspx?source=2&series=NY.GDP.PCAP.CD&country=# (accessed on 3 January 2022).
- Sustainable Development Index. Available online: https://www.sdgindex.org (accessed on 15 December 2021).
- World Bank. World Government Indicators. Available online: http://info.worldbank.org/governance/wgi/index.asp (accessed on 3 January 2022).
- Bove, V.; Leandro, E. Migration, Diversity, and Economic Growth. World Dev. 2017, 89, 227–239. [Google Scholar] [CrossRef]
- Pedroni, P. Critical Values for Cointegration Tests in Heterogeneous Panels with Multiple Regressors. Oxf. Bull. Econ. Stat. 1999, 61, 653–670. [Google Scholar] [CrossRef]
- O’Brien, R.M. A caution regarding rules of thumb for variance inflation factors. Qual. Quant. 2007, 41, 673–690. [Google Scholar] [CrossRef]
- Pedroni, P. Purchasing Power Parity Tests in Cointegrated Panels. Rev. Econ. Stat. 2001, 83, 727–731. [Google Scholar] [CrossRef] [Green Version]
- Pedroni, P. Panel Cointegration. Asymptotic and Finite Sample Properties of Pooled Time Series Tests with an Application to the PPP Hypothesis. Econom. Theory 2004, 20, 597–625. [Google Scholar] [CrossRef] [Green Version]
- Dumitrescu, E.I.; Christophe, H. Testing for Granger Non-Causality in Heterogeneous Panels. Econ. Model. 2012, 29, 1450–1460. [Google Scholar] [CrossRef] [Green Version]
Figure 1.
Dynamics (a) and countries of origin (b) of the documents on international migration, 2000–2021. Source: developed by the authors based on Scopus (2021).
Figure 1.
Dynamics (a) and countries of origin (b) of the documents on international migration, 2000–2021. Source: developed by the authors based on Scopus (2021).

Figure 2.
A content analysis of the papers on international migrants and its visualization in VOSviewer (Source: developed by the authors).
Figure 2.
A content analysis of the papers on international migrants and its visualization in VOSviewer (Source: developed by the authors).

Table 1.
The research approaches to defining the determinants of migration (Source: developed by the authors).
Table 1.
The research approaches to defining the determinants of migration (Source: developed by the authors).
| Determinants | Author | Country, Period | Methodology | Variable | Results |
|---|---|---|---|---|---|
| Ed | Iqbal K. et al. [52] | BRI, 2000–2017 | Panel unit root tests, FMOLS and Granger causality test | M, TR, GDP, FDI | FDI↔GDP; TR↔GDP; FDI↔M |
| Ed, Sd | Borjas G.J. [5] | USA, 1960–2017 | OLS | IM, Education | IM↔GDP Education↔ IM |
| Ed, Sd, Pd | Arif I. [53] | 195, 1990–2000 | OLS and PPML estimators | EFW, PI, GDP, Sv, Tv | EFW, GDP, Sv, Tv⟶M; PI and M are neutral to each other |
| Ed, Sd, Pd | Shin, G. [54] | USA, 1970–2016 | Johnsen co-integration test, ECM, Granger causality tests | FDI, IP, LV | FDI does not Granger-cause IP; FDI does not Granger-cause LC |
| Ed, Sd, Ecd | Andrew A. Alola [55] | USA, 1990–2018 | ARDL | M, GDP, RE, H, CO2 | M and CO2, RE and GDP are positively related; H “-“⟶CO2 |
| Ed, Pd | Adedoyin F.F. et al. [56] | EU23, 1998–2017 23 European countries | GMM model | TR, GDP, M, FDI, ROL, GOE, COC, RQI, VOA, PSI | M, GOE, RQI have negative effect on TRO, |
| Ed, Sd, Pd | Fong E. et al. [57] | East and Southeast Asia, 2005–2010 183 Metropolitan Statistical Areas of USA | Binomial regression analysis OLS | M, GDP, Un, PSMSA, CO, NO2, O3, SO2 | GDP⟶M; PS⟶M; Un⟶M MSA does not contribute to CO, NO2, O3, SO2 |
| Ed, Ecd | Liang L. [58] | World, 1995–2015 | SDA with the EE-MRIO model | M, CO2 | M⟶CO2 |
| Ed, Sd, Pd | Mulholland S.E. [59] | USA, 1995–2000 | SDM, MCMC | M, EG, W, EF, Ssec | EF, EG, W and Ssec⟶M |
| Ed, Sd | Sinoi E.-A. [60] | EU-28, 2003–2012 | Non spatial fixed effects models, spatial Durbin models | M, Ird, Ied | Education↔M↔Ird↔Ied |
| Ecd | Price, C.E. et al. [61] | USA, 2000–2006 | OLS | MSA, CO, NO2, O3, SO2 | MSA does not contribute to CO, NO2, O3, SO2 |
Ed—economic determinants, Ecd—ecological determinants, Sd—social determinants, Pd—political determinants, ⟶—positive/negative impact; ↔—causal relationships, M—migration, TR—traded ration, GDP—gross domestic product per capita, FDI—foreign direct investment, IM—immigration, EFW—Economic Freedom of the World index, PI—Polity IV index, Sv—survival versus self-expression, Tv—traditional versus secular–rational, RE—renewable energy consumption, CO2—carbon emission, LC—labour costs, IP—immigration policy, H—a proxy for the availability and accessibility of quality health programs for people in the US, Un—unemployment rate, PS—political stability, Ssec—social security, EG—employment growth, W—wage, EF—economic freedom. Ird—investment in R&D, Ied—investment in education, MSA—net immigration rate, CO—carbon monoxide, NO2—nitrogen dioxide, O3—ground-level ozone, SO2—sulphur dioxide.
Table 3.
Descriptive Statistics for Mig, GDP, GNI, UN, Wages, CC, RE, and PS.
| Country | Variables | Mean | Std. Dev. | CV | Min | Max |
|---|---|---|---|---|---|---|
| (A) | Mig | −1655.158 | 18,921.68 | 11.4319 | −77,944 | 79,193 |
| GDP | 13,843.67 | 5674.304 | 0.409884 | 3297.35 | 27,483.34 | |
| GNI | 13,174.54 | 5497.425 | 0.417276 | 3210 | 24,620 | |
| UN | 9.716184 | 4.220301 | 0.434358 | 2.4 | 19.9 | |
| Wag | 1055.803 | 500.0619 | 0.473632 | 254.8 | 2663.65 | |
| CO2 | 9.2325 | 2.485094 | 0.269168 | 5.4 | 16.5 | |
| FP | 18.94675 | 6.974668 | 0.368119 | 9.02 | 35.33 | |
| CC | 0.5153289 | 0.3200867 | 0.621131 | −0.01 | 1.51 | |
| PS | 0.79875 | 0.232283 | 0.290808 | 0.15 | 1.3 | |
| (B) | Mig | 3591.841 | 38,619.43 | 10.75199 | −165,941 | 181,634 |
| GDP | 2942.808 | 2034.009 | 0.69118 | 354 | 8318.51 | |
| GNI | 2844.035 | 1926.607 | 0.67742 | 380 | 7600 | |
| UN | 7.334211 | 2.092743 | 0.28534 | 3.41 | 11.94 | |
| Wag | 259.5111 | 157.6029 | 0.607307 | 32.8 | 658.09 | |
| CO2 | 5.095517 | 0.958245 | 0.188056 | 3.93 | 7.84 | |
| FP | 7.105333 | 3.112552 | 0.438059 | 1.52 | 11.98 | |
| CC | −0.7554386 | 0.2161107 | 0.28607 | −1.13 | −0.19 | |
| PS | −0.2389474 | 0.5982853 | 2.50384 | −2.02 | 0.69 |
Note: (A)—EU countries, (B)—Post-soviet countries.
Table 4.
Correlation matrix and variance inflation factor results for Mig, GDP, GNI, UN, Wag, CO2, FP, CC, and PS.
Table 4.
Correlation matrix and variance inflation factor results for Mig, GDP, GNI, UN, Wag, CO2, FP, CC, and PS.
| Mig | GDP | GNI | Un | Wages | CC | FP | CO2 | PS | VIF | |
|---|---|---|---|---|---|---|---|---|---|---|
| (A) | ||||||||||
| Mig | 1.0000 | 27.12 | ||||||||
| GDP | 0.1126 | 1.0000 | 33.99 | |||||||
| GNI | 0.1473 | 0.9666 | 1.0000 | 1.36 | ||||||
| Un | −0.1070 | −0.3470 | −0.3392 | 1.0000 | 20.35 | |||||
| Wages | 0.1554 | 0.9347 | 0.9684 | −0.3061 | 1.0000 | 2.53 | ||||
| CC | 0.1274 | 0.7370 | 0.7905 | −0.4131 | 0.8078 | 1.0000 | 1.95 | |||
| FP | 0.1356 | 0.2355 | 0.3451 | 0.1298 | 0.4562 | 0.2311 | 1.0000 | 4.24 | ||
| CO2 | 0.0134 | 0.6534 | 0.5401 | −0.3495 | 0.4817 | 0.4271 | 0.2364 | 1.0000 | 1.71 | |
| PS | −0.2024 | 0.3928 | 0.3769 | −0.4350 | 0.3407 | 0.5420 | 0.2564 | 0.3642 | 1.0000 | 27.12 |
| (B) | ||||||||||
| Mig | 1.0000 | 72.44 | ||||||||
| GDP | 0.7368 | 1.0000 | 33.73 | |||||||
| GNI | 0.7351 | 0.9711 | 1.0000 | 3.25 | ||||||
| Un | −0.0791 | −0.1479 | −0.1409 | 1.0000 | 30.98 | |||||
| Wages | 0.7161 | 0.9501 | 0.9459 | −0.3267 | 1.0000 | 4.72 | ||||
| CC | −0.2770 | −0.3194 | −0.3321 | −0.5931 | −0.1559 | 1.0000 | 2.12 | |||
| FP | 0.0956 | 0.2111 | 0.3265 | 0.1223 | 0.3586 | 0.1867 | 1.0000 | 2.28 | ||
| CO2 | 0.2450 | 0.4560 | 0.3596 | 0.5095 | 0.2135 | −0.5752 | 0.2341 | 1.0000 | 1.85 | |
| PS | −0.2326 | −0.0343 | −0.1545 | −0.3916 | −0.0470 | 0.2408 | 0.2135 | −0.0570 | 1.0000 | 72.44 |
Note: (A)—the EU countries, (B)—the post-Soviet countries.
Table 5.
The output of the variance inflation factor calculations for the re-specification of the regression models.
Table 5.
The output of the variance inflation factor calculations for the re-specification of the regression models.
| Variables | (A) | (B) | ||||
|---|---|---|---|---|---|---|
| GDP | 3.29 | – | – | 2.09 | – | – |
| GNI | – | 3.25 | – | – | 1.91 | – |
| UN | 1.34 | 1.34 | 1.35 | 3.11 | 3.04 | 3.24 |
| Wag | – | – | 3.30 | – | – | 1.80 |
| CO2 | 1.89 | 1.53 | 1.43 | 2.48 | 2.12 | 2.01 |
| FP | 2.02 | 1.34 | 1.63 | 1.56 | 2.31 | 1.59 |
| CC | 2.86 | 3.45 | 3.85 | 2.12 | 2.20 | 2.06 |
| PS | 1.59 | 1.61 | 1.65 | 1.32 | 1.43 | 1.37 |
Note: (A)—EU countries, (B)—Post-soviet countries; “–“—excluding the strongest correlated parameters from model.
Table 6.
Panel Unit Root Results for Mig, GDP, GNI, UN, Wag, CO2, FP, CC, and PS.
| Variables | Test Statistics | (A) | (B) | ||
|---|---|---|---|---|---|
| Level | First Difference | Level | First Difference | ||
| Mig | Statistic | 2.0928 | 9.1396 | 0.6062 | 4.2014 |
| p-value | 0.0182 ** | 0.0000 * | 0.2722 | 0.0000 * | |
| GDP | Statistic | −0.3252 | 9.1396 | −0.5437 | 4.2014 |
| p-value | 0.6275 | 0.0000 * | 0.7067 | 0.0000 * | |
| GNI | Statistic | −0.4418 | 4.2014 | −0.3778 | 1.3657 |
| p-value | 0.6707 | 0.0000 * | 0.6472 | 0.0460 ** | |
| UN | Statistic | 2.1809 | 5.8842 | 0.7573 | 4.6834 |
| p-value | 0.0146 ** | 0.0000 * | 0.2244 | 0.0000 * | |
| Wag | Statistic | 0.3987 | 8.5939 | −1.0076 | 6.5783 |
| p-value | 0.3451 | 0.0000 * | 0.8432 | 0.0000 * | |
| CO2 | Statistic | −1.36867 | −4.82513 | −1.26748 | −3.40512 |
| p-value | 0.0856 | 0.0000 * | 0.1025 | 0.0003 * | |
| FP | Statistic | −0.88218 | −5.27678 | −0.13335 | −4.32615 |
| p-value | 0.1888 | 0.0000 * | 0.447 | 0.0000 * | |
| CC | Statistic | −0.6419 | 5.9282 | −0.3937 | 2.5846 |
| p-value | 0.7395 | 0.0000 * | 0.6531 | 0.0049 * | |
| PS | Statistic | 6.3927 | 19.4374 | 4.6076 | 4.8753 |
| p-value | 0.0000 * | 0.0000 * | 0.0000 * | 0.0049 * | |
Note: * and ** represents significance at the 1%, 5% and 10% levels, respectively, of significance (bold entries). Note: (A) covers the EU countries, (B) presents the post-Soviet countries.
Table 7.
Pedroni Panel Cointegration Test Results.
| Dimension | Test Statistics | (A) | (B) | ||
|---|---|---|---|---|---|
| Statistics | Prob | Statistics | Prob | ||
| Within-dimension | panel v-statistic | −1.791 | 0.963 | −1.261 | 0.896 |
| panel rho-statistic | 2.158 | 0.984 | 0.877 | 0.809 | |
| panel PP-statistic | −1.36 | (0.033) ** | −11.540 | (0.000) * | |
| panel ADF-statistic | −1.874 | (0.0304) ** | −1.742 | (0.041) ** | |
| (weighted statistic) | |||||
| panel v-statistic | −1.540 | 0.938 | −1.781 | 0.962 | |
| panel rho-statistic | 2.233 | 0.987 | 0.776 | 0.781 | |
| panel PP-statistic | −1.975 | (0.024) ** | −9.314 | (0.000) * | |
| panel ADF-statistic | −1.950 | (0.025) ** | −2.228 | (0.012) ** | |
| Between-dimension | group rho-statistic | 3.437 | 0.999 | 1.200 | 0.885 |
| group PP–statistic | −2.242 | (0.012) ** | −12.070 | (0.000) * | |
| group ADF-statistic | −1.908 | (0.028) ** | −2.794 | (0.002) * | |
Note: * and ** represent significance at the 1% and 5% levels. (A)—EU countries, (B)—candidate and potential candidate countries to the EU membership.
Table 8.
Kao Panel Cointegration Tests.
| ADF t-Statistics | (A) | (B) | ||
| Statistics | Prob | Statistics | Prob | |
| −4.03497 | (0.000) * | −4.54900 | (0.000) * | |
Note: * represent significance at the 1% levels. (A)—EU countries, (B)—Post-Soviet countries.
Table 9.
Estimation of the Cointegrating Relationship.
| Variables | FMOLS | DOLS | |||||
|---|---|---|---|---|---|---|---|
| (A) | |||||||
| Dependent | Independent | Long-Run Coefficient, Prob | Long-Run Coefficient, Prob | Long-Run Coefficient, Prob | Long-Run Coefficient, Prob | Long-Run Coefficient, Prob | Long-Run Coefficient, Prob |
| Mig | GDP | 0.08 (0.044) ** | – | – | 0.13 (0.085) *** | – | – |
| GNI | – | 0.03 (0.065) *** | – | – | 0.06 (0.099) *** | – | |
| UN | −0.17 (0.059) *** | −0.18 (0.040) ** | −0.18 (0.043) ** | −0.23 (0.014) ** | −0.26 (0.006) * | −0.26 (0.006) * | |
| Wag | – | – | 0.08 (0.087) *** | – | – | −0.05 (0.467) | |
| CO2 | −0.04 (0.034) ** | −0.06 (0.021) ** | −0.04 (0.014) ** | −0.02 (0.071) *** | −0.02 (0.074) *** | −0.03 (0.085) *** | |
| FP | 0.01 (0.136) | 0.02 (0.246) | 0.01 (0.446) | 0.01 (0.236) | 0.02 (0.159) | 0.02 (0.323) | |
| CC | 0.05 (0.686) | 0.07 (0.544) | 0.138 (0.250) | −0.04 (0.737) | −0.02 (0.985) | 0.06 (0.572) | |
| PS | 0.05 (0.469) | 0.04 (0.471) | 0.06 (0.368) | 0.06 (0.318) | 0.07 (0.317) | 0.07 (0.277) | |
| R-squared | 0.68 | 0.68 | 0.67 | 0.66 | 0.65 | 0.66 | |
| (B) | |||||||
| Dependent | Independent | Long-run coefficient, Prob | Long-run coefficient, Prob | Long-run coefficient, Prob | Long-run coefficient, Prob | Long-run coefficient, Prob | Long-run coefficient, Prob |
| Mig | GDP | 0.40 (0.033) ** | – | – | 0.44 (0.049) ** | – | – |
| GNI | – | 0.33 (0.053) ** | – | – | 0.34 (0.087) *** | – | |
| UN | 0.21 (0.362) | 0.14 (0.497) | 0.31 (0.011) ** | 0.07 (0.78) | 0.02 (0.933) | 0.06 (0.787) | |
| Wag | – | – | 0.23 (0.132) | – | – | 0.44 (0.011) ** | |
| CO2 | −0.29 (0.309) | −0.13 (0.415) | −0.18 (0.000) * | −0.35 (0.297) | −0.12 (0.526) | −0.17 (0.386) | |
| FP | −0.01 (0.005) * | −0.01(0.021) ** | −0.13 (0.562) | −0.06 (0.124) | −0.03 (0.235) | −0.04 (0.323) | |
| CC | −0.07 (0.325) | −0.09 (0.273) | −0.05 (0.816) | −0.05 (0.493) | −0.06 (0.443) | −0.04 (0.590) | |
| PS | −0.21 (0.379) | −0.357 (0.079) ** | −0.41 (0.000) * | −0.146 (0.597) | −0.291 (0.222) | −0.36 (0.097) *** | |
| R-squared | 0.37 | 0.29 | 0.40 | 0.42 | 0.36 | 0.44 | |
Note: (A)—EU countries, (B)—post-Soviet countries, *, **, and *** represents significance at the 1%, 5% and 10% levels; “–“—excluding the strongest correlated parameters from model.
Table 10.
Dumitrescu-Harlin Causality Tests.
| Hypothesis | (A) | ||||
| W-stat | Z-stat | Prob. | Result | Conclusion | |
| Mig→GDP | 4.22 | 1.75 | 0.079 *** | Yes | Unidirectional causality from Mig to GDP |
| GDP→Mig | 1.12 | −1.22 | 0.220 | No | |
| Mig→GNI | 2.89 | 0.47 | 0.632 | No | No causality between Mig and GNI |
| GNI→Mig | 2.02 | −0.36 | 0.717 | No | |
| Mig→UN | 4.11 | 1.64 | 0.099 *** | Yes | Unidirectional causality from Mig to UN |
| UN→Mig | 2.31 | −0.08 | 0.935 | No | |
| Mig→ Wag | 3.56 | 1.12 | 0.260 | No | Unidirectional causality from Wag to Mig |
| Wag→Mig | 0.68 | −1.64 | 0.099 *** | Yes | |
| Mig→CO2 | 3.62 | 1.17 | 0.239 | No | Unidirectional causality from CO2 to Mig |
| CO2→Mig | 2.52 | 0.12 | 0.903 | No | |
| Mig→FP | 1.15 | 1.34 | 0.439 | No | No causality between Mig and FP |
| FP→Mig | 2.33 | −1.23 | 0.221 | No | |
| Mig→CC | 3.22 | 0.78 | 0.429 | No | No causality between Mig and CC |
| CC→Mig | 3.61 | 1.17 | 0.241 | No | |
| Mig→PS | 1.59 | −0.77 | 0.437 | No | No causality between Mig and PS |
| PS→Mig | 0.76 | −1.57 | 0.116 | No | |
| (B) | |||||
| W-stat | Z-stat | Prob. | Result | Conclusion | |
| Mig→GDP | 1.89 | −0.29 | 0.765 | No | No causality between Mig and GDP |
| GDP→Mig | 1.39 | −0.59 | 0.553 | No | |
| Mig→GNI | 1.17 | −0.72 | 0.471 | No | No causality between Mig and GNI |
| GNI→Mig | 2.83 | 0.25 | 0.796 | No | |
| Mig→UN | 1.59 | −0.47 | 0.635 | No | No causality between Mig and UN |
| UN→Mig | 2.61 | 0.12 | 0.900 | No | |
| Mig→Wag | 2.54 | 0.08 | 0.929 | No | No causality between Mig and Wag |
| Wag→Mig | 1.67 | −0.42 | 0.667 | No | |
| Mig→CO2 | 3.58 | 0.70 | 0.483 | No | Unidirectional causality from CO2 to Mig |
| CO2→Mig | 8.05 | 3.33 | 0.000 * | Yes | |
| Mig→FP | 3.58 | 0.70 | 0.483 | No | No causality between FP to Mig |
| FP→Mig | 2.63 | 0.07 | 0.879 | No | |
| Mig→CC | 0.74 | −0.97 | 0.328 | No | No causality between Mig and CC |
| CC→Mig | 1.22 | −0.69 | 0.489 | No | |
| Mig→PS | 3.45 | 0.62 | 0.534 | No | No causality between Mig and PS |
| PS→Mig | 3.97 | 0.92 | 0.352 | No | |
Note: * and *** represents significance at the 1% and 10% levels. (A)—the EU countries, (B)—post-Soviet countries.
Publisher’s Note: MDPI stays neutral with regard to jurisdictional claims in published maps and institutional affiliations. |
© 2022 by the authors. Licensee MDPI, Basel, Switzerland. This article is an open access article distributed under the terms and conditions of the Creative Commons Attribution (CC BY) license (https://creativecommons.org/licenses/by/4.0/).
Share and Cite
MDPI and ACS Style
Kwilinski, A.; Lyulyov, O.; Pimonenko, T.; Dzwigol, H.; Abazov, R.; Pudryk, D. International Migration Drivers: Economic, Environmental, Social, and Political Effects. Sustainability 2022, 14, 6413. https://doi.org/10.3390/su14116413
AMA Style
Kwilinski A, Lyulyov O, Pimonenko T, Dzwigol H, Abazov R, Pudryk D. International Migration Drivers: Economic, Environmental, Social, and Political Effects. Sustainability. 2022; 14(11):6413. https://doi.org/10.3390/su14116413
Chicago/Turabian StyleKwilinski, Aleksy, Oleksii Lyulyov, Tetyana Pimonenko, Henryk Dzwigol, Rafis Abazov, and Denys Pudryk. 2022. "International Migration Drivers: Economic, Environmental, Social, and Political Effects" Sustainability 14, no. 11: 6413. https://doi.org/10.3390/su14116413
Note that from the first issue of 2016, this journal uses article numbers instead of page numbers. See further details here.