Article

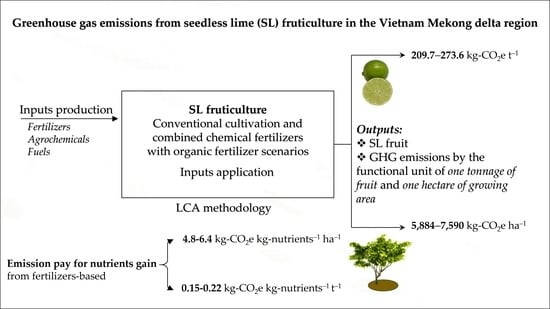
Reduction in Greenhouse Gas Emission from Seedless Lime Cultivation Using Organic Fertilizer in a Province in Vietnam Mekong Delta Region

by
Le Tran Thanh Liem
1,2,
Yukihiro Tashiro
1,3,*,
Pham Van Trong Tinh
4 and
Kenji Sakai
1,3
1
Laboratory of Soil and Environmental Microbiology, Division of Systems Bioengineering, Department of Bioscience and Biotechnology, Faculty of Agriculture, Graduate School, Kyushu University, Motooka 744, Nishi-ku, Fukuoka 819-0395, Japan
2
Department of Rural Technology, College of Rural Development, Can Tho University, 3/2 Street, Xuan Khanh Ward, Ninh Kieu District, Can Tho City 900000, Vietnam
3
Laboratory of Microbial Environmental Protection, Tropical Microbiology Unit, Center for International Education and Research of Agriculture, Faculty of Agriculture, Kyushu University, Motooka 744, Nishi-ku, Fukuoka 819-0395, Japan
4
Department of Agricultural Techniques, College of Rural Development, Can Tho University, Ninh Kieu District, Can Tho City 900000, Vietnam
*
Author to whom correspondence should be addressed.
Sustainability 2022, 14(10), 6102; https://doi.org/10.3390/su14106102
Submission received: 29 March 2022 / Revised: 12 May 2022 / Accepted: 12 May 2022 / Published: 17 May 2022
(This article belongs to the Topic Climate Change and Environmental Sustainability)

Abstract

:
This study aimed to evaluate greenhouse gas (GHG) emissions from conventional cultivation (S1) of seedless lime (SL) fruit in Hau Giang province, in the Mekong Delta region of Vietnam. We adjusted the scenarios by replacing 25% and 50% of nitrogen chemical fertilizer with respective amounts of N-based organic fertilizer (S2 and S3). Face-to-face interviews were conducted to collect primary data. Life cycle assessment (LCA) methodology with the “cradle to gate” approach was used to estimate GHG emission based on the functional unit of one hectare of growing area and one tonnage of fresh fruit weight. The emission factors of agrochemicals, fertilizers, electricity, fuel production, and internal combustion were collected from the MiLCA software, IPCC reports, and previous studies. The S1, S2, and S3 emissions were 7590, 6703, and 5884 kg-CO2 equivalent (CO2e) per hectare of the growing area and 273.6, 240.3, and 209.7 kg-CO2e for each tonnage of commercial fruit, respectively. Changing fertilizer-based practice from S1 to S2 and S3 mitigated 887.0–1706 kg-CO2e ha−1 (11.7–22.5%) and 33.3–63.9 kg-CO2e t−1 (12.2–25.6%), respectively. These results support a solution to reduce emissions by replacing chemical fertilizers with organic fertilizers.

Graphical Abstract

1. Introduction

Sustainable development goals (SDGs) will help countries to achieve economic, social, and environmental sustainability [1]. SDGs have 169 targets that fit into 17 goals for managing three aspects. Climate change (CC, SDG13: climate action) has impacts on all other goals. Rapid and serious CC slows down the targets of SDG13 [2]. Agriculture is vulnerable to CC and is a substantial source of greenhouse gas (GHG) emissions [3]. Increasing GHG emissions are the main cause of CC, and approximately one third of global GHG emissions arise from agricultural activities [4]. To avoid the negative effects of chemical fertilizers (CFs) used in agricultural farming, organic fertilizer (OF) has been used as a potential solution [5]. OF is recycled from various types of organic matter, such as diverse agricultural residues and food supply chain waste, via different manufacturing technologies [6,7].
To evaluate the environmental concerns of agricultural production it is crucial to adjust the systems for mitigating the impact, especially GHG emission control. The life cycle assessment (LCA) method is a valuable tool for environmental impact assessment which can be used to quantify, assess, compare, and improve the potential impacts of raw material purchase, production, use, and waste management. In addition, LCA presents real potential environmental impact trade-offs from one phase (current) to another [8]. This methodology generally concentrates on agricultural inputs and farming activities [9]. In fruticulture, LCA has been widely used to estimate GHG emissions in terms of growing area and fresh weight of products, such as lemon, mandarin, orange, apricot, peach, kiwi, and pear [10,11,12].
One possible solution to mitigate GHG emissions is recycling organic matter as the OF source for agriculture applications. In addition, the combined application of CFs and OF has potential for GHG emissions reduction. In fact, the combination has decreased GHG emissions in wheat and rice grain production compared to that from chemical-based farming [13,14]. Moreover, organic herbaceous crops and fruit orchards reduced GHG emissions both in growing area and product weight (except for rice) [15,16]. In addition, OF replacement decreased global warming potential compared with that from CFs’ treatment of maize systems [17].
Vietnam is an agriculture production country famous for rice farming; however, besides rice, the fruit sector is an important part of horticulture. In the first half of 2020, fruit production increased by 4–20%, compared with the same period in 2019. In particular, citrus yield increased by an average of 7.6% [18]. By the end of 2017, the fruit cultivation area in the Mekong Delta region reached nearly 300,000 ha, with an output of approximately 4,000,000 t year−1 [19]. Lime, an important citrus species, is one of southern Vietnam’s 14 essential fruit products grown primarily in the Mekong Delta provinces, accounting for 60% of the country’s total lime cultivation area. Many lime varieties, such as Giay, Seedless, and Tau, are cultivated in the Mekong Delta. Seedless lime (SL) is one of Hau Giang’s seven collective brand certifications for fruit products (Nam Roi pomelo, king orange, pineapple, SL, sweet tangerine, king mandarin, and sweet mango). In Vietnam, commercial SL fruit was graded based on three classifications including “Special,” “No. 1,” and “No. 2”; fruits with a diameter lower than 42 mm are not allowed to be sold in the market [20]. From 2015 to 2018, Vietnam’s lime fruit exportation increased 3.82 times with 27,528,000 US dollars in export value (from 11,960,000 to 39,488,000 US dollars) [FAOSTAT Statistical Database]. The rapid development in both quantity and exported value suggests that more general research on lime fruit should be conducted to achieve suitable long-term development goals.
SL is the critical fruit in Hau Giang agriculture because of its current value and potential development in local planning. In two years (2019–2020), the cultivated area of lime increased by 29.3% from 2367 to 2923 ha. In 2020, lime accounted for 20.2% of the citrus growing area and 18.4% of citrus yield. Lime productivity is stable at approximately 18 t ha−1 and was 13.9% higher than the average productivity of generic citrus. Compared with other citrus species, such as pomelos, mandarin orange, and tangerine, lime has the second largest growing area (after mandarin orange with a cultivation area of 9240 ha) and the second highest harvested weight (after mandarin orange with a harvested weight of 141,120 t) [21]. Additionally, there was a plan to grow SL and expand the growing area in many districts of Hau Giang province. Moreover, SL will replace the old and less productive orchards of other citrus species for reproduction.
Although SL was highly valued for its contribution to local agriculture development, the current cultivation that depends on CFs’ use has a potentially negative impact on the environment. Almost SL grower households have small orchard areas, and they practice traditional cultivation using CF-based methods. Smaller-scale households use better production methods, such as the Global or Vietnamese Good Agricultural Practice standard, for controlling the use of chemicals. Although farmers growing SL use OF for their orchards, the amount of applied OF is low. Farmers did not focus on providing a nutrient-based balanced solution, which would decrease direct N2O emissions via the CFs and OF fertigation strategy [22].
The literature review of lime research showed a variety of results on cultivation conditions, juice quality, post-harvest treatment, and regeneration methods [23,24,25,26]. However, knowledge of GHG emissions from lime cultivation is limited. Worldwide, research on GHG emissions from citrus includes many species, such as generic citrus groups, oranges, lemons, mandarins, and grapefruits [10,11,27,28,29]. In Vietnam, the application of LCA methodology for estimating GHG emissions from cropping systems is not a popular practice. These studies include research on paddy rice, cassava, coffee, tea, and a Vietnamese paper on fruticulture [30,31,32,33,34]. Research on estimating GHG emissions from SL cultivation using the LCA method is important for local agriculture planning and will contribute to achieving SDGs through OF application and GHG emission reduction.

2. Materials and Methods

2.1. Goal, Scope Definition, and Functional Unit

We conducted LCA based on the CO2 equivalent (CO2e) emissions from the SL farming system in Hau Giang province, Vietnam, with a 100-year framework as the assessment period for all calculations. We applied an approach defined as “cradle-to-gate,” considering all inputs and processes for manufacture together with emissions from agricultural soil practices, excluding the transportation inputs stages. Our hypothesis was as follows: If OF in SL cultivation is replaced with CF, will such a change increase or decrease GHG emissions? We designed two scenarios of replacing 25% and 50% of nitrogen-based chemical nitrogen fertilizer (N-CF), corresponding to OF replacement. Based on the nutritional content, we calculated the amount of chemical phosphorus fertilizer (P-CF) and potassium fertilizer (K-CF) supplied (details in Section 2.2). The functional unit is kg-CO2e emission per hectare of the growing area and one tonnage weight of the fresh fruit product. All GHG emissions were estimated in units of kg-CO2e.

2.2. Data Collection

Primary data on SL cultivation were collected by randomly interviewing 100 households that cultivate SL in Chau Thanh district, Hau Giang province, using a questionnaire. The number of surveyed growers and the selection method was adapted for an assessment of life cycle GHG emissions from horticultural product, following the guidelines by the British Standards Institution [35]. The present study used SL cultivation data from 2018 to estimate GHG emissions from three scenarios including conventional scenarios based on the current cultivation conditions (S1) and reduction in CF use—Scenarios 2 and 3 (S2, S3). In S2, 25% of N-CF was replaced by a N-based OF, and in S3, the replacement proportion was 50%. We did not conduct research on orchards, but our calculations balanced the nitrogen, phosphate, and potassium nutrients in all scenarios. Because Vietnamese OF products vary in nutrient substances and have an unstable proportion of organic content [35], we chose an imported Japanese OF as the recommended fertilizer for this study; the nutrient content was 0.03-kg N, 0.02 kg-P2O5, and 0.02 kg-K2O in 1 kg-OF. The differences between S1, S2, and S3 are shown in Table 1.
The amount of OF and additional CFs used for S2 and S3 were calculated as follows:
OFS2 = 0.25 × N-CFS1/0.03
P-CFS2 = P-CFS1 – P-OFS2 = P-CFS1 – OFS2 × 0.02
K-CFS2 = K-CFS1 – K-OFS2 = K-CFS1 – OFS2 × 0.02
OFS3 = 0.5 × N-CFS1/0.03
P-CFS3 = P-CFS1 – P-OFS3 = P-CFS1 – OFS3 × 0.02
K-CFS3 = K-CFS1 – K-OFS3 = K-CFS1 – OFS3 × 0.02
For P-CFS2, K-CFS2, P-CFS3, and K-CFS3 ≤ 0, the calculated values were 0.
GHG emissions from conventional and organic fruticulture farming systems were collected from previous studies to compare SL cultivation. The selected fruits include mandarins, oranges, and two species of Vietnamese pomelos [16,34]. Although Aguilera et al. [16] inventoried emissions from various activities, we selected only agricultural inputs, soil emissions, and irrigation data for our comparison. The system boundary in the study by Phong and Loi [34] was similar to that in our study.
In this study, all GHG emission data were presented in CO2e. The three gases CO2, N2O, and CH4 are relevant to the agricultural cultivation sector [36]. However, CH4 was released under flooded conditions [37]. In our study, we used only the CO2 and N2O from the input applications for our estimation. A conversion factor of 1 t-N2O = 265 t-CO2e was used for the calculations [4].

2.3. GHG Emission from Agrochemicals and Fertilizer Production

Emission data from CFs/OF, insecticides, and electricity production processes were obtained from multiple interface life cycle assessment (MiLCA) software databases (Toray Industries incorporated and Japan Environmental Management Association for Industry (JEMAI), Tokyo, Japan) (details in Section 2.6). The production of fungicides emitted 14.3 kg-CO2e kg−1 active ingredient (ai) chemical [36].

2.4. GHG Emissions from Soil

The emission factor (EF) of N2O from OFs application varied depending on organic type (crop residues, manure/manure slurry, or poultry litter), crops/plants, and soil conditions [38,39,40,41,42,43]. We did not measure the direct N2O emissions on-orchard; therefore, we chose the IPCC Tier 1 default EF of 1% NO2-N emissions per kg of applied N for this study [37].

2.5. GHG Emissions from Irrigation due to the Production and Combustion of Fossils Used

Emission data from diesel production were estimated using the MiLCA software based on the amount of fuel for diesel-powered agricultural pumps. The exhaust from the diesel pumps was estimated according to methods of Stockwell et al. [44] and Adhikari et al. [45]. In our study, we chose an EF of 2.218 kg-CO2e L−1 from the values reported by Adhikari et al. [45] because of their high number of observed agricultural water pumps.

2.6. Data Analysis

2.6.1. GHG Emission Estimation

We used the MiLCA software version 2.3 to estimate GHG emissions produced from agricultural inputs. The software with 3000 process datasets was used to support the LCA research. It supplies the results of inventory inputs for industrial input manufacturing processes and environmental impacts [46].

2.6.2. GHG Emission for Nutrients Gain (E-NG) Index Calculation

We used the E-NG index in our study to clearly explain the relationship between GHG emissions and fertilizer element gain based on the industrial manufacturing process available from the MiLCA software.
E-NG (kg-CO2e kg-nutrients−1 ha−1) = GHG emission (kg-CO2e ha−1)/[nitrogen fertilizer (kg-N ha−1) + phosphate fertilizer (kg-P2O5 ha−1) + potassium fertilizer (kg-K2O ha−1)]
E-NG (kg-CO2e kg-nutrients−1 t−1) = GHG emission (kg-CO2e ha−1)/{[nitrogen fertilizer (kg-N ha−1) + phosphate fertilizer (kg-P2O5 ha−1) + potassium fertilizer (kg-K2O ha−1)]/productivity (t ha−1)}

3. Results

3.1. Inputs of Seedless Lime Cultivation

The total cultivated area of SL in this research was 64.3 ha, and the total yield in 2018 was 1938.1 t. The average SL cultivation density was 684.0 trees ha−1, and the productivity was 30.1 t ha−1 (Table 2). Total agrochemicals, such as pesticides and fungicides, used for SL cultivation were 19.4 kg ha−1 (14.1 kg-pesticide, 5.3 kg-fungicide) and 0.76 kg t−1 fresh fruit (0.58 kg-pesticide, 0.18 kg-fungicide), respectively. Farmers did not use herbicides; instead, they manually controlled weeds. In addition, 449.3 L of diesel was used for the water pump operation and agrochemical spraying in one hectare of the SL orchard. In total, 12 L of diesel were used to produce one tonnage of SL fruit (Table 2). In SL cultivation, 23.2 kg-N, 11.2 kg-P2O5, and 10.6 kg-K2O were applied to produce one tonnage of commercial SL fruit (Table 2). In this study, 25% and 50% replacement of N-CF by OF resulted in a reduction of 101.6 (39.6%) and 185.3 (69.4%) kg-P2O5 and 103.6 (36.8%) and 196.7 (69.9%) kg-K2O per hectare of orchard growing area in S2 and S3, respectively (Table 3).

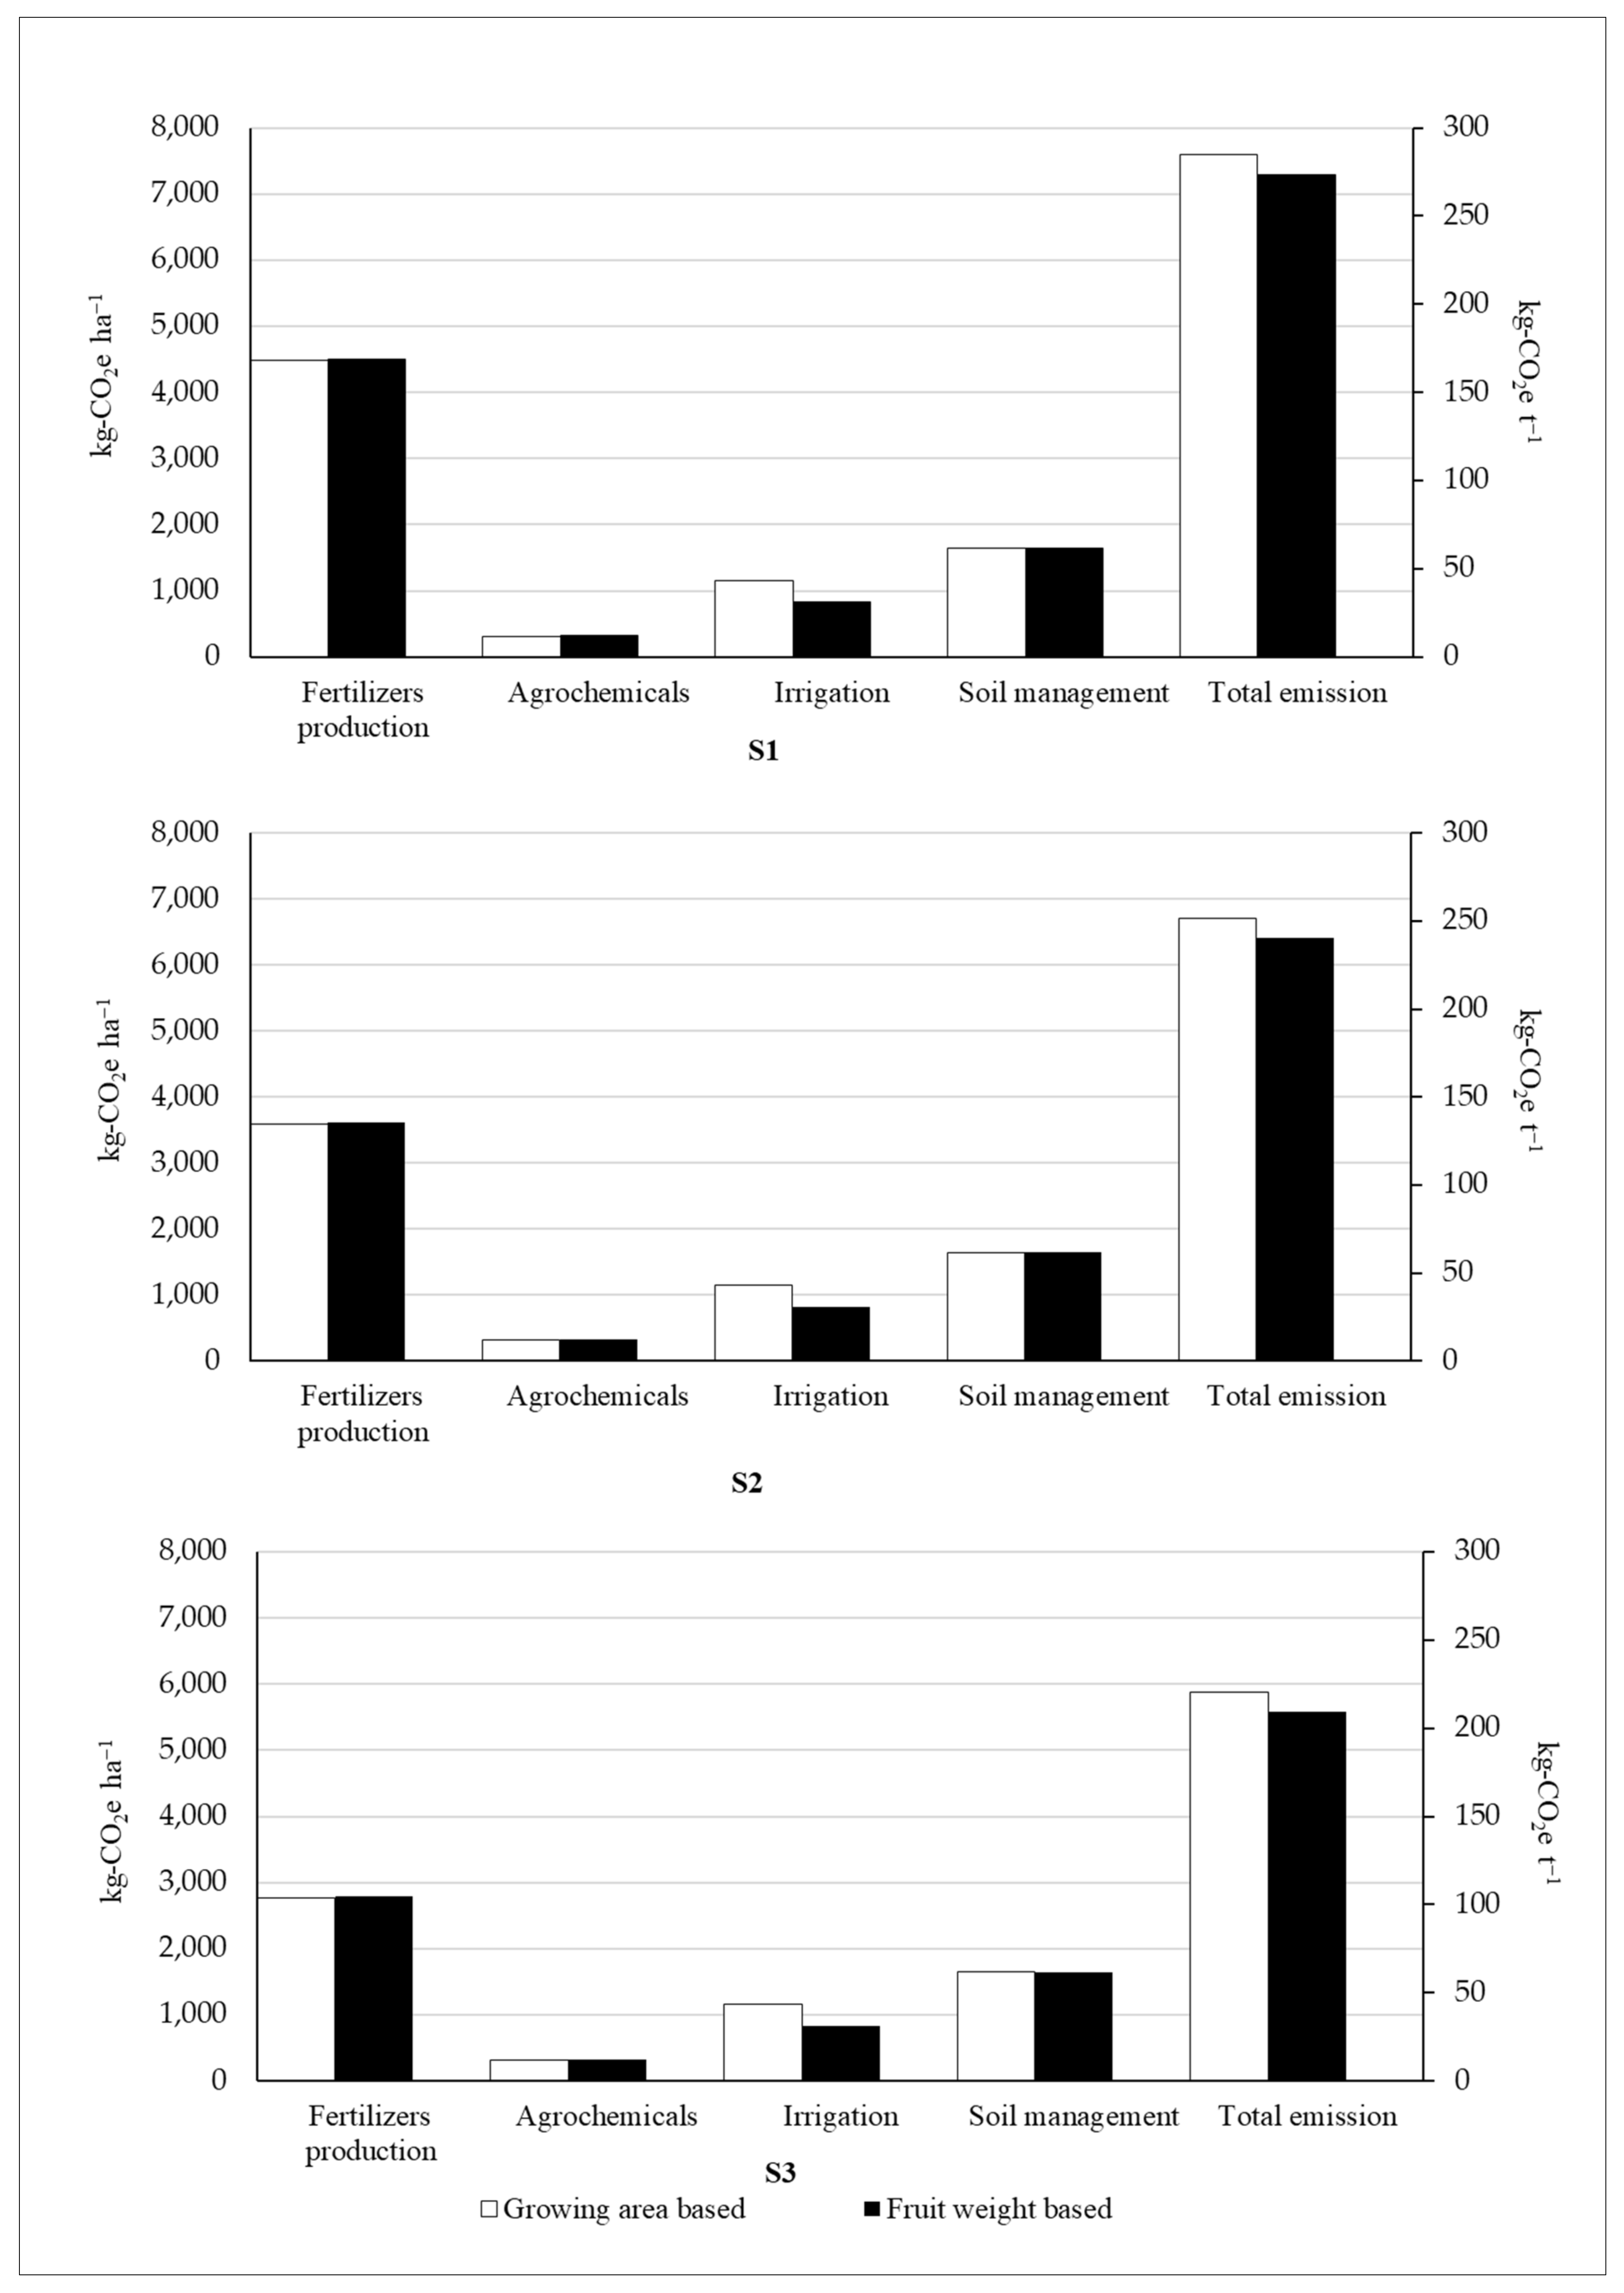
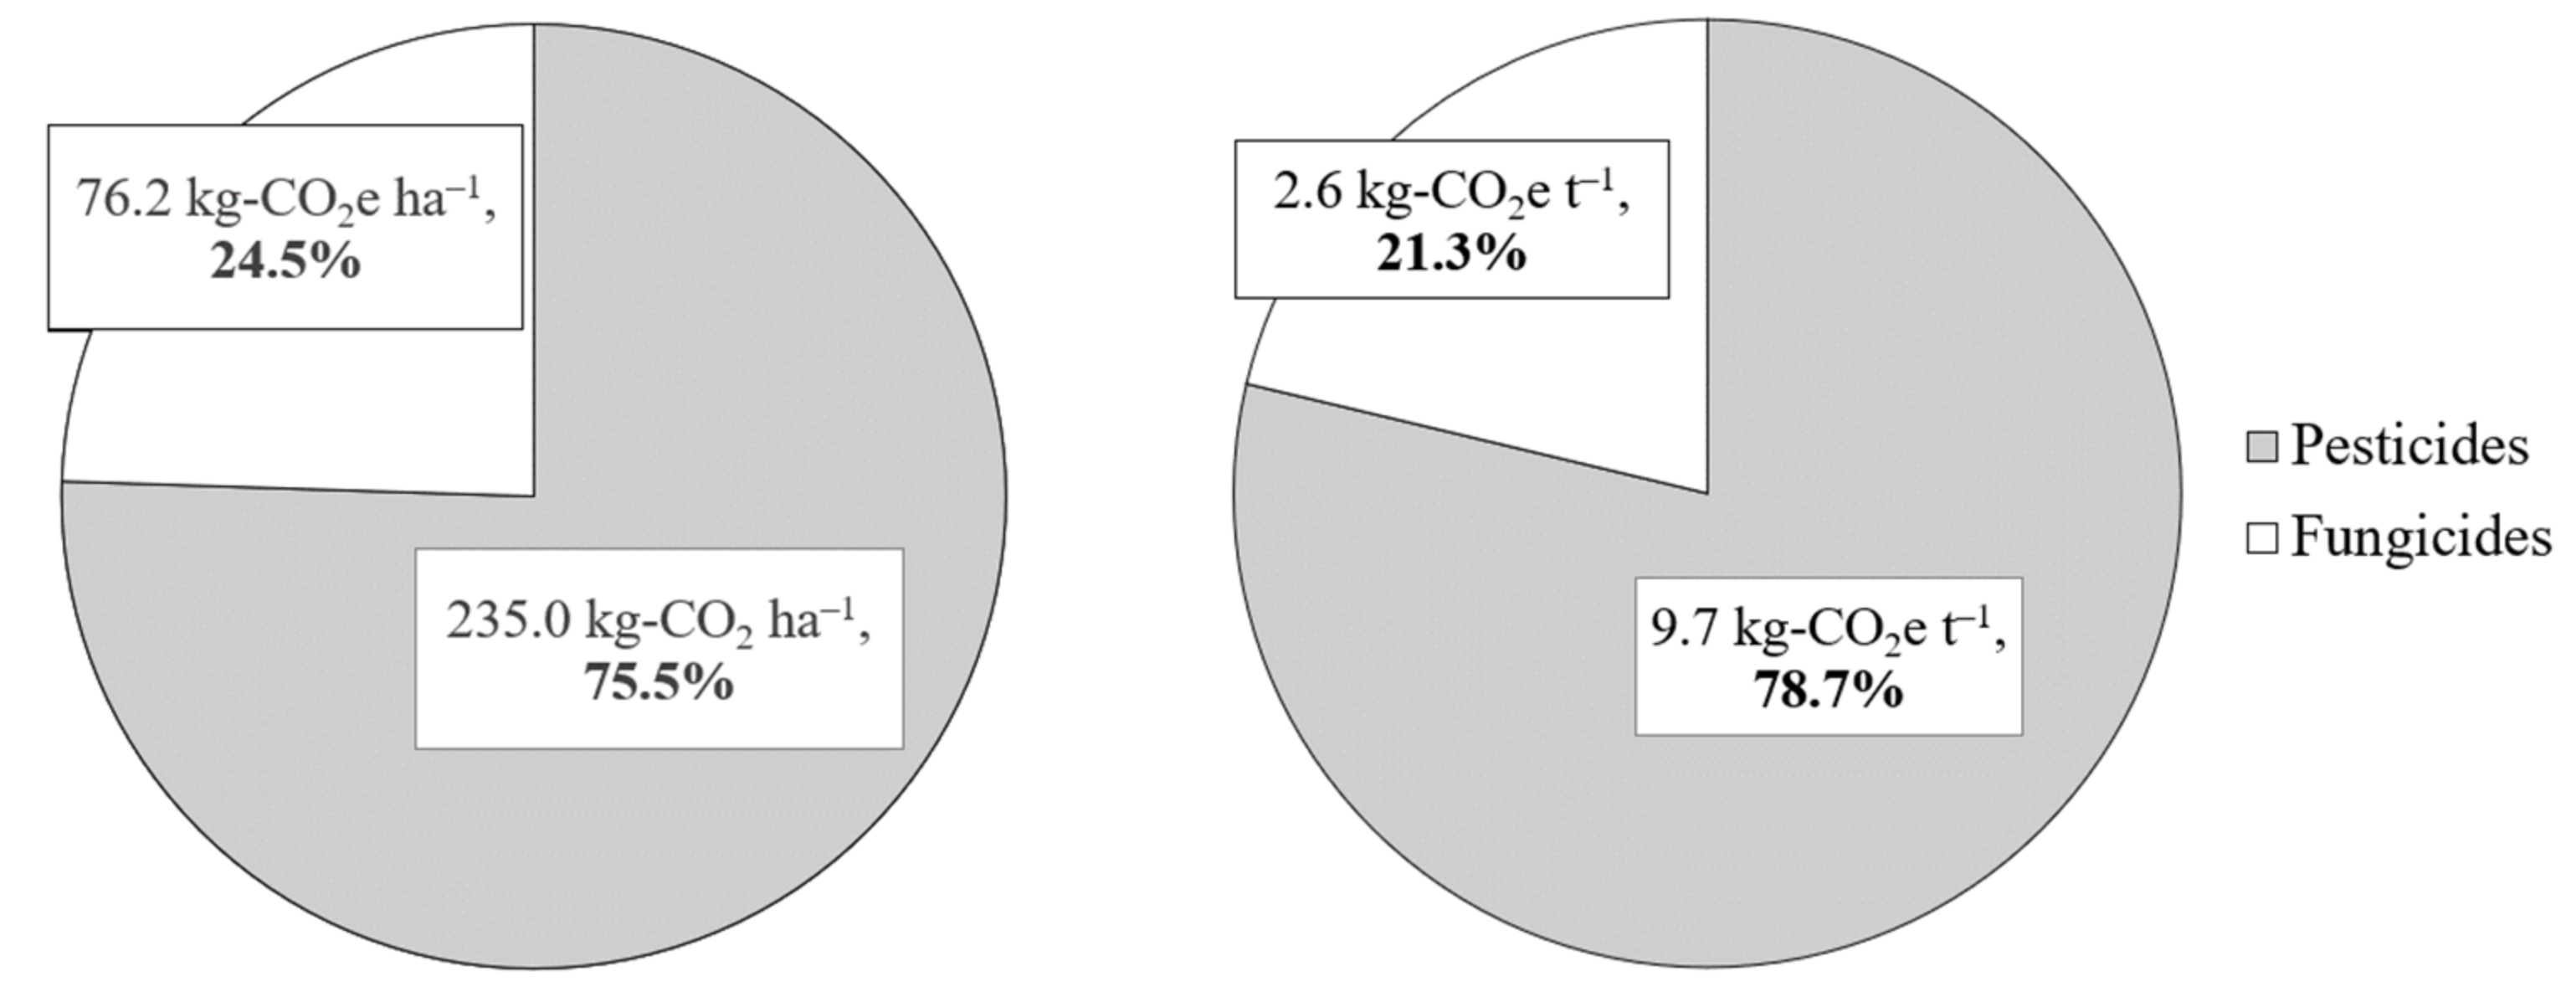
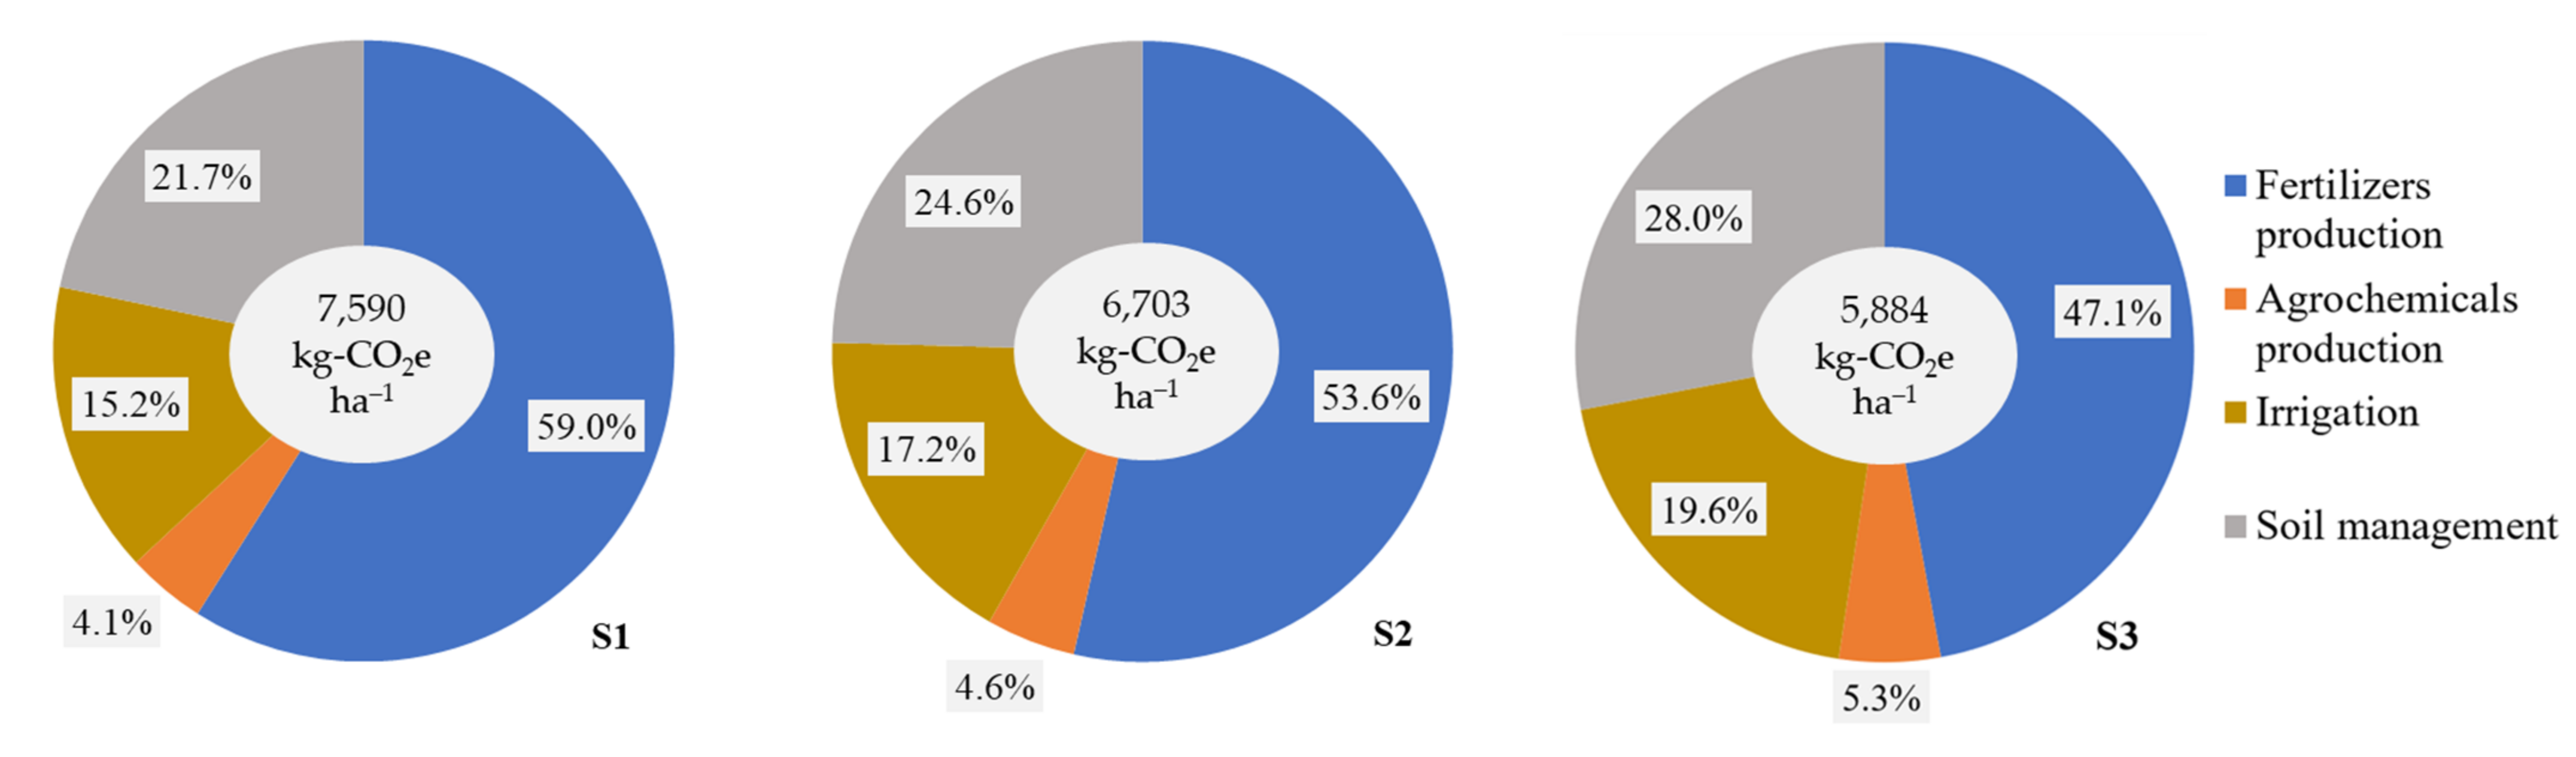
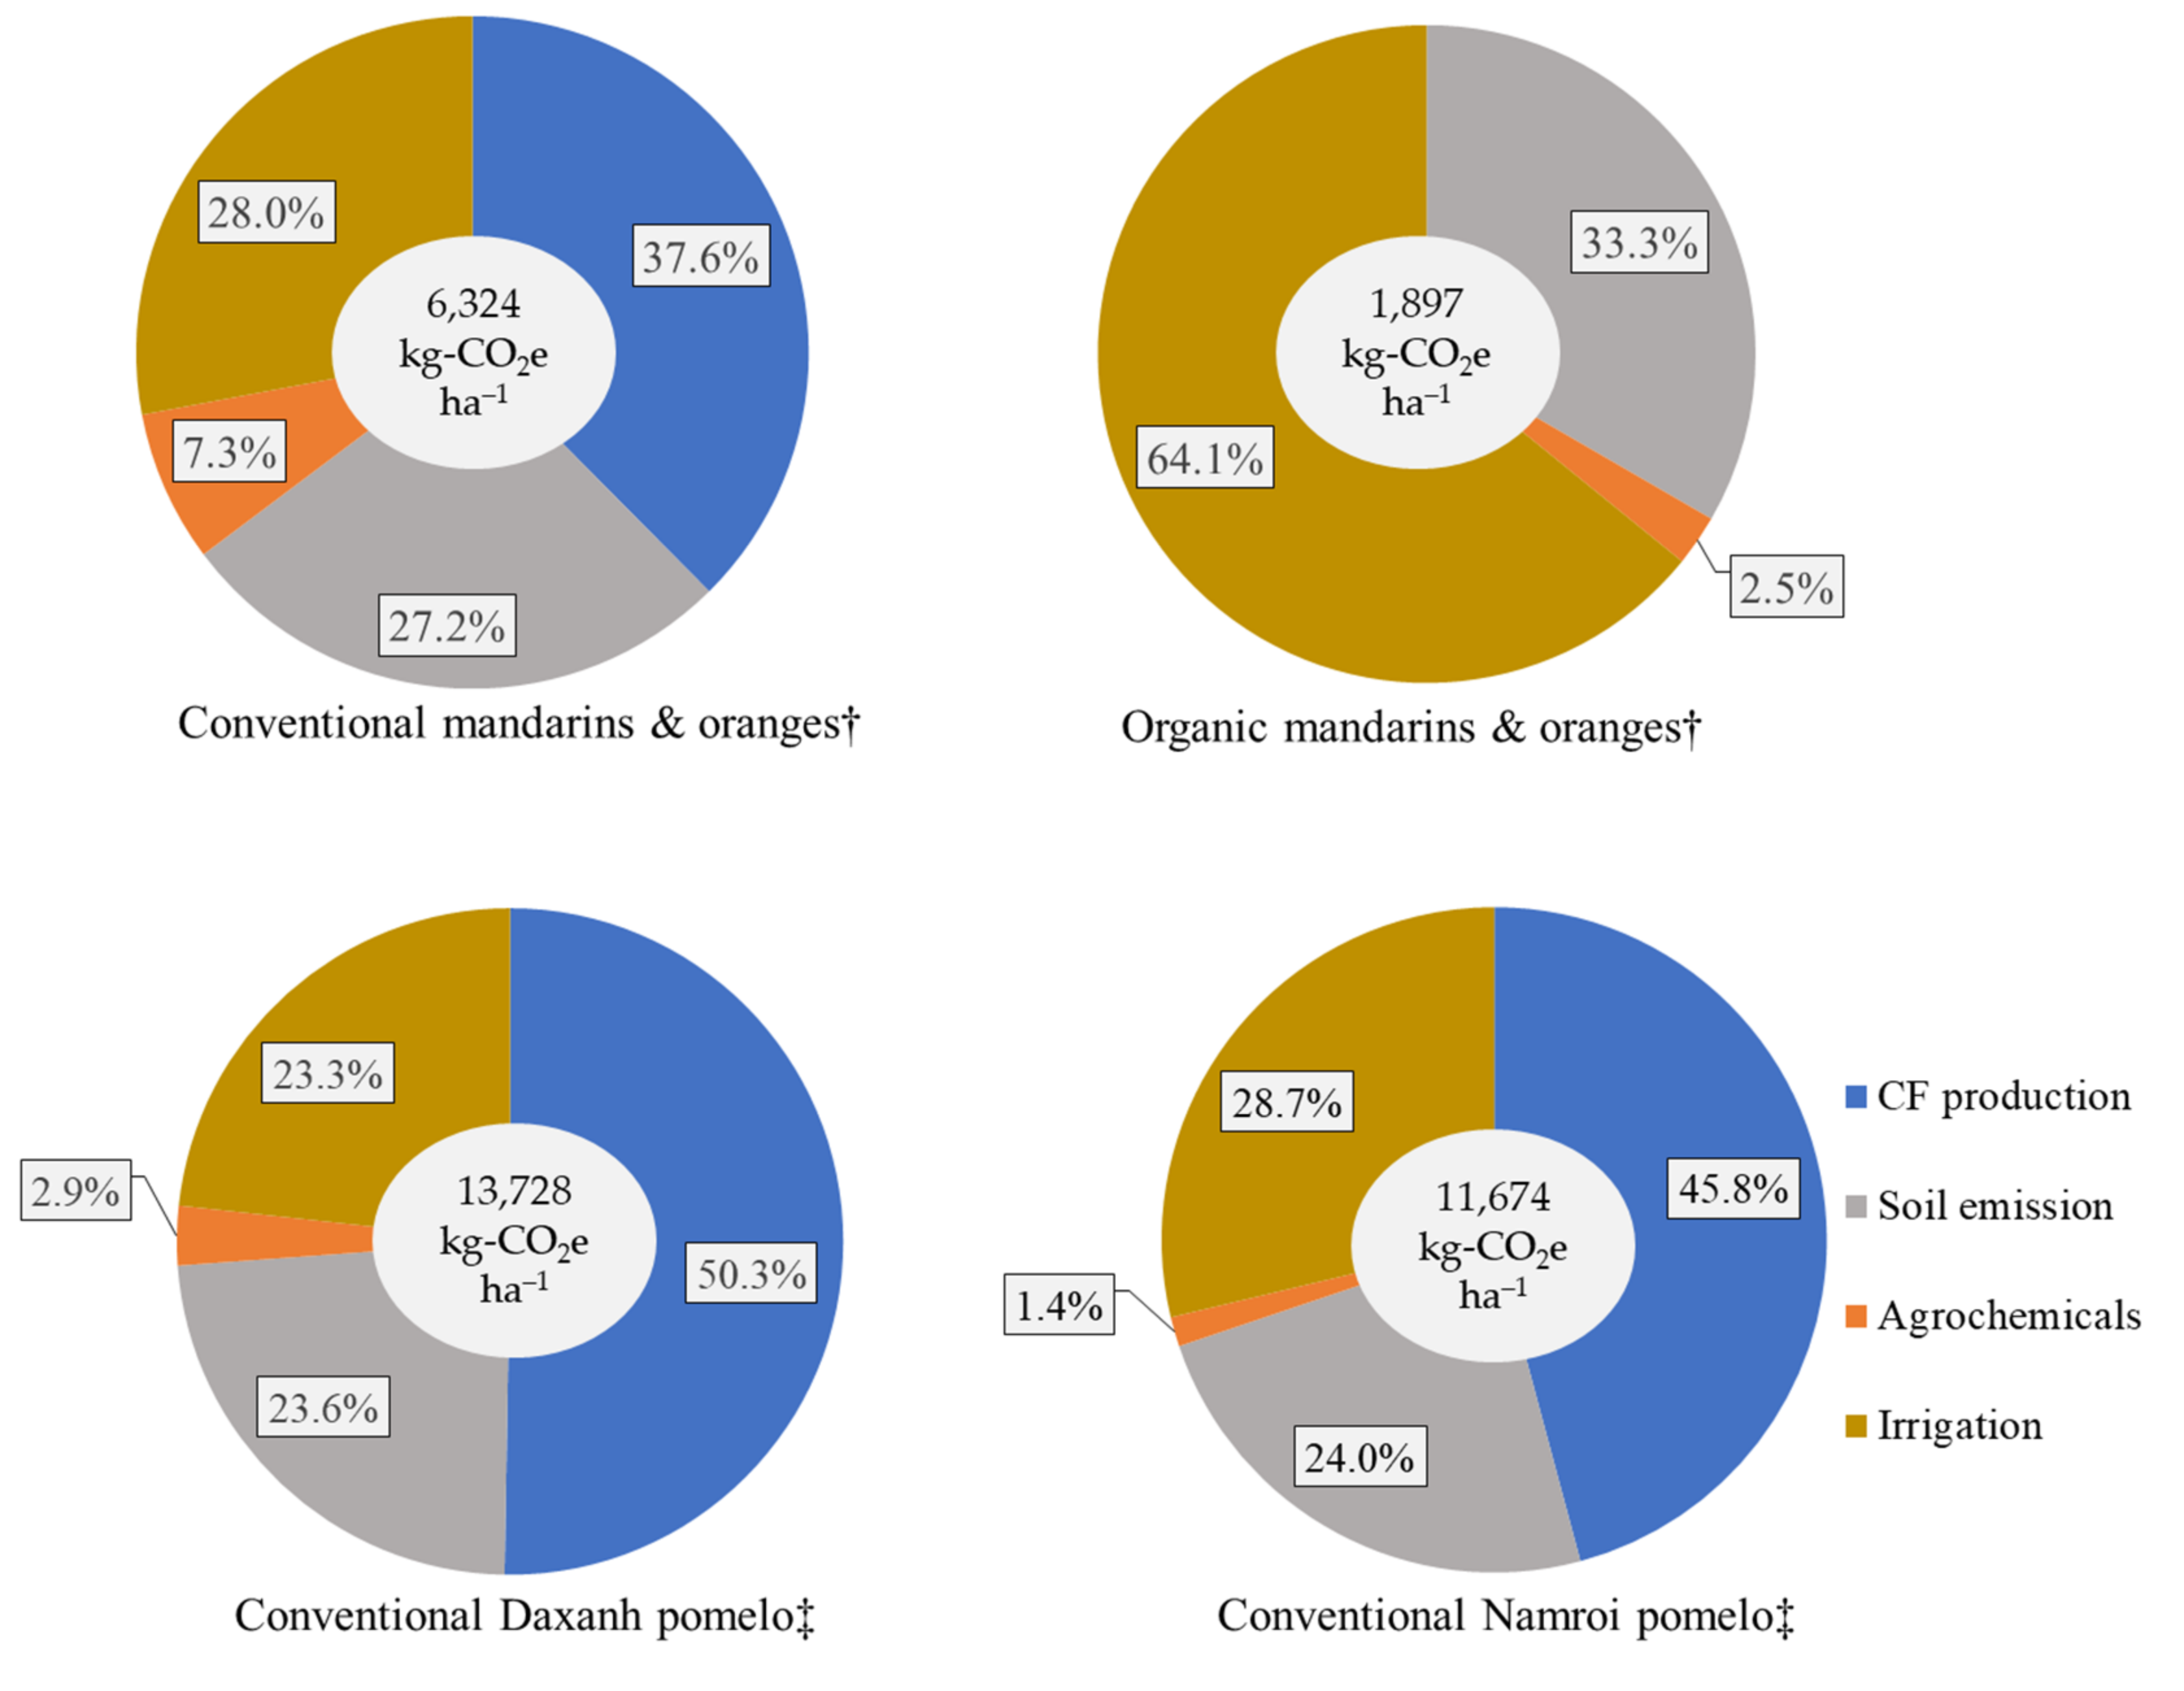
3.2. GHG Emissions from Conventional SL Cultivation

The emissions derived from CF application in conventional SL cultivation were 4477 kg-CO2e ha−1, and 168.8 kg-CO2e t−1 accounted for the highest proportion of 59.0% in total emissions of S1 (7590 kg-CO2e ha−1 and 273.6 kg-CO2e t−1; Figure 1). Emissions from agrochemicals were the lowest (311 kg-CO2e ha−1 and 12.3 kg-CO2e t−1, Figure 1). Emissions from pesticides accounted for 75.5% in growing area emissions (235 kg-CO2e ha−1) and 78.7% in fresh weight of fruit product (9.7 kg-CO2e t−1) (Figure 2). Emissions from fungicides were over three times lower than emissions from pesticides (76.2 kg-CO2e ha−1 and 2.6 kg-CO2e t−1) (Figure 2). The second largest source of total emissions was N2O emissions from agricultural soil after N-CF application (21.7%), followed by irrigation emissions through diesel-oil production and internal combustion by water pump (15.2%). The GHG emissions from SL cultivation were significantly derived from CF production (Figure 3). The highest proportion of CF usage of SL cultivation was similar to that of other fruit cultivation methods (except for organic application) (Figure 3 and Figure 4). Therefore, to reduce GHG emissions, a critical solution is to focus on decreasing CF usage. However, limiting nitrogen fertilizer volatilization under N2O form and optimizing irrigation processes to save fuel are essential.

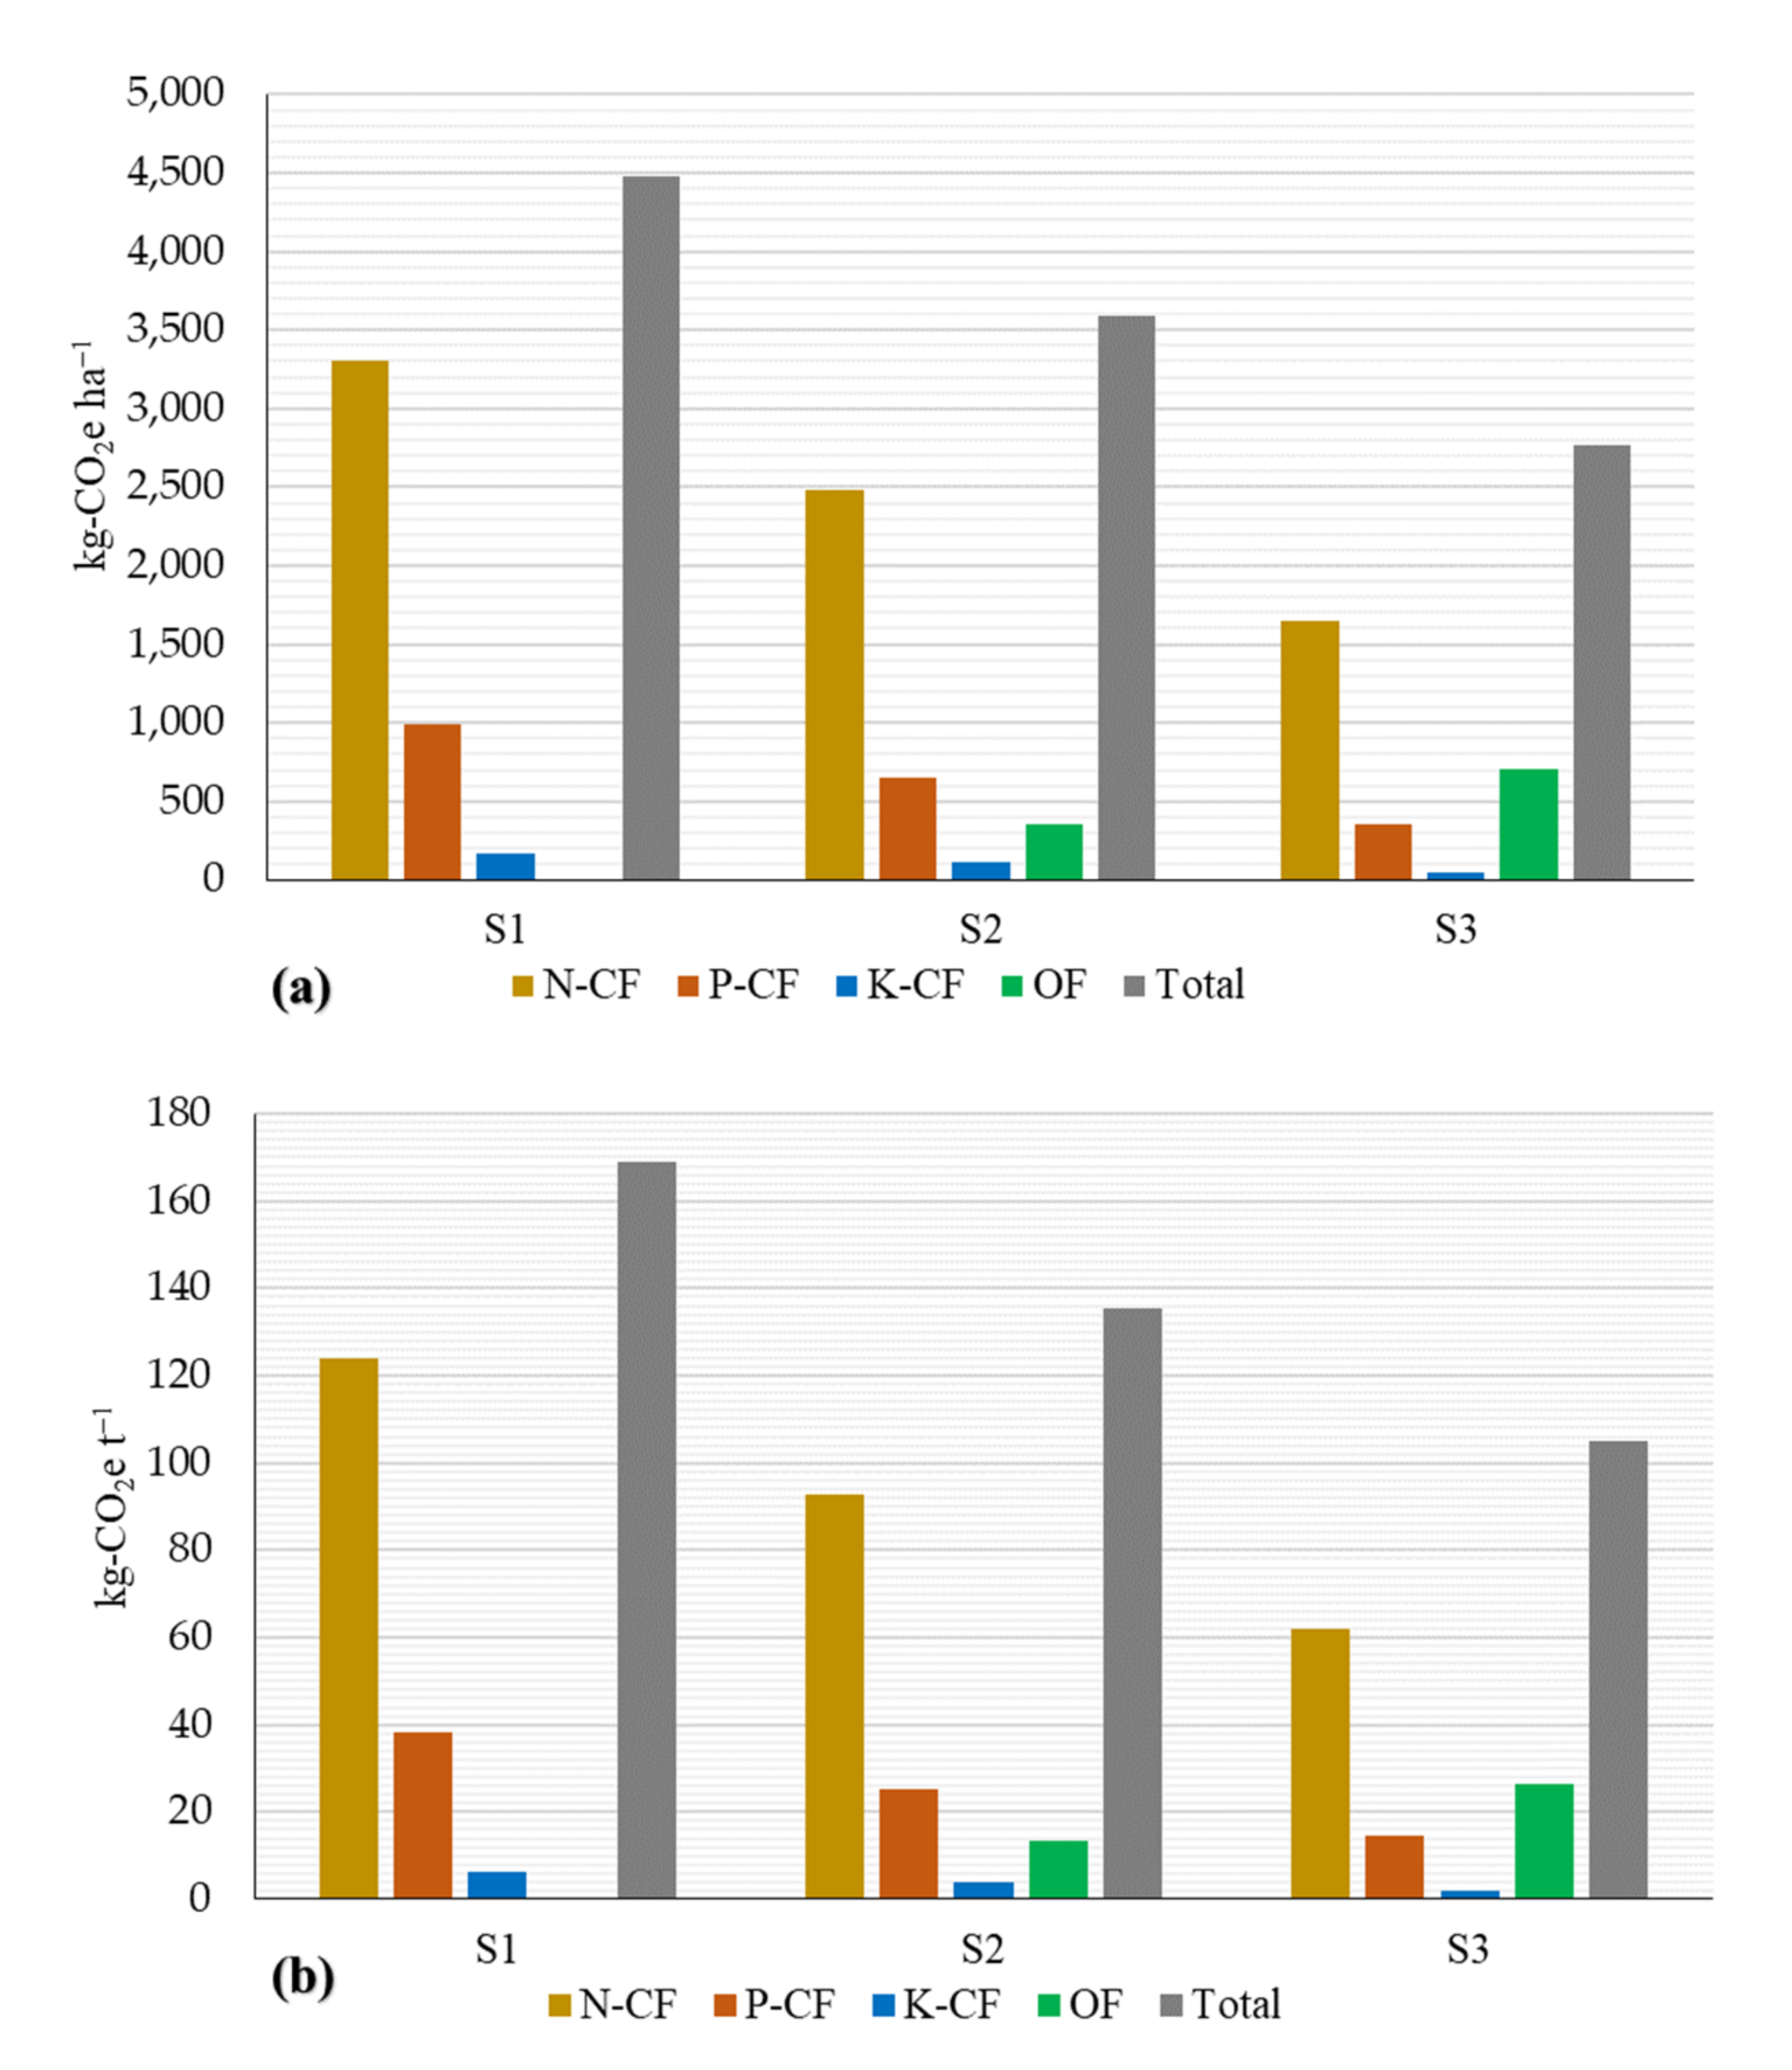
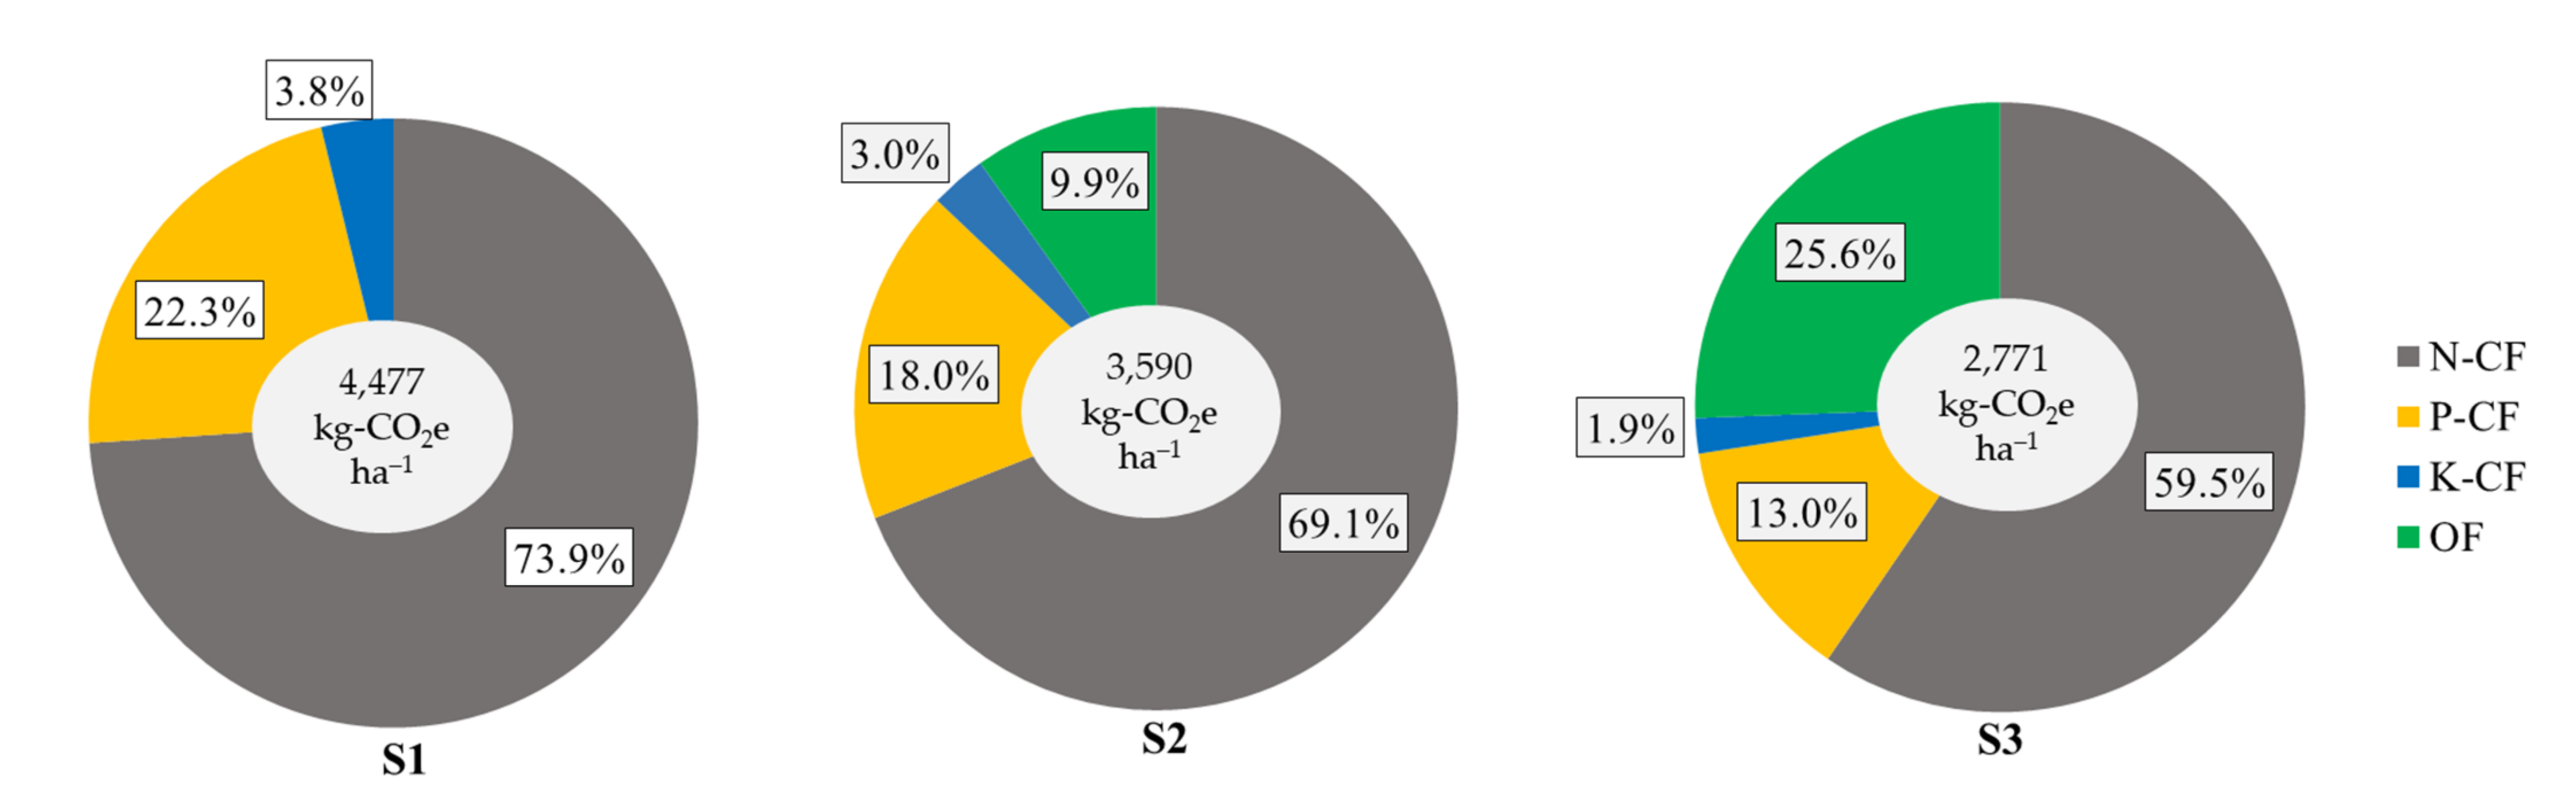
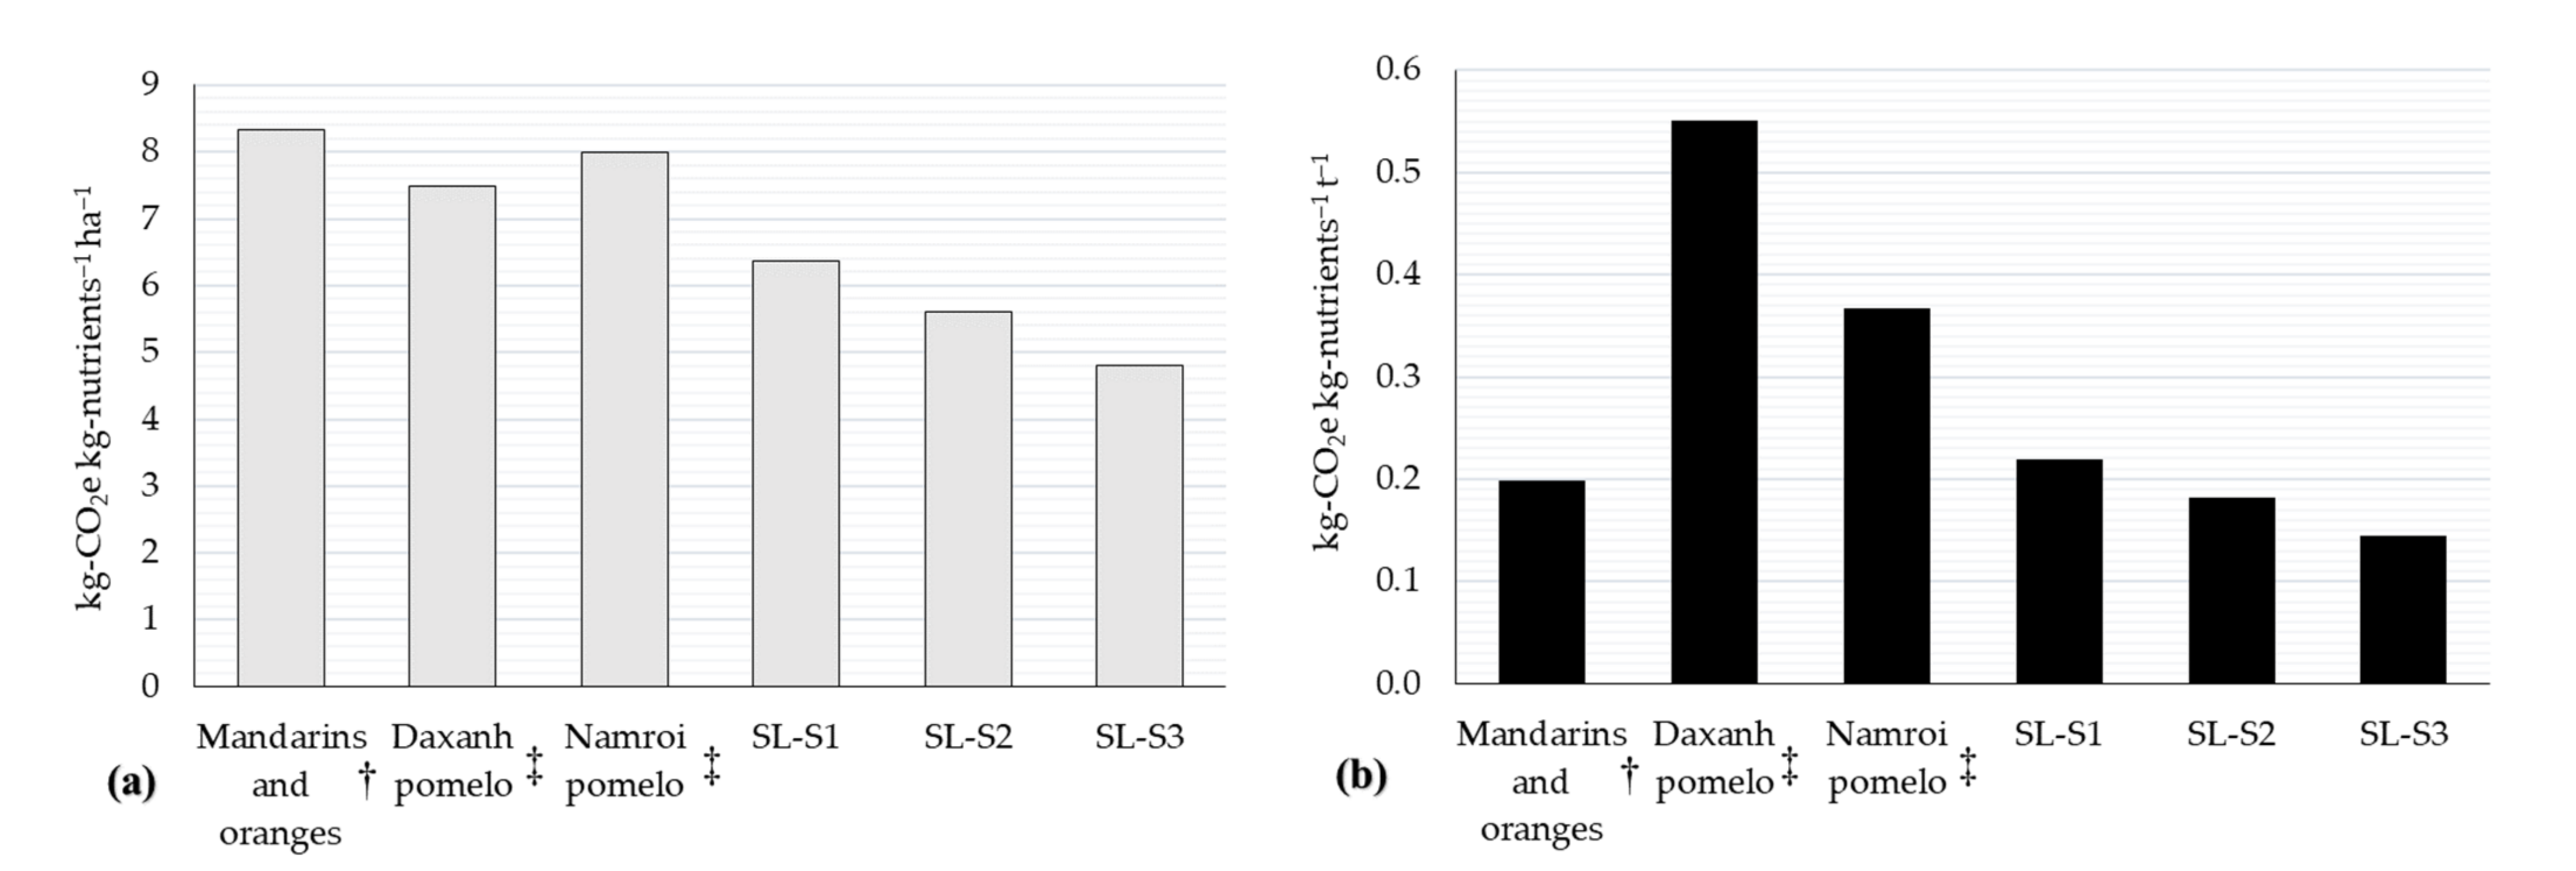
3.3. Comparison of GHG Emission from CF Replacement by OF Application and Conventional Cultivation Methods of SL

Total fertilizer emissions decreased from 3590 kg-CO2e ha−1 and 135.5 kg-CO2e t−1 in S2 to 2,771 kg-CO2e ha−1 and 104.9 kg-CO2e t−1 in S3. Total emissions decreased from 6703 kg-CO2e ha−1 and 240.3 kg-CO2e t−1 in S2 to 5884 kg-CO2e ha−1 and 209.7 kg-CO2e t−1 in S3 (Figure 1). Emissions from CF application in S1 accounted for 59.0%, and the proportion from all fertilizer production type decreased to 53.6% in S2 and 47.1% in S3 (Figure 3). Emissions from OF accounted for only 9.9% emissions (355 kg-CO2e ha−1, 13.3 kg-CO2e t−1) through fertilizer applications in S2 and increased to 25.6% (709 kg-CO2e ha−1, 26.5 kg-CO2e t−1) in S3 (Figure 5 and Figure 6). In total, changing CF-based practice from S1 to S2 and S3 mitigated 887.0–1706 kg-CO2e ha−1 (11.7–22.5%) and 33.3–63.9 kg-CO2e t−1 (12.2–25.6%). The continuous replacement of N-CF by OF from 25% to 50%, from S2 to S3, mitigated 819.9 kg-CO2e ha−1 (12.2%) and 30.6 kg-CO2e t−1 (12.7%), respectively (Figure 1). In this study, we also set a new parameter to specifically explain the relationship of GHG emissions, weight of fruit products, and growing area, with the total amount of nutrients from fertilizer elements used for crop care. For SL cultivation, a growing area of one hectare with current farming and recommended practice based on one kilogram of complete fertilizer element application emitted 4.8–6.4 kg-CO2e kg-nutrients−1 ha−1. One tonnage of SL fresh fruit was produced under the cultivation status of 0.15–0.22 kg-CO2e kg-nutrients−1 t−1. SL grown under all three scenarios had more benefit than conventionally produced fruits (except the emission calculation based on nutrients of SL-S1 and mandarins and oranges) (Figure 7).

4. Discussion

The combined OF and CFs would potentially mitigate GHG emissions in the SL orchards. This recommendation is vital for the sustainability development of Vietnam SL fruticulture and has the potential to encourage OF production based on agricultural residues from crops and livestock farming in the Mekong delta. In citrus fruticulture, our results and previous literature showed the potential of mitigating GHG emissions via the integration of CF-OF usage and organic cultivation [16,47,48]. Our results on the relationship between fertilizer use and total emissions by growing area and fresh fruit weight showed that on-orchard emission had better values than other conventional selected fruit (except SL-S1 and SL-S2 compared to mandarins/oranges; Figure 3 and Figure 4). It has benefits for the expansion of SL cultivation in the agricultural restructuring of Hau Giang province by following the advance of fertilizer practice. In addition, certificates for organic agriculture production in Vietnam were provided based on the Decision of the Vietnamese Ministry of Science and Technology in production, processing, and labeling [49]. It will be possible to develop SL organic cultivation and certified organic fruit products in the future.
Research on N2O emissions reduction is an essential solution for mitigating total GHG emission. N2O emissions from N inputs were significantly different based on many factors, such as soil conditions and fertilizer types. The application of OFs will mitigate emissions in the comparison of CFs’ application [15,38,39,41,50]; however, OF also exacerbated emissions [41,42,43]. Additionally, the combined application of biochar and OF can reduce N2O emissions compared with a sole application of CF or OF [51]. Moreover, the addition of nitrification inhibitors to OF will achieve the best value of N2O emissions compared with other fertilizer applications [52]. In this study, we use the default N2O EF, Tier 1, from the IPCC guideline, so it is crucial for us to improve our study by measuring direct emission on-orchard in further work. The possibility of decreasing SL orchard emissions by adding biochar and/or nitrification inhibitors together with combined OF and CFs application will be investigated in a subsequent study.
Reducing the value of emissions pay for fertilizer gain will result in more environmental citriculture. CFs’ manufacture depends on natural resource exploitation and significant fossil fuel for processing, so it harms the environment and causes global warming through increased GHG emissions. While OFs’ production recycles organic residues, reasonable fuel use for manufacture will be more environmentally friendly. To the best of our knowledge, this is the first study to analyze this index. Limited available data from a previous citrus study was used for comparison (Figure 7). SL had almost benefit in comparison with pomelos, mandarins, and oranges based on growing area and fresh fruit weight (except for comparisons based on weight of SL-S1 and mandarins/oranges). Reducing emissions from fertilizer application and improving fruit yield will keep decreasing the index to obtain a better value. Mulching practices in citrus orchards decreased GHG emission [28]. When nutrient inputs were balanced, irrigation practices (furrow and deficit irrigation), plant growth regulator application, nitrification inhibitor fertilizer application, and bio-fertilizer application improved fruit yield [53,54,55,56,57]. The current irrigation methods in the SL orchards are sprinkler and overflowing; the change to better practice would help save energy and decrease N2O emission [29,58]. The application of each or a combination of recommended practices under Vietnamese Mekong Delta SL orchard fruticulture conditions must be further studied.

5. Conclusions

SL is a fruit product with high economic value and is becoming increasingly popular in the Vietnam Mekong Delta region. However, together with developing fruticulture cultivation areas, people should pay attention to controlling its impact on the climate through better practices for mitigating GHG emission. An evaluation of GHG emissions from SL cultivation would help the government and policymakers to improve future agricultural planning. We used the LCA methodology with the MiLCA software, the IPCC guidelines, and previous studies results to estimate GHG emissions. Our results showed that SL cultivation emitted 7590 kg-CO2e ha−1 and 273.6 kg-CO2e t−1. In the long term, OF can reduce GHG emissions from SL cultivation by replacing 25% and 50% of N-CF. These replacements mitigated 11.7–22.5% GHG emissions per hectare of growing area and 12.2–25.6% per tonnage of commercial fruit. The emissions pay for nutrient gain from the fertilizer-based index of SL cultivation was 4.8–6.4 kg-CO2e kg-nutrients−1 ha−1 and 0.15–0.22 kg-CO2e kg-nutrients−1 t−1. We also improved the study on the application of OF for SL orchards by measuring N2O emissions under different irrigation practices and calculating the carbon trap. CO2e value labeling is one of the carbon labeling categories that enhances customer awareness of environmental concerns. We suggest a value emission label of 273.6 g-CO2e kg−1 Vietnam SL on-farm emissions as the first step for improving emissions in the future of SL growth.

Author Contributions

Investigation, P.V.T.T. and L.T.T.L.; conceptualization, L.T.T.L.; data curation, L.T.T.L.; formal analysis, L.T.T.L.; methodology, L.T.T.L.; writing—original draft preparation, L.T.T.L.; writing—review and editing, L.T.T.L., K.S. and Y.T.; supervision, K.S. and Y.T.; funding acquisition, K.S. and Y.T.; project administration, K.S. and Y.T. All authors have read and agreed to the published version of the manuscript.

Funding

This research was partly supported by MEXT KAKENHI Grant Number JP19H02875 and the Nippon Life Insurance Foundation.

Institutional Review Board Statement

The research was designated to follow the ethics course required by Kyushu University. We complied with the laws and regulations of Vietnam and Japan and followed the ethical guideline to conduct this research. We also provided the respondents with information on the research purpose and data processing and obtained their consent before conducting interviews.

Informed Consent Statement

Not applicable.

Data Availability Statement

All data are reported in the article.

Acknowledgments

Le Tran Thanh Liem gratefully acknowledges the financial support for this study from the Can Tho University Improvement Project VN14-P6, supported by a Japanese ODA loan.

Conflicts of Interest

The authors declare no conflict of interest.

Abbreviations

CFChemical fertilizer
CCClimate change
CO2eCO2 equivalents
EFEmission factor
E-NGEmissions pay for nutrient gain
GHGGreenhouse gas
LCALife cycle assessment
MiLCAMultiple interface Life Cycle Assessment
OFOrganic fertilizer
SDGsSustainable Development Goals
SLSeedless lime

References

  1. United Nations. The Road to Dignity by 2030: Ending Poverty, Transforming All Lives and Protecting the Planet—Synthesis Report of the Secretary-General on the Post-2015 Agenda; United Nations: New York, NY, USA, 2014. [Google Scholar]
  2. Arora, N.K.; Fatima, T.; Mishra, I.; Verma, M.; Mishra, J.; Mishra, V. Environmental Sustainability: Challenges and Viable Solutions. Environ. Sustain. 2018, 1, 309–340. [Google Scholar] [CrossRef]
  3. Praveen, B.; Sharma, P. A Review of Literature on Climate Change and Its Impacts on Agriculture Productivity. J. Public Aff. 2019, 19, e1960. [Google Scholar] [CrossRef]
  4. IPCC. Climate Change 2013: The Physical Science Basis. Working Group I Contribution to the Fifth Assessment Report of the Intergovernmental Panel on Climate Change; Stocker, T.F., Qin, D., Plattner, G.-K., Tignor, M., Allen, S.K., Boschung, J., Nauels, A., Xia, Y., Bex, V., Midgley, P.M., Eds.; Cambridge University Press: Cambridge, UK, 2013. [Google Scholar] [CrossRef] [Green Version]
  5. Cui, X.; Guo, L.; Li, C.; Liu, M.; Wu, G.; Jiang, G. The Total Biomass Nitrogen Reservoir and Its Potential of Replacing Chemical Fertilizers in China. Renew. Sustain. Energy Rev. 2021, 135, 110215. [Google Scholar] [CrossRef]
  6. Styles, D.; Adams, P.; Thelin, G.; Vaneeckhaute, C.; Chadwick, D.; Withers, P.J.A. Life Cycle Assessment of Biofertilizer Production and Use Compared with Conventional Liquid Digestate Management. Environ. Sci. Technol. 2018, 52, 7468–7476. [Google Scholar] [CrossRef]
  7. Diacono, M.; Persiani, A.; Testani, E.; Montemurro, F.; Ciaccia, C. Recycling Agricultural Wastes and By-Products in Organic Farming: Biofertilizer Production, Yield Performance and Carbon Footprint Analysis. Sustainability 2019, 11, 3824. [Google Scholar] [CrossRef] [Green Version]
  8. Curran, M.A. Strengths and Limitations of Life Cycle Assessment. In Background and Future Prospects in Life Cycle Assessment; Springer: Berlin/Heidelberg, Germany, 2014; pp. 189–206. [Google Scholar] [CrossRef]
  9. Sieverding, H.; Kebreab, E.; Johnson, J.M.F.; Xu, H.; Wang, M.; Grosso, S.J.D.; Bruggeman, S.; Stewart, C.E.; Westhoff, S.; Ristau, J.; et al. A Life Cycle Analysis (LCA) Primer for the Agricultural Community. Agron. J. 2020, 112, 3788–3807. [Google Scholar] [CrossRef]
  10. Martin-Gorriz, B.; Gallego-Elvira, B.; Martínez-Alvarez, V.; Maestre-Valero, J.F. Life Cycle Assessment of Fruit and Vegetable Production in the Region of Murcia (South-East Spain) and Evaluation of Impact Mitigation Practices. J. Clean. Prod. 2020, 265, 121656. [Google Scholar] [CrossRef]
  11. Mazis, A.; Litskas, V.D.; Platis, D.P.; Menexes, G.C.; Anagnostopoulos, C.D.; Tsaboula, A.D.; Mamolos, A.P.; Kalburtji, K.L. Could Energy Equilibrium and Greenhouse Gas Emissions in Agroecosystems Play a Key Role in Crop Replacement? A Case Study in Orange and Kiwi Orchards. Environ. Sci. Pollut. Res. 2021, 28, 29421–29431. [Google Scholar] [CrossRef]
  12. Vatsanidou, A.; Fountas, S.; Liakos, V.; Nanos, G.; Katsoulas, N.; Gemtos, T. Life Cycle Assessment of Variable Rate Fertilizer Application in a Pear Orchard. Sustainability 2020, 12, 6893. [Google Scholar] [CrossRef]
  13. Hashimi, R.; Matsuura, E.; Komatsuzaki, M. Effects of Cultivating Rice and Wheat with and without Organic Fertilizer Application on Greenhouse Gas Emissions and Soil Quality in Khost, Afghanistan. Sustainability 2020, 12, 6508. [Google Scholar] [CrossRef]
  14. Küstermann, B.; Kainz, M.; Hülsbergen, K.J. Modeling Carbon Cycles and Estimation of Greenhouse Gas Emissions from Organic and Conventional Farming Systems. Renew. Agric. Food Syst. 2008, 23, 38–52. [Google Scholar] [CrossRef] [Green Version]
  15. Aguilera, E.; Guzmán, G.; Alonso, A. Greenhouse Gas Emissions from Conventional and Organic Cropping Systems in Spain. I. Herbaceous Crops. Agron. Sustain. Dev. 2015, 35, 713–724. [Google Scholar] [CrossRef] [Green Version]
  16. Aguilera, E.; Guzmán, G.; Alonso, A. Greenhouse Gas Emissions from Conventional and Organic Cropping Systems in Spain. II. Fruit Tree Orchards. Agron. Sustain. Dev. 2015, 35, 725–737. [Google Scholar] [CrossRef] [Green Version]
  17. Wei, Z.; Ying, H.; Guo, X.; Zhuang, M.; Cui, Z.; Zhang, F. Substitution of Mineral Fertilizer with Organic Fertilizer in Maize Systems: A Meta-Analysis of Reduced Nitrogen and Carbon Emissions. Agronomy 2020, 10, 1149. [Google Scholar] [CrossRef]
  18. Ministry of Agriculture and Rural Development of The Socialist Republic of Vietnam. Report on the Implementation of the Agriculture and Rural Development Plan for the First Six Months, Tasks for the Last Six Months of 2020; Ministry of Agriculture and Rural Development of The Socialist Republic of Vietnam: Hanoi, Vietnam, 2020. (In Vietnamese) [Google Scholar]
  19. Huynh, T.H. Value Chain Approach to Developing Agricultural Products—Some Practical Issues in the Mekong Delta. J. Ethn. Monorities Res. 2019, 8, 1–7. [Google Scholar] [CrossRef] [Green Version]
  20. Ministry of Science and Technology of The Socialist Republic of Vietnam. Vietnamese Standards of Seedless Lime’s Fresh Fruit; Ministry of Science and Technology of The Socialist Republic of Vietnam: Hanoi, Vietnam, 2017. (In Vietnamese) [Google Scholar]
  21. Department of Agriculture and Rural Development of Hau Giang Province. Report on Agriculture and Rural Development of Hau Giang Province Sector—The Implementation in 2020 and Mission Direction in 2021; Department of Agriculture and Rural Development of Hau Giang Province: Vi Thanh, Vietnam, 2020. (In Vietnamese) [Google Scholar]
  22. Zhou, W.; Ma, Q.; Wu, L.; Hu, R.; Jones, D.L.; Chadwick, D.R.; Jiang, Y.; Wu, Y.; Xia, X.; Yang, L.; et al. The Effect of Organic Manure or Green Manure Incorporation with Reductions in Chemical Fertilizer on Yield-Scaled N2O Emissions in a Citrus Orchard. Agric. Ecosyst. Environ. 2022, 326, 107806. [Google Scholar] [CrossRef]
  23. Hasan, M.; Rahim, M.A.; Islam, A.K.M.S.; Rahman, M.A.; Naher, N. Effect of Management Practices on the Growth and Yield of Lime and Lemon. Int. J. Biosci. 2016, 8, 22–33. [Google Scholar] [CrossRef]
  24. Viana, D.S.; Carvalho, L.M.J.D.; Ribeiro, E.M.G.; Ortiz, G.M.D. Content of Total Polyphenols in Biodynamic Organic Acid Lime (Citrus Latifolia Tanaka) Clarified by Microfiltration. In Food Industrial Processes—Method and Equipment; Valdez, B., Ed.; InTech: London, UK, 2012; pp. 301–312. [Google Scholar]
  25. Budiarto, R.; Poerwanto, R.; Santosa, E.; Efendi, D.; Agusta, A. Production, Post-Harvest and Marketing of Kaffir Lime (Citrus Hystrix DC) In Tulungagung, Indonesia. J. Trop. Crop Sci. 2019, 6, 138–143. [Google Scholar] [CrossRef]
  26. Mahmoud, L.M.; Grosser, J.W.; Dutt, M. Silver Compounds Regulate Leaf Drop and Improve in Vitro Regeneration from Mature Tissues of Australian Finger Lime (Citrus Australasica). Plant Cell Tissue Organ Cult. 2020, 141, 455–464. [Google Scholar] [CrossRef]
  27. Hondebrink, M.A.; Cammeraat, L.H.; Cerdà, A. The Impact of Agricultural Management on Selected Soil Properties in Citrus Orchards in Eastern Spain: A Comparison between Conventional and Organic Citrus Orchards with Drip and Flood Irrigation. Sci. Total Environ. 2017, 581, 153–160. [Google Scholar] [CrossRef] [Green Version]
  28. Okuda, H.; Noda, K.; Sawamoto, T.; Tsuruta, H.; Hirabayashi, T.; Yonemoto, J.Y.; Yagi, K. Emission of N2O and CO2 and Uptake of CH4 in Soil from a Satsuma Mandarin Orchard under Mulching Cultivation in Central Japan. J. Jpn. Soc. Hortic. Sci. 2007, 76, 279–287. [Google Scholar] [CrossRef] [Green Version]
  29. Maestre-Valero, J.F.; Martin-Gorriz, B.; Nicolas, E.; Martinez-Mate, M.A.; Martinez-Alvarez, V. Deficit Irrigation with Reclaimed Water in a Citrus Orchard. Energy and Greenhouse-Gas Emissions Analysis. Agric. Syst. 2018, 159, 93–102. [Google Scholar] [CrossRef]
  30. Leon, A.; Minamikawa, K.; Izumi, T.; Chiem, N.H. Estimating Impacts of Alternate Wetting and Drying on Greenhouse Gas Emissions from Early Wet Rice Production in a Full-Dike System in An Giang Province, Vietnam, through Life Cycle Assessment. J. Clean. Prod. 2021, 285, 125309. [Google Scholar] [CrossRef]
  31. Tran, T.; Da, G.; Moreno-Santander, M.A.; Vélez-Hernández, G.A.; Giraldo-Toro, A.; Piyachomkwan, K.; Sriroth, K.; Dufour, D. A Comparison of Energy Use, Water Use and Carbon Footprint of Cassava Starch Production in Thailand, Vietnam and Colombia. Resour. Conserv. Recycl. 2015, 100, 31–40. [Google Scholar] [CrossRef]
  32. Trinh, L.T.K.; Hu, A.H.; Lan, Y.C.; Chen, Z.H. Comparative Life Cycle Assessment for Conventional and Organic Coffee Cultivation in Vietnam. Int. J. Environ. Sci. Technol. 2020, 17, 1307–1324. [Google Scholar] [CrossRef]
  33. Tran, T.; Branca, G.; Arslan, A.; Van Mai, T. Value Chain Analysis of Climate-Smart Shan Tea Production in the Northern Mountainous Region of Vietnam. Ital. Rev. Agric. Econ. 2016, 71, 155–169. [Google Scholar] [CrossRef]
  34. Phong, L.T.; Loi, P.T. Environmental Impact Assessment of Pummelo (Citrus Maxima Merr.) and Mango (Mangifera Indica L.) Production in the Mekong Delta. Can Tho Univ. J. Sci.—Part B Agric. Aquac. Biotechnol. 2014, 31, 39–50. [Google Scholar]
  35. The British Standards Institution—BSI. Assessment of Life Cycle Greenhouse Gas Emissions from Horticultural Products: Supplementary Requirements for the Cradle to Gate Stages of GHG Assessments of Horticultural Products Undertaken in Accordance with PAS 2050, PAS 2050-1; BSI Standards Limited: London, UK, 2012. [Google Scholar]
  36. Maraseni, T.N.; Cockfield, G.; Maroulis, J.; Chen, G. An Assessment of Greenhouse Gas Emissions from the Australian Vegetables Industry. J. Environ. Sci. Health Part B Pestic. Food Contam. Agric. Wastes 2010, 45, 578–588. [Google Scholar] [CrossRef]
  37. IPCC. Guidelines for National Greenhouse Gas Inventories; Eggleston, S., Buendia, L., Miwa, K., Ngara, T., Tanabe, K., Eds.; The Institute for Global Environmental Strategies: Kanagawa, Japan, 2006. [Google Scholar]
  38. Muhammad, W.; Vaughan, S.M.; Dalal, R.C.; Menzies, N.W. Crop Residues and Fertilizer Nitrogen Influence Residue Decomposition and Nitrous Oxide Emission from a Vertisol. Biol. Fertil. Soils 2011, 47, 15–23. [Google Scholar] [CrossRef]
  39. Jarecki, M.K.; Parkin, T.B.; Chan, A.S.K.; Hatfield, J.L.; Jones, R. Greenhouse Gas Emissions from Two Soils Receiving Nitrogen Fertilizer and Swine Manure Slurry. J. Environ. Qual. 2008, 37, 1432–1438. [Google Scholar] [CrossRef] [Green Version]
  40. Akiyama, H.; McTaggart, I.P.; Ball, B.C.; Scott, A. N2O, NO, and NH3 Emissions from Soil after the Application of Organic Fertilizers, Urea and Water. Water. Air. Soil Pollut. 2004, 156, 113–129. [Google Scholar] [CrossRef]
  41. Jones, S.K.; Rees, R.M.; Skiba, U.M.; Ball, B.C. Greenhouse Gas Emissions from a Managed Grassland. Glob. Planet. Change 2005, 47, 201–211. [Google Scholar] [CrossRef]
  42. Stalenga, J.; Kawalec, A. Emission of Greenhouse Gases and Soil Organic Matter Balance in Different Farming Systems. Int. Agrophysics 2008, 22, 287–290. [Google Scholar]
  43. Escanhoela, A.S.B.; Pitombo, L.M.; Brandani, C.B.; Navarrete, A.A.; Bento, C.B.; Do Carmo, J.B. Organic Management Increases Soil Nitrogen but Not Carbon Content in a Tropical Citrus Orchard with Pronounced N2O Emissions. J. Environ. Manag. 2019, 234, 326–335. [Google Scholar] [CrossRef]
  44. Stockwell, C.E.; Christian, T.J.; Goetz, J.D.; Jayarathne, T.; Bhave, P.V.; Praveen, P.S.; Adhikari, S.; Maharjan, R.; Decarlo, P.F.; Stone, E.A.; et al. Nepal Ambient Monitoring and Source Testing Experiment (NAMaSTE): Emissions of Trace Gases and Light-Absorbing Carbon from Wood and Dung Cooking Fires, Garbage and Crop Residue Burning, Brick Kilns, and Other Sources. Atmos. Chem. Phys. 2016, 16, 11043–11081. [Google Scholar] [CrossRef] [Green Version]
  45. Adhikari, S.; Mahapatra, P.S.; Sapkota, V.; Puppala, S.P. Characterizing Emissions from Agricultural Diesel Pumps in the Terai Region of Nepal. Atmosphere 2019, 10, 56. [Google Scholar] [CrossRef] [Green Version]
  46. Sustainable Management Promotion Organization. MiLCA Guidebook (Tentative); Sustainable Management Promotion Organization: Tokyo, Japan, 2014. [Google Scholar]
  47. Pergola, M.; D’Amico, M.; Celano, G.; Palese, A.M.; Scuderi, A.; Di Vita, G.; Pappalardo, G.; Inglese, P. Sustainability Evaluation of Sicily’s Lemon and Orange Production: An Energy, Economic and Environmental Analysis. J. Environ. Manag. 2013, 128, 674–682. [Google Scholar] [CrossRef] [Green Version]
  48. Venkat, K. Comparison of Twelve Organic and Conventional Farming Systems: A Life Cycle Greenhouse Gas Emissions Perspective. J. Sustain. Agric. 2012, 36, 620–649. [Google Scholar] [CrossRef]
  49. Ministry of Science and Technology of Vietnam. Decision on Announcing Vietnam National Standard on Organic Agriculture—Part 1: Products from Organic Agriculture (TCVN 11041-1:2017); Part 2: Organic Crops (TCVN 11041-2:2017); Part 3: Organic Livestock (TCVN 11041-3:2017); No.3883/QĐ-BKHCN dated on 29 December 2017; Ministry of Science and Technology of Vietnam: Hanoi, Vietnam, 2017. [Google Scholar]
  50. Akiyama, H.; Tsuruta, H. Effect of Organic Matter Application on N2O, NO, and NO2 Fluxes from an Andisol Field. Global Biogeochem. Cycles 2003, 17. [Google Scholar] [CrossRef]
  51. Shi, Y.; Liu, X.; Zhang, Q. Effects of Combined Biochar and Organic Fertilizer on Nitrous Oxide Fluxes and the Related Nitrifier and Denitrifier Communities in a Saline-Alkali Soil. Sci. Total Environ. 2019, 686, 199–211. [Google Scholar] [CrossRef]
  52. Cayuela, M.L.; Aguilera, E.; Sanz-Cobena, A.; Adams, D.C.; Abalos, D.; Barton, L.; Ryals, R.; Silver, W.L.; Alfaro, M.A.; Pappa, V.A.; et al. Direct Nitrous Oxide Emissions in Mediterranean Climate Cropping Systems: Emission Factors Based on a Meta-Analysis of Available Measurement Data. Agric. Ecosyst. Environ. 2017, 238, 25–35. [Google Scholar] [CrossRef] [Green Version]
  53. Raza, A.; Warraich, I.A.; Nawaz, M.A.; Asim, M.; Aziz, A.; Shireen, F.; Rehman, M.A. Does Furrow Irrigation System Improve Yield and Water Use Efficiency of Kinnow Mandarin (Citrus Reticulata Blanco)? Int. J. Agric. Ext. 2020, 8, 199–206. [Google Scholar] [CrossRef]
  54. Panigrahi, P.; Srivastava, A.K. Effective Management of Irrigation Water in Citrus Orchards under a Water Scarce Hot Sub-Humid Region. Sci. Hortic. 2016, 210, 6–13. [Google Scholar] [CrossRef]
  55. Bons, H.K.; Kaur, N.; Rattanpal, H.S. Quality and Quantity Improvement of Citrus: Role of Plant Growth Regulators. Int. J. Agric. Environ. Biotechnol. 2015, 8, 433. [Google Scholar] [CrossRef]
  56. Martínez-Alcántara, B.; Quiñones, A.; Polo, C.; Primo-Millo, E.; Legaz, F. Use of Nitrification Inhibitor DMPP to Improve Nitrogen Uptake Efficiency in Citrus Trees. J. Agric. Sci. 2013, 5, 1–18. [Google Scholar] [CrossRef]
  57. Shamseldin, A.; El-sheikh, M.H.; Hassan, H.S.A.; Kabeil, S.S.; Borg-elarab, N. Microbial Bio-Fertilization Approaches to Improve Yield and Quality of Washington Navel Orange and Reducing the Survival of Nematode in the Soil. J. Am. Sci. 2010, 6, 264–271. [Google Scholar]
  58. Munjonji, L.; Ayisi, K.K.; Mafeo, T.P.; Maphanga, T.; Mabitsela, K.E. Seasonal Variation in Soil CO2 Emission and Leaf Gas Exchange of Well-managed Commercial Citrus sinensis (L.) Orchards. Plant Soil 2021, 465, 65–81. [Google Scholar] [CrossRef]
Figure 1. GHG emissions by SL cultivation.
Sustainability 14 06102 g001
Figure 2. Emissions from agrochemicals used in SL cultivation (all scenarios).
Sustainability 14 06102 g002
Figure 3. Proportion of GHG emissions from SL cultivation activities.
Sustainability 14 06102 g003
Figure 4. Proportion of GHG emissions from fruit cultivation activities (†: [16], ‡: [34]).
Sustainability 14 06102 g004
Figure 5. GHG emissions from fertilizers used for SL cultivation based on growing area (a) and fresh fruit weight (b).
Sustainability 14 06102 g005
Figure 6. Proportion of GHG emissions from fertilizer production in SL cultivation.
Sustainability 14 06102 g006
Figure 7. Emissions pay for nutrients gain from different citrus cultivation based on growing area (a) and fresh fruit weight (b) [†: [16], ‡:[34]].
Sustainability 14 06102 g007
Table 1. Fertilizers used in S1, S2, and S3.
ScenariosN-CF
kg-N
P-CF
kg-P2O5
K-CF
kg-K2O
OF
kg-OF
S1N-CFS1P-CFS1K-CFS10
S20.75 × N-CFS1P-CFS2K-CFS2OFS2
S30.5 × N-CFS1P-CFS3K-CFS3OFS3
Table 2. Information on seedless lime cultivation and inputs inventory of the cultivation (S1) in 2018.
InputsUnitCurrent Seedless Lime Cultivation Practice
Research cultivation areaha64.3
Density of cultivationtrees ha−1684.0 ± 165.6
Total yieldt1938.1
Average productivityt ha−130.1 ± 10.8
DieselL ha−1449.3 ± 159.0
L t−112.0 ± 14.6
Pesticidekg ha−114.1 ± 10.4
kg t−10.58 ± 0.63
Fungicidekg ha−15.3 ± 7.01
kg t−10.18 ± 0.25
N-CFkg-N ha−1621.6 ± 295.9
kg-N t−123.2 ± 12.1
P-CFkg-P2O5 ha−1289.9 ± 116.0
kg-P2O5 t−111.2 ± 6.1
K-CFkg-K2O ha−1282.1 ± 71.1
kg-K2O t−110.6 ± 3.3
Note: The data were calculated per hectare of SL growing area (kg-input ha1) to produce one tonnage of SL fruit (kg-input t1).
Table 3. Differences in three scenarios.
InputsUnitS1S2S3
OFkg-OF ha−105180 ± 246510,360 ± 4930
kg-OF t−10193.6 ± 101.1387.3 ± 202.2
N-CFkg-N ha−1621.6 ± 295.9466.2 ± 221.9310.8 ± 147.9
kg-N t−123.2 ± 12.117.4 ± 9.111.6 ± 6.1
P-CFkg-P2O5 ha−1289.9 ± 116.0188.3 ± 114.9104.6 ± 106.9
kg-P2O5 t−111.2 ± 6.17.4 ± 5.54.3 ± 4.8
K-CFkg-K2O ha−1282.1 ± 71.1178.5 ± 63.485.5 ± 67.1
kg-K2O t−110.6 ± 3.36.7 ± 2.73.3 ± 2.6
Fertilizer’s
mitigation: S2–S1
kg-P2O5 ha−1-101.6 ± 45.9-
% P used-39.6 ± 21.9-
kg-K2O ha−1-103.6 ± 49.3-
% K used-36.8 ± 14.8-
Fertilizer’s
mitigation: S3–S1
kg-P2O5 ha−1--185.3 ± 72.5
% P used--69.4 ± 26.9
kg-K2O ha−1--196.7 ± 78.1
% K used--69.9 ± 21.3
Publisher’s Note: MDPI stays neutral with regard to jurisdictional claims in published maps and institutional affiliations.

