Article

Environmental Impacts of Boom-Corridor and Selectively Thinned Small-Diameter-Tree Forests

1
Department of Forest and Environmental Engineering and Management, Universidad Politécnica de Madrid, ES-28040 Madrid, Spain
2
Department of Forest Biomaterials and Technology, Swedish University of Agricultural Sciences, SE-90183 Umea, Sweden
3
The Forestry Research Institute of Sweden (Skogforsk), SE-91821 Savar, Sweden
4
Faculty of Science and Forestry, School of Forest Sciences, University of Eastern Finland, P.O. Box 111, FI-80101 Joensuu, Finland
5
Slovenian Forestry Institute, SI-1000 Ljubljana, Slovenia
6
Department of Forestry and Renewable Forest Resources, Biotechnical Faculty, University of Ljubljana, SI-1000 Ljubljana, Slovenia
*
Author to whom correspondence should be addressed.
Sustainability 2022, 14(10), 6075; https://doi.org/10.3390/su14106075
Submission received: 16 March 2022 / Revised: 12 May 2022 / Accepted: 14 May 2022 / Published: 17 May 2022
(This article belongs to the Section Sustainable Forestry)

Abstract

:
European forest stands of small-diameter trees can provide industries with biomass as an alternative to fossil use. Small-tree harvesting is costly using conventional methods but using accumulating felling heads (AFH) in combination with a novel boom-corridor thinning (BCT) technique can increase harvester productivity and supply cost efficiency. This method has great potential to reduce costs, but its environmental impact compared with selective thinning (ST) needs to be determined. The objectives of this study were therefore to quantify and compare tree and soil damage as well as air, water and soil emissions for both BCT and ST in various European small-diameter-tree forests. Trials were performed in 84 study units (42 replications per thinning technique) across four countries. Damaged trees (with a diameter at breast height ≥ 7 cm) were measured after thinning and after forwarding. Harvesting emissions were calculated from a life cycle assessment. The percentage of remaining trees that had been damaged by the harvesting processes was 13% and 19% for BCT and ST, respectively, and the difference was significant. BCT exhibited the lowest emissions in all environmental impact categories considered, in all countries. Greenhouse gas emissions were on average 17% lower for BCT. BCT in small-diameter-tree stands therefore reduces the environmental impact of thinning operations compared with conventional methods, and results in less damage to the remaining trees.

1. Introduction

In Europe, the forest area, growing stock and net annual wood increment have increased by 9%, 50% and 25%, respectively, since 1990 [1]. Today, 35% of European land area is covered by forests [1], although in Finland, Sweden and Slovenia the proportion of forest area is much higher, being 75%, 69% and 58%, respectively [1,2]. In Spain, 37% of land is covered by forests [3], which increases to 55% (based on 2019 data) if shrubland is included [4]. Across Finland, Sweden, Slovenia and Spain, large areas of small-diameter trees and dense stands are present within the forested areas [5,6,7,8,9], representing a currently underutilized biomass arising from young and dense forest stands that could boost the growing bioeconomy as a source of renewable energy and bio-based materials.
The amount of wood growing in Europe is greater than the amount being harvested annually: around 73% of the net annual increment is felled [1]. However, this alone does not ensure the sustainability of wood supply and forest ecosystems. Contingency is needed to accommodate disturbances, such as forest fires, windstorms, snowfalls or pests, and it is becoming increasingly important to actively manage forest areas, including young forests, in order to minimize damage and loss and maximize productivity.
Common forestry practices on young and dense stands include pre-commercial thinnings in northern countries and forest fire prevention treatments in southern countries [10,11,12]. In general, neither of these conventional practices collect and extract forest biomass. An alternative is the use of multi-tree handling with accumulating felling heads (AFH) and the extraction of whole trees (integrating pulpwood and energy wood sections). AFH can be applied with conventional selective thinning (ST) or with the novel boom-corridor thinning (BCT) method [13]. With BCT, the trees are felled by a linear movement of the harvester’s booms along narrow, up to 2 m wide, corridors, instead of selecting individual trees to be cut, as in ST [14]. BCT increases harvester productivity by 16% compared with ST in young and dense small-diameter-tree stands [15], while simultaneously fulfilling future production goals [16,17]. Witzell et al. [18] has suggested that BCT could also promote higher biodiversity indexes than ST. However, any residual stand damage and harvest emissions caused by BCT have yet to be evaluated.
Abdullah et al. [19] suggested that the risk of damaging residual stands is higher during thinning operations, and Sinclair et al. [20] suggested that damage to tree butts facilitates fungal attack. Standing trees damaged by harvesting operations are susceptible to fungal decay [21] and, if a fungal attack is severe enough, the tree may even die. More decay is seen in non-resinous tree species than in resinous species, because on the latter the fresh wounds are often covered by the resin [22]. The risk and severity of fungal decay therefore depends on wound intensity, wound location, tree size, species [23,24] and, in northern climates, the ambient temperature at the time of harvesting, and it is important to minimize the degree of damage to the standing trees. Harvesting operations can also damage forest soils by compacting them. The presence of rutting indicates that the forest machinery has exceeded the ground-bearing capacity of the forest soil [25], and soil compaction can increase soil penetration resistance, reducing root growth [26]. All these factors negatively affect soil ecology, forest productivity and forest regeneration [27].
When evaluating the environmental performance of harvesting operations, fossil fuel consumption and emissions also need to be taken into consideration. The more fossil fuel a harvesting process requires per unit of mass harvested, the less the potential climatic benefit provided by the harvested biomass. As well as machine design and engine technology, the operational method used influences fuel consumption [28]. Life cycle assessment (LCA) is a standardized methodology that evaluates the environmental impact associated with production systems [29]. LCA can be used to analyze and compare different harvesting systems and working methods with respect to energy and resource consumption, as well as associated emissions into the air, water and soil, tied to system performance and the final forest product [30]. The functional unit is the reference flow regarding which inputs (e.g., materials and energy) and outputs (e.g., air, water and soil emissions) are to be reported, as well as the final environmental results [29]. A functional unit based on oven-dry tonnes (ODt) can be used to compare different harvesting technologies and processes, and other woody systems can also be assessed from an LCA perspective [31,32,33,34,35]. The results from an LCA can then be used in decision-making strategies to inform system and working method choices by evaluating both the productivity and potential environmental impact of alternative working practices. Damage to the soil and trees and fossil fuel consumption should all be minimized to ensure sustainable forest production and healthy forest ecosystems.
Because BCT is a novel technique, as yet little is known about its environmental impact. The aim of this study was to quantify and compare tree and soil damage and thinning emissions from BCT and ST in small-diameter-tree stands with various characteristics in Sweden, Finland, Slovenia and Spain. The results will shed light on whether BCT with AFH can contribute to the environmental sustainability of small-diameter tree thinning. Moreover, the results will inform further development of environmentally sound dense-stand management in various types of European forests.

2. Materials and Methods

2.1. Study Area, Equipment and Machine Operator

Trials were performed between autumn 2019 and autumn 2021 at eight field study locations across four European countries: Bräcke, Sweden (62°48′34″ N, 15°27′49″ E); Kontiolahti, Finland (two stands: 62°58′21″ N, 29°42′38″ E; 62°58′11″ N, 29°42′44″ E); Mozelj and Onek, Slovenia (three stands: 45°36′01″ N, 14°57′18″ E; 45°37′46″ N, 14°55′38″ E; 45°37′55″ N 14°56′00″ E); and Villardeciervos, Spain (two stands: 42°25′34″ N, 6°18′49″ W; 42°26′39″ N, 6°20′56″ W). A total of 84 study units (20 in Sweden, 12 in Finland, 32 in Slovenia and 20 in Spain) was marked out, each approximately 1000 m2 (approx. 50 × 20 m). The characteristics of the pre-thinning stand and harvested trees are shown in Table 1 and Table 2. Half of the study units in each country were assigned BCT, and half ST, resulting in 42 units per thinning technique. Thinning was carried out according to Bergström et al. [13], using the same harvester and operator at all sites. The width on each side of the strip road corresponded to the harvester’s crane reach (approx. 10 m). The total thinned area was 8.2 ha.
A Komatsu 901.4 harvester with an engine power of 150 kW, equipped with an upgraded Bracke C16.c AFH, was used in all 84 study units. The forwarder models used were a Komatsu 855.1 in Sweden, a Komatsu 845 in Finland, a Gremo 950R in Slovenia, and a Komatsu 865 in Spain.

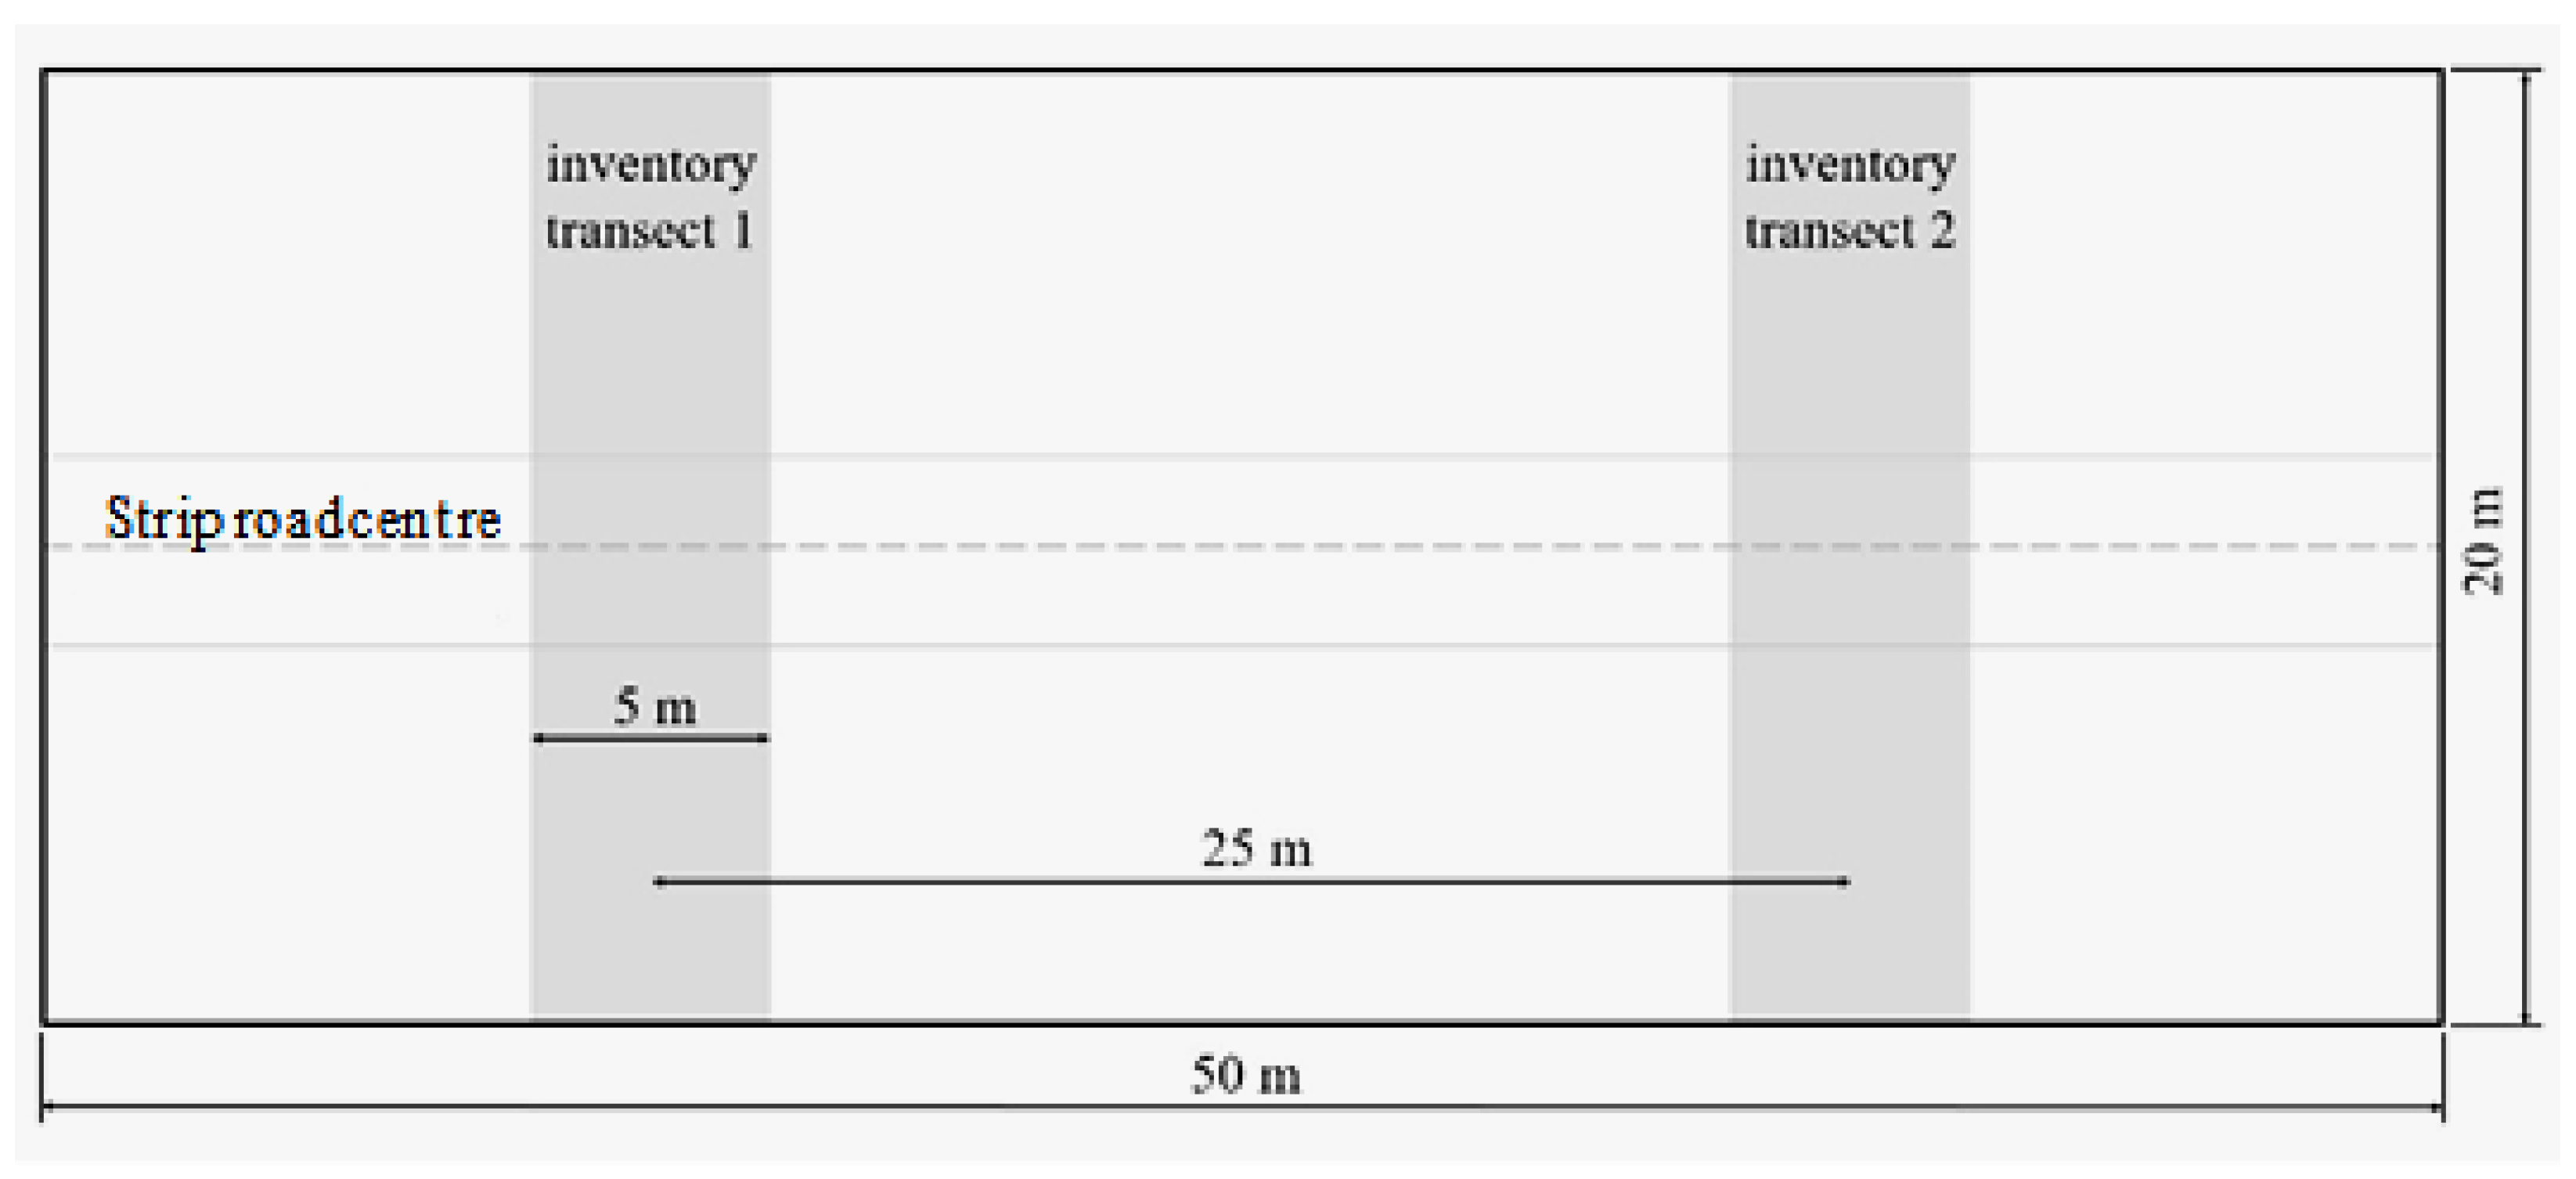
2.2. Post-Thinning Damage Inventory

Soil and tree damage was assessed after thinning and before forwarding, and again after forwarding. For each study unit, after thinning, the damaged trees (DBH ≥ 7 cm) along the strip road and an additional 2 m width (1 m on each side) were inventoried. The strip road width was measured according to Björheden and Fröding [36], and the length of soil damage (rutting > 10 cm depth) along the strip road was also measured. After forwarding, damaged trees (DBH ≥ 7 cm), stump height (with a stump diameter > 1 cm) and severe damage to adjacent vegetation were inventoried in transects for each study unit (with a sampled surface area of 200 m2 per unit) (Figure 1).
The severity of tree damage was classified into three categories: scratched bark (only the bark was affected), squeezed bark (the bark was affected, and the wound reached the sapwood without damaging it), and wood damage (the sapwood was affected). Tree damage height (<0.3 m, 0.3–1.0 m, >1.0 m) and area (<50 cm2, 50–200 cm2, 200 cm2), number of wounds per tree, cause of damage and destroyed trees (broken stem, most of the crown broken or uprooted) were also assessed and inventoried.

2.3. Statistical Analyses

Statistical analyses were performed using Statgraphics Centurion 18, with results regarded as significant if the p-value was <0.05. A t-test was used to assess any differences in damage characteristics between thinning techniques and country. When the data did not follow a normal distribution, a Kruskal–Wallis test (the non-parametric version of ANOVA) was used instead.
The influence of number of damaged trees, stand density, harvest intensity (trees remaining with DBH ≥ 7 cm), average DBH and thinning technique was investigated through multiple regression analyses.

2.4. Life Cycle Impact Assessment

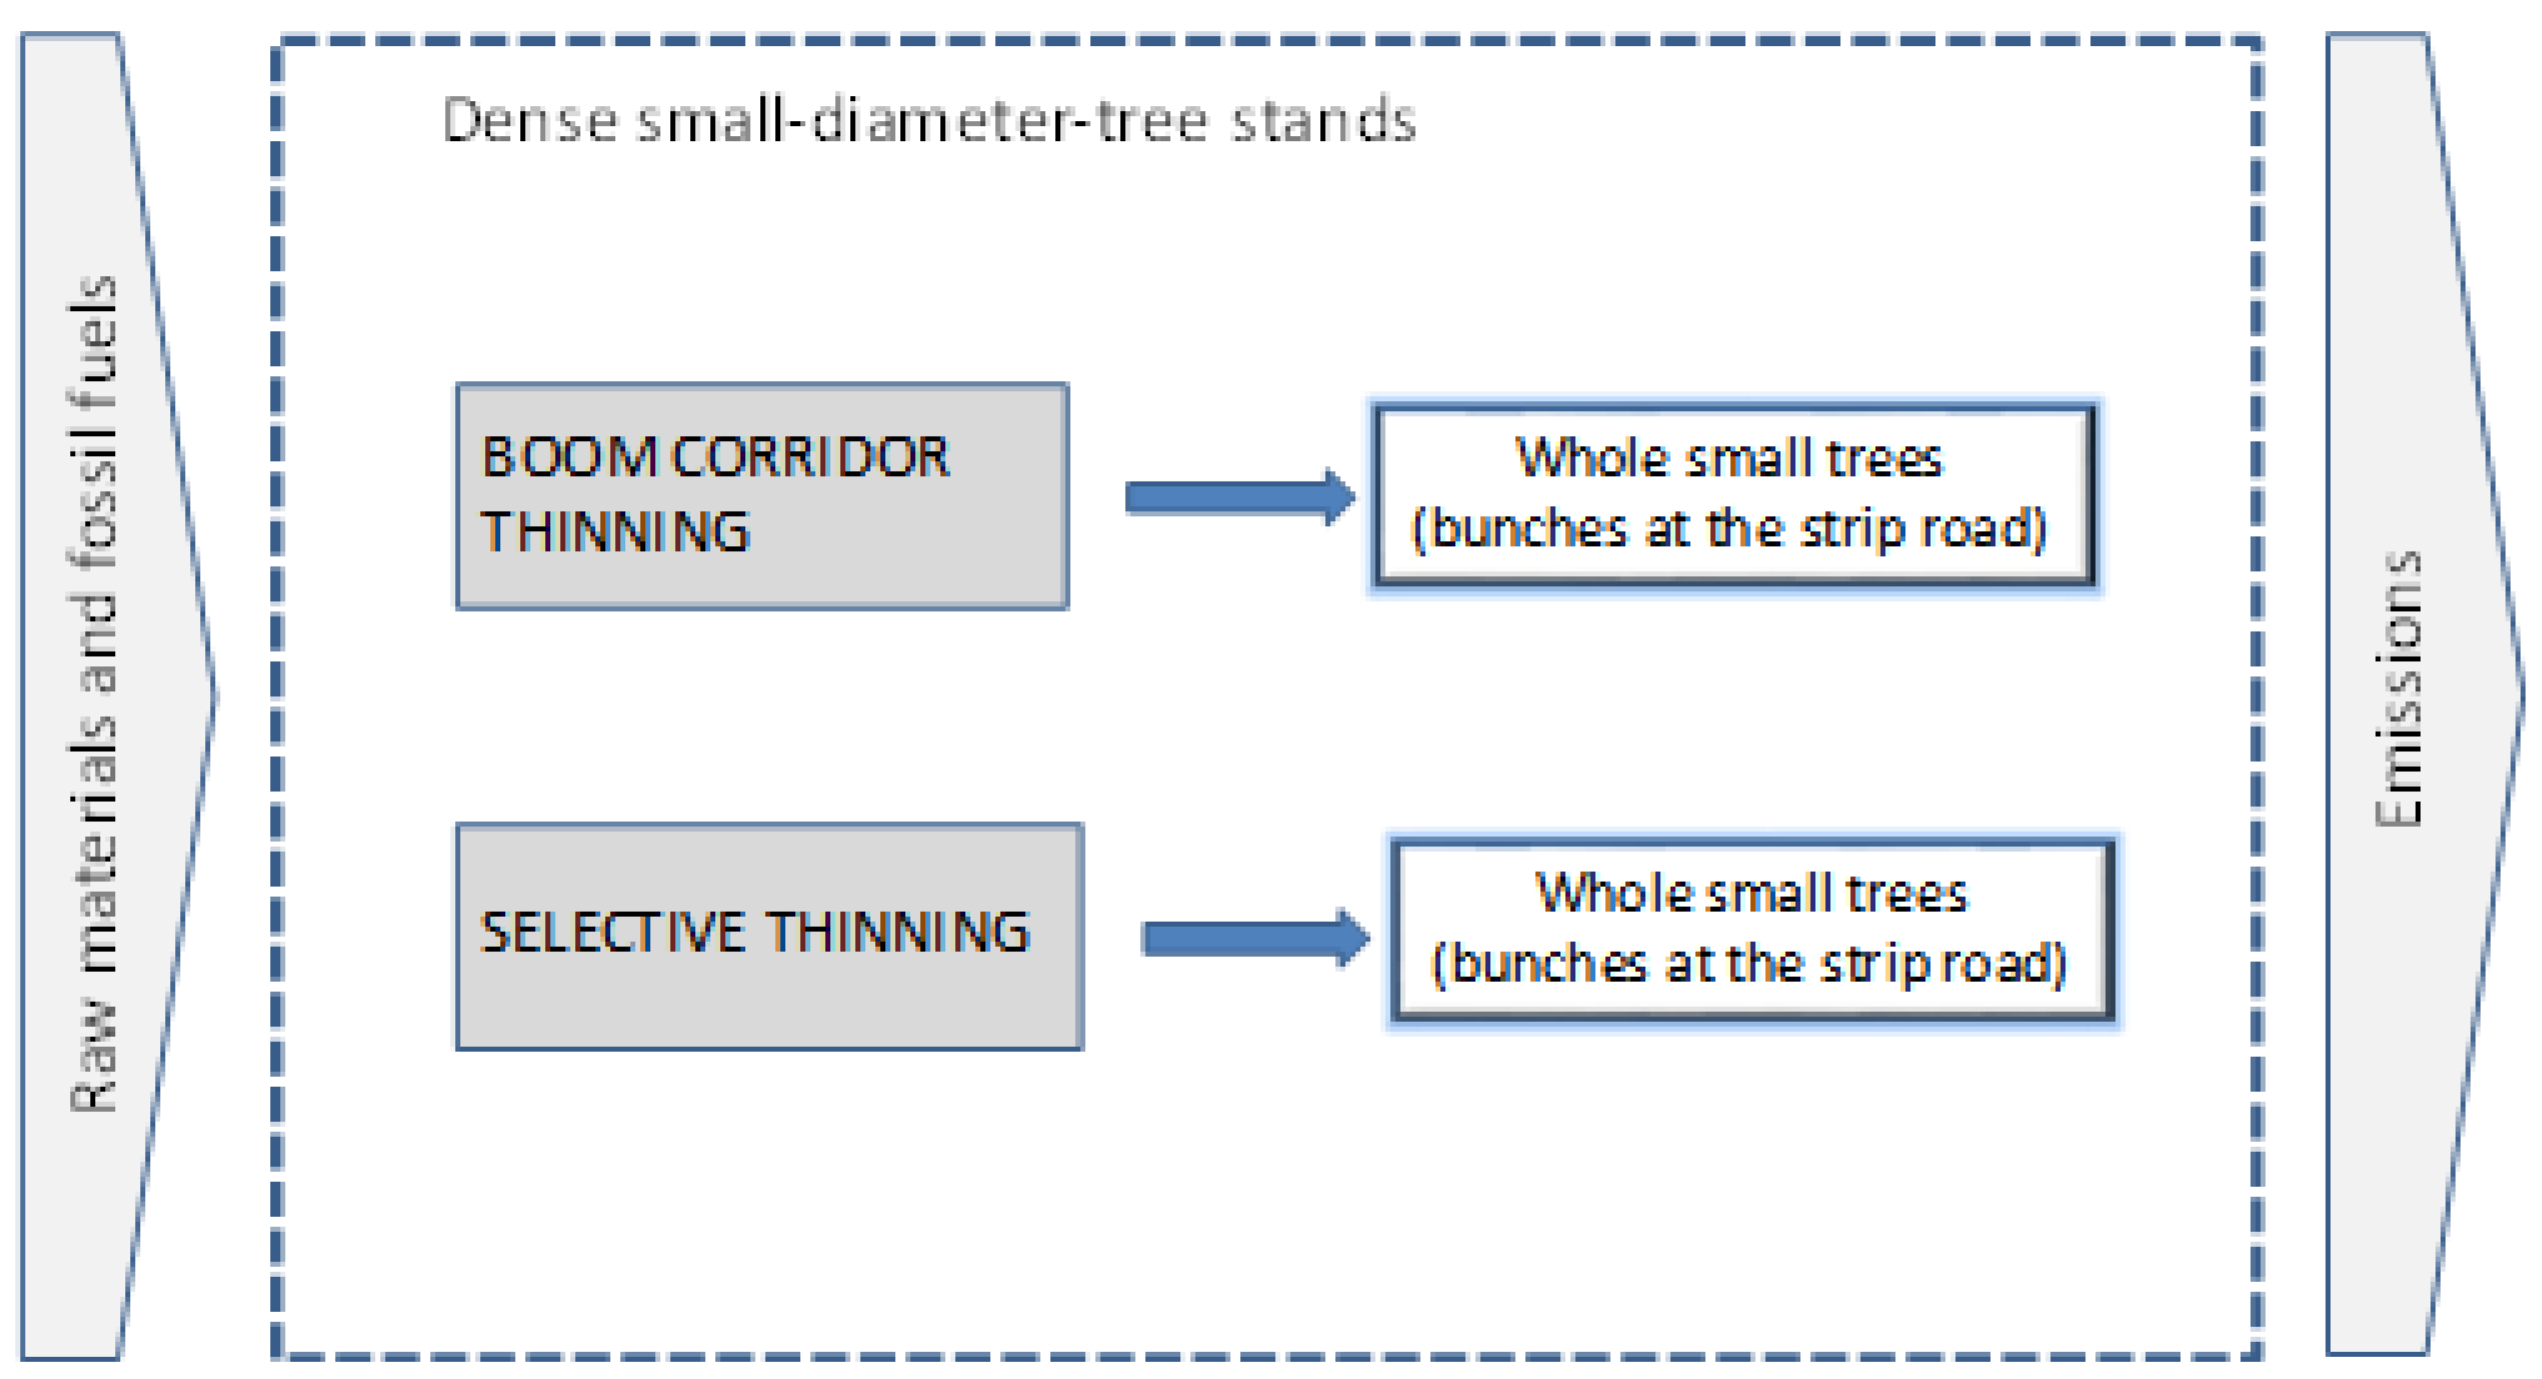
2.4.1. Goal and Scope, System Boundaries and Study Scenarios

The aim of the LCA was to investigate and compare the environmental profiles of BCT and ST applied to small-diameter stands in four European countries. In total, eight scenarios (two scenarios per country) were analyzed. Different stand densities and forest types were assessed and compared, and 1 ODt of biomass from small-diameter trees on the strip road was selected as the functional unit.
The system boundaries defined the processes that were included in the LCA. Using a gate-to-gate approach, the assessment only considered the thinning process, because this was the main focus of the study (Figure 2), and the forwarding process was carried out with different forwarders and drivers in each country. The production and maintenance of the harvester used for thinning, and the production of other inputs such as fossil fuels, were included. Emissions arising from changes in soil carbon stocks and assimilation of CO2 by trees were excluded. Activities related to the construction and maintenance of roads, further forest operations, final product manufacture, product use and end of life were excluded, because the focus was a comparison of the thinning techniques.

Allocation Procedure

Allocation was unnecessary because all the system boundary processes yielded only whole trees.

Comparisons between Thinning Techniques

The scenarios were standardized in terms of functional unit and methodological assumptions, i.e., system boundaries, database used for secondary data and impact assessment method, in order to carry out a valid comparison.

2.4.2. Data Inventory

Data quality is a key factor influencing the confidence in LCA results. “The levels of cut-off criteria and the maximum permissible uncertainty are together with the achieved technical, geographical and time-related representativeness as well as method consistency the key measure for the overall quality of the outcomes of the life cycle inventory/LCA study” [37].
For the analysis, primary data was used for the foreground system (processes explicitly related to small-tree thinning) whenever possible. Primary data from the field experiments was used for the BCT and ST processes applied during the trials [13] (Table 3). Lubricant oil consumption was taken from the literature [35]. Secondary data from the Ecoinvent 3.01. 2014 database® [38,39,40] was used for the background system (processes associated with the machinery and fossil fuel production). The Ecoinvent processes were adapted for the specific characteristics of the activities involved (fossil fuel consumption, weight and lifespan of machinery used).

2.4.3. Impact Assessment

Assigning the life cycle data inventory to the selected impact categories (classification) and calculating the impact category indicator results (characterization) are mandatory steps of an LCA [41]. The selection of impact categories and characterization model should be consistent with the goal and scope of the LCA [41].
The LCA was conducted using the characterization factors given for the ReCiPe (H) midpoint method with a 100-year time horizon, v.10. [42]. The ReCiPe midpoint is a model commonly used in LCA studies of forest production [43], and a 100-year time horizon is one of the most commonly used characterization factors for potential climate impact in LCA studies [44,45]. The potential impacts analyzed were climate change potential (CCP) (kg CO2-eq), terrestrial acidification potential (TAP) (g SO2-eq), marine eutrophication potential (MEP) (g N-eq), freshwater eutrophication potential (FEP) (g P-eq), photochemical oxidant formation potential (POFP) (g NMVOC) and fossil fuel depletion potential (FDP) (kg oil-eq). CCP is relevant because of the current climate change context. The other categories are common potential impacts reported in LCAs for forest systems [43], which facilitates comparisons with other studies. Furthermore, as processes with positive effects in one impact category may negatively affect others, it is important to analyze different impact categories in order to draw meaningful conclusions. SimaPro 8.0.3 software (PRé Sustainability B. V., Amersfoot, The Netherlands) was used for inventory data implementation and the calculations.

3. Results

3.1. Overall Damage Results

The number of damaged trees along the strip roads after thinning was on average lower for BCT, but only significantly so for Slovenia (p-value = 0.013). After forwarding, the number of damaged trees in the transects was on average lower for BCT in Finland, Slovenia and Spain, but not for Sweden. Differences after forwarding were only significant for Spain (p-value = 0.015) (Table 4). When analyzing the data from the four countries together, the number of damaged trees per 100 m of strip road after thinning, and the number of damaged trees per ha after forwarding, was 30% and 23% lower with BCT, respectively, but did not differ significantly at the 5% significance level (p-value = 0.069 and 0.141, respectively). However, when comparing the percentage of damaged remaining trees with DBH ≥ 7 cm, the number of damaged trees after forwarding was 32% significantly lower with BCT (p-value = 0.041) (Figure 3). The average stump height and degree of soil damage were similar for both thinning techniques in each country (Table 5 and Table 6).

3.2. Damage Characteristics

In Sweden and Finland, the most common sign of damage was squeezed bark, while scratched bark and wood damage were the most common in Slovenia and Spain, respectively (Table 7). The height of the damage on the trees varied between countries and thinning technique. However, in Finland and Spain, most of the damage was located below 30 cm for both thinning techniques (Table 8). The area of the damage was generally below 50 cm2 in all four countries and for both thinning techniques, with the exception of ST after forwarding in Slovenia, where most of the damage was larger than 200 cm2 (Table 8). The average number of damaged trees was similar for both thinning techniques and varied from 1 in Finland to 1.6 in Sweden. The average number of destroyed trees per study unit varied from 0 to 0.3. The main cause of damage was the harvester head movement for both of the thinning techniques (Table 9). Severe damage to adjacent vegetation after forwarding was only observed in a few study units in Sweden and Spain, representing areas between 7 and 24 m2 ha−1.
There was no statistically significant difference between BCT and ST mean values at the 5% significance level for any of the damage characteristics, with the exception of the damage caused by harvester wheels and a damage height < 0.3 m after forwarding in Slovenia, which were significantly different (p-value = 0.01) between BCT and ST (Table 8 and Table 9, respectively).
The influence of stand density, harvest intensity (remaining trees with DBH ≥ 7 cm and removals), average DBH and thinning technique on the number of damaged trees was also tested using a multiple regression analysis. Although the R-squared statistic indicated that the fitted model only explained 28% of the variability in the percentage of damaged trees, there was a significant relationship between the damaged trees, removals, remaining trees and thinning techniques at the 95.0% confidence level. The regression analysis showed that the percentage of damaged remaining trees increased with harvest intensity: a higher harvest intensity led to fewer remaining trees and a higher number of removals. The thinning technique also had a clear effect, with a decrease in the percentage of damaged trees for BCT. This was introduced in the multiple regression as a dummy variable, with zero set for ST, and was modeled according to Equation (1):
% DT = 19.3696 + 0.000744147 × R − 0.0066808 × RT − 5.06037 × WM
  • R-squared = 28.4%
  • R-squared (adjusted for d.f.) = 25.3%
  • p-value = 0.0000
where %DT is the percentage of damaged remaining trees with DBH ≥ 7 cm per ha; RT is the number of remaining trees with DBH ≥ 7 cm per ha; R is the total number of removed trees per ha; and WM is the working method (thinning technique) as a categorical variable (1 for BCT and 0 for ST). The statistic parameters of the fitted Equation (1) are shown in Table 10.

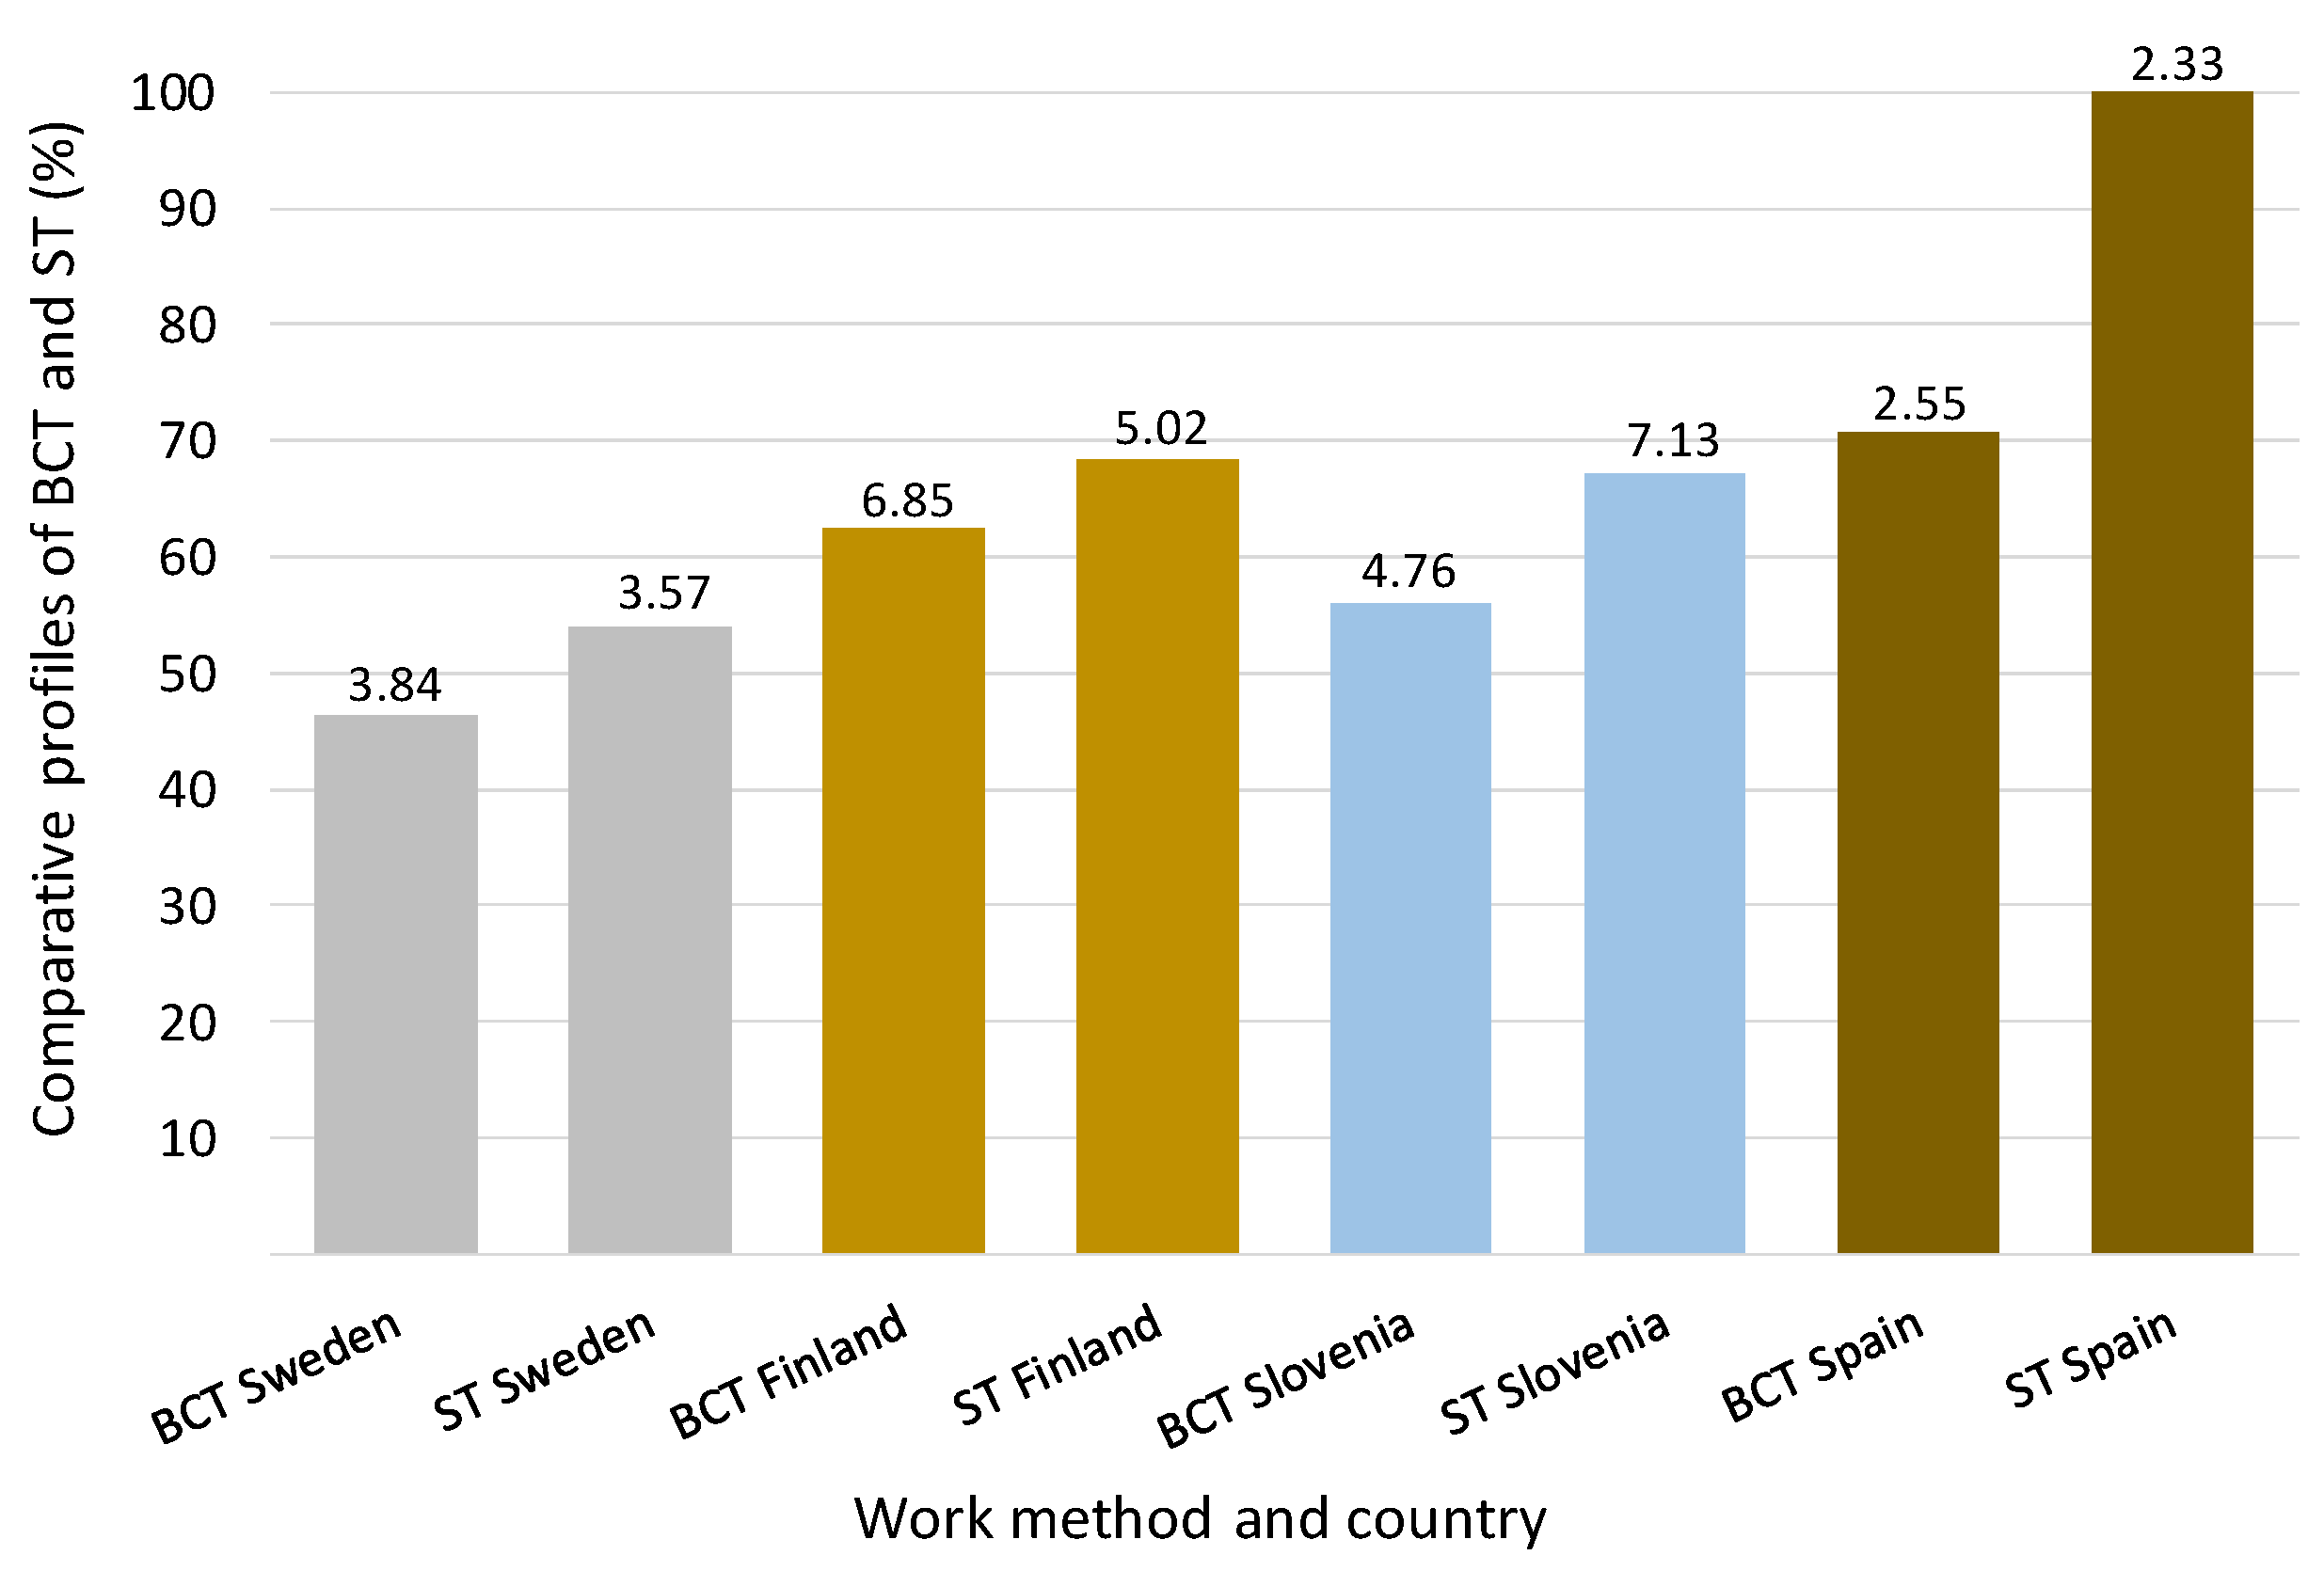
3.3. LCA Interpretation and Results

BCT exhibited the lowest emissions in all the environmental impact categories considered (Table 11). In terms of greenhouse gas emissions (GHG), BCT emissions were 14%, 9%, 16% and 29% lower than ST in Sweden, Finland, Slovenia and Spain, respectively (Figure 4). The higher productivity of BCT (Table 3) explains these differences, because the GHG emissions were mainly the result of diesel combustion by the harvester. The harvester and diesel production made a minor contribution to CCP.

4. Discussion

The aim of this study was to assess and compare tree and soil damage, stump height and thinning emissions for BCT and ST applied to young and dense forest stands in Sweden, Finland, Slovenia and Spain, representing northern boreal forests and southern Mediterranean forests. The number of damaged trees was lower with BCT than ST, which can be explained by the reduction in maneuvering work required by the harvester crane for BCT, reducing the risk of damage to the remaining trees. This difference was 30% lower at a 10% significance level (p-value = 0.069) when the number of damaged trees was compared per 100 m of strip road after thinning. In terms of emissions, BCT displayed the lowest in all the environmental impact categories considered across all four countries. This was because of the higher productivity, and therefore the lower fuel consumption per functional unit, when using BCT.
The highest numbers of damaged trees per 100 m of strip road after thinning, and damaged trees per ha after forwarding, were observed in Slovenia. Although the initial stand density in Slovenia was very similar to Sweden (Table 1), the proportion of removals was higher than in the other countries (on average 68% of the initial stand density for both thinning techniques), which led to more damaged trees because it entailed more maneuvering. In addition, the average height of the trees in the Slovenian stands was higher (Table 1), which could have contributed to the larger number of damaged trees, because more “top bucking” operations were carried out. Ground roughness (2 in the GYL classification- Classes of bearing capacity (G), ground roughness (Y) and slope (L) according to the Swedish terrain classification scheme [46]) and slope (1 and 2 in the GYL classification, depending on the stand) can also increase the number of damaged trees. However, the same ground roughness was observed in Sweden as Slovenia, and the same maximum slope was observed in Finland. Therefore, these factors by themselves cannot explain the difference.
The highest percentage of damaged remaining trees (DBH ≥ 7 cm) was observed with ST in Finland, followed by ST and BCT in Slovenia. The high value from Finland could be explained by the high biomass removal and low remaining stand density, which was in line with the recommended target densities for conventional first thinning in Finland (800 trees ha−1). In addition, the ST stands in Finland had 60% less trees with DBH ≥ 7 cm than its BCT stands.
Concerning soil damage, Sweden had the highest values per 100 m of strip road (Table 5). Although the bearing capacity following the GYL classification had a value of 2, similar to most of the other stands, the soil moisture content was high when the thinning took place, which contributed to an increased level of damage.
In relation to stump height, the ground roughness and the initially dense undergrowth contributed to the higher stumps left in Sweden. The undergrowth reduced the harvester operator’s line of sight, and the presence of rocks meant high stumps had to be left to avoid damaging the cutting chain.
When comparing the results of this study with others, it is important to take into account any differences in machinery, stand characteristics, forestry treatments, thinning techniques and methodologies used. A large variation in the percentage of damaged remaining trees can be found in the literature: from less than 5% to up to 46% [22,47]. In this study, this percentage varied from 6% to 28% (Figure 3), 13% and 19% being the average values for BCT and ST, respectively. Similar percentages have been found elsewhere, for example 13–17% by Jäghagen and Lageson [48], 12–23% by Tavankar et al. [49] and 13% by Cabral [50,51]. However, higher percentages have also been reported [51,52]. Bergström et al. [15] compared BCT and ST in young, dense Scots pine stands in Sweden. In their study, assessing the damage to trees remaining along the strip road after thinning and before forwarding, about two trees per 100 m were damaged after both thinning techniques. Their results are similar to those obtained here for Spain, but half that obtained for Sweden. Läspä and Nurmi [53] also compared harvesting damage between BCT and ST and found that ST caused less damage. However, they reported their results as damage occurrences per harvested m3 and did not present the percentage of damaged remaining trees. In addition, they highlighted the greater experience of the ST operator. This underlines the importance of training for machine drivers, to minimize the environmental damage regardless of the thinning method used. However, BCT does represent a lower risk of damage to trees and requires less experience than ST because of the fewer boom movements needed between trees within a dense stand.
Tree damage can negatively affect the future health and quality of remaining trees [54]. Wound severity, height and tree species all influence the wound healing rate [21,55]. Fast-growing tree species require less time to heal from harvesting wounds than slow-growing species [56], while shorter and cooler growing seasons can slow down wound closure [47]. Wound areas smaller than 100 cm2 are commonly reported during thinning operations [47,51,57,58,59], which is in agreement with the present study. The wound location on the stem and damage type both show a wider variation between studies. Damage to the lower part of the stem was reported as the most common by Lopes et al. [51] and Ursic et al. [59], while Heitzman and Grell [47] suggested that most of the damage occurred 90–180 cm above ground level.
Harvest intensity has been reported elsewhere as one of the main factors affecting the proportion of damaged remaining trees during harvesting [49,60,61]. Similarly, a significant relationship between the number of damaged trees and harvest intensity was found here (Equation (1)). In addition, the thinning technique appeared to have a significant influence on the number of damaged trees, in accordance with Prinullis et al. [62], who found that different thinning techniques had different impacts on stand damage.
Concerning emissions, the GHG emissions of the thinning techniques varied from 9.1 to 13.8 kg CO2 eq/ODt and 10.6 to 19.6 kg CO2 eq/ODt for BCT and ST, respectively. Similar values, around 14 kg CO2 eq/ODt, have been reported by De la Fuente et al. [35] for Sweden. In that study, a harvester with a multi-tree handling head time consumption of 23 PMh/ODt was reported. The difference between their figure and the values reported in this study (Table 3) explains the differences in emission results.
Despite the fact that impacts on biodiversity were not assessed directly in this study, higher biodiversity indexes for BCT compared with ST may be expected [18]. The study’s main limitation is related to the assessment of damaged trees after thinning and before forwarding, which was only carried out along the strip road and not in the transects, because the felled trees made assessment impossible within the transects before forwarding. Therefore, the after thinning but before forwarding quantification is reported as the number of damaged trees per 100 m of strip road and not per ha. The after forwarding measurements were influenced by the forwarding work, which was performed with a different machine in each country. Nevertheless, any damage caused by the forwarder in each country was identified and quantified. The sampling design included perpendicular transects to the strip roads, which helped eliminate the potential bias of overestimated overall damage levels because the areas of greatest machine activity, and therefore the greatest potential damage, are expected to be close to the strip roads.

5. Conclusions

This study indicates that, compared with conventional ST, BCT can reduce the number of damaged trees after thinning, and reduce diesel consumption, and air, water and soil emissions, per ODt. The lower number of damaged trees and lower fuel consumption corresponds to a reduction in risk of tree infection and decay, and in costs and emissions during the thinning process, respectively, which is important both economically and environmentally. The use of BCT in dense small-diameter-tree stands appears to have great potential in terms of reducing tree damage and emissions.

Author Contributions

Conceptualization, T.d.l.F. and E.T.; Data curation, T.d.l.F.; Formal analysis, T.d.l.F. and E.T.; Methodology, T.d.l.F., D.B., R.F.-L., T.H., N.K., R.L., T.N., M.T. and E.T.; Project administration, R.L. and E.T.; Resources, T.d.l.F., D.B., R.F.-L., T.H., N.K., R.L., T.N., M.T. and E.T.; Software, T.d.l.F. and E.T.; Supervision, E.T.; Validation, T.d.l.F., D.B., R.F.-L., T.H., N.K., R.L., T.N., M.T. and E.T.; Visualization, T.d.l.F.; Writing—original draft, T.d.l.F.; Writing—review & editing, D.B., R.F.-L., T.H., N.K., R.L., T.N., M.T. and E.T. All authors have read and agreed to the published version of the manuscript.

Funding

This study was primarily supported by the European Union’s Horizon 2020 Research and Innovation programme, which has funded the project Smallwood (http://www.smallwood.eu/, accessed on 16 May 2022) through the ERA-NET Cofund action, “ForestValue—Innovating the forest-based bioeconomy”, under grant agreement number 773324. The national financers of the project Smallwood are also acknowledged: the Finnish Ministry of Agriculture and Forestry (MMM), the Academy of Finland (AKA), the Slovenian Ministry of Education, Science and Sport (MIZS), the Swedish Energy Agency, Sweden’s Innovation Agency (Vinnova), the Swedish Research Council for Environment, Agricultural Sciences and Spatial Planning (Formas), and the Spanish Ministry of Science and Innovation (Project PCI2019-103673).

Institutional Review Board Statement

Not applicable.

Informed Consent Statement

Not applicable.

Data Availability Statement

The datasets containing fieldwork data and those generated during analysis are available from the corresponding author on request.

Acknowledgments

In Sweden: Julia Bergström and Johan Back, for their assistance during fieldwork; and the personnel at SCA Skog AB in Gällö and SCA Energy AB in Östersund, for providing the stands and helping out with several practicalities during the trials. In Finland: Yrjö Nuutinen for locating and marking the study units; Jukka Malinen for supervising the fieldwork; Aleksi Huotari, Esa Åvist and Juho Marjomaa, Heli Kymäläinen and Satu Helenius for assisting during fieldwork; Toivo Mähönen, for allowing the use of his stands; and Teemu Tiitinen, for providing practical help with forest machines. In Slovenia: the research assistants from the Department for Forest Technique and Economics at the Slovenian Forestry Institute for their support in planning the trials and executing the fieldwork; the Slovenian State Forests Firm (Slovenski državni gozdovi, d.o.o.) for providing the stands, helping with contractors and several practicalities during the trials; and employees from the Slovenian Forest Service—Kočevje district unit (Zavod za gozdove Slovenije) for supporting the study. In Spain: the Forest Administration of Castilla y León Region for supporting treatments on terrain belonging to its managed forests; Javier Ezquerra, Íñigo Oliagordia, Rafael García González, Isabel García-Álvarez and the rest of their staff, to whom we are indebted; the enterprise SOMACYL for helping with the forwarding, chipping and transporting of the biomass, and Rubén García and Carlos Martínez-Torres, who were in charge of operations, and the rest of the personnel from this company, to whom we are grateful; Kjell Törnqvist, for driving the harvester and carrying out the thinnings; Lucía Herguido and Pedro Pérez Nogués, for assisting during fieldwork; and, last but not least, the Small Local Corporation of Villar de Ciervos, which owned the forest stand where the experiments were performed, for authorizing the experiments and helping with practical issues.

Conflicts of Interest

The authors declare no conflict of interest.

References

  1. Forest Europe. State of Europe’s Forests 2020; Liaison Unit Bratislava: Bratislava, Slovakia, 2020. [Google Scholar]
  2. Statistical Office of the Republic of Slovenia. General Data about Forestry, Slovenia. 2018. Available online: https://www.stat.si/StatWeb/en/News/Index/8384 (accessed on 15 September 2021).
  3. FAO. FAOSTAT, Forests. Available online: http://www.fao.org/faostat/en/#data/GF (accessed on 15 September 2021).
  4. Ministerio de Agricultura, Pesca y Alimentación. Avance del Anuario de Estadística 2019. Available online: https://www.mapa.gob.es/estadistica/pags/anuario/2019-Avance/avance/AvAE19.pdf (accessed on 15 September 2021).
  5. Routa, J.; Asikainen, A.; Bjorheden, R.; Laitila, J.; Röser, D. Forest energy procurement: State of the art in Finland and Sweden. Wiley Interdiscip. Rev.-Energy Environ. 2013, 2, 602–613. [Google Scholar] [CrossRef]
  6. Piqué, M.; Laina, R.; Vericat, P.; Beltrán, M.; Busquets, E.; Tolosana, E. Spain. In Coppice Forests in Europe; Unrau, A., Becker, G., Spinelli, R., Lazdina, D., Magagnotti, N., Nicolescu, V.-N., Buckley, P., Bartlett, D., Kofman, P.D., Eds.; University Freiburg: Freiburg, Germany, 2017; pp. 330–336. Available online: https://www.eurocoppice.uni-freiburg.de/intern/coppiceineurope-volume/coppice-forests-in-europe-2018-09-10-final-small.pdf (accessed on 30 November 2021).
  7. Slovenian Forestry Institute. Unpublished Data from National Forest Inventory (NFI). Ljubljana, Slovenia. 2015; Unpublished. [Google Scholar]
  8. Sängstuvall, L. Improved Harvesting Technology for Thinning of Small Diameter Stands: Impact on Forest Management and National Supply of Forest Biomass; Department of Forest Resource Management, Swedish University of Agricultural Sciences: Umeå, Sweden, 2018. [Google Scholar]
  9. MITECO. Third National Forest Inventory 1997–2007. Available online: https://www.miteco.gob.es/es/biodiversidad/servicios/banco-datos-naturaleza/informacion-disponible/tablas_resumen_IFN3.aspx (accessed on 17 January 2022).
  10. Tolosana, E.; Bados, R.; Laina, R.; Bacescu, N.M.; De la Fuente, T. Forest Biomass Collection from Systematic Mulching on Post-Fire Pine Regeneration with BioBaler WB55: Productivity, Cost and Comparison with a Conventional Treatment. Forests 2021, 12, 979. [Google Scholar] [CrossRef]
  11. Bergström, D.; Di Fulvio, F. Comparison of the cost and energy efficiencies of present and future biomass supply systems for young dense forests. Scand. J. For. Res. 2014, 29, 793–812. [Google Scholar] [CrossRef]
  12. Rodríguez-Soalleiro, R.; Madrigal-Collazo, A. Selvicultura de Pinus Pinaster Ait. Subsp. Atlantica. In Compendio de Selvicultura Aplicada en España; Serrada, R., Montero, G., Reque, J., de Vill, H., Eds.; Instituto Nacional de Investigaciones Agrarias (National Institute of Agricultural Reserach): Madrid, Spain, 2008; pp. 367–398. (In Spanish) [Google Scholar]
  13. Bergström, D.; Fernandez-Lacruz, R.; De La Fuente, T.; Höök, C.; Krajnc, N.; Malinen, J.; Nuutinen, Y.; Triplat, M.; Nordfjell, T. Effects of boom-corridor thinning on harvester productivity and residual stand structure. Int. J. For. Eng. 2022, 1–17, Ahead-of-Print. [Google Scholar] [CrossRef]
  14. Bergström, D.; Bergsten, U.; Nordfjell, T.; Lundmark, T. Simulation of geometric thinning systems and their time requirements for young forests. Silva Fenn. 2007, 41, 311. [Google Scholar] [CrossRef] [Green Version]
  15. Bergström, D.; Bergsten, U.; Nordfjell, T. Comparison of Boom-Corridor Thinning and Thinning From Below Harvesting Methods in Young Dense Scots Pine Stands. Silva Fenn. 2010, 44, 669–679. [Google Scholar] [CrossRef] [Green Version]
  16. Ahnlund Ulvcrona, K.; Bergström, D.; Bergsten, U. Stand structure after thinning in 1–2 m wide corridors in young dense stands. Silva Fenn. 2017, 51, 1563. [Google Scholar] [CrossRef] [Green Version]
  17. Nuutinen, Y.; Miina, J.; Saksa, T.; Bergström, D.; Routa, J. Comparing the characteristics of boom-corridor and selectively thinned stands of Scots pine and birch. Silva Fenn. 2021, 55, 10462. [Google Scholar] [CrossRef]
  18. Witzell, J.; Bergström, D.; Bergsten, U. Variable corridor thinning—A cost-effective key to provision of multiple ecosystem services from young boreal conifer forests? Scand. J. For. Res. 2019, 34, 497–507. [Google Scholar] [CrossRef]
  19. Abdullah, E.; Akay, M.Y.; Fatih, T. Impact of Mechanized Harvesting Machines on Forest Ecosystem: Residual Stand Damage. J. Appl. Sci. 2006, 6, 2414–2419. [Google Scholar]
  20. Sinclair, W.A.; Lyon, H.H.; Johnson, W.T. Disease of Trees and Shrubs; Comstock Publishing Association, a Division of Cornell University Press: Ithaca, NY, USA, 1987; 575p. [Google Scholar]
  21. Vasiliauskas, R. Damage to Trees due to Forestry Operations and its Pathological Significance in Temperate Forests: A Literature Review. J. For. 2001, 74, 319–336. [Google Scholar] [CrossRef] [Green Version]
  22. Bodaghi, A.I.; Nikooy, M.; Naghdi, R.; Tavankar, F. Logging damage to residual trees during sustainable harvesting of uneven-age stands in the Hyrcanian forests of Iran. N. Z. J. For. Sci. 2020, 50, 1–11. [Google Scholar] [CrossRef] [Green Version]
  23. Tavankar, T.; Bonyad, A.; Marchi, E.; Venanzi, R.; Picchio, R. Effect of logging wounds on diameter growth of beech (Fagus orientalis Lipsky) trees following selection cutting in Caspian forest of Iran. N. Z. J. For. Sci. 2015, 45, 19. [Google Scholar] [CrossRef] [Green Version]
  24. Tavankar, F.; Picchio, R.; Nikooy, M.; Lo Monaco, A.; Venanzi, R.; Iranparast Bodaghi, A. Healing rate of logging wounds on broadleaf trees in Hyrcanian forest with some technological implications. Drewno 2017, 60, 65–80. [Google Scholar]
  25. Yong, R.N.; Fattah, E.A.; Skiadas, N. Vehicle Traction Mechanics; Elsevier Science Pub. Co., Inc.: New York, NY, USA, 1984. [Google Scholar]
  26. Taylor, H.M.; Brar, G.S. Effect of soil compaction on root development. Soil Till. Res. 1991, 19, 37–52. [Google Scholar] [CrossRef]
  27. Cambi, M.; Certini, G.; Neri, F.; Marchi, E. The impact of heavy traffic on forest soils: A review. For. Ecol. Manag. 2015, 338, 124–138. [Google Scholar] [CrossRef]
  28. Mohammad, R.G.; Robin, A.; Martin, K. A Short Review of Fuel Consumption Rates of Whole Tree and Cut-To-Length Timber Harvesting Methods. Curr. Investig. Agric. Curr. Res. 2018, 5, 603–606. [Google Scholar]
  29. ISO 14040; Environmental Management e Life Cycle Assessment e Principles and Framework. International Organization for Standardization: Geneva, Switzerland, 2006.
  30. De La Fuente, T. System analysis and life cycle assessment of forest supply chains with integrated biomass production. Acta Univ. Agric. Suec. 2017, 54, 96. [Google Scholar]
  31. Whittaker, C.L.; Mortimer, N.; Matthews, R. Understanding the Carbon Footprint of Timber Transport in the United Kingdom; Report; North Energy: Oslo, Norway, 2010; p. 56. [Google Scholar]
  32. Whittaker, C.L.; Mortimer, N.D.; Murphy, R.; Matthews, R. Energy and greenhouse gas balance of the use of forest residues for bioenergy production in the UK. Biomass Bioenerg 2011, 35, 4581–4594. [Google Scholar] [CrossRef] [Green Version]
  33. Johnson, L.; Lippke, B.; Oneil, E. Modeling biomass collection and wood processing Life Cycle Analysis. For. Prod. J. 2012, 62, 258–272. [Google Scholar] [CrossRef]
  34. Murphy, F.; Devlin, G.; McDonnell, K. Forest biomass supply chains in Ireland: A life cycle assessment of GHG emissions and primary energy balances. Appl. Energy 2014, 116, 1–8. [Google Scholar] [CrossRef] [Green Version]
  35. De La Fuente, T.; Athanassiadis, D.; González-García, S.; Nordfjell, T. Cradle-to-gate life cycle assessment of forest supply chains: Comparison of Canadian and Swedish case studies. J. Clean. Prod. 2017, 143, 866–881. [Google Scholar] [CrossRef]
  36. Björheden, R.; Fröding, A. A New Routine for Checking the Biological Quality of Thinning in Practice; Research Notes 48; Swedish Department of Operational Efficiency, University of Agricultural Sciences: Garpenberg, Sweden, 1986. [Google Scholar]
  37. EU-JRC-IES (European Commission-Joint Research Centre-Institute for Environment and Sustainability). International Reference Life Cycle Data System (ILCD) Handbook—General Guide for Life Cycle Assessment—Detailed Guidance; EUR 24708 EN.; Publications Office of the European Union: Luxembourg, 2010. [Google Scholar]
  38. Dones, R.; Bauer, C.; Bolliger, R.; Burger, B.; Faist Enmenegger, M.; Frischknecht, R.; Heck, T.; Jungbluth, N.; Röder, A.; Tuchschmid, M. Life Cycle Inventories of Energy Systems: Results for Current Systems in Switzerland and Other UCTE Countries; Ecoinvent Report N. 5; Paul Scherrer Institut Villigen, Swiss Centre for Life Cycle Inventories: Dübendorf, Switzerland, 2007. [Google Scholar]
  39. Nemecek, T.; Käggi, T. Life Cycle Inventories of Agricultural Production Systems; Final report ecoinvent v2.0 No. 15a; Swiss Centre for Life Cycle Inventories: Zurich and Dübendorf, Switzerland, 2007. [Google Scholar]
  40. Ecoinvent. Ecoinvent Database. Available online: https://ecoinvent.org/the-ecoinvent-database/ (accessed on 8 March 2022).
  41. ISO 14044; Environmental Management—Life Cycle Assessment—Requirements and Guidelines. International Organization for Standardization: Geneva, Switzerland, 2006.
  42. Goedkoop, M.J.; Heijungs, R.; Huijbregts, M.; De Schryver, A.; Struijs, J.; Van Zelm, R. ReCiPe 2008. A Life Cycle Impact Assessment Method Which Comprises Harmonised Category Indicators at the Midpoint and the Endpoint Level. Report I: Characterisation. 2009. Available online: http://www.lcia-recipe.net (accessed on 8 March 2022).
  43. Klein, D.; Wolf, C.; Schulz, C.; Weber-Blaschke, G. 20 years of life cycle assessment (LCA) in the forestry sector: State of the art and a methodical proposal for the LCA of forest production. Int. J. Life Cycle Assess. 2015, 20, 556–575. [Google Scholar] [CrossRef]
  44. Ahlgren, S.; Björklund, A.; Ekman, A.; Karlsson, H.; Berlin, J.; Börjesson, P.; Ekvall, T.; Finnveden, G.; Janssen, M.; Strid, I. Review of methodological choices in LCA of biorefinery systems—key issues and recommendations. Biofuels Bioprod. Biorefin. 2015, 9, 606–619. [Google Scholar] [CrossRef] [Green Version]
  45. Finnveden, G.; Hauschild, M.Z.; Ekvall, T.; Guinee, J.; Heijungs, R.; Hellweg, S.; Koehler, A.; Pennington, D.; Suh, S. Recent developments in Life Cycle Assessment. J. Environ. Manag. 2009, 91, 1–21. [Google Scholar] [CrossRef] [PubMed]
  46. Berg, S. Terrain Classification System for Forestry Work; The Forest Operations Institute of Sweden: Kista, Sweden, 1992. [Google Scholar]
  47. Heitzman, E.; Grell, A.G. Residual tree damage along forwarder trails from cut-to-length thinning in Maine spruce stands. North. J. Appl. For. 2002, 19, 161–167. [Google Scholar] [CrossRef]
  48. Jäghagen, K.; Lageson, H. Timber quality after thinning from above and below in stands of Pinus sylvestris. Scand. J. For. Res. 1996, 11, 336–342. [Google Scholar] [CrossRef]
  49. Tavankar, F.; Bonyad, A.; Majnounian, B. Affective factors on residual tree damage during selection cutting and cable-skidder logging in the Caspian forests, Northern Iran. Ecol. Eng. 2015, 83, 505–512. [Google Scholar] [CrossRef]
  50. Cabral, O.M.J.V. Avaliação Operacional da Colheita de Madeira em Desbastes de Pinus taeda L. Master’s Thesis, Setor de Ciências Agrárias, Universidade Estadual do Centro-Oeste, Guarapuava, Brazil, 2015; 110p. [Google Scholar]
  51. Lopes, E.S.; Oliveira, F.M.; Droog, A. Damage to residual trees following commercial thinning by harvester and forwarder in a Pinus taeda stand in Southern Brazil. Sci. For. 2018, 46, 167–175. [Google Scholar] [CrossRef]
  52. Diniz, C.C.C.; de Oliveira, F.M.; Junior, R.T.; Robert, R.C.G.; Tramontini, M.P.; de Brito, F.B. Damage caused by a wheeled harvester to the residual trees of a pinus stand in the first mechanized mixed thinning. Floresta 2020, 50, 1547–1554. [Google Scholar] [CrossRef]
  53. Läspä, O.; Nurmi, J. Geometrical thinning in energy wood harvesting. Int. J. For. Eng. 2018, 29, 171–178. [Google Scholar] [CrossRef] [Green Version]
  54. Nikooy, M.; Tavankar, F.; Naghdi, R.; Ghorbani, A.; Jourgholami, M.; Picchio, R. Soil impacts and residual stand damage from thinning operations. Int. J. For. Eng. 2020, 31, 126–137. [Google Scholar] [CrossRef]
  55. Picchio, R.; Neri, F.; Maesano, M.; Savelli, S.; Sirna, A.; Blasi, S.; Baldini, S.; Marchi, E. Growth effects of thinning damage in a Corsican pine (Pinus laricio Poiret) stand in central Italy. For. Ecol. Manag. 2011, 262, 237–243. [Google Scholar] [CrossRef]
  56. Vasiliauskas, A.; Stenlid, J. Discoloration following bark stripping wounds on Fraxinus excelsior. Eur. J. For. Pathol. 2007, 28, 383–390. [Google Scholar] [CrossRef]
  57. Athanassiadis, D. Residual stand damage following cut-to-length harvesting operations with a farm tractor in two conifer stands. Silva Fenn. 1997, 31, 461–467. [Google Scholar] [CrossRef] [Green Version]
  58. Lageson, H. Effects of thinning type on the harvester productivity and on the residual stand. J. For. Eng. 1997, 8, 7–14. [Google Scholar]
  59. Ursic, B.; Vusic, D.; Papa, I.; Poršinsky, T.; Zecic, Ž.; Ðuka, A. Damage to Residual Trees in Thinning of Broadleaf Stand by Mechanised Harvesting System. Forests 2022, 13, 51. [Google Scholar] [CrossRef]
  60. Fjeld, D.; Granhus, A. Injuries after selection harvesting in multi-storied spruce stands—The influence of operating systems and harvest intensity. Int. J. For. Eng. 1998, 9, 33–40. [Google Scholar] [CrossRef]
  61. Han, H.S.; Kellogg, L.D.; Fillip, G.M.; Brown, T.D. Scar closure and future timber value losses from thinning damage in western Oregon. For. Prod. J. 2000, 50, 36–42. [Google Scholar]
  62. Prindulis, U.; Lazdiņš, A.; Kalēja, S. Impact of biomass extraction method on damage to remaining trees in mechanized thinning of deciduous stands. Res. Rural Devel. 2015, 2, 74–80. [Google Scholar]
Figure 1. The layout for the study units used in the trials.
Sustainability 14 06075 g001
Figure 2. System boundaries for a gate-to-gate analysis of small-diameter tree thinning.
Sustainability 14 06075 g002
Figure 3. The percentage of damaged remaining trees (DBH ≥ 7 cm) after forwarding (mean values with standard error). Significant differences in measured variables between thinning technique are denoted with *: p < 0.05. BCT, boom-corridor thinning; ST, selective thinning.
Sustainability 14 06075 g003
Figure 4. Thinning technique profiles for climate change potential impact category, with the highest value of kg CO2 eq (ST Spain) representing 100%. The standard error for the total greenhouse gas emissions per study unit is shown above each column. BCT, boom-corridor thinning; ST, selective thinning.
Sustainability 14 06075 g004
Table 1. Pre-thinning stand characteristics in each country (mean values with standard deviation in parentheses). No significant differences were found between study units assigned boom-corridor thinning (BCT) or selective thinning (ST). DBH, diameter at breast height (i.e., 1.3 m above ground level).
CountryThinning TechniqueDBH (cm)Height (m)Trees/ha
DBH ≥ 1 cm
Trees/ha
DBH ≥ 7 cm
SwedenBCT4.2 (0.6)5.7 (0.5)11,890 (3914)1960 (455)
ST4.3 (0.7)5.8 (0.6)10,590 (4013)1930 (447)
FinlandBCT4.6 (0.5)6.2 (0.4)9708 (2562)2258 (694)
ST4.4 (0.6)6.0 (1.1)8617 (2573)1692 (714)
SloveniaBCT5.0 (1.5)7.4 (1.0)10,778 (3287)2094 (708)
ST5.3 (2.0)7.6 (1.5)10,038 (3282)2069 (873)
SpainBCT5.1 (0.6)4.3 (1.5)12,330 (2659)1865 (736)
ST5.5 (1.39)4.4 (1.5)12,445 (3221)2060 (727)
Table 2. Pre-thinning distribution of tree species (DBH ≥ 7 cm) in the 0.1 ha study units, and harvested tree species, by country. BCT, boom-corridor thinning; ST, selective thinning; DBH, diameter at breast height (i.e., 1.3 m above ground level).
SpeciesCountryPre-Harvest Distribution of Tree Species (N) per Thinning TechniqueNumber of Harvested Trees (N) per Species and Thinning TechniquePercentage (%) of Harvested Trees per Species and Thinning Technique
STBCTSTBCTSTBCT
Pinus sylvestrisSweden25323412911251.047.9
Picea abiesSweden3250192759.454.0
Betula sp.Sweden3645183050.066.7
Other broadleavesSweden5063435664.063.5
Picea abiesFinland233311647.818.2
Betula sp.Finland17923613517475.473.7
Other broadleavesFinland1211100.050.0
Tilia cordataSlovenia13279504437.955.7
Betula pendulaSlovenia1421341189283.168.7
Fagus sylvaticaSlovenia99139425342.438.1
Acer pseudoplatanusSlovenia4624361278.350.0
Ostrya carpinifoliaSlovenia184673138.967.4
Corylus avellanaSlovenia4778416687.284.6
Picea abiesSlovenia10182343833.746.3
Other broadleavesSlovenia14912685.757.9
Quercus pyrenaicaSpain40034217213043.038.0
Table 3. Time and diesel fuel consumption by BCT and ST in the field trials (mean values with standard deviation in parentheses). BCT, boom-corridor thinning; ST, selective thinning; PMh, productive machine hours without delays; ODt, oven-dry tonne.
Thinning TechniqueCountryTime Consumption
(PMh/ODt)
Fuel Consumption
(l/PMh)
BCTSweden0.16 (0.06)14.49 (0.56)
Finland0.22 (0.06)14.20 (1.33)
Slovenia0.19 (0.08)15.08 (1.03)
Spain0.24 (0.07)14.65 (1.64)
STSweden0.19 (0.03)14.56 (0.80)
Finland0.24 (0.06)14.25 (1.73)
Slovenia0.22 (0.07)15.49 (1.14)
Spain0.35 (0.08)14.46 (2.02)
Table 4. Number of damaged trees by thinning technique; values are the average per thinning technique with standard deviation in parentheses. Significant differences in measured variables between thinning techniques (within the same country) are denoted with *: p < 0.05. BCT, boom-corridor thinning; ST, selective thinning.
CountryThinning TechniqueNumber of Damaged Trees/100 m Strip Road after ThinningNumber of Damaged Trees/ha after Forwarding
SwedenBCT4.4 (4.0)125.0 (35.4)
ST5.1 (2.2); p-value = 0.662120.0 (88.8); p-value = 0.870
FinlandBCT2.3 (2.7)91.7 (58.5)
ST4.3 (5.3); p-value = 0.557133.3 (112.5); p-value = 0.666
SloveniaBCT6.6 (4.2) *185.7 (98.9)
ST12.0 (5.1) *; p-value = 0.013210.7 (100.3); p-value = 0.512
SpainBCT2.3 (2.2)75.0 (48.6) *
ST2.5 (2.6); p-value = 0.853165.0 (94.4;) *; p-value = 0.015
Table 5. Strip road characteristics and soil damage by thinning technique; values represent the average per thinning technique with standard deviation in parentheses. No significant differences between thinning techniques were found. BCT, boom-corridor thinning; ST, selective thinning.
CountryThinning TechniqueStrip Road Length (m)Strip Road Width (m)Soil Damage/100 mDeepest Rut (cm)
SwedenBCT47.3 (5.2)4.6 (0.3)7.8 (6.2)20.9 (11.0)
ST46.9 (5.8)4.9 (0.6)7.3 (1.8)17.8 (4.3)
FinlandBCT49.2 (2.0)4.6 (0.4)6.0 (8.0)16.7 (2.9)
ST50.0 (0.0)4.6 (0.3)6.7 (12.1)25.0 (7.1)
SloveniaBCT49.0 (3.0)4.9 (0.4)0.7 (1.3)13.3 (2.9)
ST48.2 (4.0)5.0 (0.9)0.9 (1.6)10.0 (0.0)
SpainBCT51.6 (2.3)4.6 (0.5)0.0-
ST51.5 (2.7)4.5 (0.4)0.1 (0.3)40 (0.0)
Table 6. Stump height (cm); mean values per country and thinning technique with standard deviation in parentheses. No significant differences between thinning techniques were found. BCT, boom-corridor thinning; ST, selective thinning.
CountryThinning TechniqueStump Height (cm)
SwedenBCT38.9 (3.6)
ST36.5 (3.7)
FinlandBCT28.5 (3.8)
ST25.4 (1.4)
SloveniaBCT28.2 (5.1)
ST25.4 (5.6)
SpainBCT24.8 (4.3)
ST25.9 (4.2)
Table 7. The average (%) damage intensity on trees remaining (DBH ≥ 7 cm) after thinning (AT) and forwarding (AF) by country and thinning technique. No significant differences between thinning technique were found. The cause of the highest percentage of damage for AT and AF is shown in bold for each country and thinning technique. BCT, boom-corridor thinning; ST, selective thinning.
CountryThinning TechniqueBark
Scratched
Bark SqueezedWood Damage
(Depth; cm)
Large Broken Branch (>10 cm Diameter)
ATAFATAFATAFATAF
SwedenBCT3.420.059.155.837.4 (0.6)19.2 (0.5)0.05.0
ST3.75.655.158.641.3 (0.9)35.8 (0.8)0.00.0
FinlandBCT11.120.855.650.033.3 (0.3)29.2 (0.9)0.00.0
ST27.428.335.746.136.9 (0.1)25.6 (0.5)0.00.0
SloveniaBCT66.375.019.125.013.7 (1.1)0.01.00.0
ST80.966.312.031.97.1 (1.4)1.8 (1.1)0.00.0
SpainBCT14.454.212.29.270.0 (0.7)36.7 (0.5)3.30.0
ST0.033.849.324.450.7 (0.7)41.8 (0.4)0.00.0
Table 8. The average (%) height and size (area) of damage after thinning (AT) and after forwarding (AF) by country and thinning technique. Significant differences between thinning techniques for each country are denoted with *: p < 0.05. The location of the highest proportion of damage for AT and AF is shown in bold for each country and thinning technique. BCT, boom-corridor thinning; ST, selective thinning.
CountryThinning Technique<0.3 m0.3–1.0 m>1.0 m<50 cm250–200 cm2>200 cm2
ATAFATAFATAFATAFATAFATAF
SwedenBCT16.727.634.017.749.354.769.779.913.66.416.713.7
ST34.441.942.332.523.325.773.384.811.71.915.013.3
FinlandBCT83.391.716.70.00.08.383.391.716.70.00.08.3
ST75.088.925.08.30.02.875.094.425.05.60.00.0
SloveniaBCT5.51.1 *43.632.550.866.473.344.718.133.88.621.5
ST7.421.2 *35.918.156.760.861.736.229.825.28.438.7
SpainBCT50.651.717.221.332.227.191.766.78.37.10.026.2
ST41.926.519.532.238.641.387.675.77.66.04.818.3
Table 9. The average proportion (%) of damage caused by different processes after thinning (AT) and forwarding (AF) by country and thinning technique. Significant differences between thinning techniques in each country are denoted with *: p < 0.05. The cause of the highest levels of damage for AT and AF are shown in bold for each country and thinning technique. BCT, boom-corridor thinning; ST, selective thinning.
CountryThinning TechniqueMachine Movement; Harvester HeadMachine Movement; Machine WheelsSaw WoundTree FellingForwarding WorkOthers or Unknown
ATAFATAFATAFATAFAFATAF
SwedenBCT53.627.527.80.00.00.00.010.022.518.740.0
ST79.731.615.011.10.00.01.70.09.33.748.0
FinlandBCT38.983.350.08.30.00.011.18.30.00.00.0
ST47.680.633.319.40.00.019.00.00.00.00.0
SloveniaBCT39.054.217.20.0 *5.80.037.99.036.70.00.0
ST58.855.35.115.1 *3.00.033.15.322.50.01.8
SpainBCT81.745.28.319.00.00.010.035.70.00.00.0
ST95.283.44.51.40.00.90.014.30.00.00.0
Table 10. Multiple regression statistic parameters.
ParameterStandard ErrorT Statisticp-Value
Constant3.886454.983890.0000
Removal (R)0.0003192732.330760.0227
Working method (WM)1.78602−2.833330.0060
Remaining trees with DBH ≥ 7 cm (RT)0.00245497−2.721330.0082
Table 11. Characterization per functional unit (1 ODt of forest biomass) corresponding to the Bracke C16 thinning process. CCP, climate change potential; FDP, fossil fuel depletion potential; FEP, freshwater eutrophication potential; MEP, marine eutrophication potential; POFP, photochemical oxidant formation potential; TAP, terrestrial acidification potential; BCT, boom-corridor thinning; ST, selective thinning.
CountryThinning TechniqueCCPTAPFEPMEPPOFPFDP
(kg CO2 eq)(g SO2 eq)(g P eq)(g N eq)(g NMVOC)(kg Oil eq)
SwedenBCT9.175.01.54.6128.13.1
ST10.687.41.85.3149.13.6
FinlandBCT12.2101.22.06.2172.74.2
ST13.4110.82.26.8189.14.5
SloveniaBCT10.990.71.85.5155.23.7
ST13.1109.12.16.7186.94.5
SpainBCT13.8114.72.27.0196.24.7
ST19.6161.83.39.9276.26.6
Publisher’s Note: MDPI stays neutral with regard to jurisdictional claims in published maps and institutional affiliations.

