Article

Effect of Tampering on On-Road and Off-Road Diesel Vehicle Emissions

1
European Commission, Joint Research Centre (JRC), 21027 Ispra, Italy
2
Dimsport, 15020 Serralunga di Crea, Italy
3
TNO, 2595 Hague, The Netherlands
4
Laboratory of Applied Thermodynamics, Aristotle University of Thessaloniki, GR-54124 Thessaloniki, Greece
*
Author to whom correspondence should be addressed.
Sustainability 2022, 14(10), 6065; https://doi.org/10.3390/su14106065
Submission received: 11 April 2022 / Revised: 6 May 2022 / Accepted: 12 May 2022 / Published: 17 May 2022
(This article belongs to the Special Issue Emissions from Road Transportation and Vehicle Management)

Abstract

:
Illegal manipulation (i.e., tampering) of vehicles is a severe problem because vehicle emissions increase orders of magnitude and significantly impact the environment and human health. This study measured the emissions before and after representative approaches of tampering of two Euro 6 Diesel light-duty passenger cars, two Euro VI Diesel heavy-duty trucks, and a Stage IV Diesel non-road mobile machinery (NRMM) agricultural tractor. With tampering of the selective catalytic reduction (SCR) for NOx, the NOx emissions increased by more than one order of magnitude exceeding 1000 mg/km (or mg/kWh) for all vehicles, reaching older Euro or even pre-Euro levels. The tampering of the NOx sensor resulted in relatively low NOx increases, but significant ammonia (NH3) slip. The particle number emissions increased three to four orders of magnitude, reaching 6–10 × 1012 #/km for the passenger car (one order of magnitude higher than the current regulation limit). The tampered passenger car’s NOx and particle number emissions were one order of magnitude higher even compared to the emissions during a regeneration event. This study confirmed that (i) tampering with the help of an expert technician is still possible, even for vehicles complying with the current Euro standards, although this is not allowed by the regulation; (ii) tampering results in extreme increases in emissions.

1. Introduction

Road vehicles contribute significantly to air pollution, especially in cities. During the type approval of vehicles, their emissions have to respect limits, the so-called Euro standards in European Union (EU). For example, the Euro 1 (1992) Diesel passenger cars limit for hydrocarbons plus NOx was 970 mg/km, while the current Euro 6 (2014) is 170 mg/km. The latest Diesel passenger cars emit less than half of the Euro 6 NOx limit (80 mg/km) even on the road [1]. For heavy-duty engines, the Euro I (1992) NOx limit for the steady cycle in the laboratory was 8000 mg/kWh, while the latest Euro VI (2013) standard is 400 mg/kWh, a twenty-fold reduction. Limits to non-road mobile machinery (NRMM) (i.e., off-road engines) were introduced later: Stage I (1999) had a NOx limit of 9000 mg/kWh, while the latest Stage V (2018) aligned the levels with the heavy-duty engines (400 mg/kWh). Particulate matter (PM) mass limits have also decreased by more than 95% for all vehicle categories. Despite the stricter limits, the environmental benefits for these two pollutants, even though not of the same magnitude, were still evident: the latest European environment agency’s (EEA) report mentioned 40% ambient air NOx reduction between 1990 and 2017 and 44% for PM between 2000 and 2017 [2]. There are various reasons for the less than expected decreases: increased contributions from other sources (such as heating and power production), increased number of vehicles and higher emissions of vehicles under real-world driving conditions (e.g., Dieselgate) [3]. Recently the contribution of high emitters has been under the focus [4]. Each vehicle has an onboard diagnostic (OBD) system, which consists of sensors designed to detect, record, and report malfunctions of all monitored emission systems or components. Nevertheless, a vehicle can perform poorly because of undetected malfunctioning, tampering, deterioration, or poor maintenance of its exhaust aftertreatment system [5,6,7].
Vehicles owners sometimes tamper (i.e., illegally manipulate) their vehicles to avoid costs of consumables, maintenance, and/or the repair of the emissions control systems [8]. Other reasons are reducing costs due to downtime, improving fuel economy, performance tuning, and exhaust sound level. In the EU “tampering” means “inactivation, adjustment, or modification of the vehicle emissions control or propulsion system, including any software or other logical control elements of those systems, that has the effect, whether intended or not, of worsening the emissions performance of the vehicle” (Regulation (EC) 595/2009). In the United States of America (USA), the term “aftermarket defeat device” refers to parts and components which bypass, defeat or render inoperative any emissions-related components of the vehicle [9]. The term “tampering” refers to the actual removal or rendering inoperative of emissions-related components. In this paper, the term tampering refers to both.
Tampering occurs mainly in Diesel vehicles, which is the focus of this paper. Tampering exists in Europe, but the magnitude of the problem is largely unknown. An internet review in 2017 identified 87 separate sites supplying Europe with tampering devices for Euro IV, V, and VI vehicles [10]. Reports of roadside inspection or plume chasing mentioned that up to 25% of the vehicles have tampered devices [8,11,12,13,14]. There is scarce information regarding the level of tampering on different markets and geographic areas. In general, it is expected that countries with stricter emissions standards, but looser technical inspection mechanisms should suffer more. It is reported that within Europe, trucks from certain countries have higher percentages of tampering based on roadside inspections [11]. Although the exact reasons are not clear, these findings may be related to fewer and less strict roadworthiness checks and inspections, and lower fines in these regions. They could also be associated with a higher relative fuel cost compared to countries where fuel prices are comparatively lower considering the higher gross domestic product (GDP) and service cost. There is no proper enforcement against tampering in place anywhere in Europe [15], unlike the USA, where it is clearly stated that it is a crime to knowingly falsify, tamper with, render inaccurate, or fail to install any “monitoring device or method” [9].

1.1. Achieving Low Emissions

The low tailpipe emission levels are achieved by optimizing the engine calibration and with emission control devices.

1.1.1. Engine Calibration

Manufacturers calibrate the engine control functions to optimize fuel consumption and power performance while maintaining low emission levels and safety. The calibration of the electronic control unit (ECU) results in a series of, usually tabulated, parameter values that govern the operation of actuators and systems in the engine and exhaust after-treatment system, also known as engine or ECU maps. The calibration considers regional parameters (extreme heat or cold, pressure/altitude ranges) and driveability. Therefore, sometimes there is room to improve one parameter (e.g., power output) in the cost of others (e.g., driveability or emissions).

1.1.2. NOx and PM Emissions Control Devices and Customer Concerns

NOx are formed at high exhaust gas temperatures. With exhaust gas recirculation (EGR), exhaust gas is added to the intake air, regulated by a valve. This results in lower peak combustion temperature and lower NOx. EGR can make combustion less efficient, compromising fuel economy and power [16]. The most common problem of EGR is the accumulation of soot on the EGR valve and passages. Soot in combination with oil vapor from a closed crankcase ventilation system can result in valve sticking due to deposit build-up. However, with Euro 6 vehicles, the EGR issues have been addressed by the automotive manufacturers.
Selective catalytic reduction (SCR) converts NOx to N2 and H2O with a catalyst and a reagent [17]. Due to the hazardous nature of the pure anhydrous ammonia, a Diesel exhaust fluid (DEF) (commercial name AdBlue®), which is a 32.5% aqueous urea solution, is widely used in the industry for this application as a reagent. The consumption is estimated to be 1–2 L of reagent per 1000 km, depending on the engine-out emissions [18,19]. An optimal ratio between NO2 and NO is needed for a high NOx reduction efficiency at low exhaust gas temperatures (e.g., during low load, low-speed operation in cities). This ratio is achieved with an upstream Diesel oxidation catalyst (DOC) which converts NO to NO2. The EGR ratio can also affect the NO/NO2 ratio mainly because the NOx reduction is achieved by NO decrease [20].
Diesel particulate filters (DPFs) trap the soot emitted by Diesel vehicles with >90% filtration efficiency [21,22]. The accumulated PM deposited in the inlet channels of the DPF leads to increased backpressure and fuel penalty; for this reason, the deposited soot has to be periodically removed (oxidized to CO2). The trapped soot can be oxidized passively at high exhaust gas temperatures (e.g., high-speed driving). Actively, the exhaust gas temperature can increase, e.g., with late fuel injection: the unburnt fuel is oxidized in the DOC increasing the exhaust gas temperature. In addition to the fuel penalty due to the soot accumulation in the DPF, or the regeneration process, there is the risk for uncontrolled regenerations that can damage the DPF. Uncontrolled regenerations can sometimes happen due to excessive soot loading or injected fuel [23], for example, when driving too frequently in city areas [24]. A final concern is that, over time, the accumulated ash (mainly due to bad lubricant and fuel) that cannot be oxidized during the regeneration results in a more frequent need for regenerations.

1.2. Tampering Approaches

In general, tampering involves changes to the emission system hardware and modifications to the engine management software [25,26].
To increase (electronically “tune”) the performance of an engine (higher power or better fuel economy) two approaches are used: (i) onboard diagnostics (OBD) tuning, i.e., directly accessing and reprogramming the ECU (also called ECU flashing or remapping); (ii) tuning boxes, i.e., optimization with auxiliary control devices (also called performance/tuning chips, piggybacks or power chips/boxes). Tuning boxes work by connecting to existing sensors on the engine and manipulating one or more signals that they send to the vehicle’s ECU. Two sensors that are commonly taken into consideration are the intake air and coolant temperature sensors.
The main type of tampering for the latest generation of aftertreatment devices is ECU reprogramming (or flashing or remapping) which changes the engine control software and overrides the OBD system. Emulators, which are devices that manipulate control signals and messages without reprogramming the engine, are also used, but less often. They can be easily found in the market, and they are cheaper but there are a lot of operating issues and they are prone to visual inspections or other roadside checks. Both approaches can be accompanied by “delete” hardware kits (delete tuners) for emission control systems and/or sensors and actuators modifications (called modifiers). Examples are spacers for lambda or temperature sensors. In parallel, diagnostic trouble code (DTC) deletion tools are offered to support tampering by erasing error codes detected by the OBD (DTC erasers or OBD suppressors).
EGR tampering is completed by software manipulation (e.g., valve positioning) and/or mechanically. For SCRs, except ECU reflashing, SCR (or DEF) emulators are sometimes used at light commercial vehicles and trucks, which imitate the SCR system components (e.g., signals related to the temperature of the exhaust system and the availability and quality of DEF) or “modifying” the NOx sensors values (called NOx emulators). Regarding DPFs, removal methods include replacing the DPF with a piece of exhaust pipe (“DPF delete”), cutting the DPF canister, removing the filter from inside, then welding the canister back together. Alternatively, tampering with the DPF includes drilling out the DPF, with a drill into the DPF’s inlet and outlet pipes (“DPF drilled/gutted”) [27]. In addition to removing the DPF, the sensor measuring the pressure difference across the DPF or the ECU will be modified to disable the regenerations. Depending on the vehicle architecture, the DPF removal requires in some cases the deactivation of the SCR because the two aftertreatment devices are connected in terms of control.
The tampering is either offered as a service in workshops or as a product with instructions for installation provided in webshops, online shopping areas, forums, and social media.

1.3. Environmental Consequences of Tampering

Tampered vehicles can have very high emissions. Depending on the frequency of tampering, the fleet emissions can increase significantly. There is not much data published on actual emissions degradation after tampering and most published studies focused on two-wheelers (mopeds and motorcycles) [28,29]. Studies have shown that 10–25% of the high emitters contribute 50–80% of the fleet emissions [4,30,31]. Tampering will be even more important for the latest and future technologies due to their low tailpipe emissions, resulting in huge emissions increases if their emission control systems are deactivated. The Horizon 2020 project diagnostic anti-tampering systems (DIAS) aims at achieving a strong reduction or total elimination of tampering emissions-relevant systems using high resistance to hardware and software manipulation and detection of tampering [32].

1.4. Tampering vs. Retrofitting

It should be added that tampering is in many ways opposite of retrofitting, i.e., the installation of various emission control technologies to improve emissions from older existing vehicles [33,34,35]. Retrofitting is covered in regulations: for example, United Nations Economic Commission for Europe (UNECE) Regulation 115 on CNG and LPG retrofitting, or Regulation 132 for the approval of retrofit emission control (REC) devices for heavy duty vehicles, agricultural and forestry tractors, and non-road mobile machinery equipped with compression ignition engines. Various programs encourage users to retrofit their vehicles.

1.5. Aims of the Study

This paper aims to present the application of tampering devices at the latest generation Diesel vehicles (two Euro 6 passenger cars, two Euro VI trucks, and a Stage IV tractor) and their impact on emissions. The study tries to shed light to the following topics for which there is lack in the literature:
  • what is the environmental impact of tampering of new generation vehicles (including light duty, heavy-duty and off-road machines) that there is no information of their engine out emissions?
  • what are the tampering installation costs and savings?
The paper, following this introduction (Section 1), presents the vehicles and the tampering approaches (Section 2). Then, at the results section (Section 3), the impact of tampering is presented for each vehicle. At the discussion section (Section 4) the environmental impact of tampering, the cost and savings and the tampering availability are discussed. The last section (Section 5) summarizes the findings of this study.

2. Materials and Methods

The following sections describe the vehicles’ characteristics, tampering approaches, testing equipment, and protocols. All vehicles were restored after finishing the project on evaluation of tampering.

2.1. Light Duty Vehicle Euro 6d-Temp

2.1.1. Vehicle

The vehicle was a Euro 6d-Temp passenger car (M1) with a 1.6 L Diesel engine and 11,000 km at the odometer. In addition to EGR, the vehicle had an aftertreatment with DOC, DPF and SCR. Market Diesel B7 fuel was used.

2.1.2. Tampering Approach
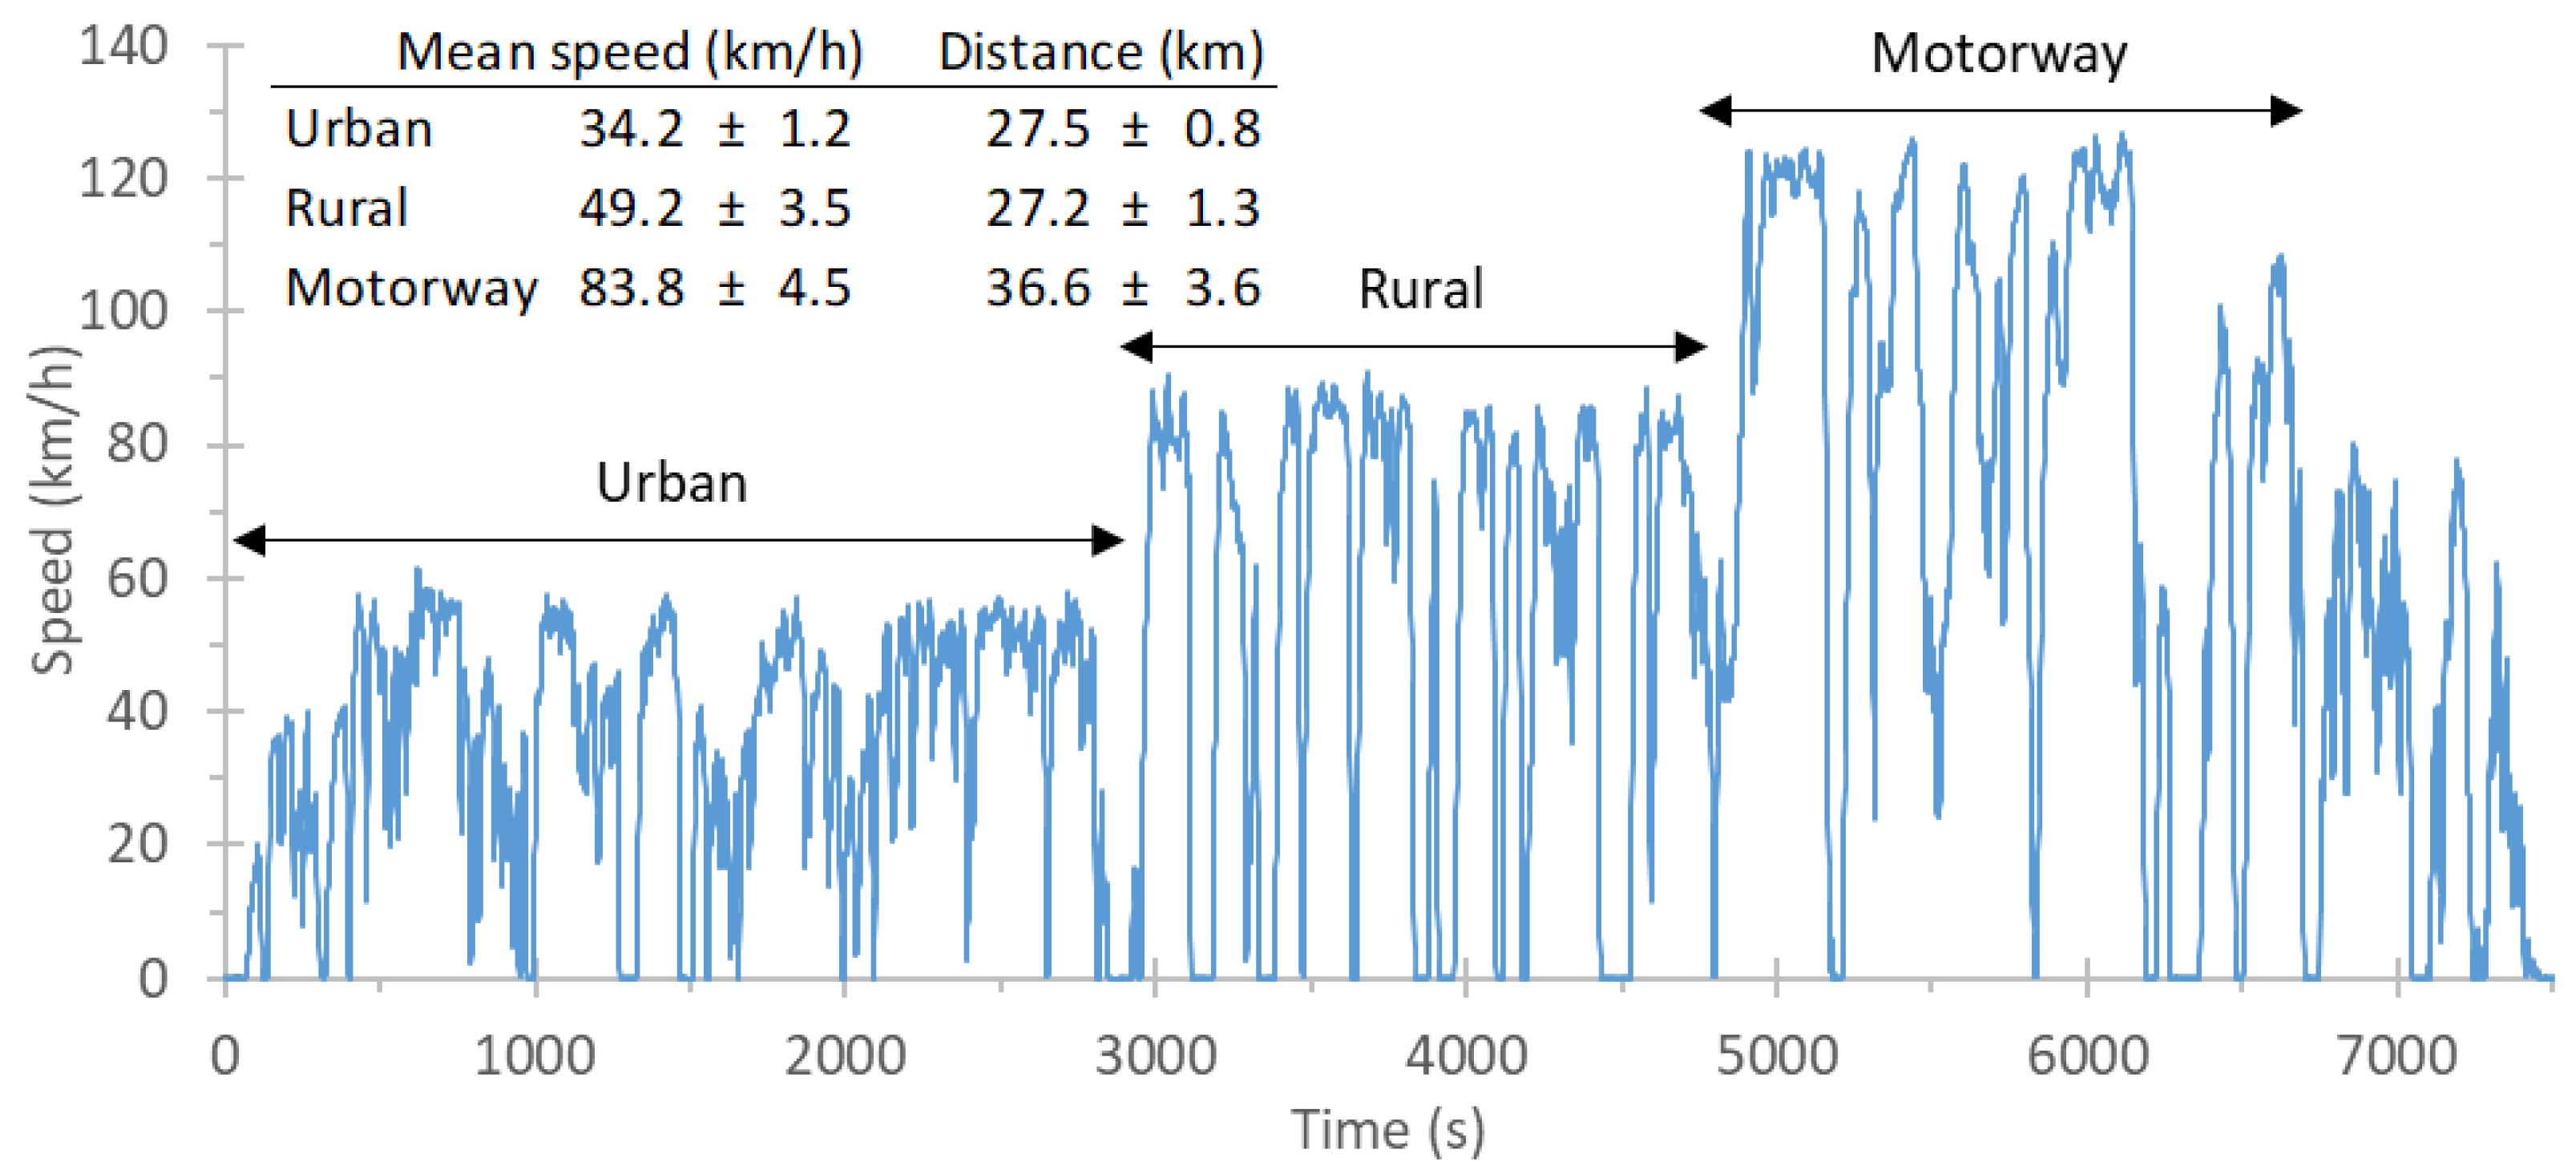
The tampering occurred with various steps of ECU flashing: initially only for the EGR valve, then only for the SCR dosing. Finally, the DPF was removed, and the SCR was deactivated, but the EGR valve was not tampered.

2.1.3. Testing

All tests were conducted on the road at the premises of the Joint Research Centre (JRC) of the European Commission, in Italy, following a real-driving emissions (RDE) regulation-compliant route (Regulation (EU) 2017/1151). The route and the characteristics are summarized in Figure 1 (see also [36]). The tests were conducted in the following order: original configuration, EGR disabled, SCR disabled, and SCR plus DPF tampered. At least two repetitions from each configuration were conducted. The tests that had DPF regeneration were not repeated, and they helped in assessing the impact of regenerations on emissions. The ambient temperature during the tests was 25 ± 3 °C.
The portable emissions measurement system (PEMS) was the OBS-ONE from Horiba (Kyoto, Japan). The PEMS equipment comprised an exhaust gas flow meter, exhaust gas analyzers, a global positioning system (GPS) device, a weather probe with ambient gas and pressure, a power supply device, and an OBD data acquisition device (not always). The exhaust flow meter was based on the Pitot tube principle. The analyzers measured CO2 and carbon monoxide CO with heated non-dispersive infrared detection (NDIR), NOx with heated chemiluminescence detection (CLD), and particle number with a condensation particle counter (CPC) after a hot catalytic stripper [37,38,39].

2.2. Light Duty Vehicle Euro 6b

2.2.1. Vehicle

The vehicle was a Euro 6b passenger car (M1) with a 1.6 L Diesel engine and 45,000 km at the odometer. In addition to EGR, the vehicle had an aftertreatment with DOC, SCR, and DPF. Market Diesel B7 fuel was used.

2.2.2. Tampering Approach

The tampering consisted of ECU flashing for the EGR valve, and the SCR dosing. The EGR valve power supply was also disconnected, while the urea dosing module was not deactivated; it was rather modified via some internal maps of the ECU.

2.2.3. Testing

The testing took place at the Laboratory of Applied Thermodynamics premises in Thessaloniki, Greece. The route was RDE compliant, consisting of the characteristics of Table 1. The car started with the engine hot. One baseline repetition was conducted and one with the tampered vehicle. As it will be shown, the tampering was not entirely successful, and no additional repetitions were performed.
The portable system was the smart emissions measurement system (SEMS) from TNO (Delft, Netherlands) which includes an OBD connection, GPS signal, and NOx, NH3, O2, and temperature sensors connected to the tailpipe [40]. The exhaust flow rate was calculated from the fuel consumption and the air-to-fuel ratio. The CO2 was calculated based on the fuel carbon–hydrogen ratio and the fuel flow rate. Studies have shown that the results are well comparable with PEMS [41].

2.3. Heavy-Duty Vehicle N2

2.3.1. Vehicle

The vehicle was a Euro VI Step D, N2 category truck with a 5L Diesel engine. In addition to EGR, the vehicle had an aftertreatment with DOC, DPF, SCR, and ammonia slip catalyst. Market B7 Diesel fuel was used.

2.3.2. Tampering Approach

The tampering device was an AdBlue® (or DEF) emulator. A unique characteristic was that it remained functional but with very low reagent consumption (<2% of the nominal consumption). It was installed by an expert technician without any permanent modification to the vehicle exhaust aftertreatment system and was difficult to detect by visual inspection. The intercepted modules were the vehicle diagnostic plug and after treatment control module. The tampering signals involved two CAN channels and two control units:
  • Engine CAN: Communication with ECU and ACM (after treatment control module). The emulator reduced the DEF dosing command on ACM, but at the same time, it fed back a higher DEF value to ECU to avoid faults on diagnostics as ACM controls the DEF consumption. In parallel, the device emulated the downstream NOx sensor by reducing its signal.
  • Diagnostic CAN: The emulator carried out a DTC erase operation immediately after the dashboard key was switched on to ensure that the whole system worked correctly.
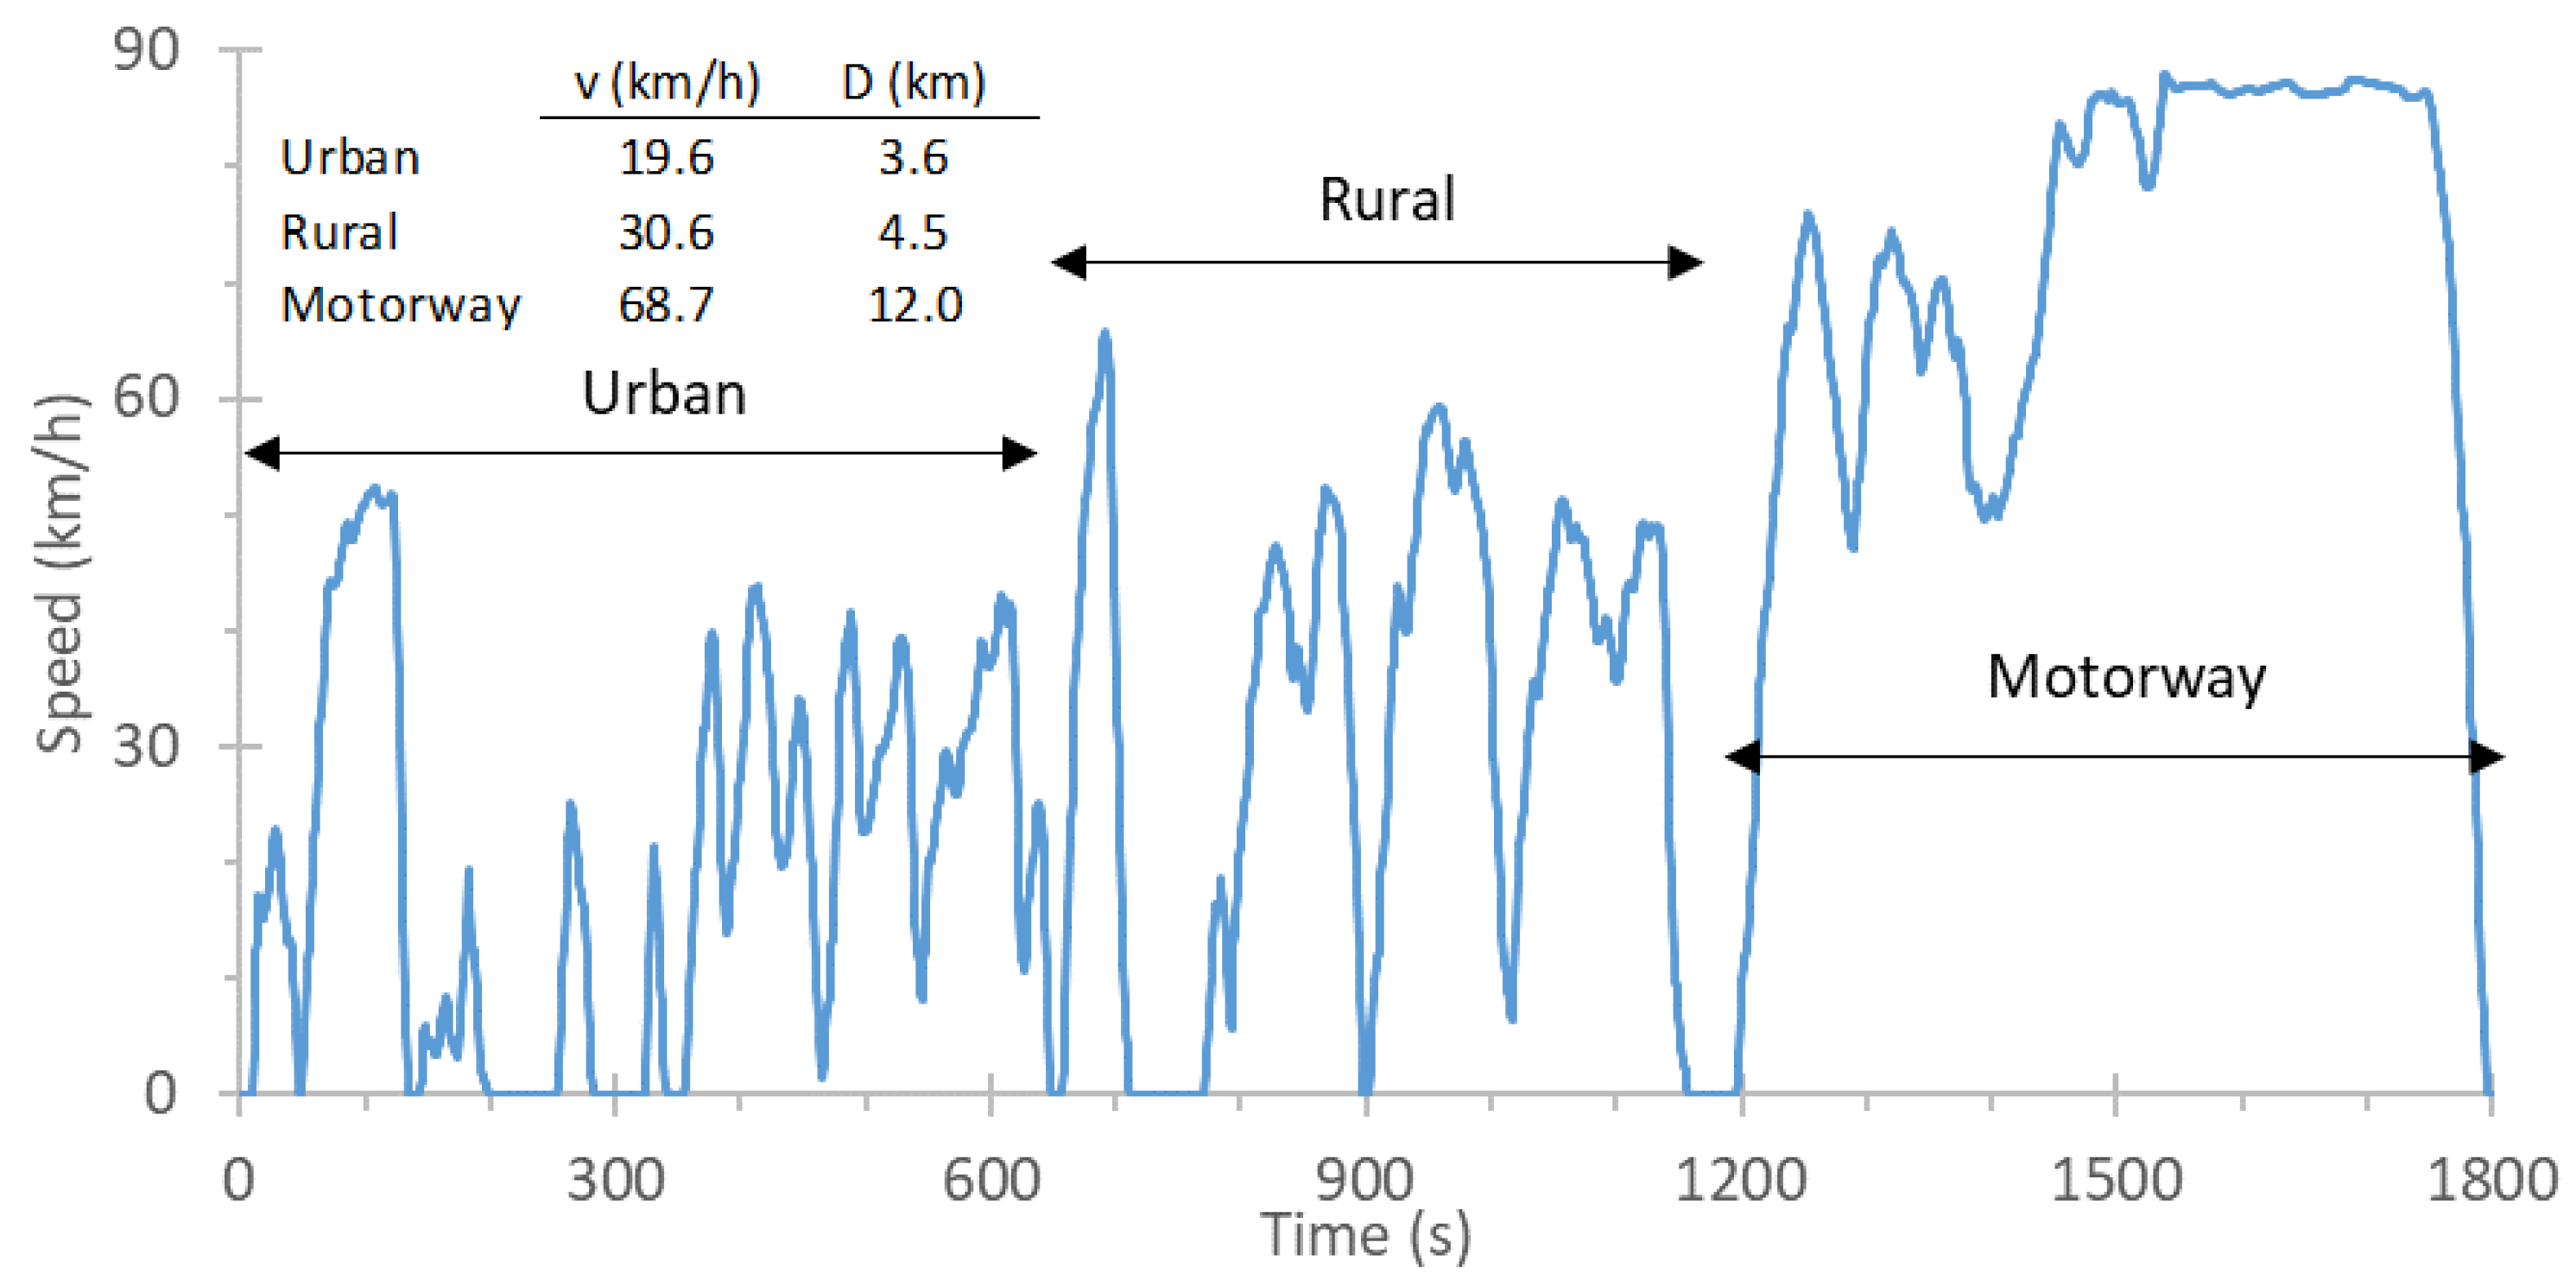
2.3.3. Testing

The tests were conducted at the vehicle emissions laboratory (VELA 7) of the JRC. The gas analyzers were AMA i60 from AVL (Graz, Italy), measuring hydrocarbons with a flame ionization detection (FID), NOx with CLD, and CO and CO2 with NDIR. Particle number measurements were performed using an AVL particle counter. The World Harmonized Vehicle Cycle (WHVC) was used to test [42], both with the original configuration and the tampering device installed. Only hot engine start tests were conducted. The cycle was divided into three parts depending on the vehicle’s speed (Figure 2). The WHVC was developed based on the same set of data used to develop the type approval Worldwide Harmonized Test Cycle (WHTC) for heavy-duty engines.

2.4. Heavy Duty Vehicle N3

2.4.1. Vehicle

The vehicle was a Euro VI Step C, N3 category truck with a 12.8 L Diesel engine. In addition to EGR, the vehicle had an aftertreatment with DOC, DPF, SCR, and ammonia slip catalyst. Market B7 Diesel fuel was used.

2.4.2. Tampering Approach

The tampering devices were one NOx sensor emulator and three different SCR emulators. The NOx sensor emulator, which is typically used to prevent replacement of broken NOx sensors and downtime, emulated only the downstream NOx sensor.
The SCR emulators emulated the CAN signals between ECU and the ACM. The vehicle had separate control units for engine (ECU) and aftertreatment devices (ACM). As the whole ACM module needed to be disconnected, all signals were emulated. Some signals were constant with either a fixed value (e.g., temperatures) or zero (e.g., DEF dosing). Because all three SCR emulators required disconnection of the control unit of the aftertreatment devices, active regeneration of the DPF was not working. Hence, according to the installation instructions of the emulators, the DPFs (2 pieces) needed to be removed to prevent clogging of the filters. The particulate emissions were not measured, and only the impact on NOx was demonstrated with these measurements, but due to the required removal of the DPF, the particulate emissions increased to unfiltered very high levels (based on the optical black smoke). As all three SCR emulators worked similarly, their results will be averaged in the Section 3.

2.4.3. Testing

The tests were conducted on road near the premises of TNO in The Hague with a SEMS (see details in Section 2.2.3). The test cycles used were a “short” cycle and an in-service conformity (ISC) cycle (Figure 3). The details of the cycles are summarized in Table 2. The ambient temperature was around 12 °C at the baseline measurements and about 9 °C with the tampering devices.

2.5. Non-Road Mobile Machinery

2.5.1. Vehicle

The vehicle was an agricultural tractor with a 88 kW power 3.6 L common rail four cylinders Diesel engine, compliant to Stage IV regulations. It was equipped with a DOC and an SCR. Market Diesel B7 fuel was used.

2.5.2. Tampering Approach
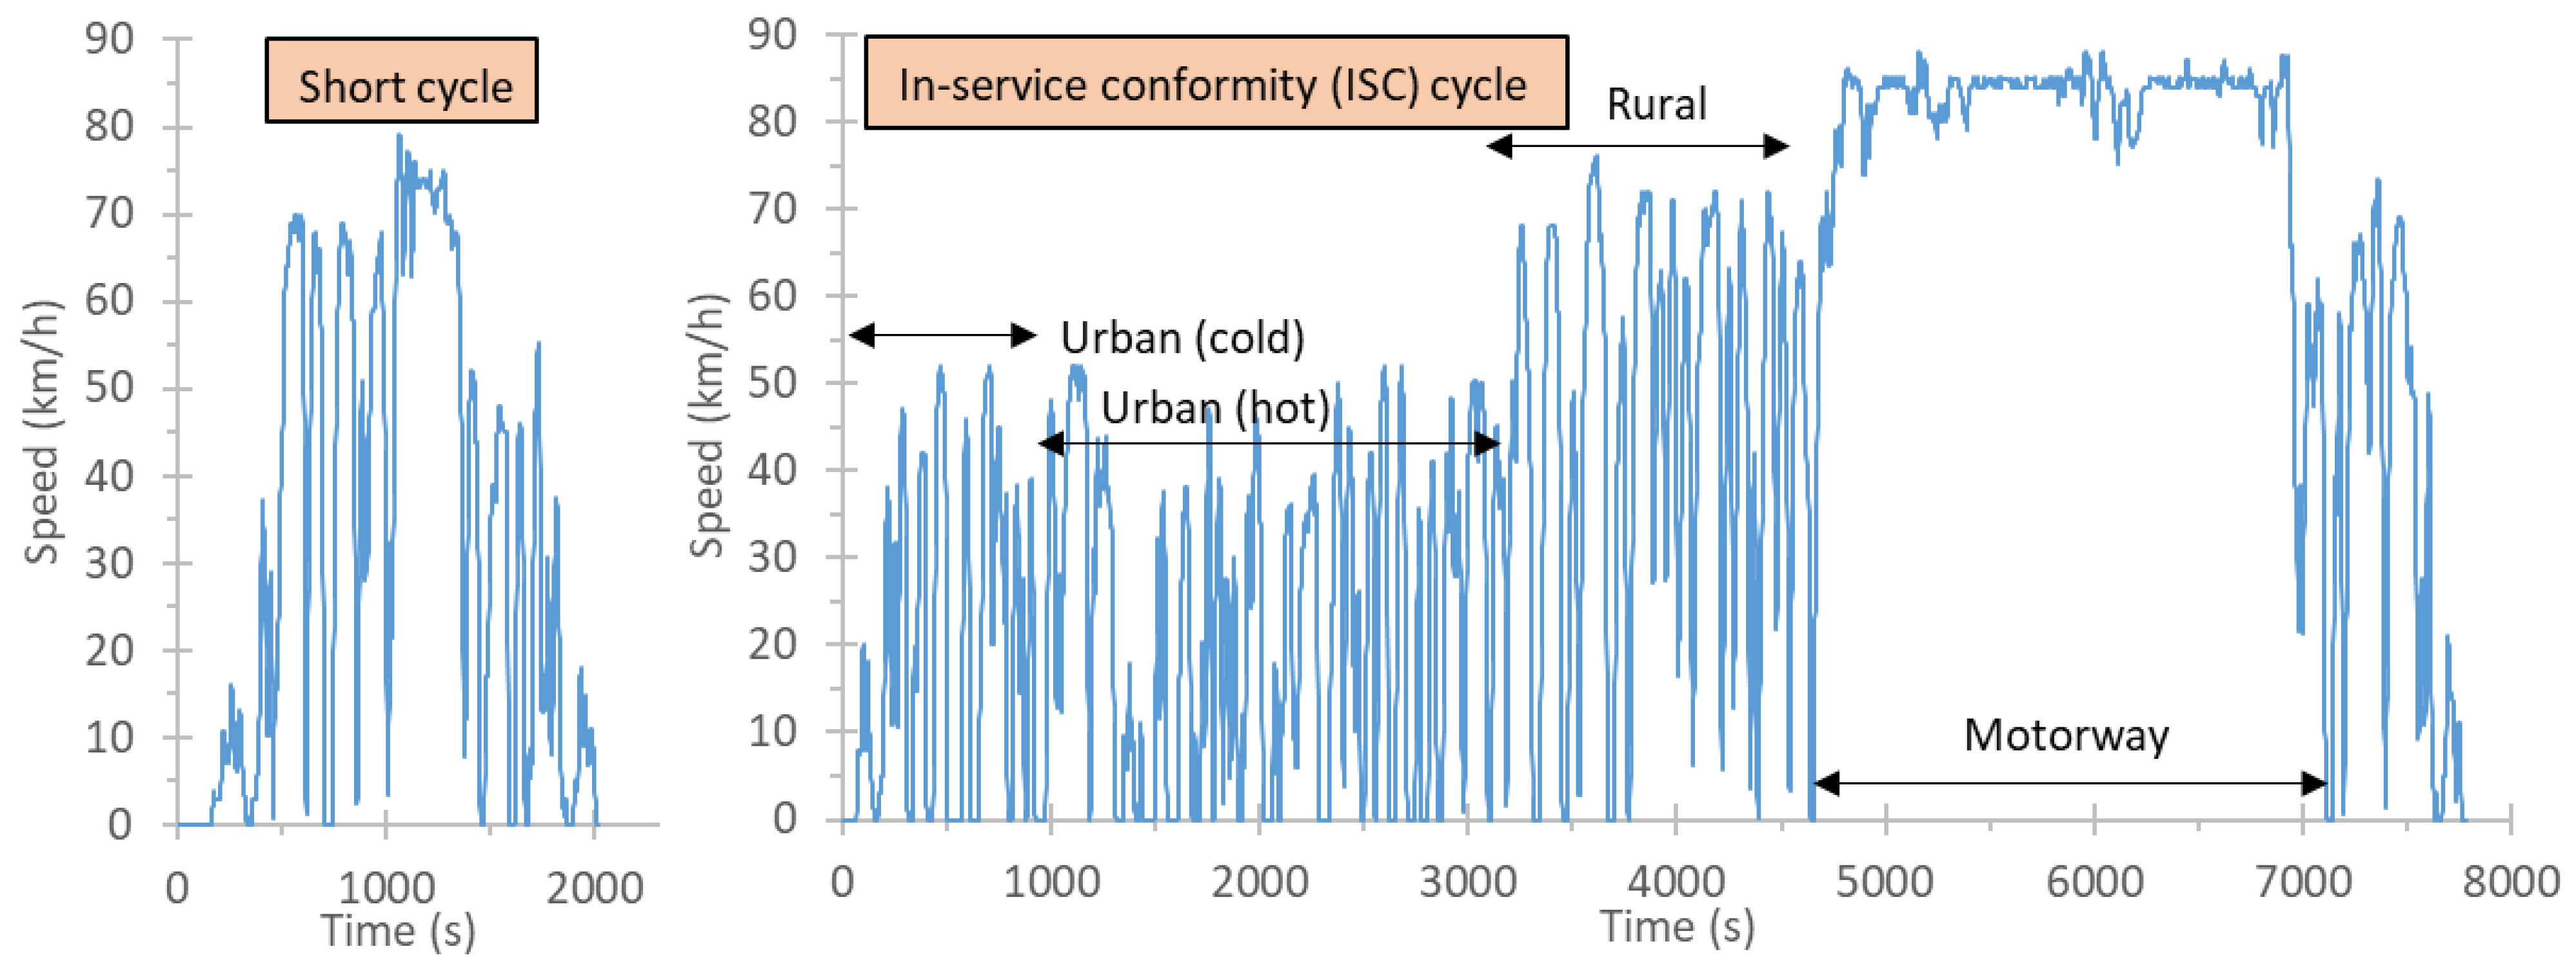
The tampering device was a prototype developed for the latest NRMM models. An expert technician installed it without causing any permanent modification to the vehicle. Even after installation, it was difficult to detect it upon visual inspection.
The SCR tampering device was a DEF emulator. It consisted of a control unit with a central processing unit (CPU) to elaborate signals to emulate and input/output (I/O) ports to interact with the rest of the vehicle. The emulator intercepted two CAN bus lines and the pump module. The first CAN only gave information about the vehicle when the engine was operating. The second CAN was dedicated to the upstream and downstream NOx sensors: the downstream was disconnected and was emulated so that the ECU would not recognize any anomaly. The pump module had one serial line to detect the initialization of the pump, digital output to switch on and off the DEF pump and emulation of the DEF pressure transductor.
As a separate tampering, ECU flashing (reprogramming) was performed independently to increase the engine’s power output.

2.5.3. Testing

The tractor was connected to an eddy current dynamometer (Dyno tractor-trailer from Dimsport, Serralunga, Italy), and the tests were performed with and without the emulator. During the tests with the emulator, no DTC occurred. The tests included the full power curve and a constant engine speed mode (1500 rpm, 290 Nm) corresponding to approximately 50% of maximum power.
The emissions were measured with a Semtech DS PEMS from Sensors (Saline, MI, USA). The NOx emissions were measured via the non-dispersive ultraviolet (NDUV) principle, while CO and CO2 emissions were measured via NDIR principle. The exhaust flow meter was based on the Pitot tube principle.

3. Results

This section describes the results for the three vehicles with and without tampering.

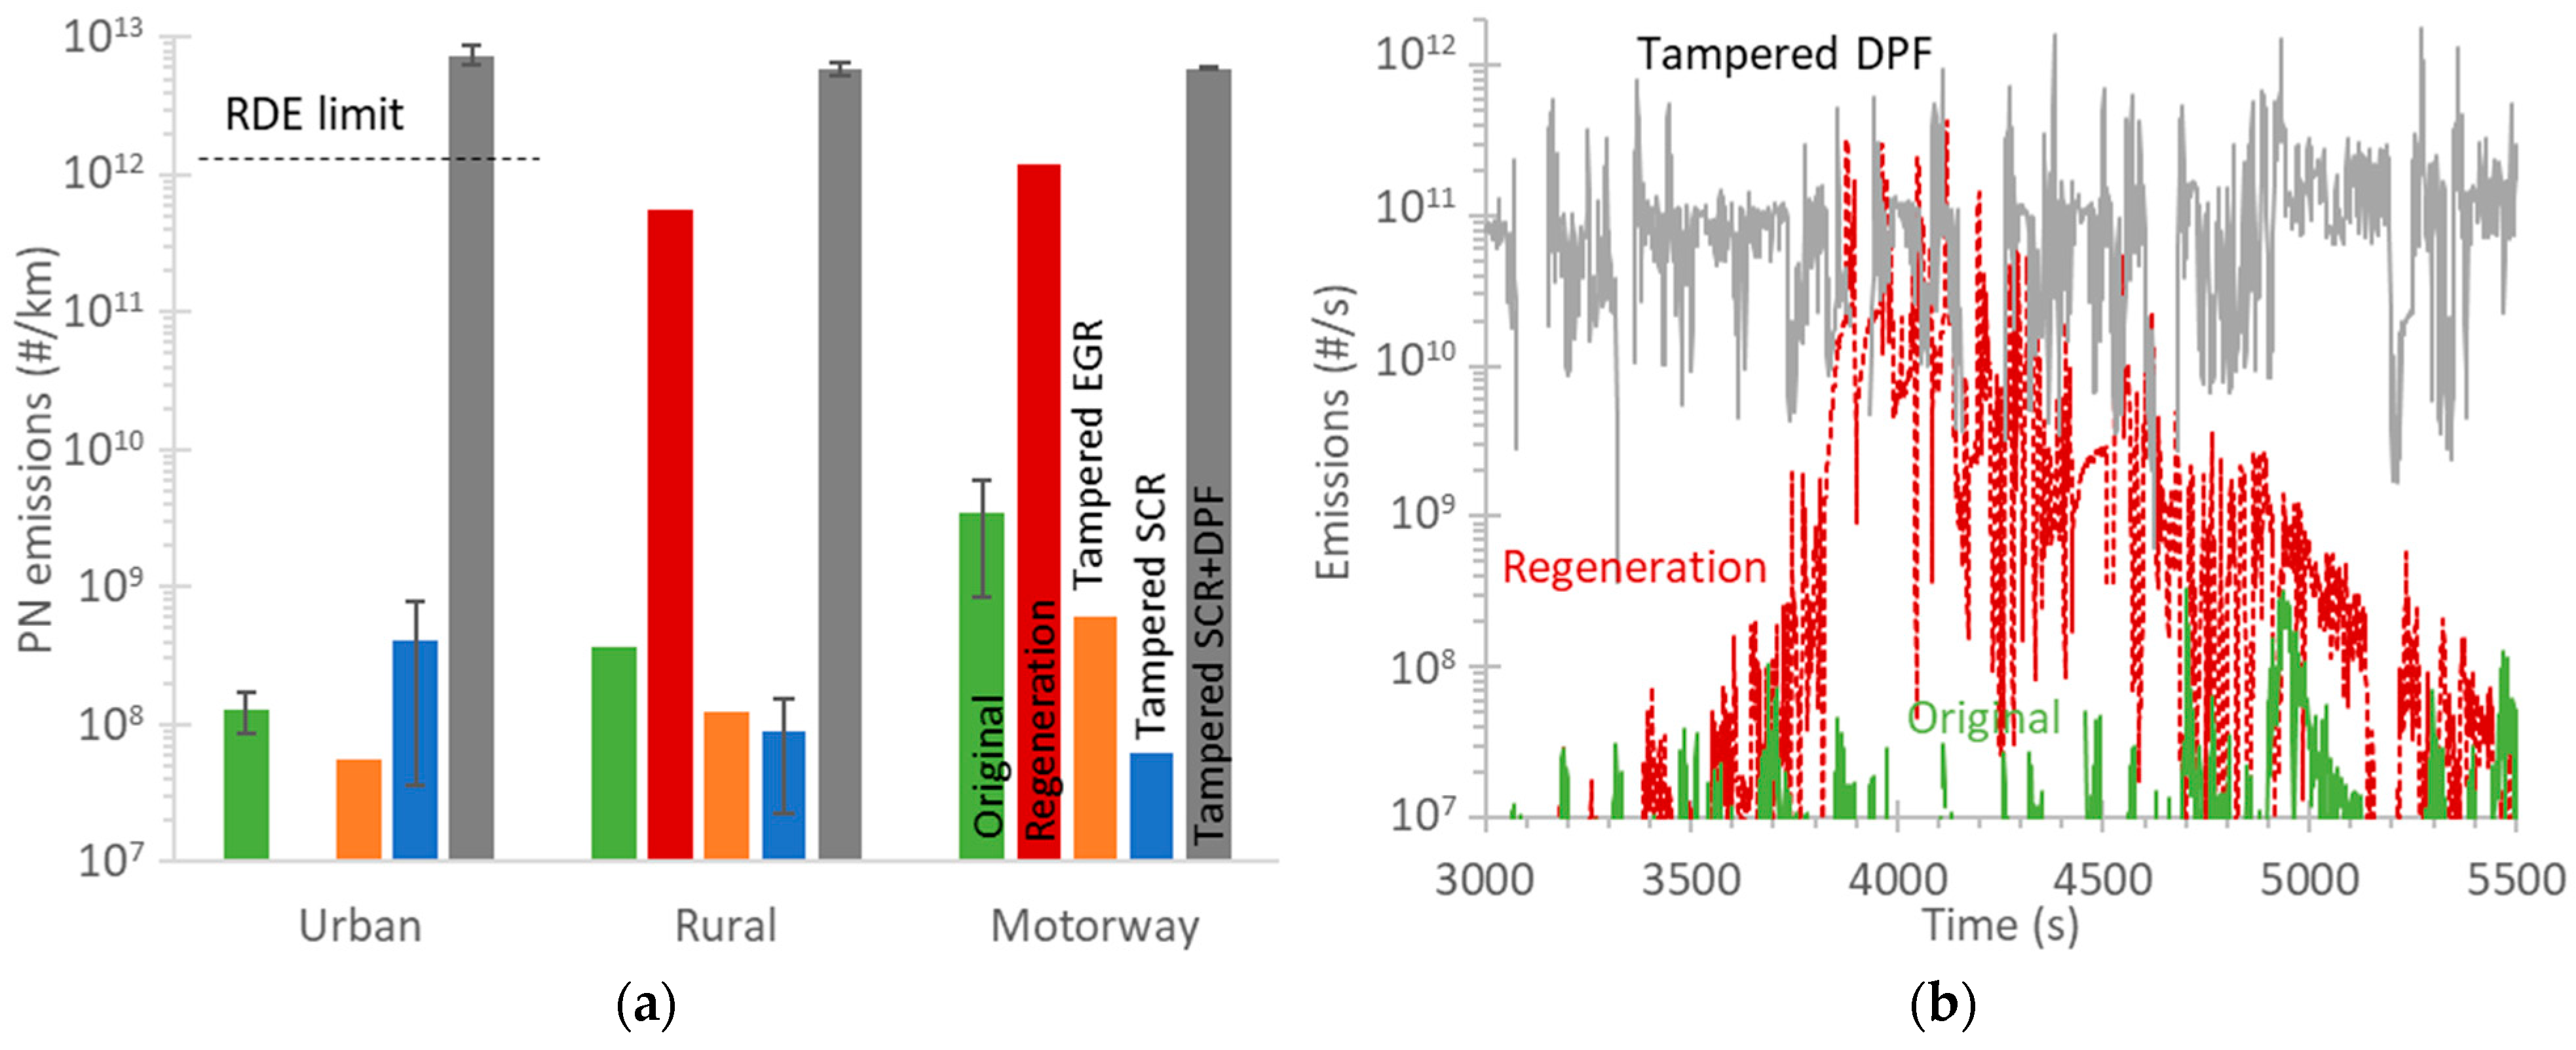
3.1. Light Duty Vehicle Euro 6d-Temp

The on-road emissions of the passenger car are summarized in Figure 4. The emissions of the original configuration, the regeneration (whenever available), the tampered EGR, tampered SCR, and the tampered SCR and DPF are given separately for the route’s urban, rural, and motorway parts.
The CO2 emissions of the tampered EGR and the tampered SCR cases were similar (Figure 4a) and exhibited a 3–9% reduction compared to the vehicle baseline for the urban and rural routes. There was no evident decrease at the motorway route. The CO2 benefit is associated with the no or reduced EGR of the tampered vehicle. At the motorway part it is highly likely that the use of EGR was low also for the original configuration. The CO2 emissions with the removed DPF were 8–15% lower, indicating considerable fuel savings due to the lower backpressure without the DPF. The DPF regeneration increased the CO2 emissions by 20–45%. The vehicle regenerated on average every 350–450 km, and the distance during the regeneration events was 16–29 km, thus, the 20–45% CO2 increase was equivalent to an average 2.4–3.0% CO2 increase for the CO2 emissions with the original configuration (the so called ki factor).
Figure 4b presents the NOx emissions. With the original configuration, they were close to the detection limit of the onboard measurement system. During the regeneration route at the rural part, NOx increased and reached 144 mg/km. The whole trip emissions were 44 mg/km, well below the regulation Euro 6 limit (80 × 1.43 = 114 mg/km) for this vehicle. The conformity factor is 1.43 and considers the measurement uncertainty of the on-road equipment [43]. The routes with tampered SCR had emissions 900–1200 mg/km, while with tampered EGR or SCR plus DPF around 1100–1500 mg/km. There is no clear explanation for the high emissions of the tampered EGR. The SCR should be functioning, but the results showed that this was not the case. Probably internal conflicts due to the blocked EGR, disabled the SCR or the SCR calibration could not be set to compensate for situations where EGR was malfunctioning or disabled. The functioning of the EGR can explain the relative lower NOx emissions of the tampered SCR case. In all cases, the emissions were almost ten times higher than the Euro 6 on-road limit for Diesel passenger cars, and even higher than any previous limit: for Euro 1 vehicles, the limit was 970 mg/km, including hydrocarbons. The latter finding reveals that tampering can result in almost a complete cancellation of the benefits provided by advanced modern aftertreatment systems, effectively reducing the vehicle to a pre-Euro standard.
The impact of tampering on the particle number emissions is given in Figure 5a, which plots the integrated emissions of the urban, rural, and motorway parts of each route (see Figure 1) for the baseline/original configuration, the original configuration when a regeneration event took place, the tampered EGR, SCR, or SCR + DPF cases.
The vehicle’s emissions with the original configuration were extremely low, three to four orders of magnitude below the Euro 6 limit (6 × 1011 × 1.5 = 9 × 10¹¹ #/km). The 1.5 is the conformity factor for particle number [39]. During regeneration, the particle emissions reached the limit (but no limit is applicable). The EGR and SCR tampering did not affect the particle number emissions, which remained at very low levels. However, tampering (removal) of the DPF resulted in emissions 5–6 times higher than the RDE limit. The specific tampered vehicle with emissions 6–10 × 1012 #/km had idle particle number concentration (as determined by the PEMS) just above 2.5 × 10⁵ #/cm3, which is the future limit during periodical technical inspection (PTI) in Germany. The vehicle with the original configuration had weighted emissions (i.e., sum of emissions including one regeneration event) around 0.4–1.4 × 10¹² #/km, well below the current particle number limit.
Figure 5b plots real-time emissions during the rural part of the trip for three cases: (i) original configuration, (ii) regeneration, and (iii) tampered DPF. Comparing the original and tampered DPF signals, the filtration efficiency of the specific DPF was >99.99%. The emissions during regeneration remained below the emissions without the DPF. The filtration efficiency during the regeneration event was 84%.

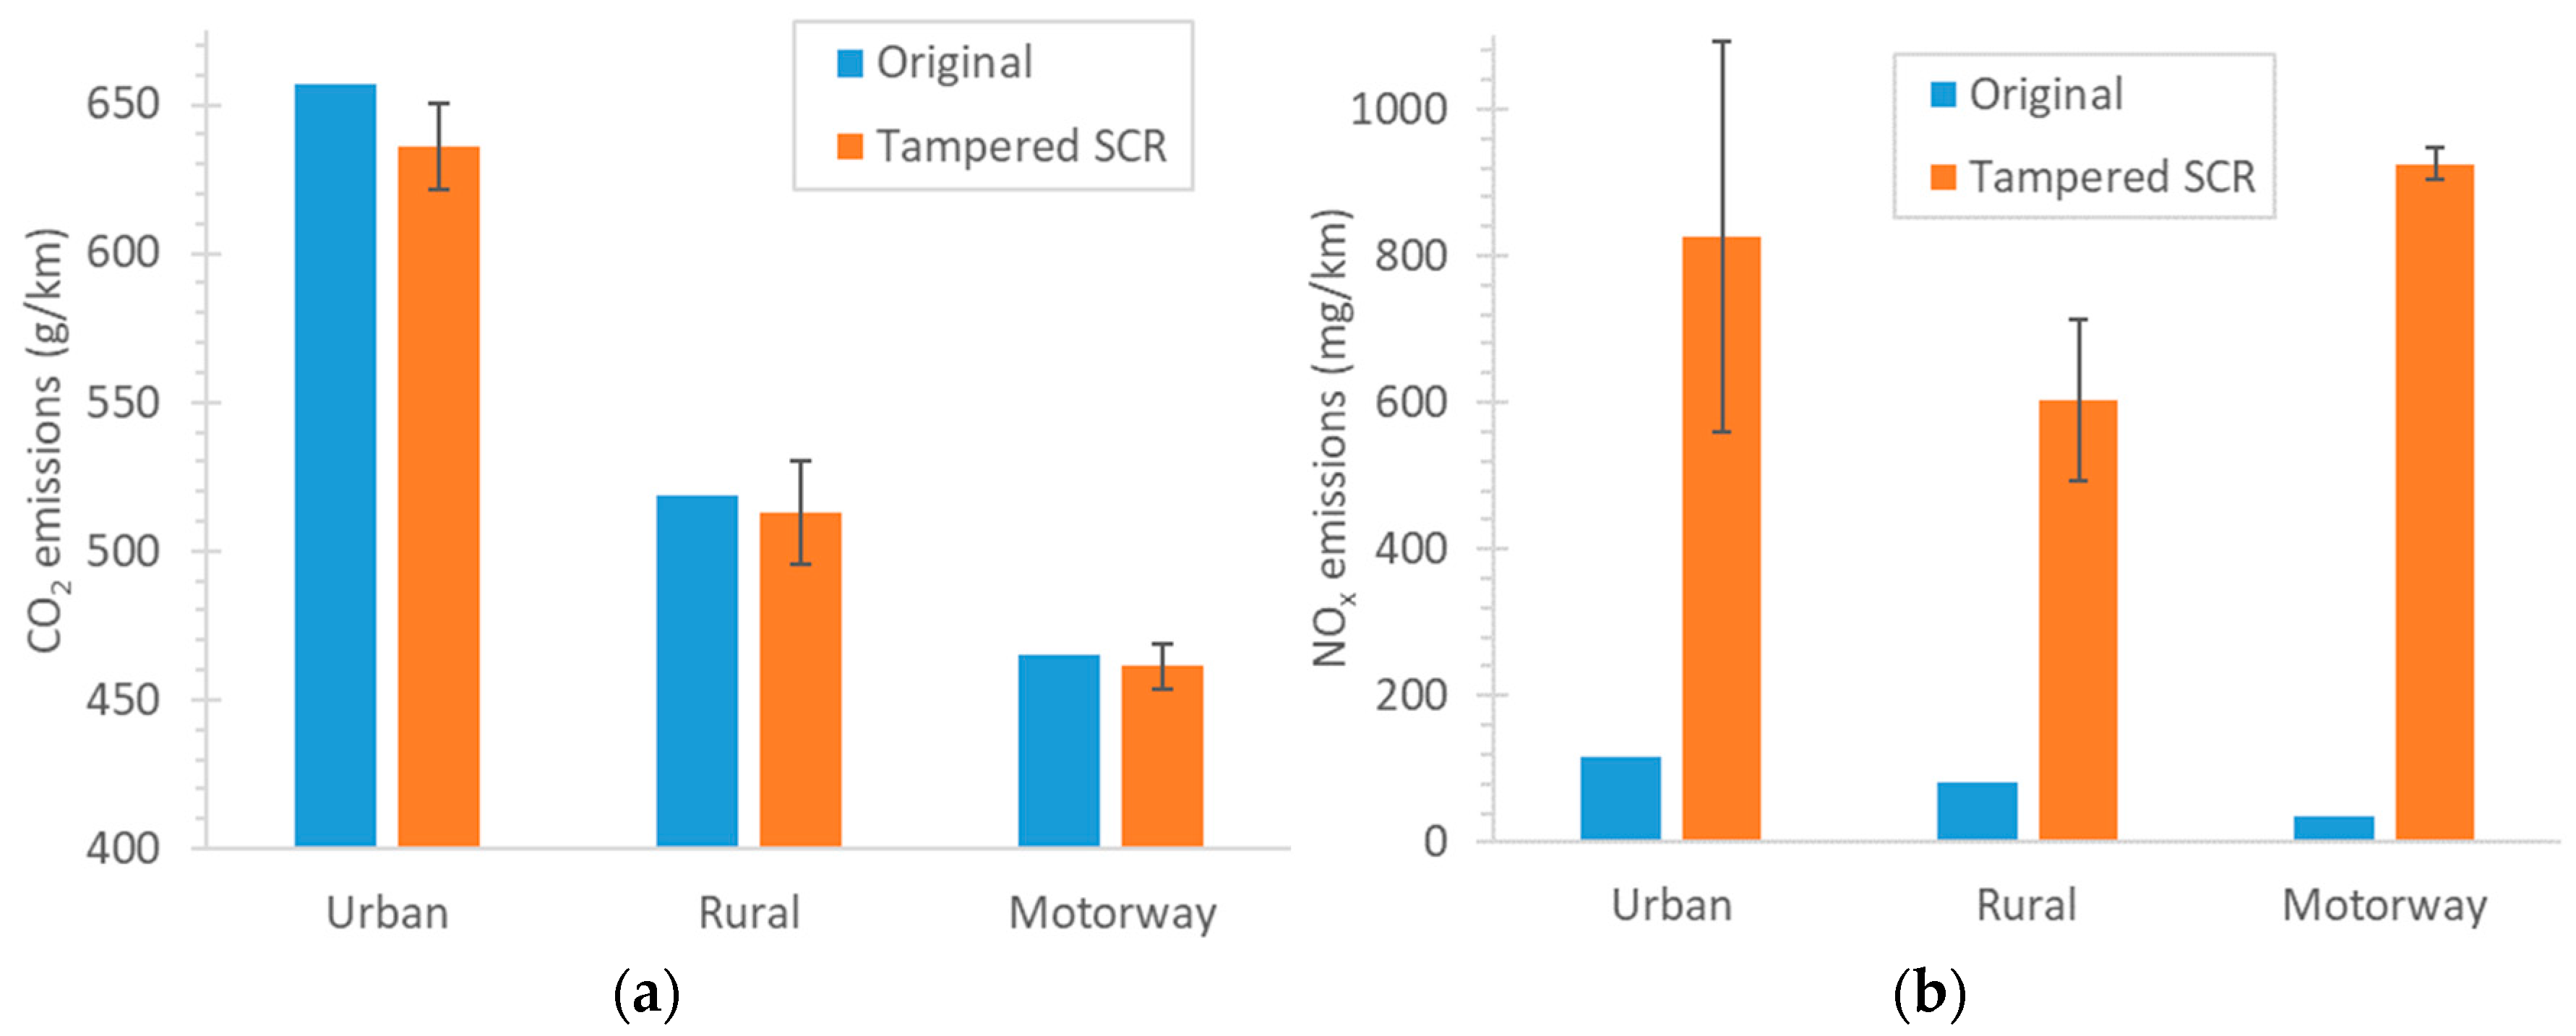
3.2. Light Duty Vehicle Euro 6b

The on-road emissions of the passenger car for the different parts of the routes with and without tampering are summarized in Table 3. In general, the CO2 had a small decrease in the urban and motorway parts, while NOx a significant increase: NOx almost doubled at urban and rural routes (but with relatively low absolute levels), and increased 18% at the motorway part where the absolute levels were high. Note that there is no RDE limit for this car, which was introduced with Euro 6c. The results clearly reflect the EGR deactivation, however there are doubts about the SCR deactivation. Even for the original configuration the SCR efficiency was low at motorway conditions. The ECU flashing did not fully deactivate the SCR, as the urban and rural emissions remained relatively low.

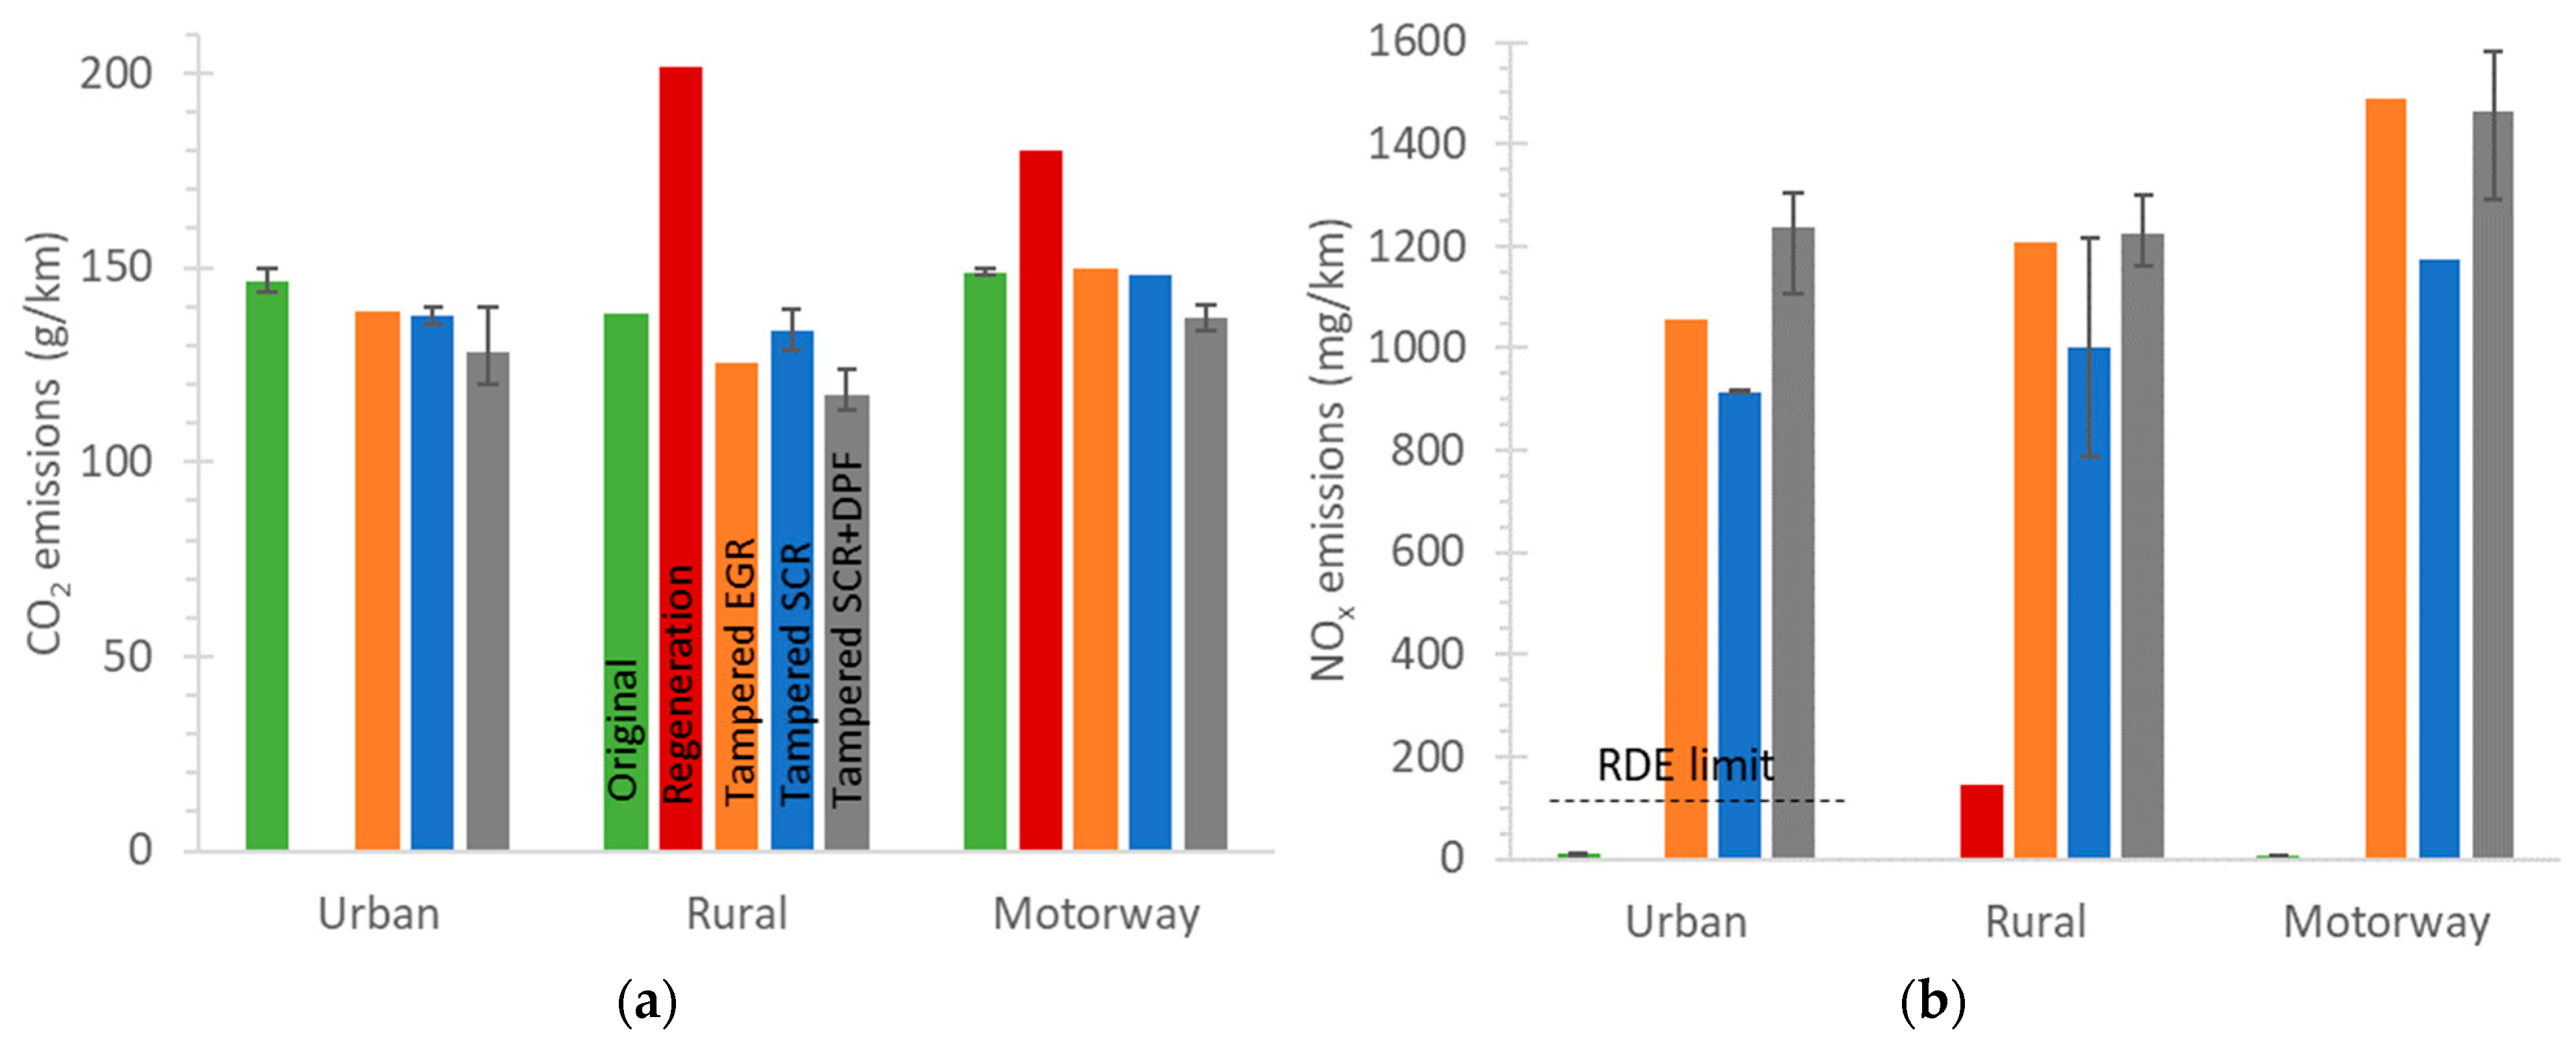
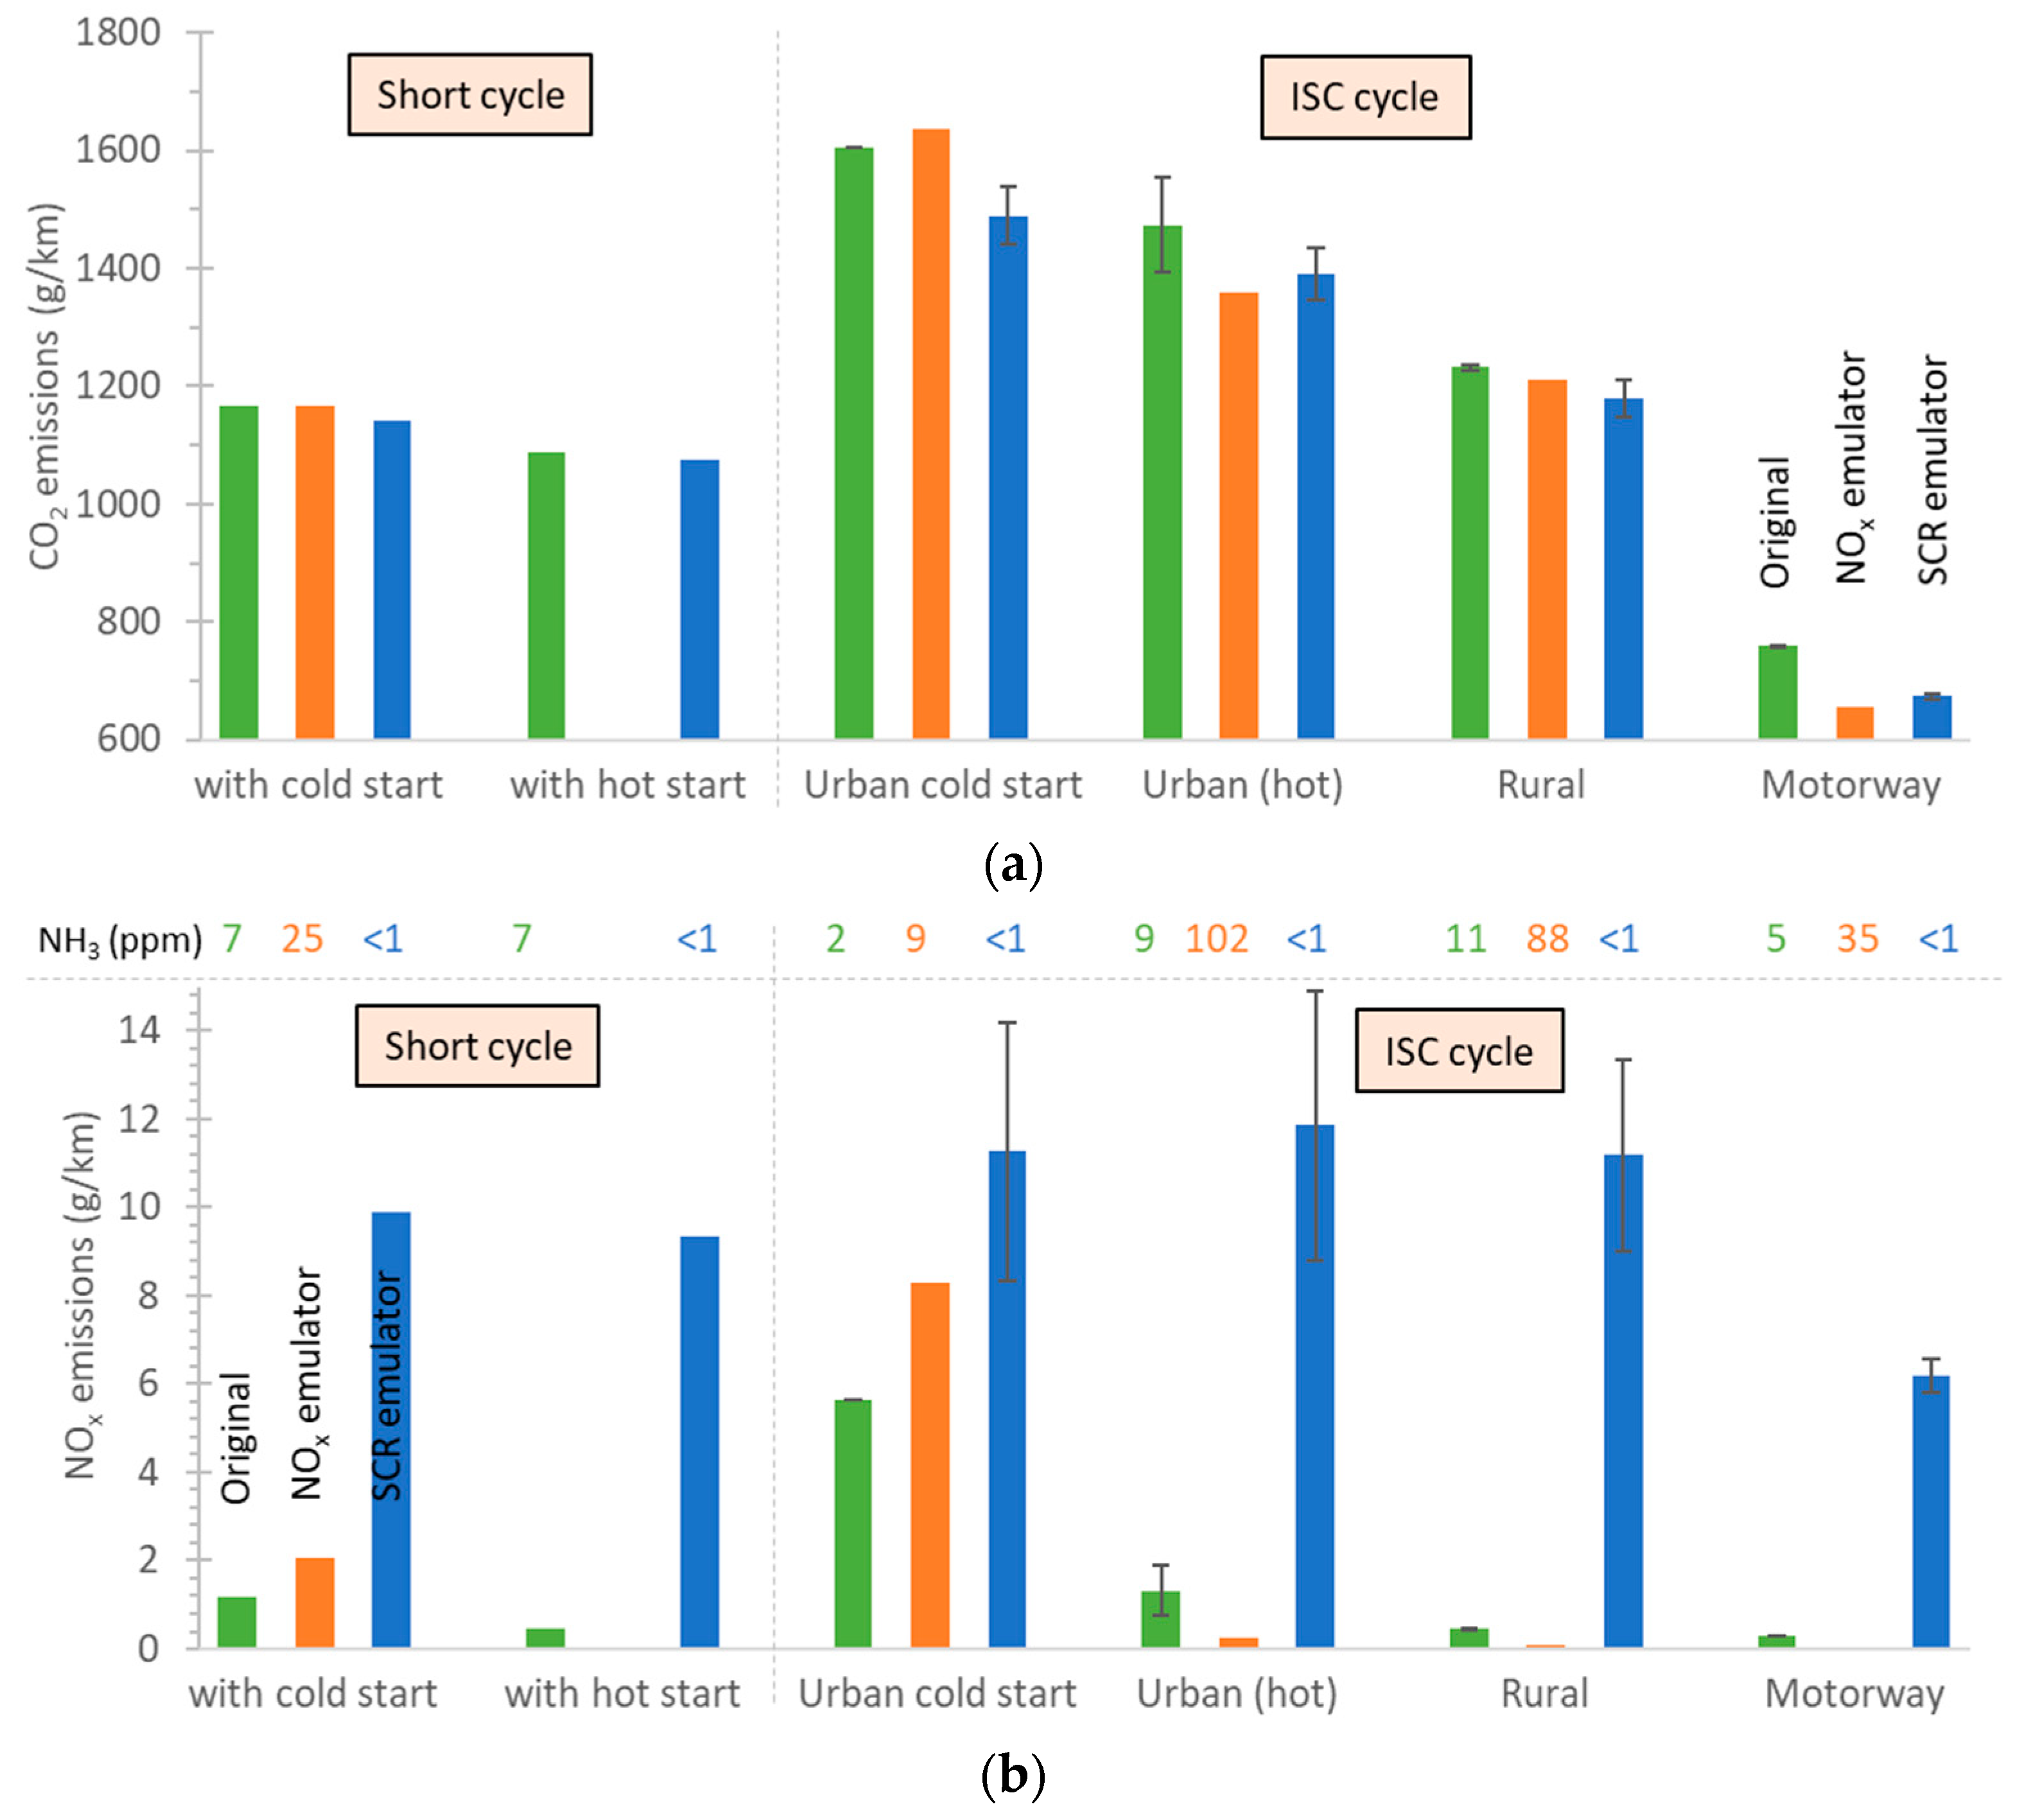
3.3. Heavy-Duty Vehicle N2

The impact of SCR tampering on the truck’s emission is summarized in Figure 6a for CO2 and Figure 6b for NOx. CO2 emissions marginally decreased over urban conditions while there was no significant change in rural and motorway driving. The NOx emissions increased to high levels (600–1000 mg/km or 1000–1700 mg/kWh). Although not applicable to vehicles, and not directly comparable due to the differences between engine and vehicle test cycles, the limit for the type approval of Euro VI heavy-duty engines is 460 mg/kWh, while for Euro V it was 2000 mg/kWh.

3.4. Heavy-Duty Vehicle N3

The results of the N3 truck are summarized in Figure 7. The CO2 emissions (Figure 7a) varied from 600 to 1600 g/km, depending on the cycle. There was a minimal difference between original and tampered configurations for the short cycles (2%), while there was a 6% decrease for the ISC urban and rural parts and 11% for the motorway part. The variability of the results can partly be attributed to the test trip variability. It should be recalled that the DPF was removed when the SCR emulators were tested.
The original configuration had NOx emissions 300–1300 mg/km (240–650 mg/kWh) (Figure 7b). The NOx emissions were high only during the 15 min cold start of ISC (5.6 g/km or 2.3 g/kWh), but when the SCR was at appropriate working temperature the emissions were very low (250 mg/kWh). The on-road NOx limit is 690 mg/kWh (1.5 × 460) for the specific vehicle, but excluding cold start for the ISC cycle. The 1.5 value is the conformity factor for on-road tests (Regulation (EU) No. 582/2011) [44].
With the NOx emulator, the NOx emissions remained at similar levels with the baseline configuration. The differences at the NOx levels are due to the different ambient temperature and the variability of the on-road testing. However, with the NOx sensor emulator mounted, ammonia concentration increased substantially (up to 102 ppm average) from 5–9 ppm with the original configuration. Note that the laboratory limit is an average of 10 ppm over a WHTC engine test cycle and is not controlled on the road. It is possible that the emulated NOx signal caused the reagent dosing to be off (open loop) and this caused increased slip of ammonia.
On the other hand, the NOx emissions with the SCR emulators were extremely high, ranging 6–15 g/km (5–6 g/kWh). The Euro I limit in 1992 was 8 g/kWh, the Euro II limit in 1996 was 7 g/kWh, and the Euro III in 2000 was 5 g/kWh. NH3 was close to zero ppm due to stopped dosing of reagent.

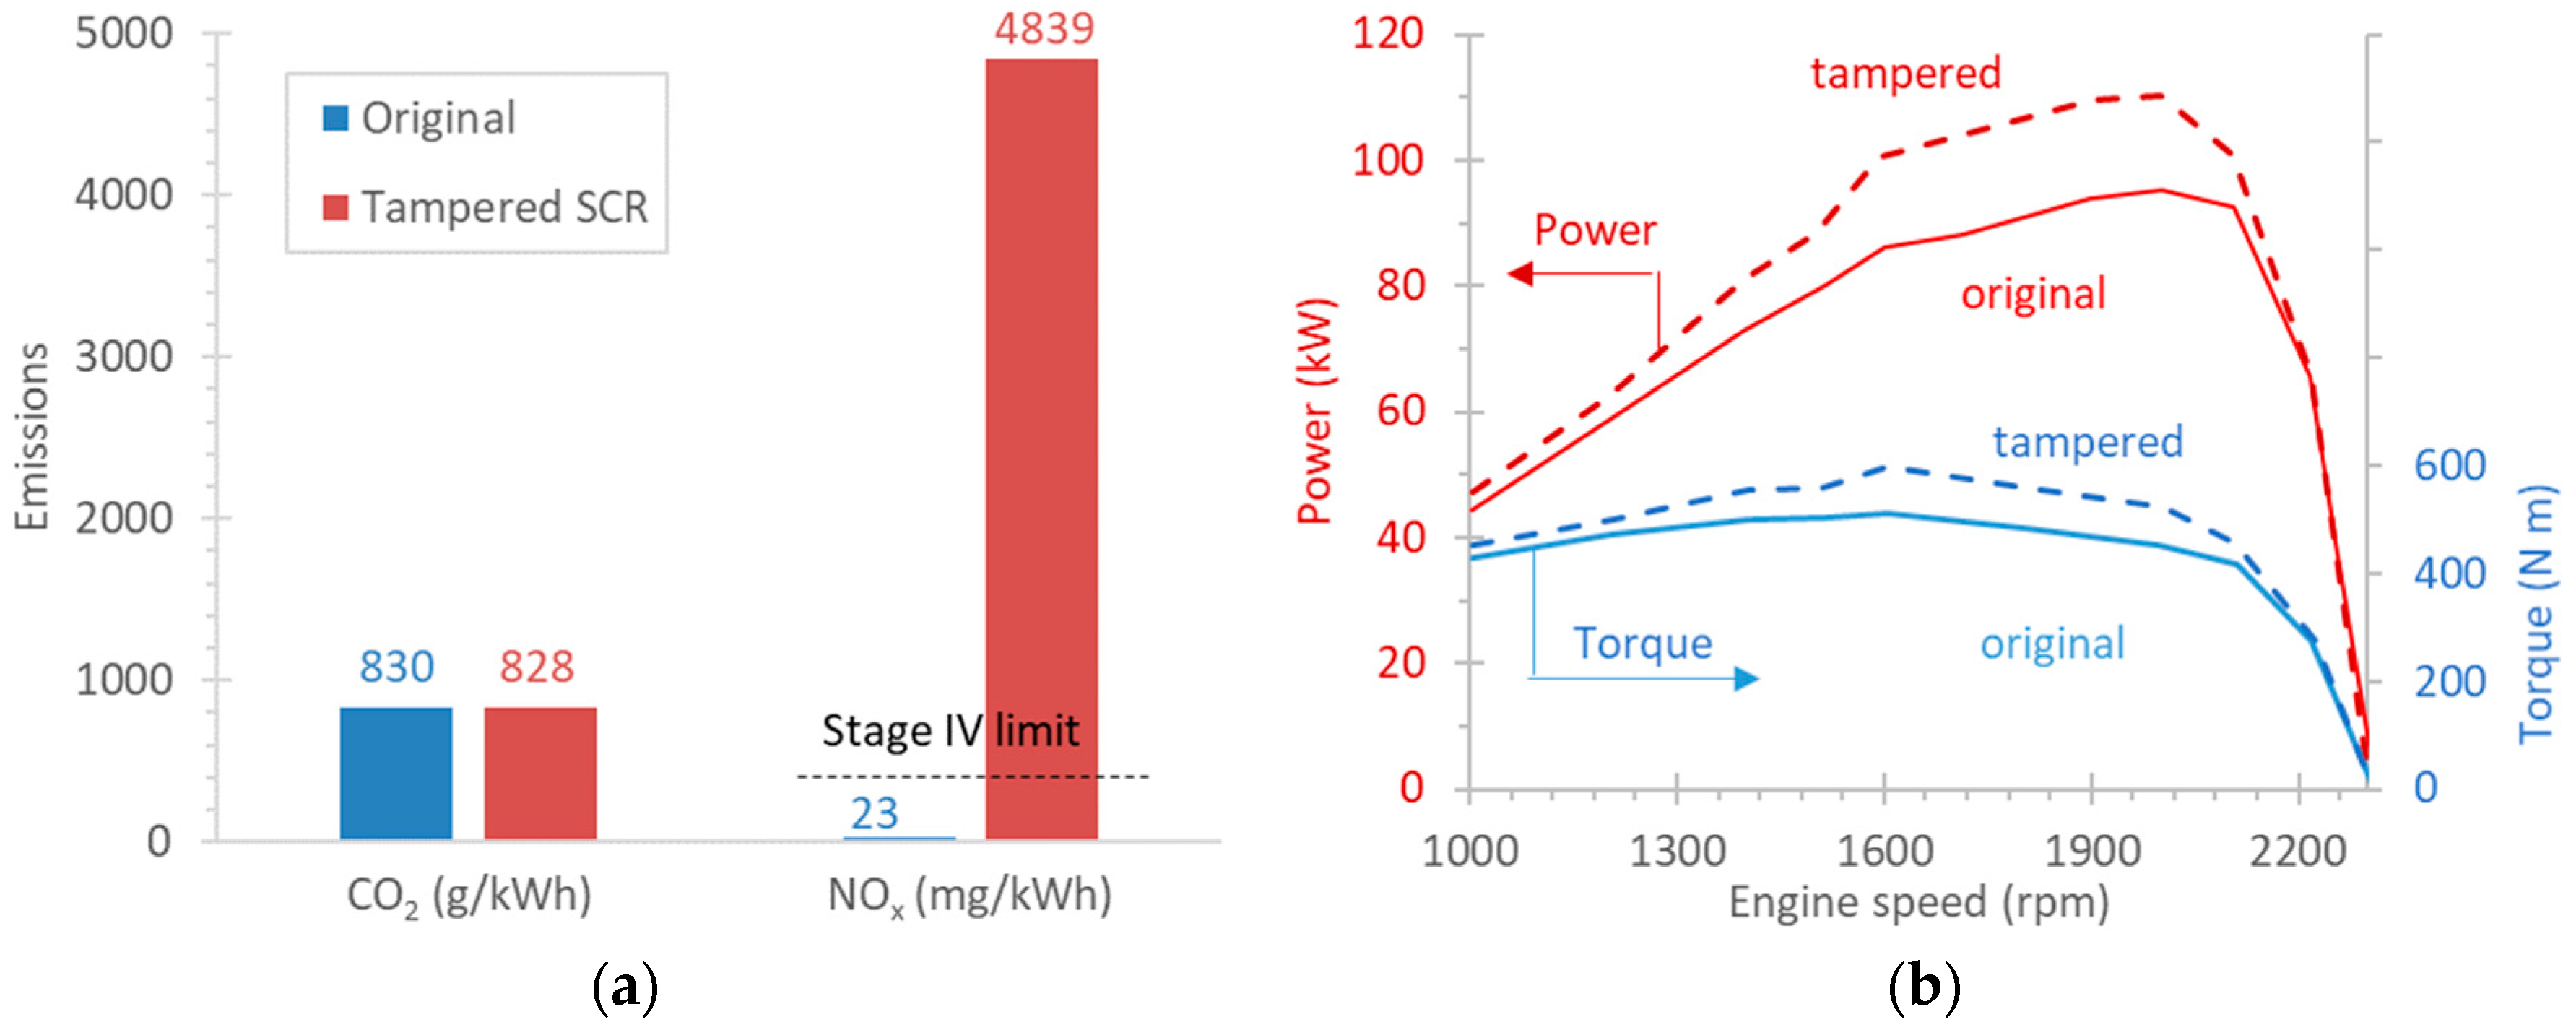
3.5. Non-Road Mobile Machinery (NRMM)

The results of the tractor’s tampering are summarized in Figure 8. Figure 8a plots the CO2 and NOx emissions at constant engine mode (around 50% of max power). While the CO2 emissions remained identical, the NOx emissions from negligible levels (23 mg/kWh) increased to very high levels (4839 mg/kWh): more than ten times above the limit for the specific tractor (Stage IV: 400 mg/kWh for NOx). The emission levels were even higher than the limit of Stage III engines (3300 mg/kWh), but lower than Stage II (6000 mg/kWh).
Figure 8b shows that after tampering (ECU reprogramming) the maximum power and torque increased around 15%. This finding confirms that tampering can increase power and torque in some cases, but the consequences to emissions, safety, durability, and driveability were not investigated.

4. Discussion

Our study provides useful information for the quantification of the impact of tampering on environment and user (as cost savings). The data can be used for detailed environmental impact of tampering on the current fleet by using more accurate emissions factors (tampered or not vehicles). The results of the impact assessment will allow the adoption of legislative guidelines considering the costs and benefits of the various countermeasures. The data can also be used for more detailed calculations on the installation of the tampering device or software and cost avoidance of parts or consumables. In the following sections these topics are discussed in more details.

4.1. Tampering and Increase of Emissions

This study demonstrated the serious environmental impact of tampering. Table 4 summarizes the vehicles, the tampering approaches and the impact on CO2 and NOx. The NOx emissions of the Euro 6d-Temp passenger car, when the SCR was tampered, increased 120–850 times, or around 30 times when considering the NOx emissions during regeneration. The absolute emissions reached 1500 mg/km exceeding any Euro standard level. Only EGR tampering of the Euro 6b car had smaller effect (up to a factor of 2). The tampered NOx levels reached what was measured from some Diesel vehicles during the Dieselgate scandal [34,45], or malfunctioning SCR [6]. For the Euro VI heavy-duty trucks under hot engine conditions, the NOx increased 7–28 times for the N2 and 50–220 times for the N3 truck. The absolute levels reached 1.7 g/kWh (Euro V) for the N2 truck and 5–6 g/kWh (Euro II) for the N3 truck. These levels are lower than a China IV tampered truck (6–8 g/kWh) [46]. The tampered tractor increased the NOx emissions >200 times, reaching 4.8 g/kWh (Stage II) levels.
The NOx/CO2 ratios of the original vehicles (except the Euro 6b) were 0.1–1.8 × 10⁻⁴, while of the tampered 9–107 × 10−4. Such ratios are in line with the ratios determined with remote sensing to detect high emitters [47,48,49,50].
The particle number emissions increased three to four orders of magnitude when the DPF was removed. Even when considering the regeneration, the weighted emissions over the regeneration distance remained more than four times below the 6 × 10¹¹ #/km limit, while the engine-out emissions were much higher than ten times the limit.
Even though the contribution of tampered vehicles to air pollution is out of the scope of this paper, the results showed that depending on the vehicle (light-duty, heavy-duty, and NRMM), driving (urban, rural, and motorway) increases by more than one order of magnitude occur.

4.2. Tampering Cost Motives

One of the main motives for tampering is cost savings. Cost savings can be achieved on multiple levels, fuel consumption reductions, as observed in the case of the light-duty vehicle, savings in SCR reagent, and in maintenance, repair, replacement parts, and downtime [8]. For a few cases, power increase could be a motive. Based on the tampering cases examined in this study, some cost savings estimations can be made.
The passenger car tests showed 3–9% reduction in fuel consumption (CO2) in the urban phases, probably due to the no or reduced EGR [16]. Annual mileage of 10,000 km in urban and rural roads would translate to about 30–100 Euros yearly savings at a fuel price of 1.5–2.0 Euros per liter and 5.5 L/100 km fuel consumption. The benefit increases when considering professional cars or commercial vehicles where the annual mileage can easily be doubled or tripled, also proportionally increasing cost savings.
Assuming a 2 L DEF consumption per 1000 km for high engine-out emissions and 25 Euro per 10 L reagent, the annual cost for 10,000 km would be 50 Euro. A similar value (70 Euro) is calculated by assuming DEF consumption equal to 5% of the fuel consumption. In the case of the truck, the cost would be more than ten times higher: according to Regulation (EU) 2019/1242 the majority of the fleet (category 5-LH) drives on average 116,000 km annually.
Removal of the DPF for the passenger car of this study resulted in 8–15% lower CO2 due to lower backpressure plus 2.4–3.0% savings for the regeneration fuel penalty. The 10–18% saving for this vehicle’s 5.5 L/100 km fuel consumption translates to 100–180 Euro annually (1.5–2.0 Euro per liter price range). For the heavy duty truck the fuel saving was from negligible (urban and rural) up to 11% (motorway). For 50,000 km driven in motorways (from the 100,000 km driven annually), a 5% fuel saving translates to 1100–1500 Euros annually (based on 30 L/100 km fuel consumption under motorway conditions).
The cost of tampering for a passenger car can start from 50 Euro (only an emulator), but ECU flashing costs are estimated to be around 300–600 Euro. For tractors and heavy-duty vehicles, the cost is similar or slightly higher. The removal of the DPF costs 1500–2000 Euro for heavy-duty vehicles [8]. Thus, the “investment” return would need around 3–6 years for EGR and SCR tampering (assuming 100 Euros reduced costs per year). For DPF tampering a cost of 1500 Euro would take 10 years to pay back for a passenger car, but probably 1 year for a heavy duty vehicle. However, the cost of tampering becomes marginal if the owner has to replace a damaged DPF (cost >1500 Euro) or other parts of the vehicle (EGR valve, NOx sensors, DEF pump, and injectors). Thus, based on this simple analysis, light-duty vehicles tampering is likely to appear in vehicles requiring repair or replacement of exhaust aftertreatment components, thus already some years in the market, or in professional or commercial vehicles performing a significant number of kilometers annually. For heavy-duty vehicles DEF and fuel savings could be a motive even early in the vehicles’ life.

4.3. Tampering Availability

Finding a workshop willing to tamper the vehicle is not very uncommon. Furthermore, there are many sites and forums available if one wants to install the tampering device independently [8,26]. Most importantly, at the moment, there are no robust procedures to detect tampering: the periodical technical inspection (typically every two years after four years from the purchase) does not include NOx testing [51]. The threshold of the DPF smoke opacity test is very high. Efforts are taking place to add a NOx test, while for DPFs, a much more sensitive particle number methodology will be introduced in the Netherland, Belgium, Germany, and Switzerland [52,53]. However, as most tampering methods are reversible, the user might restore the vehicle before the PTI test. This could be the case with some emulators which have a switch to be deactivated.
However, ECU re-flashing is not easy to undo. Then most importantly, to restore a removed DPF would cost significantly. PTI controls report <1% tampered vehicles [54], while roadside inspections up to 25%, but typically 5–10% [8,12]. Thus, roadside inspections are important as other monitoring programs (e.g., remote sensing) [48,50]. Finally, there is a need for stricter OBD requirements to detect tampering attempts [55,56,57,58,59]. In the future, the vehicle gathered data could be transmitted to a cloud backend, where a more complex analysis over longer time frames would be possible [60]. Another possibility is secure onboard tampering diagnostics and reporting. Even more importantly, there is no proper legal framework to deal with tampering today, particularly for light-duty vehicles [61]. Regulation (EC) 715/2007 on the emissions of light-duty vehicles does not mention tampering, but provisions for the electronic system security are required from manufacturers of light-duty vehicles according to the implementing Regulation (EU) 2017/1151. Even though Regulation (EC) 595/2009 on the emissions of heavy-duty vehicles foresees penalties for manufacturers, repairers and even operators of vehicles that perform tampering, such penalties are never applied in practice. Combining all these measures may already lead to a less attractive ‘environment’ for tampering.

5. Conclusions

Five latest technology Diesel vehicles equipped with Diesel particulate filter (DPF) and selective catalytic reduction (SCR) for NOx were tampered: two Euro 6 light duty passenger cars (EGR, SCR, and DPF), two Euro VI heavy duty trucks (NOx sensor and SCR), and a Stage IV NRMM agricultural tractor (SCR, and power increase). Tampering included market NOx, SCR, and Diesel exhaust fluid (DEF) (commercial name AdBlue®) emulators and ECU reprogramming for the SCR and EGR, removal of the DPF, and electronic control unit (ECU) reprogramming for the power increase. The results showed a very high increase of NOx (>1000 mg/km), reaching older or even pre-Euro standards levels for all vehicles. For the few cases that the tampering was not successful, the NOx increases were smaller, and in one case NH3 slip was noticed reaching 10 times the laboratory limit. EGR tampering had a small fuel consumption (CO2) benefit. The particle number emissions of the passenger car with tampered DPF increased three to four orders of magnitude, reaching levels one order of magnitude above the current limit. The passenger car tests also included regeneration events with the original configuration. The DPF filtration efficiency was still 84% during the regeneration period. It increased the CO2 emissions by 2.4–3.0% over the regeneration distance. Removal of the DPF reduced the CO2 emissions by 8–15%. The maximum power of the tractor increased around 15% with the ECU reprogramming. The key message of this study is that tampering is still possible even for the latest (Euro 6/VI, Stage IV) generation vehicles with serious environmental consequences.
The study is part of an EU-funded research project (DIAS) for the development of novel anti-tampering technologies. In this respect the findings will serve as the foundation for further research for creating more robust and resilient exhaust aftertreatment systems and vehicle control. This study also highlighted the broader need to find solutions for tampering: starting from regulatory level to vehicle manufacturers, from users to service providers. Finally, the quantification of the tampering effect is a necessary input for assessing the impact of the anti-tampering countermeasures. This will allow the adoption of the most efficient technical solutions and legislative actions in terms of cost and benefit.

Author Contributions

The authors B.G., F.F., M.C., G.B., P.C., R.V., D.K., P.F., Z.S. and G.F. have contributed to manuscript as follows: Conceptualization, G.F. and Z.S.; methodology and data collection, F.F., M.C., D.K., P.F., R.V., P.C., Z.S., G.F. and G.B.; data curation and formal analysis, B.G.; results interpretation and analysis: B.G, G.F., D.K. and F.F.; writing—original draft preparation, B.G.; writing—review and editing, F.F., D.K., R.V. and G.F. All authors have read and agreed to the published version of the manuscript.

Funding

This research was funded by the DIAS project of the European Union’s Horizon 2020 research and innovation programme (LC-MG-1-4-2018) under grant agreement No. 814951.

Institutional Review Board Statement

Not applicable.

Informed Consent Statement

Not applicable.

Data Availability Statement

Data is available from the corresponding author upon request.

Acknowledgments

The authors would like to acknowledge the companies that supported the installation of the tampering software and/or devices for the purposes of this project.

Conflicts of Interest

The authors declare no conflict of interest.

Disclaimer

Τhe research conforms to the ethics and risk assessment rules of the Horizon 2020 programme. The views expressed in the document are purely those of the authors and shall not be interpreted as an official position of the European Commission under any circumstance.

References

  1. Valverde-Morales, V.; Clairotte, M.; Pavlovic, J.; Giechaskiel, B.; Bonnel, P. On-Road Emissions of Euro 6d-TEMP Vehicles: Consequences of the Entry into Force of the RDE Regulation in Europe; No. 2020-01–2219; SAE International: Warrendale, PA, USA, 2020. [Google Scholar]
  2. European Environment Agency. Air Quality in Europe: 2020 Report; Publications Office of the European: Luxembourg, 2021.
  3. Andersen, O.; Upham, P.; Aall, C. Technological Response Options after the VW Diesel Scandal: Implications for Engine CO2 Emissions. Sustainability 2018, 10, 2313. [Google Scholar] [CrossRef] [Green Version]
  4. Liu, B.; Zimmerman, N. Fleet-Based Vehicle Emission Factors Using Low-Cost Sensors: Case Study in Parking Garages. Transp. Res. Part D Transp. Environ. 2021, 91, 102635. [Google Scholar] [CrossRef]
  5. Mérel, P.; Smith, A.; Williams, J.; Wimberger, E. Cars on Crutches: How Much Abatement Do Smog Check Repairs Actually Provide? J. Environ. Econ. Manag. 2014, 67, 371–395. [Google Scholar] [CrossRef]
  6. Huang, Y.; Ng, E.C.Y.; Yam, Y.; Lee, C.K.C.; Surawski, N.C.; Mok, W.; Organ, B.; Zhou, J.L.; Chan, E.F.C. Impact of Potential Engine Malfunctions on Fuel Consumption and Gaseous Emissions of a Euro VI Diesel Truck. Energy Convers. Manag. 2019, 184, 521–529. [Google Scholar] [CrossRef]
  7. Jiang, Y.; Yang, J.; Tan, Y.; Yoon, S.; Chang, H.-L.; Collins, J.; Maldonado, H.; Carlock, M.; Clark, N.; McKain, D.; et al. Evaluation of Emissions Benefits of OBD-Based Repairs for Potential Application in a Heavy-Duty Vehicle Inspection and Maintenance Program. Atmos. Environ. 2021, 247, 118186. [Google Scholar] [CrossRef]
  8. van den Meiracker, J.A.; Vermeulen, R. DIAS: The Market of Cheating Devices and Testing Matrix with a Prioritization for Testing of Vehicle Tampering Technique Combinations; TNO DIAS Deliverable D3.2; TNO: Delft, The Netherlands, 2020. [Google Scholar]
  9. Acevedo, F.; Yarbrough, C. Tampering & Aftermarket Defeat Devices. In Proceedings of the Midwest Clean Diesel Initiative Steering Committee Meeting, Chicago, IL, USA, 25 April 2019. [Google Scholar]
  10. Godwin, S. Web Investigation of Emulation & Device Removal Services (Prepared for ACEA). In Proceedings of the GRPE WP29-172–25e, Geneva, Switzerland, 18 April 2017. [Google Scholar]
  11. Pöhler, D.; Adler, T.; Krufczik, C.; Horbanski, M.; Lampel, J.; Platt, U. Real Driving NOx Emissions of European Trucks and Detection of Manipulated Emission Systems. In Proceedings of the EGU General Assembly Conference Abstracts, Vienna, Austria, 23–28 April 2017; p. 13991. [Google Scholar]
  12. Belser, E. Tampered Diesel Pickup Trucks: A Review of Aggregated Evidence from EPA Civil Enforcement Investigations. Available online: https://www.Epa.Gov/Enforcement/Tampered-Diesel-Pickup-Trucks-Review-Aggregated-Evidence-Epa-Civil-Enforcement (accessed on 10 April 2022).
  13. AECC. AECC Newsletter Jan 2018: International Regulatory Developments; AECC: Bournemouth, UK, 2018. [Google Scholar]
  14. Vojtisek-Lom, M.; Arul Raj, A.F.; Jindra, P.; Macoun, D.; Pechout, M. On-Road Detection of Trucks with High NOx Emissions from a Patrol Vehicle with on-Board FTIR Analyzer. Sci. Total Environ. 2020, 738, 139753. [Google Scholar] [CrossRef] [PubMed]
  15. Tenge, E.; Ypma, P.; McNally, P. MODALES D2.3: Legal Situation of Tampering; Spark Legal Network: London, UK, 2020; Available online: https://modales-project.eu/wp-content/uploads/2020/09/MODALES_D2.3-Legal-situation-of-tampering_WEB.pdf (accessed on 10 April 2022).
  16. Majewski, W.A.; Khair, M.K. Diesel Emissions and Their Control; SAE International: Warrendale, PA, USA, 2006; ISBN 978-0-7680-0674-2. [Google Scholar]
  17. Selleri, T.; Melas, A.D.; Joshi, A.; Manara, D.; Perujo, A.; Suarez-Bertoa, R. An Overview of Lean Exhaust DeNOx Aftertreatment Technologies and NOx Emission Regulations in the European Union. Catalysts 2021, 11, 404. [Google Scholar] [CrossRef]
  18. Kadijk, G.; van Mensch, P.; Spreen, J. Detailed Investigations and Real-World Emission Performance of Euro 6 Diesel Passenger Cars; TNO Report R10702; TNO: Delft, The Netherlands, 2015. [Google Scholar]
  19. Williams, R.; Pettinen, R.; Ziman, P.; Kar, K.; Dauphin, R. Fuel Effects on Regulated and Unregulated Emissions from Two Commercial Euro V and Euro VI Road Transport Vehicles. Sustainability 2021, 13, 7985. [Google Scholar] [CrossRef]
  20. Rößler, M.; Velji, A.; Janzer, C.; Koch, T.; Olzmann, M. Formation of Engine Internal NO 2: Measures to Control the NO 2 /NO X Ratio for Enhanced Exhaust After Treatment. SAE Int. J. Engines 2017, 10, 1880–1893. [Google Scholar] [CrossRef]
  21. Li, J.; Ge, Y.; Wang, H.; Yu, C.; Yan, X.; Hao, L.; Tan, J. Effects of Different Diesel Particulate Filter on Emission Characteristics of In-Use Diesel Vehicles. Energy Sources Part A Recovery Util. Environ. Eff. 2019, 41, 2989–3000. [Google Scholar] [CrossRef]
  22. Chiavola, O.; Chiatti, G.; Sirhan, N. Impact of Particulate Size during Deep Loading on DPF Management. Appl. Sci. 2019, 9, 3075. [Google Scholar] [CrossRef] [Green Version]
  23. Zhan, R.; Huang, Y.; Khair, M. Methodologies to Control DPF Uncontrolled Regenerations; No. 2006-01–1090; SAE International: Warrendale, PA, USA, 2006. [Google Scholar]
  24. Kontses, D.; Geivanidis, S.; Fragkiadoulakis, P.; Samaras, Z. Uncertainties in Model-Based Diesel Particulate Filter Diagnostics Using a Soot Sensor. Sensors 2019, 19, 3141. [Google Scholar] [CrossRef] [PubMed] [Green Version]
  25. Majewski, W.A. Emissions Tampering. Available online: https://dieselnet.com/tech/emissions_tampering.php (accessed on 10 April 2022).
  26. Braun, C.; Badshah, H.; Hosseini, V.; Jin, L.; Miller, J.; Rodriguez, F. Heavy-Duty Emissions Control Tampering in Canada; International Council Clean Transportation (ICCT) Report; ICCT: Washington, DC, USA, 2022. [Google Scholar]
  27. Barlow, T.; Müller, G.; Mäurer, H.-J.; Buekenhoudt, P.; Schulz, W.; Geis, I.; Multari, A.; Petelet, G. SET—Sustainable Emissions Test; CITA: Brussels, Belgium, 2015. [Google Scholar]
  28. Clairotte, M.; Suarez-Bertoa, R.; Zardini, A.A.; Giechaskiel, B.; Pavlovic, J.; Valverde, V.; Ciuffo, B.; Astorga, C. Exhaust Emission Factors of Greenhouse Gases (GHGs) from European Road Vehicles. Environ. Sci. Eur. 2020, 32, 125. [Google Scholar] [CrossRef]
  29. Zardini, A.A.; Suarez-Bertoa, R.; Dardiotis, C.; Astorga, C. Unregulated Pollutants from Tampered Two-Wheelers. Transp. Res. Procedia 2016, 14, 3109–3118. [Google Scholar] [CrossRef]
  30. Wang, J.M.; Jeong, C.-H.; Zimmerman, N.; Healy, R.M.; Wang, D.K.; Ke, F.; Evans, G.J. Plume-Based Analysis of Vehicle Fleet Air Pollutant Emissions and the Contribution from High Emitters. Atmos. Meas. Tech. 2015, 8, 3263–3275. [Google Scholar] [CrossRef] [Green Version]
  31. Zhou, L.; Hallquist, Å.M.; Hallquist, M.; Salvador, C.M.; Gaita, S.M.; Sjödin, Å.; Jerksjö, M.; Salberg, H.; Wängberg, I.; Mellqvist, J.; et al. A Transition of Atmospheric Emissions of Particles and Gases from On-Road Heavy-Duty Trucks. Atmos. Chem. Phys. 2020, 20, 1701–1722. [Google Scholar] [CrossRef] [Green Version]
  32. DIAS Diagnostic Anti-Tampering Systems. Available online: Https://Dias-Project.Com/ (accessed on 10 April 2022).
  33. Watts, R.; Ghosh, A.; Hinshelwood, J. Exploring the Potential for Electric Retrofit Regulations and an Accreditation Scheme for the UK. Electronics 2021, 10, 3110. [Google Scholar] [CrossRef]
  34. Giechaskiel, B.; Suarez-Bertoa, R.; Lähde, T.; Clairotte, M.; Carriero, M.; Bonnel, P.; Maggiore, M. Evaluation of NOx Emissions of a Retrofitted Euro 5 Passenger Car for the Horizon Prize “Engine Retrofit”. Environ. Res. 2018, 166, 298–309. [Google Scholar] [CrossRef]
  35. Giechaskiel, B.; Suarez-Bertoa, R.; Lahde, T.; Clairotte, M.; Carriero, M.; Bonnel, P.; Maggiore, M. Emissions of a Euro 6b Diesel Passenger Car Retrofitted with a Solid Ammonia Reduction System. Atmosphere 2019, 10, 180. [Google Scholar] [CrossRef] [Green Version]
  36. Giechaskiel, B.; Valverde, V.; Kontses, A.; Melas, A.; Martini, G.; Balazs, A.; Andersson, J.; Samaras, Z.; Dilara, P. Particle Number Emissions of a Euro 6d-Temp Gasoline Vehicle under Extreme Temperatures and Driving Conditions. Catalysts 2021, 11, 607. [Google Scholar] [CrossRef]
  37. Giechaskiel, B.; Casadei, S.; Mazzini, M.; Sammarco, M.; Montabone, G.; Tonelli, R.; Deana, M.; Costi, G.; Di Tanno, F.; Prati, M.; et al. Inter-Laboratory Correlation Exercise with Portable Emissions Measurement Systems (PEMS) on Chassis Dynamometers. Appl. Sci. 2018, 8, 2275. [Google Scholar] [CrossRef] [Green Version]
  38. Giechaskiel, B.; Casadei, S.; Rossi, T.; Forloni, F.; Di Domenico, A. Measurements of the Emissions of a “Golden” Vehicle at Seven Laboratories with Portable Emission Measurement Systems (PEMS). Sustainability 2021, 13, 8762. [Google Scholar] [CrossRef]
  39. Giechaskiel, B.; Bonnel, P.; Perujo, A.; Dilara, P. Solid Particle Number (SPN) Portable Emissions Measurement Systems (PEMS) in the European Legislation: A Review. Int. J. Environ. Res. Public Health 2019, 16, 4819. [Google Scholar] [CrossRef] [PubMed] [Green Version]
  40. Heepen, F.; Yu, W. SEMS for Individual Trip Reports and Long-Time Measurement; No. 2019-01–0752; SAE International: Warrendale, PA, USA, 2019. [Google Scholar]
  41. Yu, Y.S.; Jeong, J.W.; Chon, M.S.; Cha, J. NOx Emission of a Correlation between the PEMS and SEMS over Different Test Modes and Real Driving Emission. Energies 2021, 14, 7250. [Google Scholar] [CrossRef]
  42. Giechaskiel, B. Solid Particle Number Emission Factors of Euro VI Heavy-Duty Vehicles on the Road and in the Laboratory. Int. J. Environ. Res. Public Health 2018, 15, 304. [Google Scholar] [CrossRef] [Green Version]
  43. Giechaskiel, B.; Clairotte, M.; Valverde-Morales, V.; Bonnel, P.; Kregar, Z.; Franco, V.; Dilara, P. Framework for the Assessment of PEMS (Portable Emissions Measurement Systems) Uncertainty. Environ. Res. 2018, 166, 251–260. [Google Scholar] [CrossRef]
  44. Giechaskiel, B.; Gioria, R.; Carriero, M.; Lähde, T.; Forloni, F.; Perujo, A.; Martini, G.; Bissi, L.M.; Terenghi, R. Emission Factors of a Euro VI Heavy-Duty Diesel Refuse Collection Vehicle. Sustainability 2019, 11, 1067. [Google Scholar] [CrossRef] [Green Version]
  45. O’Driscoll, R.; Stettler, M.E.J.; Molden, N.; Oxley, T.; ApSimon, H.M. Real World CO2 and NOx Emissions from 149 Euro 5 and 6 Diesel, Gasoline and Hybrid Passenger Cars. Sci. Total Environ. 2018, 621, 282–290. [Google Scholar] [CrossRef]
  46. Su, S.; Ge, Y.; Zhang, Y. NOx Emission from Diesel Vehicle with SCR System Failure Characterized Using Portable Emissions Measurement Systems. Energies 2021, 14, 3989. [Google Scholar] [CrossRef]
  47. Pujadas, M.; Domínguez-Sáez, A.; De la Fuente, J. Real-Driving Emissions of Circulating Spanish Car Fleet in 2015 Using RSD Technology. Sci. Total Environ. 2017, 576, 193–209. [Google Scholar] [CrossRef]
  48. Huang, Y.; Organ, B.; Zhou, J.L.; Surawski, N.C.; Yam, Y.; Chan, E.F.C. Characterisation of Diesel Vehicle Emissions and Determination of Remote Sensing Cutpoints for Diesel High-Emitters. Environ. Pollut. 2019, 252, 31–38. [Google Scholar] [CrossRef] [PubMed]
  49. Hassani, A.; Safavi, S.R.; Hosseini, V. A Comparison of Light-Duty Vehicles’ High Emitters Fractions Obtained from an Emission Remote Sensing Campaign and Emission Inspection Program for Policy Recommendation. Environ. Pollut. 2021, 286, 117396. [Google Scholar] [CrossRef] [PubMed]
  50. Huertas, J.I.; Mogro, A.E.; Mendoza, A.; Huertas, M.E.; Ibarra, R. Assessment of the Reduction in Vehicles Emissions by Implementing Inspection and Maintenance Programs. Int. J. Environ. Res. Public Health 2020, 17, 4730. [Google Scholar] [CrossRef]
  51. Buekenhoudt, P.; Müller, G.; Mäurer, H.-J.; González, A.S.; Stephenson, J.; Multari, A.; Petelet, G.; Schulz, W. CITA SET II Project: Sustainable Emission Test for Diesel Vehicles Involving NOx Measurements; CITA: Brussels, Belgium, 2019. [Google Scholar]
  52. Jarosiński, W.; Wiśniowski, P. Verifying the Efficiency of a Diesel Particulate Filter Using Particle Counters with Two Different Measurements in Periodic Technical Inspection of Vehicles. Energies 2021, 14, 5128. [Google Scholar] [CrossRef]
  53. Melas, A.; Selleri, T.; Suarez-Bertoa, R.; Giechaskiel, B. Evaluation of Solid Particle Number Sensors for Periodic Technical Inspection of Passenger Cars. Sensors 2021, 21, 8325. [Google Scholar] [CrossRef]
  54. Manipulation on EURO IV, EURO V and EURO VI Trucks by Suppression of AdBlue Injection. In Proceedings of the 76th GRPE, Geneva, Switzerland, 9–12 January 2018. GRPE-76-08.
  55. Geivanidis, S.; Samaras, Z.; Willimowski, M.; Faye, I.; Urrehman, O.; Schernus, C.; Vermeulen, R. Next Generation of Vehicle Diagnostics Based on Advanced On-Board Monitoring and Cloud-Based Diagnostics. In Proceedings of the 8th Transport Research Arena TRA 2020, Helsinki, Finland, 27–30 April 2020. [Google Scholar]
  56. Ran, Q.; Song, Y.; Du, W.; Du, W.; Peng, X. Fault Detection of Diesel Engine Air and After-Treatment Systems with High-Dimensional Data: A Novel Fault-Relevant Feature Selection Method. Processes 2021, 9, 259. [Google Scholar] [CrossRef]
  57. Roman, A.-S.; Genge, B.; Duka, A.-V.; Haller, P. Privacy-Preserving Tampering Detection in Automotive Systems. Electronics 2021, 10, 3161. [Google Scholar] [CrossRef]
  58. Chen, T.; Li, X. (Semi-)Automatically Parsing Private Protocols for In-Vehicle ECU Communications. Entropy 2021, 23, 1495. [Google Scholar] [CrossRef]
  59. Haller, P.; Genge, B.; Forloni, F.; Baldini, G.; Carriero, M.; Fontaras, G. VetaDetect: Vehicle Tampering Detection with Closed-Loop Model Ensemble. Int. J. Crit. Infrastruct. Prot. 2022, 37, 100525. [Google Scholar] [CrossRef]
  60. Ki, J.; Schildt, S.; Hastall, A.; Jeroschewski, S.E.; Hoettger, R. Eclipse KUKSA. Val for SCR Anti-Tampering Monitoring in Heavy Vehicles. In Proceedings of the 2nd Eclipse Research International Conference on Security, Artificial Intelligence, Architecture and Modelling for Next Generation Mobility, Virtual, 15–16 June 2021. [Google Scholar]
  61. Hooftman, N. Tampering; TNO: The Hague, The Netherlands, 2019. [Google Scholar]
Figure 1. Typical on-road speed profile followed by the passenger car. The route is compliant with the real driving emissions (RDE) regulation for light-duty vehicles.
Sustainability 14 06065 g001
Figure 2. Speed profile followed by the N2 truck in the laboratory. The route is standardized and based on the same data used for the engines type-approval cycle. The differentiation to urban, rural, and motorway parts is only specific to this study. The mean speed (v) and distance per phase (D) is given in the inset.
Sustainability 14 06065 g002
Figure 3. Speed profile of the short cycle and the in-service conformity (ISC) cycle (N3 truck).
Sustainability 14 06065 g003
Figure 4. Impact of regeneration (red bars), tampering of the EGR (orange bars), SCR (blue bars) and/or the DPF (grey bars) on the emissions of the original vehicle configuration (green bars), indicated with different colored bars: (a) CO2; (b) NOx. Error bars give min-max values of two or three repetitions. Test: On-road routes (Figure 1). To convert (m)g/km to (m)g/kg fuel multiply by 22.5. DPF = Diesel particulate filter; EGR = exhaust gas recirculation; SCR = selective catalytic reduction.
Sustainability 14 06065 g004
Figure 5. Impact of regeneration, tampering of the EGR, SCR and/or the DPF on the particle number (PN) emissions of the original vehicle configuration: (a) integrated PN emissions. Error bars give min-max values of two or three repetitions; (b) real-time PN emissions.
Sustainability 14 06065 g005
Figure 6. Impact of SCR tampering on the emissions of the original vehicle configuration: (a) CO2; (b) NOx. Error bars give min-max values of two repetitions. Test: Hot start WHVC (Figure 2). To convert (m)g/km to (m)g/kg fuel multiply by 6.1. To convert to (m)g/kWh divide by 0.63 (urban), 0.57 (rural), and 0.58 (motorway). SCR = selective catalytic reduction for NOx; WHVC = world harmonized vehicle cycle.
Sustainability 14 06065 g006
Figure 7. Results of the N3 truck: (a) impact of NOx and SCR emulators on: (a) CO2; (b) NOx and NH3 emissions. To convert to (m)g/kWh divide by the kWh/km factors of Table 2.
Sustainability 14 06065 g007
Figure 8. Results of the tractor: (a) impact of SCR tampering on the CO2 and NOx emissions of the original vehicle configuration. To convert (m)g/km to (m)g/kg fuel multiply by 3.8.; (b) full power curve.
Sustainability 14 06065 g008
Table 1. On-road RDE-complaint trip characteristics. U = urban; R = rural; M = motorway.
Trip CharacteristicsOriginalTampered
Ambient temperature (°C)2522
Coolant temperature (°C)9284
Mean speeds U/R/M (km/h)26.1/80.0/99.130.3/76.0/106.6
Distances U/R/M (km)22.6/26.0/25.323.1/26.0/25.0
Table 2. Characteristics of the two tested cycle (short cycle) and in-service conformity (ISC) cycle. All ISC cycles were started with cold engine, while the short cycles with cold or hot engine.
ParameterShort CycleISC Cold StartISC UrbanISC RuralISC Motorway
Distance18.1 ± 0.15.0 ± 0.613.1 ± 0.618.3 ± 0.652.7 ± 0.2
Mean speed34.4 ± 1.420.1 ± 2.620.0 ± 3.238.0 ± 7.672.3 ± 7.0
kWh/km1.83 or 1.67 12.46 ± 0.162.12 ± 0.052.04 ± 0.201.09 ± 0.10
1 The higher value for the cold start test.
Table 3. Results of the Euro 6b passenger car tampering.
EmissionsOriginalTamperedDifference
Urban CO2 (g/km)128.5122.6−4.6%
Rural CO2 (g/km)113.5114.71.1%
Motorway CO2 (g/km)154.4148.2−4.0%
Urban NOx (mg/km)127.4234.184%
Rural NOx (mg/km)133.1291.0119%
Motorway NOx (mg/km)771.4912.418%
Table 4. Tampering approaches of this study and impact on emissions.
CategoryDescriptionTargetApproachCO2NOx
LD (Euro 6d-Temp)Passenger carEGRECU flashing 13–9%1.1–1.5 g/km
SCR (DEF)ECU flashing3–9%0.9–1.2 g/km
SCR + DPFECU flashing8–15% 21.1–1.5 g/km
LD (Euro 6b)Passenger carEGR + SCRECU flashing 3<5%0.2–0.9 g/km
HD (Euro VI D)N2 truckSCR (DEF)DEF emulatorno impact1.0–1.7 g/kWh
HD (Euro VI C)N3 truckNOx sensorNOx emulator2–11%No impact 4
SCR + DPFSCR emulator2–11%5–6 g/kWh
NRMM (Stage IV)Agrigultural tractorSCRDEF emulatorno impact4.8 g/kWh
PowerECU flashing+15% powern/a
1 The EGR tampering affected the SCR negatively and resulted in high NOx emissions; 2 plus 2.4–3.0% benefit from the regeneration; 3 the SCR tampering was probably not successful and resulted in relatively low increases of NOx; 4 ammonia slip was measured. DEF = Diesel exhaust fluid; DPF = Diesel particulate filter; ECU = electronic control unit; EGR = exhaust gas recirculation; HD = heavy duty; LD = light duty; NRMM = non-road mobile machinery; SCR = selective catalytic reduction.
Publisher’s Note: MDPI stays neutral with regard to jurisdictional claims in published maps and institutional affiliations.

