Hotel Service Innovation with Smart Technologies: Exploring Consumers’ Readiness and Behaviors


1
School of Hotel and Tourism Management, Youngsan University, 142 Bansong Beltway, Haeundae-Gu, Busan 48015, Korea
2
College of Hospitality and Tourism Management, Sejong University, 98 Gunja-Dong, Gwanjin-Gu, Seoul 05006, Korea
*
Author to whom correspondence should be addressed.
Sustainability 2022, 14(10), 5746; https://doi.org/10.3390/su14105746
Submission received: 12 April 2022
/
Revised: 3 May 2022
/
Accepted: 7 May 2022
/
Published: 10 May 2022
(This article belongs to the Section Tourism, Culture, and Heritage)
Abstract
:This research investigated consumer behaviors for a smart hotel, which is driven by innovative technologies along with the fourth industrial revolution. Considering its enormous potential to become the hotel of the future, we aimed to offer a better understanding of consumers’ intricate decision-making process and behaviors for a smart hotel choice. A robust model was developed by incorporating technology readiness into the merged framework encompassing technology acceptance model and planned behavior theory. The results of data analysis discovered the significant role of each variable, such as technology readiness, perceived ease of use, perceived usefulness, attitude, subjective norm, and perceived behavioral control, and confirmed all hypotheses within the combined model. The proposed theoretical framework sufficiently accounted for consumers’ behavioral intentions and the discussions involved managerial implications of this research.
1. Introduction
Innovative technologies are constantly being introduced at present and they have deeply penetrated into various industrial environments [1]. The same phenomenon occurs in the hotel industry and proactively embracing such innovations brought a smart hotel into existence [2,3]. A smart hotel is to some extent a practical term which describes a novel concept of hotels operating with a wide range of new technologies [4]. As such, a smart hotel can be defined as an innovative hotel that deploys advanced technologies to provide operational excellence through service automation and customized offerings. Furthermore, human-free services are often characterized at a smart hotel since disruptive technologies such as robots could handle a range of tasks that human beings used to manage [5,6,7].
As innovative technologies provide the main impetus for a better result of key performance indicators across different industries, individuals’ behavioral intentions towards the acceptance of novel technology have been the popular debating topics in business today [8,9,10]. People have a different perception in almost every case, and this applies the same to the technology. This eventually affects consumer behavior, which is categorized under approach behavior and avoidance behavior in the hotel sector [2]. Some individuals welcome innovative technologies and feel excited about how technology revolution enhances their experience, whereas others are not interested in and repelled by new technology-powered products/services. In this respect, technology readiness (TR) was proposed, which illustrates an individual tendency to embrace novel technology [11]. Many scholars have emphasized the need to consider individual differences into account when assessing consumers’ technology adoption behavior and they have accordingly adopted TR to predict behavioral intentions in the various settings [8,12,13,14]. In this study, we focused on how to increase approach behavior which leads individuals to visit the hotel property constantly and recommend others to visit.
In addition, constant endeavors to determine the prominent driving factors behind the willingness to adopt new technology have supported the technology acceptance model (TAM) which was created by Davis [15]. In theory, the perceived ease of use and perceived usefulness of novel technology-based offerings were posited as antecedents which influence individual attitude, and consequently affect use intentions and actual usage [15]. TAM has been extensively employed in the hospitality context and it was validated with the strong predicting power of consumers’ behavioral intentions towards cutting-edge technologies [16,17,18]. Meanwhile, the theory of planned behavior (TPB) is a popular social psychological theory which explains the formation of consumer behavior [19,20]. TPB predicts a person’s intentions by individual attitude, subjective norm, and perceived behavioral control factors [21]. The application of TPB spans a variety of sectors and the employment rate of this theory in the domain of the technology is also high [22,23]. Thus, on the basis of the wealth of empirical evidence, TR, TAM, and TPB appear to be most widely supported frameworks in explaining consumers’ behavioral intentions in the tech-augmented hospitality industry.
The comprehensive approach, merging distinctive constructs from the empirically validated theories, has become increasingly common to understand more sophisticated consumers in these days [9,17,24,25]. However, it is still in the infancy stage in the context of innovative technology driven hospitality, and only a few attempts have been made in the domain of a smart hotel. This implies the opportunity for a better understanding of consumers’ behavioral intentions through the overarching theoretical model. Given the above, the research aim is to assess consumers’ decision-making process for a smart hotel selection by incorporating TR into TAM and TPB. This means that the study allows assessing the individual specific disposition towards technology through TR, acceptance of technology specific through TAM, and individual specific behavior through TPB. Further material is divided into several parts. Thus, in Section 2, we review the extant literature introducing smart hotels and articulating TR and variables which are rooted from TAM and TPB. Section 3 explains the methodology, which describes how the quantitative approach was designed to test proposed hypotheses, and Section 4 presents the results of data analyses in detail. Section 5 discusses meaningful implications for theory and practitioners in the field, followed by the conclusion in Section 6, which includes the limitations of this research and the recommendations for future study.
2. Literature Review
2.1. Emergence of a Smart Hotel
Recent years have experienced the outburst of new technology and have witnessed how innovative technologies reshape the hotel industry [26,27]. Similarly, Law et al. [3] asserted that the technology development in the hotel industry has infinite possibilities which enable hotel practitioners in operating intelligent systems for the improvement of effective management. Despite the different levels of technology adoption by hotels, embracing disruptive technologies in a large scale has promoted the generation of a smart hotel.
Smart is generally considered as innovative and intelligent solutions and a smart hotel is described as a hotel that implants the advanced technology-powered environment to gain the competitive advantages in its operation [2,4,28]. Likewise, a smart hotel is featured with a wide range of novel technologies that enable automated, innovative, and personalized services [4,28,29,30]. As an example, Kim and Han [2] articulated Yotel Singapore Orchard Road and Flyzoo Hotel in China. Yotel provides guests with a smartbed, technowall with adjustable mood lighting, smart TVs, and service robots (i.e., Yoshi and Yolanda) and the hotel won the first place in “Robotics for Hospitality and Leisure” category in the Technology Excellence Award 2019. Flyzoo Hotel has opened its door in Hangzhou, China where guests open their room with facial recognition, service robots are employed to deliver amenities and foods, and guests enjoy fun digital experiences with interactive screens and guided workouts.
Even though the potential risks related to the adoption of novel technologies are addressed now and then [4], the development trends of a hotel industry will be mainly led by advances in technology [3,28,31]. According to the survey conducted by Amadeus and InterContinental Hospitality Group [7], earphones that offer immediate translation, an algorithm which provides the best possible suggestions or solutions, and voice assistance in guest rooms were nominated as technologies that tomorrow’s guests look for. Likewise, the adoption of smart technologies are indisputable and more likely to be continued since both today’s buyers and suppliers appreciate the smart technologies in the hotel industry to improve every aspect of their respective goals [27,28,32]. Therefore, a smart hotel is regarded as the hotel of the future.
2.2. Technology Readiness (TR)
Technology and its revolution increased value to the general public in many aspects. However, Parasuraman [11] argued that every individual has a different level of propensity to embrace novel technology and proposed TR, which describes individuals’ inclination toward technology. Moreover, TR is illustrated as relatively durable and long-term individual level characteristic [14,28,33]. People with a higher degree of TR are related to the greater possibilities to adopt innovative technology and their usage of technology become more intense [33,34]. Furthermore, Lin et al. [10] asserted that the identification of the psychological processes of individuals’ perception toward technology has to be conducted in order to assess the technology acceptance. Hence, an individual’s readiness has been tested to predict consumers’ technology adoption in many studies [12,13,28,35].
TR was described with four underlying facets, which are optimism, innovativeness, discomfort, and insecurity [11]. Of them, optimism involves the positive beliefs and perspectives that technology driven products/services offer individuals benefits such as improved efficiency, control, and flexibility. Innovativeness describes a disposition to be an influencer, leader, or pioneer in the field of technology adoption. On the other hand, discomfort illustrates the status being overwhelmed by emerging technology or having insufficient control over technology, and insecurity is related to skepticism and distrust about technology and its capability to work appropriately. Likewise, optimism and innovativeness are regarded as drivers of TR, and on the contrary, discomfort and insecurity are categorized as inhibitors [11]. Parasuraman and Colby [33] further improved scales of multi-faceted TR and demonstrated TR 2.0. They remained with four underlying dimensions in the enhancement, though discomfort and insecurity were not meeting the criterion for the acceptable convergent validity. The authors then explained that these results are attributed to these inhibiting dimensions being more complex and more complicated to measure, and acknowledged this as a limitation of their research. In this regard, numerous existing studies generally demonstrated a low reliability of insecurity and discomfort, or discovered the insignificant associations between these inhibitors and constructs of TAM [12,35,36]. Therefore, the current study adopted drivers (i.e., optimism and innovativeness) of TR which have been validated as solid determinants of an individuals’ predisposition to use novel technologies in the extant empirical studies.
2.3. Technology Acceptance Model (TAM)
TAM is a specific framework for predicting individual adoption of technology and it postulates that individuals’ willingness to accept novel technology is highly determined by attitude, which is built by uses’ perception of ease of use and usefulness towards technology-based products or services [15]. In other words, TAM is centered on how individuals’ attitudes toward the characteristics of novel technology influence consumers’ intentions, ultimately the use of the specific technology [18].
Perceived ease of use was articulated as “the degree to which a person believes that use of a particular system would be free of effort”, whereas perceived usefulness was conceptualized as “the degree to which a person believes that use of a particular system would enhance his/her job performance” (p. 320) [15]. In the framework, perceived ease of use is also postulated as it is influencing perceived usefulness and both variables increase the attitude which is “the degree to which a person has a favorable or unfavorable evaluation or appraisal of the behavior in question” (p. 188) [21] and consequently intentions to use. Proposed variables in TAM are internally reliable, exhibit a good level of convergent and discriminant properties, and demonstrate predictive validity [15,18,37]. Even though TAM was originally proposed to understand employees’ technology adopting behaviors at workplaces, numerous studies applied TAM to explicate consumers’ acceptance behavior toward novel systems and technologies in the hospitality context [16,17,28,38,39]. Likewise, Stock and Merkle [5] examined consumers’ acceptance of service robots based on TAM and Huang et al. [38] employed the extended TAM to investigate consumers’ adoption of hotel mobile applications. As such, TAM evolved into one of the leading models in predicting consumer behavior along with the technological progress.
2.4. Theory of Planned Behavior (TPB)
The premise of the planned behavior theory is that individual intentions are under attitude, subjective norm, and perceived behavioral control [21]. As explained above, attitude is a person’s general assessment of a certain behavior after assessing the perceived consequences of an act. Subjective norm was explained as the level to which a person believes that people around think she or he should engage in a specific activity [20,40]. Perceived behavioral control encompasses the perception of inner and/or outer constraints on a certain behavior. This means that individuals’ behavioral intentions depend on how a person evaluates a specific behavior, how one wants to comply with the opinion of significant others, and how a person possesses the perceptions of internal or external constraints on action.
TPB has been extensively cited in most of the studies that deal with consumer behavior in the hospitality industry and abundant empirical evidence has been provided [19,24,41,42,43]. For instance, Han and Kim [20] sought to predict the consumers’ decision formation in the green hotel context and tested TPB model. Their findings revealed that key determining variables of TPB (i.e., attitude, subjective norm, and perceived behavioral control) increased the intentions to choose a green hotel and supported the superiority of the theory. Jun and Arendt [44] developed the extended TPB, which was implemented by incorporating additional variables, subdividing the original constructs of attitude into affective attitude and cognitive attitude, and breaking down social norms into injunctive norms and descriptive norms to explain individuals’ healthy eating behaviors at casual dining restaurants. Likewise, TPB has been verified as a powerful theory in predicting consumer behavior in many different settings of the hospitality industry.
2.5. Incorporating TR into TAM and TPB
Numerous scholars have addressed personal traits as an essential construct in understanding individual behavior in the context of the technology [33,34,36]. A cognitive clue of TR is retrieved at first and settled, and then the specific cognitive appraisal (e.g., ease of use) is processed in forming individuals’ technology adoption intentions [10]. In other words, it is of importance to understand the level of comfort with smart technologies from the consumers’ perspective as a priority. In accordance with that, drivers of TR (i.e., optimism and innovativeness) were discovered to have positive and meaningful effects on perceived ease of use toward novel technology [12,33,45]. At the same time, Verma et al. [14] discovered that consumers with a high TR immediately display stronger intentions and emphasized that hotel operators should consider how consumers feel toward innovative technology to predict their acceptance.
The personality reflected in TR is regarded as a significant antecedent to the cognitive constructs of TAM in the extant literature. For example, Lin et al. [10] integrated TR into TAM and proposed the technology readiness and acceptance (TRAM) model to predict individuals’ use intentions of an online stock trading system. The analysis results using 406 responses revealed a strong direct impact of TR on perceived ease of use and exhibited the psychological process of TR to perceived ease of use, then to perceived usefulness which subsequently increases use intentions. Shin and Lee [13] tested individuals’ adoption of mobile payment services using a combined model of TR and TAM. Their results exhibited the meaningful link between TR and perceived ease of use. Kim and Chiu [46] examined consumers’ willingness to accept smart sports wearable technology and positive TR which is consisted of optimism and innovativeness considerably affect perceived ease of use. Meanwhile, a number of scholars demonstrated the direct influence of TR on behavioral intentions [34,47]. For instance, Lin and Hsieh [47] explored the relationship between TR and behavior in adopting self-service technologies (SSTs), and their results statistically supported the link. Chen et al. [48] investigated how TR influences the continuance use intentions of electronic appointment system and reported that both optimism and innovativeness aid to increase the intentions to use. Based on this theoretical background and empirical evidence, TR is postulated to be a critical antecedent of perceived ease of use, which in turn affects perceived usefulness, attitude, and behavioral intentions, and also to be an immediate antecedent of behavioral intentions. Given the above, it is appropriate to formulate the following two hypotheses:
Hypothesis 1a (H1a).
Technology readiness significantly affects perceived ease of use.
Hypothesis 1b (H1b).
Technology readiness significantly affects behavioral intentions.
Both TAM and TPB derive from the theory of reasoned action (TRA) [49]. TRA postulated intentions, which result in real actions, depend on volitional control that consists of attitude and subjective norm [49,50]. TAM and TPB are respectively enhanced model while recognizing the inherent limitation of TRA and have been frequently applied to test the individuals’ behavioral intentions in many diverse sectors. Bagozzi [37] explained the main strength of TAM is the parsimony. However, it was argued that it is unreasonable that one simple model could explain individuals’ behavior completely across a wide scope of technology adoption. That is, essential drivers of consumer action may be overlooked, and therefore efforts were made to broaden or deepen the theory [13,24,38]. In a similar vein, while the salient explaining power of the planned behavior theory was supported in previous studies, scholars have made efforts to extend TPB in responding the shortcomings of the original theory [9,20,44]. In this respect, numerous scholars endeavored to combine TAM and TPB and indicated a better explanation of power in the area of consumer behavior towards new technology [24,51,52,53].
Casaló et al. [51] explored the formation of individual intentions to take part in online travel communities on the basis of an integrated model of TAM and TPB, and their findings supported that antecedent constructs rooted in these models are key predictors of individuals’ intentions. Aboelmaged and Gebba [24] tested the acceptance of mobile banking through a combined TAM and TPB. Their results of analysis indicated that subjective norm exerted an influence on system adoption and perceived usefulness affected attitude which, in turn, increased the adoption. Yu et al. [53] proposed a comprehensive model based on TAM and TPB to understand individuals’ willingness to adopt a sharing system. The results of their study discovered that attitude is formulated by perceived usefulness and perceived ease of use towards the system and the intentions to use is significantly affected by perceived usefulness along with attitude and perceived behavioral control. More recently, Hua and Wang [54] integrated TAM and TPB to identify the driving forces of consumer adoption of applications designed for energy-efficiency. From the analysis, using 280 responses, their study observed significant associations among proposed study constructs rooted from these two theories. Following this logic, hypotheses were formulated.
Hypothesis 2a (H2a).
Perceived ease of use significantly affects perceived usefulness.
Hypothesis 2b (H2b).
Perceived ease of use significantly affects attitude.
Hypothesis 3 (H3).
Perceived usefulness significantly affects attitude.
Hypothesis 4 (H4).
Attitude significantly affects behavioral intentions.
Hypothesis 5 (H5).
Subjective norm significantly affects behavioral intentions.
Hypothesis 6 (H6).
Perceived behavioral control significantly affects behavioral intentions.
In the research model (see Figure 1), the original variables and paths of TAM are indicated within the blue color box; and the original factors and links of TPB are outlined in the orange color box.
3. Methodology
3.1. Measurement Development
All measurement items of proposed study variables were adapted from the existing literatures, which were examined with high validity. For example, measurement items for TR which is composed of optimism and innovativeness were borrowed from Parasuraman [11] and Parasuraman and Colby [33]. Measurement items for the constructs stemming from TAM were adapted from Davis [15] and Venkatesh and Davis [18], while items for the variables rooted from TPB were cited by Ajzen [21] and De Groot and Steg [40]. These measurements were fine tuned to fit in a smart hotel context. These study variables were all measured using a 7-point Likert scale except for attitude which was measured by bipolar semantic-differential scales. Questionnaires were developed in English, and they were carefully reviewed by native English speakers and academic experts in the hospitality context to ensure they are plain, well-defined, and easy to understand. The instruments were converted to a web-based format for an actual survey at the end.
3.2. Survey Structure and Data Collection
The survey was composed of three main sections. The study objectives were stated in the first section that includes the description of a smart hotel. Furthermore, in order to help the understanding of any respondents who have not experienced a smart hotel in the past, respondents were required to watch a video which illustrates the operations of Flyzoo, one of the recent openings of a smart hotel. In the second section, the questionnaires were followed to measure TR and other key study constructs rooted from the TAM and TPB. The last part of survey involved questions regarding the demographic information of the responders. In addition, respondents were demanded to indicate their hotel experience in the past year such as a frequency of hotel stay.
The data collection was completed with the assistance of Qualtrics, which has about 20 million panels in the US. The survey was conducted in the latter half of 2019, and thus the responses were not affected by the COVID-19 pandemic. An online survey was conducted for survey efficiency and accessibility to demographically diverse participants. Questions were used to screen out those who have not stayed hotel in the past six months. Participants were then provided with the detailed explanation of a smart hotel concept prior to beginning the survey. The average time spent for participants to complete the survey was approximately 15 minutes. After detecting and excluding outliers, a total of 305 responses were finally used in the data analysis using SPSS 18 and AMOS 20. The sample size in this study is sufficient for performing confirmatory factor analysis and structural equation modeling according to Hair et al. [55]. A snapshot of the demographic characteristics of our sample is displayed in Table 1. The sample is overall representative across demographic profiles of age, gender, income, ethnic background, and education. Furthermore, the hotel stay experience was assessed and 57.7% (176) of the respondents indicated they have stayed in a hotel 2–5 times per year, 16.4% (50) lodged at a hotel 6–10 times per year, and 12.1% (37) experienced a hotel to stay more than 10 times per year.
4. Results
4.1. Measurement Model
The confirmatory factor analysis involving TR and variables stemming from TAM and TPB in the proposed research model proved an acceptable data fit to goodness-of-fit statistics: χ2 = 619.477, df = 276, p < 0.001, χ2/df = 2.244, RMSEA = 0.064, CFI = 0.966, IFI = 0.966, NFI = 0.941, TLI = 0.960. To be specific, the value of χ2/df fell within an acceptable range from 2.00 to 5.00 which was recommended by Marsh and Hocevar [56]. Moreover, the RMSEA value was lower than suggested value of 0.80 and other goodness-of-fit indices were all bigger than 0.900 [55]. As Table 2 exhibits the results, the standardized loadings of each item were the range between 0.847 and 0.969 and they were all significantly related to their associate latent variable (p < 0.01). The internal consistency of the loaded items for each latent factor were confirmed according to the values of composite reliability (CR) ranged from 0.762 to 0.931, exceeding the cutoff of 0.60 [57]. The values of average variance extract (AVE) were all exceeding the threshold of 0.50 [58], which established convergent validity. In general, AVE values for each variable were greater than the square of the correlation between each pair of constructs, and thus discriminant validity was supported (see Table 3).
4.2. Structural Model
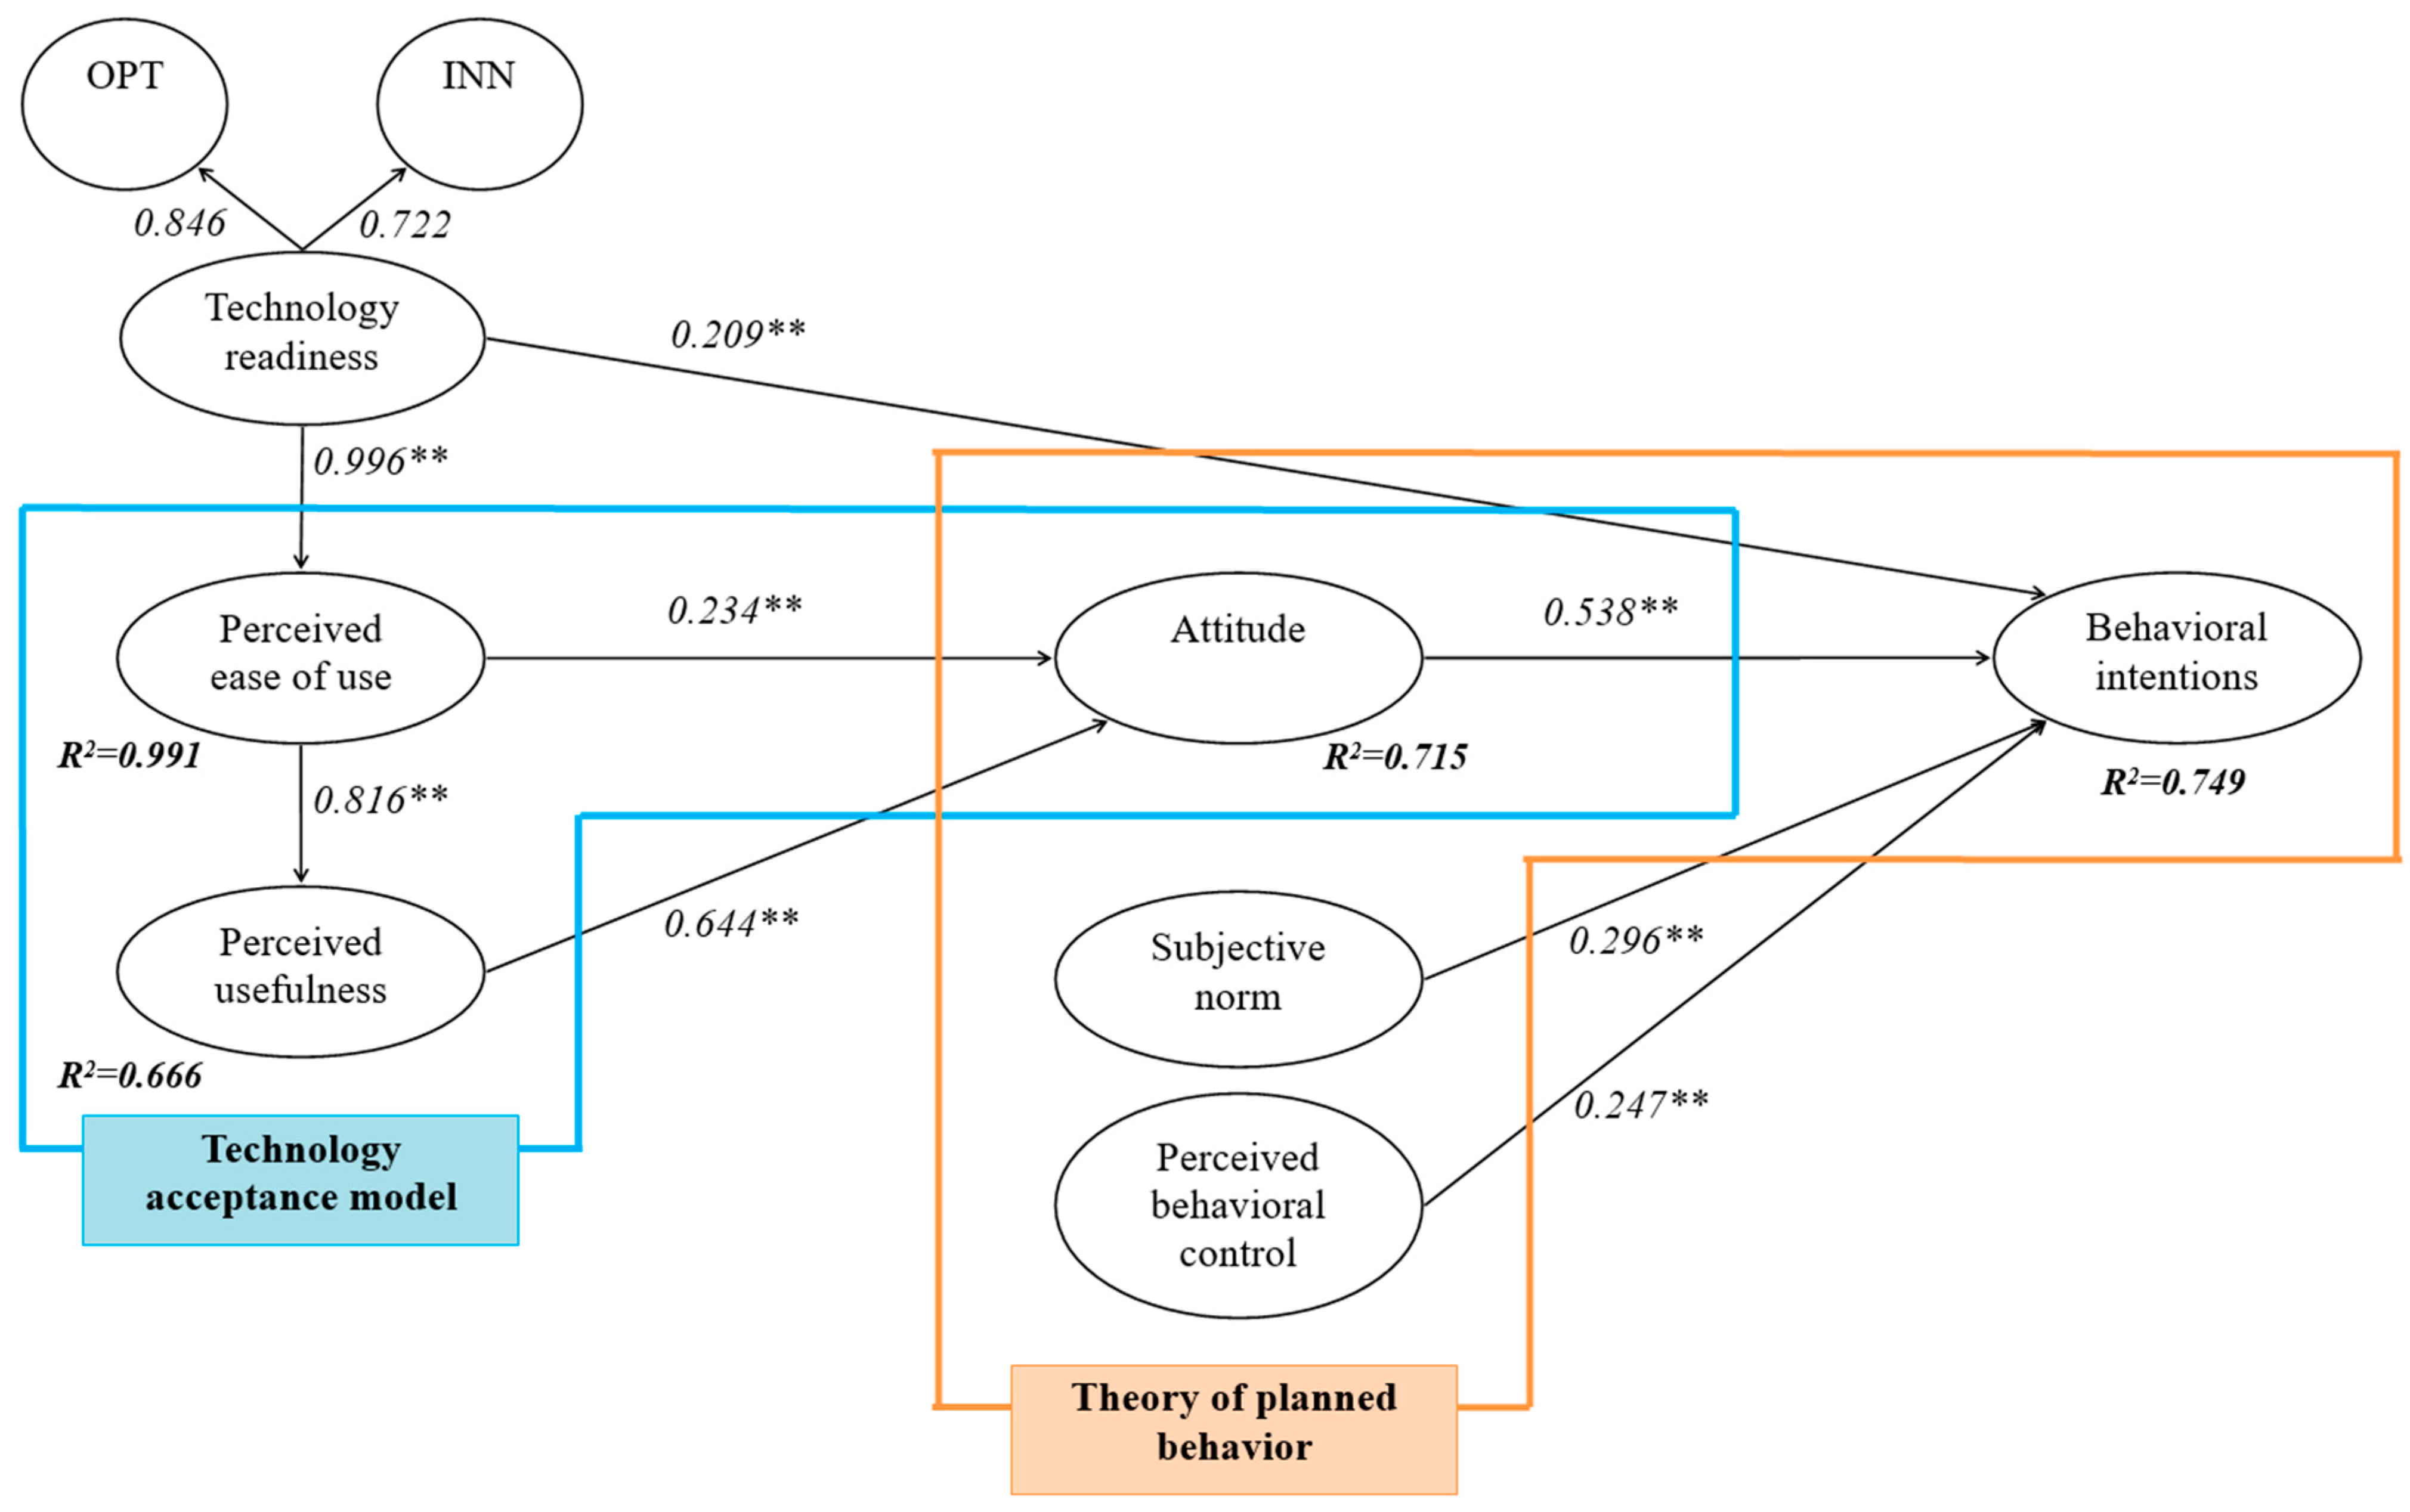
Structural equation modeling (SEM) was performed to validate the hypotheses among study variables. The goodness-of-fit statistics (χ2 = 905.550, df = 283, χ2/df = 2.622, p < 0.001, RMSEA = 0.085, CFI = 0.939, IFI = 0.939, NFI = 0.913, TLI = 0.929) indicate a satisfactory fit of the model. Hypotheses were evaluated based on the results of SEM, and Figure 2 and Table 4 present the details. The results indicated that TR exerted a positive and significant influence on both perceived ease of use and behavioral intentions. Therefore, Hypothesis 1a (β = 0.996, t = 12.228, p < 0.001) and Hypothesis 1b (β = 0.209, t = 3.731, p < 0.001) were supported. The impact of perceived ease of use was tested and the positive impact on perceived usefulness (β = 0.816, t = 16.077, p < 0.001) and attitude (β = 0.234, t = 3.502, p < 0.001) were statistically supported. Accordingly, the results supported Hypotheses 2a and 2b. Moreover, perceived usefulness was found to enhance attitude (β = 0.644, t = 9.539, p < 0.001) and attitude increased behavioral intentions (β = 0.538, t = 9.815, p < 0.001) which supported Hypotheses 3 and 4. That is, the associations among study variables rooted from TAM were all supported. In addition, Hypotheses 5 (β subjective norm --> behavioral intentions = 0.296, t = 6.270, p < 0.001) and 6 (β perceived behavioral control --> behavioral intentions = 0.247, t = 5.013, p < 0.001) were supported. Thus, the results supported the links proposed in TPB as well. All study variables explained 74.9% of total variance in behavioral intentions, and therefore the proposed theoretical model was regarded to be valid to explicate consumers’ behavioral intention towards a smart hotel.
5. Discussions and Implications
5.1. Discussions
The smart hotel is in the spotlight as a new model of hotels which provide superior services in many aspects of business operation [3,4]. Specifically, smart hotels have a greater opportunity to increase customer satisfaction through better responding to the needs of consumers of the future. This study was motivated to explore the consumer decision-making process towards a smart hotel. For this, an overarching theoretical model, which combines TR, TAM, and TPB, was proposed.
First, TR was proven to influence perceived ease of use, which is a cognitive construct of TAM. These results are coherent with the work of Lin et al. [10], Shin and Lee [13], and Kim and Chiu [46], and support that examining individuals’ readiness takes precedence for their cognitive evaluation in order to predict consumers’ technology acceptance. In addition, the data analysis results validated that TR exerted a direct influence on intentions. This is the same observation with the study conducted by Chen et al. [48] and Lin and Chang [34], suggesting that TR affects an individuals’ intentions of technology adoption behavior.
Second, the results of data analysis confirmed that both perceived ease of use and perceived usefulness influenced attitude which in turn generated favorable behavioral intentions. We infer these results are attributed to the numerous benefits that a smart hotel could bring to the customer experience. Such benefits involve more comfort, control, convenience, efficiency, and fun, which are driven by cutting-edge technologies employed at a smart hotel [4,6]. For example, data driven technologies enabled hotel operators to offer more customized services based on individuals’ preferences, which include room temperature, special requirements for kids, and amenities [59]. Kwan et al. [60] introduced guest empowerment technologies in the hotel to assist customers with convenient, easier, and quicker service transactions. Meanwhile, the analysis results showed that a positive subjective norm and a high perceived behavioral control increase individuals’ behavioral intentions towards a smart hotel. In particular, a highly possible explanation for the strong link between subjective norm and behavioral intentions is that the diffusion of innovative technology is not only about the technology itself, but is highly related to members of society and organizations [61].
Last, the analysis results supported the proposed links in both TAM and TPB. These two theories have been individually applied. However, the superior predicting power of TAM and TPB combined model has been addressed as it provides an adequate conceptual model to explain consumers’ behavioral intentions towards novel technology in the hospitality setting [53,54]. As such, this present study adopted the combined framework to extensively understand a person’s acceptance of technology specific and individual specific behavior, and the findings indicate the appropriateness of merged framework in the smart hotel context. Based on the course and results of study, insightful implications are respectively discussed in the following subsections.
5.2. Theoretical Implications
The application of cutting-edge technologies is a valid means to reinforce the competitiveness of hotels in the future [3,28]. Thus, it is more likely that smart hotels will gradually become the preferred place for modern people to visit [2,32]. Nevertheless, the extant studies pertaining to the smart hotel are largely focused on the cost–benefit analysis, construction, design, development, or possible solutions [27,30,31]. Furthermore, research related to the consumer adoption is limited to the acceptance on a particular innovative technology in the hotel industry [6,38,59]. Hence, little is known regarding how consumers perceive the total stay experience at a smart hotel and how their behavioral intentions are formulated. In this respect, the current research endeavored to offer more comprehensive understanding of consumer behavior in a smart hotel context through merging validated existing theories for the first time.
Specifically, the present study is the first attempt to incorporate TR into TAM and TPB to explicate the development of consumers’ behavioral intentions towards a smart hotel. This approach allows the extensive consideration which includes individuals’ tendency toward technology, individuals’ acceptance based on technology characteristics, and individuals’ general behavior formation. The previous studies that dealt with TR have generally focused on one specific technology, such as wearable technology, mobile payment system, and SSTs [13,46,47], and this research provides empirical evidence that the same significant role of individuals’ readiness applies to the combined various technologies at a smart hotel. In addition, even though a few studies have attempted combining TAM and TPB, this research enriched the existing literature by delivering evidence of validities of merged TAM and TPB in the context of a smart hotel. Therefore, our theoretical framework increased the understanding of consumers’ behavioral intentions towards a smart hotel, and this is the notable originality of the current study.
5.3. Managerial Implications
First, the findings about the significant role of TR on the formation of consumer behavior toward a smart hotel suggest that industry practitioners need to recognize the different personal traits and execute the strategic marketing activities depending on individuals’ TR respectively. Parasuraman and Colby [33] identified five TR segments which included explorer, pioneer, skeptic, paranoid, and laggard, and explained that the speed of adopting technology varies by each group. Consumers in the explorer category are generally embracing the novel technology first among segments, while people in the laggards will be the last group to accept [33]. However, regardless of different speeds, people adopt technologies eventually depending on their respective timing. Similarly, customers at hotel exhibit numerous differences depending on their level of TR [14]. Hence, understanding the unique needs and concerns of advanced technologies deployed at a smart hotel is of primary importance as hotel operators can achieve faster penetration through customized marketing. In this respect, professionals in a smart hotel are required to identify their target customers who belong to explorer and pioneer segments in their early stage into operation. Likewise, social communities related to innovative technologies can be targeted as the major audience, digital spaces may be utilized as the main marketing channels, and virtual reality can be used as an effective marketing tool to promote a smart hotel.
Second, the results which denoted the significant effect of perceived ease of uses and perceived usefulness on attitude support the assertion by Verma et al. [14] that hotel professionals who intend to differentiate their property using smart technology should carefully consider and understand the consumers’ response to high-tech innovations. Hoteliers at a smart hotel should proactively advertise their new technologies by highlighting how they are ease to use and useful for the stay at a hotel. Making the video clips and running the simulations for a virtual hotel experience would be an effective way to promote a smart hotel regarding its outstanding operational excellence. These promotional activities would aid in building a positive attitude towards a smart hotel, which appeared to be a salient predictor of behavioral intentions.
Third, the findings indicated that word-of-mouth of significant others is important, and hotel professionals should effectively encourage the endorsement of influencers in the field of technology or transmit innovative stories of guests at a smart hotel. For example, it is suggested to create fun or memorable moments of truth regarding how cutting-edge technologies could enhance a hotel stay. The personification of technologies can be an option. For example, it is recommended to give the robots friendly names and illustrate how they are interacting with guests, and chatbots can be visualized as a professional butler according to individual guests’ imagination. These sources would create the stories to share and build an atmosphere that induces the higher level of subjective norm. Moreover, as the current study results discovered, the positive effect of perceived behavioral control on behavioral intentions, generating individuals’ personal control over their behaviors is important. Even though hotel operators cannot force individual customers to improve their own control, they would be able to give aid to them by having smart hotels in various tiers and locations. That is, potential customers would be more likely to stay at a smart hotel based on their available resources and convenience.
6. Conclusions
Innovative technologies have been constantly introduced in the marketplace and have major implications for service providers and users [27,28,32]. Moreover, technology driven transformation will be even accelerated in the future [2,3]. As such, this study is centered on a smart hotel, which is advanced technology-powered and is considered a the new concept for the hotel of the future. With the aim to build the robust framework to explain more delicate consumer behavior in the domain of a smart hotel, the current study incorporated TR into TAM and TPB to predict consumers’ behavioral intentions. The results of data analyses statistically supported all suggested hypotheses in the conceptual model. Accordingly, this study offers insightful implications for theory and practice.
Despite a great deal of interest in technology adoption in the hotel context, the smart hotel remains in the initial stages as is yet to operate in every destination. As such, our sampling process was not able to capture every respondent with an experience at a smart hotel. Even though the video provided showcased the operations of a smart hotel to help participants understand the concept of such a hotel, the data would involve anticipation to some extent. Thus, it is recommended to conduct empirical studies in the future once a smart hotel is more commonly found across the region. Secondly, the current study did not capture the demographic profiles, which are often adopted along with the application of TR, TAM, and TPB, and its influence in the relationships among key constructs were demonstrated [14,17]. Therefore, future studies are suggested including individual profiles in the consideration as the extension of present research. Last, this study failed to include the economic aspects of innovation, which would be considered for further research in a smart hotel context.
Author Contributions
Conceptualization, J.J.K. and H.H.; methodology, J.J.K.; formal analysis, J.J.K.; writing—original draft preparation, J.J.K.; writing—review and editing, H.H.; supervision, H.H.; project administration, J.J.K. and H.H. All authors have read and agreed to the published version of the manuscript.
Funding
This work was supported by Youngsan University Research Fund of 2021.
Institutional Review Board Statement
Because of the observational nature of the study, and in the absence of any involvement of therapeutic medication, no formal approval of the Institutional Review Board of the local Ethics Committee was required. Nonetheless, all subjects were informed about the study and participation was fully on a voluntary basis. Participants were ensured of confidentiality and anonymity of the information associated with the surveys. The study was conducted according to the guidelines of the Declaration of Helsinki.
Informed Consent Statement
Not applicable.
Data Availability Statement
The dataset used in this research are available upon request from the corresponding author. The data are not publicly available due to restrictions i.e., privacy or ethical.
Conflicts of Interest
The authors declare no conflict of interest.
References
- Liu, C.; Hung, K. A comparative study of self-service technology with service employees: A qualitative analysis of hotels in China. Inf. Technol. Tour. 2020, 22, 33–52. [Google Scholar] [CrossRef]
- Kim, J.J.; Han, H. Hotel of the future: Exploring the attributes of a smart hotel adopting a mixed-methods approach. J. Travel Tour. Mark. 2020, 37, 804–822. [Google Scholar] [CrossRef]
- Law, R.; Sun, S.; Chan, C. Hotel technology: A perspective article. Tour. Rev. 2020, 75, 286–289. [Google Scholar] [CrossRef]
- Wu, H.C.; Cheng, C.C. Relationships between technology attachment, experiential relationship quality, experiential risk and experiential sharing intentions in a smart hotel. J. Hosp. Tour. Manag. 2018, 37, 42–58. [Google Scholar] [CrossRef]
- Stock, R.M.; Merkle, M. A service robot acceptance model: User acceptance of humanoid robots during service encounters. In Proceedings of the 2017 IEEE International Conference on Pervasive Computing and Communications Workshops (PerCom Workshops), Kona, HI, USA, 13–17 March 2017; pp. 339–344. [Google Scholar]
- Tussyadiah, I.P.; Park, S. Consumer evaluation of hotel service robots. In Information and Communication Technologies in Tourism; Springer: Cham, Switzerland, 2018; pp. 308–320. [Google Scholar]
- Amadeus & InterContinental Hospitality Group. Drivers of Change in Hospitality; Cornell University, SC Johnson College of Business, Center for Hospitality Research: Ithaca, NY, USA, 2019. [Google Scholar]
- Gelderman, C.J.; Paul, W.T.; Van Diemen, R. Choosing self-service technologies or interpersonal services—The impact of situational factors and technology-related attitudes. J. Retail. Consum. Serv. 2011, 18, 414–421. [Google Scholar] [CrossRef]
- Kim, J.J.; Hwang, J. Merging the norm activation model and the theory of planned behavior in the context of drone food delivery services: Does the level of product knowledge really matter? J. Hosp. Tour. Manag. 2020, 42, 1–11. [Google Scholar] [CrossRef]
- Lin, C.H.; Shih, H.Y.; Sher, P.J. Integrating technology readiness into technology acceptance: The TRAM model. Psychol. Mark. 2007, 24, 641–657. [Google Scholar] [CrossRef]
- Parasuraman, A. Technology readiness index (TRI) a multiple-item scale to measure readiness to embrace new technologies. J. Serv. Res. 2000, 2, 307–320. [Google Scholar] [CrossRef]
- Godoe, P.; Johansen, T. Understanding adoption of new technologies: Technology readiness and technology acceptance as an integrated concept. J. Eur. Psychol. Stud. 2012, 3, 38–52. [Google Scholar] [CrossRef]
- Shin, S.; Lee, W.J. The effects of technology readiness and technology acceptance on NFC mobile payment services in Korea. J. Appl. Bus. Res. 2014, 30, 1615–1626. [Google Scholar] [CrossRef]
- Verma, R.; Victorino, L.; Karniouchina, K.; Feickert, J. Segmenting hotel customers based on the technology readiness index. Cornell Hosp. Rep. 2007, 7, 4–16. [Google Scholar]
- Davis, F.D. Perceived usefulness, perceived ease of use, and user acceptance of information technology. MIS Q. 1989, 13, 319–340. [Google Scholar] [CrossRef] [Green Version]
- Huh, H.J.; Kim, T.T.; Law, R. A comparison of competing theoretical models for understanding acceptance behavior of information systems in upscale hotels. Int. J. Hosp. Manag. 2009, 28, 121–134. [Google Scholar] [CrossRef]
- Sun, S.; Lee, P.; Law, R. Impact of cultural values on technology acceptance and technology readiness. Int. J. Hosp. Manag. 2019, 77, 89–96. [Google Scholar] [CrossRef]
- Venkatesh, V.; Davis, F.D. A theoretical extension of the technology acceptance model: Four longitudinal field studies. Manag. Sci. 2000, 46, 186–204. [Google Scholar] [CrossRef] [Green Version]
- Chen, M.F.; Tung, P.J. Developing an extended theory of planned behavior model to predict consumers’ intention to visit green hotels. Int. J. Hosp. Manag. 2014, 36, 221–230. [Google Scholar] [CrossRef]
- Han, H.; Kim, Y. An investigation of green hotel customers’ decision formation: Developing an extended model of the theory of planned behavior. Int. J. Hosp. Manag. 2010, 29, 659–668. [Google Scholar] [CrossRef]
- Ajzen, I. The theory of planned behavior. Organ. Behav. Hum. Decis. Processes 1991, 50, 179–211. [Google Scholar] [CrossRef]
- Hwang, J.; Kim, I.; Gulzar, M.A. Understanding the eco-friendly role of drone food delivery services: Deepening the theory of planned behavior. Sustainability 2020, 12, 1440. [Google Scholar] [CrossRef] [Green Version]
- Wang, S.; Fan, J.; Zhao, D.; Yang, S.; Fu, Y. Predicting consumers’ intention to adopt hybrid electric vehicles: Using an extended version of the theory of planned behavior model. Transportation 2016, 43, 123–143. [Google Scholar] [CrossRef]
- Aboelmaged, M.; Gebba, T.R. Mobile banking adoption: An examination of technology acceptance model and theory of planned behavior. Int. J. Bus. Res. Dev. 2013, 2, 35–50. [Google Scholar] [CrossRef]
- Lee, T.H.; Jan, F.H. Ecotourism behavior of nature-based tourists: An integrative framework. J. Trav. Res. 2018, 57, 792–810. [Google Scholar] [CrossRef]
- Cobos, L.M.; Mejia, C.; Ozturk, A.B.; Wang, Y. A technology adoption and implementation process in an independent hotel chain. Int. J. Hosp. Manag. 2016, 57, 93–105. [Google Scholar] [CrossRef]
- Ivanov, S.; Webster, C. Conceptual framework of the use of robots, artificial intelligence and service automation in travel, tourism, and hospitality companies. In Robots, Artificial Intelligence, and Service Automation in Travel, Tourism and Hospitality; Emerald Publishing Limited: Bingley, UK, 2019; pp. 7–37. [Google Scholar]
- Yang, H.; Song, H.; Cheung, C.; Guan, J. How to enhance hotel guests’ acceptance and experience of smart hotel technology: An examination of visiting intentions. Int. J. Hosp. Manag. 2021, 97, 103000. [Google Scholar] [CrossRef]
- Bilgihan, A.; Smith, S.; Ricci, P.; Bujisic, M. Hotel guest preferences of in-room technology amenities. J. Hosp. Tour. Technol. 2016, 7, 118–134. [Google Scholar] [CrossRef]
- Ivanov, S.; Webster, C.; Berezina, K. Adoption of robots and service automation by tourism and hospitality companies. Rev. Tur. Desenvolv. 2017, 27, 1501–1517. [Google Scholar]
- Xu, X. Research on the construction and development of smart hotel from the perspective of serving customers. In Proceedings of the 2018 2nd International Conference on Education Science and Economic Management (ICESEM 2018), Xiamen, China, 25–26 August 2018. [Google Scholar]
- Chen, S.H.; Tzeng, S.Y.; Tham, A.; Chu, P.X. Hospitality services in the post COVID-19 era: Are we ready for high-tech and no touch service delivery in smart hotels? J. Hosp. Mark. Manag. 2021, 30, 905–928. [Google Scholar] [CrossRef]
- Parasuraman, A.; Colby, C.L. An updated and streamlined technology readiness index: TRI 2.0. J. Serv. Res. 2015, 18, 59–74. [Google Scholar] [CrossRef]
- Lin, J.S.C.; Chang, H.C. The role of technology readiness in self-service technology acceptance. Manag. Serv. Qual. Int. J. 2011, 21, 424–444. [Google Scholar] [CrossRef]
- Van Compernolle, M.; Buyle, R.; Mannens, E.; Vanlishout, Z.; Vlassenroot, E.; Mechant, P. “Technology readiness and acceptance model” as a predictor for the use intention of data standards in smart cities. Media Comm. 2018, 6, 127–139. [Google Scholar]
- Liljander, V.; Gillberg, F.; Gummerus, J.; Van Riel, A. Technology readiness and the evaluation and adoption of self-service technologies. J. Ret. Consum. Serv. 2006, 13, 177–191. [Google Scholar] [CrossRef]
- Bagozzi, R.P. The legacy of the technology acceptance model and a proposal for a paradigm shift. J. Assoc. Inf. Syst. 2007, 8, 3. [Google Scholar] [CrossRef]
- Huang, Y.C.; Chang, L.L.; Yu, C.P.; Chen, J. Examining an extended technology acceptance model with experience construct on hotel consumers’ adoption of mobile applications. J. Hosp. Mark. Manag. 2019, 28, 957–980. [Google Scholar] [CrossRef]
- Jamšek, S.; Culiberg, B. Introducing a three-tier sustainability framework to examine bike-sharing system use: An extension of the technology acceptance model. Int. J. Consum. Stud. 2020, 44, 140–150. [Google Scholar] [CrossRef]
- De Groot, J.; Steg, L. General beliefs and the theory of planned behavior: The role of environmental concerns in the TPB. J. Appl. Soc. Psychol. 2007, 37, 1817–1836. [Google Scholar] [CrossRef] [Green Version]
- Arli, D.; Tan, L.P.; Tjiptono, F.; Yang, L. Exploring consumers’ purchase intention towards green products in an emerging market: The role of consumers’ perceived readiness. Int. J. Consum. Stud. 2018, 42, 389–401. [Google Scholar] [CrossRef]
- Tian, Y.; Yoo, J.H.; Zhou, H. To read or not to read: An extension of the theory of planned behaviour to food label use. Int. J. Consum. Stud. 2021, 46, 984–993. [Google Scholar] [CrossRef]
- Ullah, I.; Rukh, G.; Zhou, J.; Khan, F.U.; Ahmed, Z. Modeling customer satisfaction in online hotel booking. J. Ret. Consum. Serv. 2019, 48, 100–104. [Google Scholar] [CrossRef]
- Jun, J.; Arendt, S.W. Understanding healthy eating behaviors at casual dining restaurants using the extended theory of planned behavior. Int. J. Hosp. Manag. 2016, 53, 106–115. [Google Scholar] [CrossRef]
- Walczuch, R.; Lemmink, J.; Streukens, S. The effect of service employees’ technology readiness on technology acceptance. Inf. Manag. 2007, 44, 206–215. [Google Scholar] [CrossRef]
- Kim, T.; Chiu, W. Consumer acceptance of sports wearable technology: The role of technology readiness. Int. J. Sports Mark. Spons. 2019, 20, 109–126. [Google Scholar] [CrossRef]
- Lin, J.S.C.; Hsieh, P.L. The influence of technology readiness on satisfaction and behavioral intentions toward self-service technologies. Comput. Hum. Behav. 2007, 23, 1597–1615. [Google Scholar] [CrossRef]
- Chen, S.C.; Jong, D.; Lai, M.T. Assessing the relationship between technology readiness and continuance intention in an E-appointment system: Relationship quality as a mediator. J. Med. Syst. 2014, 38, 76. [Google Scholar] [CrossRef] [PubMed]
- Fishbein, M.; Ajzen, I. Belief, Attitude, Intention, and Behavior: An Introduction to Theory and Research; Addison-Wesley: Reading, MA, USA, 1975. [Google Scholar]
- Ajzen, H.; Fishbein, M. Understanding Attitudes and Predicting Social Behavior; Prentice-Hall: Englewood Cliffs, NJ, USA, 1980. [Google Scholar]
- Casaló, L.V.; Flavián, C.; Guinalíu, M. Determinants of the intention to participate in firm-hosted online travel communities and effects on consumer behavioral intentions. Tour. Manag. 2010, 31, 898–911. [Google Scholar] [CrossRef]
- Choe, J.Y.; Kim, J.J.; Hwang, J. Innovative marketing strategies for the successful construction of drone food delivery services: Merging TAM with TPB. J. Trav. Tour. Mark. 2021, 38, 16–30. [Google Scholar] [CrossRef]
- Yu, Y.; Yi, W.; Feng, Y.; Liu, J. Understanding the intention to use commercial bike-sharing systems: An integration of TAM and TPB. In Proceedings of the 51st Hawaii International Conference on System Sciences, Hilton Waikoloa Village, HI, USA, 3–6 January 2018; pp. 646–655. [Google Scholar]
- Hua, L.; Wang, S. Antecedents of consumers’ intention to purchase energy-efficient appliances: An empirical study based on the technology acceptance model and theory of planned behavior. Sustainability 2019, 11, 2994. [Google Scholar] [CrossRef] [Green Version]
- Hair, J.F., Jr.; Black, W.C.; Babin, B.J.; Anderson, R.E.; Tatham, R.L. Multivariate Data Analysis, 6th ed.; Prentice-Hall: Upper Saddle River, NJ, USA, 2006. [Google Scholar]
- Marsh, H.W.; Hocevar, D. A new, more powerful approach to multitrait-multimethod analyses: Application of second-order confirmatory factor analysis. J. Appl. Psychol. 1988, 73, 107. [Google Scholar] [CrossRef]
- Bagozzi, R.P.; Yi, Y. On the evaluation of structural equation models. J. Acad. Mark. Sci. 1988, 16, 74–94. [Google Scholar] [CrossRef]
- Fornell, C.; Larcker, D.F. Evaluating structural equation models with unobservable variables and measurement error. J. Mark. Res. 1981, 18, 39–50. [Google Scholar] [CrossRef]
- Neuhofer, B.; Buhalis, D.; Ladkin, A. Smart technologies for personalized experiences: A case study in the hospitality domain. Electron. Mark. 2015, 25, 243–254. [Google Scholar] [CrossRef]
- Kwan, L.H.; Chia, S.J.; Khor, R.; Wong, T.H.; Xulin, Y.; Zhao, C.X. Factors affecting hotel visitors’ usage of guest empowerment technology (GET). In Handbook of Research on Leveraging Consumer Psychology for Effective Customer Engagement; IGI Global: Hershey, PA, USA, 2017; pp. 138–153. [Google Scholar]
- Rogers, E.M. Diffusion of Innovations: Modifications of a model for telecommunications. In Die Diffusion von Innovationen in der Telekommunikation; Springer: Berlin/Heidelberg, Germany, 1995; pp. 25–38. [Google Scholar]
Figure 1.
Proposed research framework. Note. OPT = optimism, INN = innovativeness.

Figure 2.
Standardized theoretical path coefficients. Note. OPT = optimism, INN = innovativeness, ** p < 0.001.
Figure 2.
Standardized theoretical path coefficients. Note. OPT = optimism, INN = innovativeness, ** p < 0.001.


Table 1.
Profile of the samples (n = 305).
| Variable | n | Percentage |
|---|---|---|
| Gender | ||
| Male | 152 | 49.8 |
| Female | 153 | 50.2 |
| Age | ||
| 20 s | 26 | 8.5 |
| 30 s | 34 | 11.1 |
| 40 s | 18 | 5.9 |
| 50 s | 47 | 15.4 |
| 60 s | 96 | 31.5 |
| 70 s | 84 | 27.5 |
| Mean age = 57.99 years old | ||
| Annual household income | ||
| Under $24,999 | 21 | 6.9 |
| $25,000–$39,999 | 32 | 10.5 |
| $40,000–$54,999 | 46 | 15.1 |
| $55,000–$69,999 | 40 | 13.1 |
| $70,000–$84,999 | 27 | 8.9 |
| $85,000–$99,999 | 40 | 13.1 |
| Over $100,000 | 97 | 31.8 |
| Ethnic background | ||
| Black/African American | 25 | 8.2 |
| Asian/Pacific Islander | 14 | 4.6 |
| Hispanic/Spanish American | 4 | 1.3 |
| Caucasian/White | 258 | 84.6 |
| Other | 4 | 1.3 |
| Education Level | ||
| Less than high school degree | 4 | 1.3 |
| High school degree | 66 | 21.6 |
| Two-year college degree | 64 | 21.0 |
| Graduate degree | 81 | 26.6 |
| Four-year bachelor degree | 90 | 29.5 |
Table 2.
Details of confirmatory factor analysis.
| Construct and Scale Items | Loadings | Mean | Standard Deviation |
|---|---|---|---|
| Technology readiness | |||
| Optimism (AVE: 0.666; CR: 0.857) | |||
| High-technology products and services at a smart hotel would give me more control over my hotel experience. | 0.897 | 4.3934 | 1.5757 |
| Advanced technologies and robots at a smart hotel would enable me more efficient to experience products and services what I looked for. | 0.927 | 4.3508 | 1.5847 |
| Products and services that use the advanced technologies at a smart hotel would be much more convenient to use. | 0.916 | 4.4262 | 1.6065 |
| Innovativeness (AVE: 0.552; CR: 0.787) | |||
| Others would come to me for advice on high-technology products and services available at a smart hotel. | 0.881 | 3.7213 | 1.8472 |
| I would have fewer problems than others in making technology work at a smart hotel. | 0.924 | 4.0787 | 1.7642 |
| I keep up with the latest technological development that I am interested in. | 0.889 | 4.0656 | 1.8976 |
| Perceived ease of use (AVE: 0.605; CR: 0.860) | |||
| It looks easy to use high-technology products and services employed at a smart hotel. | 0.896 | 4.4525 | 1.5083 |
| I would go through a simple process to operate the high-technology products and services employed at a smart hotel. | 0.905 | 4.4197 | 1.5177 |
| Interactions with advanced technologies (e.g., AI speaker) and robots available at a smart hotel seem to be clear and understandable. | 0.872 | 4.2852 | 1.5813 |
| It does not seem to be difficult to interact with advanced technologies and robots available at a smart hotel. | 0.867 | 4.4623 | 1.5494 |
| Perceived usefulness (AVE: 0.620; CR: 0.867) | |||
| High technologies employed at a smart hotel would enable me to enjoy more efficient services. | 0.915 | 4.1279 | 1.6303 |
| High technologies employed at a smart hotel could make it easier for me to request and receive products/services. | 0.898 | 4.3049 | 1.5756 |
| High technologies employed at a smart hotel seem to be convenient when staying at hotel. | 0.911 | 4.400 | 1.6133 |
| High technologies employed at a smart hotel would improve my overall hotel experience. | 0.886 | 4.000 | 1.7340 |
| Attitude (AVE: 0.772; CR: 0.931) | |||
| For me, staying at a smart hotel is … | |||
| Bad—Good | 0.955 | 5.4092 | 1.5307 |
| Unfavorable—Favorable | 0.957 | 4.8852 | 1.6151 |
| Negative—Positive | 0.933 | 4.9738 | 1.5726 |
| Unpleasant—Pleasant | 0.931 | 5.0656 | 1.5333 |
| Subjective norm (AVE: 0.771; CR: 0.910) | |||
| Most people who are important to me think that in the future I should stay at a smart hotel. | 0.913 | 3.3475 | 1.5803 |
| In the future, most people who are important to me would want me to stay at a smart hotel. | 0.958 | 3.4689 | 1.6383 |
| People whose opinions I value would prefer me in the future to stay at a smart hotel. | 0.969 | 3.4754 | 1.6663 |
| Perceived behavioral control (AVE: 0.616; CR: 0.762) | |||
| I am confident that in the future I would be able to stay at a smart hotel. | 0.928 | 4.5377 | 1.5259 |
| In the future, I would have the resources, time, and opportunity to stay at a smart hotel. | 0.847 | 4.5377 | 1.5281 |
| Behavioral intentions (AVE: 0.656; CR: 0.851) | |||
| I intend to visit a smart hotel in the future. | 0.939 | 3.6754 | 1.8271 |
| I plan to stay at a smart hotel in the future. | 0.959 | 3.6918 | 1.8452 |
| I am likely to recommend a smart hotel to others. | 0.871 | 3.7869 | 1.6772 |
| Goodness-of-fit statistics: χ2 = 619.477, df = 276, p < 0.001, χ2/df = 2.244, RMSEA = 0.064, CFI = 0.966, IFI = 0.966, NFI = 0.941, TLI = 0.960 | |||
Note 1. AVE = average variance extracted, CR = composite reliability; Note 2. RMSEA = Root Mean Square Error of Approximation, CFI = Comparative Fit Index, IFI = Incremental Fit Index, NFI = Normed Fit Index, TLI = Tucker-Lewis Index.
Table 3.
Descriptive statistics of the constructs and correlations.
| Mean (SD) | AVE | (1) | (2) | (3) | (4) | (5) | (6) | (7) | (8) | |
|---|---|---|---|---|---|---|---|---|---|---|
| (1) Optimism | 4.3902 (1.4977) | 0.666 | 0.857 a | 0.639 b | 0.769 | 0.863 | 0.759 | 0.596 | 0.633 | 0.747 |
| (2) Innovativeness | 3.9552 (1.7131) | 0.552 | 0.408 c | 0.787 | 0.631 | 0.689 | 0.655 | 0.616 | 0.557 | 0.694 |
| (3) Perceived ease of use | 4.4049 (1.4085) | 0.605 | 0.591 | 0.398 | 0.860 | 0.749 | 0.696 | 0.601 | 0.623 | 0.713 |
| (4) Perceived usefulness | 4.2082 (1.5190) | 0.620 | 0.745 | 0.475 | 0.561 | 0.867 | 0.807 | 0.663 | 0.701 | 0.803 |
| (5) Attitude | 4.9934 (1.4979) | 0.772 | 0.576 | 0.429 | 0.484 | 0.651 | 0.931 | 0.652 | 0.682 | 0.835 |
| (6) Subjective norm | 3.4306 (1.5713) | 0.771 | 0.355 | 0.379 | 0.361 | 0.440 | 0.425 | 0.910 | 0.614 | 0.753 |
| (7) Perceived behavioral control | 4.5377 (1.4428) | 0.616 | 0.401 | 0.310 | 0.388 | 0.491 | 0.465 | 0.377 | 0.762 | 0.737 |
| (8) Behavioral intentions | 3.7180 (1.6889) | 0.657 | 0.558 | 0.482 | 0.508 | 0.645 | 0.697 | 0.567 | 0.543 | 0.851 |
Note 1. a Composite reliabilities are along the diagonal, b Correlations are above the diagonal, c Squared correlations are below the diagonal; Note 2. SD = Standard Deviation, AVE = Average Variance Extracted.
Table 4.
Result of the structural model evaluation.
| Path | Coefficients | t-Values | Status | |
|---|---|---|---|---|
| H1a | Technology readiness → Perceived ease of use | 0.996 | 12.228 ** | Supported |
| H1b | Technology readiness → Behavioral intentions | 0.209 | 3.731 ** | Supported |
| H2a | Perceived ease of use → Perceived usefulness | 0.816 | 16.077 ** | Supported |
| H2b | Perceived ease of use → Attitude | 0.234 | 3.502 ** | Supported |
| H3 | Perceived usefulness → Attitude | 0.644 | 9.539 ** | Supported |
| H4 | Attitude → Behavioral intentions | 0.538 | 9.815 ** | Supported |
| H5 | Subjective norm → Behavioral intentions | 0.296 | 6.270 ** | Supported |
| H6 | Perceived behavioral control → Behavioral intentions | 0.247 | 5.013 ** | Supported |
Total variance explained. R2 for perceived ease of use = 0.991; R2 for perceived usefulness = 0.666; R2 for attitude = 0.715; R2 for behavioral intentions = 0.749; Goodness-of-fit statistics: χ2 = 905.550, df = 283, p < 0.001, χ2/df = 3.200, RMSEA = 0.085, CFI = 0.939, IFI = 0.939, NFI = 0.913, TLI = 0.929; Note. ** p < 0.001.
Publisher’s Note: MDPI stays neutral with regard to jurisdictional claims in published maps and institutional affiliations. |
© 2022 by the authors. Licensee MDPI, Basel, Switzerland. This article is an open access article distributed under the terms and conditions of the Creative Commons Attribution (CC BY) license (https://creativecommons.org/licenses/by/4.0/).
Share and Cite
MDPI and ACS Style
Kim, J.J.; Han, H. Hotel Service Innovation with Smart Technologies: Exploring Consumers’ Readiness and Behaviors. Sustainability 2022, 14, 5746. https://doi.org/10.3390/su14105746
AMA Style
Kim JJ, Han H. Hotel Service Innovation with Smart Technologies: Exploring Consumers’ Readiness and Behaviors. Sustainability. 2022; 14(10):5746. https://doi.org/10.3390/su14105746
Chicago/Turabian StyleKim, Jinkyung Jenny, and Heesup Han. 2022. "Hotel Service Innovation with Smart Technologies: Exploring Consumers’ Readiness and Behaviors" Sustainability 14, no. 10: 5746. https://doi.org/10.3390/su14105746
Note that from the first issue of 2016, this journal uses article numbers instead of page numbers. See further details here.