Article

Delighting Hotel Guests with Sustainability: Revamping Importance-Performance Analysis in the Light of the Three-Factor Theory of Customer Satisfaction

by
Michele Preziosi
1,
Alessia Acampora
2,
Maria Claudia Lucchetti
2 and
Roberto Merli
2,*
1
Energy Efficiency Department, ENEA (Italian National Agency for New Technologies, Energy and Sustainable Economic Development), Lungotevere Thaon di Revel 76, 00196 Roma, Italy
2
Department of Business Studies, Roma Tre University, Via Silvio D’Amico 77, 00145 Roma, Italy
*
Author to whom correspondence should be addressed.
Sustainability 2022, 14(6), 3575; https://doi.org/10.3390/su14063575
Submission received: 14 February 2022 / Revised: 9 March 2022 / Accepted: 11 March 2022 / Published: 18 March 2022

Abstract

:
Tourism has a key role in the global economy, and it is a significant contributor to environmental degradation and climate change. Concurrently, it is one of the most exposed businesses to the deterioration of environmental quality. Inside the tourism sector, the hospitality industry accounts for nearly 30% of emissions and in recent years has begun to introduce voluntary tools to manage the environmental impacts of its operations. Among these instruments, ecolabels ensure compliance with specific environmental performance criteria and reliable communication. In Italy, Legambiente Turismo is the most widespread tourism ecolabel that awards over 300 hotels. Previous investigations have shown that firms implementing environmental sustainability practices may gain economic advantages in terms of savings thanks to increased efficiency and reduced waste. At the same time, when evaluating firms’ performance, it is relevant to explore how customers perceive the actions implemented by the accommodation industry to minimize the environmental impact of its activities. Through a survey addressed to the customers of an eco-labeled hotel, this paper investigates if green practices form a specific dimension of service quality and if these green practices are considered by hotel guests as excitement factors among hotel service quality attributes. Results show that customers identify environmental practices as a specific dimension of eco-labeled hotels. Moreover, applying the three-factors theory of customer satisfaction, findings identify hotel green practices as delighting guests if properly delivered and communicated. Findings have significant implications both from a theoretical and managerial viewpoint, as they show that customers positively recognize the hotel’s commitment toward the natural environment, representing a significant differentiation strategy on the market.

1. Introduction

In recent years, tourism has constantly risen, turning into one of the industries that are growing faster, occupying a prominent role in the European economy. Globally, Europe has always been a very popular tourist destination and, according to the World Tourism Organization (WTO), five of its Member States (France, Spain, Italy, Germany, and the United Kingdom) fall into the top ten destinations preferred by travelers in the world ranking for the year 2017 [1]. However, the growth of the tourism sector goes hand in hand with its increasing environmental impact. Tourism activity and the environment have always had a complex and dual relationship: on one side, tourism needs a beautiful environment to attract tourist flows, while on the other, the environment affects tourism as it generates negative impacts on the tourism ecosystem, with the risk of damaging it permanently [2,3]. It is, therefore, important to find an equilibrium between the tourism sector and its ecological dimension to simultaneously increase both the profitability of tourism and the quality of the ecosystem [4]. Tourism, as a dynamic industry subordinated to changes in consumer preferences, has been influenced by the development of the concept of sustainability [5]. In fact, part of the tourism demand has become more and more interested in a type of consumption that is sensitive to environmental protection and respect for local populations’ cultures [6]. Consumers are constantly looking for green lodging options, but there is a problem in identifying which hotels are really committed to the environment [7]. After this change in consumption, all the actors of the tourism system (tourism industry, local populations, non-profit organizations, and local bodies) have worked both for the identification of strategies to satisfy these new needs and to communicate to the public this new sustainable approach to tourism, to make customers able to perceive the benefit of their choices. The assimilation of the concept of sustainable tourism is a long and difficult process; in fact, it requires a gradual collective journey, able to involve all the stakeholders operating in the tourism sector. To encourage this involvement, ecolabels represent a useful tool for hotels, as they can help the management in meeting specific environmental performance criteria and improve market performance due to the positive impact on their environmentally conscious image. The Legambiente Turismo Ecolabel supports tourism facilities in implementing green practices and in spreading sustainability values to customers and citizens. In this context, the comprehension of how consumers perceive and evaluate environmental practices in hotels contributes to implementing win-win strategies for sustainable tourism management [8]. In response to consumers’ increasing environmental concerns, particularly when making a purchasing decision [9], tourism facilities have started “to go green”, adopting more environmentally friendly practices. Even if little research can be found on this subject, understanding the importance of hotel environmental practices is fundamental in the hotel decision-making process. Through a survey, this study tries to reduce this gap, investigating if green practices form part of a specific “green” dimension of service quality and if they contribute to enhancing satisfaction and delighting customers.
The literature review presented in Section 2 reveals how only a few studies have investigated the relationship between green practices and customer behavior in the context of the hospitality industry. Therefore, this paper tries to reduce this gap, evaluating how consumers perceive green attributes implemented by hotels awarded with an ecolabel. The main goal is to examine the guest perception of these practices with respect to other hotel service quality attributes. The first objective is to identify the existence of a specific environmental dimension among hotel service quality dimensions. Starting from the three-factor theory of customer satisfaction, the second goal of the study is to determine if green attributes are evaluated by guests as basic, performance, or excitement attributes of their staying in the hotel. Because these attributes are not widely considered as a fundamental part of the provision of hotel service, our hypothesis is that customers could consider them as excitement factors. If this hypothesis is confirmed, when these attributes are properly delivered, they surprise the guest and can generate delight [10]. This would have significant managerial consequences for hotel managers, as they allow companies to differentiate from their competitors as regards these attributes [11,12,13].
Summarizing, this paper aims at testing the following hypothesis:
H1. 
Hotel green attributes define a specific dimension of service quality in eco-labeled hotels.
H2. 
Hotel green attributes are perceived by guests as “excitement” attributes.
The paper, in Section 2, reviews the theoretical background behind the relationship between service quality and customer satisfaction; next, it presents the theoretical foundations of the Importance-Performance Analysis and the Three-factor theory of customer satisfaction, which has been employed to analyze the results. Then, it reviews relevant studies carried out with these approaches in the field of the hospitality industry. Section 3 presents the research hypotheses and methods, whilst Section 4 presents the obtained results. Finally, Section 5 discusses the theoretical and managerial implications of the study.

2. Theoretical Background

2.1. Customer Satisfaction in the Service Industry

In the service industry, customer satisfaction is often recognized as being related to guest attitudes and the perceived performance of service attributes [14,15]. This relation is also recognized in the context of tourism facilities [16,17,18], opening a wide debate on the direct role of service attributes performance on customer satisfaction [16,17]. Additionally, service dimensions have a different impact on customer satisfaction, as they are critical in influencing customer perception of key attributes [14].
While the relationship between hotel industry service quality and customer behavior was widely explored, not many scholars investigated the relationship between guest satisfaction and hotel environmental sustainability practices [19]. Therefore, it is crucial to understand if these attribute performances are meaningful antecedents of customer satisfaction. This positive relationship was established by scholars, hypothesizing that, without service failure, they can improve customer satisfaction [20,21,22].
A service is characterized by the multi-dimensional nature of its quality attributes. Considering the heterogeneity of services and industries, different dimensions of service quality have been proposed [23]. One of the most employed is provided by Parasuraman et al. (1988), who identified five dimensions of service quality by proposing the SERVQUAL model, which can be applied to all service industries [24,25]. Other models developed scales and dimensions for the lodging industry [26,27,28] that are also specifically dedicated to eco-tourism [29].

2.2. Importance-Performance Analysis

Starting from the assumption that customer satisfaction depends on expectations towards some importance attributes and the perception of these attributes’ performance, the Importance-Performance Analysis (IPA) is a significant technique for examining this relationship and allowing the definition of priorities in the direction of the improvement of the service quality [30]. In IPA, attribute importance and performance are measured and combined through a two-dimensional grid. A plot allows the simultaneous comparison of importance and performance attributes. The mean values are adopted as the crossing points to build the IPA grid [31]. Importance is plotted on the vertical axis and performance on the horizontal axis, and the plot is divided into four quadrants, which present different managerial implications [32]. For different combinations of importance and performance scores, the classical optimization [33] identifies for each quadrant a specific result and strategic outcome: Q1 “Keep up the good work”, Q2 “Potential overkill”, Q3 “Low priority”, Q4 “Concentrate here” [34].
The IPA technique is widely implemented to measure service quality as an effective alternative to the SERVQUAL [24] and SERVPERF [15] frameworks [35,36,37]. Oh (2001) states that there is confusion among researchers between SERVQUAL, which measures customers’ expectations, and IPA, which refers to the importance concept [38]. Often the concepts are considered interchangeable, while they should be treated separately. According to Ryan (1999) importance is the desired outcome, while expectation is the tolerated outcome in consumer perceptions of service quality [31]. Nevertheless, as SERVQUAL, IPA considers quality as a function of attributes’ importance and performance. The difference is that expectations are not considered in the IPA. Given the similarity of the techniques, service attributes often used in SERVQUAL and SERVPERF are integrated with IPA performance attributes [39]. Generally, the traditional IPA is integrated with Gap Analysis of importance and performance, which has its origins in SERVQUAL, proposed by Parasuraman et al. (1988) [40]. The integration of IPA with Gap Analysis supports the improvement of service quality [35,41,42].
Most investigations conducted through IPA measure the importance directly. Scholars reported that direct measures of importance lead to more reliable results [34,41,43]. Nevertheless, many studies reported validity problems associated with self-reported measures of importance [44], such as the lack of respondents’ involvement in questionnaires [43] that determines high scores and uniformity of scores [34,41,45]. Moreover, the original IPA is reported to own two relevant shortcomings: attribute importance and performance are assumed as independent variables, and the relationship between attribute performance and overall satisfaction is assumed to be symmetrical and linear. In fact, many studies reported that this symmetric relationship is not true in all conditions, identifying, in some cases, an asymmetric impact of the service attributes’ performance on customer satisfaction [46]. Bearing in mind these shortcomings, the need to revise the traditional IPA approach has emerged [10].

2.3. Revisiting Traditional IPA: The Three-Factors Theory of Customer Satisfaction

Several scholars have investigated the characteristics of attribute performance, indicating the existence of two groups regarding its relationship with overall satisfaction. This approach differentiates attributes considering how their performance influences consumers’ satisfaction or disaffection. The premise is that customer satisfaction is a multi-dimensional concept and that the link between attributes’ performance and overall satisfaction is not always symmetrical [17]. Attributes may be differentiated into two main categories. The first type reaches more importance with a high level of performance, the latter type increases in importance with a low level of performance. This framework was firstly developed by Herzberg in 1959 and then integrated by other scholars [16,47], defining a theoretical framework known as “two-factor importance-performance models” [48]. On this baseline, other scholars suggested a third type of attribute, relevant at low and high-performance levels and able to influence satisfaction and dissatisfaction [16,48,49]. Kano firstly distinguished five categories of attributes [50]. Later on, other scholars suggested that attributes fall into three categories: basic factors, performance factors, and excitement factors, identifying the three-factor theory (Figure 1) [51,52,53]. In 1997, Vavra proposed a method to identify the three types of attributes proposed in the three-factor theory: the Importance Grid (IG) [11]. According to this method, attributes’ importance would change considerably if it is directly asked for or if it is calculated indirectly [46]. Thus, Vavra differentiates “explicit” and “implicit” importance. The first is self-reported by the interviewed, the second is identified through statistical procedures without considering the first type. Usually, implicit attributes’ importance is obtained with regression analysis or a partial correlation between overall satisfaction and attributes’ performance. Plotting the two measures of importance, it is possible to differentiate the three types of attributes: Expected, Attractor, and One Dimensional (high and low). In the matrix (Figure 2), on the x-axes, explicit importance is plotted, while on the y-axes the implicit importance is plotted. The matrix is then split into four quadrants, identified through the average score of explicit and implicit importance [40,46,48]. According to this framework, attributes’ importance may vary considerably as they are calculated through explicit or implicit measurements because customers tend to ignore performance when rating importance [46]. Thanks to the indirect measurement of importance, we can evaluate how the performance level influences the overall satisfaction [46].
According to Vavra’s IG there are four attributes’ categories [11,46]:
  • Basic attributes: low implicit and high explicit importance.
  • Low Performance attributes: low implicit and low explicit importance.
  • High Performance attributes: high implicit and high explicit importance.
  • Excitement attributes: high implicit and low explicit importance.
The work of Vavra has been adopted by several scholars [40,42,52]. These scholars identified:
  • Basic factors (high explicit and low implicit importance);
  • Performance factors of high importance (high explicit and high implicit importance);
  • Performance factors of low importance (low explicit and low implicit importance);
  • Excitement factors (unexpected and strongly enhancing satisfaction).
The theory affirms that the overall satisfaction is influenced by each factors’ category in a different way.
Basic factors are basic requirements, causing discontent if presenting low scores, but they do not influence the overall satisfaction with high scores. Thus, if it is realized that they do not offer delight to customers, but if their performance is low, they can produce a significant impact on overall satisfaction. Excitement factors have a positive effect on customer satisfaction if achieved, but do not lead to discontent if not fulfilled [40,52]. By consequence, they present little impact on overall satisfaction when registering low scores. Contrarily, they produce delight with high performance [17]. Lastly, performance factors may influence satisfaction or dissatisfaction [48,54,55] because of their scores. These attributes’ performance present a symmetric link with the general satisfaction [17].
According to several scholars, these three factors must be addressed when conducting an IPA [53,56,57].

2.4. Literature Review: IPA Studies in Tourism Research

The IPA framework has been used in different research fields [34,40,56]. Additionally, the IPA has achieved significant importance in the field of hospitality and tourism [34,56]. Table 1 summarizes the main scholars’ contributions, applying the IPA to analyze how customers evaluate practices realized for improving the environmental sustainability of the service delivered. Different research also addressed the points of view of many different categories of stakeholder, such as hotel employees [58,59] and managers [60,61,62]. Scholars also analyzed the customer’s point of view, considering green practices together with different service attributes [36,63] or examining solely sustainability attributes [64]. In other cases, environmental sustainability was analyzed considering the viewpoint of the residents of tourist destinations [37,65].
These studies used a traditional approach to IPA, where a symmetric relationship between service performance and customer satisfaction is considered. Scholars also studied hospitality services in the light of the three-factor theory, to differentiate attributes into basic, performance, and excitement [17,46]. However, only in a few cases did scholars try to evaluate the potential of green practices as excitement attributes for customers in the light of the three-factor theory of customer satisfaction. Giannelloni (2010), using a Tetraclasse model (very similar to the three-factor theory), investigated the role of the hotel’s green attributes on overall satisfaction [119]. The study shows that all environment-related attributes, with one exception, fall in the “basic” category. This category contains attributes that, if negatively considered by customers, could have a negative impact on their general satisfaction, whilst, if positively considered, they do not produce a significant positive effect. Contrary to Giannelloni’s (2010) initial research hypothesis, these attributes cannot be considered as part of the “plus” category because they are evaluated as an integral part of the service, rather than as differentiating criteria. This finding implies that hotel managers have to maintain a high level of performance for “green” attributes. Additionally, in the context of the lodging industry, Slevitch, Mathe, Karpova, & Scott-Halsell (2013) investigated the role of “green” attributes in the formation of customer satisfaction. The study showed that the “green” attributes are facilitating attributes, considered as excitement attributes in the context of the three-factor theory. However, results also revealed that the “green” attributes’ effect on customer satisfaction is moderated by core attributes’ performance [120].

3. Methodology

3.1. Measures: Identification of Hotel Service Quality Attributes

Hotel attributes presented in the questionnaire have been selected with a two-step approach. Firstly, an extensive review of the literature dealing with customer satisfaction in hotel facilities has been performed. Specifically, the starting point has been investigations that used SERVQUAL. Even though SERVQUAL has been widely supported in the lodging industry, the scale is not universal, as the dimensions relate to the type of service under consideration [121]. Thus, the analysis has been integrated with modified SERVQUAL scales, specifically designed for the hotel industry as the HOLSERV [122], ECOSERV [29], LONGSERV [26], Rural Establishment [123], and Lodging Quality Index [27]. Other references for the analysis have been [28,119,124,125,126,127,128,129,130]. Concurrently, papers implementing IPA for the evaluation of hotel services have been reviewed. The environmental sustainability attributes have been selected mostly from two sources: the criteria included in the Legambiente Turismo Ecolabel and previously published literature concerning green hotel practices and customer satisfaction [21,25,28,29,36,58,61,63,64,119,131,132,133].
In the first part of the measures’ selection, a list of 81 potential attributes has been collected to compose the questionnaire. At this stage, the 81 items identified were reduced by merging those with similar content but different regarding the form in which the different authors had proposed them in their respective studies. In addition, at this stage, the items were also grouped to ensure a balance between the different families of attributes based on the analysis of the literature reviewed and on the content of the attributes defined by the ‘Tourism ecolabel’ certification. To skim, reduce and select the most appropriate attributes, in the next step of the analysis we conducted semi-structured interviews with six managers of hotels awarded with a Legambiente Turismo Ecolabel. Managers have been asked to evaluate the importance of each attribute on its potential to contribute to global customer satisfaction. “Generic” and “environmental” attributes have been evaluated separately so as not to compromise the integration of the questionnaire with green attributes. The initial 49 hotel attributes have been reduced to 16, while the 32 environmental good practices have been reduced to 10. Finally, the questionnaire has been pre-tested by randomly interviewing 30 guests of the hotel under investigation to verify that all items were clear and comprehensible. Based on the pre-test, some items of the questionnaire were refined to increase their clearness. Figure 3 summarizes the process of identification and refinement of hotel attributes selected for the questionnaire.

3.2. Data Analysis

To test if performance attributes can be grouped into different dimensions of service quality a Factor Analysis was conducted, [56,134,135]. Principal Component Analysis (PCA) with Direct Oblimin Method rotation [136] was employed for factors extraction. PCA has been widely applied in IPA investigations for determining the dimensions of service quality attributes [56]. This procedure allowed us to verify the presence of a specific environmental dimension among the ones composing hotel service quality.
To test H2, and evaluate if green hotel attributes are excitement attributes, we started calculating the implicit importance of hotel attributes. In the field of the three-factor theory, many techniques have been tested to derive the implicit importance, all sharing the guideline of obtaining it from performance attributes and overall satisfaction [134].
For this reason, we have two different forms of implicit importance. One is employed through competitive measures and the other through non-competitive measures [48]. In this paper, the implicit performance was derived with a non-competitive technique through Kendall’s tau-b correlation coefficients between performance and overall satisfaction. Kendall’s tau-b correlation was preferred over a simple Pearson correlation as it was more suitable for the ordinal data employed in the questionnaire. Once determined, the implicit importance was plotted with an explicit measure of importance into the Importance Grid [11,46].

3.3. Data Collection

The first step was to receive the hotel manager’s endorsement, and then 500 questionnaires were delivered to the hotel. After informing and training the hotel staff on the investigation, the questionnaire was submitted to guests when they were checking out. Guests were selected using the convenience sampling technique, which is widely employed in consumer-related studies. Given that the hotel is located at the seaside, the distribution was carried out in summer (during the three months of June, July, and August), as this is the period with the highest number of visitors. After the questionnaires were collected, 366 were completed and employed for the following analysis, representing a response rate of 73.2%.

4. Results

Section 4 illustrates the outcomes of the analysis. In the first part, respondents’ characteristics are provided (Section 4.1). Next, the results of the PCA are described (Section 4.2). Finally, Section 4.3 presents the classification of hotel attributes according to the three-factor structure of customer satisfaction.

4.1. Profile of Respondents

Table 2 presents the main characteristics of survey respondents. Almost 70% were male and with an age ranging from 18 to 39 years. Leisure travel is the most cited purpose of traveling, and almost half of the guests were traveling with family. Considering their level of awareness of the hotel ecolabel, 33.5% of the interviewed guests knew that the hotel had an ecolabel. Of them, 39.5% were already aware of the label before staying. Moreover, only 22.1% affirmed to have had a previous stay in an eco-labeled structure (Table 2).

4.2. Identification of Hotel Attributes Dimensions

In order to analyze how guests evaluated the performance of the facilities for the 33 selected attributes, we used PCA with Direct Oblimin Method rotation [136] as a factors extraction method. PCA has been widely applied in IPA investigations for determining service quality attributes’ dimensions [56]. As the eigenvalue exceeded 1, the results of PCA suggest a five factors solution. Moreover, it can be inferred by the scree plot that those five components represent a correct choice (Figure 4).
Considering factor loading significance, we followed the guidelines provided by [137], which suggest a cut-off value of loadings of 0.4. Moreover, Hair, Black, Babin, & Anderson (2014) suggests that with a sample size greater than 350 observations, there is statistical significance for loadings greater than 0.30 [138]. Therefore, all the observed variables satisfy the requirements for factor analysis. The cumulative variance extracted by the three factors is 62,384%, as in social sciences a threshold of 60% is to be considered satisfactory [138].
To test whether the PCA suits the data structure well, Bartlett Test of Sphericity and Kaiser-Meyer-Olkin (KMO) statistics have been performed. The Bartlett Test of Sphericity shows a p-value lower than 0.000, indicating a satisfactory measure of the sampling adequacy. In addition, the KMO statistics with a value of 0.913 indicate that the overall measure of sampling adequacy is meritorious [138,139]. Then, communalities show the amount of variance accounted for by the factor solution for each variable. Communalities in the analysis range from 0.464 to 0.804, with an average value above 0.62, suggesting that the variance of the original values is well explained by the common factors [35]. Finally, to verify internal consistency reliability, the value of Cronbach’s alpha for each dimension has been calculated [35,56,134,140,141]. All components have a Cronbach’s alpha well above 0.5, which is considered the minimum threshold to consider the analysis reliable [35,142]. Nevertheless, components three and four have values lower than 0.7 (0.683 and 0.631), which can be considered as a moderate reliability. On the other hand, the other three components have values over 0.7, which is considered as the threshold for extensive reliability [138,143]. The five components have been named: “Tangibles”, “Staff service quality”, “Food”, “Value for money”, and “Green” (Green Attributes).
Table 3 shows the results of PCA, specifically describing component name, factor loadings, eigenvalues, variance explained by each component, the communalities, and Cronbach’s Alphas.

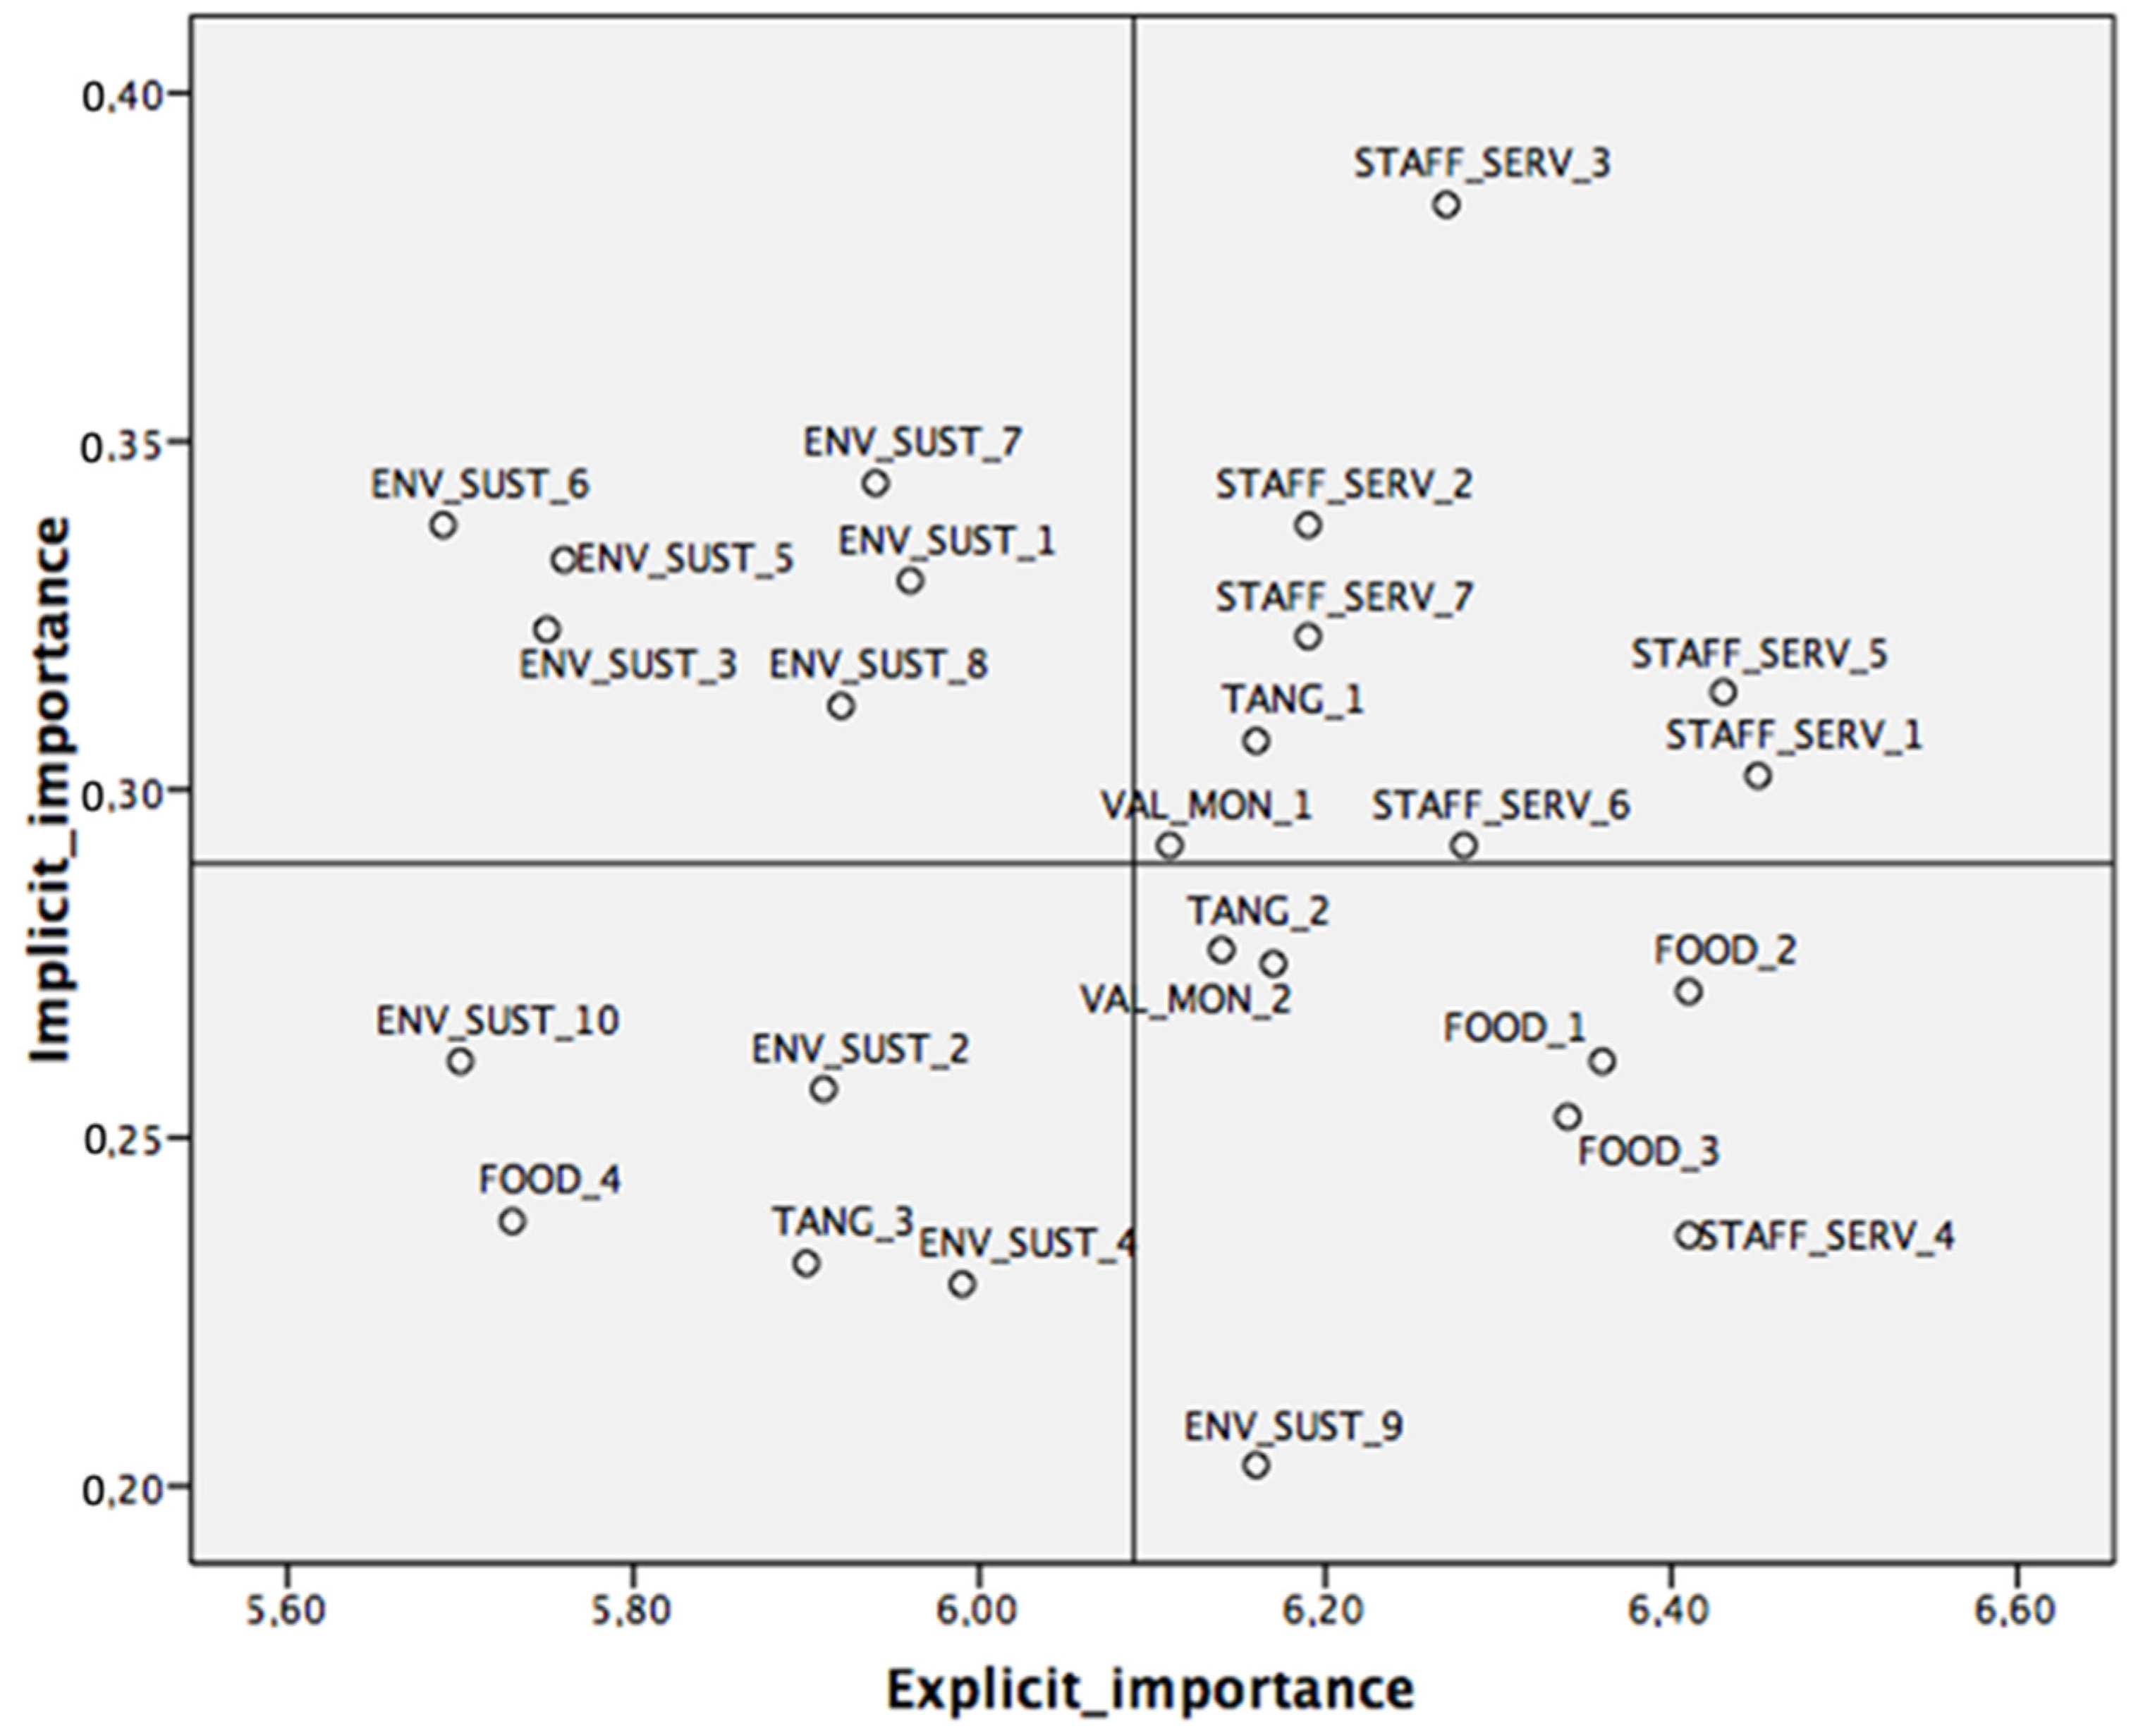
4.3. The Three-Factors Structure of Hotel Attributes

To calculate the implicit importance of each attribute on final customer satisfaction, we performed a Kendall’s tau-b correlation between attributes’ performance and a direct questionnaire item expressing the overall level of satisfaction of hotel guests. Moreover, we calculated for each dimension the value of importance and performance, obtained considering the average of the attributes’ score. In Table 4, we present all the obtained values.
As reported in Table 4, all correlations for the 26 hotel attributes are statistically significant, with a confidence interval greater than 99% (two-tailed p-value < 0.000).
Subsequently, both the importances (implicit and explicit) have been plotted in the Importance Grid with a “data-centered” approach, in which cross points are set using the average score retrieved for importance and performance on the questionnaire scale [31,33,43,56]. The Importance Grid reports on the X-axes the explicit importance that has been acquired directly from respondents’ ratings, while on the Y-axes are reported scores of implicit importance. Figure 3 shows the Importance Grid, split into four quadrants through crosshairs with the grand mean of explicit and implicit importance.
In Figure 5, “basic” attributes are in the southeast quadrant, “high-performance” attributes are in the northeast quadrant, “low-performance” attributes are in the southwest quadrant, and “excitement” attributes are in the northwest quadrant.
The four quadrants contain respectively:
  • “basic” attributes in the southeast quadrant
  • “high-performance” attributes in the northeast quadrant
  • “low-performance” attributes in the southwest quadrant
  • “excitement” attributes in the northwest quadrant.
Considering the quadrant defining basic attributes, three relate to the “Food” dimension, one to “Staff and Service Quality” (“The hotel staff is kind, careful and polite”), one to “Tangibles” (“The room is quiet”), one to “Value for Money” (“The prices correspond to the level of services provided”), and one to the “Green” dimension (“The hotel provides its guests bicycles for free or for rent”). In the quadrant of the high-performance factors, we can find six out of the seven attributes defining the “Staff and Service Quality” dimension. It also includes one attribute from the “Tangible” dimension (“The room is comfortable, adequately furnished and fitted”) and one from “Value for money” (“The quality of hotel service corresponds to the number of stars”). The low-performance quadrant contains one attribute from the “Tangible” dimension (“In-room and hotel technologies are adequate and functional”), one from “Food” (“Organic or seasonal food are available for breakfast”), and three elements from the “Green” dimension. Finally, the excitement quadrant is made up of the remaining six “Green” attributes.

5. Discussion and Managerial Implications

5.1. Theoretical Contributions

H1. 
Hotel green attributes define a specific dimension of service qualityin eco-labeled hotels.
Service quality is a critical aspect of determining customer satisfaction and positive behavioral intentions [144]. In service industries, quality is defined by the simultaneous effect of multiple dimensions. In recent decades, the hotel industry is making significant investments in the implementation of sustainability practices, so it is compelling to investigate if consumers recognize these practices as a specific dimension of service quality. Previous studies investigated the existence of specific service quality dimensions related to a specific Green dimension. For example, Khan (2003) revisited the SERVQUAL scale in the ECOSERV in the context of ecotourism, establishing six service quality dimensions [29]. The Eco-tangible construct was recognized as the most important for customers. Environmentally friendly attitudes and physical equipment that minimizes environmental degradation were identified by guests as the most relevant for enhancing service quality [29]. Additionally, Yusof et al. (2014) revisited the SERVQUAL, integrating it with two additional sustainability dimensions for ecotourism. Sustainable practices include actions implemented to keep the original value of environmental and cultural assets (e.g., recycling, reuse, integration with local environment/culture) [28]. Considering the hotel industry, Kassinis & Soteriou (2015) identified a specific factor for environmental practices, separated from other service quality attributes [63]. The results of this study indicated that when hotels implemented green practices, this resulted in an increase in customer satisfaction [63]. Moreover, W. H. Lee & Cheng (2018) proposed a Green Lodging Service Quality scale (GLSERV scale) to measure the service quality of green hotels [145].
Results of the analysis presented above show that guests identify a service quality dimension specifically linked to hotel green attributes. Even though not many studies have been performed on the specific topic, the study confirms the findings of other Scholars that identified the existence of a specific green dimension of service quality in the hospitality industry.
H2. 
Hotel green attributes are perceived by guests as “excitement” attributes.
The analysis shows that guests consider the green dimension of hotel service quality as having lower explicit importance with respect to the other dimensions (Table 3). However, when implicit importance was calculated, this difference tended to decrease. This finding supports evidence from many studies that reported how some validity problems can be associated with self-reported measures of importance [44]. Additionally, considering our research hypothesis, it is partially accepted, as customers identify most of the environmental practices implemented as “excitement factors”. However, some Green attributes fall into different quadrants: one into the Basic quadrant (GREEN_9) and three into the low-performance quadrant (GREEN_2, GREEN_4, GREEN_10”).
For basic attributes, findings show, as suggested also by Robinot & Giannelloni (2010), that environmental initiatives should be communicated to guests only if the hotel can deliver them properly and constantly, limiting the risk of being negatively assessed on these initiatives. Regarding the excitement attributes, Figure 5 shows that environmental sustainability practices introduced by eco-labeled hotels are generally well recognized by guests and for this reason can be considered as positive differentiation factors. Hotels should invest in these practices as they strongly contribute to guests’ satisfaction. Findings from this study confirm the initial research hypothesis that hotel green attributes are identified by guests as “excitement” attributes, as affirmed also in the Slevitch (2013) study [120]. This result, however, is in contrast with Robinot & Giannelloni’s (2010) findings that lead to the conclusion that environment-related attributes fall into the “basic” category [119]. Indeed, only one attribute (GREEN_9) falls into this category.

5.2. Managerial Implications

Hotels are a major energy and water-intensive sector in their day-to-day operations [146,147]. To overcome these issues, hoteliers are increasingly developing green programs in the management of their operations to create a more sustainable business environment and to reduce their operating costs [148]. Indeed, the hotel sector has been a pioneer of corporate social responsibility (CSR) practices in the tourism sector. For decades, it has been applying green practices, starting to consider environmental-related aspects of the service as a pillar in its operations [147,149,150]. The implementation of green practices in the hotel industry has become, in recent years, a pivotal aspect of hotel management strategy [60]. This is due not only to managers’ awareness of this impact, but also to the fact that consumers are becoming increasingly aware of hotels’ environmental impact and seem to appreciate hotels’ efforts to reduce their environmental footprint [148]. The efforts of hotels towards more environmentally sustainable activities are positively judged by consumers [151], enhancing customer satisfaction [152] and loyalty [147] and indirectly increasing firms’ competitiveness [153]. Considering these phenomena, many hotels have been proactive in adopting green practices and becoming greener, to attract eco-conscious consumers who are demanding “green consciousness” in hotels’ operation management [148,150]. Results show that customers identify green practices as a specific dimension of the service. This should be central to the policies of hotel managers, as guests perceive the integration of green practices as a significant part of the whole service. Moreover, guests recognize green practices as “excitement” attributes, which lead to delight in case of a good performance but do not produce discontent if not achieved [40,52]. In this sense, it seems demonstrated that hotels’ green programs can have a positive influence on guests’ satisfaction. Moreover, prior research pointed out that hotels’ green efforts have a positive impact on guest behavioral intentions and positive word-of-mouth [152,154,155].
Another important basic factor that emerged from our survey is the availability of bicycles for free or for rent, whilst other green practices, such as water and energy-saving or separated waste collection, seem to be less significant for customers. Actually, the literature shows that hotels decide to invest in sustainability initiatives for many reasons: economic benefits, improved employee organizational commitment, facing public scrutiny, improved investor relations, and the general social good [25]. Lastly, the green practices that seem to represent excitement factors are mainly related to the communication on green practices implemented, on cultural and environmental experiences available near the accommodation, and the use of public transportation. As pointed out by Fuller and Matzler (2008), hoteliers should: “Fulfil the basic requirements to ‘‘enter’’ the market, be competitive with regard to the performance factors to increase satisfaction, and stand out from the rest based on excitement factors to delight the customer” [118].
However, as pointed out by Robinot & Giannelloni (2010), green practices can also have a negative effect on customer satisfaction if delivered improperly. Additionally, guests can get used to some services and start to consider them as basic factors. Therefore, hotel managers should carefully evaluate if it is convenient for them to implement a sustainability strategy and if they will have the resources to maintain it in the long term.

6. Conclusions

Since not many studies have investigated the relationship between green practices and customer behavior in the context of the hotel industry through the lens of the three-factory of customer satisfaction, this study tries to fill this gap in the literature. Through a survey, this paper investigates how consumers evaluate green attributes implemented by hotels awarded with an ecolabel to evaluate if they may be considered as excitement factors among hotel service quality attributes. 366 questionnaires were usable and were employed for subsequent analysis. The results show that guests identify a specific dimension of hotel service related to hotel green attributes. Additionally, findings show that when hotels implement green practices as part of their sustainability strategy, these practices increase guest satisfaction and are perceived as excitement factors, contributing to delighting guests. Therefore, when green practices are implemented by hotels, these are generally positively recognized by guests and therefore they can be a positive differentiation factor on the market. Findings suggest that hotels should invest in these practices, as they contribute to enhancing overall satisfaction. However, results show, as suggested also by Giannelloni (2010), that it would be better not to inform guests about the sustainability program if it is not certain that the structure can deliver them properly and constantly, avoiding the risk of being negatively assessed on these aspects [119].
This study is not free of limitations. Firstly, a convenience sampling technique with a relatively restricted sample has been used. Secondly, data were collected only from an Italian hotel awarded with a Legambiente Turismo Ecolabel. Therefore, study results may not apply to green hotels with different ecolabels or green certifications and to other destinations and countries. Thirdly, the items’ selection reflects the criteria that hotels had to meet to be awarded with the Legambiente Ecolabel. Future research may need to expand the scope of the analysis to different ecolabels or green certification schemes. Additionally, it could be interesting to evaluate the role of green practices on customer satisfaction, considering different segments of the customer population, analyzing how basic, excitement, and performance factors affect different types of consumers. However, even if study findings are not free from limitations, they contribute to the academic debate on the asymmetrical relationship between service attributes and satisfaction, and to understanding customers’ perception of green practices. Additionally, this study has significant managerial implications, supporting the efficacy of green practices in helping hoteliers to develop a positive differentiation strategy on the market.
Particularly, companies and hoteliers who are interested in implementing these green practices, or developing a sustainability strategy for their hotels, can find in this paper a useful tool to guide their business choices by exploring the different elements that characterize this area of research.

Author Contributions

Conceptualization, M.P., A.A., M.C.L. and R.M.; data curation, M.P. and A.A.; formal analysis, M.P. and A.A.; investigation, M.P. and R.M.; methodology, M.P., A.A., M.C.L. and R.M.; project administration, M.P. and R.M.; supervision, M.C.L. and R.M.; writing—original draft, M.P., A.A. and R.M.; writing—review & editing, M.C.L. and R.M. All authors have read and agreed to the published version of the manuscript.

Funding

This research received no external funding.

Institutional Review Board Statement

Not applicable.

Informed Consent Statement

Not applicable.

Data Availability Statement

Not applicable.

Conflicts of Interest

The authors declare no conflict of interest.

References

  1. World Tourism Organization. UNWTO World Tourism Barometer; World Tourism Organization: Madrid, Spain, 2018; Volume 16. [Google Scholar]
  2. Correia, L.; Ademir, D.; Morbeck De Oliveira, K.; Garcia, D.S. The Relationship between Environmental Education and Tourist Activity in Accordance with the Brazilian Laws. Athens J. Tour. 2016, 139–154. [Google Scholar]
  3. Moeller, T.; Dolnicar, S.; Leisch, F. The sustainability–profitability trade-off in tourism: Can it be overcome? J. Sustain. Tour. 2011, 19, 155–169. [Google Scholar] [CrossRef]
  4. Hunter, C. Sustainable tourism as an adaptive paradigm. Ann. Tour. Res. 1997, 24, 850–867. [Google Scholar] [CrossRef]
  5. Jarvis, N.; Weeden, C.; Simcock, N. The Benefits and Challenges of Sustainable Tourism Certification: A Case Study of the Green Tourism Business Scheme in the West of England. J. Hosp. Tour. Manag. 2010, 17, 83–93. [Google Scholar] [CrossRef] [Green Version]
  6. Lee, J.-S.; Hsu, L.-T.; Han, H.; Kim, Y. Understanding how consumers view green hotels: How a hotel’s green image can influence behavioural intentions. J. Sustain. Tour. 2010, 18, 901–914. [Google Scholar] [CrossRef]
  7. Rahman, I.; Reynolds, D. The influence of values and attitudes on green consumer behavior: A conceptual model of green hotel patronage. Int. J. Hosp. Tour. Adm. 2017, 20, 47–74. [Google Scholar] [CrossRef]
  8. Balouin, Y.; Rey-Valette, H.; Picand, P.A. Automatic assessment and analysis of beach attendance using video images at the Lido of Sète beach, France. Ocean Coast. Manag. 2014, 102, 114–122. [Google Scholar] [CrossRef]
  9. Ham, S.; Han, H. Role of Perceived Fit With Hotels’ Green Practices in the Formation of Customer Loyalty: Impact of Environmental Concerns. Asia Pac. J. Tour. Res. 2013, 18, 731–748. [Google Scholar] [CrossRef]
  10. Matzler, K.; Bailom, F.; Hinterhuber, H.H.; Renzl, B.; Pichler, J. The asymmetric relationship between attribute-level performance and overall customer satisfaction: A reconsideration of the importance-performance analysis. Ind. Mark. Manag. 2004, 33, 271–277. [Google Scholar] [CrossRef]
  11. Vavra, T.G. Improving Your Measurement of Customer Satisfaction: A Guide to Creating, Conducting, Analyzing, and Reporting Customer Satisfaction Measurement Programs; White Plains: New York, NY, USA, 1997. [Google Scholar]
  12. Oliver, R.L. Satisfaction: A Behavioral Perspective on the Consumer. J. Consum. Mark. 1997, 14, 448. [Google Scholar] [CrossRef]
  13. Berman, B. How to delight your customers. Calif. Manag. Rev. 2005, 48, 129–151. [Google Scholar] [CrossRef]
  14. Subash, L.; Raju, P.S. Impact of service attributes on customer satisfaction and loyalty in a healthcare context. Leadersh. Health Serv. 2015, 28, 5–7. [Google Scholar] [CrossRef]
  15. Cronin, J.J.; Taylor, S. A Measuring Quality: A Reexamination and Extension. J. Mark. 1992, 56, 55–68. [Google Scholar] [CrossRef]
  16. Anderson, E.W.; Mittal, V. Strengthen the satisfaction-profit chain. J. Serv. Res. 2000, 3, 107–120. [Google Scholar] [CrossRef]
  17. Albayrak, T.; Caber, M. Prioritisation of the hotel attributes according to their influence on satisfaction: A comparison of two techniques. Tour. Manag. 2015, 46, 43–50. [Google Scholar] [CrossRef]
  18. Baker, D.A.; Crompton, J.L. Quality, satisfaction and behavioral intentions. Ann. Tour. Res. 2000, 27, 785–804. [Google Scholar] [CrossRef]
  19. Han, H.; Hsu, L.J.T.J.; Lee, J.S.; Sheu, C. Are lodging customers ready to go green? An examination of attitudes, demographics, and eco-friendly intentions. Int. J. Hosp. Manag. 2011, 30, 345–355. [Google Scholar] [CrossRef]
  20. Berezan, O.; Raab, C.; Love, C. Sustainable hotel practices and nationality: The impact on guest satisfaction and guest intention to return. Int. J. Hosp. Manag. 2013, 34, 227–233. [Google Scholar] [CrossRef]
  21. Xu, X.; Gursoy, D. Influence of sustainable hospitality supply chain management on customers’ attitudes and behaviors. Int. J. Hosp. Manag. 2015, 49, 105–116. [Google Scholar] [CrossRef]
  22. Bruns-smith, A.; Choy, V.; Chong, H.; Verma, R. Environmental Sustainability in the Hospitality Industry: Best Practices, Guest Participation, and Customer Satisfaction; Cornell Hospitality Reports: Ithaca, NY, USA, 2015; Volume 15. [Google Scholar]
  23. Manhas, P.S.; Ramjit, J. Customer perceptions of service quality in hospitality industry: Importance performance analysis. J. Tour. Res. 2011, 2, 34–57. [Google Scholar]
  24. Parasuraman, A.; Zeithaml, V.A.; Berry, L.L. SERQUAL: A Multiple-Item scale for Measuring Consumer Perceptions of Service Quality. J. Retail. 1988, 64, 28. [Google Scholar]
  25. Prud’homme, B.; Raymond, L. Sustainable development practices in the hospitality industry: An empirical study of their impact on customer satisfaction and intentions. Int. J. Hosp. Manag. 2013, 34, 116–126. [Google Scholar] [CrossRef]
  26. Knutson, B.; Stevens, P.; Wullaert, C.; Patton, M.; Yokoyama, F. Lodgserv: A service quality index for the lodging industry. J. Hosp. Tour. Res. 1990, 14, 277–284. [Google Scholar] [CrossRef]
  27. Getty, J.M.; Getty, R.L. Lodging quality index (LQI): Assessing customers’ perceptions of quality delivery. Int. J. Contemp. Hosp. Manag. 2003, 15, 94–104. [Google Scholar] [CrossRef]
  28. Yusof, N.; Abd Rahman, F.; Che Jamil, M.F.; Iranmanesh, M. Measuring the Quality of Ecotourism Services: Case Study-Based Model Validation. SAGE Open 2014, 4. [Google Scholar] [CrossRef]
  29. Khan, M. ECOSERV Ecotourist’s quality expectations. Ann. Tour. Res. 2003, 30, 109–124. [Google Scholar] [CrossRef]
  30. Martilla, J.; James, J.C. Importance-performance analysis. J. Mark. 1977, 41, 77–79. [Google Scholar] [CrossRef]
  31. Oh, H. Revisiting importance—Performance analysis. Tour. Manag. 2001, 22, 617–627. [Google Scholar] [CrossRef]
  32. Chen, K.Y. Improving importance-performance analysis: The role of the zone of tolerance and competitor performance. The case of Taiwan’s hot spring hotels. Tour. Manag. 2014, 40, 260–272. [Google Scholar] [CrossRef]
  33. Eskildsen, J.K.; Kristensen, K. Enhancing importance-performance analysis. Int. J. Product. Perform. Manag. 2006, 55, 40–60. [Google Scholar] [CrossRef]
  34. Azzopardi, E.; Nash, R. A critical evaluation of importance—Performance analysis. Tourism Management. Tour. Manag. 2013, 35, 222–233. [Google Scholar] [CrossRef]
  35. Chu, R.K.S.; Choi, T. An importance-performance analysis of hotel selection factors in the Hong Kong hotel industry: A comparison of business and leisure travellers. Tour. Manag. 2000, 21, 363–377. [Google Scholar] [CrossRef]
  36. Sörensson, A.; von Friedrichs, Y. An importance-performance analysis of sustainable tourism: A comparison between international and national tourists. J. Destin. Mark. Manag. 2013, 2, 14–21. [Google Scholar] [CrossRef]
  37. Boley, B.B.; McGehee, N.G.; Hammett, A.L.T. Importance-performance analysis (IPA) of sustainable tourism initiatives: The resident perspective. Tour. Manag. 2017, 58, 66–77. [Google Scholar] [CrossRef]
  38. Lee, S.A.; Oh, H. Effective Communication Strategies for Hotel Guests’ Green Behavior. Cornell Hosp. Q. 2014, 55, 52–63. [Google Scholar] [CrossRef]
  39. Qu, H.; Sit, C.Y. Hotel Marketing Managers’ Responses to Ethical Dilemmas. Int. J. Hosp. Tour. Adm. 2007, 8, 35–48. [Google Scholar] [CrossRef]
  40. Feng, M.; Mangan, J.; Wong, C.; Xu, M.; Lalwani, C. Investigating the different approaches to importance–performance analysis. Serv. Ind. J. 2014, 34, 1021–1041. [Google Scholar] [CrossRef]
  41. Abalo, J.; Varela, J.; Manzano, V. Importance values for Importance-Performance Analysis: A formula for spreading out values derived from preference rankings. J. Bus. Res. 2007, 60, 115–121. [Google Scholar] [CrossRef]
  42. Lin, S.-P.; Chan, Y.-H.; Tsai, M.-C. A transformation function corresponding to IPA and gap analysis. Total Qual. Manag. Bus. Excell. 2009, 20, 829–846. [Google Scholar] [CrossRef]
  43. Bacon, D.R. A comparison of approaches to Importance-Performance Analysis. Int. J. Mark. Res. 2003, 45, 55–72. [Google Scholar] [CrossRef]
  44. Oh, H.; Parks, S.C. Evaluating the Role of Attribute Importance as a Multiplicative Weighting Variable in the Study of Hospitality Consumer Decision-Making. J. Hosp. Tour. Res. 1998, 21, 61–80. [Google Scholar] [CrossRef]
  45. Gustafsson, A.; Johnson, M.D. Determining Attribute Importance in a Service Satisfaction Model. J. Serv. Res. 2004, 7, 124–141. [Google Scholar] [CrossRef]
  46. Albayrak, T.; Caber, M.; Bideci, M. Identification of hotel attributes for senior tourists by using Vavra’s importance grid. J. Hosp. Tour. Manag. 2016, 29, 17–23. [Google Scholar] [CrossRef]
  47. Chowdhary, N.; Prakash, M. Service quality: Revisiting the two factors theory. J. Serv. Res. 2005, 5, 61–75. [Google Scholar]
  48. Smith, R.; Deppa, B. Two dimensions of attribute importance. J. Consum. Mark. 2009, 26, 28–38. [Google Scholar] [CrossRef]
  49. Mikulic, J. The Kano Model—A Review of Its Application in Marketing Research from 1984 to 2006. Available online: https://www.researchgate.net/publication/228434290_The_Kano_model-A_review_of_its_application_in_marketing_research_from_1984-2006 (accessed on 13 February 2022).
  50. Kano, N.; Seraku, N.; Takahashi, F.; Tsuji, S. Attractive quality and must-be quality. J. Jpn. Soc. Qual. Control 1984, 14, 39–48. [Google Scholar] [CrossRef]
  51. Matzler, K.; Sauerwein, E. The factor structure of customer satisfaction. Int. J. Serv. Ind. Manag. 2002, 13, 314–332. [Google Scholar] [CrossRef]
  52. Matzler, K.; Sauerwein, E.; Heischmidt, K. A Importance-Performance Analysis Revisited: The Role of the Factor Structure of Customer Satisfaction. Serv. Ind. J. 2003, 23, 112–129. [Google Scholar] [CrossRef]
  53. Deng, W.J.; Chen, W.-C.; Pei, W. Back-propagation neural network based importance–performance analysis for determining critical service attributes. Expert Syst. Appl. 2008, 34, 1115–1122. [Google Scholar] [CrossRef]
  54. Westbrook, R.A.; Oliver, R. The Dimensionality of Consumption Emotion Pattems and Consumer Satisfaction. J. Consum. Res. 1991, 18, 84–91. [Google Scholar] [CrossRef]
  55. Oliver, R.L. Cognitive, Affective, and Attribute Bases of the Satisfaction Response. J. Consum. Res. 1993, 20, 418. [Google Scholar] [CrossRef]
  56. Lai, I.K.W.; Hitchcock, M. Importance-performance analysis in tourism: A framework for researchers. Tour. Manag. 2015, 48, 242–267. [Google Scholar] [CrossRef]
  57. Alegre, J.; Garau, J. The factor structure of tourist satisfaction at sun and sand destinations. J. Travel Res. 2011, 50, 78–86. [Google Scholar] [CrossRef]
  58. To, W.M.; Lam, K.H.; Lai, T.M. Importance-performance ratings for environmental practices among Hong Kong professional-level employees. J. Clean. Prod. 2015, 108, 699–706. [Google Scholar] [CrossRef]
  59. Tsai, H.; Tsang, N.K.F.; Cheng, S.K.Y. Hotel employees’ perceptions on corporate social responsibility: The case of Hong Kong. Int. J. Hosp. Manag. 2012, 31, 1143–1154. [Google Scholar] [CrossRef]
  60. Kim, S.H.; Choi, Y. Hotel Employees’ Perception of Green Practices. Int. J. Hosp. Tour. Adm. 2013, 14, 157–178. [Google Scholar] [CrossRef]
  61. Levy, S.E.; Park, S.-Y. An Analysis of CSR Activities in the Lodging Industry. J. Hosp. Tour. Manag. 2011, 18, 147–154. [Google Scholar] [CrossRef]
  62. Wu, K.-S.; Teng, Y.-M.; Huang, D.-M. Are lodging really go green? Empirical investigation of the sustainability practice from the hoteliers by IPA analysis. Life Sci. J. 2013, 10, 418–427. [Google Scholar]
  63. Kassinis, G.I.; Soteriou, A.C. Environmental and quality practices: Using a video method to explore their relationship with customer satisfaction in the hotel industry. Oper. Manag. Res. 2015, 8, 142–156. [Google Scholar] [CrossRef]
  64. Esparon, M.; Gyuris, E.; Stoeckl, N. Does ECO certification deliver benefits? An empirical investigation of visitors’ perceptions of the importance of ECO certification’s attributes and of operators’ performance. J. Sustain. Tour. 2014, 22, 148–169. [Google Scholar] [CrossRef]
  65. Zhang, S.; Chan, C.S. Nature-based tourism development in Hong Kong: Importance-Performance perceptions of local residents and tourists. Tour. Manag. Perspect. 2016, 20, 38–46. [Google Scholar] [CrossRef]
  66. Haahti, A.; Yavas, U. A multi-attribute approach to understanding image of a theme park: The Case of SantaPark in Lapland. Eur. Bus. Rev. 2004, 16, 390–397. [Google Scholar] [CrossRef]
  67. Sheng, X.; Simpson, P.M.; Siguaw, J.A. U.S. winter migrants’ park community attributes: An importance-performance analysis. Tour. Manag. 2014, 43, 55–67. [Google Scholar] [CrossRef]
  68. Hollenshorst, S.; Olson, D.; Fortney, R. Use of importance-performance analysis to evaluate state park cabins: The case of the West Virginia state park system. J. Park Recreat. Adm. 1992, 10, 1–11. [Google Scholar]
  69. Hunt, K.D.; Shores, K.; Scott, D.; Richardson, S. Positioning public recreation and park offerings using importance performance analysis. J. Park Recreat. Adm. 2003, 21, 1–21. [Google Scholar]
  70. Wade, D.J.; Eagles, P.F.J. The use of Importance–Performance Analysis and market segmentation for tourism management in parks and protected areas: An application to Tanzania’s National Parks. J. Ecotour. 2003, 2, 196–212. [Google Scholar] [CrossRef]
  71. Cottrell, S.P.; Vaske, J.J.; Roemer, J.M. Resident satisfaction with sustainable tourism: The case of Frankenwald Nature Park, Germany. Tour. Manag. Perspect. 2013, 8, 42–48. [Google Scholar] [CrossRef]
  72. Coghlan, A. Facilitating reef tourism management through an innovative importance-performance analysis method. Tour. Manag. 2012, 33, 767–775. [Google Scholar] [CrossRef] [Green Version]
  73. Bruyere, B.L.; Rodriguez, D.A.; Vaske, J.J. Enhancing Importance-Performance Analysis Through Segmentation. J. Travel Tour. Mark. 2002, 12, 81–95. [Google Scholar] [CrossRef]
  74. Tonge, J.; Moore, S.A. Importance-satisfaction analysis for marine-park hinterlands: A Western Australian case study. Tour. Manag. 2007, 28, 768–776. [Google Scholar] [CrossRef] [Green Version]
  75. Milman, A.; Li, X.; Wang, Y.; Yu, Q. Examining the guest experience in themed amusement parks: Preliminary evidence from China. J. Vacat. Mark. 2012, 18, 313–325. [Google Scholar] [CrossRef]
  76. Vaske, J.J.; Kiriakos, R.; Cottrell, S.P.; Khuong, M.N. Importance-performance and segmentation: An application at a biosphere reserve in vietnam. J. Travel Tour. Mark. 2009, 26, 30–41. [Google Scholar] [CrossRef]
  77. Cheng, Q.; Guo, J.; Ling, S. Fuzzy importance-performance analysis of visitor satisfaction for theme park: The case of Fantawild Adventure in Taiwan, China. Curr. Issues Tour. 2016, 19, 895–912. [Google Scholar] [CrossRef]
  78. Moyle, B.D.; Weiler, B.; Croy, G. visitors’ perceptions of tourism impacts: Bruny and Magnetic islands, Australia. J. Travel Res. 2012, 52, 392–406. [Google Scholar] [CrossRef] [Green Version]
  79. Litvin, S.W.; Ng Sok Ling, S. The destination attribute management model: An empirical application to Bintan, Indonesia. Tour. Manag. 2001, 22, 481–492. [Google Scholar] [CrossRef]
  80. Crompton, L.J.; Love, L.L. The predictive validity of alternative approaches to evaluating quality of a festival. J. Travel Res. 1985, 34, 11–24. [Google Scholar] [CrossRef]
  81. Joppe, M.; Martin, D.W.; Waalen, J. Toronto’s Image As a Destination: A Comparative Importance-Satisfaction Analysis by Origin of Visitor. J. Travel Res. 2001, 39, 252–260. [Google Scholar] [CrossRef]
  82. O’Leary, S. Ireland’s Image as a Tourism Destination in France: Attribute Importance and Performance. J. Travel Res. 2005, 43, 247–256. [Google Scholar] [CrossRef]
  83. Fallon, P.; Schofield, P. The dynamics of destination attribute importance. J. Bus. Res. 2006, 59, 709–713. [Google Scholar] [CrossRef]
  84. Aktas, A.; Aksu, A.A.; Cizel, B. Destination choice: An impor- tantesatisfaction analysis. Qual. Quant. 2007, 41, 265–273. [Google Scholar] [CrossRef]
  85. Caber, M.; Albayrak, T.; Matzler, K. Classification of the destination attributes in the content of competitiveness (by revised importance-performance analysis). J. Vacat. Mark. 2012, 18, 43–56. [Google Scholar] [CrossRef]
  86. Murdy, S.; Pike, S. Perceptions of visitor relationship marketing opportunities by destination marketers: An importance-performance analysis. Tour. Manag. 2012, 33, 1281–1285. [Google Scholar] [CrossRef] [Green Version]
  87. Lee, J.; Choi, Y.; Breiter, D. An exploratory study of convention destination competitiveness from the attendees’ perspective: Importanceeperformance analysis and repeated measures of Manova. J. Hosp. Tour. Manag. 2013, 40, 589–610. [Google Scholar] [CrossRef]
  88. Go, F.; Zhang, W. Applying Importance-Performance Analysis to Beijing as an international meeting destination. J. Travel Res. 1997, 35, 42–49. [Google Scholar] [CrossRef]
  89. Breiter, D.; Milman, A. Attendees’ needs and service priorities in a large convention centre: Application of the importance-performance theory. Tour. Manag. 2006, 27, 1364–1370. [Google Scholar] [CrossRef]
  90. Weber, K. Meeting planners’ perceptions of hotel-chain practices and benefits: An importance-performance analysis. Cornell Hotel Restaur. Adm. Q. 2000, 41, 32–38. [Google Scholar] [CrossRef]
  91. Hultsman, W. From the Eyes of an Exhibitor. J. Conv. Exhib. Manag. 2001, 3, 27–44. [Google Scholar] [CrossRef]
  92. Weber, K.; Roehl, W. Service quality issues for convention and visitor bureaus. Conv. Exhib. Manag. 2001, 3, 1–19. [Google Scholar] [CrossRef]
  93. Higgs, B.; Polonsky, M.J.; Hollick, M. Measuring expectations: Forecast vs. ideal expectations. Does it really matter? J. Retail. Consum. Serv. 2005, 12, 49–64. [Google Scholar] [CrossRef] [Green Version]
  94. Kuo, C.-M.; Chen, L.-C.; Lin, S.-Y. Exploring the relationship between hotel-based service attribute importance and customer satisfaction at international conferences in Taiwan. J. Conv. Event Tour. 2010, 11, 293–313. [Google Scholar] [CrossRef]
  95. Whitfield, J.; Webber, D.J. Which exhibition attributes create repeat visitation? Int. J. Hosp. Manag. 2011, 30, 439–447. [Google Scholar] [CrossRef]
  96. Duke, C.R.; Persia, M.A. Performance-Importance Analysis of Escorted Tour Evaluations. J. Travel Tour. Mark. 1996, 5, 207–223. [Google Scholar] [CrossRef]
  97. Zhang, H.Q.; Chow, I. Application of importance-performance model in tour guides’ performance: Evidence from mainland Chinese outbound visitors in Hong Kong. Tour. Manag. 2004, 25, 81–91. [Google Scholar] [CrossRef]
  98. Ziegler, J.; Dearden, P.; Rollins, R. But are tourists satisfied? Importance-performance analysis of the whale shark tourism industry on Isla Holbox, Mexico. Tour. Manag. 2012, 33, 692–701. [Google Scholar] [CrossRef]
  99. Perl, Y.; Israeli, A.A. Crisis management in the travel agency sector: A case study. J. Vacat. Mark. 2011, 17, 115–125. [Google Scholar] [CrossRef]
  100. Caber, M.; Albayrak, T.; Loiacono, E.T. The Classification of Extranet Attributes in Terms of Their Asymmetric Influences on Overall User Satisfaction: An Introduction to Asymmetric Impact-Performance Analysis. J. Travel Res. 2013, 52, 106–116. [Google Scholar] [CrossRef]
  101. Bentz, J.; Lopes, F.; Calado, H.; Dearden, P. Enhancing satisfaction and sustainable management: Whale watching in the Azores. Tour. Manag. 2016, 54, 465–476. [Google Scholar] [CrossRef]
  102. Evans, M.R.; Chon, K.-S. Formulating and Evaluating Tou Rism Policy Using Importance-Performance Analysis. J. Hosp. Tour. Res. 1989, 13, 203–213. [Google Scholar] [CrossRef]
  103. Pike, S.; Ryan, C. Destination positioning analysis through a comparison of cognitive, affective, and conative perceptions. J. Travel Res. 2004, 42, 333–342. [Google Scholar] [CrossRef] [Green Version]
  104. Frauman, E.; Banks, S. Gateway community resident perceptions of tourism development: Incorporating Importance-Performance Analysis into a Limits of Acceptable Change framework. Tour. Manag. 2011, 32, 128–140. [Google Scholar] [CrossRef]
  105. Gilinsky, A.; Newton, S.K.; Vega, R.F. Sustainability in the Global Wine Industry: Concepts and Cases. Agric. Agric. Sci. Procedia 2016, 8, 37–49. [Google Scholar] [CrossRef] [Green Version]
  106. Enright, M.J.; Newton, J. Tourism destination competitiveness: A quantitative approach. Tour. Manag. 2004, 25, 777–788. [Google Scholar] [CrossRef]
  107. Ryan, C.; Huimin, G. Perceptions of Chinese Hotels. Cornell Hotel Restaur. Adm. Q. 2007, 48, 380–391. [Google Scholar] [CrossRef]
  108. Mueller, H.; Kaufmann, E.L. Wellness tourism: Market analysis of a special health tourism segment and implications for the hotel. J. Vacat. Mark. 2001, 1, 5–17. [Google Scholar] [CrossRef] [Green Version]
  109. Jin, X.; Qi, S.; Chiang, C.-H. A Cross-Sector Evaluation of Service Quality in the Tourism Industry of Hong Kong: Importance vs. Performance. J. China Tour. Res. 2008, 4, 319–335. [Google Scholar] [CrossRef]
  110. Cvelbar, L.K.; Dwyer, L. An importance–performance analysis of sustainability factors for long-term strategy planning in Slovenian hotels. J. Sustain. Tour. 2012, 21, 1–18. [Google Scholar] [CrossRef]
  111. Mohsin, A. Assessing lodging service down under: A case of Hamilton, New Zealand. Int. J. Contemp. Hosp. Manag. 2007, 19, 296–308. [Google Scholar] [CrossRef]
  112. Mount, D.J. Introducing the relativity to traditional importance performance analysis. J. Hosp. Tour. Res. 1997, 21, 111–119. [Google Scholar] [CrossRef]
  113. Beldona, S.; Cobanoglu, C. Importance-Performance Analysis of Guest Technologies in the Lodging Industry. Cornell Hotel Restaur. Adm. Q. 2007, 48, 299–312. [Google Scholar] [CrossRef]
  114. Guadagnolo, F. The importance performance analysis: An evaluation and marketing tool. J. Park Recreat. Adm. 1985, 14, 43–54. [Google Scholar]
  115. Hudson, S.; Shephard, G.W.H. Measuring service quality at tourist destinations: An application of importance-performance analysis to an Alpine Ski Resort. J. Travel Tour. Mark. 1998, 7, 61–77. [Google Scholar] [CrossRef]
  116. Uysal, M.; Howard, G.; Jamrozy, U. An application of importance performance analysis to a ski resort: A case study in North Carolina. Vis. Leis. Bus. 1991, 10, 16–25. [Google Scholar]
  117. Lai, I.K.W.; Hitchcock, M. A comparison of service quality attributes for stand-alone and resort-based luxury hotels in Macau: 3-Dimensional importance-performance analysis. Tour. Manag. 2016, 55, 139–159. [Google Scholar] [CrossRef]
  118. Fuller, J.; Matzler, K. Customer delight and market segmentation: An application of the three-factor theory of customer satisfaction on life style groups. Tour. Manag. 2008, 29, 116–126. [Google Scholar] [CrossRef]
  119. Robinot, E.; Giannelloni, J.-L. Do hotels’ “green” attributes contribute to customer satisfaction? J. Serv. Mark. 2010, 24, 157–169. [Google Scholar] [CrossRef]
  120. Slevitch, L.; Mathe, K.; Karpova, E.; Scott-Halsell, S. “Green” attributes and customer satisfaction: Optimization of resource allocation and performance. Int. J. Contemp. Hosp. Manag. 2013, 25, 802–822. [Google Scholar] [CrossRef]
  121. Ladhari, R. Service quality, emotional satisfaction, and behavioural intentions: A study in the hotel industry. Manag. Serv. Qual. 2009, 19, 308–331. [Google Scholar] [CrossRef]
  122. Mei, A.W.O.; Dean, A.M.; White, C.J. Analysing service quality in the hospitality industry. Manag. Serv. Qual. 1999, 9, 136–143. [Google Scholar] [CrossRef]
  123. Albacete-Saez, C.A.; Mar Fuentes-Fuentes, M.M.; Llorens-Montes, F.J. Service quality measurement in rural accommodation. Ann. Tour. Res. 2007, 34, 45–65. [Google Scholar] [CrossRef]
  124. Akama, J.S.; Kieti, D.M. Measuring tourist satisfaction with Kenya’s wildlife safari: A case study of Tsavo West National Park. Tour. Manag. 2003, 24, 73–81. [Google Scholar] [CrossRef]
  125. Akan, P. Dimensions of service quality: A study in Istanbul. Manag. Serv. Qual. 1995, 5, 39–43. [Google Scholar] [CrossRef]
  126. Juwaheer, T.D. Exploring international tourists’ perceptions of hotel operations by using a modified SERVQUAL approach—A case study of Mauritius. Manag. Serv. Qual. 2004, 14, 350–364. [Google Scholar] [CrossRef]
  127. Kandampully, J.; Suhartanto, D.; Pearce, P.L.; Morrison, A.M.; Moscardo, G.M. Individuals as tourist icons: A developmental and marketing analysis. J. Hosp. Leis. Mark. 2003, 10, 63–85. [Google Scholar] [CrossRef]
  128. Ekinci, Y.; Riley, M. Validating quality dimensions. Ann. Tour. Res. 2001, 28, 202–223. [Google Scholar] [CrossRef]
  129. Akbaba, A. Measuring service quality in the hotel industry: A study in a business hotel in Turkey. Int. J. Hosp. Manag. 2006, 25, 170–192. [Google Scholar] [CrossRef]
  130. Ramsaran-Fowdar, R.R. Developing a service quality questionnaire for the hotel industry in Mauritius. J. Vacat. Mark. 2007, 13, 19–27. [Google Scholar] [CrossRef]
  131. Bohdanowicz, P.; Zientara, P.; Novotna, E. International hotel chains and environmental protection: An analysis of Hilton’s we care! programme (Europe, 2006–2008). J. Sustain. Tour. 2011, 19, 797–816. [Google Scholar] [CrossRef]
  132. Hsiao, T.; Chuang, C.; Kuo, N.; Yu, S.M. Establishing attributes of an environmental management system for green hotel evaluation. Int. J. Hosp. Manag. 2014, 36, 197–208. [Google Scholar] [CrossRef]
  133. Bastič, M.; Gojčič, S. Measurement scale for eco-component of hotel service quality. Int. J. Hosp. Manag. 2012, 31, 1012–1020. [Google Scholar] [CrossRef]
  134. Deng, W. Using a revised importance-performance analysis approach: The case of Taiwanese hot springs tourism. Tour. Manag. 2007, 28, 1274–1284. [Google Scholar] [CrossRef]
  135. Wilkins, H. Using Importance-Performance Analysis to Appreciate Satisfaction in Hotels. J. Hosp. Mark. Manag. 2010, 19, 866–888. [Google Scholar] [CrossRef] [Green Version]
  136. Jennrich, R.I.; Sampson, P.F. Rotation for simple loadings. Psychometrika 1966, 31, 313–323. [Google Scholar] [CrossRef] [PubMed]
  137. Stevens, J.P. Applied Multivariate Statistics for the Social Sciences; Routledge, Taylor and Francis Group: New York, NY, USA, 2012; ISBN 978-0805859034. [Google Scholar]
  138. Hair, J.F.; Black, W.C.; Babin, B.J.; Anderson, R.E. Multivariate Data Analysis, 7th ed.; Pearson Education Limited: Harlow, UK, 2014; ISBN 9781292021904. [Google Scholar]
  139. Kaiser, H.F. An Index of Factor Simplicy. Psychometrika 1974, 39, 31–36. [Google Scholar] [CrossRef]
  140. Cronbach, L.J. Coefficient Alpha and the Internal Structure of Tests. Psychometrika 1951, 16, 297–334. [Google Scholar] [CrossRef] [Green Version]
  141. Tavakol, M.; Dennick, R. Making sense of Cronbach’s alpha. Int. J. Med. Educ. 2011, 2, 53–55. [Google Scholar] [CrossRef]
  142. Nunnally, J.C. Psychometric theory. McGraw-Hill Ser. Psychol. 1967, 4, 640. [Google Scholar]
  143. Robinson, J.P.; Shaver, P.R.; Wrightsman, L.S. Criteria for scale selection and evaluation. Meas. Personal. Soc. Psychol. Attitudes 1991, 1, 1–16. [Google Scholar] [CrossRef]
  144. Hansen, E.; Bush, R.J. Understanding customer quality requirements: Model and application. Ind. Mark. Manag. 1999, 28, 119–130. [Google Scholar] [CrossRef]
  145. Lee, W.H.; Cheng, C.C. Less is more: A new insight for measuring service quality of green hotels. Int. J. Hosp. Manag. 2018, 68, 32–40. [Google Scholar] [CrossRef]
  146. Verma, V.K.; Chandra, B. Hotel Guest’s Perception and Choice Dynamics for Green Hotel Attribute: A Mix Method Approach. Indian J. Sci. Technol. 2016, 9, 1–9. [Google Scholar] [CrossRef]
  147. Han, H.; Lee, J.S.; Trang, H.L.T.; Kim, W. Water conservation and waste reduction management for increasing guest loyalty and green hotel practices. Int. J. Hosp. Manag. 2018, 75, 58–66. [Google Scholar] [CrossRef]
  148. Yi, S.; Li, X.; Jai, T.M. Hotel guests’ perception of best green practices: A content analysis of online reviews. Tour. Hosp. Res. 2018, 18, 191–202. [Google Scholar] [CrossRef]
  149. Park, J.; Kim, H.J. Environmental proactivity of hotel operations: Antecedents and the moderating effect of ownership type. Int. J. Hosp. Manag. 2014, 37, 1–10. [Google Scholar] [CrossRef]
  150. Wang, J.; Wang, S.; Xue, H.; Wang, Y.; Li, J. Green image and consumers’ word-of-mouth intention in the green hotel industry: The moderating effect of Millennials. J. Clean. Prod. 2018, 181, 426–436. [Google Scholar] [CrossRef]
  151. Oroian, M.; Rațiu, F.R.; Gheres, M. Tourists ’ Perception of the Likely Impact of Implementing Csr Practices in Romanian Hotels. In Proceedings of the International Conference Global Economics and Governance, Bucarest, Romania, 10–12 September 2014. [Google Scholar]
  152. Han, H.; Kim, Y. An investigation of green hotel customers’ decision formation: Developing an extended model of the theory of planned behavior. Int. J. Hosp. Manag. 2010, 29, 659–668. [Google Scholar] [CrossRef]
  153. Bagur-Femenias, L.; Celma, D.; Patau, J. The adoption of environmental practices in small hotels. voluntary or mandatory? An empirical approach. Sustainability 2016, 8, 695. [Google Scholar] [CrossRef] [Green Version]
  154. Gao, Y.L.; Mattila, A.S.; Lee, S. A meta-analysis of behavioral intentions for environment-friendly initiatives in hospitality research. Int. J. Hosp. Manag. 2016, 54, 107–115. [Google Scholar] [CrossRef]
  155. Lee, S.; Heo, C.Y. Corporate social responsibility and customer satisfaction among US publicly traded hotels and restaurants. Int. J. Hosp. Manag. 2009, 28, 635–637. [Google Scholar] [CrossRef]
Figure 1. Three-factor structure of customer satisfaction—(Source: Matzler et al. p. 273.) [10]. Reprinted from Matzler et al. (2004). Copyright © 2003 with permission from Elsevier.
Sustainability 14 03575 g001
Figure 2. Three-factor structure of customer satisfaction—(Source: Matzler et al. p. 272.) [10]. Reprinted from Matzler et al. (2004). Copyright © 2003 with permission from Elsevier.
Sustainability 14 03575 g002
Figure 3. Survey instrument: development process.
Sustainability 14 03575 g003
Figure 4. Scree Plot of PCA.
Sustainability 14 03575 g004
Figure 5. Attributes Importance Grid.
Sustainability 14 03575 g005
Table 1. IPA investigations in tourism and hospitality.
Studies Applying IPA Framework in Tourism Field of Research
FocusArticles
Parks and protected areas[64,65,66,67,68,69,70,71,72,73,74,75,76,77]
Destination[36,57,78,79,80,81,82,83,84,85,86,87]
Meetings and exhibitions[35,88,89,90,91,92,93,94,95]
Tour services and travel agents[96,97,98,99,100,101]
Tourism policy and development[65,102,103,104,105,106]
Tourism Accommodation Sector
Hotels[17,32,35,36,39,107,108,109,110]
Lodging[111,112,113]
Resorts and outdoor activities[114,115,116,117,118]
Table 2. Summary of respondents’ main characteristics and ecolabel awareness.
VariableRangePercentageVariableRangePercentage
GenderFemale30.7%Purpose of travelLeisure72.7%
Male69.3% Business23.3%
Age18–2931.7%Number of nights1–229.2%
30–3935.2% 3–520.1%
40–4923.8% 6–1036.7%
50–598.1% over 1014.0%
over 601.2%Hotel Ecolabel awarenessYes33.5%
Type of travellerSingle16.6% No66.5%
Couple12.0%Hotel Ecolabel awareness before visitYes39.5%
Family48.4% No60.5%
Friends23.0%Other experience in ecolabel hotelYes22.1%
No77.9%
Table 3. PCA results of the performance of hotel attributes.
FactorsEV% Var.ItemHotel Service Attributes PerformanceFLComm.
Factor 1—Tangibles (n = 3) (α = 0.739)1.606.15TANG_1The room is comfortable, adequately furnished and fitted0.6140.68
TANG_2The room is quiet0.8020.71
TANG_3In-room and hotel technologies (Wi-Fi, TV, telephone, wake-up call) are adequate and functional0.7710.70
Factor 2—Staff service quality (n = 7) (α = 0.833)2.379.11STAFF_SERV_1The room is clean0.7290.62
STAFF_SERV_2The communal facilities are comfortable and in good conditions0.4340.51
STAFF_SERV_3The hotel staff is well-trained and prepared0.4920.56
STAFF_SERV_4The hotel staff is kind, careful and polite0.6710.54
STAFF_SERV_5The hotel staff is always available when needed0.7210.54
STAFF_SERV_6The hotel’s reservation system is reliable and efficient0.550.46
STAFF_SERV_7The check-in/check-out procedures are efficient0.6520.49
Factor 3—Food (n = 4) (α = 0.683)1.375.28FOOD_1Service during breakfast is accurate and efficient−0.5470.58
FOOD_2The quality of the food offered for breakfast is adequate−0.7390.70
FOOD_3The choice of food & beverages for breakfast is adequate−0.8430.75
FOOD_4Organic or seasonal food are available for breakfast−0.5960.61
Factor 4—Value for money (n = 2) (α = 0.631)1.013.87VAL_MON_1The quality of hotel service corresponds to the number of stars0.7380.68
VAL_MON_2The prices correspond to the level of services provided0.6190.59
Factor 5—Green (n = 10) (α = 0.931)9.8737.97GREEN_1The hotel cares about sustainability and adopts good practices of environmental management0.4990.60
GREEN_2The hotel implements water and energy saving practices (e.g. new linen only when necessary)0.5560.60
GREEN_3The hotel tries to avoid disposable or single-dose products0.6260.63
GREEN_4In the hotel separated waste collection is available0.4730.50
GREEN_5The hotel informs the guests about the good environmental practices implemented0.8050.69
GREEN_6The hotel provides its guests with information on how they can contribute to reduce the hotel’s environmental impact0.7490.64
GREEN_7The hotel provides its guests with information on the environmental and cultural activities available in the area0.8250.80
GREEN_8The hotel provides information on public transportation0.7670.76
GREEN_9The hotel provides its guests bicycles for free or for rent0.5880.55
GREEN_10The hotel uses environmental certified or green labeled products (toiletry products, paper)0.8250.73
62.38% of cumulative variance explained
Legend: FL: Factor loadings; EV: Eigenvalue; α: Cronbach’s alpha
Table 4. Explicit importance, performance, and implicit importance values of the hotel attributes and dimensions.
Hotel Service AttributesExplicit
Importance
PerformanceImplicit
Importance
MeanStd. Dev.MeanStd. Dev.Kendall’s tau-b
Dimension: Tangibles6.06 5.73
TANG_16.160.765.950.850.307 *
TANG_26.140.975.721.180.277 *
TANG_35.901.195.521.340.232 *
Dimension: Staff and Service Quality6.32 6.27
STAFF_SERV_16.450.646.270.690.302 *
STAFF_SERV_26.190.776.200.750.338 *
STAFF_SERV_36.270.906.200.860.384 *
STAFF_SERV_46.410.746.370.760.236 *
STAFF_SERV_56.430.696.280.720.314 *
STAFF_SERV_66.280.776.300.750.292 *
STAFF_SERV_76.190.786.270.720.322 *
Dimension: Food6.21 6.14
FOOD_16.360.816.330.720.261 *
FOOD_26.410.766.110.920.271 *
FOOD_36.340.766.160.800.253 *
FOOD_45.731.325.951.060.238 *
Dimension: Value for Money6.14 6.13
VAL_MON_16.110.836.140.780.292 *
VAL_MON_26.170.856.110.850.275 *
Dimension: Green5.88 5.98
GREEN_15.960.976.130.790.330 *
GREEN_25.910.956.040.870.257 *
GREEN_35.751.165.860.960.323 *
GREEN_45.991.036.120.920.229 *
GREEN_55.761.125.831.120.333 *
GREEN_65.691.135.761.230.338 *
GREEN_75.941.025.961.180.344 *
GREEN_85.921.085.891.170.312 *
GREEN_96.161.066.351.010.203 *
GREEN_105.701.055.910.950.261 *
* Significance level at 99.9% (p-value < 0.01).
Publisher’s Note: MDPI stays neutral with regard to jurisdictional claims in published maps and institutional affiliations.

