
Decoupling Regional Economic Growth from Industrial CO2 Emissions: Empirical Evidence from the 13 Prefecture-Level Cities in Jiangsu Province

1
School of Economics and Finance, Huaqiao University, Quanzhou 362021, China
2
Business School, Hunan Agricultural University, Changsha 410125, China
3
Xiamen National Accounting Institute, Xiamen 361005, China
*
Author to whom correspondence should be addressed.
Sustainability 2022, 14(5), 2733; https://doi.org/10.3390/su14052733
Submission received: 24 January 2022
/
Revised: 18 February 2022
/
Accepted: 22 February 2022
/
Published: 25 February 2022
(This article belongs to the Topic Climate Change and Environmental Sustainability)
Abstract
:Amid global climate warming, it is necessary to explore the decoupling relationship between economic growth (EG) and industrial CO2 emissions (ICEs). This paper uses the Tapio decoupling model and the logarithmic mean Divisia index (LMDI) model synthetically to analyze the decoupling relationship between EG and ICEs and reveal the driving force of growth of CO2 emissions (CEs) based on ICE panel data from 13 prefecture-level cities in Jiangsu province from 2011 to 2015. From the research results, it can be seen that the decoupling status in southern Jiangsu, middle Jiangsu and northern Jiangsu presented weak decoupling (WD), weak negative decoupling (WND) and WD, respectively. In 2011–2013, seven prefecture-level cities exhibited states of WD, and strong decoupling (SD) occurred only in Zhenjiang, with a decoupling index value of −0.3359. In 2013–2015, five prefecture-level cities exhibited states of WD. The energy intensity and carbon emission intensity had negative inhibitory effects on ICEs, and economic development and the energy structure had positive promotion effects on ICEs. The research results have important theoretical and practical significance for future energy savings, carbon emissions reductions and the realization of a low-carbon economy in the economic development of Jiangsu.
1. Introduction
With the aggravation of global warming, carbon emissions are drawing more and more public attention, and how to deal with climate change has become a major global concern. At present, China is in a period of rapid economic growth (EG), and the conflict between EG and environmental conservation in China has become obvious. According to statistics from the United Nations’ World Energy Statistics Report, after becoming the world’s largest carbon emitter in 2006, China’s CO2 emissions (CEs) have grown rapidly each year, reaching 9.145 billion tons in 2015, accounting for 28.20% of global CEs [1]. As the world’s largest energy consumer and CO2 emitter, the economic development model of China has attracted attention from the international community, resulting in considerable pressure to reduce emissions in China. The Chinese government has proposed clear measures to reduce carbon emission intensity by 40–45% by 2020 compared with the 2005 level at the world climate conference in Copenhagen, and included energy conservation and emission reduction in their development strategy during the period of the 12th Five-Year Plan.
The ravages of COVID-19 have especially heightened humanity’s reverence for nature and life. As the leader of a responsible major country, President Xi Jinping announced to the world the goal of achieving carbon peak by 2030 and being carbon neutral by 2060 in the 75th session of the United Nations General Assembly. However, as the largest developing country in the world, minimizing energy consumption and CEs while promoting EG has become the core issue for current and future sustainable development in China. Therefore, in the context of vigorously developing a low-carbon economy, it is of great significance to discuss how to decouple energy consumption, CEs and EG. To explore this topic, this paper chooses Jiangsu as a case study.
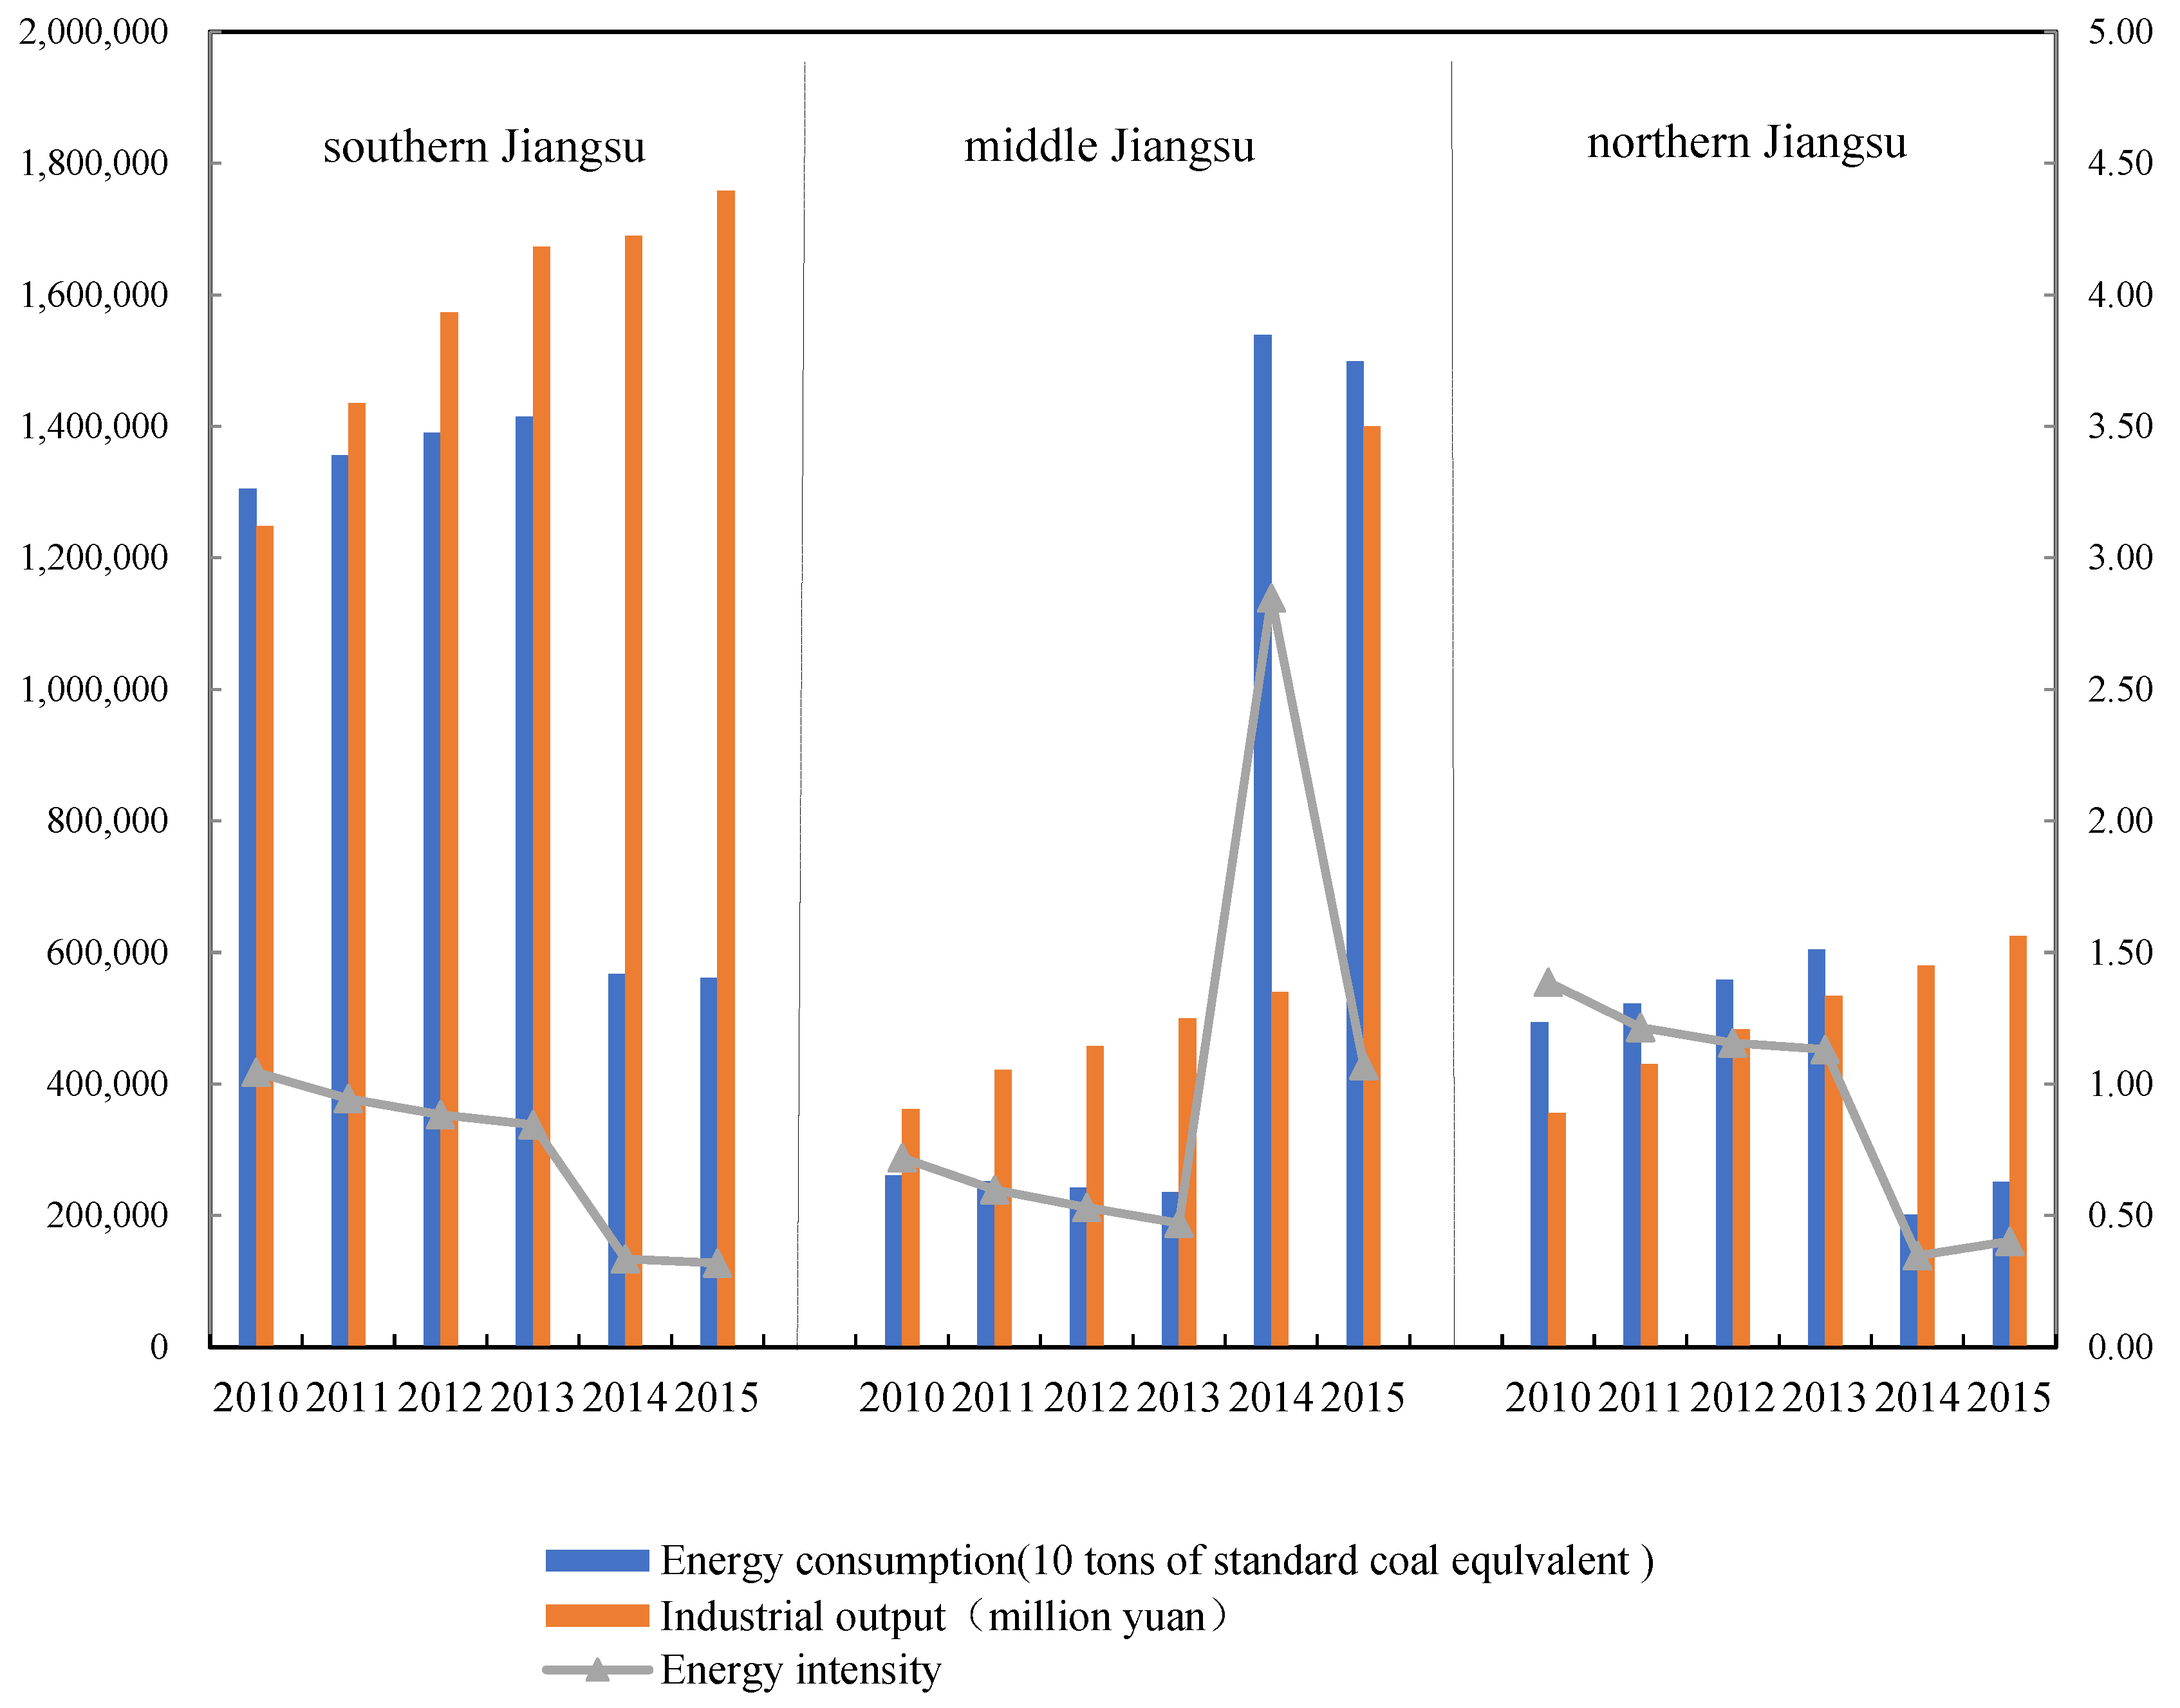
Jiangsu is located in the economically developed area of the Yangtze River Delta and encompasses 13 prefecture-level cities in three regions. Jiangsu is the only province in which all prefecture-level cities are ranked among the top 100 largest cities in China. In addition, the industrial scale of Jiangsu Province has also been the largest in China for eight consecutive years. However, with the rapid development of the economy and industry, “large energy consumption, weak environmental bearing capacity and high pollutant emission intensity” has become the basic provincial situation in Jiangsu. According to the Jiangsu Statistical Yearbook [2], Jiangsu’s industrial output and energy consumption increased from 1.86 billion yuan and 171.67 million tons of standard coal in 2005 to 7.31 billion yuan and 302.35 million tons of standard coal in 2015, up 291.56 and 76.12%, respectively. The energy intensity in southern Jiangsu and northern Jiangsu has displayed a declining trend (shown in Figure 1).
Furthermore, as an economically developed province, Jiangsu Province has a wide range of economic development levels and serious regional imbalances. The economic development levels of southern Jiangsu, middle Jiangsu, and northern Jiangsu have gradually decreased, exhibiting a stepwise distribution. Specifically, the average annual industrial output growth rates in southern Jiangsu, middle Jiangsu and northern Jiangsu from 2011 to 2015 were 12.64, 14.18 and 14.78%, respectively. Consistent with the imbalance among regional economic conditions, the regional industrial CO2 emission (ICEs) pattern in Jiangsu is also southern Jiangsu > middle Jiangsu > northern Jiangsu, with significant regional differences. Additionally, the rapid EG of Jiangsu has been accompanied by a huge increase in ICEs.
Thus, this paper selects 13 prefecture-level cities in Jiangsu Province as research objects to try to answer the following questions. What are the real relations among energy consumption, ICEs and economic development in Jiangsu? In terms of these relationships, are there any differences among regions with different economic development levels in Jiangsu? What is the real driving force of ICEs? Therefore, based on panel data of economic development and energy consumption in Jiangsu, this paper discusses the relationships among energy consumption, ICEs and EG from regional and urban perspectives. The answers to these questions have an important theoretical and practical significance for future energy savings, carbon emissions reductions and the realization of a low-carbon economy in the economic development of Jiangsu. Moreover, Jiangsu is the one of the most important industrial provinces in China, and relevant research conclusions about how to balance economic development and environmental protection for Jiangsu can provide a reference for China and even some other countries.
2. Literature Review
Determining whether there is a special relationship between ICEs and EG has long been the focus of academic and government policy concerns. The Organization for Economic Cooperation and Development (OECD) first used “decoupling” to describe the link between EG and resource consumption or environmental pollution [3]. Determining how to decouple EG from energy consumption without damaging the rate and quality of EG has become a focus of scholars. Decoupling theory, as a new theoretical approach for studying the relationship between economic development and CEs, has been widely used in different fields, especially for energy conservation and emission reductions.
At present, scholars have studied the decoupling relationship between energy conservation and emission reductions at the national [4,5,6,7,8,9], regional [10,11,12,13], municipal [14,15] and industrial levels [12,16,17,18,19]. For example, Tapio studied the decoupling of EG in transportation and greenhouse gases in Europe between 1970 and 2001 [20]. Diakoulaki and Mandaraka found that the output effect and energy intensity were the main factors that influenced the growth of CEs in the EU manufacturing sector from 1990 to 2003 [21]. De Freitas et al. discussed the decoupling of Brazil’s economic development and ICEs and found that carbon intensity and energy structure were the most critical factors related to CE reductions [22]. Zhang and Wang studied the relationship between CEs and EG in Jiangsu Province, and the results showed that EG played a positive role in promoting CEs [23]. Wang and Yang studied the impact of EG on CEs in Beijing-Tianjin-Hebei based on the Tapio decoupling model [15]. Zhang and Da found that energy intensity was the main factor that influenced the decoupling relationship between energy-based CEs and EG in China [24]. Taking Jiangsu Province as an example, Lu et al. discussed the correlations among EG, energy consumption and CEs in various industrial sectors [25]. Chen et al. compared the decoupling relationship between EG and CEs in OECD countries [26]. Wang et al. performed a comparative analysis of the decoupling relationship between CEs and EG in China and the United States [27]. Wang and Feng adopted the logarithmic mean Divisia index (LMDI) to study the main factors that influence energy consumption from the perspective of the nonferrous metal industry in China [28]. Shuai et al. analysed the decoupling relationship between EG and energy CEs for 133 countries based on decoupling theory [29].
Identifying the driving factors of CEs is an important prerequisite for formulating carbon emission reduction policies and addressing climate change. Existing studies have mainly adopted the index decomposition method (IDA) and structure decomposition method (SDA) to study the factors that affect CEs [13,19,28,30,31,32,33]. Most studies analysed these factors from the perspectives of industrial structure, energy consumption structure and scientific and technological progress [34,35,36,37,38,39]. After analysing the annual CE growth in Taiwan, Germany, Japan and South Korea, Lu et al. found that EG and vehicle ownership were the main factors that influenced the growth of CEs [40]. Tan et al. analysed changes in the CEs intensity in China and found that the electric power industry played a key role in CEs [41]. Moutinho et al. performed a comparative analysis of CEs from four regions in Europe and showed that the energy structure was the decisive factor that affected changes in European CEs [42]. Cansino et al. studied the factors that influence CEs in Spain, and the results showed that the energy intensity was the most important factor related to reducing CEs, and EG caused an increase in CEs [43]. Mousavi et al. adopted LMDI to explore the effects of the energy intensity and consumption structure on CEs in Iran [44]. Based on decoupling theory, Wang and Feng adopted the LMDI method to analyse CEs from regional and provincial perspectives and concluded that the economic output and population were the main factors that influenced CEs and that the energy structure played a significant role in reducing CEs [28].
In summary, various studies of the relationship between economic development and CEs have used decoupling methods, and the LMDI method has been widely accepted in academic circles for studying the driving factors of CEs at the microlevel. However, the literature has mainly focused on the national, regional and industrial levels, and few scholars have studied the decoupling relationship between EG and CEs in different regions at the provincial level. In the current research on the driving factors of CEs, most of the studies were performed at the national level, ignoring differences in provincial areas. This paper adopts the Tapio decoupling elastic index to analyse the decoupling relationship between CEs and EG in three regions (southern Jiangsu, middle Jiangsu and northern Jiangsu) and 13 prefecture-level cities in Jiangsu and then uses LMDI to analyse the driving factors of CEs in different regions and prefectures of Jiangsu during the 12th Five-Year Plan period. (The 12th Five-Year period was a key stage for Jiangsu Province to promote green manufacturing and change the economic development mode.) The results provide a reference for Jiangsu to formulate differentiated low-carbon development policies for different regions and specific industries and a theoretical reference for achieving both EG and energy-saving emission reductions in a win–win scenario.
3. Methodology and Data Sources
In order to explain the methods and data which are used in this paper better, the estimation of ICEs, the Tapio decoupling model, the LMDI model and the data sources are introduced in turn in the section. Among them, the Tapio decoupling model is a mature method for conducting decoupling analysis of EG and ICEs and the LMDI model is a widely used method to decompose the driving factors of ICEs.
3.1. Estimation of ICEs
In this paper, the prefecture-level ICEs are calculated based on a method given by the IPCC [43]. The calculation is as follows:
where represents the total ICEs in year t; represents the total amount of energy consumption based on the ith fuel in year t; , as obtained from the IPCC [45], is the carbon emission standard factor of the ith fuel; represents the calorific value of energy in China, which can be found directly in the China Energy Statistical Yearbook [46]; and represents a constant conversion factor between different units of energy.
3.2. Tapio Decoupling Model
At present, two main indicators are widely used to study decoupling: the OECD decoupling model and the Tapio decoupling model. The OECD decoupling model mainly describes the relationship between environmental pressure and driving force changes. Taking carbon dioxide emissions as an example, the GDP is the driving force of the economy, and carbon dioxide emissions are the environmental pressure [3]. If the growth rate of carbon dioxide emissions is faster than the growth rate of the GDP, the two will display a decoupling relationship. Tapio further developed OECD decoupling theory by introducing the transport volume as an intermediate variable in studies of the relationship between European economic development and carbon dioxide emissions and divided the decoupling elasticity index into the decoupling elasticity between the transport volume and GDP and the decoupling elasticity between the transport volume and overall carbon dioxide emissions [20]. By contrast, the Tapio decoupling model focuses on the analysis of individual years, is not affected by changes in statistical dimensions and can be compared between different years, thus avoiding the arbitrariness of the OECD decoupling model regarding the selection of the basis period. In addition, Tapio decoupling provides a finer division of decoupling than the OECD model. Following Wang and Feng [17,28] this paper adopted the Tapio decoupling elasticity index method to analyse the decoupling state of ICEs and EG in Jiangsu.
The decoupling elasticity index between ICEs and economic development based on the GDP is shown in Equation (2):
where and represent the changes in ICEs and the GDP in a specific period of time, respectively. The decoupling indicators of the Tapio decoupling model [20] can be divided into eight grades (shown in Table 1).
3.3. LMDI Model
The ICEs in year t can be expressed by Equation (3):
where i and j represent the municipal and energy categories, respectively; represents the ICEs generated by the jth energy category in the ith city in year t; = represents the carbon emission intensity of the jth energy category in the ith city in year t; = represents the energy structure of the ith city in year t; = represents the energy intensity of the ith city in year t, reflecting the utilization efficiency of energy; and = represents the proportion of the industrial output of the ith city in the total industrial GDP in year t.
According to the additive form of the LMDI model, the change in ICEs () can be decomposed into five factors: the carbon emission intensity effect (), energy structure effect (), energy intensity effect (), industrial structure effect () and economic development effect (). This model can be expressed as shown in Equation (4):
The five driving factors can also be expressed by the following Equations (5)–(9):
In connection with Equations (2) and (4), the decoupling elasticity of ICEs and the GDP can also be decomposed into the form shown in Equation (10):
where and represent the elasticity of the carbon emission intensity, energy structure, energy intensity, industrial structure and economic development, respectively, and the decoupling elasticity of ICEs and EG is the sum of these five driving factors.
3.4. Data Sources
The data used in this paper mainly include the industrial output and energy consumption data of the 13 prefecture-level cities in Jiangsu Province from 2011 to 2015. Specifically, the industrial output of Jiangsu and the 13 prefecture-level cities is measured by the industrial GDP, which is converted at 2011 constant prices to remove the effects of price changes and inflation. The data above comes from the Jiangsu Statistical Yearbook and the China Industrial Statistical Yearbook [2,47]. Moreover, the energy consumption data are derived from the Jiangsu Statistical Yearbook, China Energy Statistical Yearbook, and EPS database [2,46]. Based on these data, the final industrial energy consumption is determined for five energy categories, namely, coal, oil, natural gas, heat and electricity, and converted into standard coal consumption. The data for ICEs are calculated through the method given by the IPCC [45].
4. Results and Discussions
Based on the research methods above, this section analyses and discusses the results of the study.
4.1. Situation Analysis of ICEs in Jiangsu
4.1.1. Situation Analysis of ICEs in Southern Jiangsu, Middle Jiangsu and Northern Jiangsu
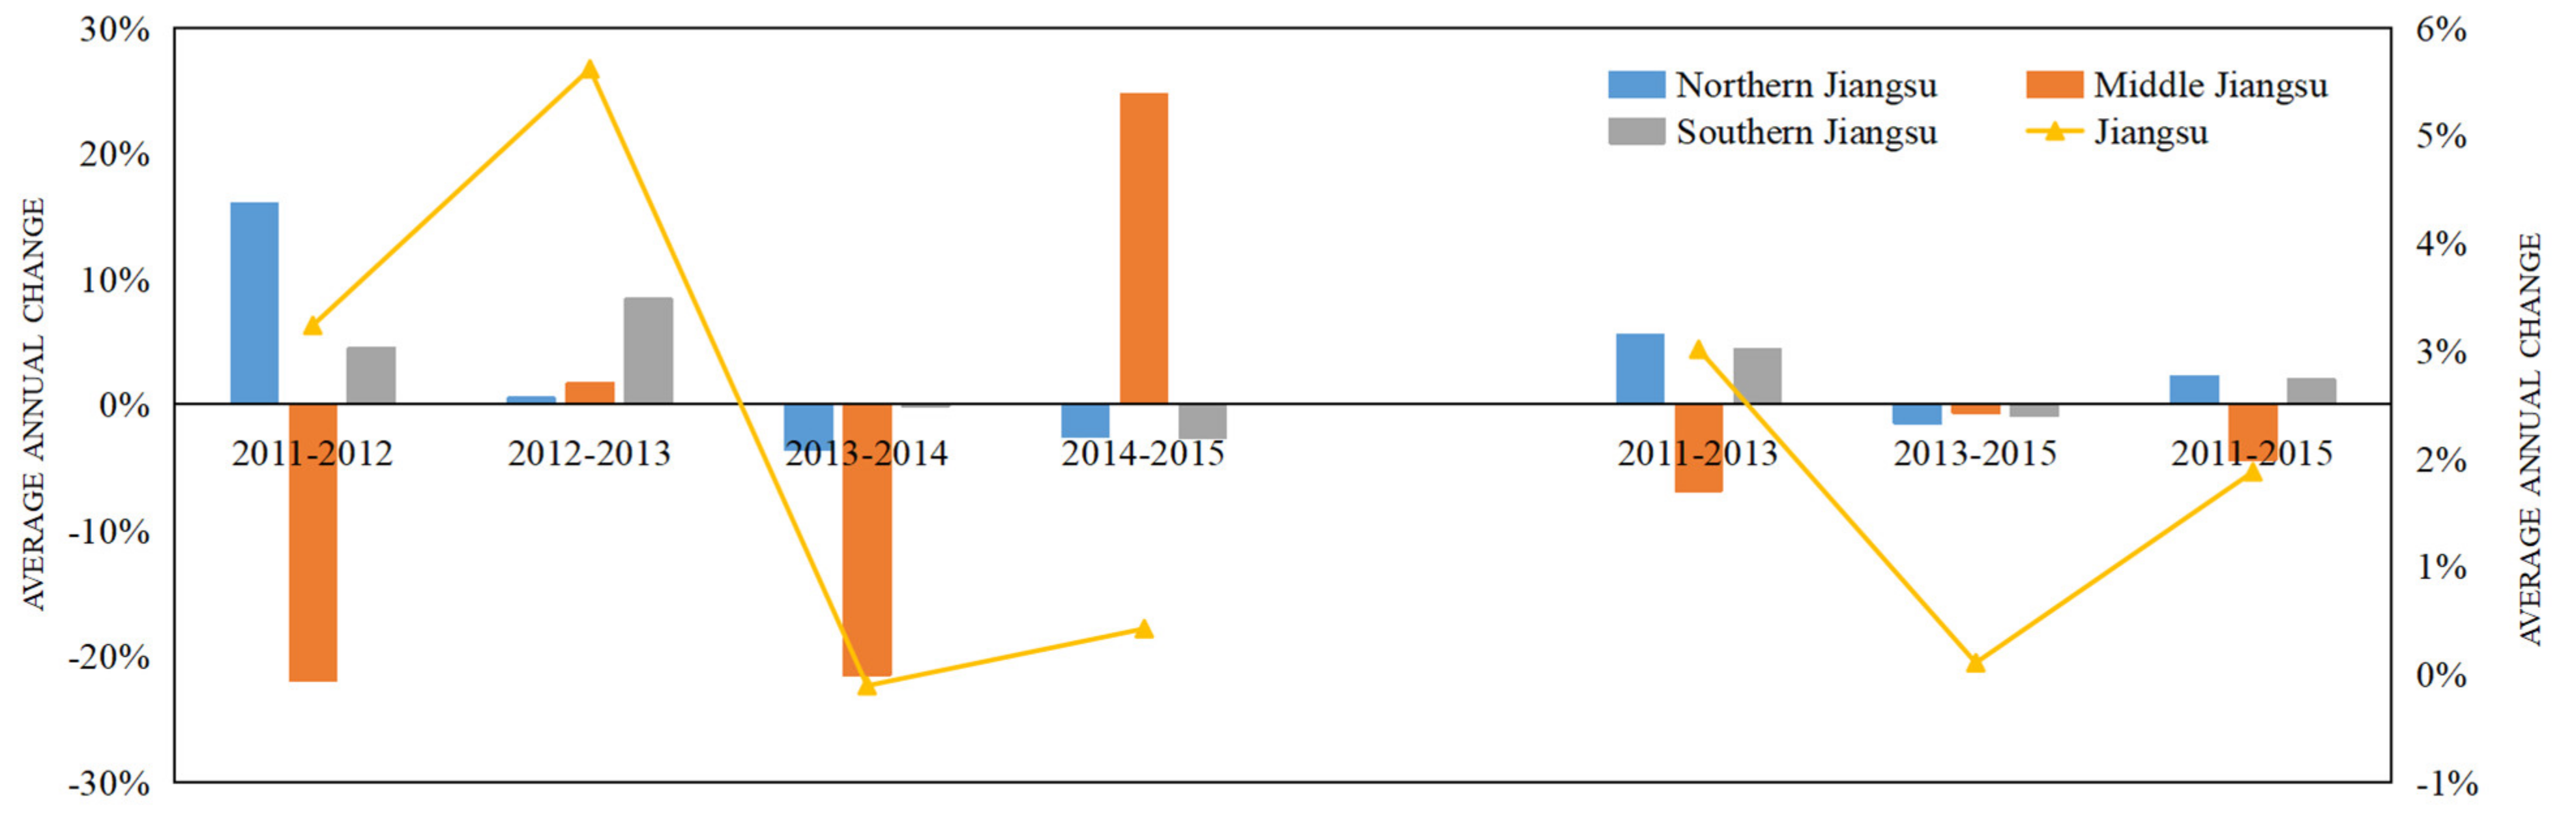
In consideration of the fact that the economic development levels of different regions in Jiangsu are different, this paper divides Jiangsu Province into three regions (southern Jiangsu, middle Jiangsu and northern Jiangsu) and analyses the ICEs of each one separately. Generally, ICEs in Jiangsu increased each year, with an average rate of growth of 1.87% during the 12th Five-Year Plan period (shown in Figure 2). Specifically, the ICEs of northern Jiangsu and southern Jiangsu showed positive growth, with average annual growth rates of 2.24 and 2.01%, respectively, while the ICEs of middle Jiangsu showed negative growth, with an average annual growth rate of −4.46%. These data show that the phenomenon of high emission still exists in northern Jiangsu and southern Jiangsu, but the emission reduction work in middle Jiangsu has achieved remarkable results.
In addition, although the ICEs in Jiangsu province increased every year from 2011 to 2015 with an average rate 2.35%, it is worth noting that the growth rates of ICEs in 2013–2014 and 2014–2015 were only 0.11 and 0.42%, respectively. In terms of region, the ICEs in southern Jiangsu and northern Jiangsu both showed positive growth from 2011 to 2013, with average annual growth rates of 4.43 and 5.53%, respectively, while the ICEs in middle Jiangsu showed negative growth, with an average annual growth rate of −6.87%. Furthermore, the ICEs in southern Jiangsu, middle Jiangsu and northern Jiangsu all showed negative growth, with average annual growth rates of −1.55, −0.70, and −0.94%, respectively, from 2013 to 2015.
Overall, the growth trend of ICEs in middle Jiangsu displayed alternating peaks and troughs, with growth rates of −21.93% from 2011 to 2012 and −21.51% from 2013 to 2014; the regional growth rate from 2014 to 2015 was the highest, with an average annual growth rate of 24.74%. The growth rates of ICEs in southern Jiangsu and northern Jiangsu showed the opposite trend, reaching peaks in 2012–2013 and 2011–2012, respectively. The ICEs in Jiangsu showed a downward trend, but the decline was extremely small. Moreover, there are different carbon reduction effects in the different regions in Jiangsu Province. Overall, the reduction in ICEs indicates that some reductions were made during the 12th Five-Year Plan period in Jiangsu, but the extent of the reduction in ICEs shows that the results are not satisfactory.
4.1.2. Situation Analysis of ICEs in 13 Prefecture-Level Cities in Jiangsu
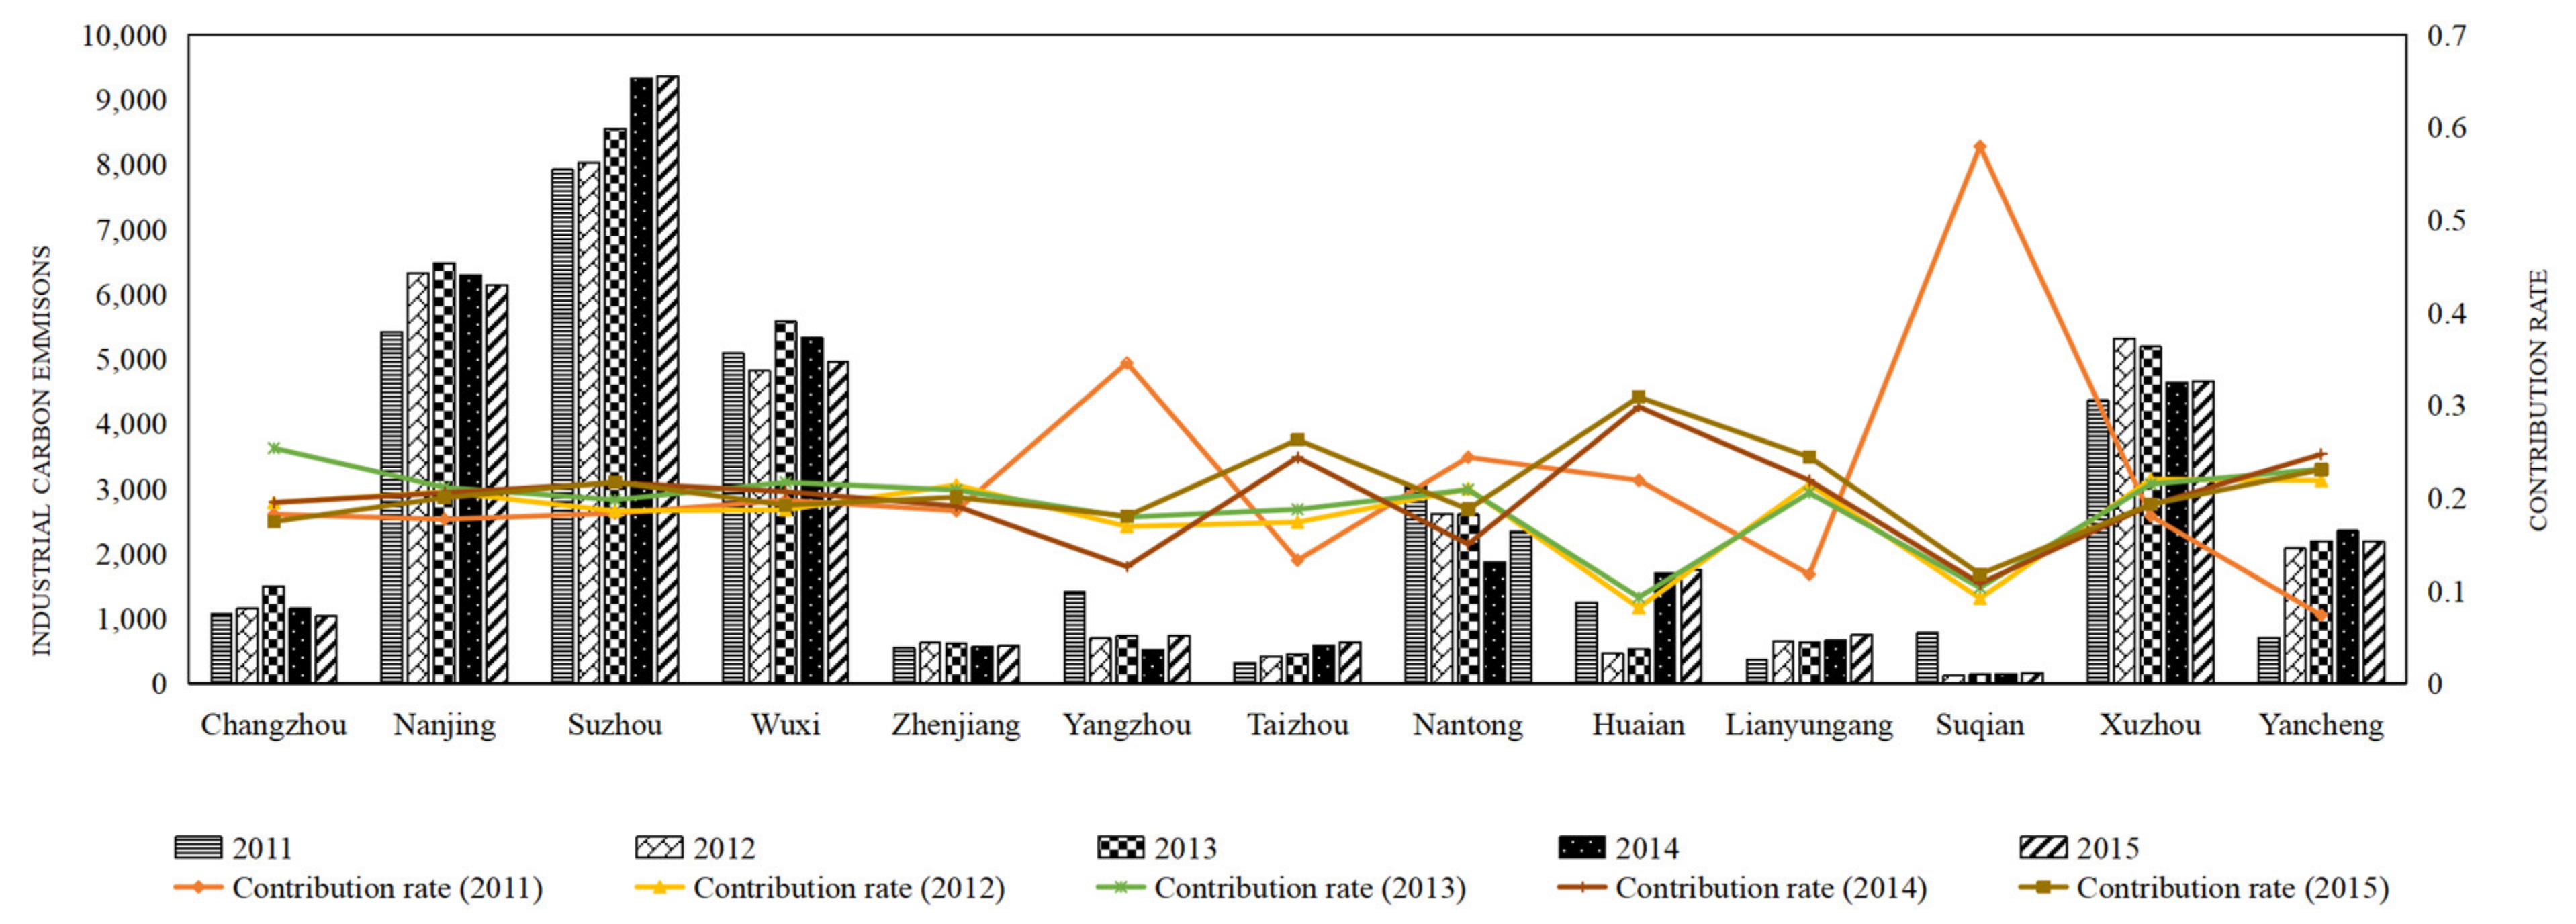
In order to explore the reason for the differences in ICEs in different regions, this paper analyses the ICEs further from the prefecture-level city level. As shown in Figure 3, during the 12th Five-Year Plan period, ICEs were generally characterized by high levels in southern Jiangsu and low levels in northern Jiangsu. The highest value of ICEs occurred in Suzhou in southern Jiangsu. In 2011, ICEs reached 44.74 million tons of standard coal. The next-highest total was observed in Nanjing, which is the provincial capital of Jiangsu, with ICEs reaching 43.29 million tons of standard coal. The ICEs in Xuzhou in northern Jiangsu reached 32.74 million tons of standard coal, ranking third. Suqian in northern Jiangsu had the lowest ICEs, with a value of 1.06 million tons of standard coal [2]. The ICEs of cities in 2015 were slightly different compared to those in 2011, and the results clearly suggest that Nanjing, Suzhou, Xuzhou and Wuxi are high-emission areas. Moreover, the contributions of ICEs in southern Jiangsu (Changzhou, Nanjing, Suzhou, Wuxi and Zhenjiang) remained basically stable, fluctuating between 18 and 22%, while those of ICEs in middle Jiangsu (Yangzhou, Taizhou and Nantong) and northern Jiangsu (Huai’an, Lianyungang, Suqian, Xuzhou and Yancheng) fluctuated considerably.
Specifically, Suzhou had the highest ICEs during the 12th Five-Year Plan period, and Suqian had the lowest. The ICEs of Taizhou and Suzhou showed a steady upward trend from 2011 to 2015, while those of Changzhou and Nanjing showed a trend of first increasing and then decreasing. Furthermore, the ICEs in Suqian, Yangzhou and Huai’an decreased significantly after 2011, with decreases of 84.16, 51.06 and 62.7%, respectively. From the regional perspective, southern Jiangsu had the highest proportion of ICEs during the 12th Five-Year Plan period; the proportions of ICEs in middle Jiangsu and northern Jiangsu showed increasing trends, and the gap between the three regions gradually narrowed.
4.2. Decoupling Analysis of EG and ICEs
4.2.1. Decoupling Analysis of EG and ICEs in Jiangsu at the Region Level
Overall, the ICEs displayed expansive negative decoupling with EG in Jiangsu during the 12th Five-Year Plan period (shown in Table 2). The percentage changes in the GDP and ICEs were 3.24 and −0.005%, respectively, indicating that the growth rate of economic development was lower than that of ICEs and that the EG in Jiangsu at this stage still occurred at the cost of substantial energy consumption and ICEs. The decoupling states of northern Jiangsu and southern Jiangsu from 2011 to 2015 both represented weak decoupling (WD), and the decoupling indexes were 0.027 and 0.082, respectively. The percentage changes in the GDP and ICEs in northern Jiangsu were 17.08 and 0.457%, respectively, and those in southern Jiangsu were 1.12 and 0.092%, respectively, indicating that the growth rate of ICEs was less than that of EG and that energy conservation and emission reductions in northern Jiangsu and southern Jiangsu achieved certain results during the 12th Five-Year Plan period. The decoupling state of middle Jiangsu was weak negative decoupling (WND), and the decoupling index was 0.438. The percentage changes in the GDP and ICEs in middle Jiangsu were −2.67 and −1.169%, respectively, indicating that the government in middle Jiangsu should attach great importance to the environmental pollution caused by energy consumption.
Furthermore, the EG in Jiangsu from 2011 to 2013 reflected WD (shown in Table 2), with a decoupling index of −0.5506, and the percentage changes in the GDP and ICEs were 11.41 and 0.0015%, respectively, which demonstrates that the speed of EG was faster than the ICEs and that the energy conservation and emission reduction measured achieved initial results. ICEs displayed strong negative decoupling with EG in southern Jiangsu, with a decoupling index of −0.4422. The percentage changes in the GDP and ICEs were −0.62 and 0.273%, respectively. WD occurred in northern Jiangsu, and SD occurred in middle Jiangsu, with decoupling indexes of 0.0567 and −0.1639, respectively. The percentage changes in GDP in northern Jiangsu and middle Jiangsu were 64.91 and 5.36%, respectively, and those in ICEs in northern Jiangsu and middle Jiangsu were 3.68 and −0.878%, respectively, indicating that although the degree of decoupling between northern Jiangsu and middle Jiangsu was still relatively low, the growth rate of EG exceeded that of ICEs from 2011 to 2013. WND occurred in both middle Jiangsu and northern Jiangsu from 2013 to 2015 (shown in Table 2), with decoupling indexes of 0.0483 and 0.0891, respectively. SD occurred in southern Jiangsu, and the decoupling index was −0.0912.
According to the results above, there are large spatial differences in the decoupling elasticity of EG and ICEs in Jiangsu. For example, not only the continuous economic development, but also the ecological environment in southern Jiangsu has improved, thus realizing a win–win situation in EG and environmental protection. However, economic development in northern Jiangsu and middle Jiangsu still occurred at the cost of the environment to some extent. Therefore, northern Jiangsu and middle Jiangsu should accelerate industrial transformation, strengthen regional coordination and cooperation, and improve the imbalance of regional development.
4.2.2. Decoupling Analysis of EG and ICEs at the Prefecture City Level
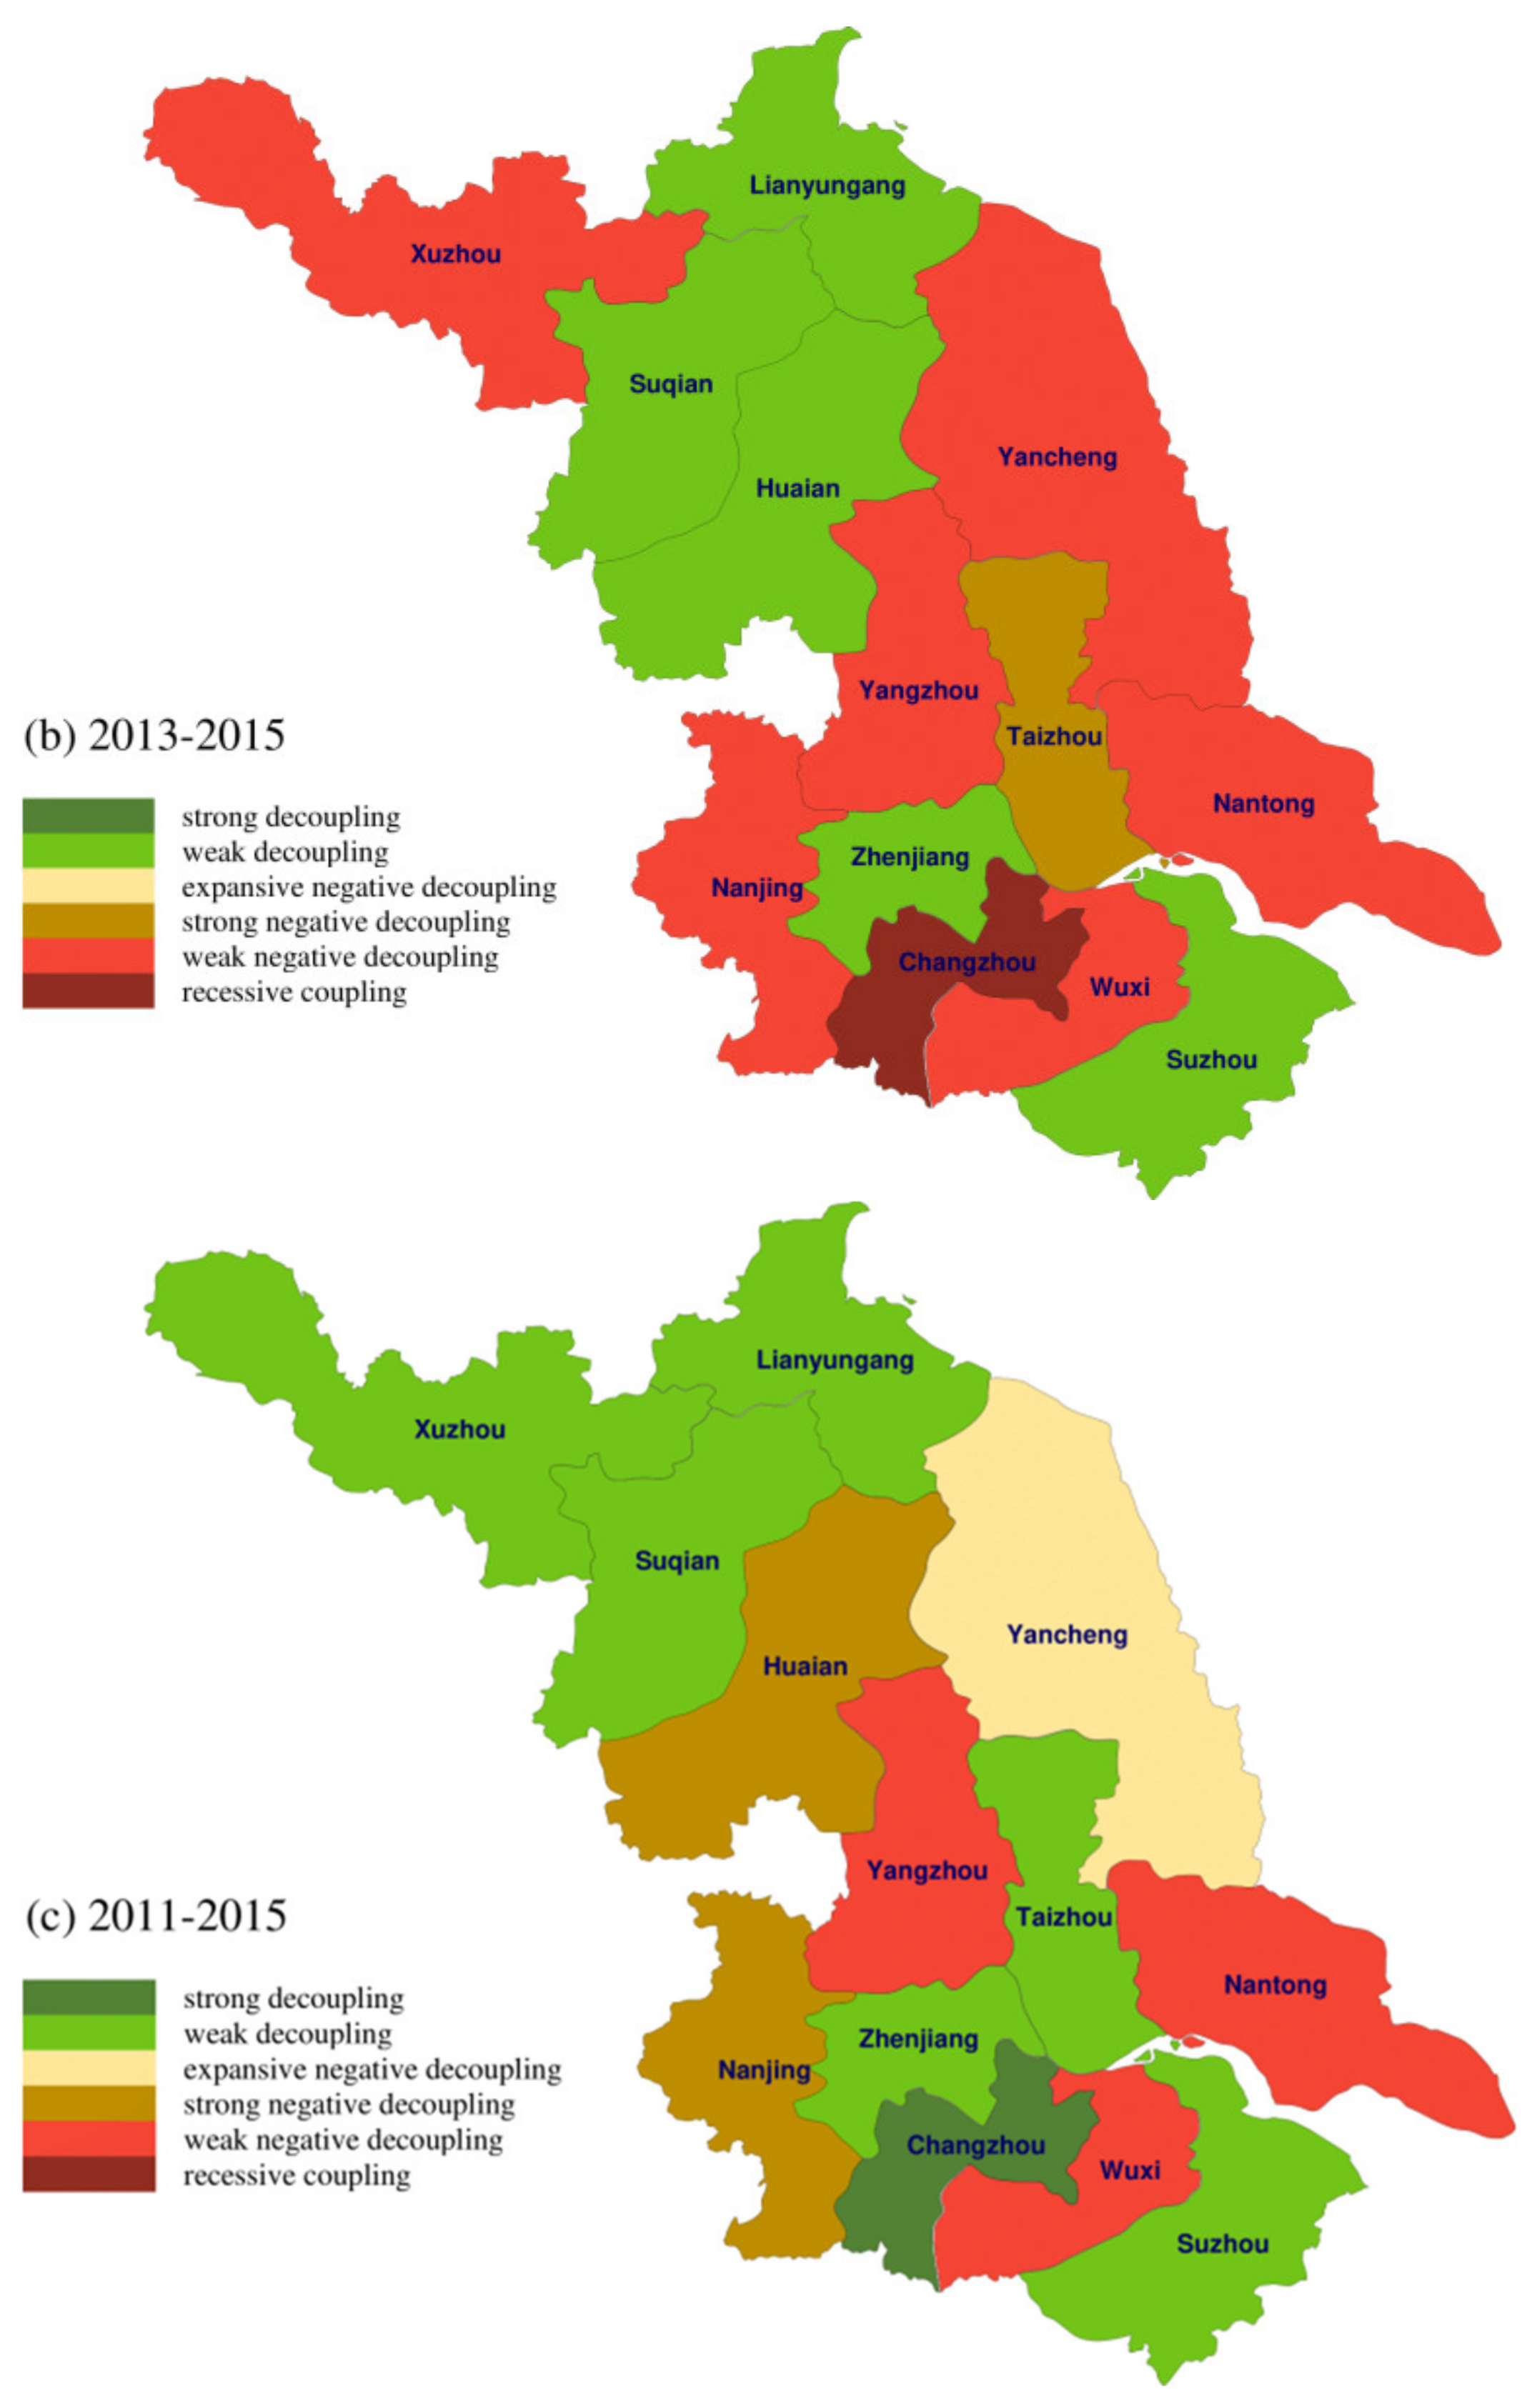
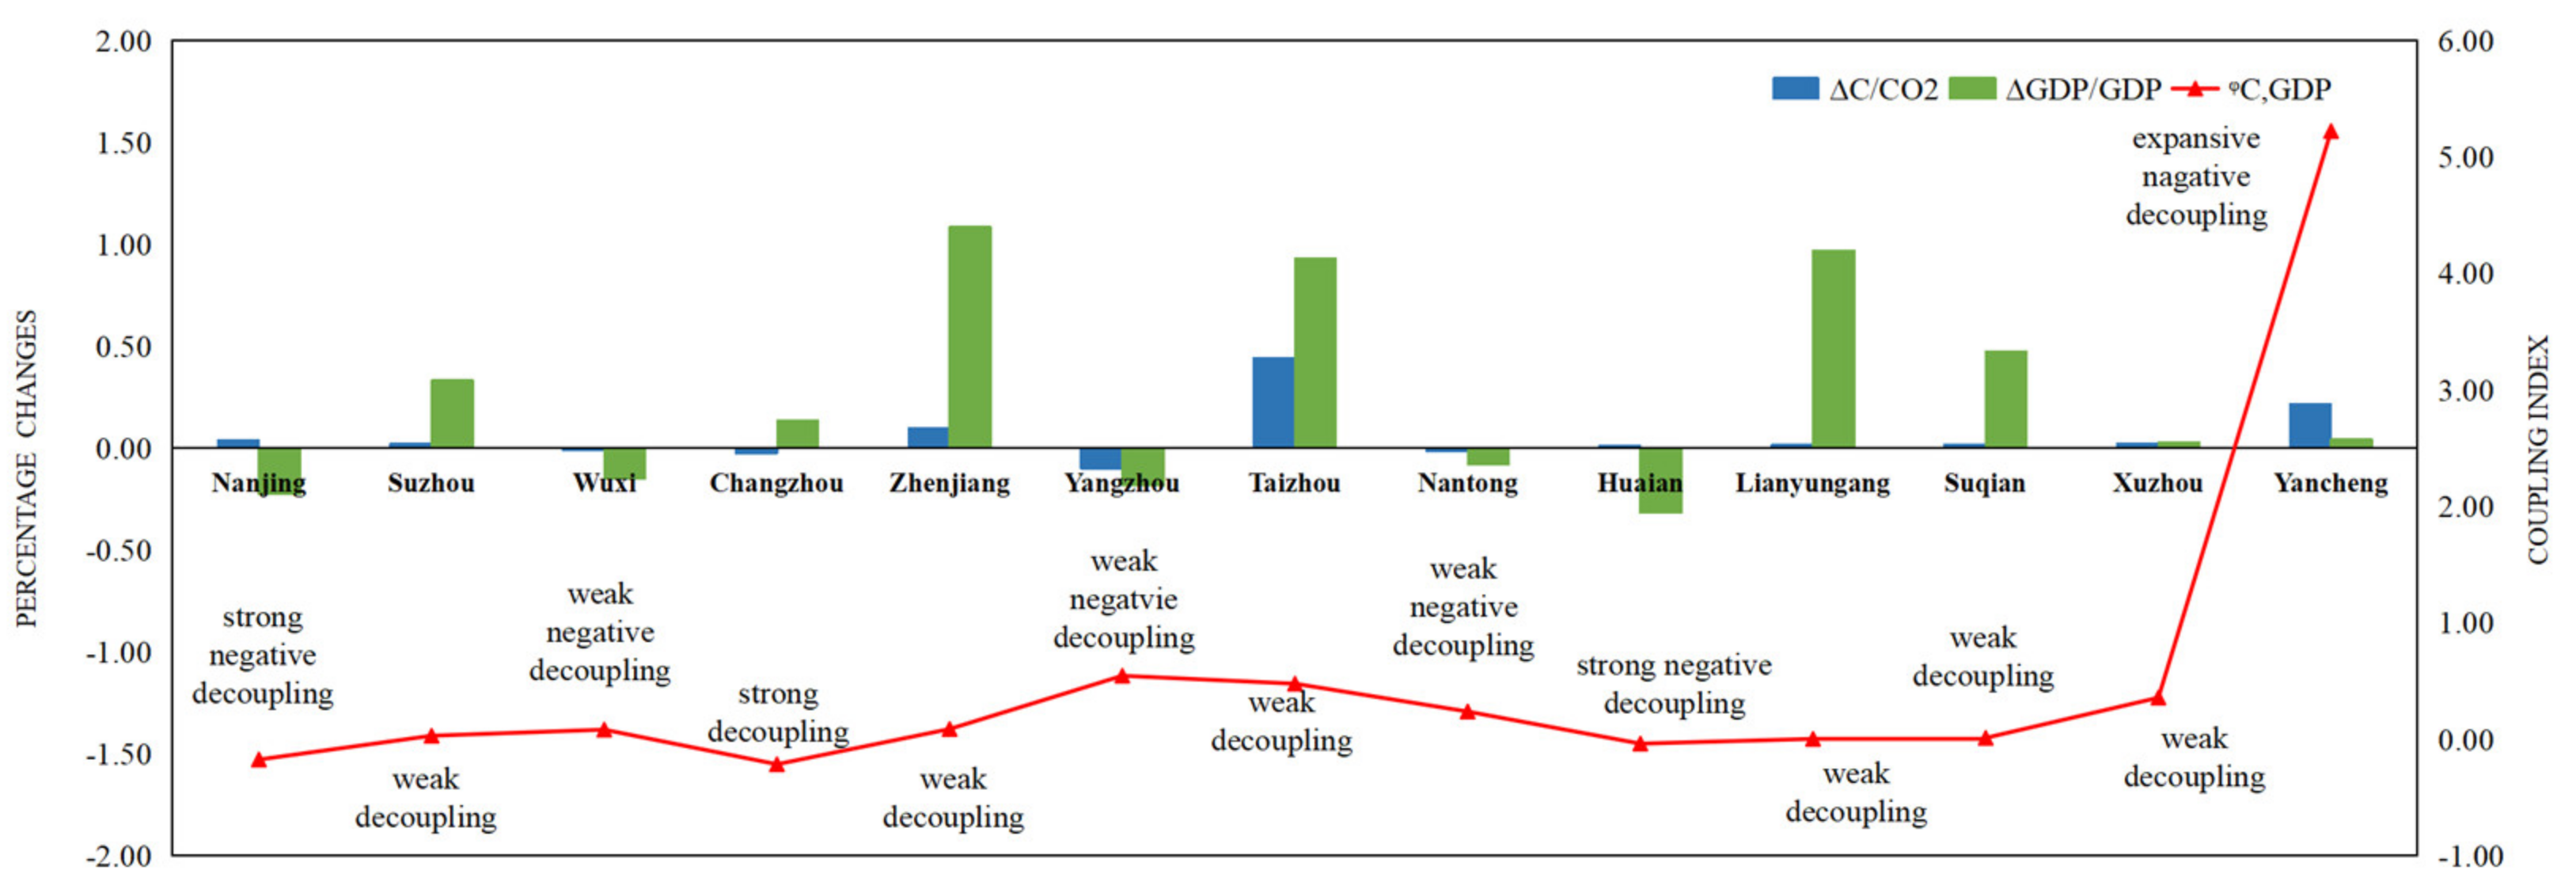
In order to explore the relationship between EG and ICEs further in Jiangsu, this section conducts a decoupling analysis from the perspective of prefecture-level cities. The results in Figure 4c and Figure 5 show that the ICEs of Suzhou, Zhenjiang, Taizhou, Lianyungang, Suqian and Xuzhou displayed WD with EG during the 12th Five-Year Plan period. Nanjing and Huai’an were in states of strong negative decoupling, with decoupling indexes of −0.175 and −0.038, while Wuxi, Yangzhou and Nantong were in states of WND, with decoupling indexes of 0.082, 0.545, and 0.237, respectively. Furthermore, expansive negative decoupling occurred in Yancheng, with a decoupling index of 5.219, and SD occurred in Changzhou, with a decoupling index of −0.215.
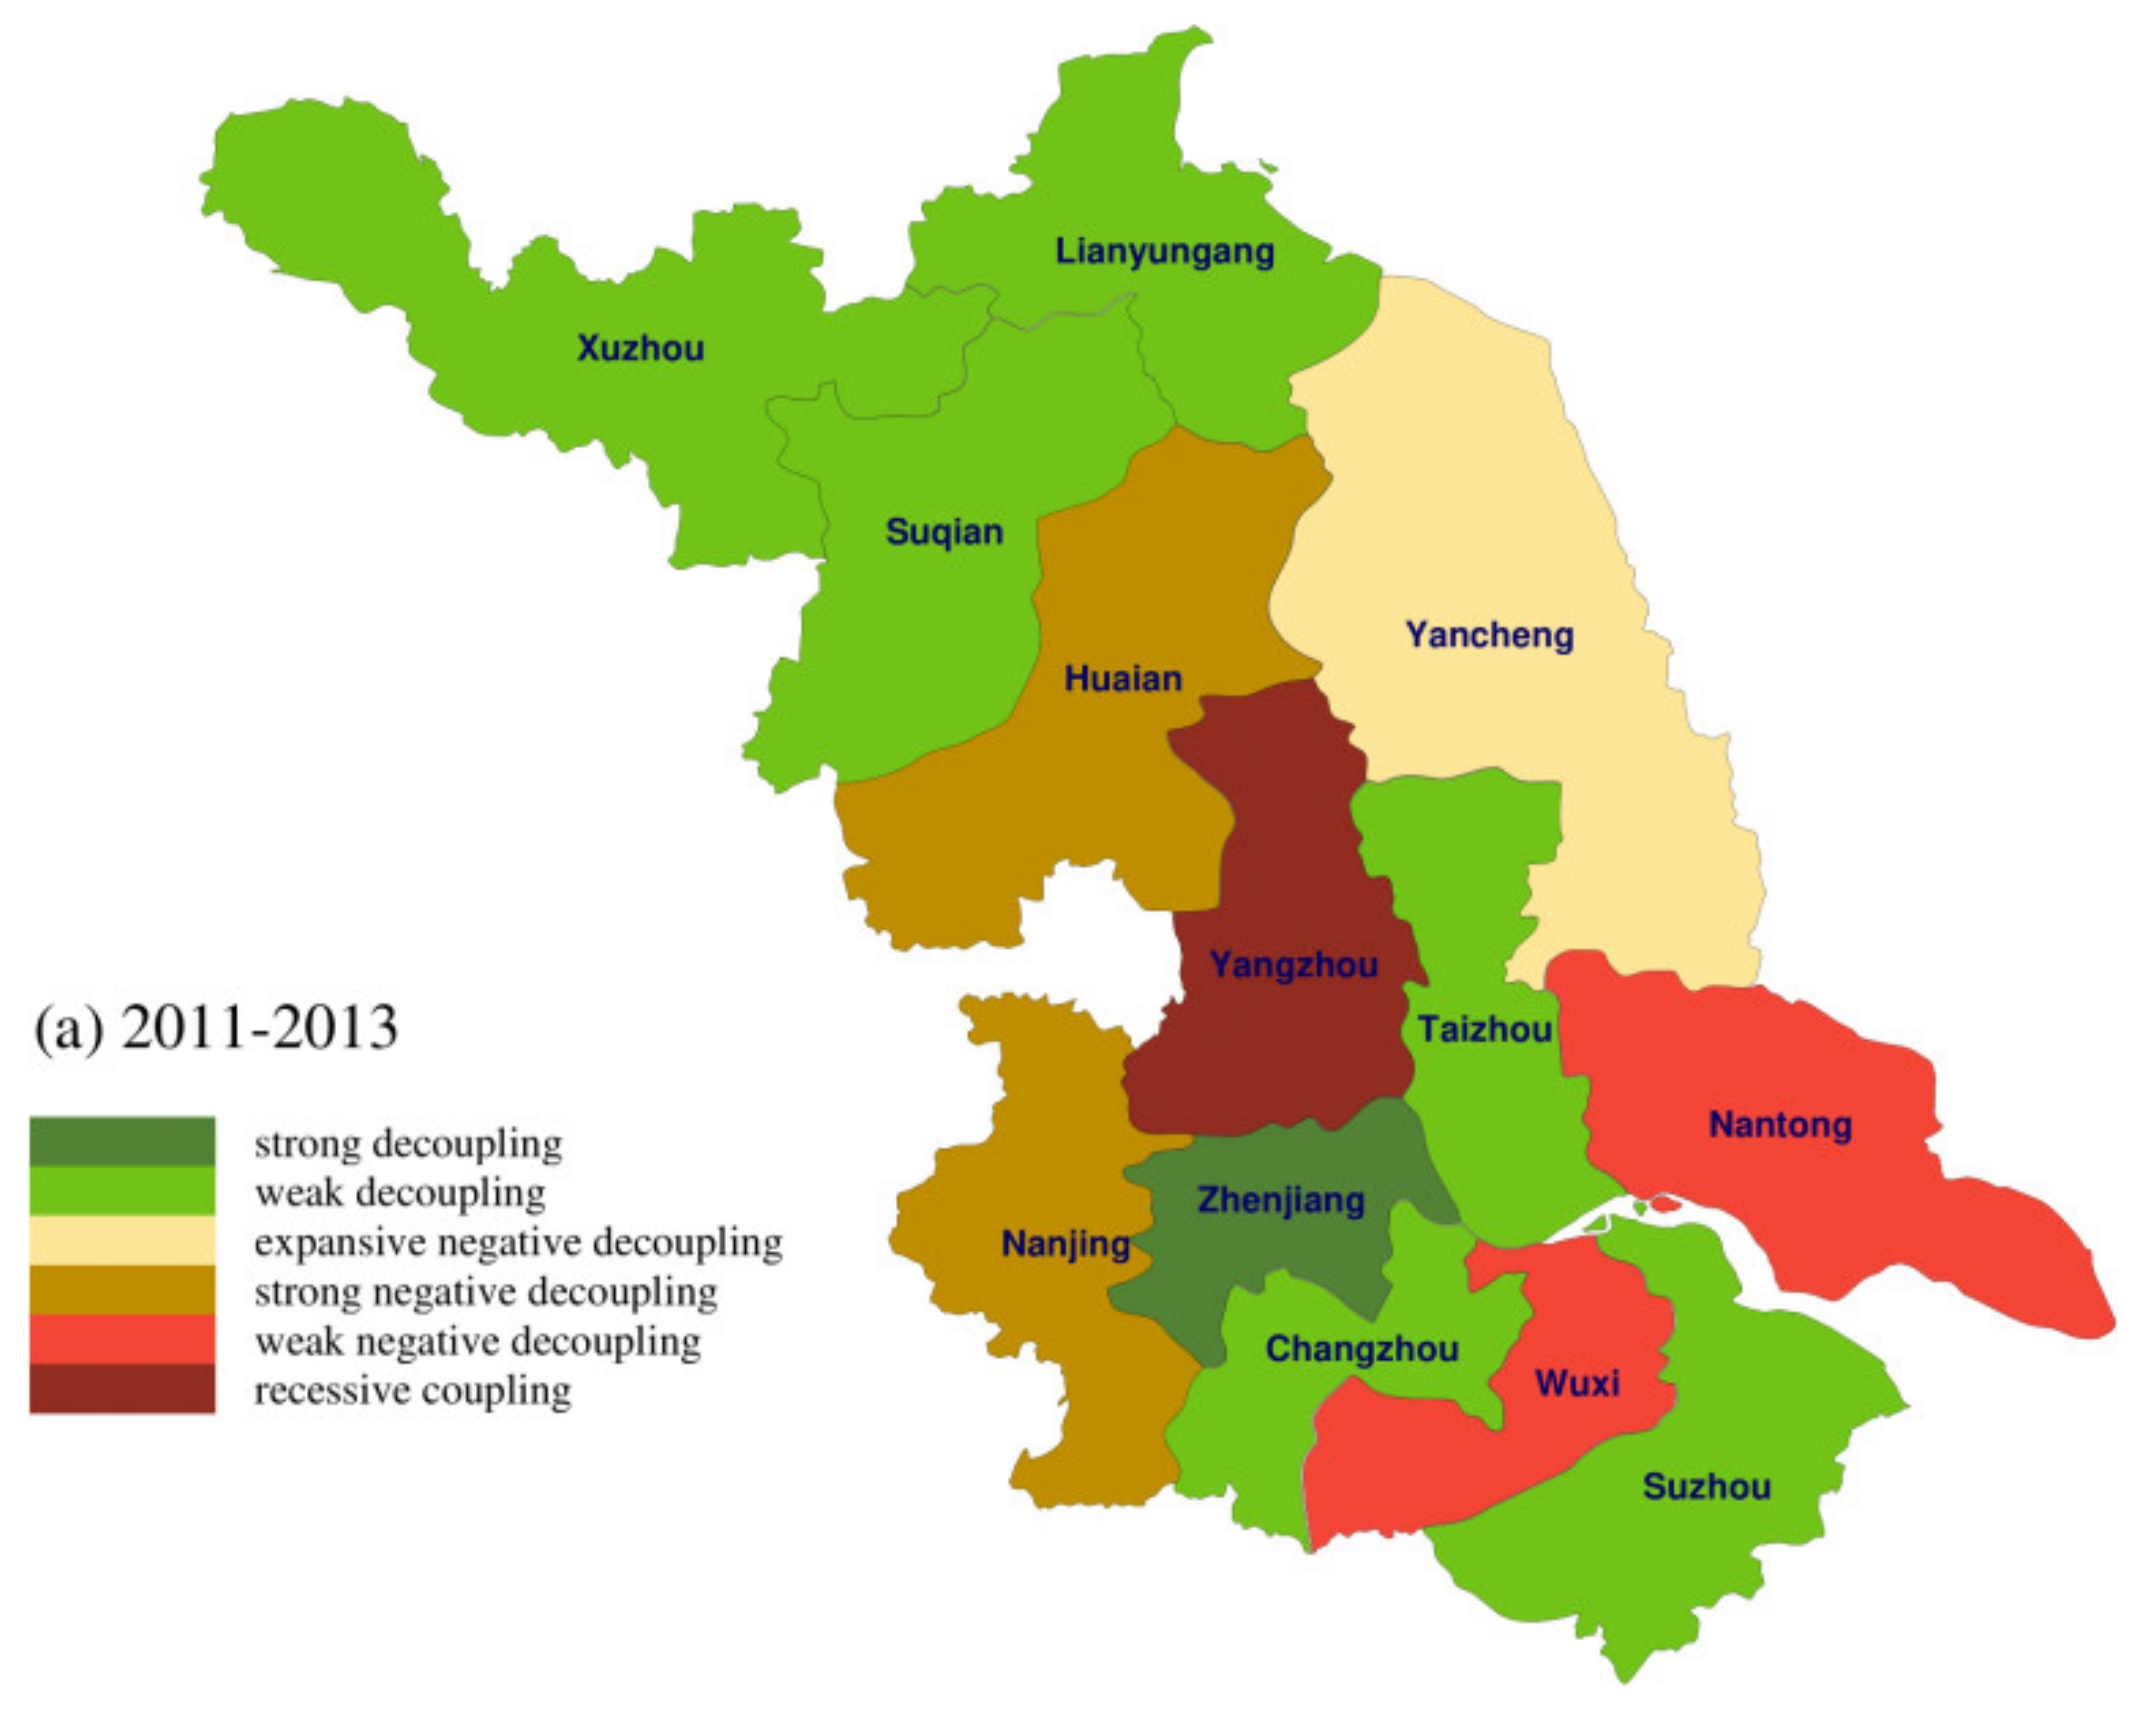
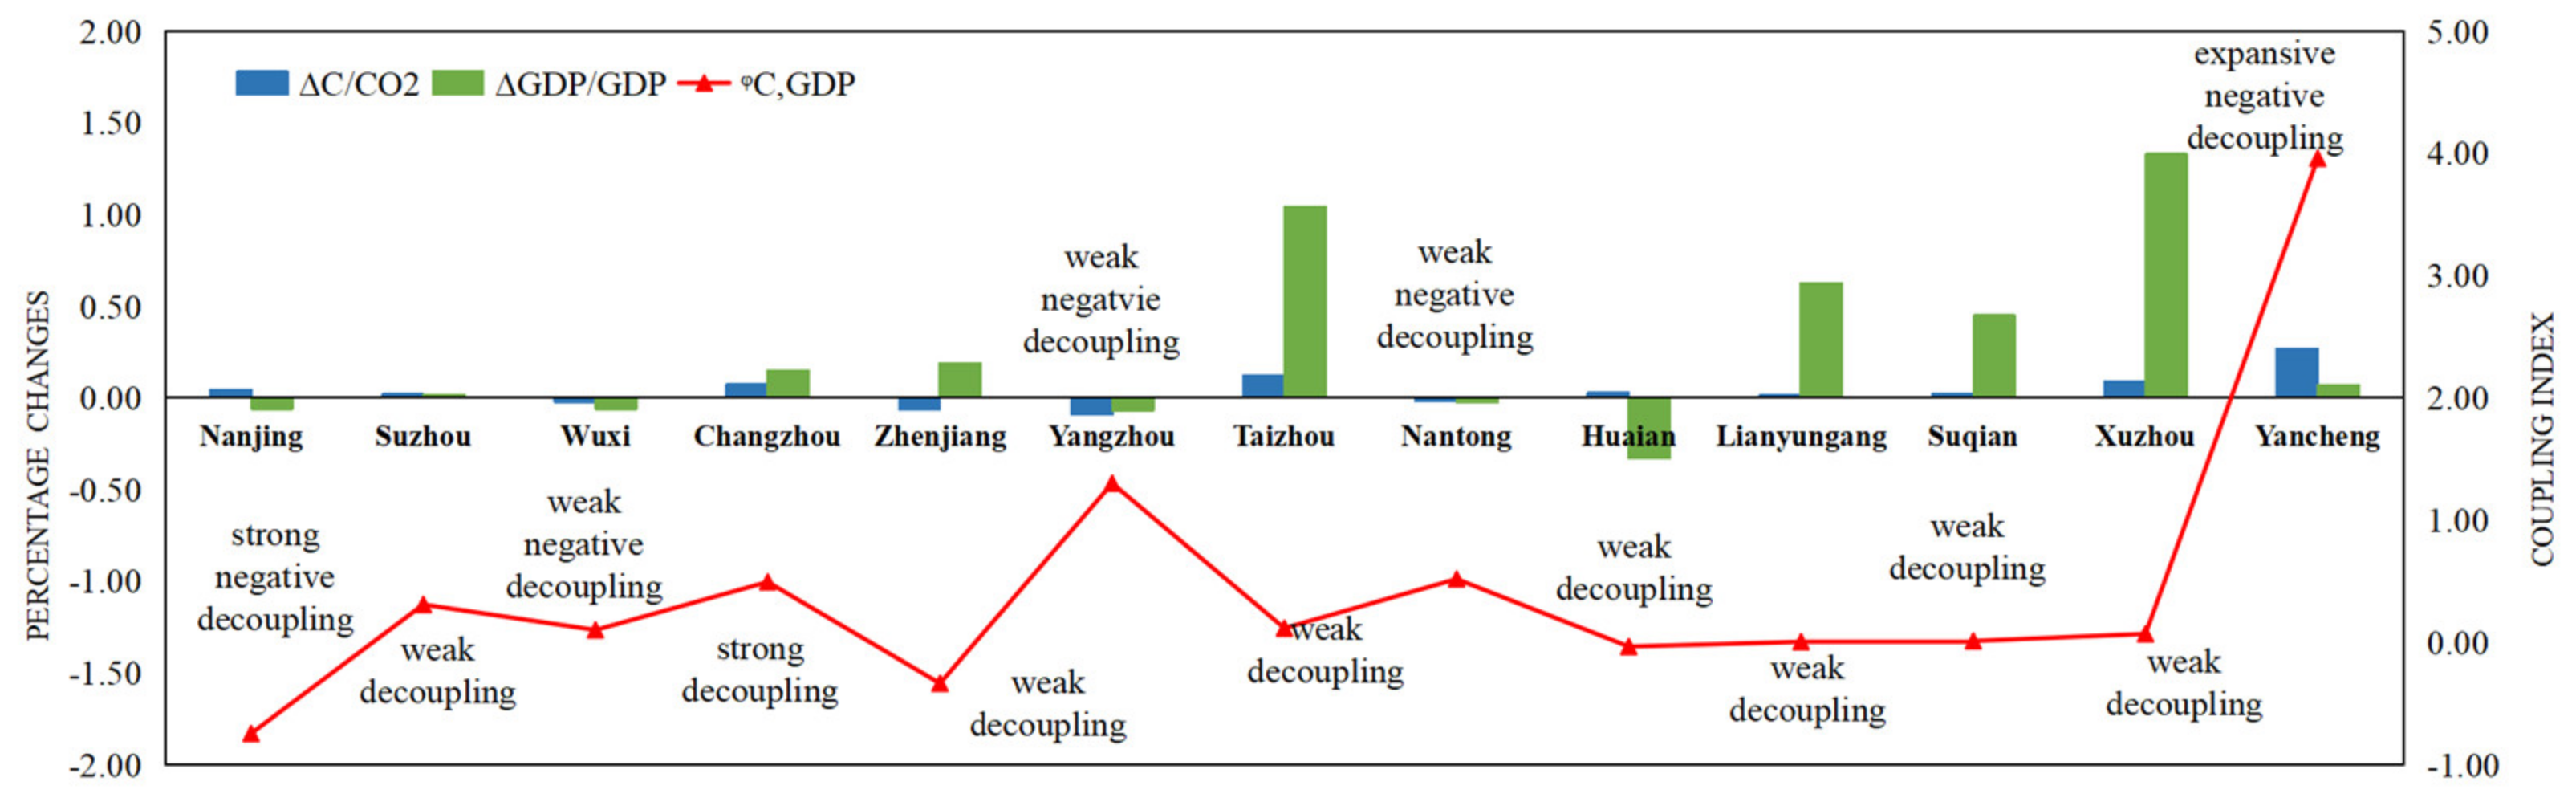
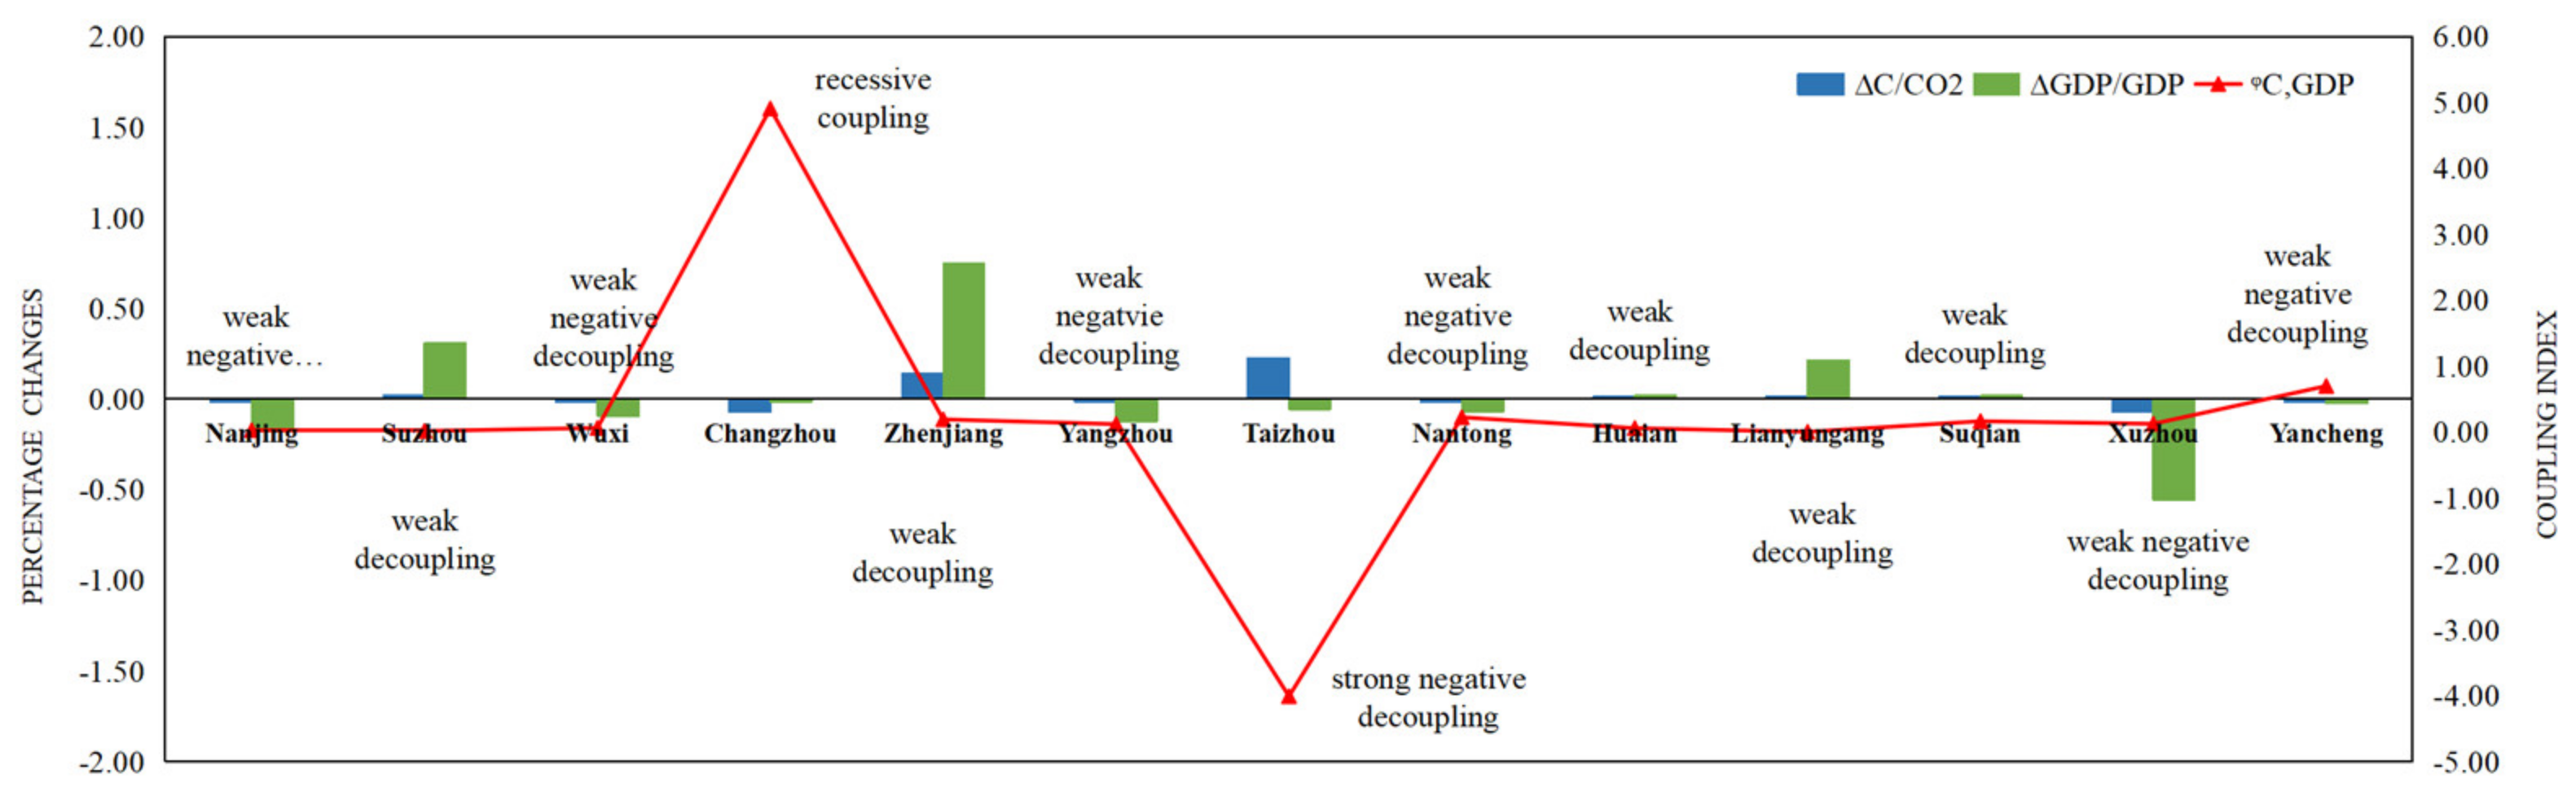
Moreover, the decoupling analysis was also performed from different periods. Figure 4a and Figure 6 show that the ICEs of Suzhou, Changzhou, Taizhou, Lianyungang, Suqian and Xuzhou presented WD with EG from 2011 to 2013. Nanjing and Huai’an were in states of strong negative decoupling, with decoupling indexes of −0.746 and −0.035, while Wuxi and Nantong represented opposite decoupling states, with WND indexes of 0.101 and 0.518, respectively. Yancheng and Yangzhou were in states of expansive negative decoupling and recessive coupling, respectively. Furthermore, SD occurred only in Zhenjiang, with a decoupling index of −0.336, and the percentage changes in the GDP and ICEs were 0.191 and −0.064%, respectively. Figure 4b and Figure 7 show that no cities exhibited SD from 2013 to 2015. The ICEs of Suzhou, Zhenjiang, Taizhou, Huai’an, Lianyungang, and Suqian presented WD with EG from 2013 to 2015. Nanjing, Wuxi, Yangzhou, Nantong and Xuzhou displayed states of WND, while Taizhou presented a state of strong negative decoupling. Recessive coupling occurred in Changzhou, with a coupling index of 4.9055, and the percentage changes in the GDP and ICEs were −0.015 and −0.0734%, respectively.
Specifically, the decoupling state in Zhenjiang exhibited SD from 2011 to 2013 and WD from 2013 to 2015, indicating that the CEs of Zhenjiang were well controlled while EG was rapid and that tangible results were achieved in promoting economic quality improvements and structural transformation and upgrades during the 12th Five-Year Plan period. Suzhou, Lianyungang, and Suqian exhibited WD from 2011 to 2013 and 2013 to 2015, indicating that these three cities paid more attention to investments and improvements in industrial upgrading, energy conservation and emission reduction measures, energy structure enhancement and other factors while their economies were rapidly growing. Although some achievements in energy conservation and emission reduction were observed from 2011 to 2013, such as in Yancheng and Yangzhou, the issues associated with the high-pollution and high-consumption extensive EG mode have not been fundamentally resolved.
It is worth noting that the changes in the decoupling states of different cities in Jiangsu during the 12th Five-Year Plan period were significantly different, indicating that decoupling elasticity analysis is sensitive to period selection and that the conclusions may be different in different periods. According to the above results, Jiangsu has great potential for energy savings and consumption reductions in the future. The EG of Jiangsu will continue to drive continuous increases in energy consumption and ICEs, and the government should focus on reducing energy consumption in the context of technological progress.
4.3. Decomposition Analysis of the Driving Forces of EG and ICEs
4.3.1. Analysis of the Main Driving Forces in Jiangsu
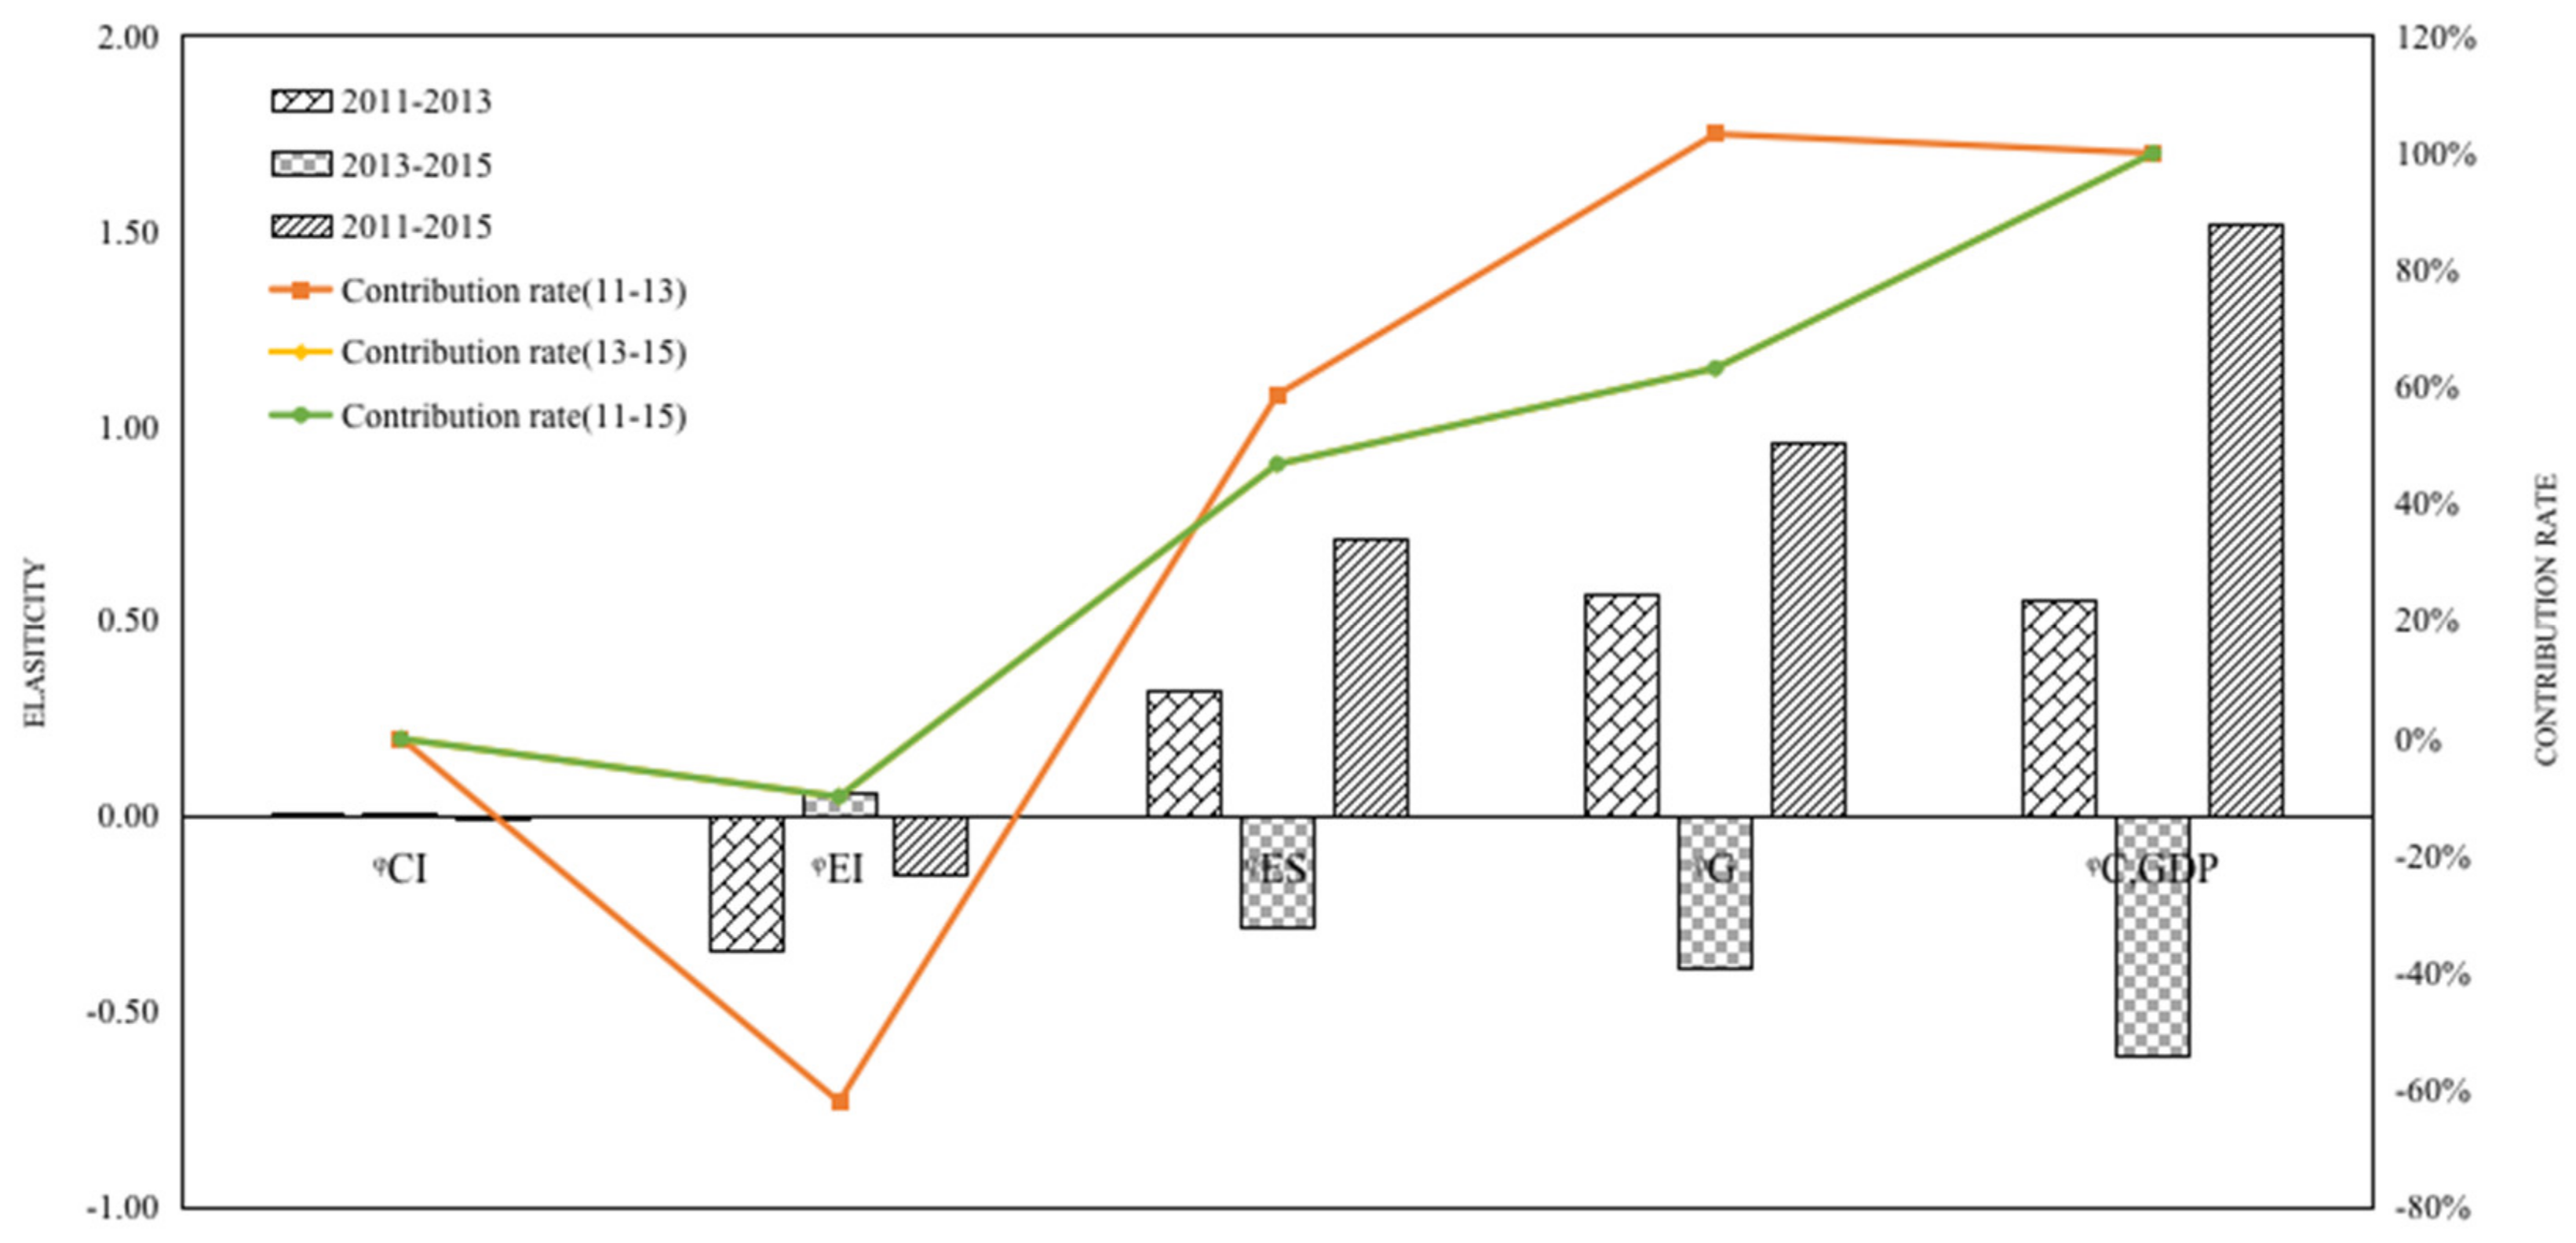
To better comprehend the influence factors of ICEs, the LMDI method was adopted in this paper for factor decomposition. As shown in Figure 8, during the 12th Five-Year Plan period, the energy intensity effect and carbon emission intensity effect were negative, indicating that these two factors had a negative inhibitory effect on ICEs in Jiangsu, while the economic development effect and energy structure effect were positive, indicating that these two factors had a positive promotional effect on ICEs in Jiangsu.
Specifically, the level of the economic development effect was much higher than levels of other influencing factors from 2011 to 2015, indicating that economic development was the most important driving factor that affected ICEs in Jiangsu. From 2011–2013 and 2013–2015, the value of the economic development effect quickly decreased from 103.28 to 63.22%, which suggests that the promotion effect of economic development on ICEs decreased. In particular, from 2013 to 2015, the impact factor of economic development on ICEs changed to an inhibitory effect, which indicated that with the change in the pattern of EG and the continuous development of green and low-energy industries in Jiangsu, the effect of economic development on ICEs gradually changed from promoting to inhibiting. Furthermore, the energy structure effect played a positive role in ICEs, accounting for 46.83% of the total effect, and it was the second-largest driving factor that influenced ICEs in Jiangsu. The energy structure effect showed a downward trend from 2011 to 2015, and negative values occurred from 2013 to 2015, indicating that the promoting influence of the energy structure effect on ICEs decreased. This finding also suggests that the government in Jiangsu is constantly adjusting and optimizing the energy consumption structure, but EG still depends on fossil energy consumption to some extent; therefore, the government should aim to further develop and utilize new energy.
ASignificantly, the energy intensity effect was the main driving factor of energy savings and emission reductions, accounting for −9.96% of the total effect. The contribution of the energy intensity effect reached −61.99% in 2011–2013, making a notable contribution to energy conservation and emission reductions in Jiangsu; this effect was related to the gradual implementation of strong environmental management policies and the promotion of a green economy.
4.3.2. Analysis of the Main Driving Factors in Southern Jiangsu, Middle Jiangsu and Northern Jiangsu
In order to explore whether there are differences in the main driving factors of ICEs in different regions in Jiangsu, this section analyses the driving forces of ICEs at the regional level in Jiangsu Province from north to south.
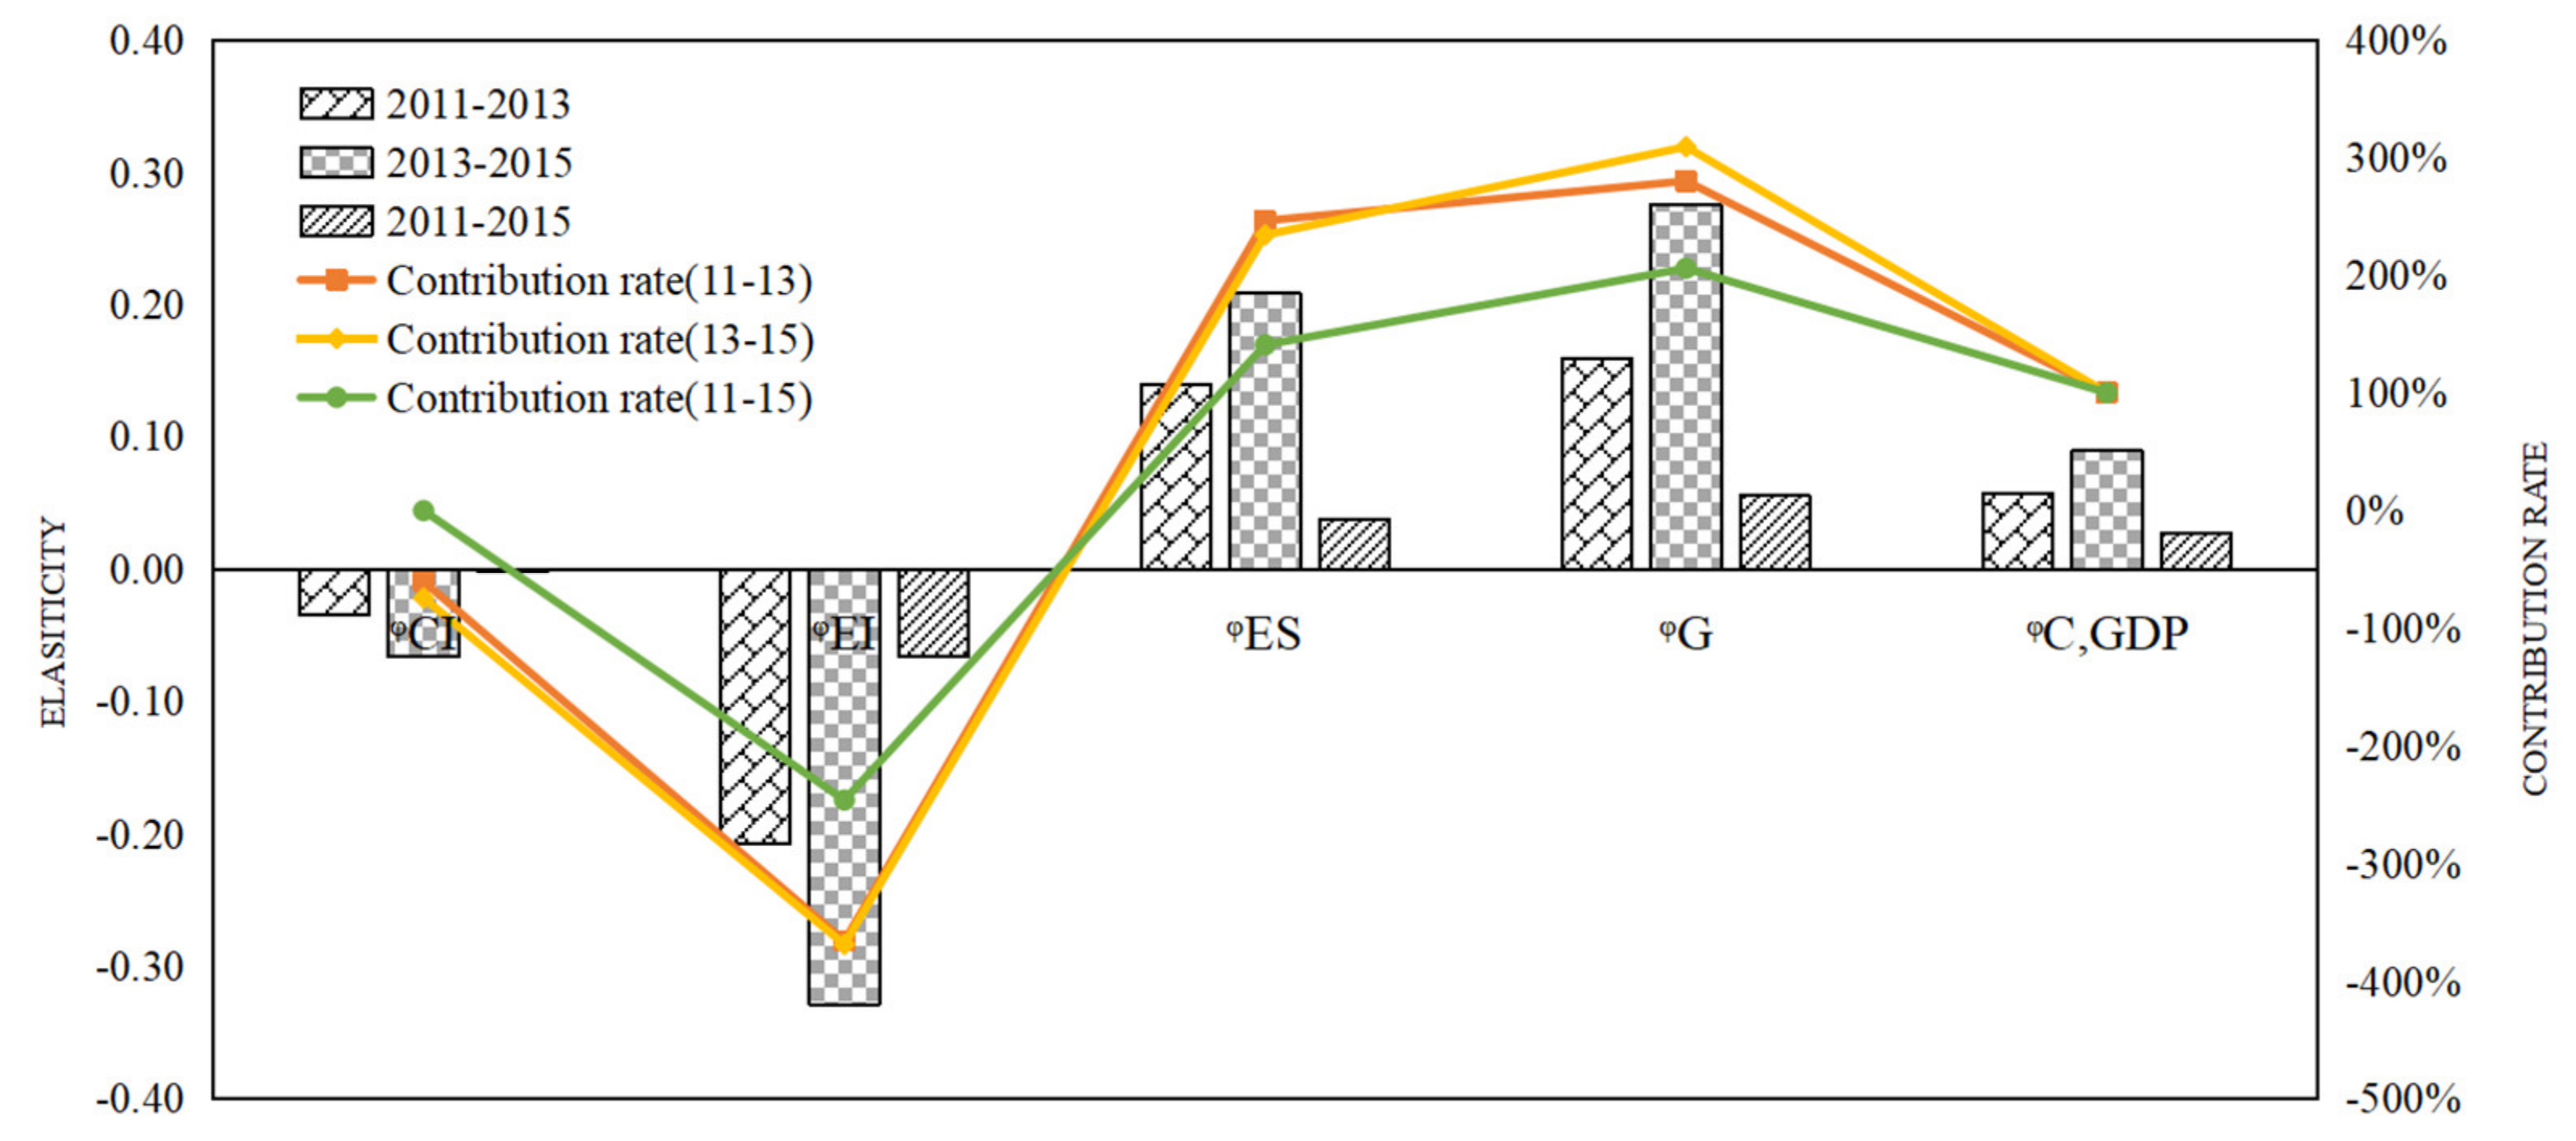
Firstly, Figure 9 shows that based on the measurements of the driving forces of ICEs during the 12th Five-Year Plan period, the total effect of EG on ICEs in northern Jiangsu was positive (0.027). However, different driving forces have different effects; the energy intensity effect (−0.066) and carbon intensity effect (−0.0001) were negative, indicating that these two factors had a negative inhibitory effect on ICEs in northern Jiangsu, while the regional economic development effect (0.055) and energy structure effect (0.0378) were positive, indicating that these two factors had a positive promotional effect on ICEs in northern Jiangsu. Specifically, the total effect of EG on ICEs in northern Jiangsu was positive, with a value of 0.057 from 2011 to 2013 and 0.891 from 2013 to 2015. Although the inhibiting influence of the carbon emission effect and energy intensity effect gradually increased from 2011 to 2015 and the promotional influence of the regional economic development effect and energy structure effect also increased each year, the contribution of each effect changed little in different periods. This finding is consistent with the decoupling state described above in the Tapio decoupling model of northern Jiangsu (shown in Table 2); that is, the EG in northern Jiangsu was decoupled from ICEs from 2011 to 2015.
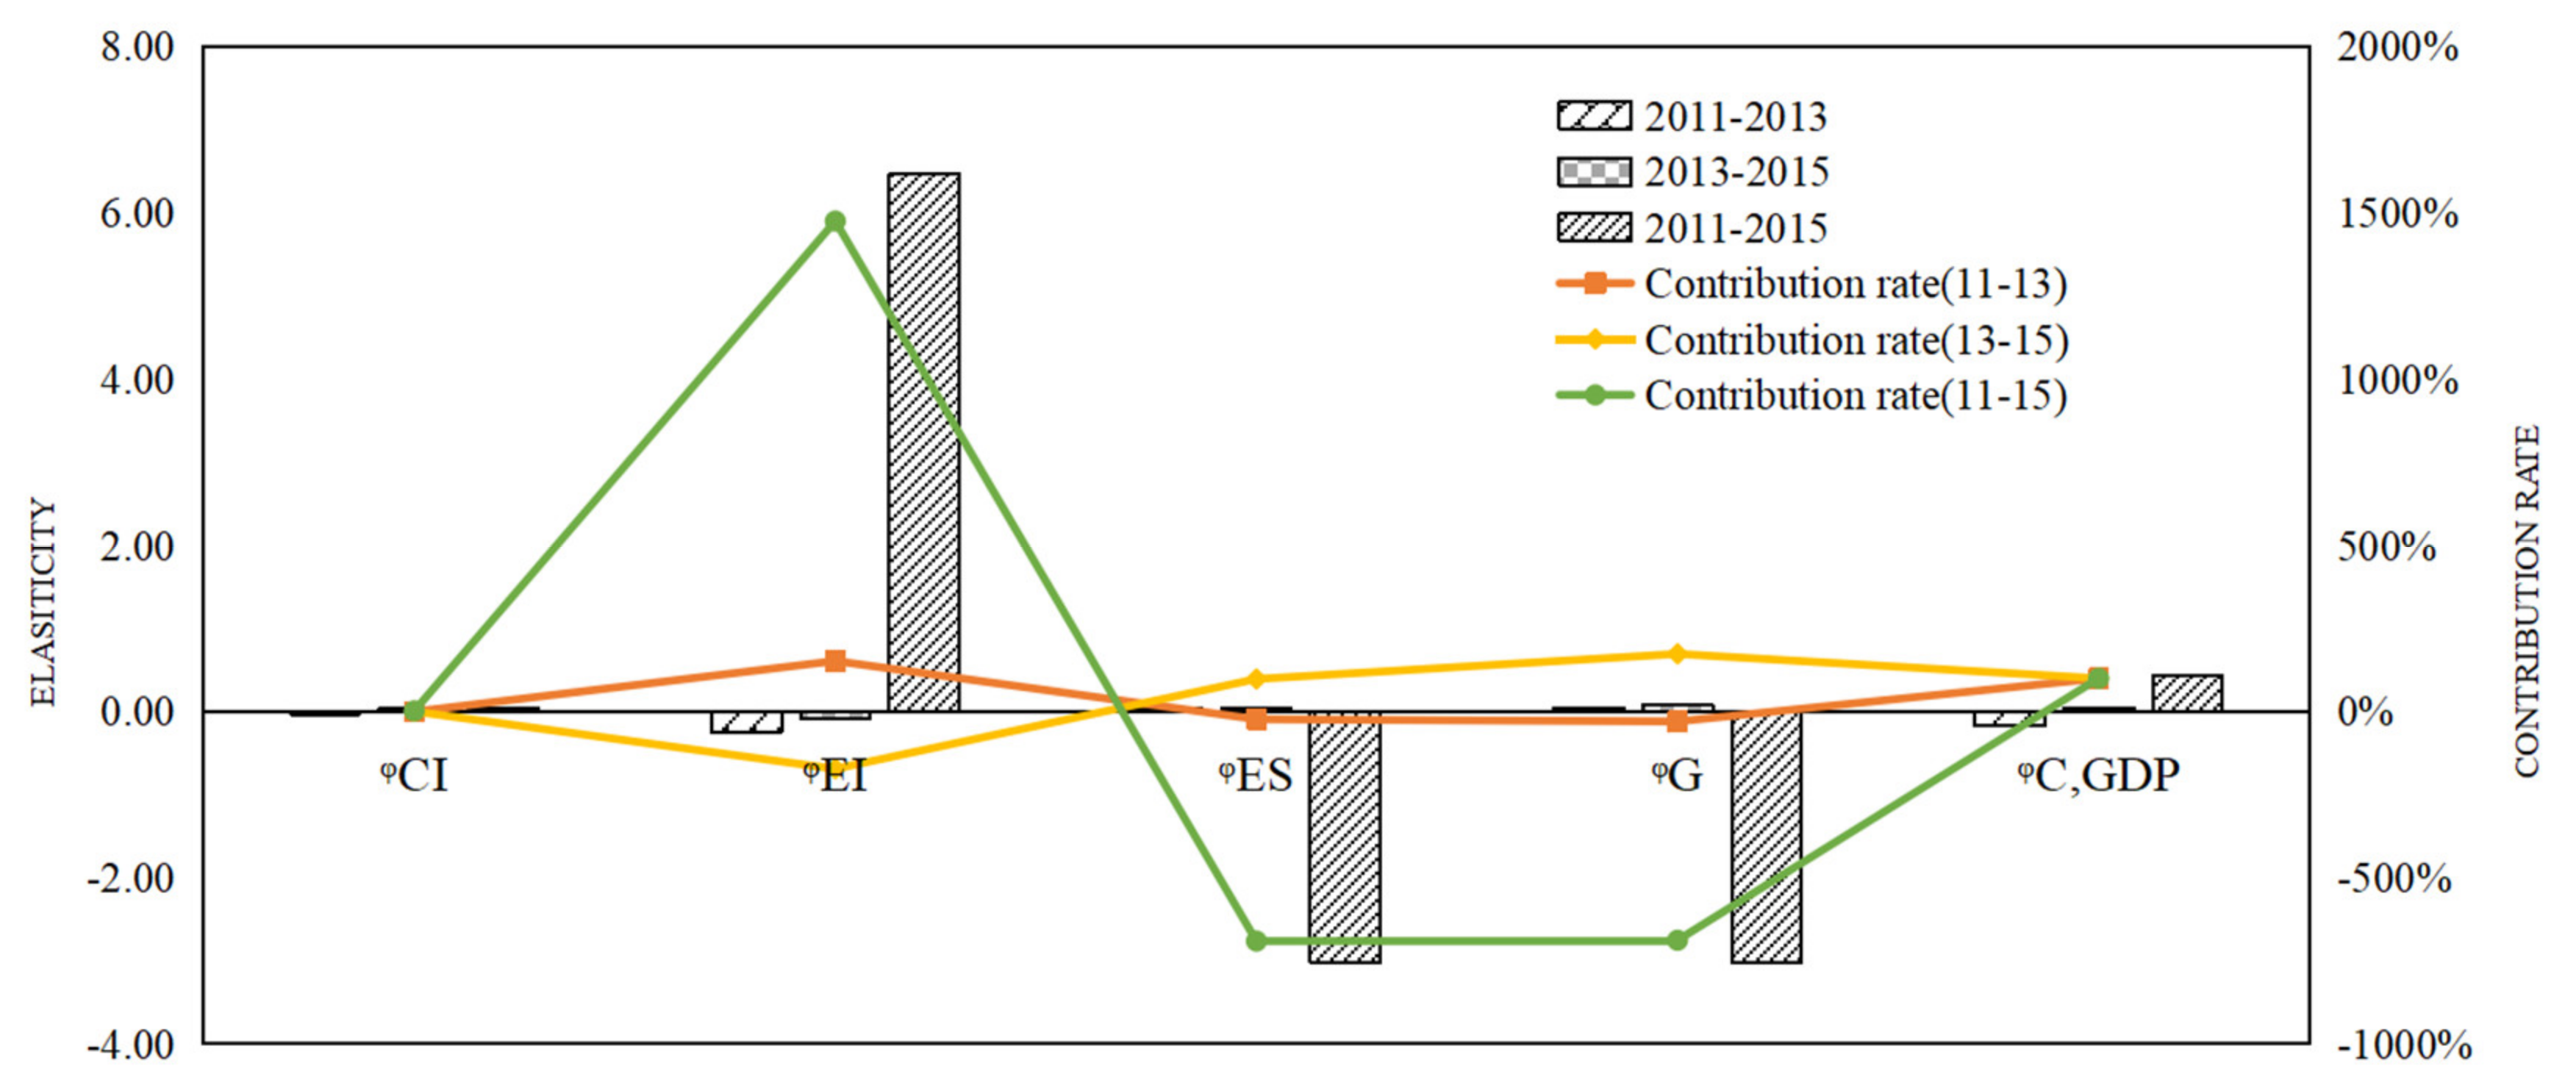
Secondly, the total effect of EG on ICEs in middle Jiangsu was positive (0.438) (shown in Figure 10). In terms of the effects of different driving forces, the energy intensity effect (6.468) and carbon intensity effect (0.01) were positive, indicating that these two factors had a positive promotional effect on ICEs in middle Jiangsu, while the regional economic development effect (−3.014) and energy structure effect (−3.025) were negative, indicating that these two factors had a negative inhibiting effect on ICEs in middle Jiangsu. From 2011 to 2013, the total effect of EG on ICEs in middle Jiangsu was negative (−0.164), the energy intensity effect on ICEs in middle Jiangsu was negative (−0.250) and the energy structure effect (0.037) and regional economic development effect (0.048) were both positive. From 2013 to 2015, the total effect of EG on ICEs in middle Jiangsu was positive (0.048), and the energy intensity effect was negative (−0.083), with the contribution rate increasing from 152.31% in 2013 to 172.15% in 2015. Although the energy structure effect (0.037) and regional economic development effect (0.048) were both positive, their contributions varied greatly. During this period, the contribution rate of the energy structure effect increased from 22.85 to 98.09%, and the contribution rate of the regional economic development effect increased from 29.46 to 173.56%.
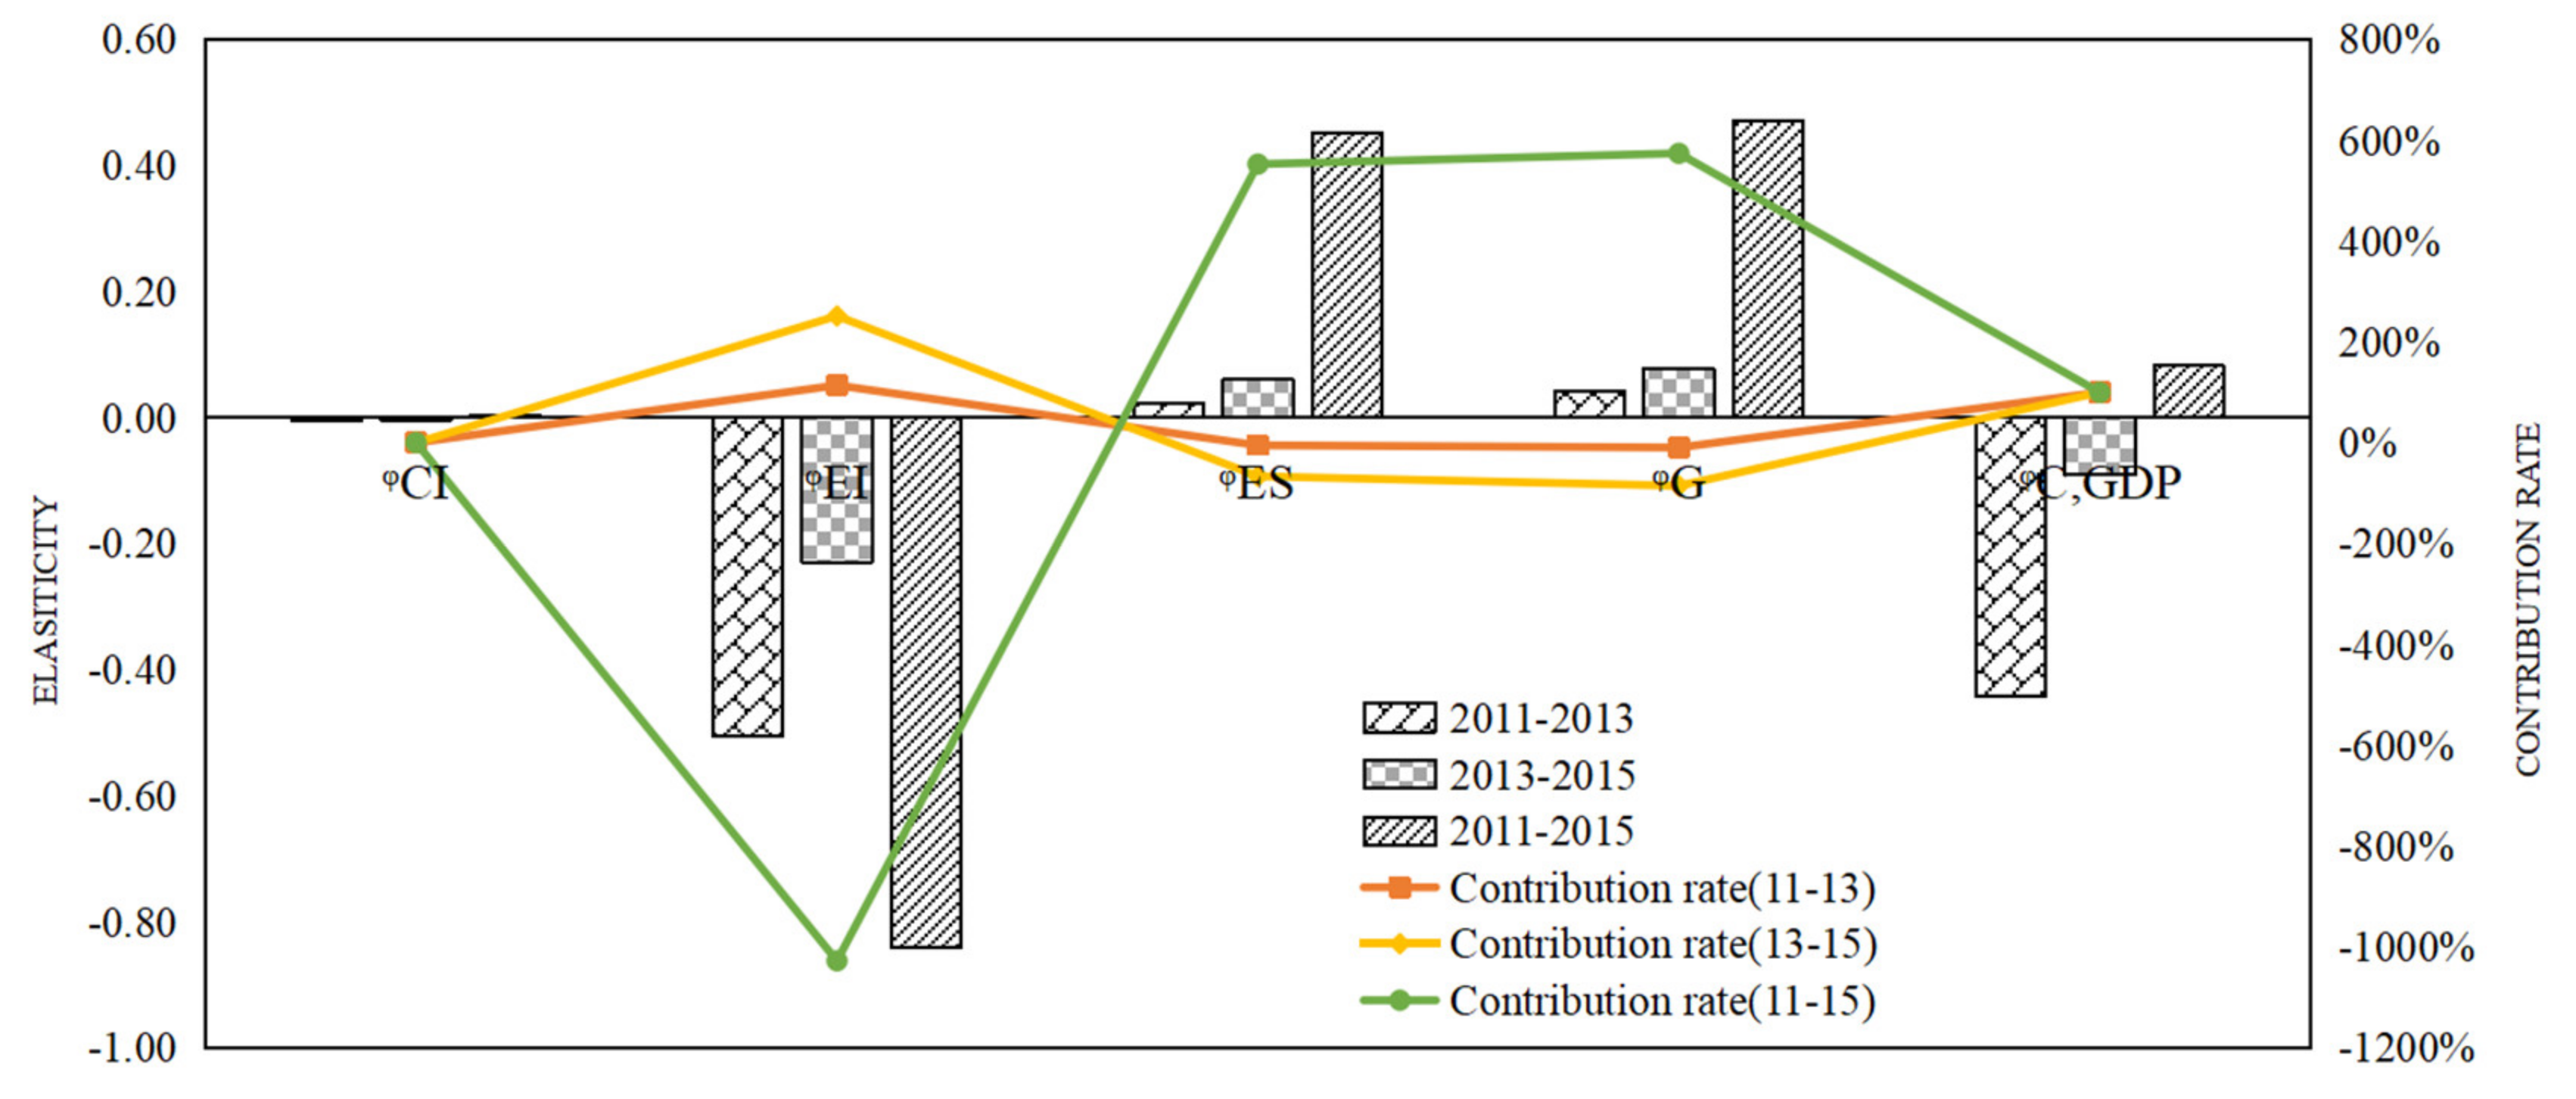
Thirdly, as shown in Figure 11, as the most economically developed region in Jiangsu Province, southern Jiangsu displayed a positive (0.082) total effect of EG on ICEs from 2011 to 2015. The energy intensity effect was −0.841, indicating that the energy intensity had an inhibitory effect on ICEs, and the carbon intensity effect, regional economic development effect and energy structure effect were all positive, with values of 0.003, 0.470 and 0.453, respectively, indicating that these three factors had a positive promotional effect on ICEs in southern Jiangsu. With the rapid economic development of southern Jiangsu, the contribution of each effect changed significantly. Specifically, the contribution of the energy intensity effect increased from 114.07% in 2011–2013 to 251.54% in 2013–2015, and that of the energy structure effect increased from 4.95 to 66.37%. In addition, the contribution of the regional economic development effect increased from 9.35% in 2011–2013 to 85.27% in 2013–2015.
The above results show that the regional economic development effect factor had a positive stimulating effect in northern Jiangsu and southern Jiangsu, while that in middle Jiangsu displayed a negative inhibitory effect. These findings indicate that with the optimization of the economic energy consumption structure and the improvement of the energy utilization efficiency in northern Jiangsu, the EG rate has been increasingly slowed by the impact of CEs. The energy intensity effect did not change significantly in the three regions in 2011–2013 and 2013–2015, which suggests that there was not substantial progress in energy conservation and emission reduction technologies in the various regions during the 12th Five-Year Plan period. Therefore, the government in Jiangsu should take active measures to increase investments in energy-saving and emission reduction technologies. Furthermore, with the promotion of new energy types and renewable resource policies by the government, there is still a chance to moderate the growth of carbon dioxide emissions by the energy structure effect. Therefore, the government in Jiangsu should continue to optimize and adjust the industrial structure and the energy structure in order to boost the transformation of the EG pattern.
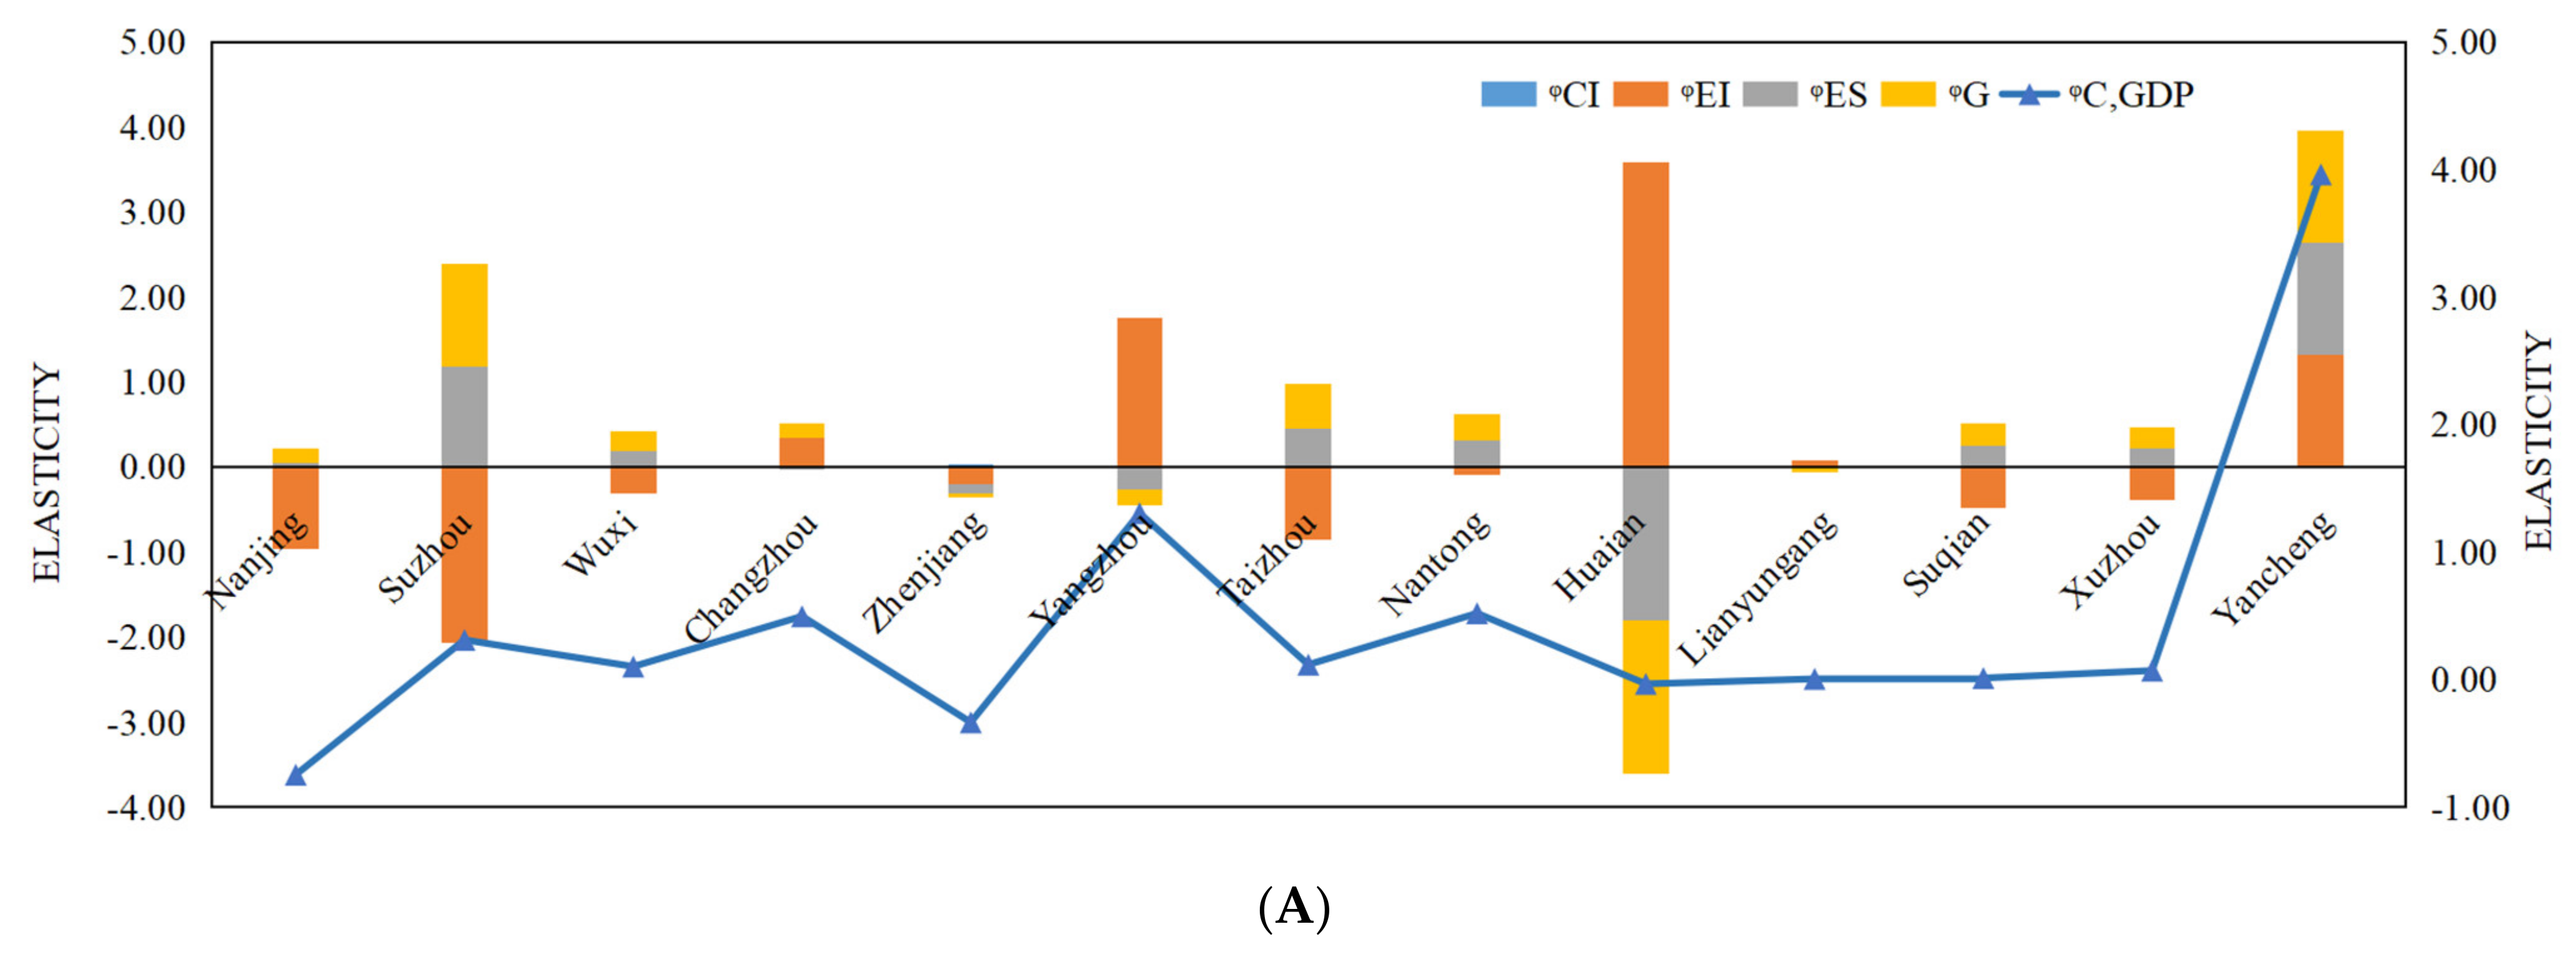
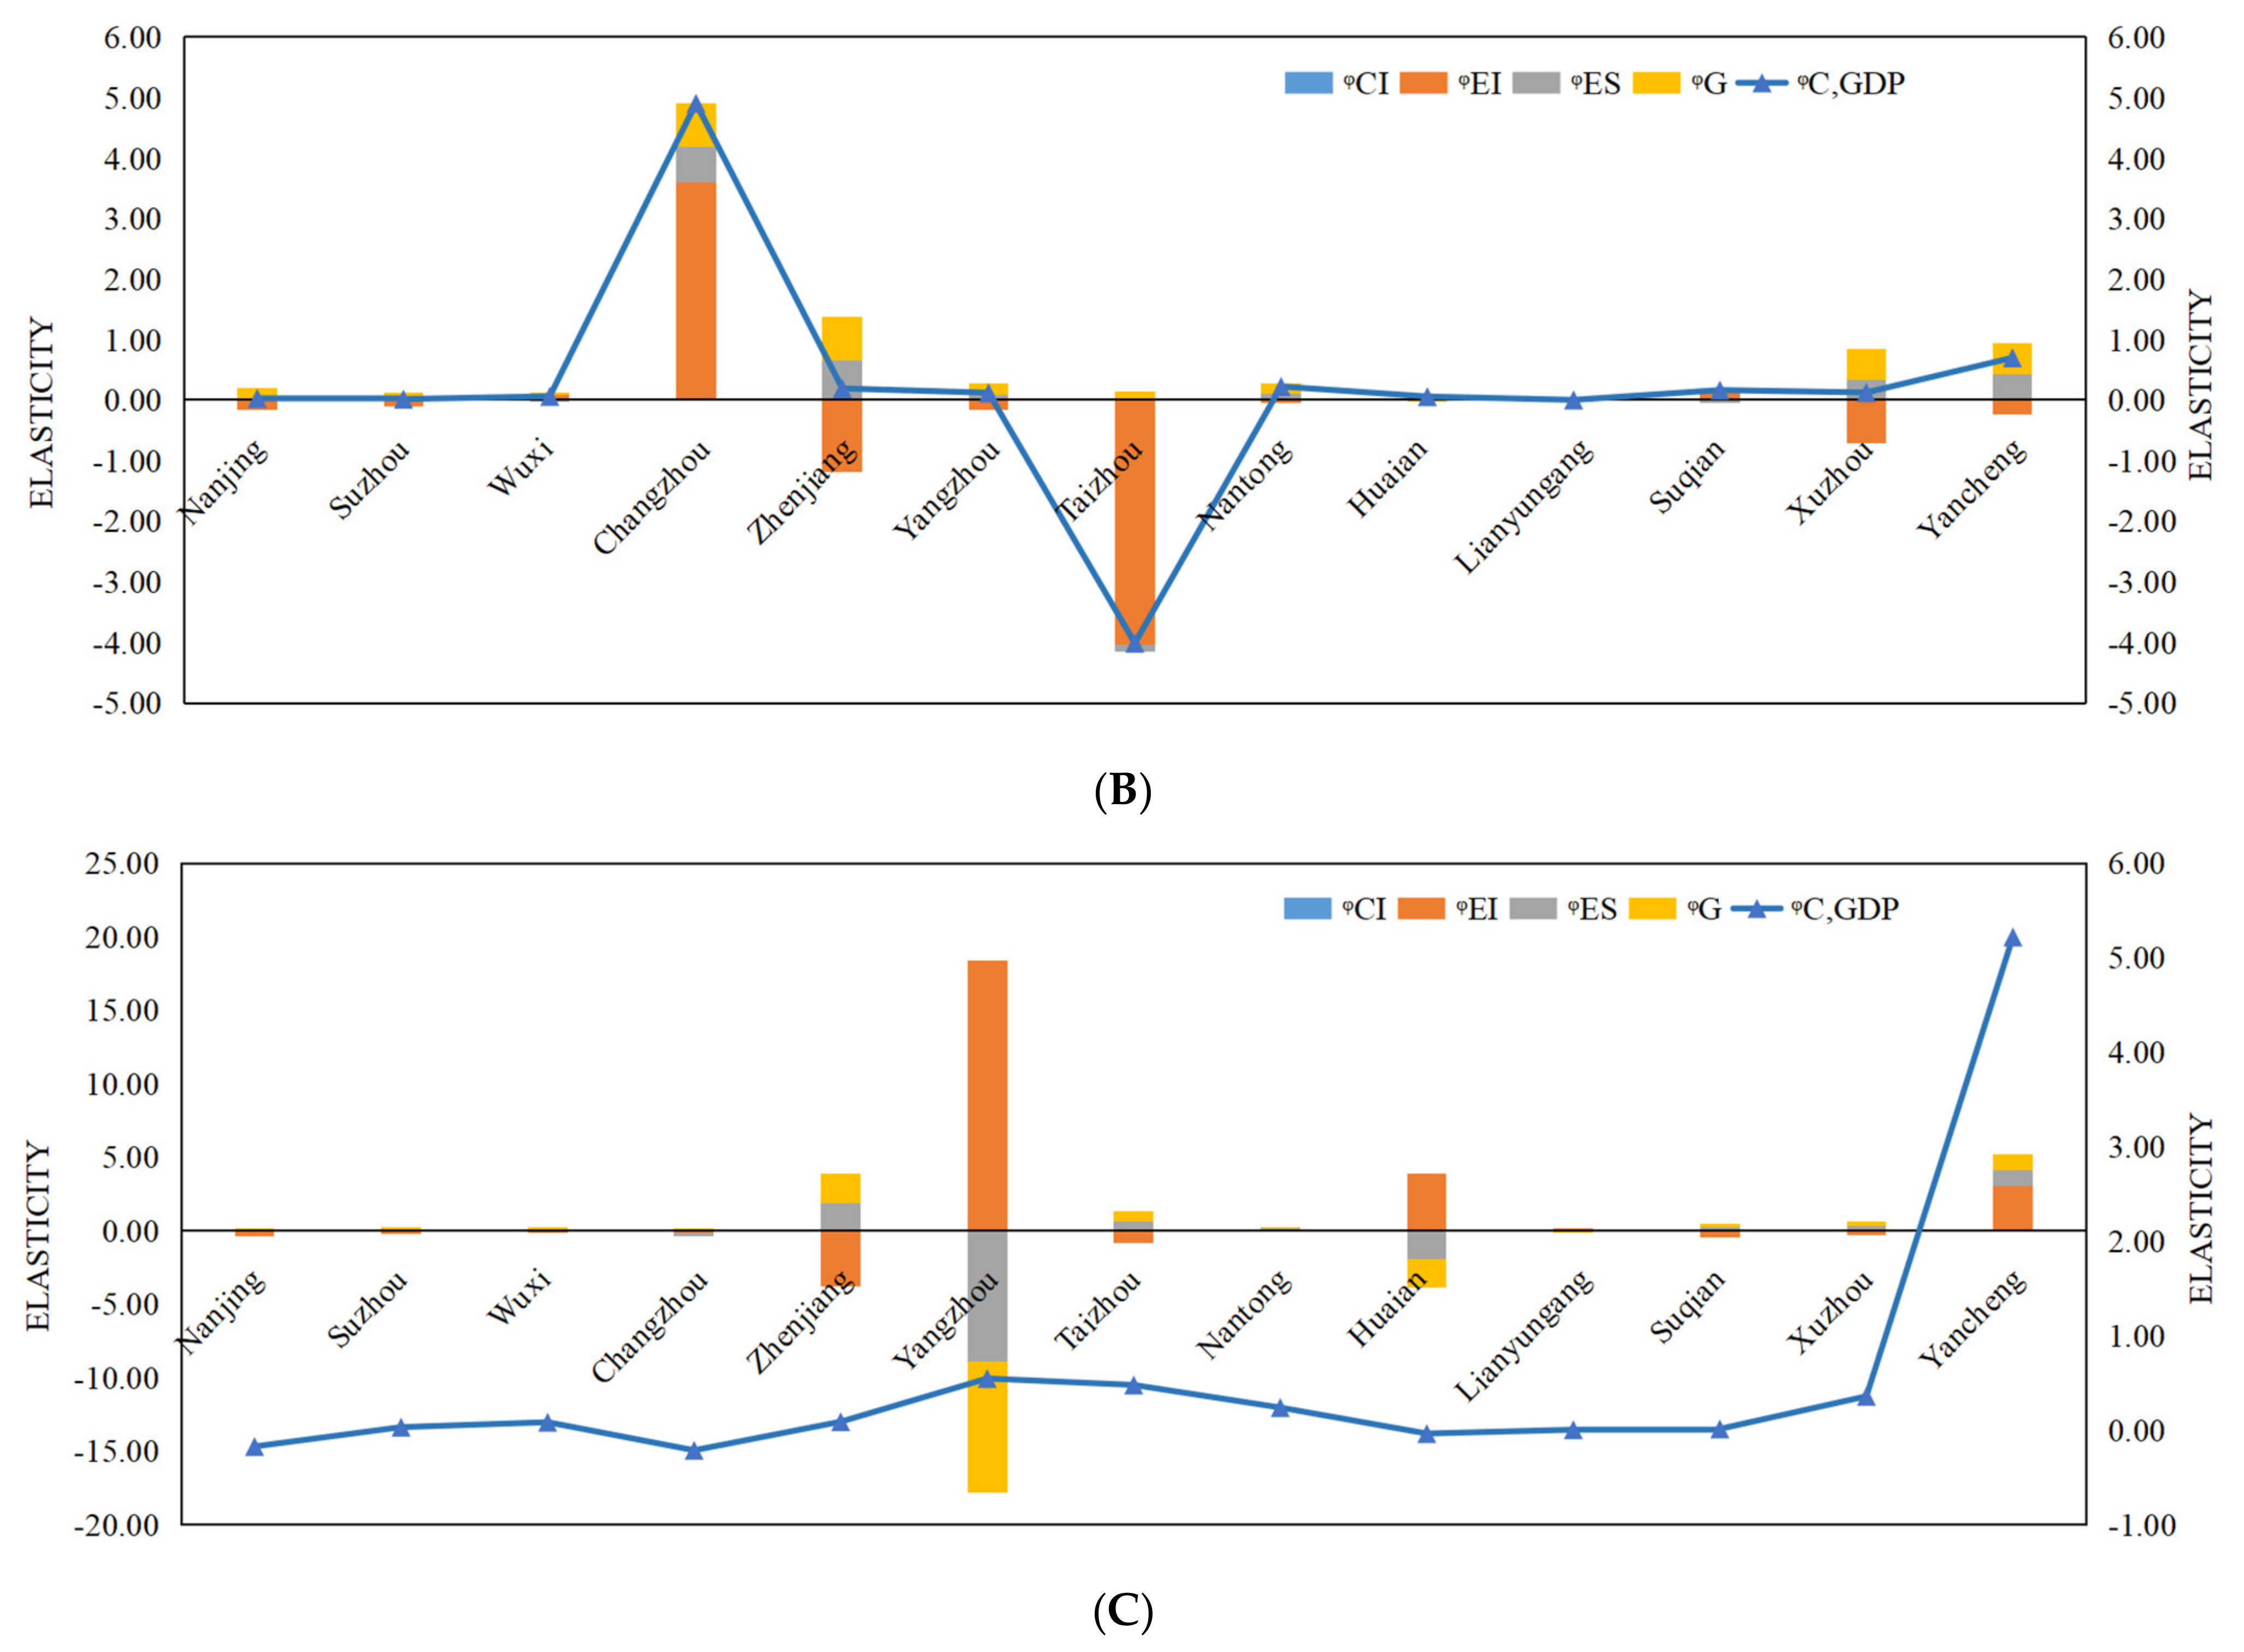
4.3.3. Analysis of the Main Driving Factors in 13 Prefecture-Level Cities in Jiangsu
In order to further explore the specific effects of the driving forces of CO2 emissions in different cities, this section studies the main driving factors including energy intensity, energy structure and economic development on 13 prefecture-level cities in Jiangsu.
- (1)
- Energy intensity effect
During the 12th Five-Year Plan period, the energy intensity factor had the greatest inhibitory effect on ICEs in Jiangsu (seen in Figure 12C). In 2011–2013 and 2013–2015, the energy intensity effects of Nanjing, Suzhou, Zhenjiang, Taizhou, Nantong and Xuzhou all played a positive role in promoting the decoupling of GDP in Jiangsu and ICEs (seen in Figure 12A,C). However, the energy intensity factor of Yangzhou and Yancheng changed the impact from promoting to restraining ICEs, which indicates that the government in Yangzhou and Yancheng accelerated the transformation and upgrading of industrial structure and made significant progress in energy conservation and emission reductions. However, the influence of the energy intensity effect on ICEs in Wuxi and Suqian changed from inhibition to promotion, which indicates that the economic growth of Wuxi and Suqian is still largely dependent on fossil energy consumption and that governments in Wuxi and Suqian should further deepen the development and utilization of new energy.
- (2)
- Energy structure effect
During the 12th Five-Year Plan period, the energy structure effect in Suqian, Xuzhou and Yancheng positively promoted increases in ICEs in northern Jiangsu (shown in Figure 12C). The energy structure effect in Taizhou and Nantong contributed to increases in ICEs in middle Jiangsu. Additionally, the energy structure effect in five cities in southern Jiangsu, excluding Changzhou, played a positive role in leading to an increase in ICEs. In 2011–2013 and 2013–2015 (shown in Figure 12A,B), the energy structure factor in Xuzhou, Yancheng, Nanjing, Suzhou and Nantong played a positive role in the decoupling of GDP and carbon dioxide emissions. In contrast, the energy structure factor in Wuxi, Changzhou, Zhenjiang, Yangzhou, Taizhou, Lianyungang and Suqian showed a positive trend and promoted negative changes in the decoupling of the GDP and ICEs. In addition, the values of the energy structure effect in Huainan in 2011–2013 and 2013–2015 were both negative, indicating that the energy structure factor in Huainan inhibited increases in ICEs in northern Jiangsu. In general, the government in Jiangsu should constantly optimize the energy structure and continue to increase the consumption of energy types with low carbon emission coefficients, such as natural gas and clean energy, and reduce the consumption of energy types with high carbon emission coefficients, such as coal.
- (3)
- Economic development effect
During the 12th Five-Year Plan period, except in Yangzhou, Huainan and Lianyungang, the economic development effect on ICEs in the other cities in Jiangsu was positive (shown in Figure 12C). From 2011–2013, except in Zhenjiang, Yangzhou, Huainan and Lianyungang, the economic development factor in the other cities in Jiangsu had a positive effect on ICEs, indicating that the government in Jiangsu attached importance to the transformation and upgrading of the industrial structure in 2011–2013 and that the driving influence of the economic development effect gradually weakened (shown in Figure 12A,B). From 2013–2015, the effect of the economic development factor in all the cities except Huainan on ICEs in Jiangsu was positive, indicating that from 2013 to 2015 the economic development factor was still the most important factor that promoted the growth of energy consumption and ICEs in Jiangsu.
5. Conclusions
5.1. Research Conclusions
This paper mainly studied the relationship between EG and ICEs and explored the driving force of CE growth in Jiangsu Province. Furthermore, this paper also explored the different relationships and driving forces in different regions in Jiangsu. The main methods adopted in this paper include the Tapio decoupling model and the LMDI model. They were used for analysing the decoupling relationship between EG and ICEs and the driving forces of ICEs. The conclusions are as follows.
The research results of this paper show that during the 12th Five-Year Plan period, the decoupling states of ICEs associated with EG in southern Jiangsu, middle Jiangsu and northern Jiangsu displayed WD, WND and WD trends, respectively, and ICEs exhibited expansive negative decoupling with the EG of Jiangsu. Specifically, from 2011 to 2013, the EG in middle Jiangsu and northern Jiangsu presented SD and WD trends, and strong negative decoupling occurred in southern Jiangsu; from 2013 to 2015, the decoupling state in southern Jiangsu was SD, and WND occurred in middle Jiangsu and northern Jiangsu. Furthermore, from 2011 to 2013, the ICEs of Suzhou, Changzhou, Taizhou, Lianyungang, Suqian and Xuzhou displayed WD with EG, and SD occurred only in Zhenjiang, with a decoupling index value of −0.3359. From 2013–2015, the decoupling states of Suzhou, Zhenjiang, Taizhou, Huai’an, Lianyungang and Suqian presented WD, and no cities reached SD during this period. In particular, the ICEs of Lianyungang, Suqian and Xuzhou displayed WD with EG during the 12th Five-Year Plan period, and these results provide guidance for the government to formulate targeted energy conservation and emission reduction measures for each city. In terms of the effect of driving forces on ICE growth, economic development was most essential. Moreover, the energy intensity effect and the carbon emission intensity effect had a negative inhibitory effect and economic development effect, and energy structure effect had a positive promotional effect on ICEs in Jiangsu Province during the 12th Five-Year Plan period.
Eventually, compared with previous relevant research conclusions [10,12,16,31,40,48,49,50], this paper finds the decoupling states in different regions or cities to be different in Jiangsu, which is a new finding. Moreover, this paper also finds that the factors of energy intensity played a negative inhibitory role on ICEs. By contrast, the factors of economic development and energy structure showed a positive promotion effect on industrial CO2 emissions.
5.2. Policy Recommendations
According to the main results obtained in this paper, the following policy recommendations should be considered:
- (1)
- Transforming the economic development model of the regional and prefecture levels in Jiangsu and optimizing the industrial structure. Jiangsu Province as one of the biggest industrial provinces in China plays an essential role in promoting economic development, while Jiangsu Province is also the one of the most carbon-emitting provinces. According to the research results, economic structure was a very important factor leading to an increase in ICEs during the 12th Five-Year Plan period. Thus, the government should accelerate changes to the EG strategy and advance new industrialization methods.
- (2)
- Improving the energy efficiency and advancing clean production technology. Technological innovation and technological introduction are the core aspects of improving energy utilization efficiency. Government departments should actively promote research and development associated with innovative technologies for energy exploitation, transformation and utilization and invest more in these fields to build a technological innovation system that is “market oriented, enterprise oriented and industry-university research based”.
- (3)
- Strengthening government functions and creating a macro energy-saving environment. The government should fully consider the functions of guidance, encouragement and supervision; adhere to strict low-carbon standards; actively perform exchanges and promote cooperation involving advanced ideas and technologies; and encourage enterprises and the masses to participate in low-carbon development. Additionally, the government should promote energy consumption reduction through subsidies, incentives, penalties and tax cuts. Only by building sound policy support and market systems can energy conservation strategies be smoothly and effectively implemented.
5.3. Limitations and Future Research
This paper takes the 13 prefecture-level cities in Jiangsu as research objects to study the decoupling between EG and ICEs and explores the driving factors of ICEs further through LMDI at regional and urban levels. The research results provide references and suggestions on how to balance the relationship between EG and ICEs and achieve the development goal of a low-carbon economy for Jiangsu. However, because of data limitation, the LMDI method and paper length, the decompositions of driving factors of ICEs are not sufficient. In addition, although Jiangsu as one of the most important industrial provinces in China has a strong representation, the research conclusions are still not comprehensive since only data from Jiangsu was used.
In the following study, some new research methods will be attempt in order to analyse the more specific driving factors of ICEs such as the combination of a DEA–LMDI base on input–output data. Furthermore, it is necessary to attempt to select more provinces and regions with different characteristics as research objects in order to obtain more comprehensive research results to put forward more constructive suggestions.
Author Contributions
Conceptualization, J.L. and H.L.; formal analysis, J.L.; data collection process, H.L. and T.L.; methodology, H.L. and J.L.; data analysis, J.L. and H.L.; writing—original draft preparation, H.L.; writing—review and editing, J.L. and T.L.; funding acquisition, J.L. and T.L. All authors have read and agreed to the published version of the manuscript.
Funding
This research was funded by the National Social Science Foundation (21CJY014;21CJL029), Innovation Strategy Research Program Project of Fujian Province (2021R0059), Social Science Planning Project of Fujian Province (FJ2019B134) and China Postdoctoral Science Foundation (2021M693487).
Informed Consent Statement
Not applicable.
Data Availability Statement
Data sharing not applicable.
Acknowledgments
The authors extend their appreciation to Feitao Jiang for his assistance with data analysis in this paper.
Conflicts of Interest
The authors declare no conflict of interest.
References
- IEA (International Energy Agency). World Energy Balances and Statistics. 2016. Available online: https://www.iea.org/data-and-statistics?country=CHINAREG&fuel=CO2%20emissions&indicator=CO2%20emissions%20by%20energy%20source (accessed on 9 January 2020).
- JSY (Jiangsu Statistical Yearbook). 2011–2016. The Statistical Yearbook of Jiangsu Province. Available online: http://navi.cnki.net/knavi/YearbookDetail?pcode=CYFD&pykm=YJSTJ (accessed on 9 January 2020).
- OECD (Organization for Economic Co-Operation and Development). Indicators to Measure Decoupling of Environmental Pressure from Economic Growth. Sustainable Development. 2002. Available online: http://www.oecd.org/env/indicators-modelling-outlooks/1933638.pdf (accessed on 9 January 2020).
- Andreoni, V.; Galmarini, S. Decoupling economic growth from carbon dioxide emissions: A decomposition analysis of Italian energy consumption. Energy 2021, 44, 682–691. [Google Scholar] [CrossRef]
- Liaskas, K.; Mavrotas, G.; Mandaraka, M.; Diakoulaki, D. Decomposition of ICEs: The case of European Union. Energy Econ. 2000, 22, 383–394. [Google Scholar] [CrossRef]
- Roinioti, A.; Koroneos, C. The decomposition of CO2 emissions from energy use in Greece before and during the economic crisis and their decoupling from economic growth. Renew. Sustain. Energy Rev. 2017, 76, 448–459. [Google Scholar] [CrossRef]
- Wang, W.; Li, M.; Zhang, M. Study on the changes of the decoupling indicator between energy-related CO2 emission and GDP in China. Energy 2017, 128, 11–18. [Google Scholar] [CrossRef]
- Wu, Y.; Zhu, Q.; Zhu, B. Decoupling analysis of world economic growth and CO2 emissions: A study comparing developed and developing countries. J. Clean. Prod. 2018, 190, 94–103. [Google Scholar] [CrossRef]
- Zhang, M.; Song, Y.; Su, B.; Sun, X. Decomposing the decoupling indicator between the economic growth and energy consumption in China. Energy Effic. 2015, 8, 1231–1239. [Google Scholar] [CrossRef]
- Dong, B.; Zhang, M.; Mu, H.; Su, X. Study on decoupling analysis between energy consumption and economic growth in Liaoning Province. Energy Policy 2016, 97, 414–420. [Google Scholar] [CrossRef]
- Wang, Q.; Wang, S. A comparison of decomposition the decoupling carbon emissions from economic growth in transport sector of selected provinces in eastern, central and western China. J. Clean. Prod. 2019, 229, 570–581. [Google Scholar] [CrossRef]
- Wang, Q.; Jiang, X.T.; Li, R. Comparative decoupling analysis of energy-related carbon emission from electric output of electricity sector in Shandong Province, China. Energy 2017, 127, 78–88. [Google Scholar] [CrossRef]
- Zhou, X.; Zhang, M.; Zhou, M.; Zhou, M. A comparative study on decoupling relationship and influence factors between China’s regional economic development and industrial energy–related carbon emissions. J. Clean. Prod. 2017, 142, 783–800. [Google Scholar] [CrossRef]
- Wang, Q.; Zhao, M.; Li, R. Decoupling sectoral economic output from carbon emissions on city level: A comparative study of Beijing and Shanghai, China. J. Clean. Prod. 2019, 209, 126–133. [Google Scholar] [CrossRef]
- Wang, Z.; Yang, L. Delinking indicators on regional industry development and carbon emissions: Beijing–Tianjin–Hebei economic band case. Ecol. Indic. 2015, 48, 41–48. [Google Scholar] [CrossRef]
- Wang, M.; Feng, C. Decomposition of energy-related CO2 emissions in China: An empirical analysis based on provincial panel data of three sectors. Appl. Energy 2017, 190, 772–787. [Google Scholar] [CrossRef]
- Wang, M.; Feng, C. Decoupling economic growth from carbon dioxide emissions in China’s metal industrial sectors: A technological and efficiency perspective. Sci. Total Environ. 2019, 691, 1173–1181. [Google Scholar] [CrossRef]
- Cao, Z.; Shen, L.; Zhao, J.; Liu, L.; Zhong, S.; Sun, Y.; Yang, Y. Toward a better practice for estimating the CO2 emission factors of cement production: An experience from China. J. Clean. Prod. 2016, 139, 527–539. [Google Scholar] [CrossRef]
- Xie, P.; Gao, S.; Sun, F. An analysis of the decoupling relationship between CO2 emission in power industry and GDP in China based on LMDI method. J. Clean. Prod. 2019, 211, 598–606. [Google Scholar] [CrossRef]
- Tapio, P. Towards a theory of decoupling: Degrees of decoupling in the EU and the case of road traffic in Finland between 1970 and 2001. Transp. Policy 2005, 12, 137–151. [Google Scholar] [CrossRef] [Green Version]
- Diakoulaki, D.; Mandaraka, M. Decomposition analysis for assessing the progress in decoupling industrial growth from CO2 emissions in the EU manufacturing sector. Energy Econ. 2007, 29, 636–664. [Google Scholar] [CrossRef]
- De Freitas, L.C.; Kaneko, S. Decomposing the decoupling of CO2 emissions and economic growth in Brazil. Ecol. Econ. 2011, 70, 1459–1469. [Google Scholar] [CrossRef]
- Zhang, M.; Wang, W. Decouple indicators on the CO2 emission-economic growth linkage: The Jiangsu Province case. Ecol. Indic. 2013, 32, 239–244. [Google Scholar] [CrossRef]
- Zhang, Y.J.; Da, Y.B. The decomposition of energy-related carbon emission and its decoupling with economic growth in China. Renew. Sustain. Energy Rev. 2015, 41, 1255–1266. [Google Scholar] [CrossRef]
- Lu, Q.; Yang, H.; Huang, X.; Chuai, X.; Wu, C. Multi-sectoral decomposition in decoupling industrial growth from carbon emissions in the developed Jiangsu Province, China. Energy 2015, 82, 414–425. [Google Scholar] [CrossRef]
- Chen, J.; Wang, P.; Cui, L.; Huang, S.; Song, M. Decomposition and decoupling analysis of CO2 emissions in OECD. Appl. Energy 2018, 231, 937–950. [Google Scholar] [CrossRef]
- Wang, Q.; Zhao, M.; Li, R.; Su, M. Decomposition and decoupling analysis of carbon emissions from economic growth: A comparative study of China and the United States. J. Clean. Prod. 2018, 197, 178–184. [Google Scholar] [CrossRef]
- Wang, M.; Feng, C. Decomposing the change in energy consumption in China’s nonferrous metal industry: An empirical analysis based on the LMDI method. Renew. Sustain. Energy Rev. 2018, 82, 2652–2663. [Google Scholar] [CrossRef]
- Shuai, C.; Chen, X.; Wu, Y.; Zhang, Y.; Tan, Y. A three-step strategy for decoupling economic growth from carbon emission: Empirical evidences from 133 countries. Sci. Total Environ. 2019, 646, 524–543. [Google Scholar] [CrossRef]
- Wu, Y.; Tam, V.W.; Shuai, C.; Shen, L.; Zhang, Y.; Liao, S. Decoupling China’s economic growth from carbon emissions: Empirical studies from 30 Chinese provinces (2001–2015). Sci. Total Environ. 2019, 656, 576–588. [Google Scholar] [CrossRef]
- Yu, Y.; Zhou, L.; Zhou, W.; Ren, H.; Kharrazi, A.; Ma, T.; Zhu, B. Decoupling environmental pressure from economic growth on city level: The Case Study of Chongqing in China. Ecol. Indic. 2017, 75, 27–35. [Google Scholar] [CrossRef]
- Zhang, M.; Liu, X.; Wang, W.; Zhou, M. Decomposition analysis of CO2 emissions from electricity generation in China. Energy Policy 2013, 52, 159–165. [Google Scholar] [CrossRef]
- Zheng, X.; Wang, R.; He, Q. A city-scale decomposition and decoupling analysis of carbon dioxide emissions: A case study of China. J. Clean. Prod. 2019, 238, 117824. [Google Scholar] [CrossRef]
- Hang, Y.; Wang, Q.; Zhou, D.; Zhang, L. Factors influencing the progress in decoupling economic growth from carbon dioxide emissions in China’s manufacturing industry. Resour. Conserv. Recycl. 2019, 146, 77–88. [Google Scholar] [CrossRef]
- Lin, B.; Ouyang, X. Analysis of energy-related CO2 (carbon dioxide) emissions and reduction potential in the Chinese non-metallic mineral products industry. Energy 2014, 68, 688–697. [Google Scholar] [CrossRef]
- Ma, X.; Wang, C.; Dong, B.; Gu, G.; Chen, R.; Li, Y.; Zou, H.; Zhang, W.; Li, Q. Carbon emissions from energy consumption in China: Its measurement and driving factors. Sci. Total Environ. 2019, 648, 1411–1420. [Google Scholar] [CrossRef]
- Cao, Z.; Shen, L.; Liu, L.; Zhong, S. Analysis on major drivers of cement consumption during the urbanization process in China. J. Clean. Prod. 2016, 133, 304–313. [Google Scholar] [CrossRef]
- Spreafico, C. Quantifying the advantages of TRIZ in sustainability through life cycle assessment. J. Clean. Prod. 2021, 303, 126955. [Google Scholar] [CrossRef]
- Zhang, Y.; Zhang, J.; Yang, Z.; Li, S. Regional differences in the factors that influence China’s energy-related carbon emissions, and potential mitigation strategies. Energy Policy 2011, 39, 7712–7718. [Google Scholar] [CrossRef]
- Lu, I.J.; Lin, S.J.; Lewis, C. Decomposition and decoupling effects of carbon dioxide emission from highway transportation in Taiwan, Germany, Japan and South Korea. Energy Policy 2007, 35, 3226–3235. [Google Scholar] [CrossRef]
- Tan, Z.; Li, L.; Wang, J.; Wang, J. Examining the driving forces for improving China’s CO2 emission intensity using the decomposing method. Appl. Energy 2011, 88, 4496–4504. [Google Scholar] [CrossRef]
- Moutinho, V.; Moreira, A.C.; Silva, P.M. The driving forces of change in energy-related CO2 emissions in Eastern, Western, Northern and Southern Europe: The LMDI approach to decomposition analysis. Renew. Sustain. Energy Rev. 2015, 50, 1485–1499. [Google Scholar] [CrossRef]
- Cansino, J.M.; Sánchez-Braza, A.; Rodríguez-Arévalo, M.L. Driving forces of Spain’s CO2 emissions: A LMDI decomposition approach. Renew. Sustain. Energy Rev. 2015, 48, 749–759. [Google Scholar] [CrossRef]
- Mousavi, B.; Lopez, N.S.A.; Biona, J.B.M.; Chiu, A.S.; Blesl, M. Driving forces of Iran’s CO2 emissions from energy consumption: An LMDI decomposition approach. Appl. Energy 2017, 206, 804–814. [Google Scholar] [CrossRef]
- IPCC. Greenhouse Gas Inventory: IPCC Guidelines for National Greenhouse Gas Inventories; United Kingdom Meteorological Office: Bracknell, UK, 2006.
- CESY (China Energy Statistical Yearbook). 2011–2015. National Bureau of Statistics of China, National Development and Reform Commission. Available online: http://navi.cnki.net/knavi/YearbookDetail?pcode=CYFD&pykm=YCXME (accessed on 9 January 2020).
- CISY (China Industrial Statistical Yearbook). 2010–2015. National Bureau of Statistics of China, National Development and Reform Commission. Available online: http://navi.cnki.net/knavi/YearbookDetail?pcode=CYFD&pykm=YZGJN (accessed on 9 January 2020).
- Wang, Y.; Xie, T.; Yang, S. Carbon emission and its decoupling research of transportation in Jiangsu Province. J. Clean. Prod. 2017, 142, 907–914. [Google Scholar] [CrossRef]
- Wang, M.; Feng, C. Investigating the drivers of energy-related CO2, emissions in china’s industrial sector: From regional and provincial perspectives. Struct. Chang. Econ. Dyn. 2018, 46, 136–147. [Google Scholar] [CrossRef]
- Wang, M.; Feng, C. Exploring the driving forces of energy-related CO2 emissions in China’s construction industry by utilizing production-theoretical decomposition analysis. J. Clean. Prod. 2018, 202, 710–719. [Google Scholar] [CrossRef]
Figure 1.
Industrial output, energy consumption and energy intensity from 2011 to 2015.

Figure 2.
The annual rates of change in ICEs in Jiangsu and the three regions from 2011 to 2015.

Figure 3.
ICEs of 13 prefecture-level cities in Jiangsu and their contributions from 2011 to 2015.

Figure 4.
Spatial differences in the decoupling of EG and ICEs in Jiangsu from 2011 to 2013 (a), 2013 to 2015 (b) and 2011 to 2015 (c).
Figure 4.
Spatial differences in the decoupling of EG and ICEs in Jiangsu from 2011 to 2013 (a), 2013 to 2015 (b) and 2011 to 2015 (c).


Figure 5.
Decoupling results of EG and CEs for 13 prefecture-level cities in Jiangsu Province from 2011 to 2015.
Figure 5.
Decoupling results of EG and CEs for 13 prefecture-level cities in Jiangsu Province from 2011 to 2015.

Figure 6.
Decoupling results of EG and CEs for 13 prefecture-level cities in Jiangsu Province from 2011 to 2013.
Figure 6.
Decoupling results of EG and CEs for 13 prefecture-level cities in Jiangsu Province from 2011 to 2013.

Figure 7.
Decoupling results of EG and CEs for 13 prefecture-level cities in Jiangsu Province from 2013 to 2015.
Figure 7.
Decoupling results of EG and CEs for 13 prefecture-level cities in Jiangsu Province from 2013 to 2015.

Figure 8.
LMDI results for Jiangsu and the contribution of each factor in 2011–2013, 2013–2015 and 2011–2015.
Figure 8.
LMDI results for Jiangsu and the contribution of each factor in 2011–2013, 2013–2015 and 2011–2015.

Figure 9.
LMDI results for northern Jiangsu and the contribution of each factor from 2011 to 2013, 2013 to 2015 and 2011 to 2015.
Figure 9.
LMDI results for northern Jiangsu and the contribution of each factor from 2011 to 2013, 2013 to 2015 and 2011 to 2015.

Figure 10.
LMDI results for middle Jiangsu and the contribution of each factor from 2011 to 2013, 2013 to 2015 and 2011 to 2015.
Figure 10.
LMDI results for middle Jiangsu and the contribution of each factor from 2011 to 2013, 2013 to 2015 and 2011 to 2015.

Figure 11.
LMDI results for southern Jiangsu and the contribution of each factor from 2011 to 2013, 2013 to 2015 and 2011 to 2015.
Figure 11.
LMDI results for southern Jiangsu and the contribution of each factor from 2011 to 2013, 2013 to 2015 and 2011 to 2015.

Figure 12.
LMDI results for 13 prefecture-level cities in Jiangsu from 2011 to 2013 (A), 2013 to 2015 (B) and 2011 to 2015 (C).
Figure 12.
LMDI results for 13 prefecture-level cities in Jiangsu from 2011 to 2013 (A), 2013 to 2015 (B) and 2011 to 2015 (C).


Table 1.
The discriminant standard of the decoupling status.
| ΔCE | ΔGDP | ε | Decoupling Type |
|---|---|---|---|
| <0 | >0 | ε < 0 | Strong Decoupling (SD) |
| >0 | >0 | 0.8 ≥ ε > 0 | Weak Decoupling (WD) |
| >0 | >0 | 1.2 ≥ ε > 0.8 | Expansive Connection (EC) |
| >0 | >0 | ε > 1.2 | Expansive Negative Decoupling (END) |
| >0 | <0 | ε < 0 | Strong Negative Decoupling (SND) |
| <0 | <0 | 0.8 ≥ ε > 0 | Weak Negative Decoupling (WND) |
| <0 | <0 | 1.2 ≥ ε > 0.8 | Recessionary Connection (RC) |
| <0 | <0 | ε > 1.2 | Recessionary Decoupling (RD) |
Table 2.
Decoupling index of ICEs and EG in the three regions for the periods of 2011–2013, 2013–2015 and 2011–2015.
Table 2.
Decoupling index of ICEs and EG in the three regions for the periods of 2011–2013, 2013–2015 and 2011–2015.
| Region | Year | ∆C/CO2 | ∆GDP/GDP | φC, GDP | State |
|---|---|---|---|---|---|
| Southern Jiangsu | 2011–2013 | 0.273% | −0.62% | −0.4422 | SND |
| 2013–2015 | −0.159% | 1.75% | −0.0912 | SD | |
| 2011–2015 | 0.092% | 1.12% | 0.0819 | WD | |
| Middle Jiangsu | 2011–2013 | −0.878% | 5.36% | −0.1639 | SD |
| 2013–2015 | −0.368% | −7.61% | 0.0483 | WND | |
| 2011–2015 | −1.169% | −2.67% | 0.4384 | WND | |
| Northern Jiangsu | 2011–2013 | 3.680% | 64.91% | 0.0567 | WD |
| 2013–2015 | −2.122% | −29.00% | 0.0891 | WND | |
| 2011–2015 | 0.457% | 17.08% | 0.0268 | WD | |
| Jiangsu | 2011–2013 | 0.001% | 11.41% | 0.5506 | WD |
| 2013–2015 | −0.005% | −7.33% | −0.6144 | SND | |
| 2011–2015 | −0.005% | 3.24% | 1.5171 | END |
Publisher’s Note: MDPI stays neutral with regard to jurisdictional claims in published maps and institutional affiliations. |
© 2022 by the authors. Licensee MDPI, Basel, Switzerland. This article is an open access article distributed under the terms and conditions of the Creative Commons Attribution (CC BY) license (https://creativecommons.org/licenses/by/4.0/).
Share and Cite
MDPI and ACS Style
Liu, J.; Li, H.; Liu, T. Decoupling Regional Economic Growth from Industrial CO2 Emissions: Empirical Evidence from the 13 Prefecture-Level Cities in Jiangsu Province. Sustainability 2022, 14, 2733. https://doi.org/10.3390/su14052733
AMA Style
Liu J, Li H, Liu T. Decoupling Regional Economic Growth from Industrial CO2 Emissions: Empirical Evidence from the 13 Prefecture-Level Cities in Jiangsu Province. Sustainability. 2022; 14(5):2733. https://doi.org/10.3390/su14052733
Chicago/Turabian StyleLiu, Jingxing, Hailing Li, and Tianqi Liu. 2022. "Decoupling Regional Economic Growth from Industrial CO2 Emissions: Empirical Evidence from the 13 Prefecture-Level Cities in Jiangsu Province" Sustainability 14, no. 5: 2733. https://doi.org/10.3390/su14052733
Note that from the first issue of 2016, this journal uses article numbers instead of page numbers. See further details here.