Article

Power Management and Control of a Hybrid Electric Vehicle Based on Photovoltaic, Fuel Cells, and Battery Energy Sources

1
Processes, Energy, Environment and Electrical Systems (Code: LR18ES34), National Engineering School of Gabès, University of Gabès, Gabès 6072, Tunisia
2
Department of Electrical Engineering, College of Engineering, Majmaah University, Al-Majmaah 11952, Saudi Arabia
3
Electrical Engineering Department, Mirpur University of Science and Technology, Mirpur 10250, Pakistan
4
School of Computing and Engineering, Institute for Innovation in Sustainable Engineering, University of Derby, Derby DE22 1GB, UK
*
Author to whom correspondence should be addressed.
Sustainability 2022, 14(5), 2551; https://doi.org/10.3390/su14052551
Submission received: 8 December 2021 / Revised: 15 February 2022 / Accepted: 16 February 2022 / Published: 23 February 2022
(This article belongs to the Special Issue Sustainability of Distributed Generation through Virtual Power Plant)

Abstract

:
This paper deals with an energy management problem to ensure the best performance of the recharging tools used in electric vehicles. The main objective of this work is to find the optimal condition for controlling a hybrid recharging system by regrouping the photovoltaic cells and fuel cells. The photovoltaic and fuel cell systems were connected in parallel via two converters to feed either a lithium battery bank or the main traction motor. This combination of energy sources resulted in a hybrid recharging system. The mathematical model of the overall recharging system and the designed power management loop was developed, taking into account multiple aspects, including vehicle loading, the stepwise mathematical modelling of each component, and a detailed discussion of the required electronic equipment. Finally, a simplistic management loop was designed and implemented. Multiple case studies were simulated, statistical approaches were used to quantify the contribution of each recharging method, and the benefits of the combination of the two sources were evaluated. The energetic performance of an electric vehicle with the proposed hybrid recharging tool under various conditions, including static and dynamic modes, was simulated using the MATLAB/Simulink tool. The results suggest that despite the additional weight of PV panels, the combination of the PV and FC systems improves the vehicle’s energetic performance and provides a higher charging capacity instead of using an FC alone. A comparison with similar studies revealed that the proposed model has a higher efficiency. Finally, the benefits and drawbacks of each solution are discussed to emphasise the significance of the hybrid recharging system.

1. Introduction

The efficiency of the hybrid electric vehicle (HEV) powertrain depends entirely on the performance of the driving behaviour and the devices used, such as converters, switches, and motor drives [1]. Apart from the HEV physical components, significant improvements are being made in HEV software to improve the efficiency of the systems [2].
Generally, an HEV consists of an internal combustion engine (ICE) and a motor for propulsion. Vehicle manufacturers are focusing on HEVs because environmental safety has become a global concern. Hydrogen was introduced as a fuel source for vehicles to keep the atmosphere clean. Fuel cells (FCs) have been considered as a possible solution to replace traditional gasoline vehicles (GVs) [3,4,5,6]. This is due to limited emissions, less reliance on crude oil, and the heightened fuel economy, which could significantly improve air quality, energy stability, and climate change. Based on the advantages of FC systems and the benefits of renewable energy systems, integrating photovoltaic cells into electric vehicles can potentially increase their available energy, even if they are on the road [5,7].
Many modelling studies focusing on the transient power characteristics of FC systems have been conducted, such as [8,9]. In addition, much research has focused on the fuel-cycle analysis of emissions and the energy consumption of transportation fuels, as found in [10]. However, few studies have examined the efficiency of fuel cell systems in relation to fuel-cycle emissions and energy consumption [11]. Some studies have analysed hybrid FC and PV systems, such as [12,13], which aimed to find a simple and efficient control topology.
This study proposes a new multi-source system for EVs that comprises an FC system, a PV system, and a battery system. It tests and validates whether the integration of PV cells with the FC solution will be advantageous to solve the constraints of the existing literature. A hybrid energy source is created for HEVs by combining FC and PV systems, which can be used to recharge a vehicle. This study aims to optimise the efficiency for improving vehicle autonomy by coupling these energy sources. Therefore, a power management control loop was designed to control these two energy sources to help charge vehicles in three different cases. The results of this study indicate a difference when using a combination of energy sources and proves that integrating PV cells is profitable, even if additional weight is introduced [14,15].
Thus, the energy efficiency of the hybrid recharging tool was tested under various simulation conditions. The importance of this hybrid system was validated by monitoring the battery’s state of charge (SOC) while the vehicle was accelerating under different values, and the energetic performance was compared. This analysis also produced statistical results that classified and organised the proposed recharging solutions according to vehicle speed and then found the best conditions for each studied recharging solution. Thus, this paper presents an approach to managing the hybrid energy source in an EV to optimise the battery charging system. The proposed power management flowchart manages two energy sources [2] based on predefined rules and is fixed according to the vehicle speed and battery state of charge [16].
The rest of this paper is organised as follows. After a general introduction, the electric vehicle model is described, and its internal components are presented in Section 2. Then, in Section 3, the hybrid recharging tool is described by showing the necessary PV and FC mathematical equations. Section 4 shows the related results, which study the energetic performance of the hybrid recharging tool. This is carried out after showing the energy management block and describing its running mode. Many results are shown in this section, and a critical discussion is applied for each simulation step. Finally, Section 6 is intended for resuming this work and presents future endeavours.

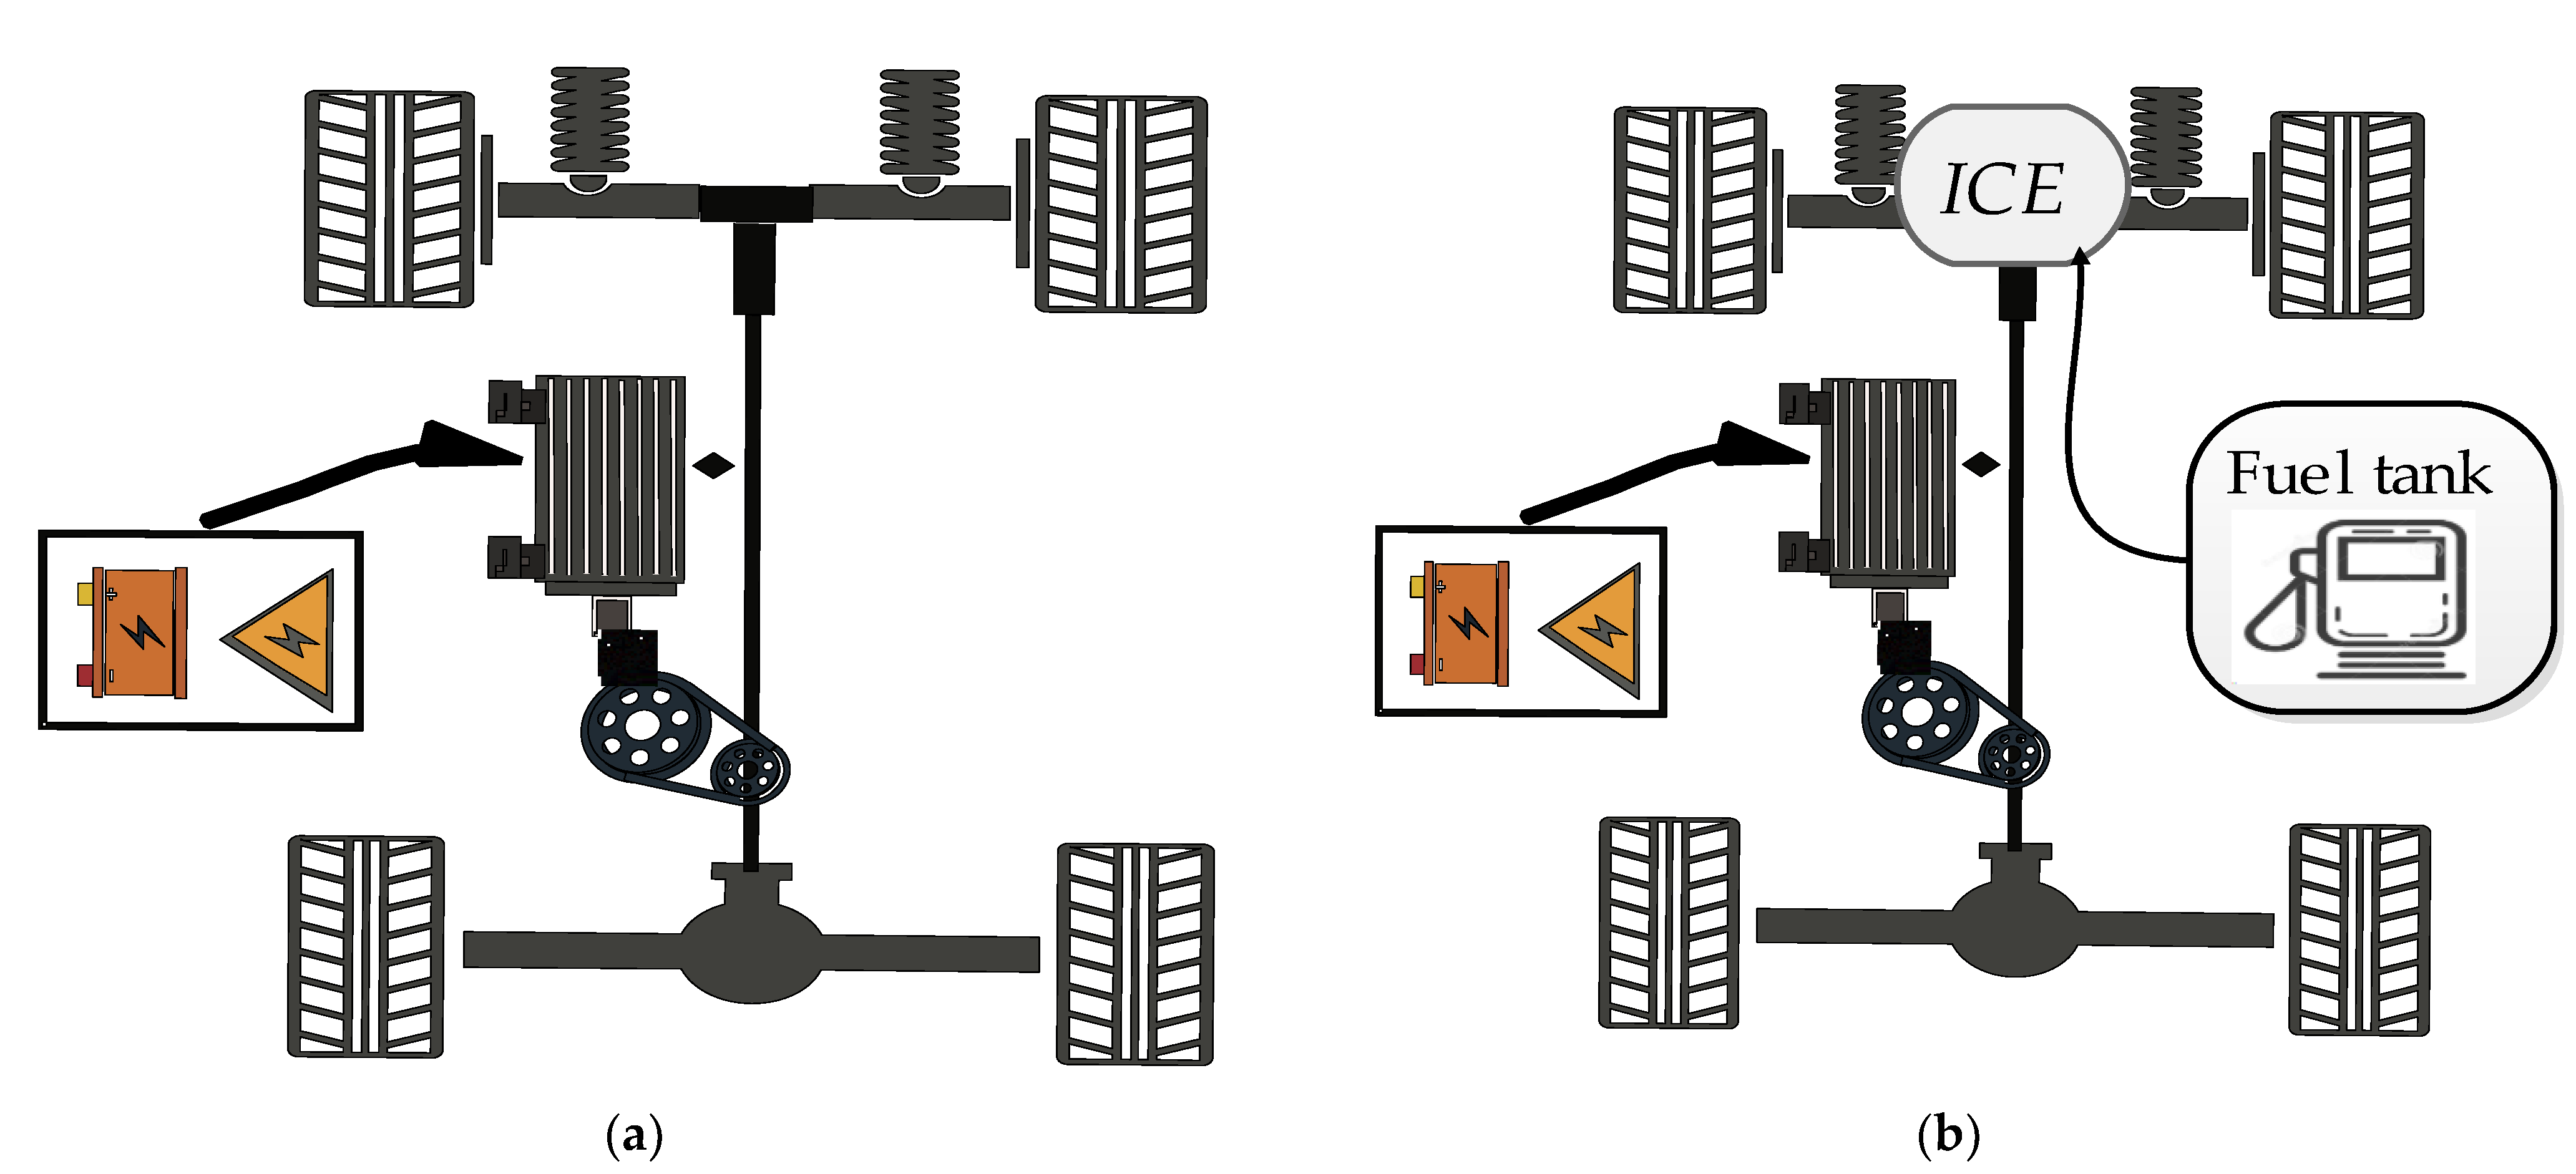
2. Electric Vehicle Description
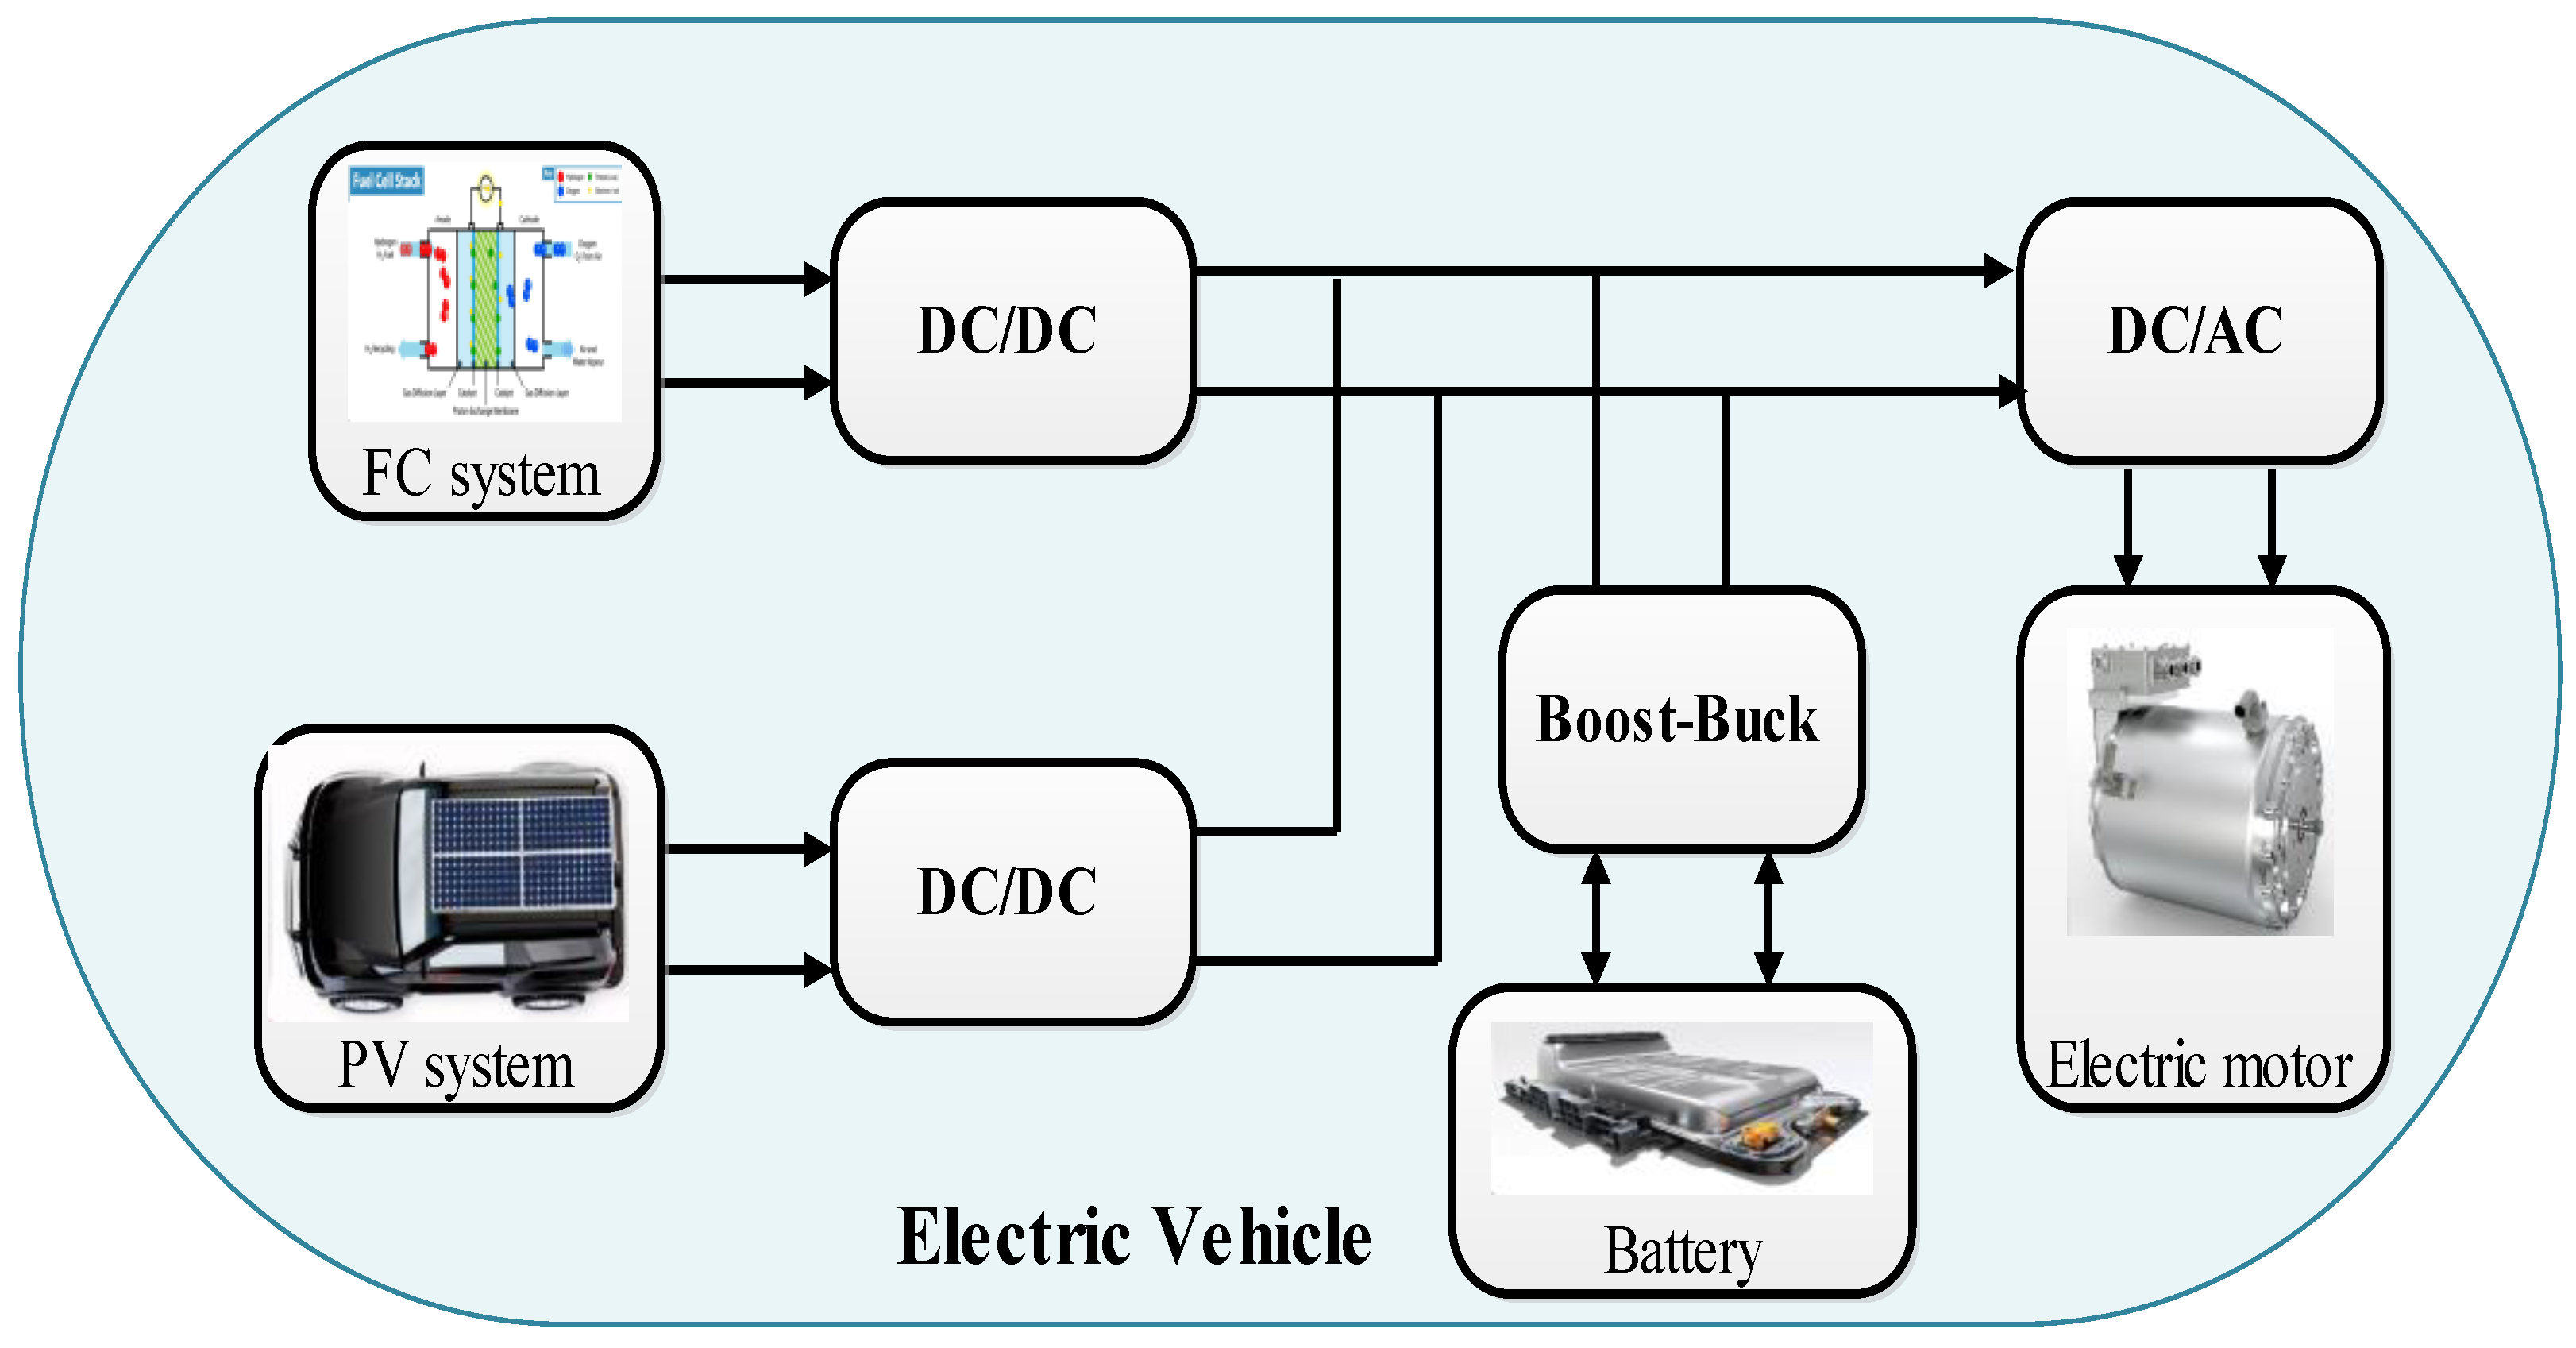
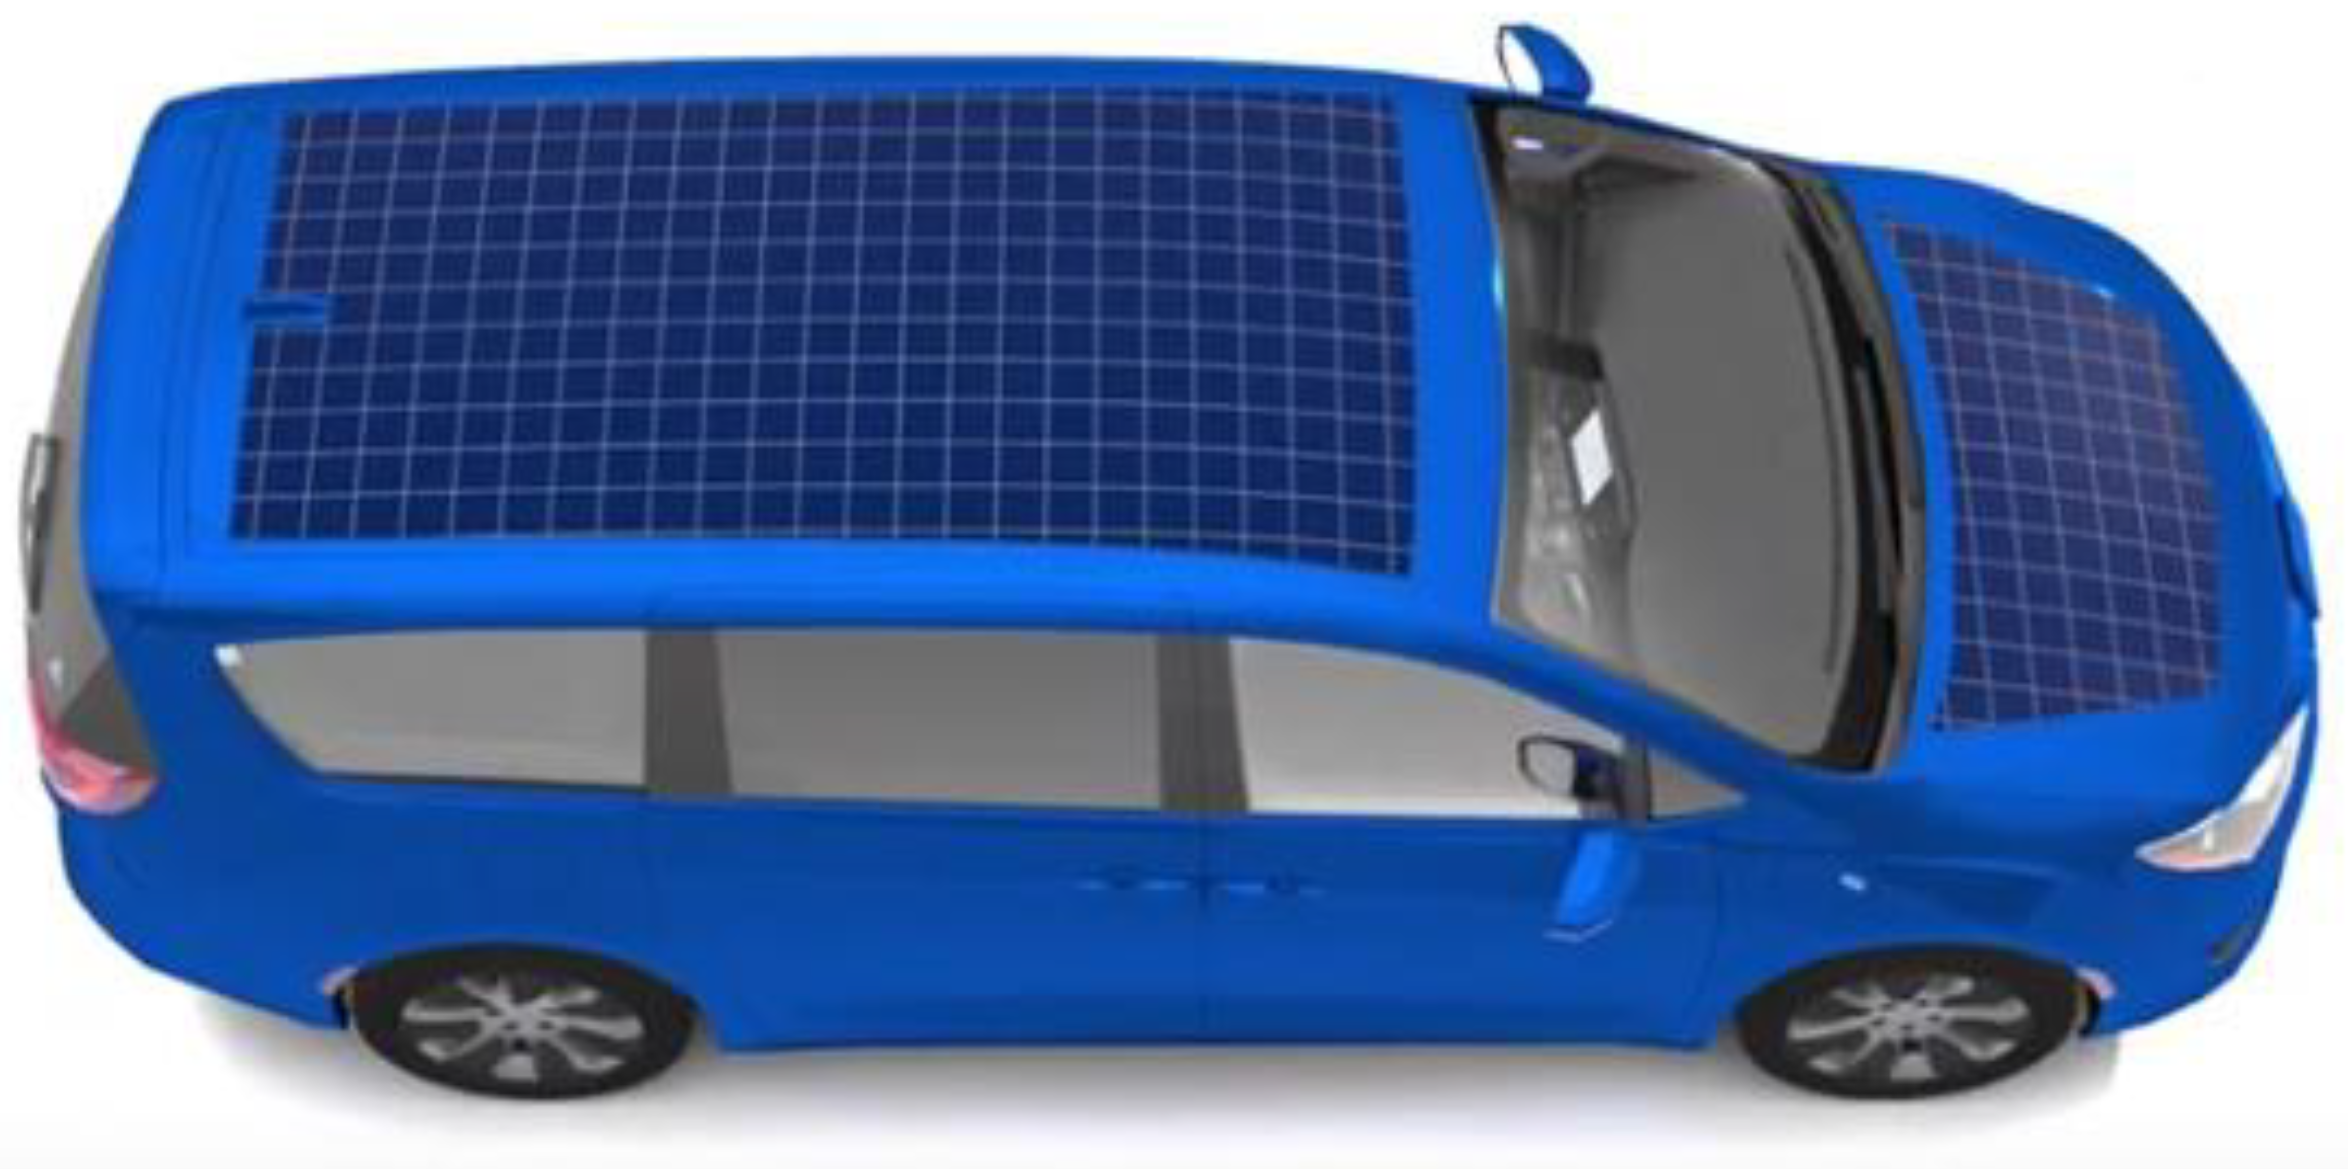
2.1. General Review

An EV is composed of two models, the hybrid version and the pure EV. Figure 1 shows the two different architectures of the pure electric vehicle model and the hybrid version. The only difference between the two models is the internal combustion engine (ICE) present in the hybrid model. The initial pack of components regroups an energy source alongside the battery system. This block is connected to an electronic power converter to feed the main electric motor. The function block needs a control system in addition to a calculator with a high-speed processor to supervise all the processes of energy management and vehicle speed control [17,18].
Many problems and advantageous descriptions can be found for each of these models in [19]. Considering the problems of the environment and gas emissions, it is easy to conclude that the pure electric vehicle field has encouraged researchers to make this transport solution more efficient. Optimising a motor’s size and improving the battery technologies by making various recharging solutions are the different fields in this research sector [20,21,22].

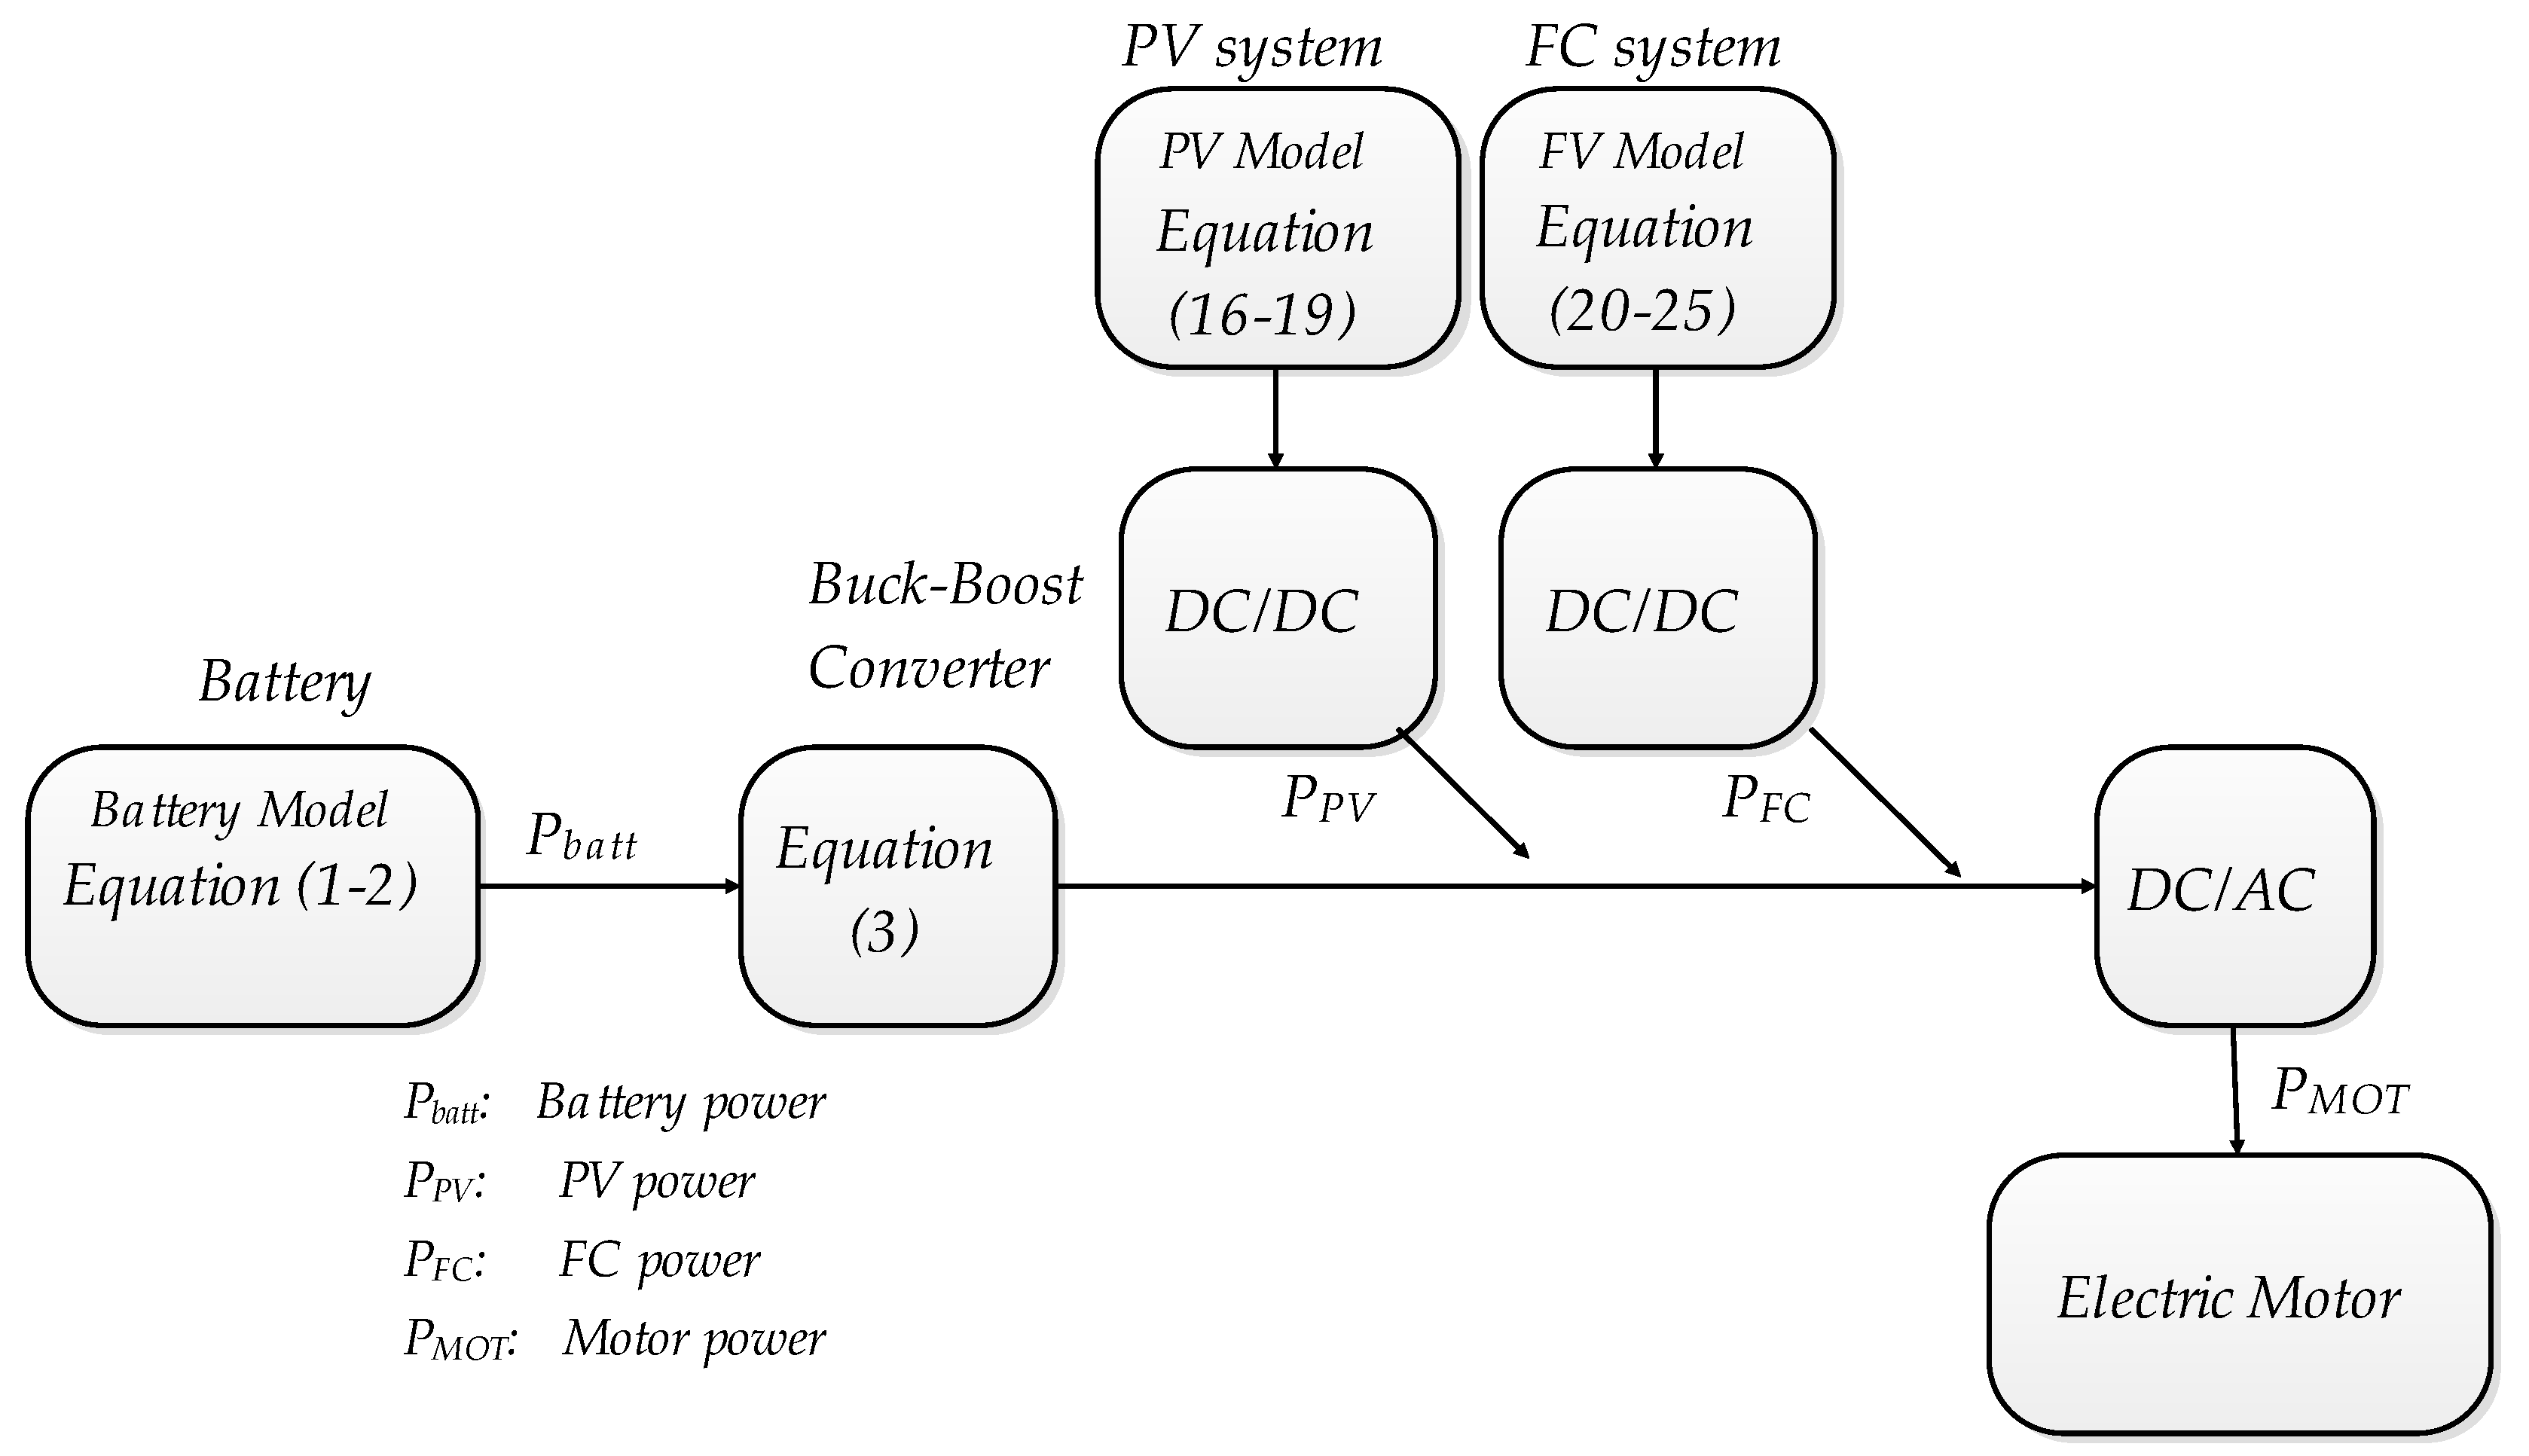
2.2. The Associated Converters in the Electric Vehicle Model

The composition of the EV systems and, particularly, the energy sources determine the energy transferred through the battery charger. The challenges of designing an HEV involve particular compositions, including a PV system, a battery system, the mechanical gear model, the fuel cell generator, the associated converters, and the main electric motor [23].
This study intends to propose a new multi-source system for EVs that comprises an FC system, PV system, and battery system. A conceptual depiction of the proposed system is given in Figure 2. The system consists of a DC/DC converter, buck-boost converter, and DC/AC converter. The DC/DC converter adjusts the electric current to charge the battery. Generally, the charging topology of electric vehicle applications comprises front-end (AC-DC) and back-end (DC-DC) converters. In the first stage of AC-DC converter topology, the power factor correction (PFC) is adjusted while the DC-DC converter topology controls the voltage level to make it appropriate for EV battery charging. Mainly, there are multiple DC-DC converters for different applications, and the desired output power level decides the converter type selection [24]. Some challenging factors, such as safety, efficiency, cost, switching frequency, and power density, need to be considered while designing a DC-DC converter for a battery charger for EVs. The DC-DC converters in EV charging applications can be divided into unidirectional and bidirectional based on charging systems [24]. The authors in [24,25] discussed several unidirectional and bidirectional DC-DC converter topologies based on EVs charging systems. The advantages of bidirectional over unidirectional converters, along with their challenging issues, are examined in detail in [26]. For a bidirectional elevator chopper topology, a double active switch is needed, while an inductor in the output is not essential, making it less costly and easy to implement. There are some DC-DC converters, such as a multi-stage integrated charging solution for EVs, which are more efficient than the one used, but the cost of the converter is very high [24,26]. Therefore, bidirectional non-isolated DC-DC converters, including conventional DC-DC converters, are common, with a low cost, high reliability, fast control, and a wide voltage range in two operating conditions [27]. These topologies are popularly used with continuous power supplies and hybrid electric cars, as they provide a high efficiency due to their high static voltage gains and low voltage stress in both boost and buck mode [24,27].
In this application, a single source or both energy sources can be used to charge the battery. The buck-boost converter is responsible for the charging or the discharging state of the battery. The charging or the discharging state depends on the electric motor’s energetic needs. When the electric motor is in the traction phase, the surplus energy from the PV and the FC sources can be used to charge the battery, whereas, in the discharging state, the battery can provide the low power to operate the motor. Three possible cases can be observed, i.e., a recharge using only the PV system, a recharge using only the FC system, or the hybrid recharge using two energy sources.

3. The main Components of the Electric Vehicle

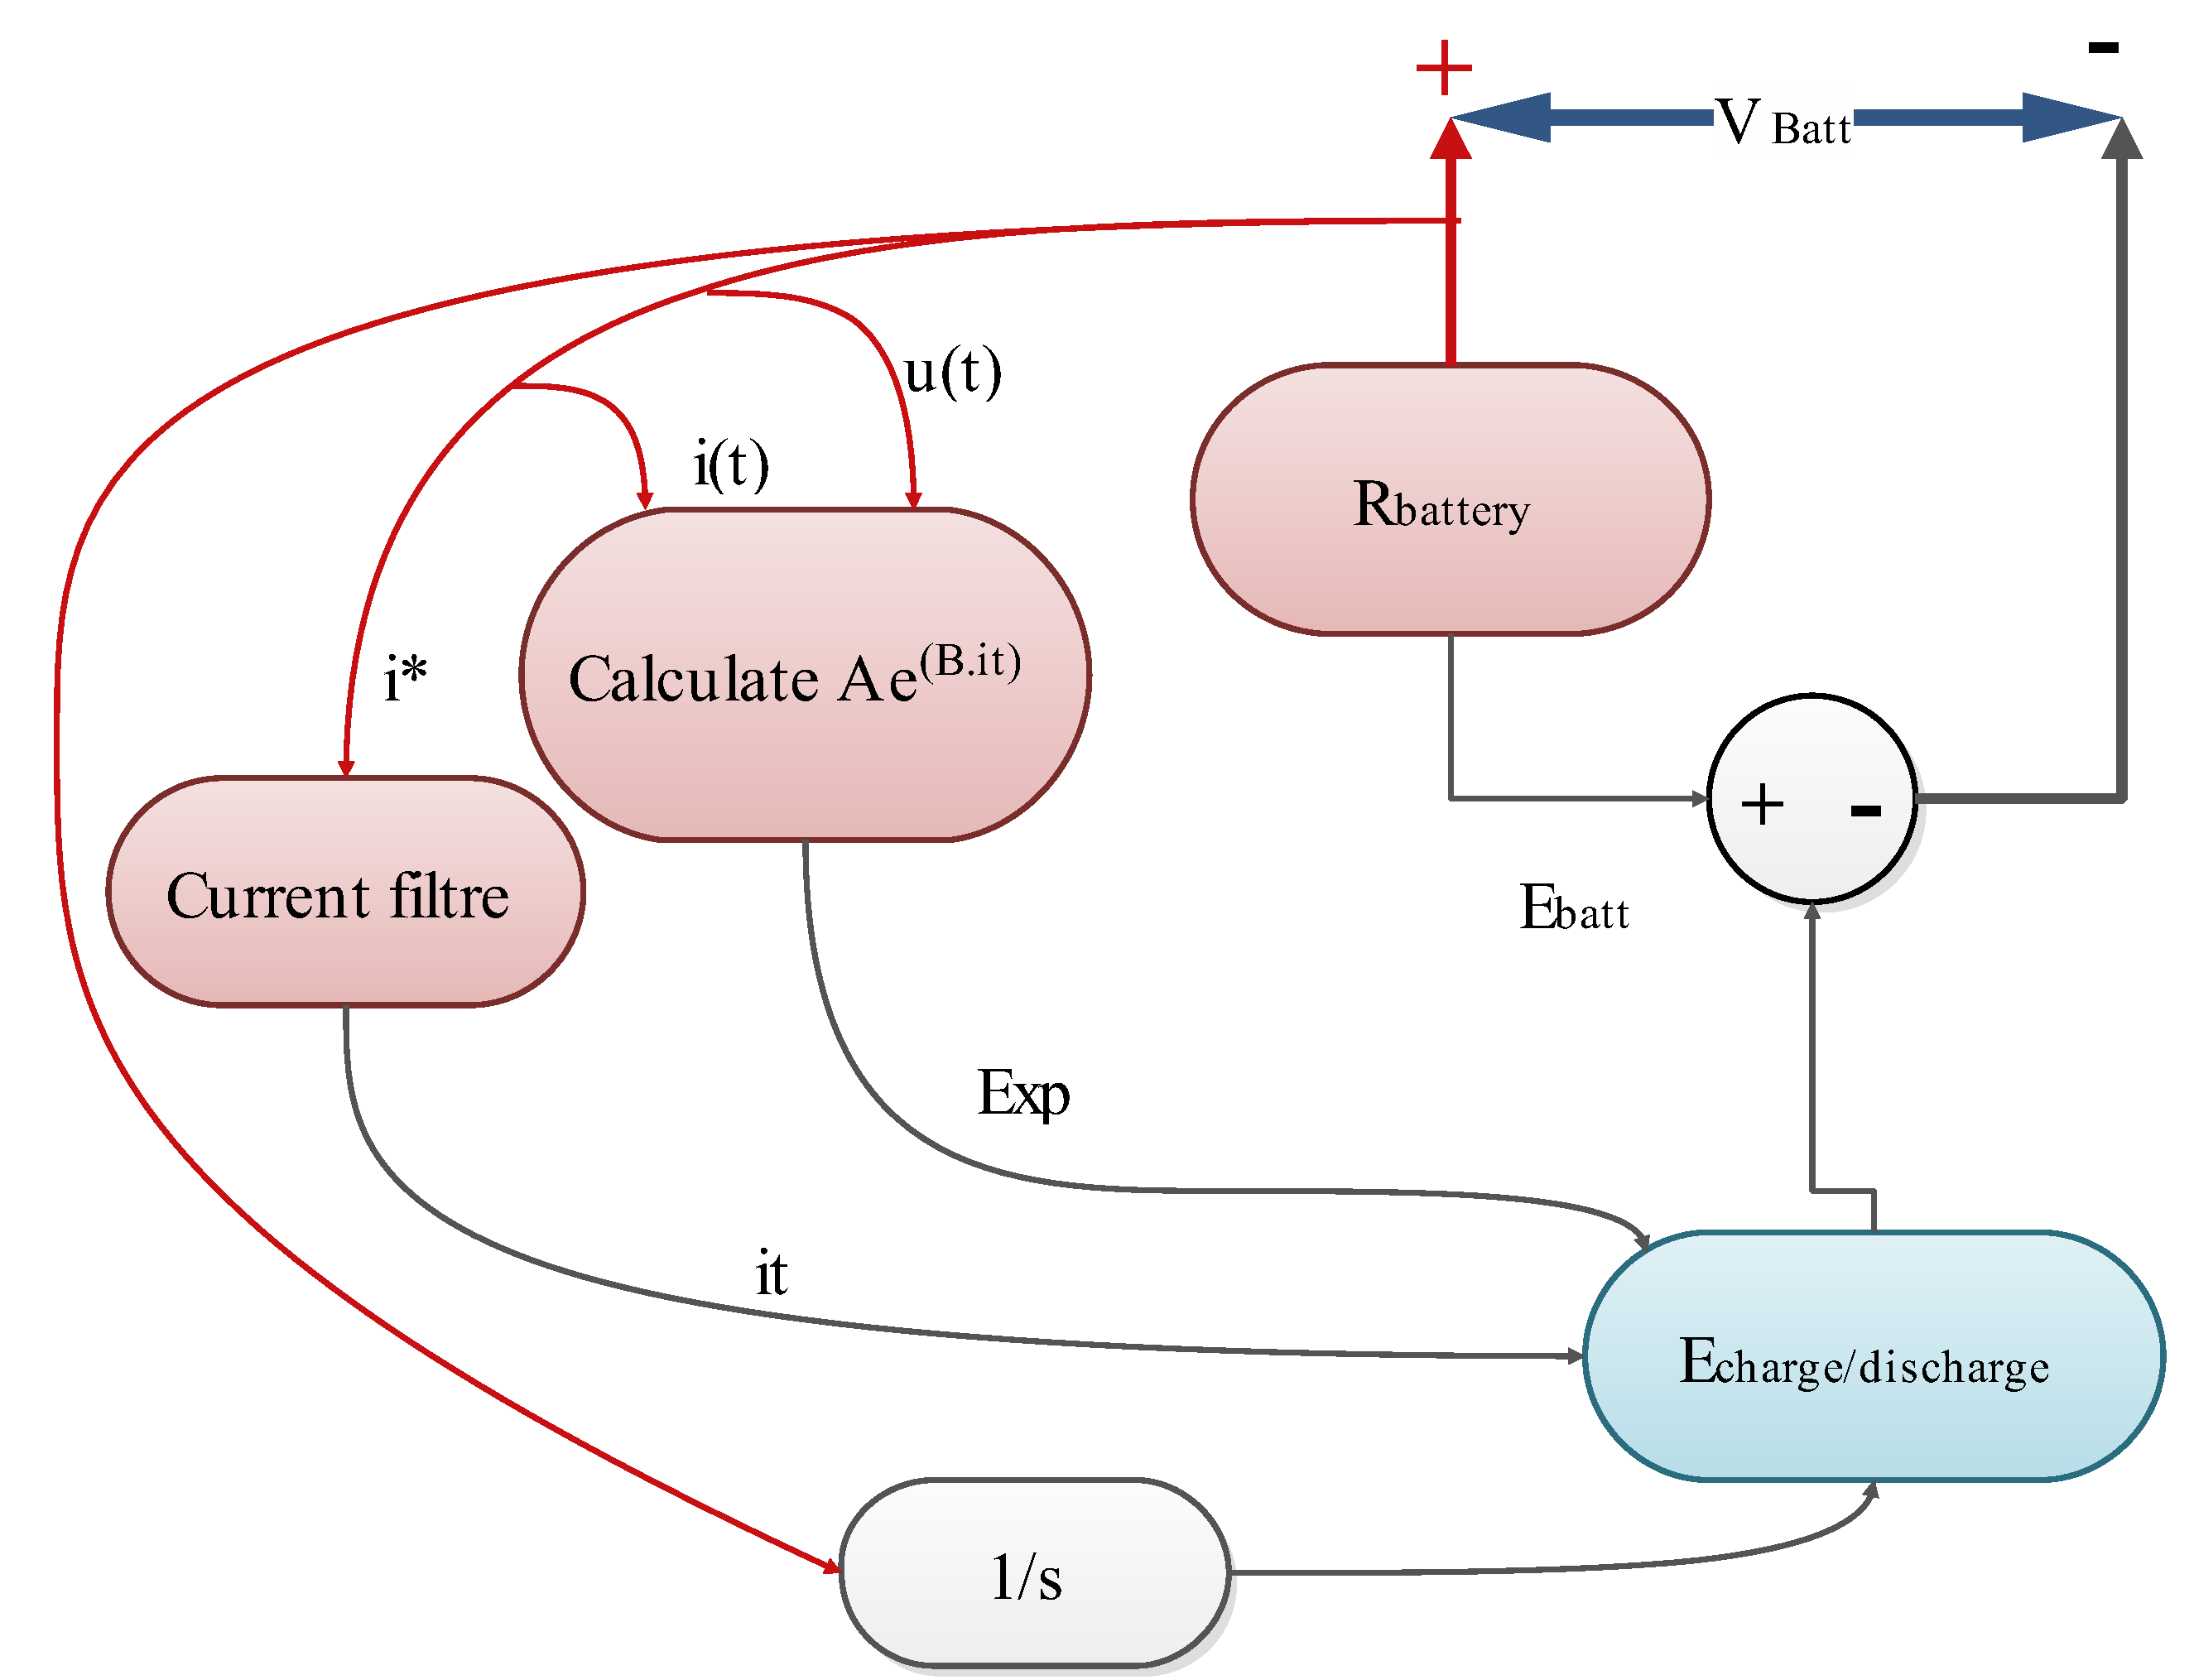
3.1. Lithium-Ion Battery Model

Numerous battery models can be found in the existing literature, as indicated in these studies [28,29]. The lithium model can provide optimum performance, and its detailed function is given in Figure 3 [30,31,32].
The battery voltage model, noted by Echarge/discharge [31,33], can be defined in Equation (1), and this equation is also used to calculate the nonlinear voltage Ebatt.
{ E c h a r g e = E 0 K Q Q i t × i t K × Q Q i t × i * + A × e ( B · i t ) E d i s c h a r g e = E 0 K Q Q i t × i t K × Q 0.1   Q + i t × i * + A × e ( B · i t )
The state of charge can be calculated using Equation (2):
{ S O C = Q ( t ) Q M a x × 100 Q ( t ) = Q ( 0 ) 0 t η b I b d t
where Ib = battery current and ηb = battery performance [34].
These two equations were used inside a battery power model to generate the equivalent battery power noted by Pbatt. The details of this mathematical model can be found in [35].

3.2. Electronic Equipment for The Recharging Solution

3.2.1. Bidirectional Converter

The electrical system of an electric vehicle depends mainly on a group of converters. The buck-boost converter, based on semiconductors, is the most important element inside this loop. Wide band-gap semiconductors, such as SiC, GaN, and diamond, are needed for megawatt power applications. Such applications require highly efficient, lightweight, high-density power converters operating at high temperatures. The specific properties of various semiconductors are listed in Table 1 [36,37,38].
The key energy source is the battery, which is connected to an electric motor through a two-quadrant DC-DC converter. The converter has two functions, i.e., a voltage minimisation step and a voltage elevation phase. In addition, they are assured by a buck-boost DC converter. These operation functions are required, as the storage system has positive and negative signs, allowing bidirectional energy transfer [39].
The bidirectional DC-DC converter operates in boost mode when the IGBTs related to the switch “S1” and the diode “D2” are closed, and it is in conduction status. Therefore, the battery is in discharging mode, and the current of the inductor, iL, has a positive sign. By merging the equation of the mesh law, the mathematical model of the DC-DC converter, which operates in boost mode, is given by the differential system as in Equation (3):
{ d i L d t = ( 1 u 1 ) L V d c + V b a t L R L i L   i b a t = ( 1 u 1 ) i L    
The bidirectional DC-DC converter operates in buck mode when the IGBTs related to the switch S2 and the diode D1 are closed so that they can conduct. Then, in this case, the battery is in charging mode and the current of the inductor, iL, has a negative sign. The mathematical model of the DC-DC converter is in buck mode and is given the same form of Equation (3) and by considering u 2 = ( 1 u 1 ) , which represents the control signal of the second IGBT.

3.2.2. Converter Losses

The power losses of the MOSFET or the IGBT in the switching or the conduction phases, the corresponding power losses of the diode in the conduction phase, and the inductor and capacitor equivalent power losses in the DC-DC boost and buck-boost converters are evaluated in this section. The following formulas that can be used to compute the equivalent losses in these components were obtained from [40] and summarised as follows:

MOSFET Losses

The drain-source on-resistance (RDS (on)) causes conduction loss in MOSFETs. Changes in the drain current and junction temperature affect the on-resistance. The voltage drop is calculated by Equation (4) [40]:
V D S ( i d , T ) = i D × R D S ( o n ) ( i D , T )
Equation (5) can be used to express the instantaneous value of the conduction loss:
P c o n , M ( t ) = V D S ( t ) × i D ( t ) = i D ( t ) 2 × R D S ( o n )
The MOSFET switching loss is primarily determined by the on and off state energy losses. The MOSFET switching loss is computed by taking into account the loss associated with the MOSFET’s on and off states. The on-state energy loss is determined without taking into account the loss associated with MOSFET reverse recovery. However, the loss associated with the anti-parallel diode’s reverse recovery process is taken into account when computing the on-state loss. The switching loss of a MOSFET is calculated as in Equation (6):
  P s w , M = ( E o n , M + E o f f , M ) f s w
The MOSFET datasheets include the values for the parameters utilised in the theoretical computation of conduction and switching losses.

IGBT Losses

The conduction and switching losses of IGBTs are estimated in the same way that MOSFET conduction and switching losses are calculated. The MOSFET drain, source, and gate are analogous to the IGBT collector, emitter, and base, respectively. The conduction loss in an IGBT is calculated as follows:
Equation (7) gives the immediate value of the conduction loss associated with IGBT:
P c o n , I G B T ( t ) = V C E ( t ) × i C ( t ) = ( V C E O + R C i C ( t ) ) i C ( t ) = V C E O i C ( t ) + R c i c   ( t ) 2
Equation (8) is the average value of the IGBT conduction loss:
P c o n , I G B T = 1 T s w 0 T s w V C E ( t ) × i C ( t ) d t = 1 T s w 0 T s w ( V C E O + R C i C ) i C ( t ) d t = V C E O I C a v + R c i C r m s 2
In this phase, the IGBT switching loss is given by Equation (9):
P s w , I G B T = ( E o n , I G B T + E o f f , I G B T ) f s w
The IGBT datasheet provided the values for the parameters needed in the theoretical calculation of the conduction and switching losses.

Diode Losses

There are two types of losses in a boost converter diode: conduction and switching losses. The conduction loss and the switching loss in diode can be expressed in Equations (10) and (11):
P c o n , D = V f D × I 0
  P s w , D = Q c × V 0 × f s w

Inductor Losses

The inductor has significant losses, such as conduction and copper losses. Equation (12) is a breakdown of these losses:
P L = I L r m s 2     R d c
w h e r e   , I L r m s 2 = I 0 2 + Δ I 2 12  
where ∆I is the ripple current and ΔI2 can be neglected.
Therefore, the inductor conduction loss can be simplified by:
P L = I 0 2 ×   R d c

Capacitor Losses

The losses in the capacitor can be stated as:
P c = I c 2 ×   E S R

4. Modelling of the Hybrid Recharging Tool

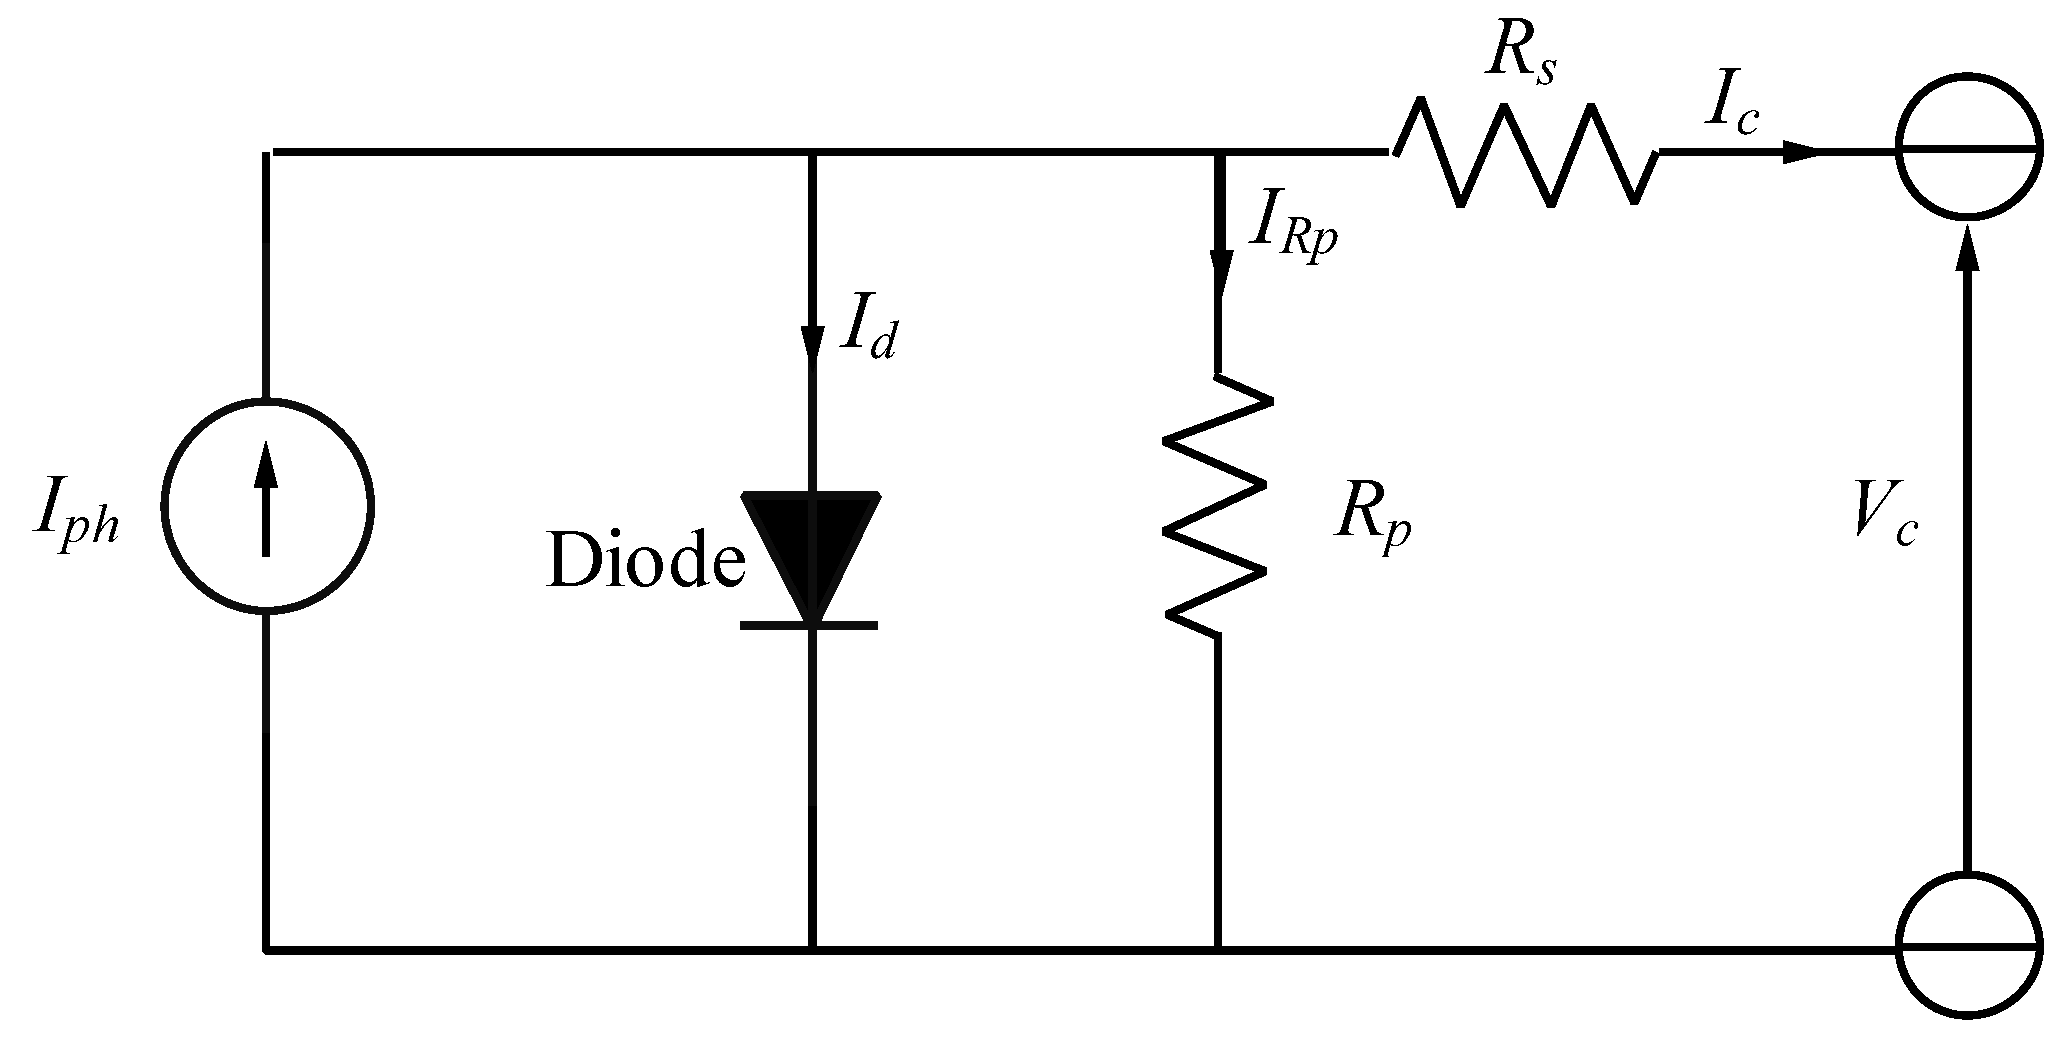
4.1. The First Recharging Tool: The Photovoltaic Generator

The PV system consists of many solar cells. They are the essential electrical component used to convert solar irradiation into electricity and can be used in different applications, including electric vehicles. Many studies have proposed numerous models for the solar cell, as in [41]. Figure 4 shows a commonly used electrical model of a solar cell [42,43].
The current, Ic, can be given by Equation (16):
I c = I p h + I s h + I d
where Ic is the cell current, Iph is the photocurrent generated by the current source, Id is the current shunted through the intrinsic diode, and Ish is the current delivered by the parallel resistance.
The current Iph (PV cell current) can be evaluated by Equation (17):
{ I p h = G G r e f ( I r s r e f + [ K S C T ( T c T c r e f ) ] ) I d = I r s ( e q ( V c + R s I c ) α k T 1 ) I s h = 1 R p ( V c + R s I c )
The PV generator model depends on the connection types (parallel or series), and the number of solar cells, Np and Ns, respectively, as shown in Figure 5 and explained in Equation (18).
{ I P = N P I C V P = N S V C
The resistances Rs are considered very small compared to Rp, and based on this supposition, the model uses Rp = ∞ and Rs = 0. So, the current, Ip, can be given by Equation (19).
I p = N p I p h [ N p I r s ( e ( q ( V p ) n β n s T c N s ) 1 ) ]
The equivalent given power from this renewable energy generator can be presented in [44], and the parameter used for calculating this energy is noted as PPV.

4.2. The Second Recharging Tool: Fuel Cell Model

The fuel cell proton exchange membrane [12] uses air and hydrogen as the fuel sources [45,46]. Equation (20) gives the rates of conversion (utilisations) of hydrogen (XfH2) and oxygen (XfO2), which are determined in block A as follows:
{ X f O 2 = n o 2 r n o 2 i n = 60 , 000 × R × T × i f c 2 × z × F × P a i r × V a i r × y % X f H 2 = n H 2 r n H 2 i n = 60 , 000 × R × T × i f c z × F × P f u e l × V f u e l × x %
The partial pressures and the Nernst voltage (En) are determined in block B and are shown in Equations (21) and (22) [12,47]:
  { P H 2 = ( 1 U f H 2 ) x % P f u e l P H 2 o = ( ω f c + 2 y % U f O 2 ) P a i r P O 2 = ( 1 U f O 2 ) y % P a i r
{ E n = 1.229 + ( T 298 ) × 44.43 z F + R T z F ln ( P H 2 × P O 2 1 2 )           w h e n   T   100   ° C E n = 1.229 + ( T 298 ) × 44.43 z F + R T z F ln ( P H 2 × P O 2 1 2 P H 2 O )             w h e n   T > 100   ° C  
where PH2O represents the partial pressure of water vapour inside the stack (atm) and w represents the oxidant percentage of water vapour (%).
Then, the exchange current (i0) and the open-circuit voltage (Eoc) can be computed based on the Nernst voltage (En) and the partial pressures of gases, as in Equations (23) and (24) [12]:
E o c = K c E n
i 0 = z F k ( P H 2 + P O 2 ) R h e ( Δ G R T )
Based on the previously cited reference [12], at nominal operating conditions, the study uses the polarisation curve while some additional parameters are taken into account. These parameters include the stack efficiency, composition of fuel and air, supply pressures, and ambient temperatures. The nominal rates of gas conversions can be computed as in Equation (25).
{ X f H 2 = η n o m Δ h ( H 2 O ) g 0 N z F V n o m X f O 2 = 60 , 000 × R × T n o m × N × I n o m 2 × z × F × P a i r n o m × V I p m ( a i r ) n o m × 0 . 21
All of these equations were used to estimate the given fuel cell power, noted PFC, and the corresponding mathematical model of this output can be found in [48].

5. Results and Discussion

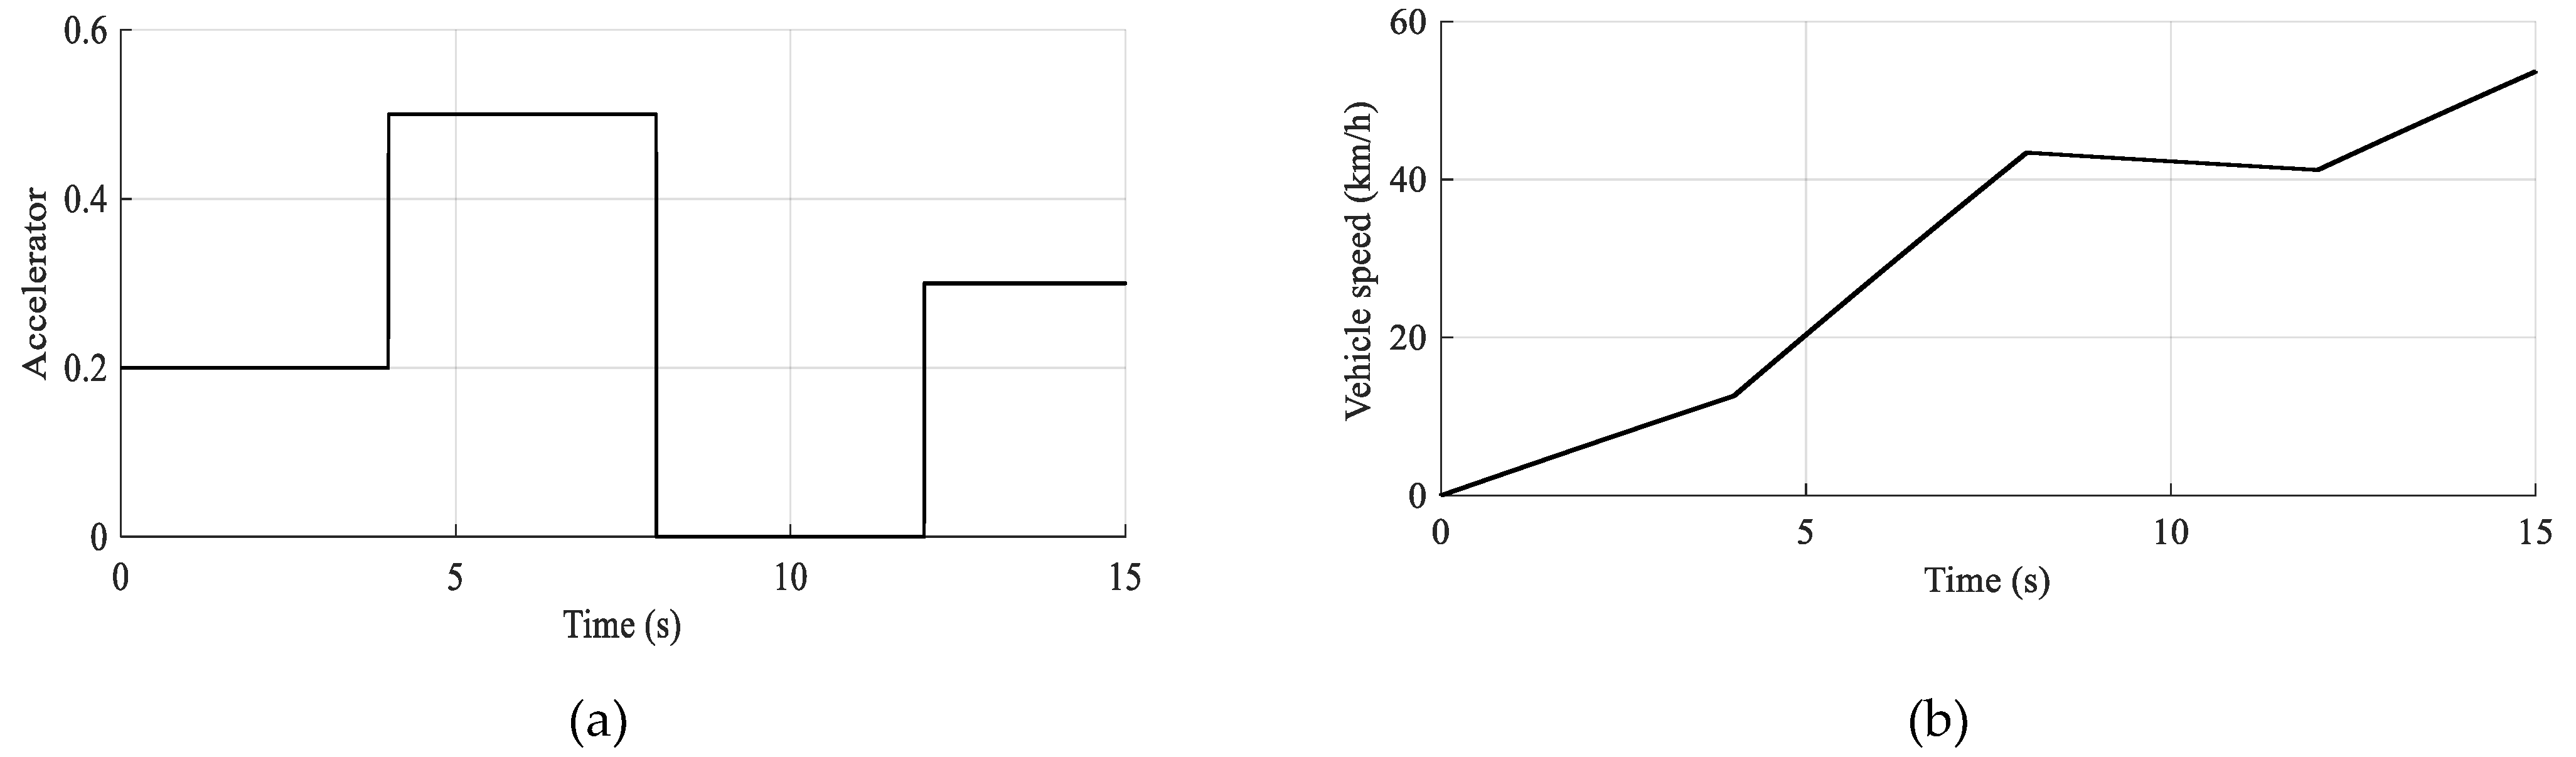
5.1. Simulation Conditions

The EV model was simulated using the MATLAB/Simulink tools. The proposed model was validated under different conditions related to the vehicle status and the hybrid system parameters. Therefore, this section presents and discusses the obtained results using the proposed models. It concentrates on the control and power management efficiency concerning electric vehicle speed. The vehicle parameters and the motor and battery pack specification used in simulations are listed in Table 2 and Table 3 [28,41]. Figure 6 shows the explanatory diagram of the overall system; this figure correlates the mathematical model with the proposed model.
Given the high costs of a lithium battery, minimising the total energy consumed is important. A more complex control strategy is needed because, in this case, the energy stored is small. It is important to detect any variables that need to be sensed, such as instant battery voltage, battery charge state, instant battery current, initial conditions of the battery, battery capacitor current, etc. The vehicle’s speed must also be taken into account, as all the energy is required when the vehicle is going to start. On the other hand, when the vehicle is operating at high speeds, the fuel cell needs to give important energy to recover the electric motor’s consumption. To test the hybrid system’s efficiency, a driving route, as presented in Figure 7a was chosen. Figure 7b gives the corresponding vehicle speed for the given acceleration form as it is in Figure 7a.

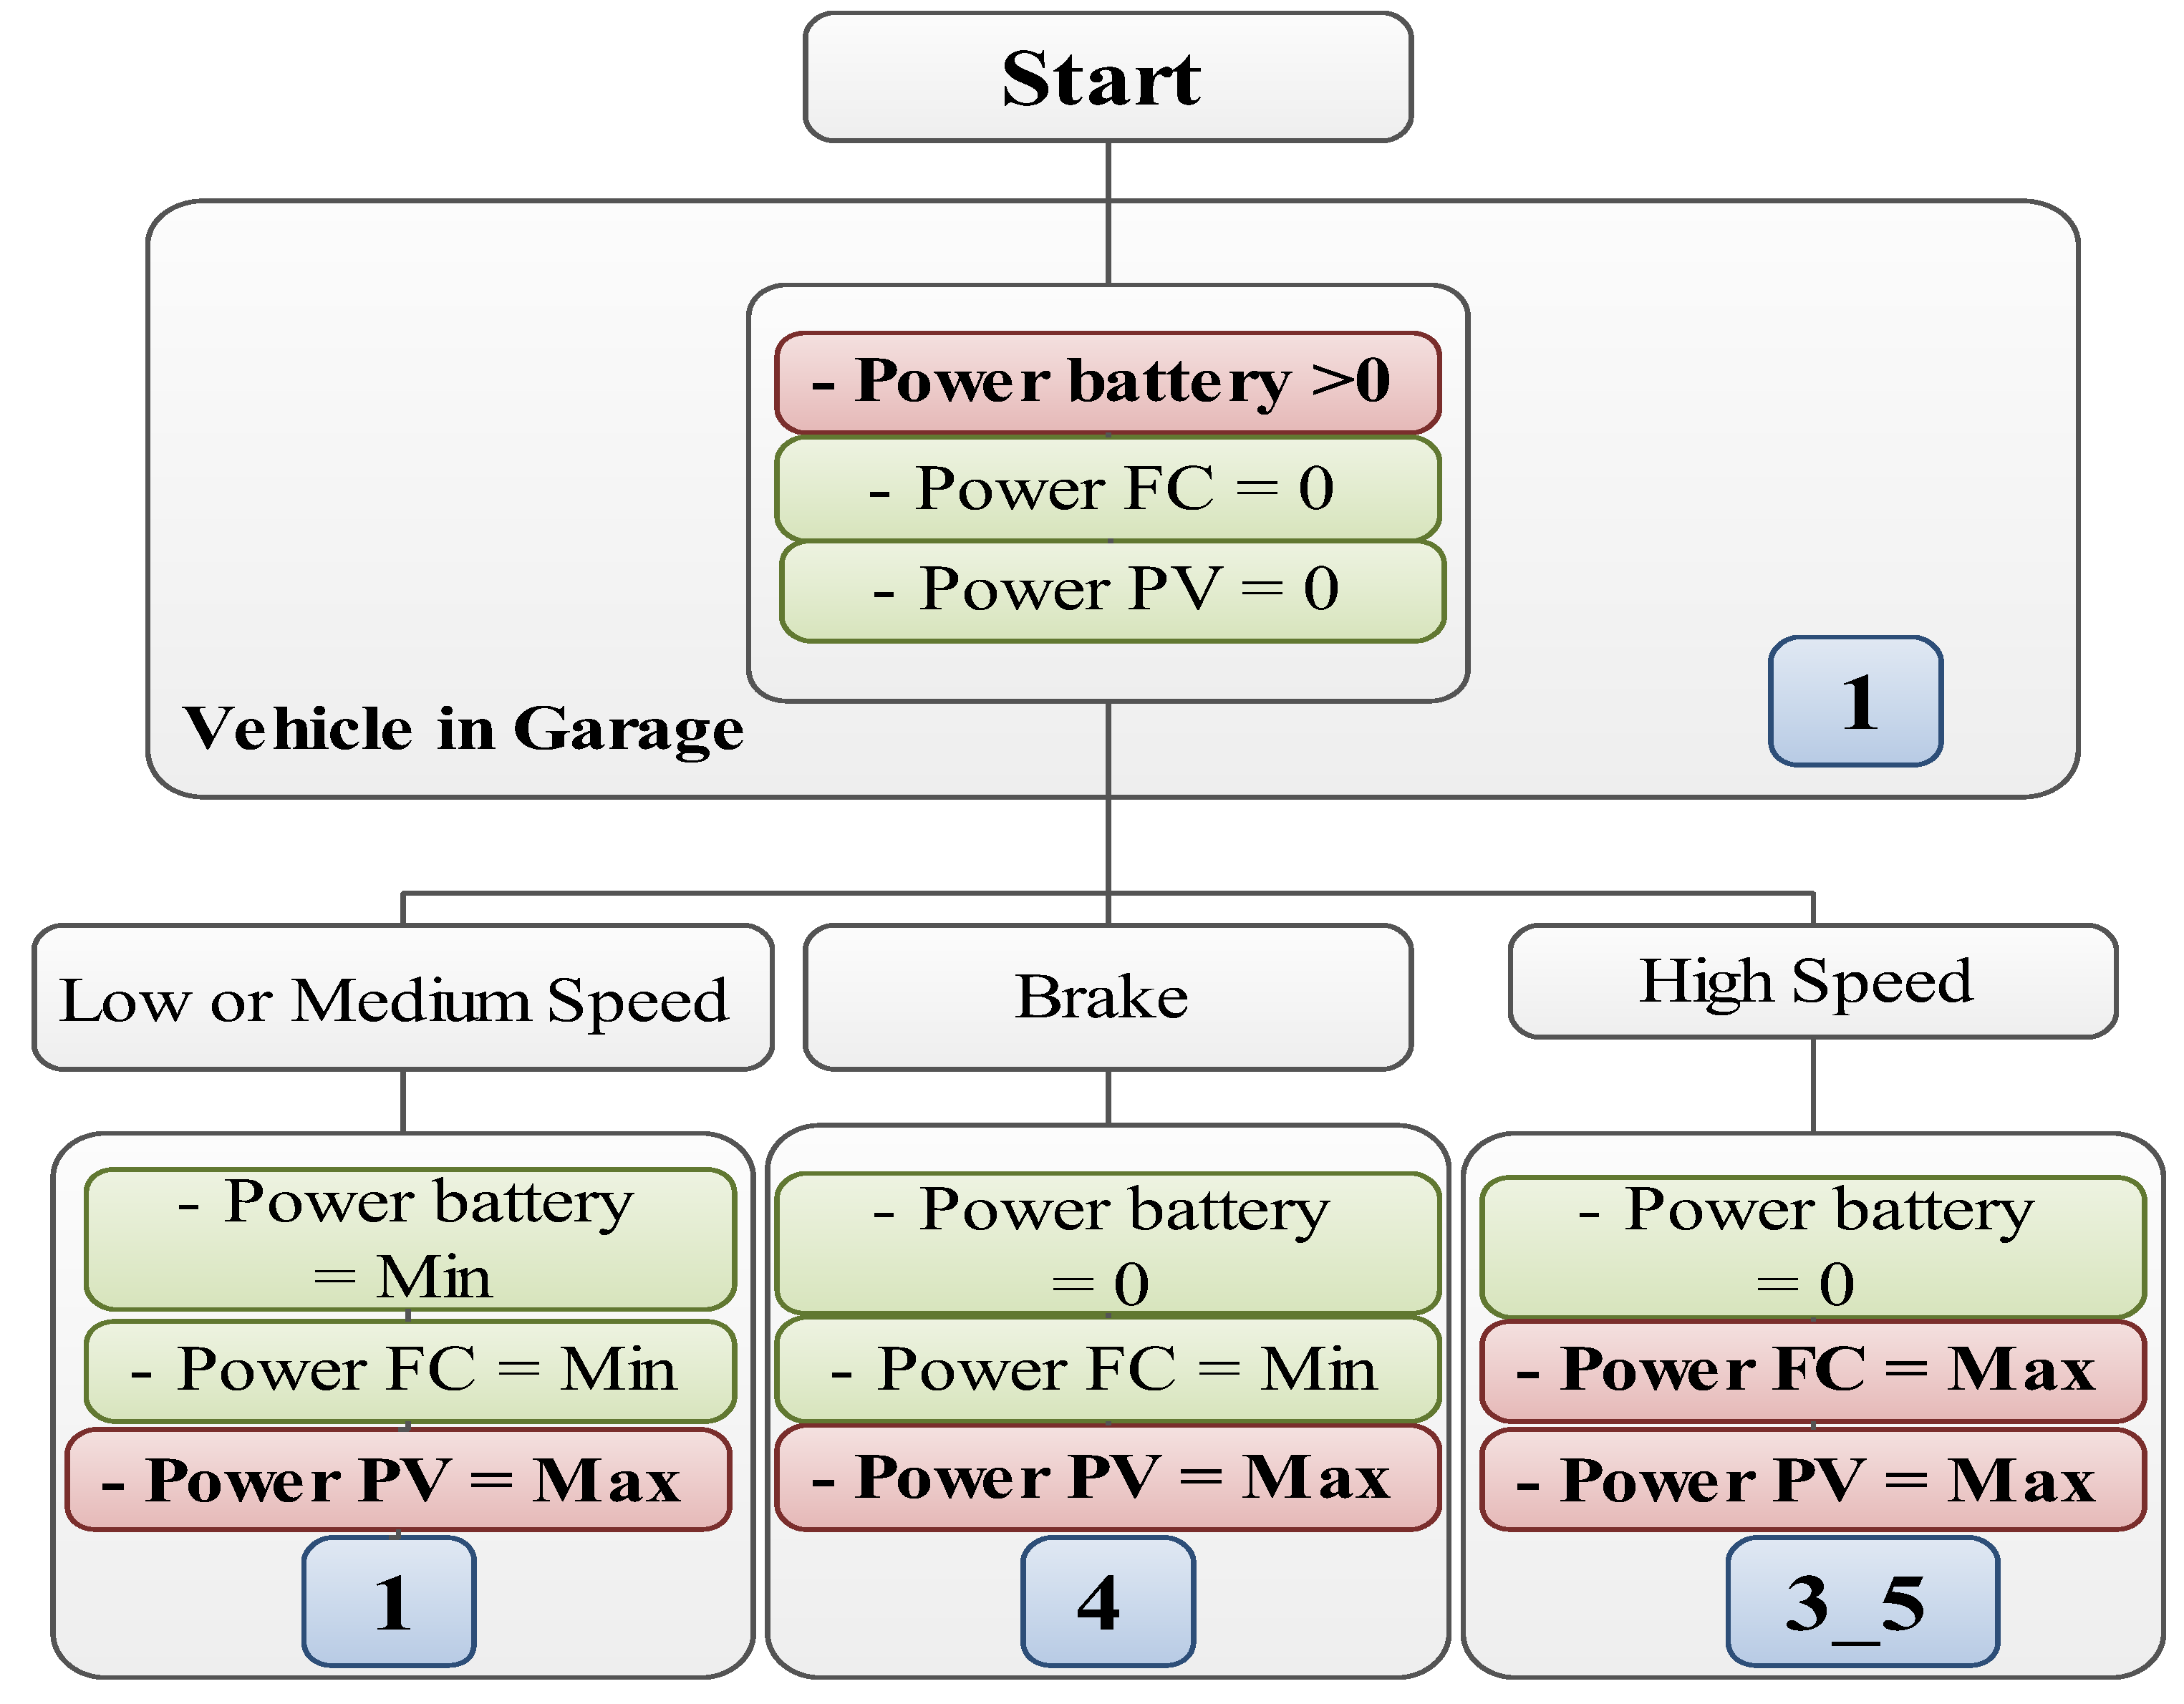
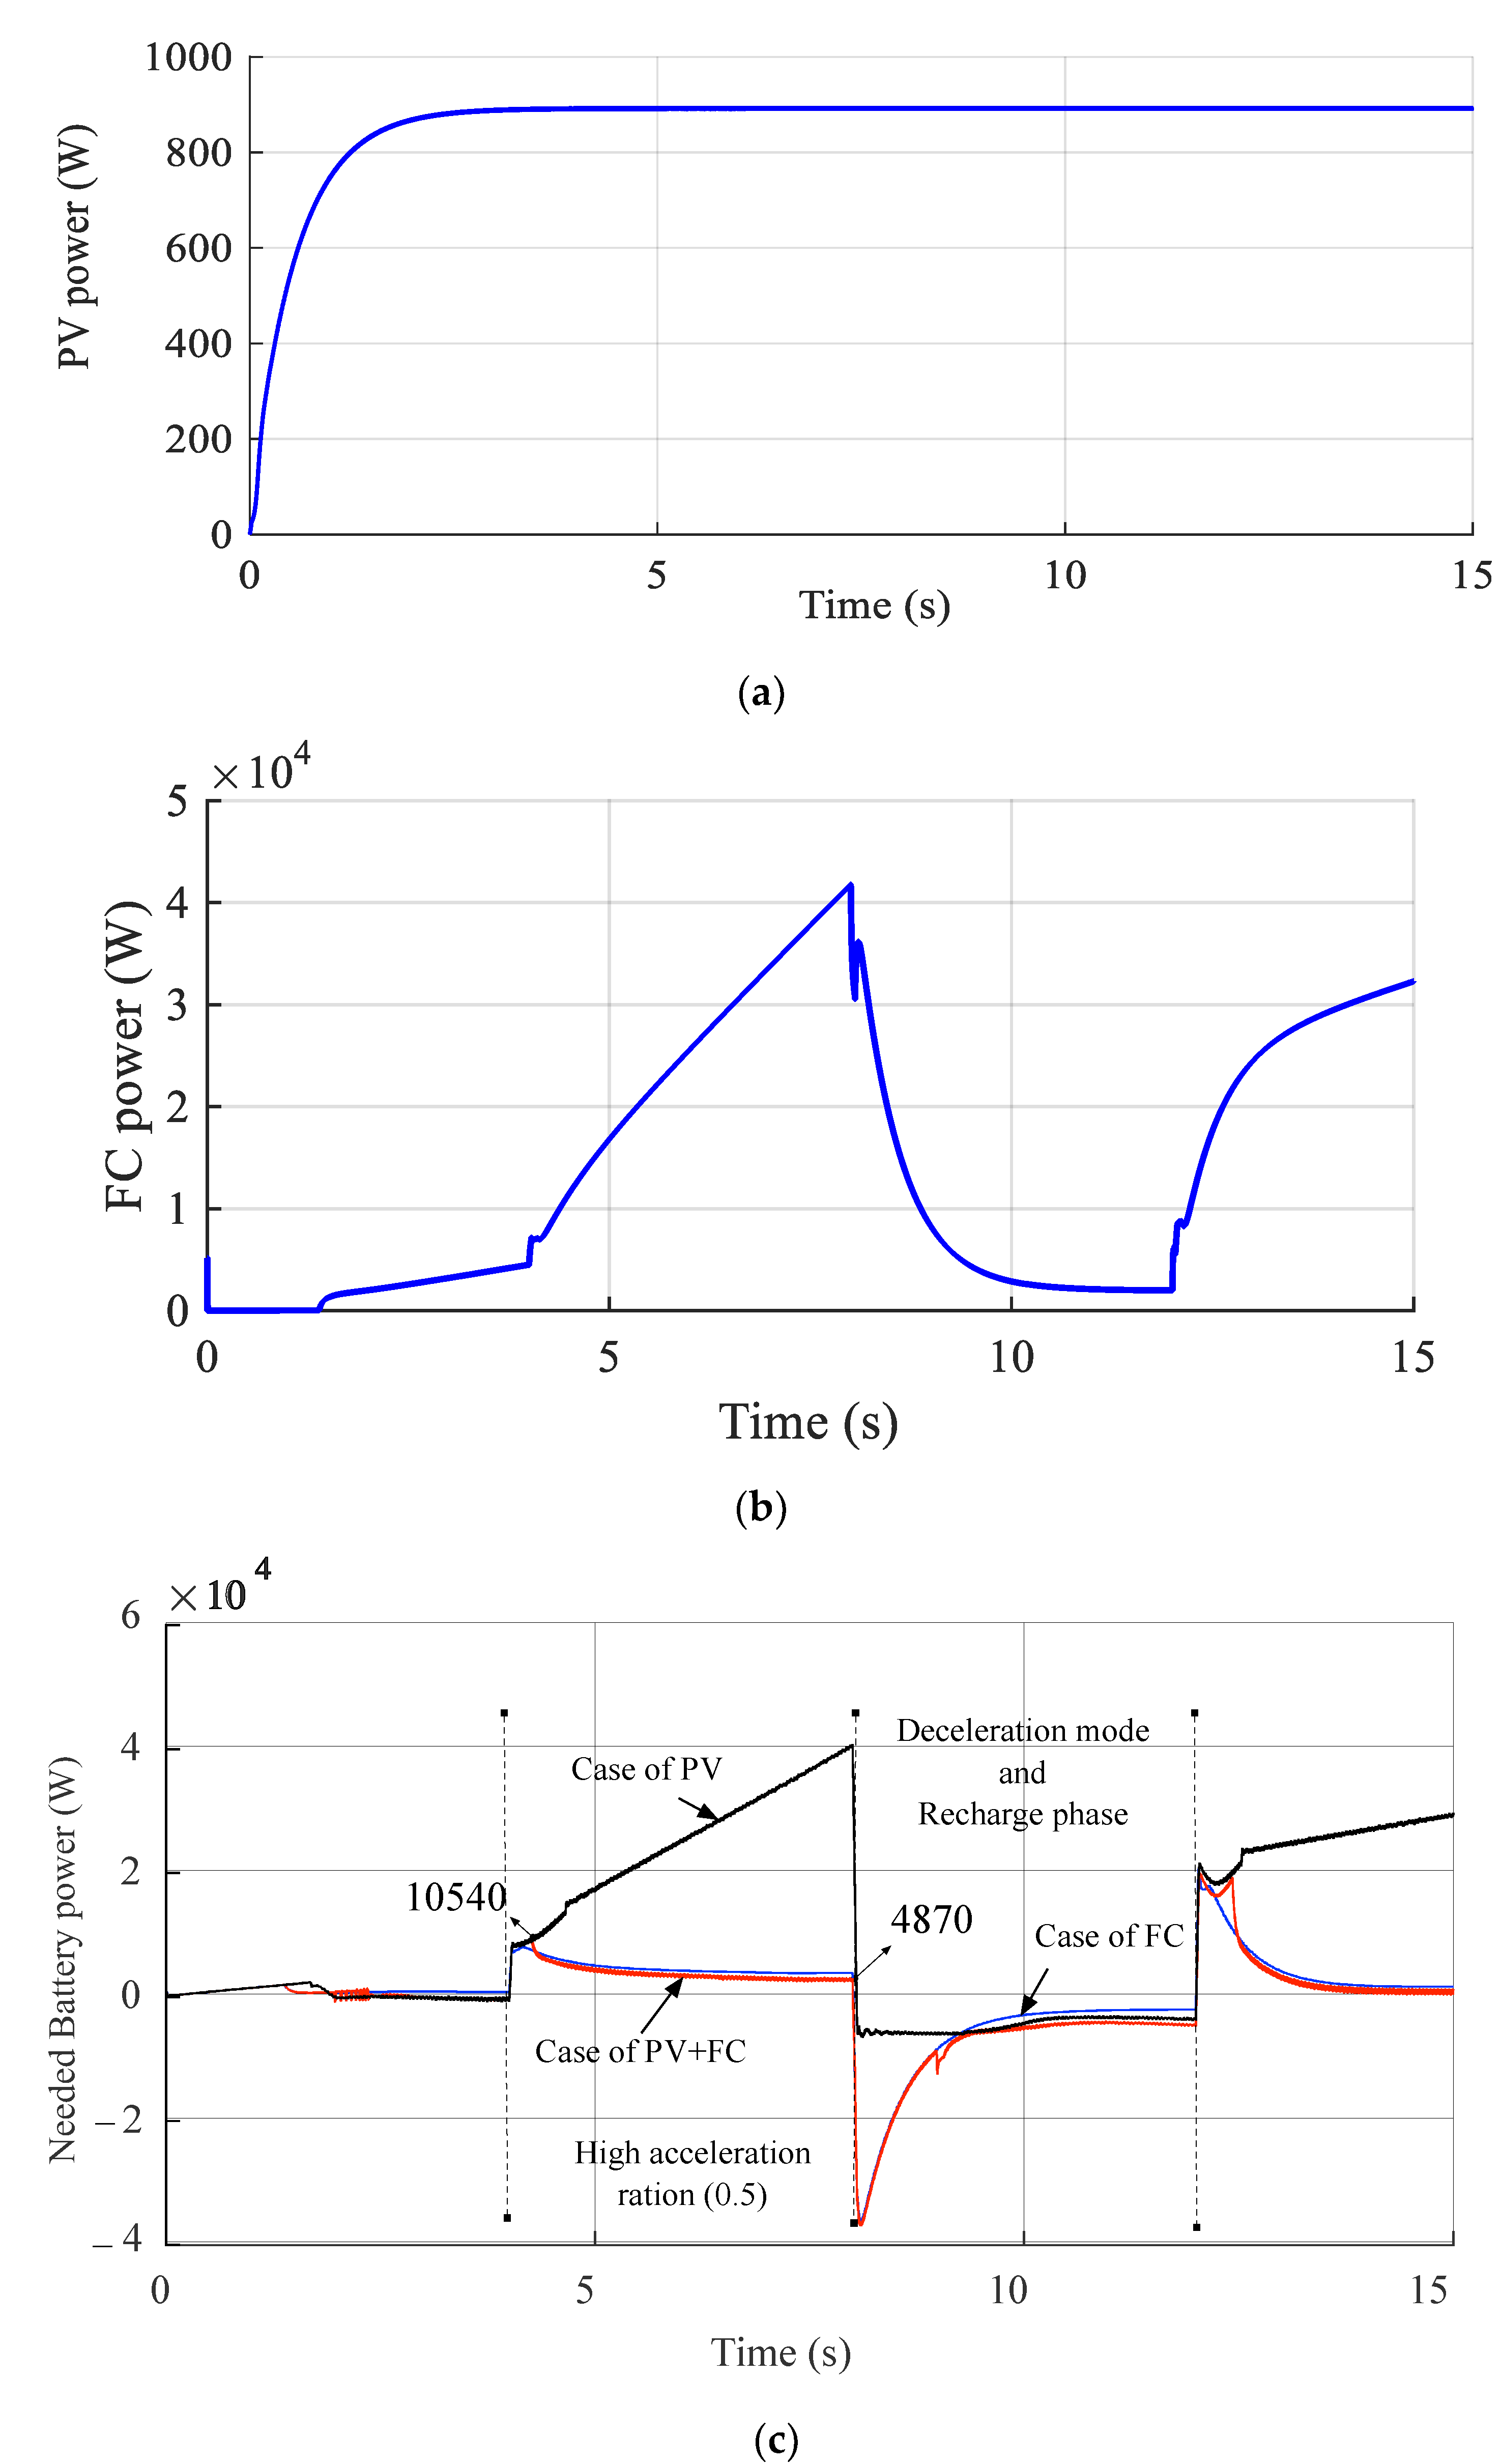
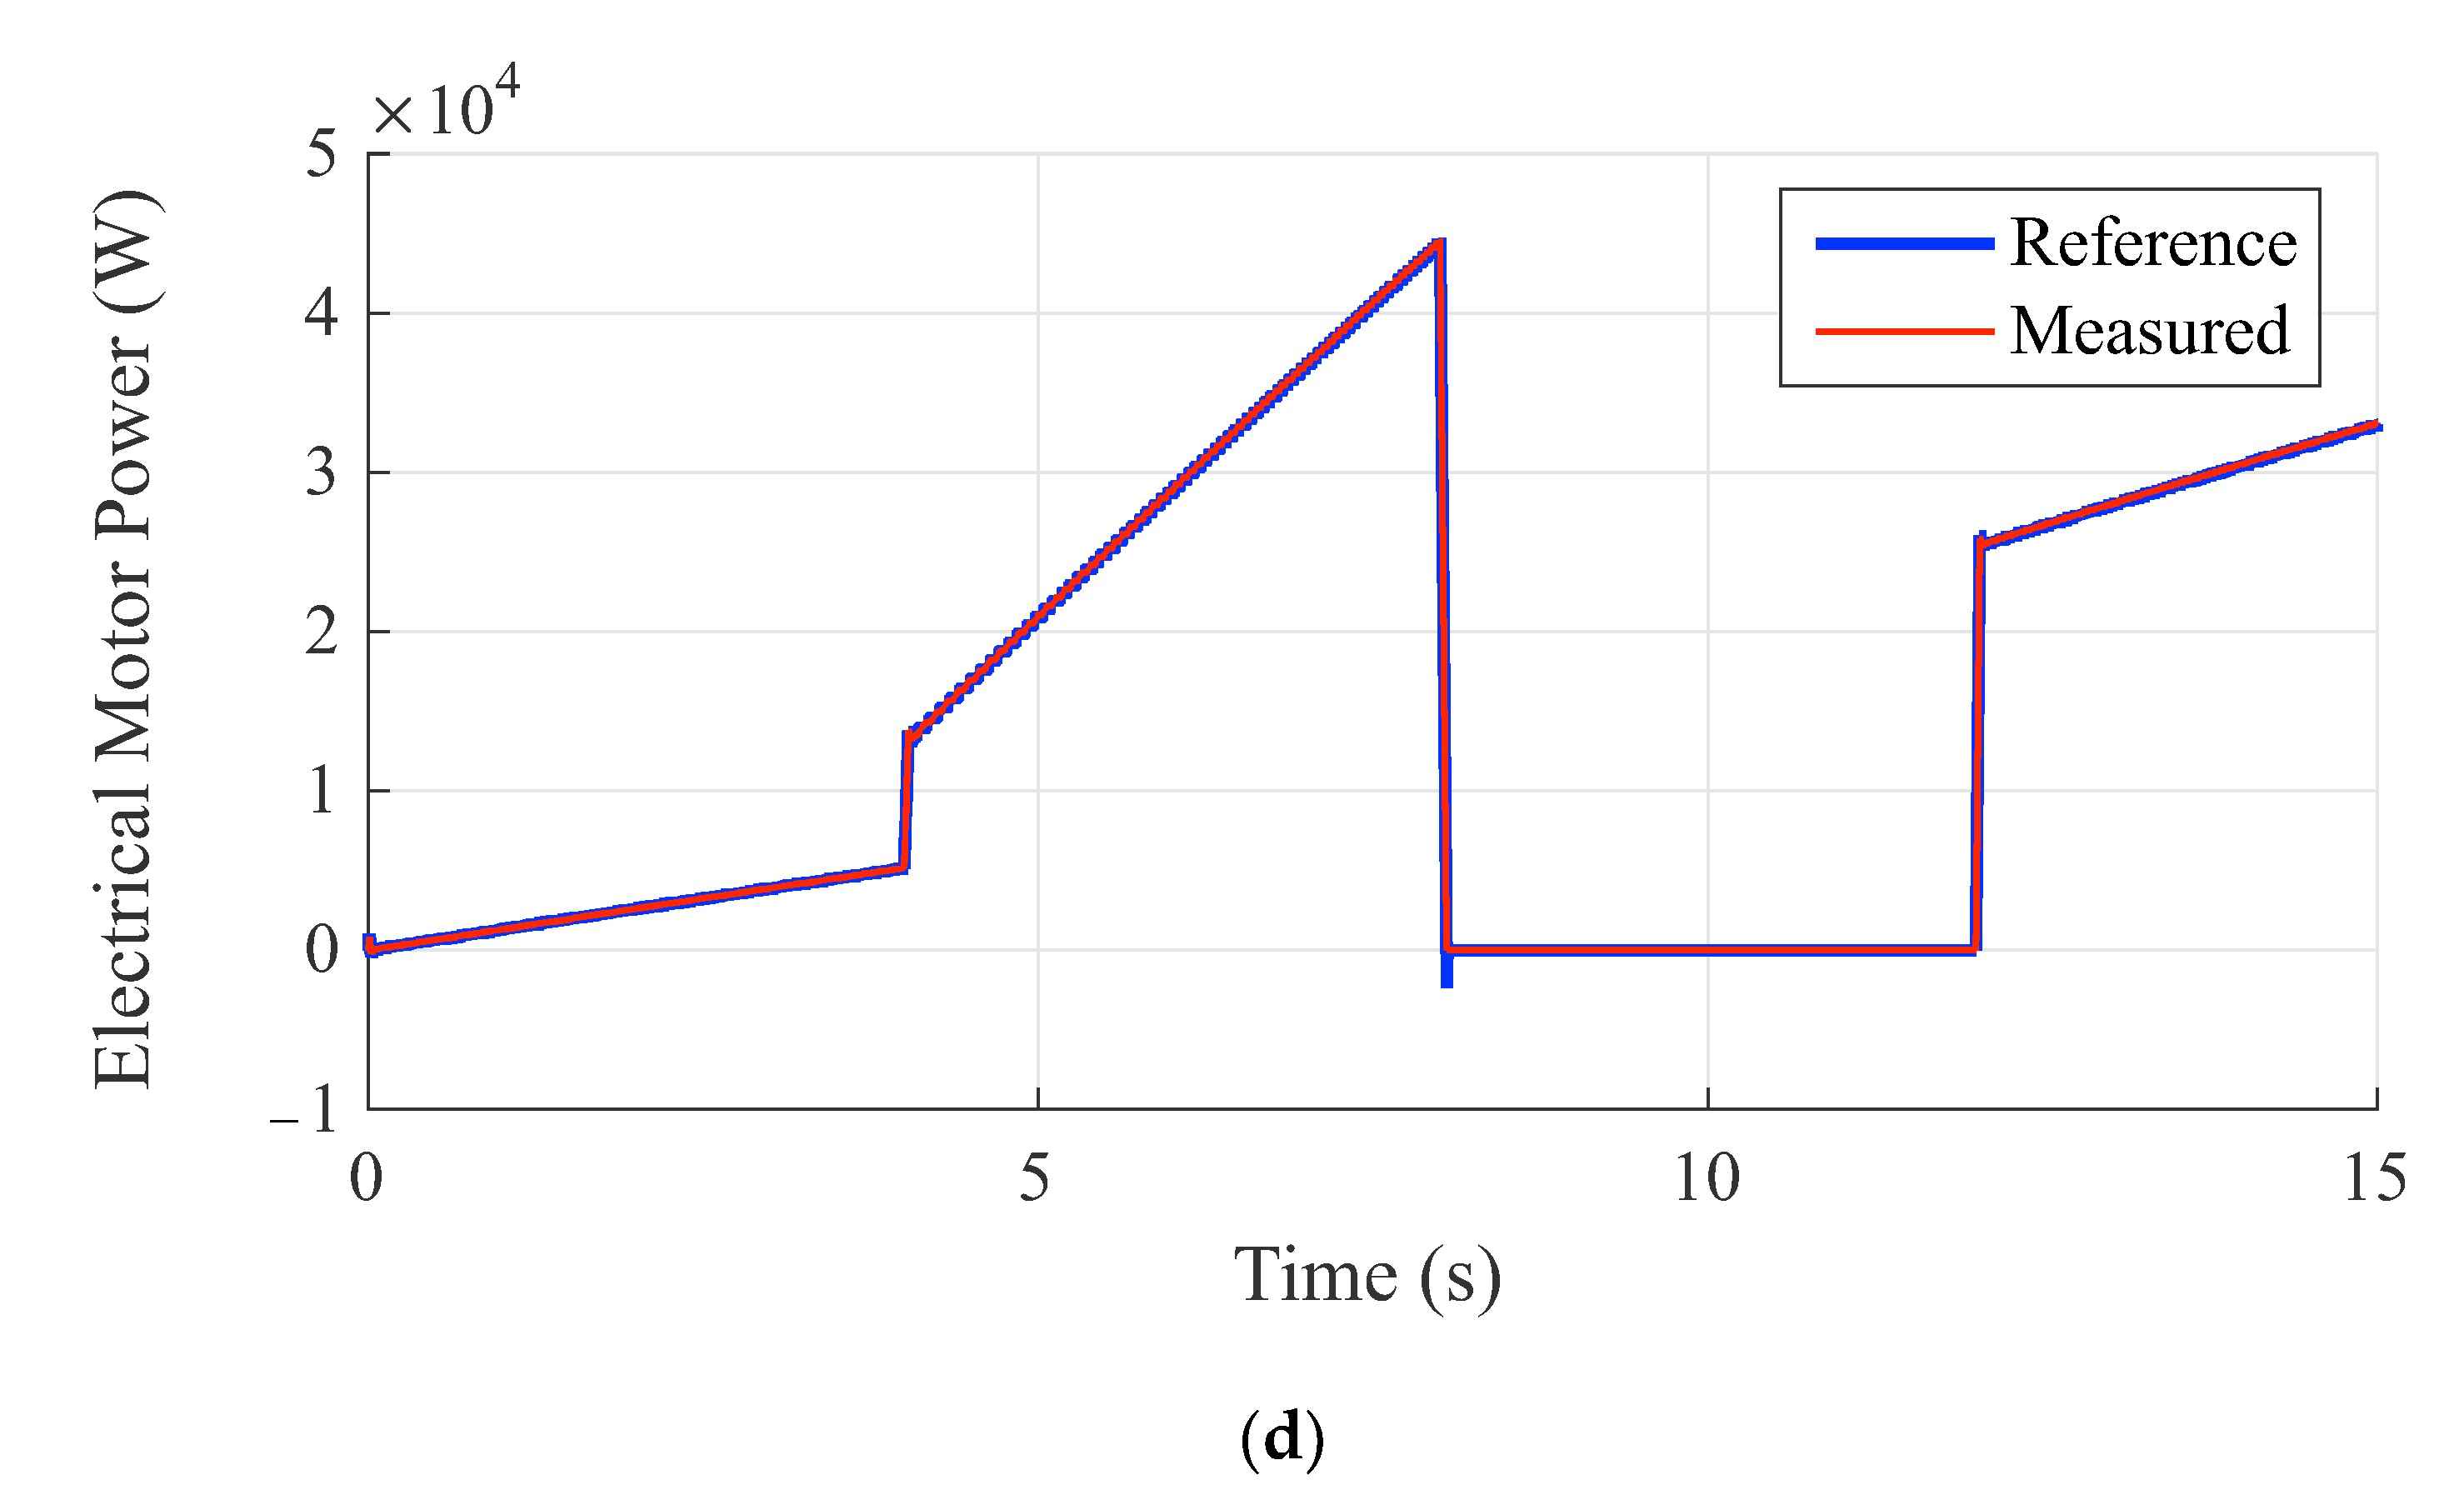
5.2. Power Management and Control

The electric vehicle (EV) with storage batteries must be recharged daily. A hydrogen supply is required for those using FCs to supply electrical energy. It is only during the sunshine cycle that solar energy provides energy for those fitted with PV systems. The electric vehicle uses batteries for storage, but fuel cell or hydrogen vehicles, solar electric vehicles, or a combination of solar, FC, and battery can be a competitive option due to less autonomy. Coordination between the various energy sources includes control of power management. Several researchers have worked on the energy management system, and each study was used according to the application. For example, in [49,50,51], the authors used fuzzy logic in the ICE, battery application, and optimisation-based energy management strategy. In [52], the authors studied the topologies and integrated energy management strategies to improve system power loss efficiency. Most of the research only used two energy sources in their control algorithm, making the control topology more complex if a third source was used; that is because updating the fuzzy rules or updating a neural network controller needs a significant change and an extensive database. In this study, the presented control topology seems more straightforward than when even three energy sources were used, as the control tool is based on relays [53].
Based on these studies, the battery bank device was chosen in our work to begin generating electricity. The fuel cell uses hydrogen to generate electricity, and the photovoltaic system at least works to adapt solar irradiation to electrical energy supplied to a DC bus. The total power is measured as explained in [54] and in Equation (26), and Figure 8 shows a proposed diagram of the hybrid energy storage system and power management for EV [55].
P M o t o r = P P V + P F C + P b a t t
When the EV is under partial shading, such as in a garage, parking lot, or any other type of shelter, the solar radiation’s power will be at its lowest (zero). The battery will drive the car, and the FC will participate when the acceleration demand increases. The obtained results of the power evolution for the previously cited simulation conditions are shown in Figure 9, which confirms Equation (26) and proves the mathematical models and their description. Figure 9a shows the PV system power for the various acceleration forms, as shown in Figure 7a. Based on new photovoltaic cell technologies [56,57], the PV can generate 9W as its maximum energy for the best irradiation factor.
Similarly, the fuel cell power evolution can be found in Figure 9b. It is clear that, even if the acceleration factor rises, the fuel cell generates more power. In Figure 9d, the motor’s power evolution is proportional to the acceleration factor, which explains why the motor’s power increases in the highest acceleration region. Based on Figure 9c, the power needed from the battery system was evaluated. The battery will contribute significantly only if the PV system is used as it is in the period with a 0.5 acceleration ratio. However, if the fuel cell is integrated in addition to the PV system, the given battery power will be less, and it will be less than 10 KW before the new acceleration ratio is given. Therefore, it is clear that the battery can provide a maximum given power, reaching 42 KW in the traction mode. However, in the recharging mode, as it is during deceleration, when the acceleration ratio is 0, the injected power inside the battery reaches 38 KW at the beginning of this deceleration mode.
It is essential to mention that the battery specification used in this simulation phase is as mentioned in Table 3. A value of 50 kW is the rated battery power.
In addition, one of the simulation conditions is related to the non-activation of the regenerative mode. Similarly, the PV will contribute 100% of its energy in the recharging phase and cover the shortfall through the use of the FC system. Thus, the battery power will be harmful as it receives energy from the recharging tool, as shown in Figure 9c.

5.3. Efficiency of a Hybrid System: Dynamic Mode and Static Mode

In this section, it is supposed that the vehicle comportment was simulated for 15 s. However, for the hybrid proficiency test, it is mandatory to know the SOC status of the battery for the different vehicle conditions. So, two cases were investigated. The first case examined the dynamic mode where the vehicle is in motion with variable speed. The second case is the static mode, which studied the stopped car situation and shows the recharging system performance. In both cases, the effect of the hybrid system on the SOC of the battery was observed.

5.3.1. Case 1: Dynamic Mode

In this case, the electric vehicle was driven using the electric motor. The primary energy management strategy in combined systems is stated in many works. Figure 10 shows the state of charge of the lithium-ion battery. From the obtained results, the hybrid system can control all energy loops efficiently, as specified by the control of energy management in Figure 8. The sudden changes in rotating speed at t = 4 s, t = 8 s, and t = 12 s were made to check the hybrid system’s robustness. The outcomes of the model validate the proposed hypothesis.

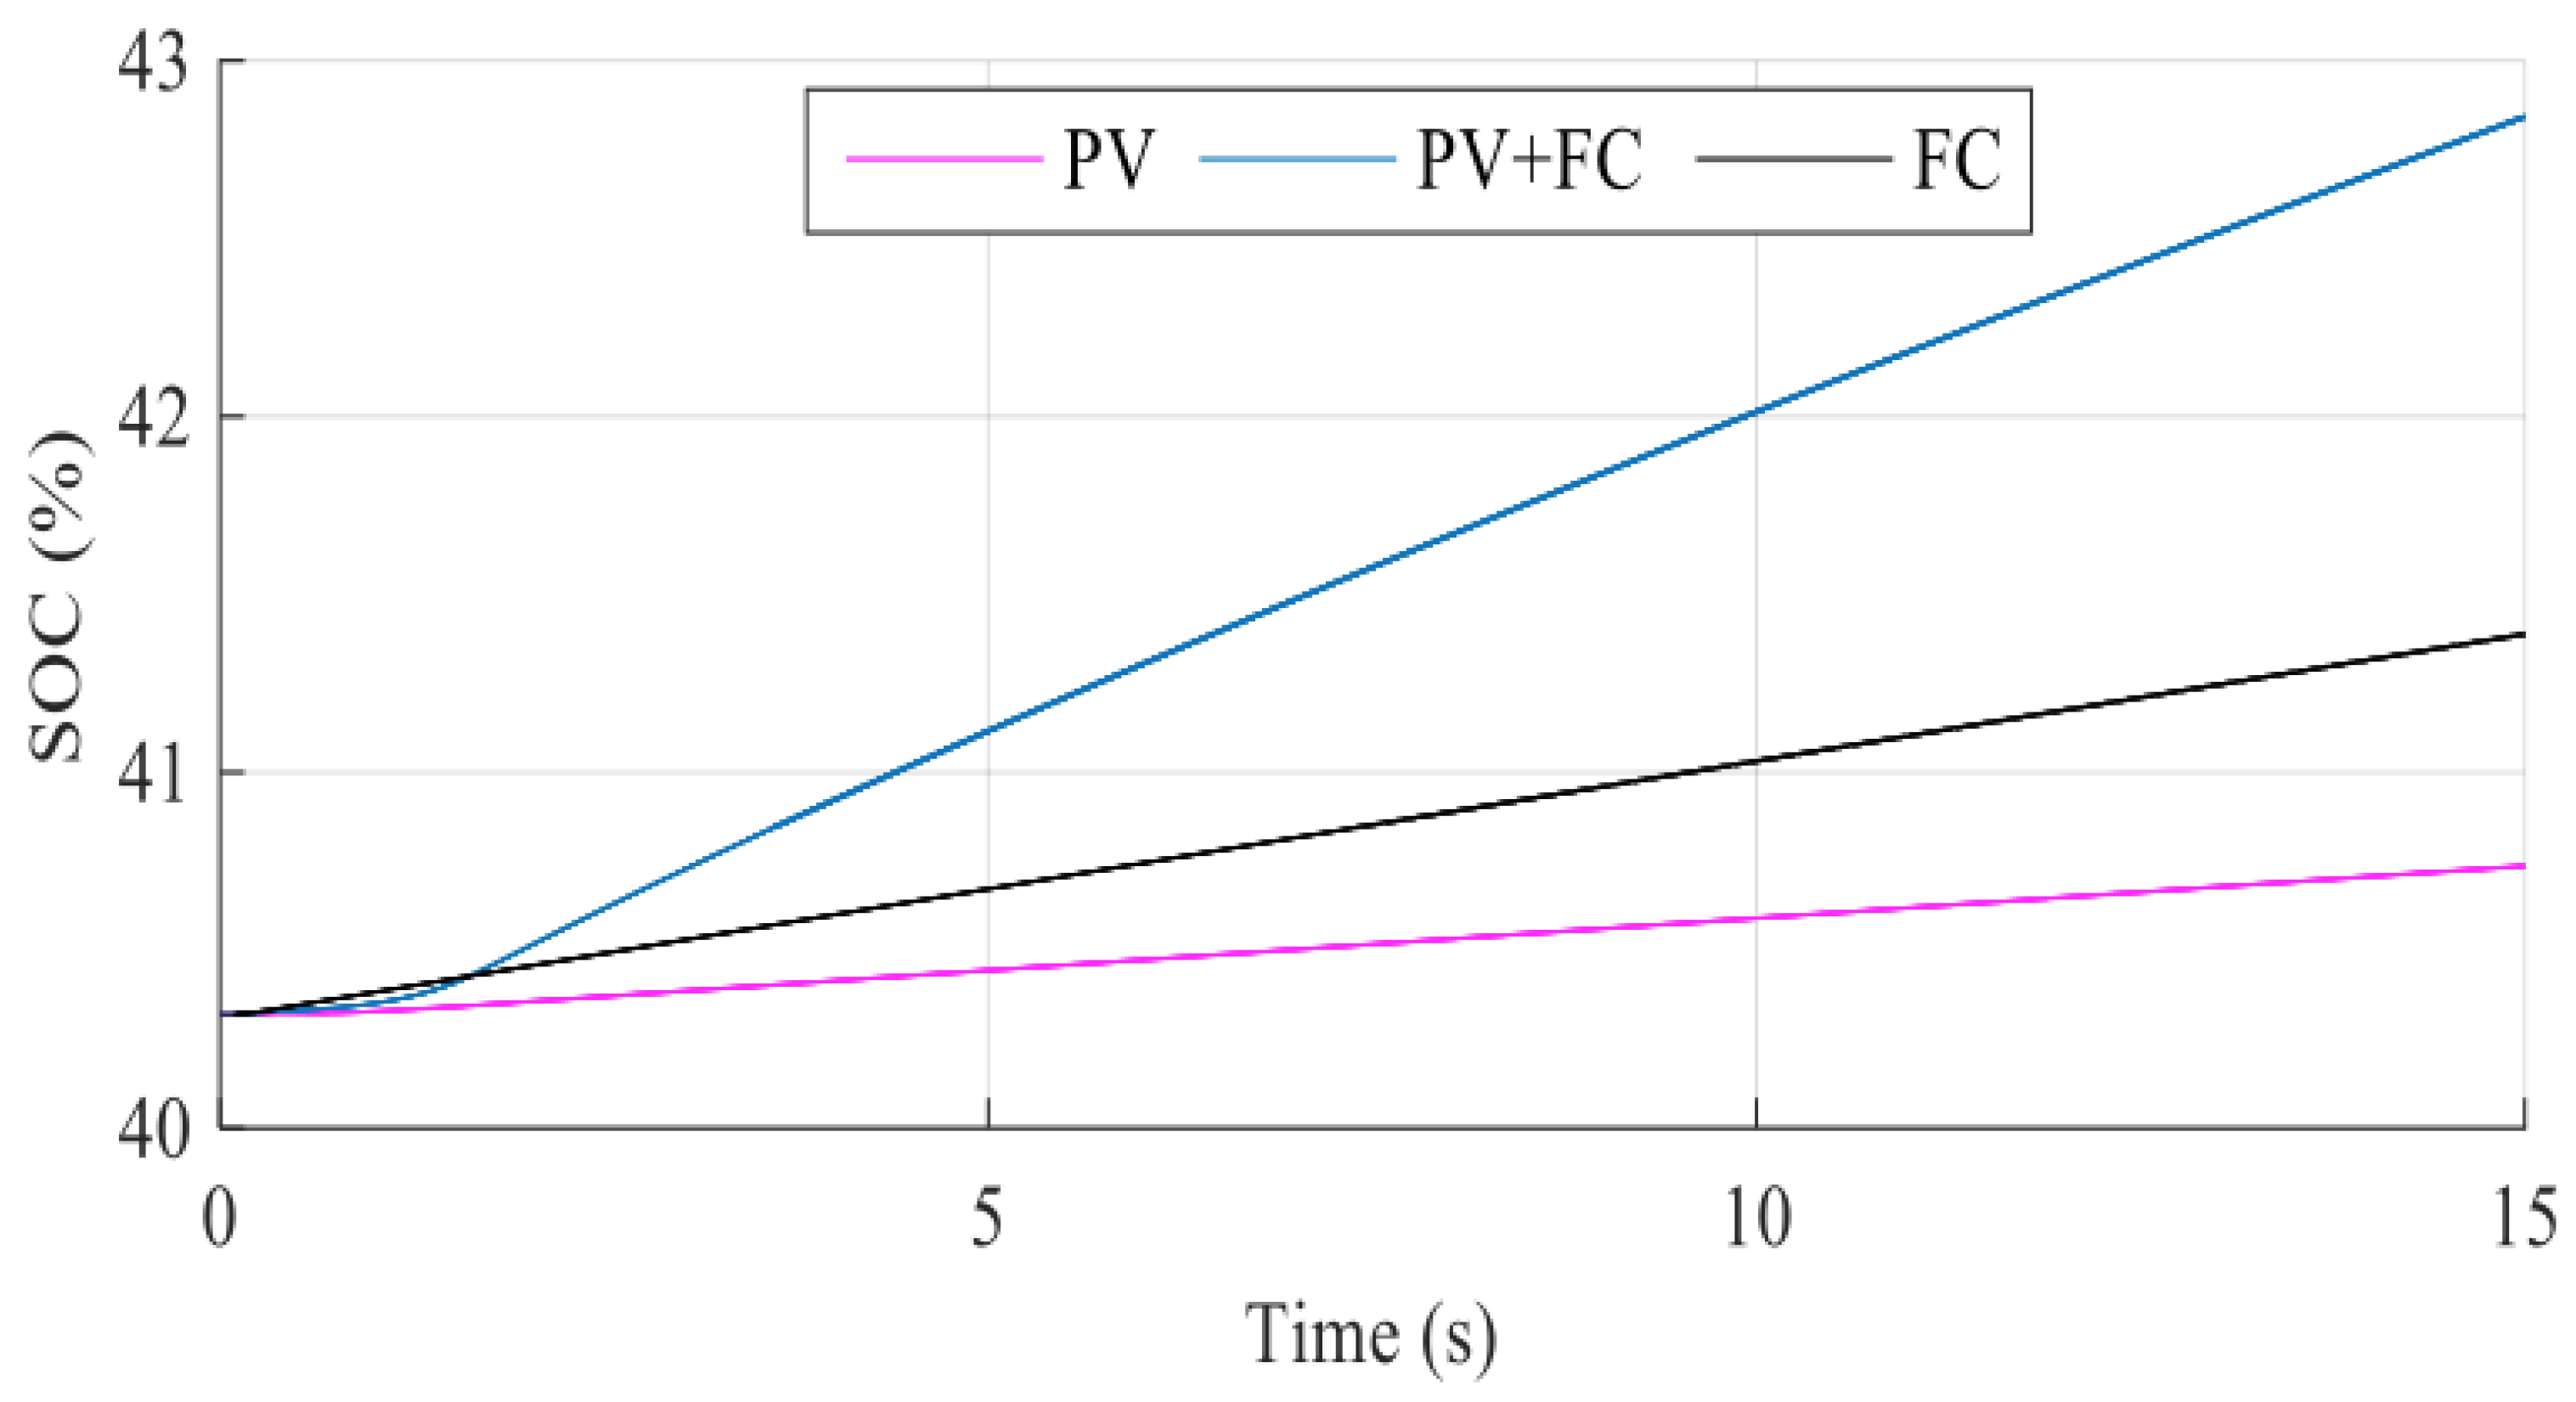
5.3.2. Case 2: Static Mode

In this case, it was assumed that the electric motor was inactive and the battery was only being charged. Figure 11 shows the results of the battery SOC for the different charging systems. In this simulation, the initial value of the SOC was equal to 40.32%, and the energy gain from each recharging system could be estimated. For the case of the PV system, the energy gain was 0.48%, as the new battery SOC was 40.80%. For the FC, the final SOC reached 41.50%, and then the gain was 1.18%. For the combined source (PV + FV), the obtained SOC was 42.90%, and the gain was 2.58%. Therefore, it can be concluded that the FC + PV system is more efficient in energy production.

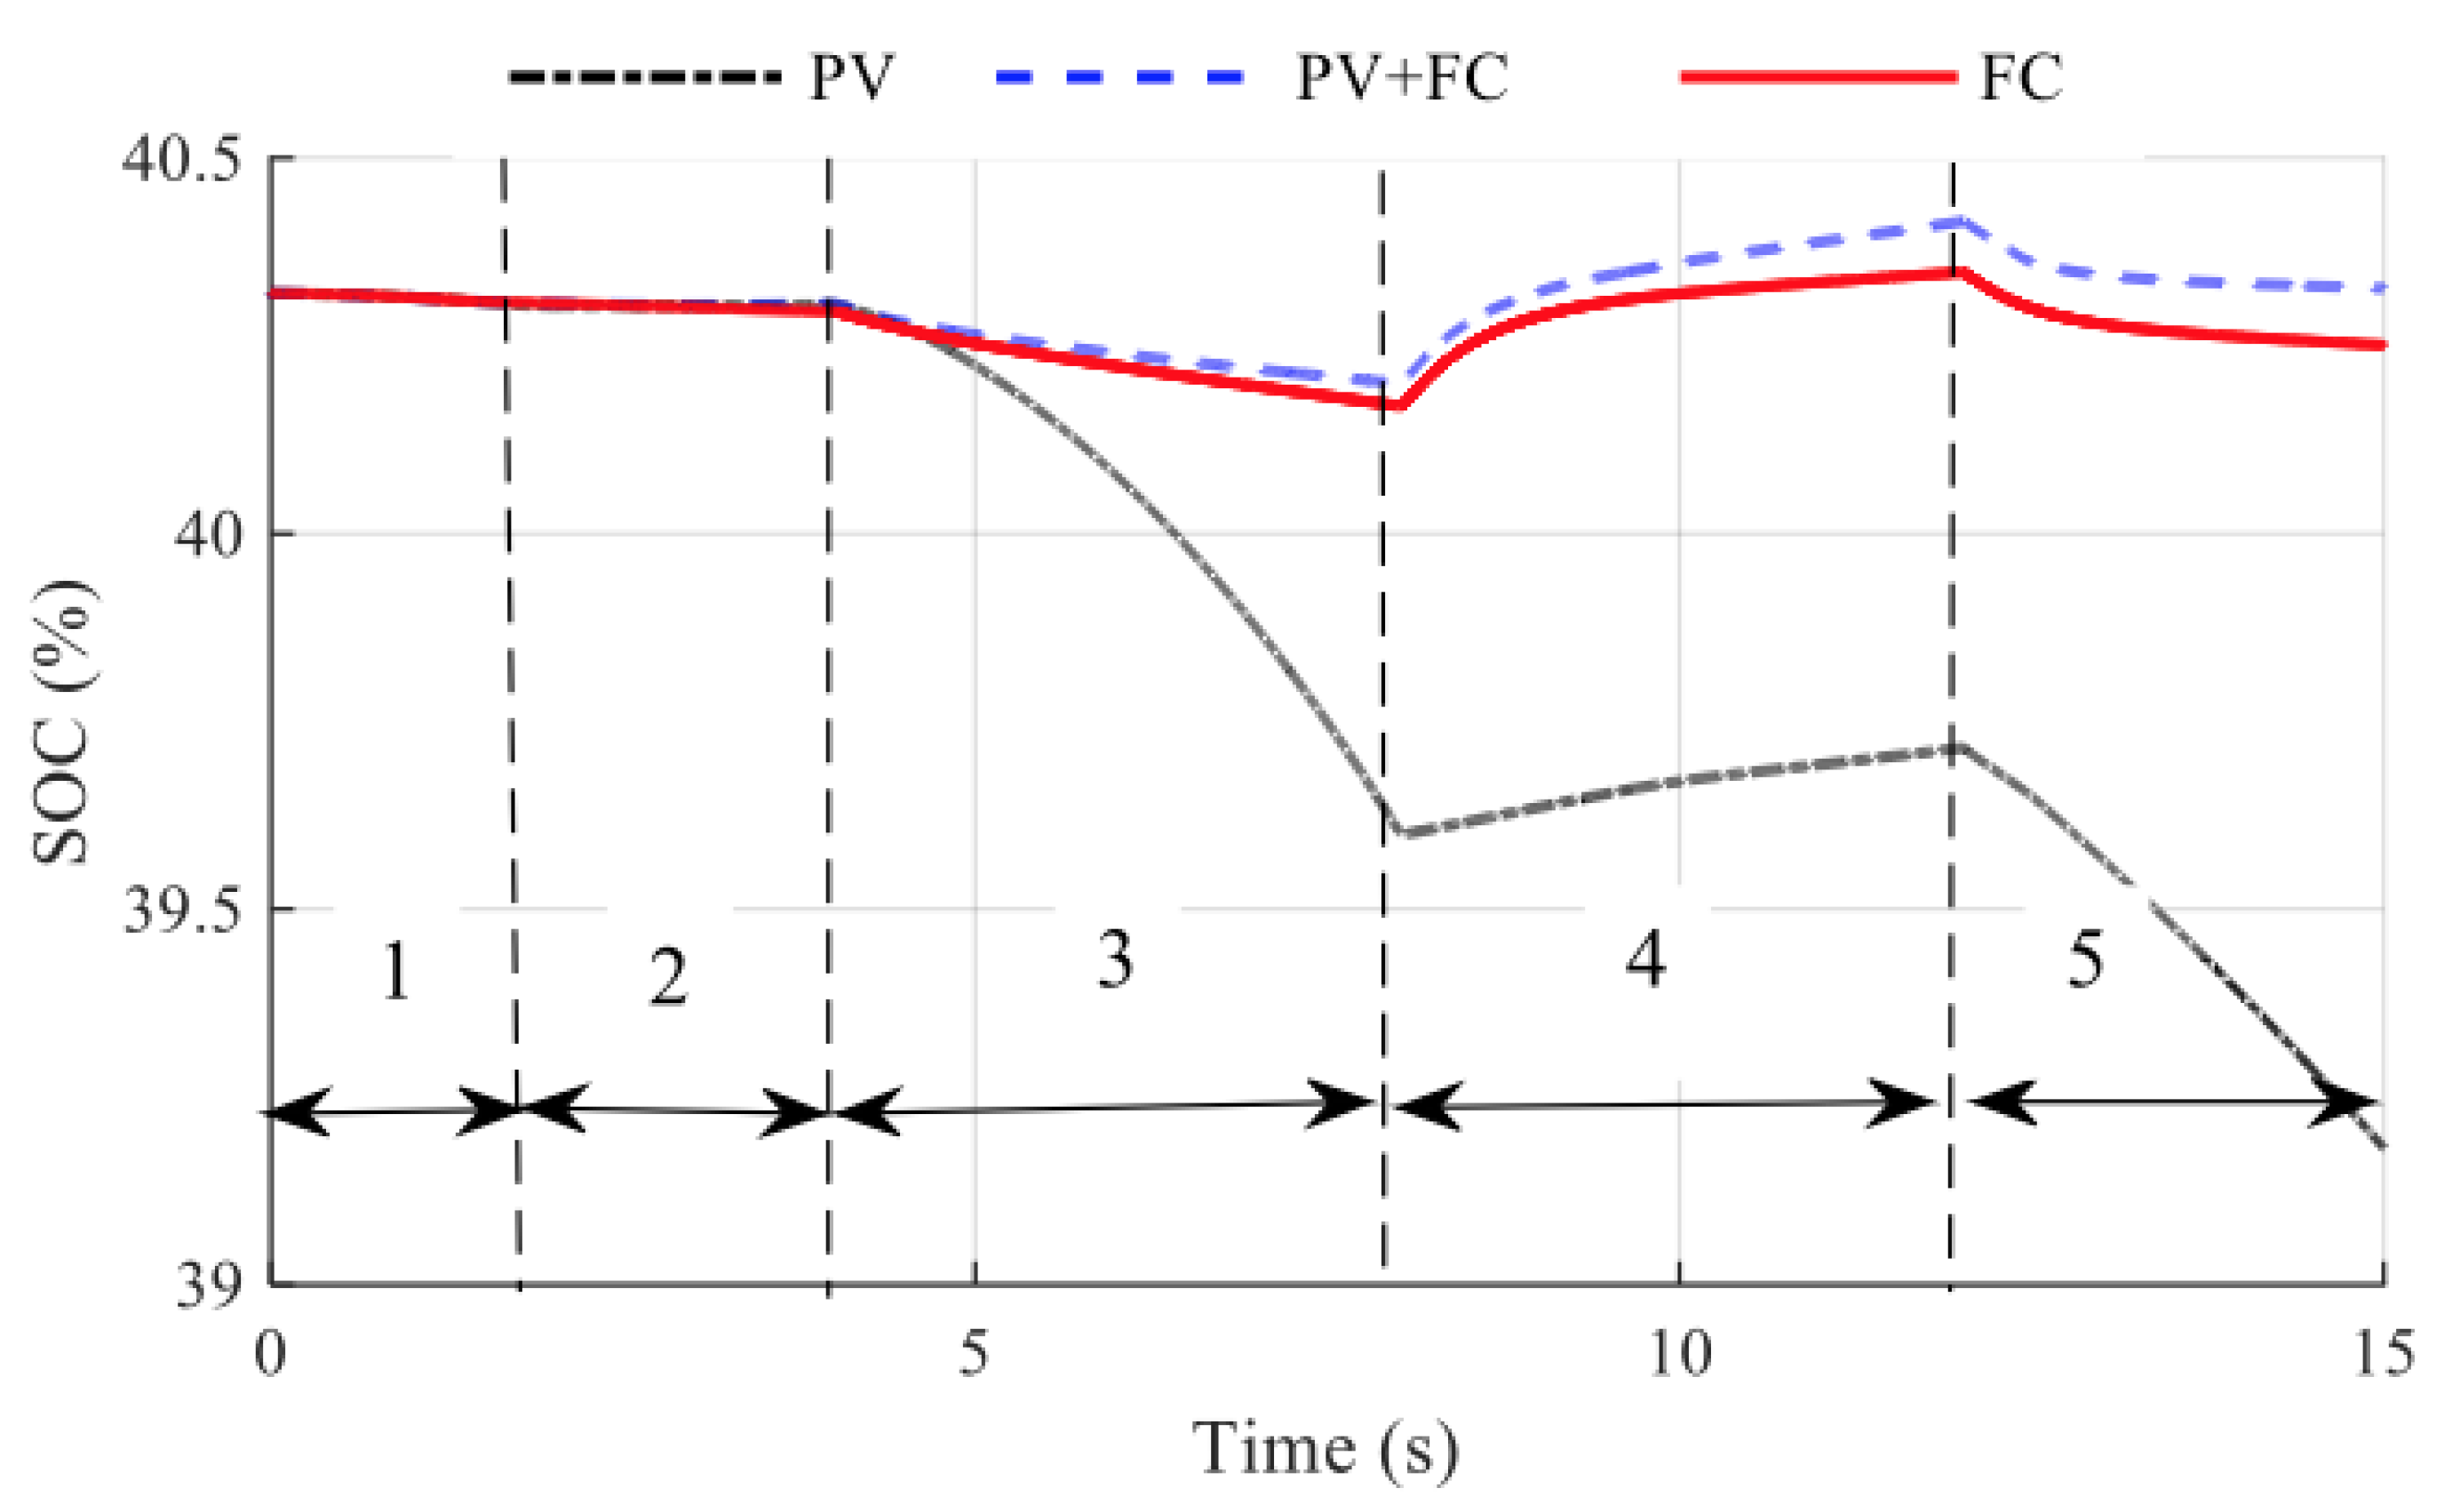
5.4. Energetic Performance concerning Each Recharging Method

For the same previous simulation conditions, this section will show the energetic performance of the hybrid system. The given evaluation was made under the previous vehicle speeds. According to Figure 10, it was noticed that the zone (zone 4) at t = 8 s and t = 12 s, a deceleration zone, was fixed, but a regenerative mode was not activated. Therefore, the energy gain can be evaluated by presenting the percentage gain for each system. Table 4 shows some statistics and gives an energetic evaluation.
Referring to this case (case 1 and case 2), each recharging technique was tested separately, and their performance and energetic contribution were evaluated in detail. The optimum selection can be related to combining the two techniques (FC and PV), as demonstrated by the given statistics in the case studies. Nevertheless, as the difference is insufficient, the major energy efficiency can only be assessed if the PV system’s weight is correctly considered. Based on some research, the evaluation of the influence of the PV system weight on the vehicle was made, and a comparison regarding its influence is summarised in Table 5. It is shown that with the new PV system technique [56,57], the PV systems add more weight to the vehicle, which will slightly affect its performance.
Consequently, it is possible to say that the benefit of this renewable energy source is assured. Nevertheless, it is vital to demonstrate that the vehicle speed factor has a significant influence on the energetic performance, as is demonstrated in [57,58,59] and as is shown in Figure 12, which shows that in a deceleration mode, the PV cells will contribute 100% to the recharging action. Therefore, the percentage in this figure presents the rate of use of each charging system for each speed. For example, in Figure 12d, for no acceleration action (acceleration = 0), the PV cells contributed 100% to the recharging action. Based on this paper, the proposed solution would help reduce fuel consumption and help charge electric vehicles efficiently. Table 6 shows the benchmarks for many segmented FC and PV system research projects and the results presented in the literature. Compared to [6,9,55,60], the proposed hybrid system uses refined active recharging to produce a high power level of 4900 watts.
In Table 6, a comparison between the contribution of the battery pack for more than hybrid energy management tool is compared. Initially, it is important to mention that the battery pack will always be required to help feed the electrical motor with the necessary energy power. As shown in Figure 9c, in the high acceleration period, the battery contributed 10,540 W at the beginning of the acceleration phase and 4870 W at the end of the acceleration mode. Therefore, after this test, it was concluded that the battery pack contributed at least 4900 W, as mentioned in Table 6.

6. Conclusions

This study presents a hybrid recharging tool used for electric vehicles. A complete mathematical model describing the components used and the approach adopted to recharge the battery and provide energy to the traction motor is presented. In this paper, the FC, the PV, or a combination of both was used in the recharging mode. This is why we talk about the hybrid recharging system. The battery pack only feeds the traction mode, and when it is required, the battery is charged through these blocks. The simulated case studies suggest that additive autonomy can be obtained using this hybrid energy combination for recharging and driving. The results signify hybridisation’s importance and demonstrate the potential of hybridisation with renewable energy sources in future hybrid electric vehicles. Particularly with PV hybridisation, a significant charging gain while stationary without the need to plug the car into a socket can be useful for regions with higher solar irradiance. A comparison with previous studies suggests that the proposed recharging model is significantly effective. The study can be used as a steppingstone to develop further detailed studies by considering additional variables, such as the cost of the components, the vehicle weight, the regenerative system, and many others.

Author Contributions

S.L., F.A. and N.M. designed the problem under study, performed the simulations, and obtained the results; A.A., Z.A.K. and S.L. analysed the obtained results; F.A., Z.A.K., A.A. and N.M. wrote the paper, which was further reviewed by all authors. All authors have read and agreed to the published version of the manuscript.

Funding

This research was funded by Majmaah University, grant number R-2021-229.

Institutional Review Board Statement

Not applicable.

Informed Consent Statement

Not applicable.

Data Availability Statement

Data sharing is not applicable to this article.

Acknowledgments

The authors would like to thank the Deanship of Scientific Research at Majmaah University for supporting this work under project number R-2021-229.

Conflicts of Interest

The authors declare no conflict of interest.

Abbreviations

EVElectric Vehicle
FCFuel Cell
IPTInductive Power Transfer
PVPhotovoltaic
HEVHybrid Electric Vehicles
BEVBattery Electric Vehicles
ICEInternal Combustion Engine
GVGasoline Vehicle
FCVFuel Cell Vehicle
SOCState of Charge
List of symbols
E o n , I G B T IGBT ON state (J)
E o f f , I G B T IGBT OFF state (J)
E o n , M MOSFET on state energy loss (J)
E o f f , M MOSFET off-state energy loss (J)
ESREffective series resistance (Ω)
f s w Switching frequency (kHz)
i C Collector current (A)
    I C a v Average collector current (A)
I C r m s Collector RMS current (A)
i D Drain current (A)
i D r m s Drain RMS current (A)
I L r m s Inductor RMS current (A)
I 0 Output current (A)
V f D Diode on-state voltage drop (V)
V 0 Output DC voltage (V)
Pcon, DDiode conduction loss (W)
Pcon,MMOSFET conduction loss (W)
Pcon,IGBTIGBT conduction loss (W)
Psw,IGBTIGBT switching loss (W)
Psw,MMOSFET switching loss (W)
QcSchottky diode junction charge (C)
RCCollector resistance (Ω)
RdcInductor DC resistance (Ω)
RDS(on)Drain to source on resistance (Ω)
TswSwitching period (s)
vCEInstantaneous collector to emitter voltage (V)
vCEOCollector voltage (V)
vDSInstantaneous drain to source voltage (V)
VDSOff condition of the drain to source voltage in (V)
TCell temperature in Kelvin (K)
qElectron charge (1.602 × 10⁻¹⁹ C)
KBoltzmann’s constant (1.381 × 10⁻²³ J/K)
IrsSaturation current of the diode
PfuelPressure of fuel (atm)
PairPressure of air (atm)
Vlpm(fuel)Fuel flow rate (l min−1)
Vlpm(air)Airflow rate (l min−1)
xHydrogen in the fuel (%)
yOxygen in the oxidant (%)
NCell number
zMoving electrons
KcVoltage of nominal operation conditions (V)
kBoltzmann’s constant [J K−1]
hPlanck constant [J s]
η n o m Nominal efficiency (%)
Δ h ( H 2 O ) g 0 Enthalpy of water vapour (J mol−1)
V n o m Nominal voltage (V)
InomNominal current (A)
ifcFC current (A)
V I p m ( a i r ) n o m Nominal airflow rate (l min−1)
AExponential zone amplitude (V)
PairnomNominal absolute pressure of air (Pa)
QBattery capacity (Ah)
TnomNominal operating temperature (K)
I*Current of low-frequency dynamic (A)
PH2OWater pressure (bar)
itAvailable capacity (Ah)
ω Percentage in the oxidant (%)
KPolarisation constant or polarisation resistance (Ω)
BExponential zone time constant inverse (Ah)−1
E0Standard voltage (V)
EbattNonlinear voltage (V)

References

  1. Alam Chowdhury, M.S.; Rahman, A.M.; Samrat, N.H. A comprehensive study on green technologies used in the vehicle. In Proceedings of the 2015 3rd International Conference on Green Energy and Technology (ICGET), Dhaka, Bangladesh, 11 September 2015. [Google Scholar]
  2. Ahmad, S.; Ahmad, A.; Naeem, M.; Ejaz, W.; Kim, H.S. A compendium of performance metrics, pricing schemes, optimisation objectives, and solution methodologies of demand side management for the smart grid. Energies 2018, 11, 2801. [Google Scholar] [CrossRef] [Green Version]
  3. Thomas, C.E. Fuel cell and battery electric vehicles compared. Int. J. Hydrogen Energy 2009, 34, 6005–6020. [Google Scholar] [CrossRef] [Green Version]
  4. Hwang, J.J.; Wang, D.Y.; Shih, N.C. Development of a lightweight fuel cell vehicle. J. Power Sources 2005, 141, 108–115. [Google Scholar] [CrossRef]
  5. Veziroglu, A.; MacArio, R. Fuel cell vehicles: State of the art with economic and environmental concerns. Int. J. Hydrogen Energy 2011, 36, 25–43. [Google Scholar] [CrossRef]
  6. Mohamed, N.; Aymen, F.; Ali, Z.M.; Zobaa, A.F.; Aleem, S.H.E.A. Efficient Power Management Strategy of Electric Vehicles Based Hybrid Renewable Energy. Sustainability 2021, 13, 7351. [Google Scholar] [CrossRef]
  7. Zhang, R.; Tao, J.; Zhou, H. Fuzzy Optimal Energy Management for Fuel Cell and Supercapacitor Systems Using Neural Network Based Driving Pattern Recognition. IEEE Trans. Fuzzy Syst. 2019, 27, 45–57. [Google Scholar] [CrossRef] [Green Version]
  8. Moore, R.M.; Hauer, K.H.; Friedman, D.; Cunningham, J.; Badrinarayanan, P.; Ramaswamy, S.; Eggert, A. A dynamic simulation tool for hydrogen fuel cell vehicles. J. Power Sources 2005, 141, 272–285. [Google Scholar] [CrossRef]
  9. Mokrani, Z.; Rekioua, D.; Rekioua, T. Modeling, control and power management of hybrid photovoltaic fuel cells with battery bank supplying electric vehicle. Int. J. Hydrogen Energy 2014, 39, 15178–15187. [Google Scholar] [CrossRef]
  10. Hwang, J.J.; Chen, Y.J.; Kuo, J.K. The study on the power management system in a fuel cell hybrid vehicle. Int. J. Hydrogen Energy 2012, 37, 4476–4489. [Google Scholar] [CrossRef]
  11. Wang, M. Fuel choices for fuel-cell vehicles: Well-to-wheels energy and emission impacts. J. Power Sources 2002, 112, 307–321. [Google Scholar] [CrossRef]
  12. Hwang, J.J.; Kuo, J.K.; Wu, W.; Chang, W.R.; Lin, C.H.; Wang, S.E. Lifecycle performance assessment of fuel cell/battery electric vehicles. Int. J. Hydrogen Energy 2013, 38, 3433–3446. [Google Scholar] [CrossRef]
  13. Un-Noor, F.; Padmanaban, S.; Mihet-Popa, L.; Mollah, M.N.; Hossain, E. A comprehensive study of key electric vehicle (EV) components, technologies, challenges, impacts, and future direction of development. Energies 2017, 10, 1217. [Google Scholar] [CrossRef] [Green Version]
  14. Boretti, A. Analysis of the energy storage battery and fuel tank of a commercial electric vehicle with range extender during charge sustaining operation. Energy Storage 2020, 2, e129. [Google Scholar] [CrossRef]
  15. Baek, K.; Kim, S.; Lee, E.; Cho, Y.; Kim, J. Data-Driven Evaluation for Demand Flexibility of Segmented Electric Vehicle Chargers in the Korean Residential Sector. Energies 2021, 14, 866. [Google Scholar] [CrossRef]
  16. Ahmad, S.; Alhaisoni, M.M.; Naeem, M.; Ahmad, A.; Altaf, M. Joint Energy Management and Energy Trading in Residential Microgrid System. IEEE Access 2020, 8, 123334–123346. [Google Scholar] [CrossRef]
  17. Lulhe, A.M.; Date, T.N. A technology review paper for drives used in electrical vehicle (EV) & hybrid electrical vehicles (HEV). In Proceedings of the 2015 International Conference on Control, Instrumentation, Communication and Computational Technologies ICCICCT, Kumaracoil, India, 18–19 December 2015; pp. 632–636. [Google Scholar]
  18. Mohamed, N.; Aymen, F.; Alqarni, M. Inductive Power Transmission System for Electric Car Charging Phase: Modeling plus Frequency Analysis. World Electr. Veh. J. 2021, 12, 267. [Google Scholar] [CrossRef]
  19. Datta, U. A price-regulated electric vehicle charge-discharge strategy. Energy Res. 2019, 43, 1032–1042. [Google Scholar] [CrossRef] [Green Version]
  20. Rawat, T.; Niazi, K.R.; Gupta, N.; Sharma, S. Impact assessment of electric vehicle charging/discharging strategies on the operation management of grid accessible and remote microgrids. Int. J. Energy Res. 2019, 43, 9034–9048. [Google Scholar] [CrossRef]
  21. Models, T.; Kim, Y.; Kim, S. Forecasting Charging Demand of Electric Vehicles Using Time-Series Models. Energies 2021, 14, 1487. [Google Scholar]
  22. Mohamed, N.; Aymen, F.; Issam, Z.; Bajaj, M.; Ghoneim, S.S.M. The Impact of Coil Position and Number on Wireless System Performance for Electric Vehicle Recharging. Sensors 2021, 21, 4343. [Google Scholar] [CrossRef]
  23. Song, Z.; Hofmann, H.; Li, J.; Wang, Y.; Lu, D.; Ouyang, M.; Du, J. Torque Distribution Strategy for Multi-PMSM Applications and Optimal Acceleration Control for Four-Wheel-Drive Electric Vehicles. J. Dyn. Syst. Meas. Control 2019, 142, 021001. [Google Scholar] [CrossRef]
  24. Habib, S.; Khan, M.M.; Abbas, F.; Ali, A.; Faiz, M.T.; Ehsan, F.; Tang, H. Contemporary trends in power electronics converters for charging solutions of electric vehicles. CSEE J. Power Energy Syst. 2020, 6, 911–929. [Google Scholar]
  25. Tie, S.S.F.; Tan, C.W.C. A review of energy sources and energy management system in electric vehicles. Renew. Sustain. Energy Rev. 2013, 20, 82–102. [Google Scholar] [CrossRef]
  26. Tan, K.M.; Ramachandaramurthy, V.K.; Yong, J.Y. Integration of electric vehicles in smart grid: A review on vehicle to grid technologies and optimisation techniques. Renew. Sustain. Energy Rev. 2016, 53, 720–732. [Google Scholar] [CrossRef]
  27. Lipu, M.S.H.; Faisal, M.; Ansari, S.; Hannan, M.A.; Karim, T.F.; Ayob, A.; Hussain, A.; Miah, M.S.; Saad, M.H.M. Review of Electric Vehicle Converter Configurations, Control Schemes and Optimizations: Challenges and Suggestions. Electronics 2021, 10, 477. [Google Scholar] [CrossRef]
  28. Naoui, M.; Aymen, F.; Ben Hamed, M.; Lassaad, S. Analysis of Battery-EV state of charge for a Dynamic Wireless Charging system. Energy Storage 2019, 2, e117. [Google Scholar]
  29. Zhuang, Z.; Yang, L.; Ju, B.; Yin, A.; Lei, G.; Zhou, Q.; Tang, Y.; Deng, Z.; Tu, F.; Qin, S. Engineering LiNi0.5Co0.2Mn0.3O2/poly(propylene carbonate) interface by graphene oxide modification for all-solid-state lithium batteries. Energy Storage 2020, 2, e109. [Google Scholar] [CrossRef] [Green Version]
  30. Lee, J.Y.; Han, B.M. A bidirectional wireless power transfer EV charger using self-resonant PWM. IEEE Trans. Power Electron. 2015, 30, 1784–1787. [Google Scholar] [CrossRef]
  31. Tremblay, O.; Dessaint, L. Experimental Validation of a Battery Dynamic Model for EV Applications. World Electr. Veh. J. 2009, 3, 289–298. [Google Scholar] [CrossRef] [Green Version]
  32. Dubarry, M.; Vuillaume, N.; Liaw, B.Y. From single cell model to battery pack simulation for Li-ion batteries. J. Power Sources 2009, 186, 500–507. [Google Scholar] [CrossRef]
  33. Rothenberger, M.J.; Safi, J.; Liu, J.; Anstrom, J.; Brennan, S.; Fathy, H.K. Improving Lithium-Ion Battery Pack Diagnostics by Optimising the Internal Allocation of Demand Current for Parameter Identifiability. J. Dyn. Syst. Meas. Control 2017, 139, 081001. [Google Scholar] [CrossRef]
  34. Mohamed, N.; Aymen, F.; Lassaad, S.; Mouna, B.H. Practical validation of the vehicle speed influence on the wireless recharge system efficiency. In Proceedings of the 2020 6th IEEE International Energy Conference (ENERGYCon), Gammarth, Tunisia, 28 September–1 October 2020; pp. 372–376. [Google Scholar]
  35. Dhameja, S. Electric Vehicle Battery Charging. In Electric Vehicle Battery Systems; Butterworth–Heinemann: Woburn, MA, USA, 2001; pp. 69–91. [Google Scholar]
  36. Baliga, B.J. Power Semiconductor Device Figure of Merit for High-Frequency Applications. IEEE Electron Device Lett. 1989, 10, 455–457. [Google Scholar] [CrossRef]
  37. Elasser, A.; Chow, T.P. Silicon carbide benefits and advantages for power electronics circuits and systems. Proc. IEEE 2002, 90, 969–986. [Google Scholar] [CrossRef]
  38. Hudgins, J.L.; Simin, G.S.; Santi, E.; Khan, M.A. An assessment of wide band-gap semiconductors for power devices. IEEE Trans. Power Electron. 2003, 18, 907–914. [Google Scholar] [CrossRef] [Green Version]
  39. El Fadil, H.; Giri, F.; Member, S.; Guerrero, J.M.; Member, S. Modeling and Nonlinear Control of a Fuel Cell/Supercapacitor Hybrid Energy Storage System for Electric Vehicles. IEEE Trans. Veh. Technol. 2014, 63, 3011–3018. [Google Scholar] [CrossRef] [Green Version]
  40. Alam, M.; Kumar, K.; Dutta, V. Comparative efficiency analysis for silicon, silicon carbide MOSFETs and IGBT device for DC–DC boost converter. SN Appl. Sci. 2019, 1, 1–11. [Google Scholar] [CrossRef] [Green Version]
  41. Mohamed, N.; Aymen, F.; Hamed, M. Ben Characteristic Of Photovoltaic Generator For The Electric Vehicle. Int. J. Sci. Technol. Res. 2019, 8, 871–876. [Google Scholar]
  42. Ahmed, M.; Abdelrahem, M.; Harbi, I.; Kennel, R. An Adaptive Model-Based MPPT Technique with Drift-Avoidance for Grid-Connected PV Systems. Energies 2020, 13, 6656. [Google Scholar] [CrossRef]
  43. Bendjedia, B.; Hadjadj, A.; Benhouia, A.; Temmir, T. Energy management and control of a solar electric vehicle. In Proceedings of the 2015 4th International Conference on Electrical Engineering (ICEE), Boumerdes, Algeria, 13–15 December 2015; pp. 1–5. [Google Scholar] [CrossRef]
  44. Ye, B.; Jiang, J.; Miao, L.; Yang, P.; Li, J.; Shen, B.; Ye, B.; Jiang, J.; Miao, L.; Yang, P.; et al. Feasibility Study of a Solar-Powered Electric Vehicle Charging Station Model. Energies 2015, 8, 13265–13283. [Google Scholar] [CrossRef] [Green Version]
  45. Paladini, V.; Donateo, T.; de Risi, A.; Laforgia, D. Super-capacitors fuel-cell hybrid electric vehicle optimisation and control strategy development. Energy Convers. Manag. 2007, 48, 3001–3008. [Google Scholar] [CrossRef]
  46. Cipollone, R.; Di Battista, D.; Marchionni, M.; Villante, C. Model based design and optimisation of a fuel cell electric vehicle. Energy Procedia 2014, 45, 71–80. [Google Scholar] [CrossRef] [Green Version]
  47. Hwang, J.J.; Chen, C.K.; Savinell, R.F.; Liu, C.C.; Wainright, J. A three-dimensional numerical simulation of the transport phenomena in the cathodic side of a PEMFC. J. Appl. Electrochem. 2004, 34, 217–224. [Google Scholar] [CrossRef]
  48. Andaloro, L.; Arista, A.; Agnello, G.; Napoli, G.; Sergi, F.; Antonucci, V. Study and design of a hybrid electric vehicle (Lithium Batteries-PEM FC). Int. J. Hydrogen Energy 2017, 42, 3166–3184. [Google Scholar] [CrossRef]
  49. Schouten, N.J.; Salman, M.A.; Kheir, N.A. Fuzzy logic control for parallel hybrid vehicles. IEEE Trans. Control Syst. Technol. 2002, 10, 460–468. [Google Scholar] [CrossRef]
  50. Fu, Z.; Zhu, L.; Tao, F.; Si, P.; Sun, L. Optimization based energy management strategy for fuel cell/battery/ultracapacitor hybrid vehicle considering fuel economy and fuel cell lifespan. Int. J. Hydrogen Energy 2020, 45, 8875–8886. [Google Scholar] [CrossRef]
  51. Hoenicke, P.; Ghosh, D.; Muhandes, A.; Bhattacharya, S.; Bauer, C.; Kallo, J.; Willich, C. Power management control and delivery module for a hybrid electric aircraft using fuel cell and battery. Energy Convers. Manag. 2021, 244, 114445. [Google Scholar] [CrossRef]
  52. Tran, D.D.; Vafaeipour, M.; El Baghdadi, M.; Barrero, R.; Van Mierlo, J.; Hegazy, O. Thorough state-of-the-art analysis of electric and hybrid vehicle powertrains: Topologies and integrated energy management strategies. Renew. Sustain. Energy Rev. 2020, 119, 109596. [Google Scholar] [CrossRef]
  53. Ahmad, S.; Naeem, M.; Ahmad, A. Unified optimisation model for energy management in sustainable smart power systems. Int. Trans. Electr. Energy Syst. 2020, 30, e12144. [Google Scholar] [CrossRef]
  54. Nguyen, B.H.; Trovão, J.P.F.; German, R.; Bouscayrol, A. Real-time energy management of parallel hybrid electric vehicles using linear quadratic regulation. Energies 2020, 13, 5538. [Google Scholar] [CrossRef]
  55. Zhang, Y.; Ma, R.; Zhao, D.; Huangfu, Y.; Liu, W. A Novel Energy Management Strategy based on Dual Reward Function Q-learning for Fuel Cell Hybrid Electric Vehicle. IEEE Trans. Ind. Electron. 2021, 69, 1537–1547. [Google Scholar] [CrossRef]
  56. Oberbeck, L.; Alvino, K.; Goraya, B.; Jubault, M. IPVF’s PV technology vision for 2030. Prog. Photovolt. Res. Appl. 2020, 28, 1207–1214. [Google Scholar] [CrossRef]
  57. Sierra, A.; Reinders, A. Designing innovative solutions for solar-powered electric mobility applications. Prog. Photovolt. Res. Appl. 2020, 29, 802–818. [Google Scholar] [CrossRef]
  58. Das, H.S.; Rahman, M.M.; Li, S.; Tan, C.W. Electric vehicles standards, charging infrastructure, and impact on grid integration: A technological review. Renew. Sustain. Energy Rev. 2020, 120, 109618. [Google Scholar] [CrossRef]
  59. Turoń, K. Hydrogen-powered vehicles in urban transport systems-current state and development. Transp. Res. Procedia 2020, 45, 835–841. [Google Scholar] [CrossRef]
  60. Okundamiya, M.S. Size optimisation of a hybrid photovoltaic/fuel cell grid connected power system including hydrogen storage. Int. J. Hydrogen Energy 2021, 46, 30539–30546. [Google Scholar] [CrossRef]
Figure 1. Two electric vehicles models: (a) battery electric vehicle; (b) hybrid electric vehicle.
Sustainability 14 02551 g001
Figure 2. Multi-source system for an electric vehicle.
Sustainability 14 02551 g002
Figure 3. Electrical diagram of a lithium-ion battery.
Sustainability 14 02551 g003
Figure 4. Equivalent solar cell’s electric circuit.
Sustainability 14 02551 g004
Figure 5. PV cells placed on a vehicle.
Sustainability 14 02551 g005
Figure 6. Diagram of the global system.
Sustainability 14 02551 g006
Figure 7. Vehicle speed: (a) accelerator; (b) speed.
Sustainability 14 02551 g007
Figure 8. Energy management strategy technique.
Sustainability 14 02551 g008
Figure 9. (a) Photovoltaic generator power; (b) fuel cell power; (c) battery power; (d) power delivered to the electric motor by the three sources.
Sustainability 14 02551 g009aSustainability 14 02551 g009b
Figure 10. Battery state of charge with the charger system.
Sustainability 14 02551 g010
Figure 11. SOC evolution in relation to the different recharging systems.
Sustainability 14 02551 g011
Figure 12. Energetic contribution of the three power generation modes according to the vehicle speed: (a) low speed, (b) medium speed, (c) high speed, and (d) no acceleration action.
Sustainability 14 02551 g012
Table 1. Semiconductor properties.
Si4H-SiC6H-SiCGaAsGaNDiamond
Energy band-gap, Eg (eV)1.123.033.261.433.455.45
Critical electric field, Ec (MV/cm)0.252.22.50.4210
Saturated electron drift velocity, Vsat (cm/s)1 × 1072 × 1072 × 1071 × 1072.2 × 1072.7 × 107
Thermal conductivity I (W/cm-K)1.54.94.90.461.322
Electron mobility, µn (cm2/s)13501000500850012502200
Dielectric constant, et11.910.19.6613.195.5
Table 2. Parameters of the vehicle.
ParametersSymbolValues
Vehicle massm1800 kg
Rolling resistancefr0.01
Air density ρ a i r 1.2 kg × m2
The frontal surface area of the EVAf2.6 m2
Tire radiusR0.32 m
Aerodynamic drag coefficientCd0.41
Table 3. Parameters of the electric motor and battery pack.
ParametersSymbolValues
Shaft powerPu50 kW
Pole pairsPp2
Resistance of statorRs2.63 Ω
Resistance of rotorRr2.42 Ω
Mutual inductanceM0.253 H
Rotor and stator self-inductanceLs = Lr0.214 H
Inertia momentJ0.03 kg m2
Viscous frictionf0.0002 N m × s2
Battery parameters
Battery voltage V b a t 72 V
Rated Capacity Q 68 Ah
Rated Power P b a t 50 kW
TypeLithium battery-
Table 4. Estimated energy gain for each system in the deceleration zone (zone 4).
Energy Gain
PVFCPV + FC
At the beginning of the zone39.6%40.17%40.2%
At the end of the zone39.71%40.35%40.42%
SOC gain0.11%0.18%0.22%
Table 5. Influence of the PV cell weight on the energetic consumption over 100 Km.
With the Weight of PVWithout the Weight of PV
Example of vehicle model weight750 kg737 kg
Energy consumed over 100 km14.08 kWh14 kWh
Table 6. Comparison of different hybrid systems.
References/ParametersBattery Power (W)Number of Sources
Proposed system49003
System 1 [9]52004
System 2 [55]14403
System 3 [6]49863
System 4 [60]32002
Publisher’s Note: MDPI stays neutral with regard to jurisdictional claims in published maps and institutional affiliations.

