Article

Reducing the Environmental Impacts of Desalination Reject Brine Using Modified Solvay Process Based on Calcium Oxide

by
Tahereh Setayeshmanesh
1,
Mohammad Mehdi Parivazh
2,
Mohsen Abbasi
1,*,
Shahriar Osfouri
1,
Mohammad Javad Dianat
1 and
Mohammad Akrami
3,*
1
Department of Chemical Engineering, Faculty of Petroleum, Gas and Petrochemical Engineering, Persian Gulf University, Bushehr P.O. Box 75169-13798, Iran
2
Department of Chemical Engineering, Amirkabir University of Technology (Tehran Polytechnic), Tehran P.O. Box 15875-4413, Iran
3
Department of Engineering, University of Exeter, Exeter EX4 4QF, UK
*
Authors to whom correspondence should be addressed.
Sustainability 2022, 14(4), 2298; https://doi.org/10.3390/su14042298
Submission received: 5 January 2022 / Revised: 27 January 2022 / Accepted: 14 February 2022 / Published: 17 February 2022
(This article belongs to the Special Issue Water-Energy Nexus in a Sustainable Environment)

Abstract

:
In this research, the influence of a variety of operational factors such as the temperature of the reaction, gas flow rate, concentration of NaCl, and the amount of Ca(OH)2 for reducing the environmental impacts of desalination reject brine using the calcium oxide-based modified Solvay process were investigated. For this purpose, response surface modeling (RSM) and central composite design (CCD) were applied. The significance of these factors and their interactions was assessed using an analysis of variance (ANOVA) technique with a 95% degree of certainty (p < 0.05). Optimal conditions for this process included: a temperature of 10 °C, a Ca(OH)2/NaCl concentration ratio of 0.36, and a gas flow rate of 800 mL/min. Under these conditions, the maximum sodium removal efficiency from the synthetic sodium chloride solution was 53.51%. Subsequently, by employing the real brine rejected from the desalination unit with a 63 g/L salinity level under optimal conditions, the removal rate of sodium up to 43% was achieved. To investigate the process’s kinetics of Na elimination, three different kinds of kinetics models were applied from zero to second order. R squared values of 0.9101, 0.915, and 0.9141 were obtained in this investigation for zero-, first-, and second-degree kinetic models, respectively, when synthetic reject saline reacted. In contrast, according to R squared’s results with utilizing real rejected brine, the results for the model of kinetics were: R squared = 0.9115, 0.9324, and 0.9532, correspondingly. As a result, the elimination of sodium from real reject brine is consistent with the second-order kinetic model. According to the findings, the calcium oxide-based modified Solvay method offers a great deal of promise for desalination of brine rejected from desalination units and reducing their environmental impacts. The primary benefit of this technology is producing a usable solid product (sodium bicarbonate) from sodium chloride in the brine solution.

1. Introduction

Water is necessary as a raw material for life on Earth [1]. Today, water pollution has led to the severe destruction of resources and degradation of environmental growth, human nutrient levels, and economic conditions. To protect natural resources from pollution, domestic water and wastewater regulations have been introduced for the use of water and sewage in cities as an effective method [2]. To address the freshwater shortage to survive on Earth, desalination of seawater is essential, but this technology has faced severe limitations since its inception. One of the main factors limiting the growth and productivity of desalination is salinity [3]. The salinity of water affects its quality; a high salt concentration leads to turbidity, so this type of pollution prevents light from entering the water and impedes photosynthesis [4]. Emissions of carbon dioxide are also a significant environmental problem. In terms of global warming, carbon dioxide is the most potent greenhouse gas. Carbon dioxide emissions from fossil fuel-based power plants account for over 60% of all CO2 emissions in the atmosphere [5].
Several scientific studies around the world are trying to remove these limitations and expand the desalination industry. Today, as Persian Gulf countries are trying to reduce the emission of greenhouse gases such as carbon dioxide, they have accepted the proposal of Carbon Capture and Storage (CCS) and are looking for ways to cooperate [6,7]. By 2030, Europe’s energy road plan calls for a 40% decrease in greenhouse gas (GHG) emissions, which can only be accomplished through CCS technology [8,9].
Capturing CO2 by chemical solvents is one of the most intriguing methods for reducing the growing levels of global warming gases in the atmosphere. Amines and ammonia are the most commonly employed CO2 capture solvents [10,11]. One of the major drawbacks of the main Solvay process is the presence of ammonia, which can pose a threat to both the environment and human health. A high level of ammonia exposure can result in severe burns to the skin, nose, throat, and breathing system [12].
Modified Solvay processes are used to desalinate brine discharged from desalination units and convert sodium chloride salt into useful carbonate products [12]. This ammonia-free Solvay method uses carbon dioxide to react with saline water (reaction 1). The advantages of the calcium oxide-based modified Solvay method include the use of calcium oxide instead of risky ammonia, reducing energy consumption, operational activities, and operating costs. This technique has the dual advantage of lowering sodium levels in the reject brine while also lowering carbon dioxide emissions in the environment [13]. A calcium oxide-based Solvay scheme is shown in Figure 1.
2 NaCl + 2 CO 2 + Ca OH 2 CaCl 2 + 2 NaHCO 3
Numerous studies have been performed on methods that can capture carbon dioxide and also reduce the salinity of saline water rejected from desalination units [14,15,16,17]. Mohammad et al. [18] developed a novel Solvay technique for recovering large concentrations of ammonia from water in the form of NH4Cl, NH4OH, and (NH4)2CO3. The Solvay effluent with an initial ammonia content of 13,700 mg/L was reduced to 190 mg/L. A 77.1% ammonia recovery in NH4OH form was also accomplished. Mourad et al. [19] considered a modified Solvay process based on potassium hydroxide that could simultaneously capture carbon dioxide and reduce the reject brine ions. At relatively high temperatures, the Solvay method was tested for its capacity to reduce brine salinity. The effect of various operating parameters on CO2 capture and ion removal was investigated and optimized by applying CCD-RSM design [20]. These factors included pressure, KOH concentration, temperature, and CO2 gas flow rate. In another study [21], they looked at the effects of potassium hydroxide and aluminum oxide on the pH level, CO2 capture capacity, and ion reduction. Mustafa et al. [22], in a review paper, presented various methods to manage pollutants such as carbon dioxide and reject brine. They argued that a single chemical reaction would be the most efficient method of dealing with these contaminants. A process was proposed by Dindi et al. [23] for the treatment of brine wastewaters rejected from desalination units in combination with CO2 capture and using NaHCO3. The results showed that for each kg of the carbonated solution, the carbon absorption capacity of 1.86 mol and the NaHCO3 yield of 44 g were obtained. Sodium and chloride concentrations in brine decreased by 20% and 70%, respectively. Muftah et al. [24] compared the traditional (ammonia-based) and calcium hydroxide-based modified Solvay processes. These processes captured 86% and 99% of carbon dioxide and removed 29% and 35% of sodium, respectively. Dindi et al. [25] evaluated several alkylamines, including MEA (99%), 2-Amino 2-Methyl propanol (99%), Methyl diethanolamine (MDEA), and Piperazine (99%) to replace ammonia as a carbon dioxide absorbent in the Solvay process. According to the results, by increasing the sodium concentration from 0.6 to 1.8 M, the amine concentration by 30 wt.%, and the temperature of 23 °C as the lowest one, the greatest conversion of sodium to bicarbonate and the highest carbon dioxide uptake were found. Huang et al. [26] investigated a modified Solvay process called the Dual Alkali Approach. In this method, two types of amines, including Methyl Amino Ethanol (MAE) and Mono Ethanol Amine (MEA), were studied as an alternative to ammonia in the traditional Solvay process. MAE performed better than the other one. With activated carbon, they were also able to recover ammonia from ammonium chloride solution in the main Solvay process.
This study’s objective is to simultaneously use saline wastewater from desalination plants and carbon dioxide from the power plant as hazardous environmental factors in the modified Solvay process to convert saline into useful carbonate products, such as sodium bicarbonate. Therefore, another product will be low salinity water suitable for irrigation. The novelty of this study is the use of real and synthetic brine with very high salinity (60–120 g/L) and achieving an acceptable amount of salt removal at a low temperature. The effect of various factors on the removal of sodium in brine and its sedimentation as sodium bicarbonate solid by the modified Solvay process based on calcium oxide and without the use of ammonia is evaluated. These parameters include: different concentrations of sodium chloride, temperature, various concentrations of calcium hydroxide, and gas flow rate. Then, the optimum conditions for the removal of sodium from brine were determined before applying it to the real desalination reject brine.

2. Materials and Method

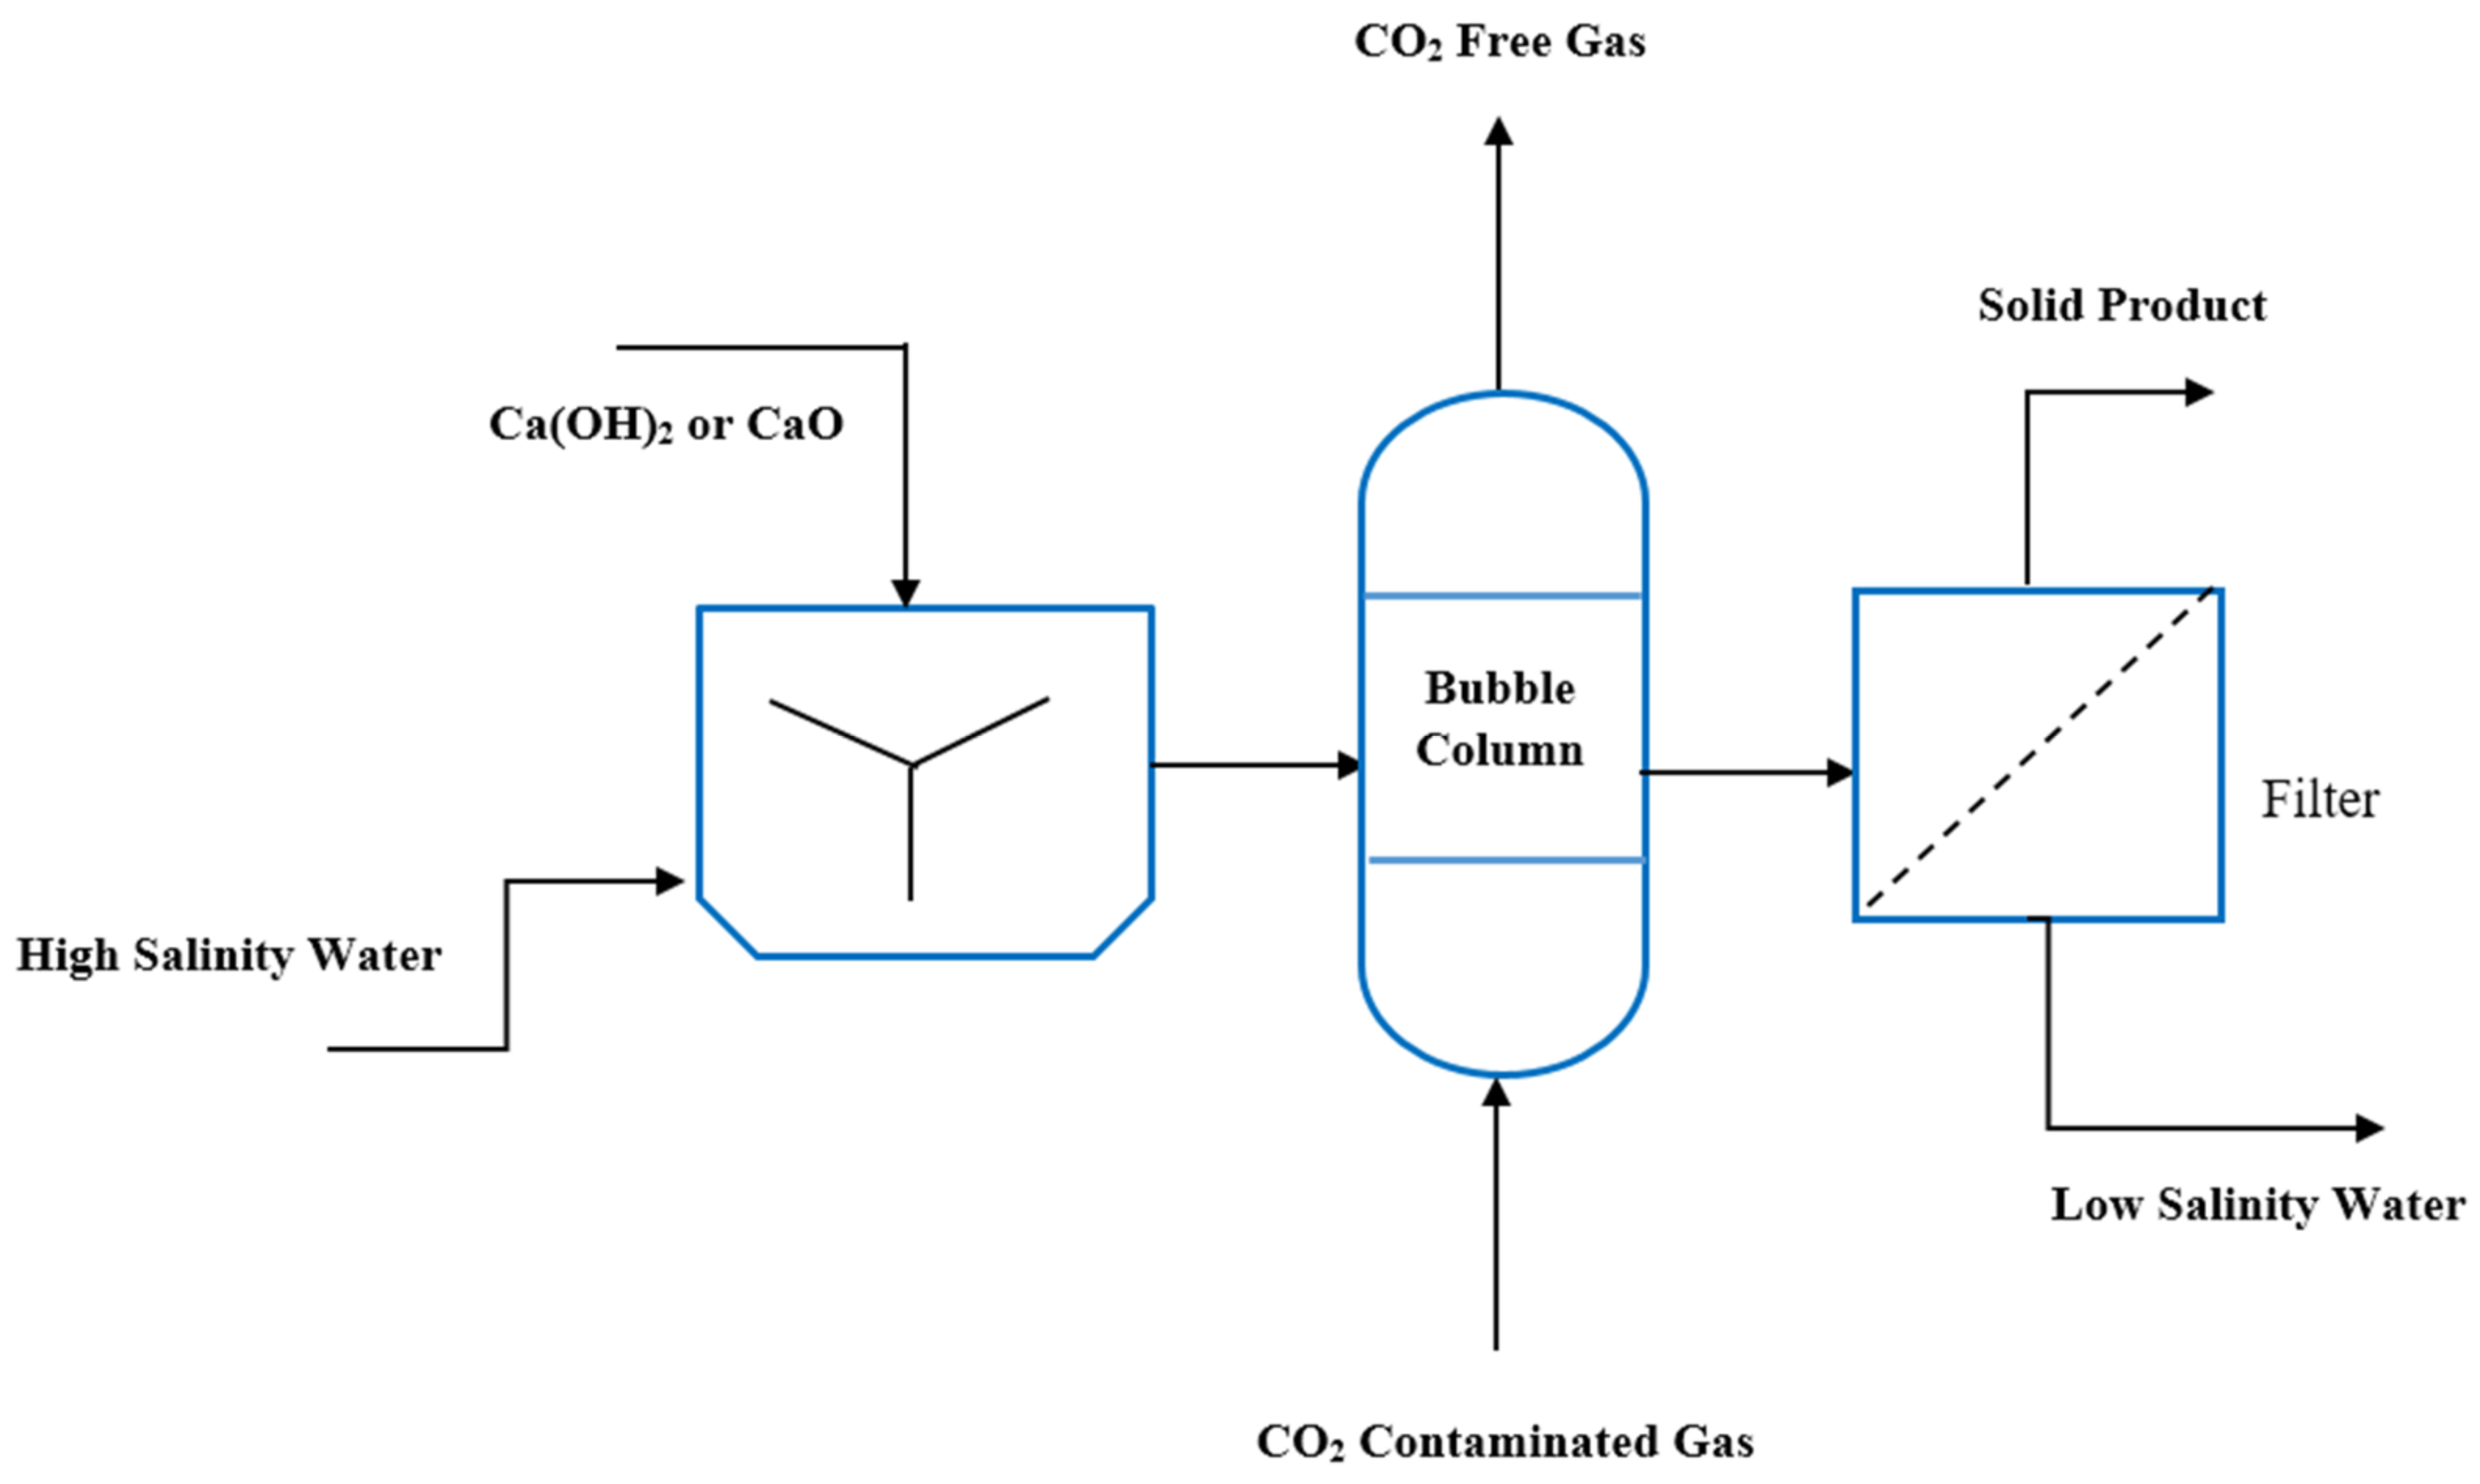
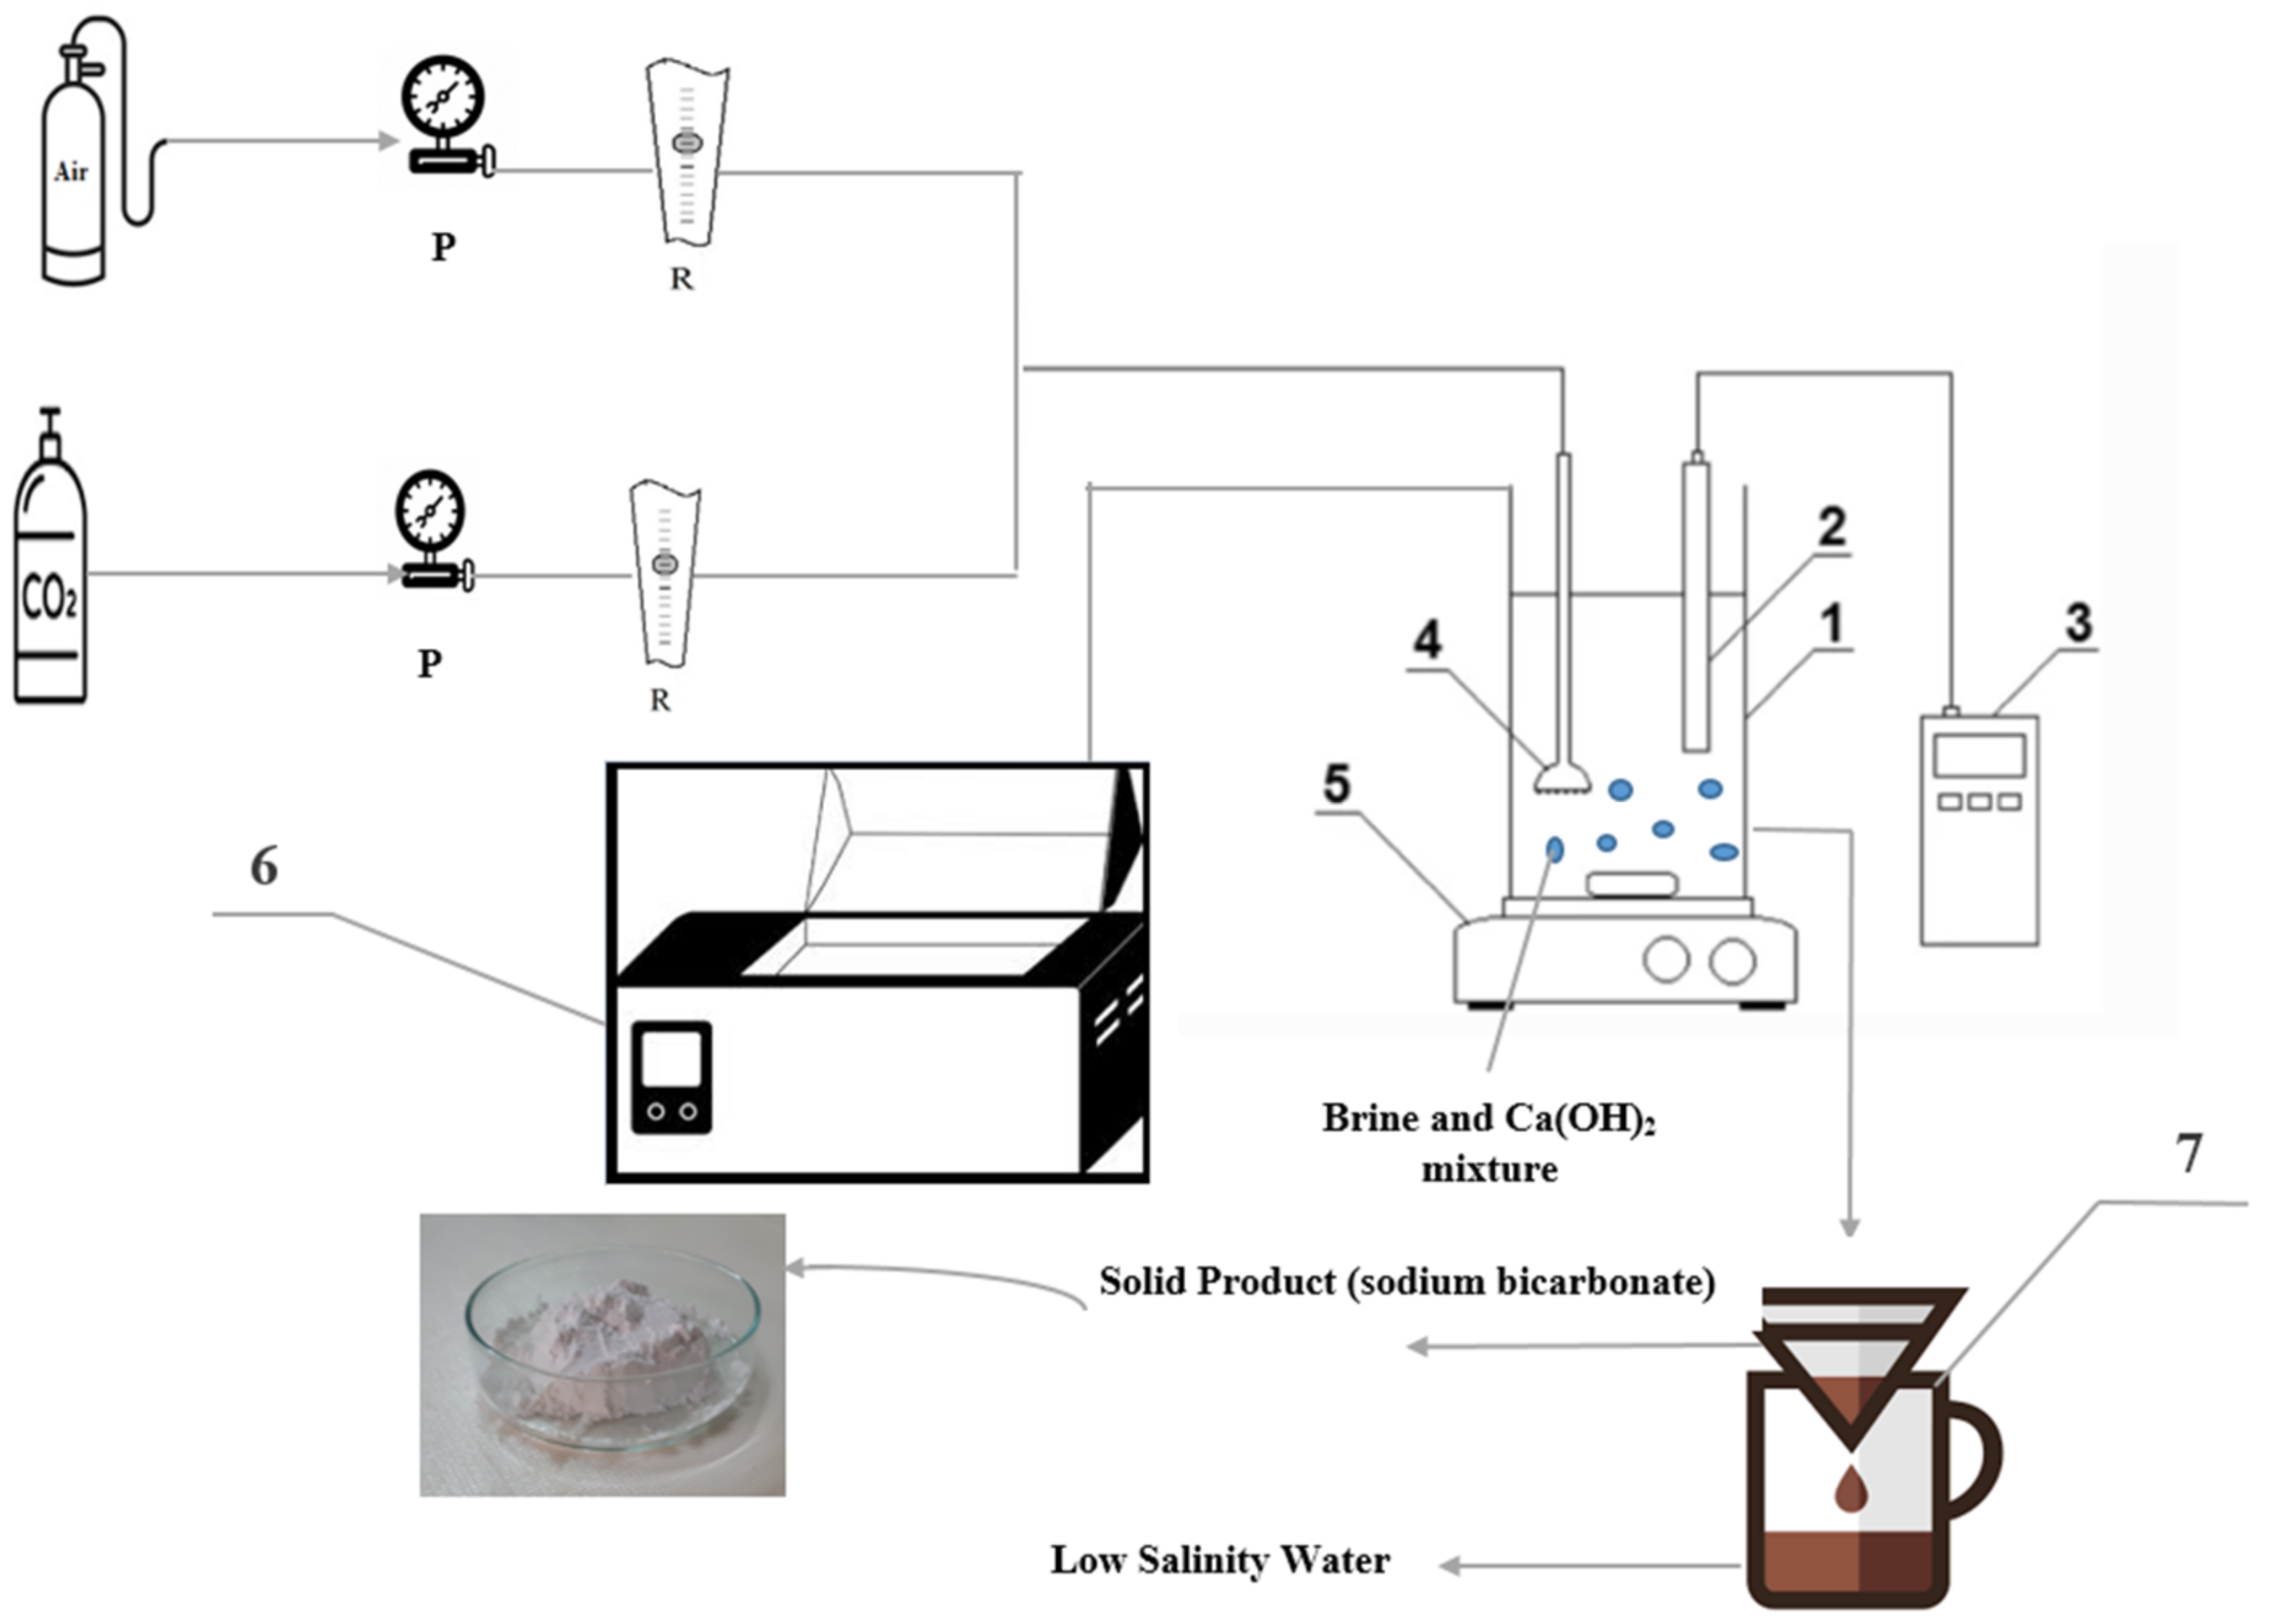
2.1. Experimental Setup

In the modified Solvay process, a bubble column reactor is used. For gas-liquid systems, bubble columns are used as strippers and absorbers. Bubble column reactors are commonly implemented because of their simplicity of construction, maintenance, and lack of mechanical parts. Furthermore, the slow reaction inside these reactors can increase the liquid holdup, the high surface area, and, finally, enhance the overall mass transfer coefficient. The double-walled reactor in this study is made of Pyrex, with a height of 40 cm, an inner diameter of 8 cm, and a distance of 0.5 cm between the double-walled. The reactor lid is made of Teflon with a diameter of 10 cm, which is placed on top of the reactor to prevent the release of gases used in the process. Two rotameters made in Germany are used to adjust the flow ratio of 10% carbon dioxide gas to 90% air. Air stone is used to produce small gas bubbles in the liquid inside the reactor to mix and better contact the gas with the solution and perform the reaction.
Based on the experimental design, the amount of sodium chloride and calcium hydroxide salt was accurately measured. The mixture was then poured into a 2000 mL Erlenmeyer flask filled with one liter of distilled water. This solution is then placed in an Erlenmeyer containing the magnet and stirred for 10 min at 800 rpm and 25 °C for better mixing. Once the solution is transferred to the magnetic stirrer, it is placed in a double-walled reactor with a magnet. The reactor operates in a semi-batch state; the continuous operation is specialized for the gas state, while the batch one is for the liquid. To prevent precipitation of the mixture and to ensure good mixing, the stirrer is continuously adjusted and turned on at 500 rpm. The temperature of the water bath is then adjusted to achieve the desired temperature. By connecting the outlet hose of the water bath to the inlet of the second wall of the reactor, the outlet water of the wall is returned to the water bath to readjust the temperature. Throughout the process, this procedure is repeated. To avoid temperature loss, the reactor is well covered with aluminum foil. The flow-meter is then used to set the 10 to 90 ratio of the carbon dioxide gas flow rate entering the reactor to the dry air. Thus, the conversion of the required units was performed by stoichiometry. The modified Solvay process starts as soon as the gas enters the reactor. Based on the studies, 4 h was determined as the appropriate time for the process [24]. At the beginning and during operation, the pH of the solution is accurately measured. At the end of the processing time, the solution is transferred to a beaker, then filtered to precipitate the solid product and allowed to dry at room temperature. The electrical conductivity of the residual water is also measured to determine the concentration of the remaining salt. The experimental setup of the modified Solvay process is shown in Figure 2.

2.2. Experimental Materials

NaCl is used in the preparation of synthetic saline solutions required by the modified Solvay process. The NaCl was prepared with 99% purity from Dr. Mojallali Industrial Chemical Complex Co., Iran. Ca(OH)2 is also used as an alkali to improve the deposition of sodium bicarbonate and was purchased with 93% purity from Bushehr Hydrated Lime Co., Iran. Two 10-L cylinders, one containing carbon dioxide and the other containing dry air with 99.9% purity, were produced by Lian Oxygen Aria Company, (Bushehr, Iran).

2.3. Design of Experiment for Modified Solvay Process

Examining a large number of variables with slightly different ranges boosts the number of experiments and raises cost and time. The central composite design based on the response surface method overcomes this limitation. It allows quantitative modeling of the simultaneous relationship of several independent variables with a dependent variable with the minimum number of possible experiments. Response surface method is a combination of statistical and mathematical methods that predicts or optimizes the response variable by designing an appropriate number of experiments and combining their results through multivariate analysis [27,28].
In this study, experiments designed based on a central composite design (CCD) by Response Surface Methodology (RSM) in experimental design software to investigate the effects of various factors such as initial salt concentration (X1, 60, 75, 90, 105, and 120), gas flow rate (10% CO2 and 90% air, X2, 20, 375, 550, 725 and 900), temperature (X3, 10, 17.5, 25, 32.5 and 40), calcium hydroxide concentration (X4, 10, 17.5, 25, 32.5 and 40), on the removal of sodium (response: RE) from synthetic brine during the modified Solvay process, which was conducted by determining the optimum conditions at the real desalination reject brine. A summary of these results can be seen in Table 1. To find out how many experiments were performed, the formula N = k2 + 2k + cp is used; here, N denotes the number of samples; k is the factor number, and (cp) is the replicate number of the central point [29]. Thirty-one experiments were calculated to be necessary. A second-order polynomial equation (Equation (2)) depicts the relationship between the answer (Y) and the variables (XK); Y is commonly dependent on several variables that are encoded [30]:
Y = b0 + b1X1 + … + bkXk + b12X1X2 + b13X1X3 + … + bk−1,kXk−1Xk + b11X12 + … + bkkXk2 + ℇ
The polynomial model’s coefficients are denoted by the symbols: b0 (fixed number) and b0, b1, …, bk, (effects of linearity), b11, …, bkk (2nd-order effects), and b12, b13, …, bk−1,k (interaction effects) [31]. The importance of each term in the regression equation was determined, and the model’s expressions of importance were identified using ANOVA analysis for each answer.
The removal efficiency factor (RE) was used to evaluate the performance of this process. Accordingly, Equation (3) shows the percentage of sodium removed from the brine and its conversion to solid sodium bicarbonate during the modified Solvay process.
RE % = C 0 C C 0 × 100
In this equation, C0 and C are the primary and secondary concentrations of sodium, respectively [32].

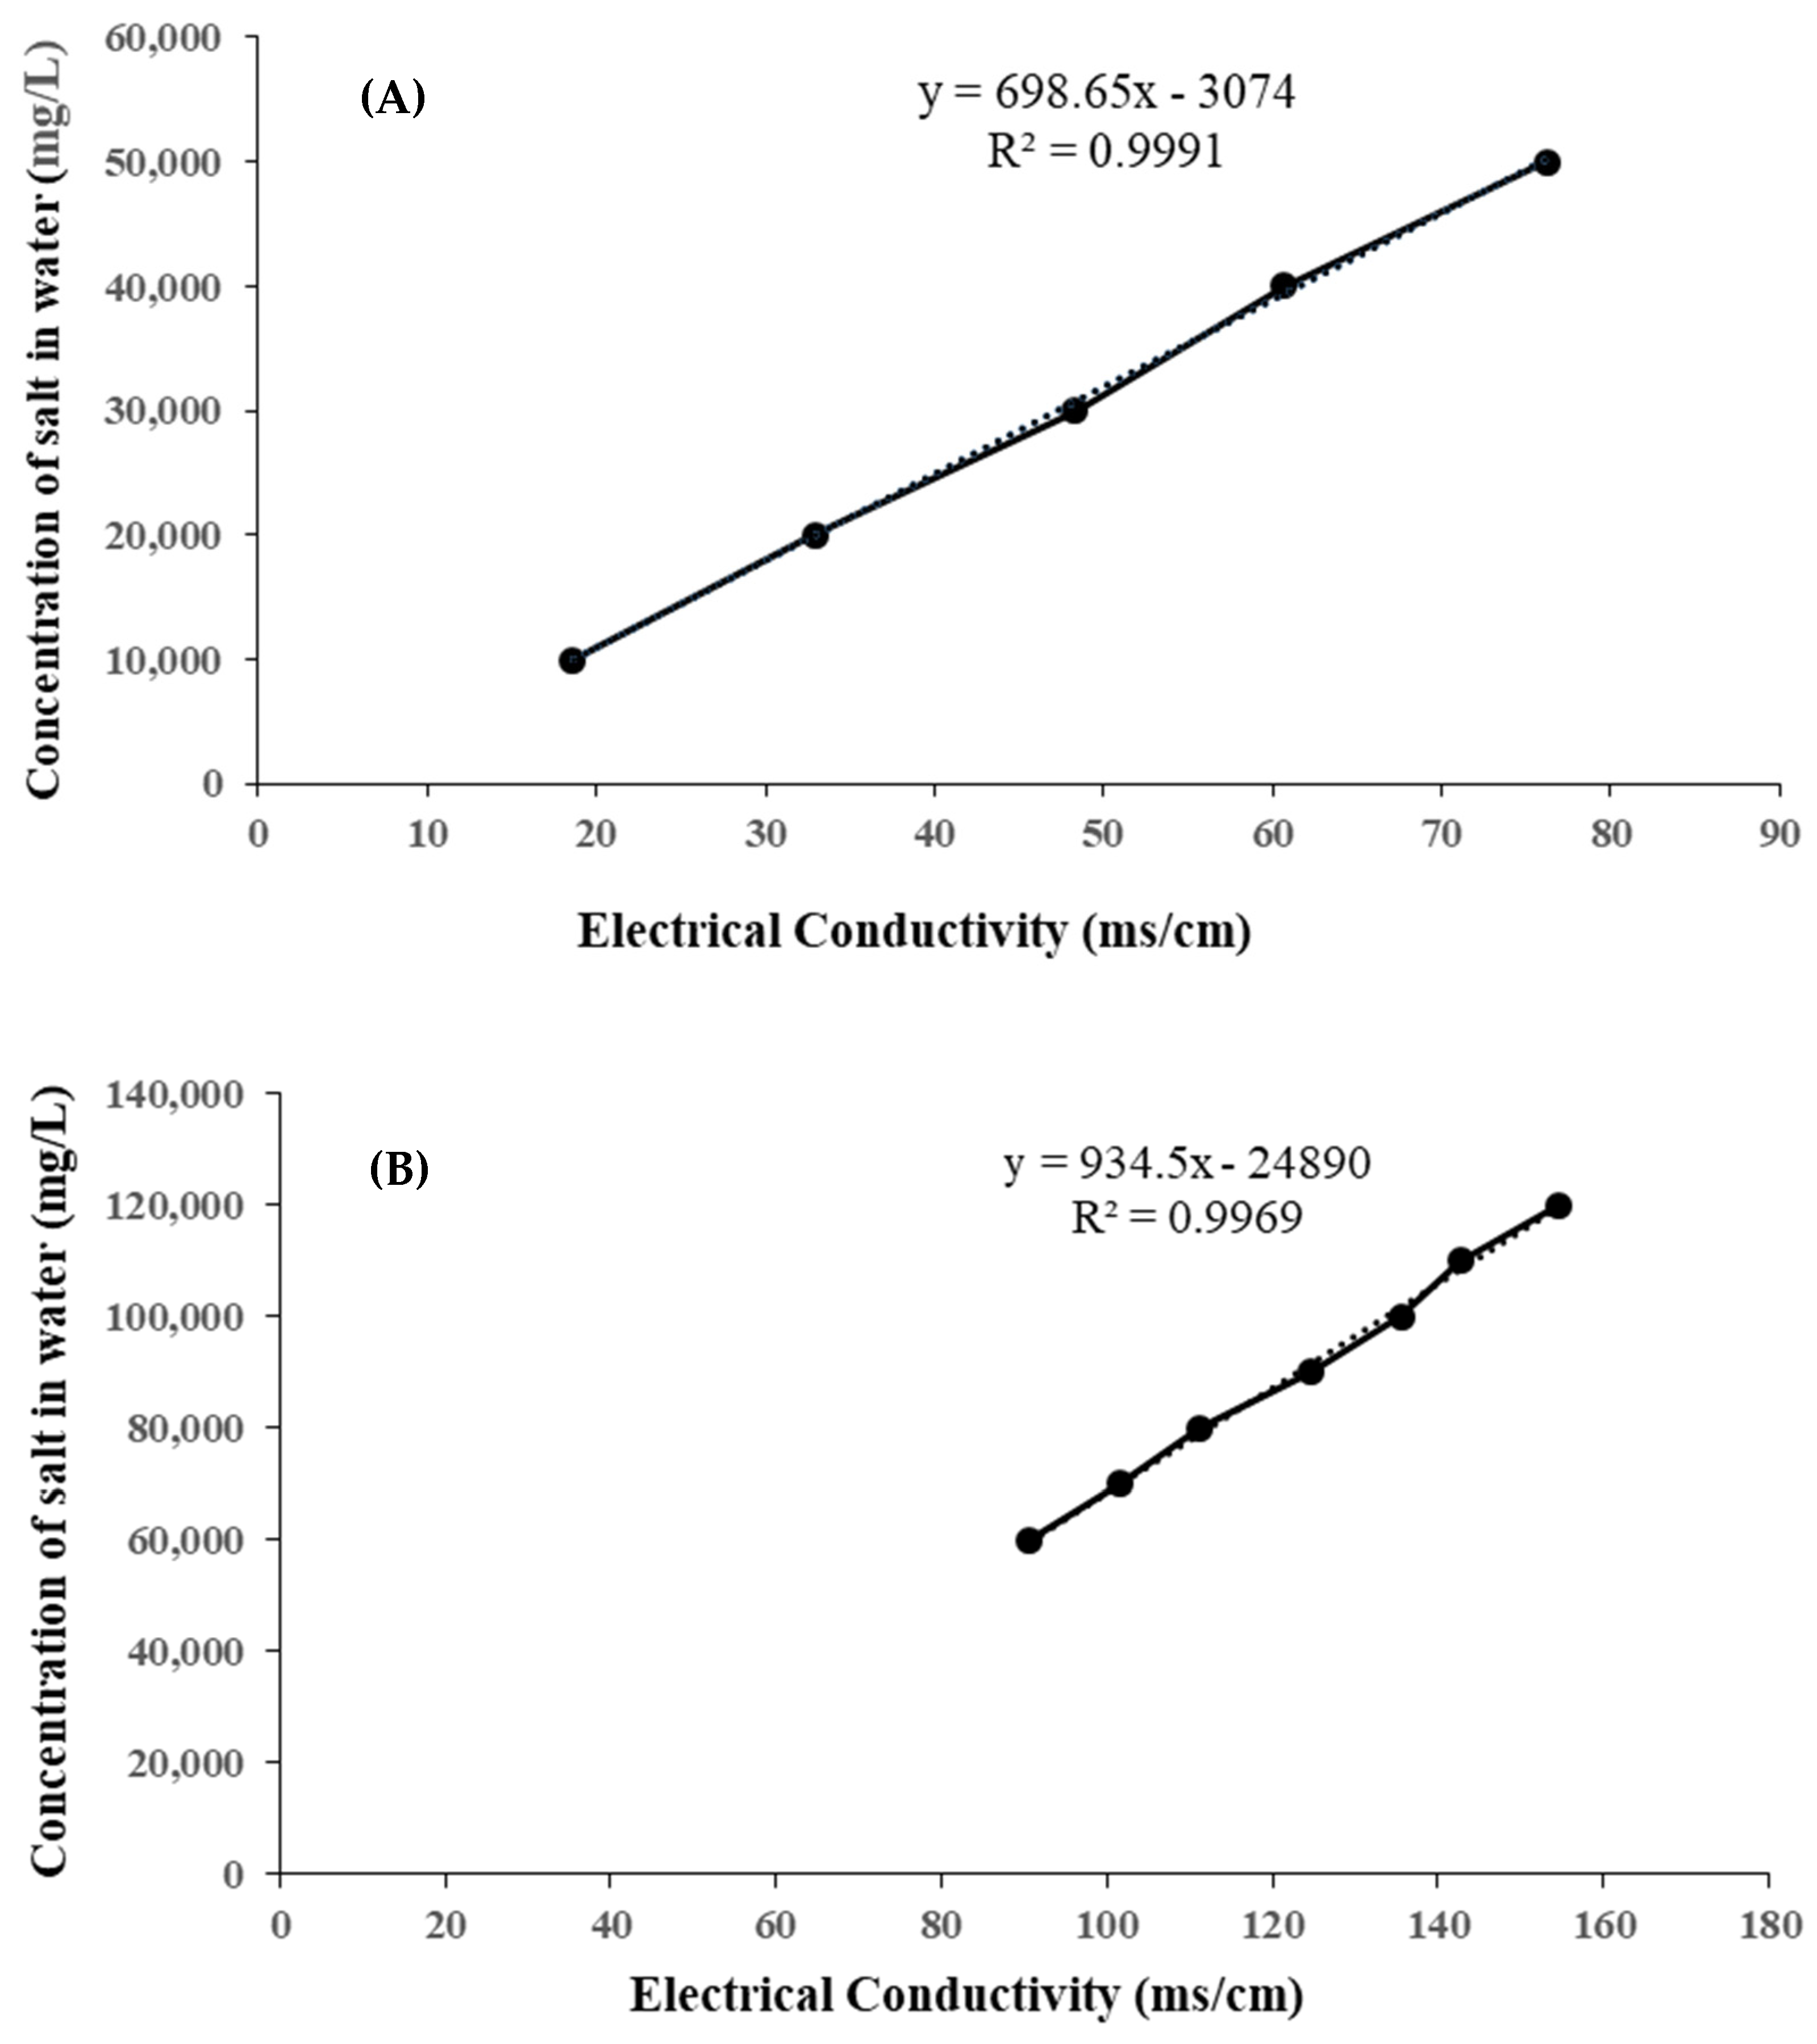
2.4. Drawing a Calibration Chart and Converting Electrical Conductivity to Total Soluble Solids

Due to a large number of experiments and the high salt content, it was better to use an electrical conductivity meter (EC meter) to measure sodium chloride concentration in water. Therefore, to determine the electrical conductivity of the solution and convert it to total soluble solids, its calibration diagram should be drawn. Hence, the NaCl salt was placed in an oven at 100 °C for 4 h to remove moisture. Solutions with a concentration of 10,000 to 120,000 mg/L of sodium chloride salt were then prepared, and their electrical conductivity was measured. Following that, the concentrations for 10,000 to 50,000 mg/L (Figure 3A) and 60,000 to 120,000 mg/L (Figure 3B) were depicted in two graphs. Using the chart of linear equation, the conductivity measured in the individual test steps can be converted into the total salt dissolved in it. Considering that both the input and output solution of the process contains sodium chloride salt as well as calcium hydroxide, the conductivity of water containing different concentrations of calcium hydroxide was also measured. It was observed that the amount of electrical conductivity for the maximum calcium hydroxide concentration and sodium chloride concentration (120,000 mg/L) is equal to 0.06. On the other hand, this effect will be much smaller due to the low ratio of calcium hydroxide to sodium chloride salts specified in the experimental design. Therefore, the calibration chart for the electrical conductivity of sodium chloride salt was used as the basis for determining the electrical conductivity of all solids, and the concentrations were calculated based on this chart. The R-squared values of calibration curves were determined to be 0.9991 and 0.9969, respectively.

2.5. Determination of the Optimal Reaction Conditions

After completing all the designed experiments and entering their results into the Minitab program, the program predicted the optimal conditions for each factor studied in the modified Solvay process. Under optimal conditions, the sodium removal percentage for the synthetic brine and the desalination reject brine were examined.

3. Results and Discussion

3.1. Analysis of the Central Composite Design (CCD)

The analysis of variance (ANOVA) was used to assess the information regarding the interaction impacts of the operational factors on the process. On the basis of F-tests and p-values, the most efficient parameters for modeling the response were identified using ANOVA [33]. CCD values for experimentally determined and model-predicted outcomes for Na removal by the modified Solvay process are reported in Table 2. Additionally, Table 3 summarizes the ANOVA findings using a quadratic model for Na removal. The F-value of 19.25 signifies that the model had a significant impact on the response, according to the ANOVA. In terms of F-values, the following order of influence was observed for the examined parameters on the modified Solvay process: gas flow rate > concentrations of calcium hydroxide > temperature > concentrations of sodium chloride. Furthermore, factors that have the ability to predict statistically in the presence of other variables have a probability coefficient (p-value) less than 0.05. In statistical terms, a p-value greater than 0.05 is deemed insignificant at a 95% level of confidence [34]. As can be seen in Table 3, the probability coefficient for all factors X1, X2, X3, and X4 is less than 0.05 and is significant. The values of the R2 and R2adj were observed to be 0.9444 and 0.9283 for Na removal, respectively; these results support the statistical model’s capacity to fit the experimental data and its application in estimating the percentage of Na removed. The real link between the answer (the percentage of Na removed) and the required variables is adequately expressed by the model, according to the analysis of variance (ANOVA). For data fitting, several models, such as linear, quadratic, and cubic models, were used to derive regression equations. The quadratic model provides the greatest fit for eliminating Na through the modified Solvay process, as seen in Table 4. In order to determine the equation of the fitted response surface, all meaningless variables with a probability coefficient greater than 0.05 were removed, and significant variables were used. According to the variables in Table 3, the linear effect of all factors was significant. However, the quadratic effect of X3 (p-value = 0.359 > 0.05) was insignificant. In relation to the interaction effect, only the X1 × X4 interaction was significant, and other effects were not considered to determine the regression equation. This fitted polynomial equation, which is expressed as a 3D surface, is used to visualize the relationship between the responses and experimental levels of each factor and to determine the optimal conditions. The regression equation with respect to the coded variables was obtained as follows:
Na removal (%) = −5.1 + 0.553 X1 + 0.10 X2 − 0.4743 X3 − 1.2 X4 − 0.01069 X1 × X1
−0.000064 X2 × X2 − 0.04721 X4 × X4 + 0.04582 X1 × X4

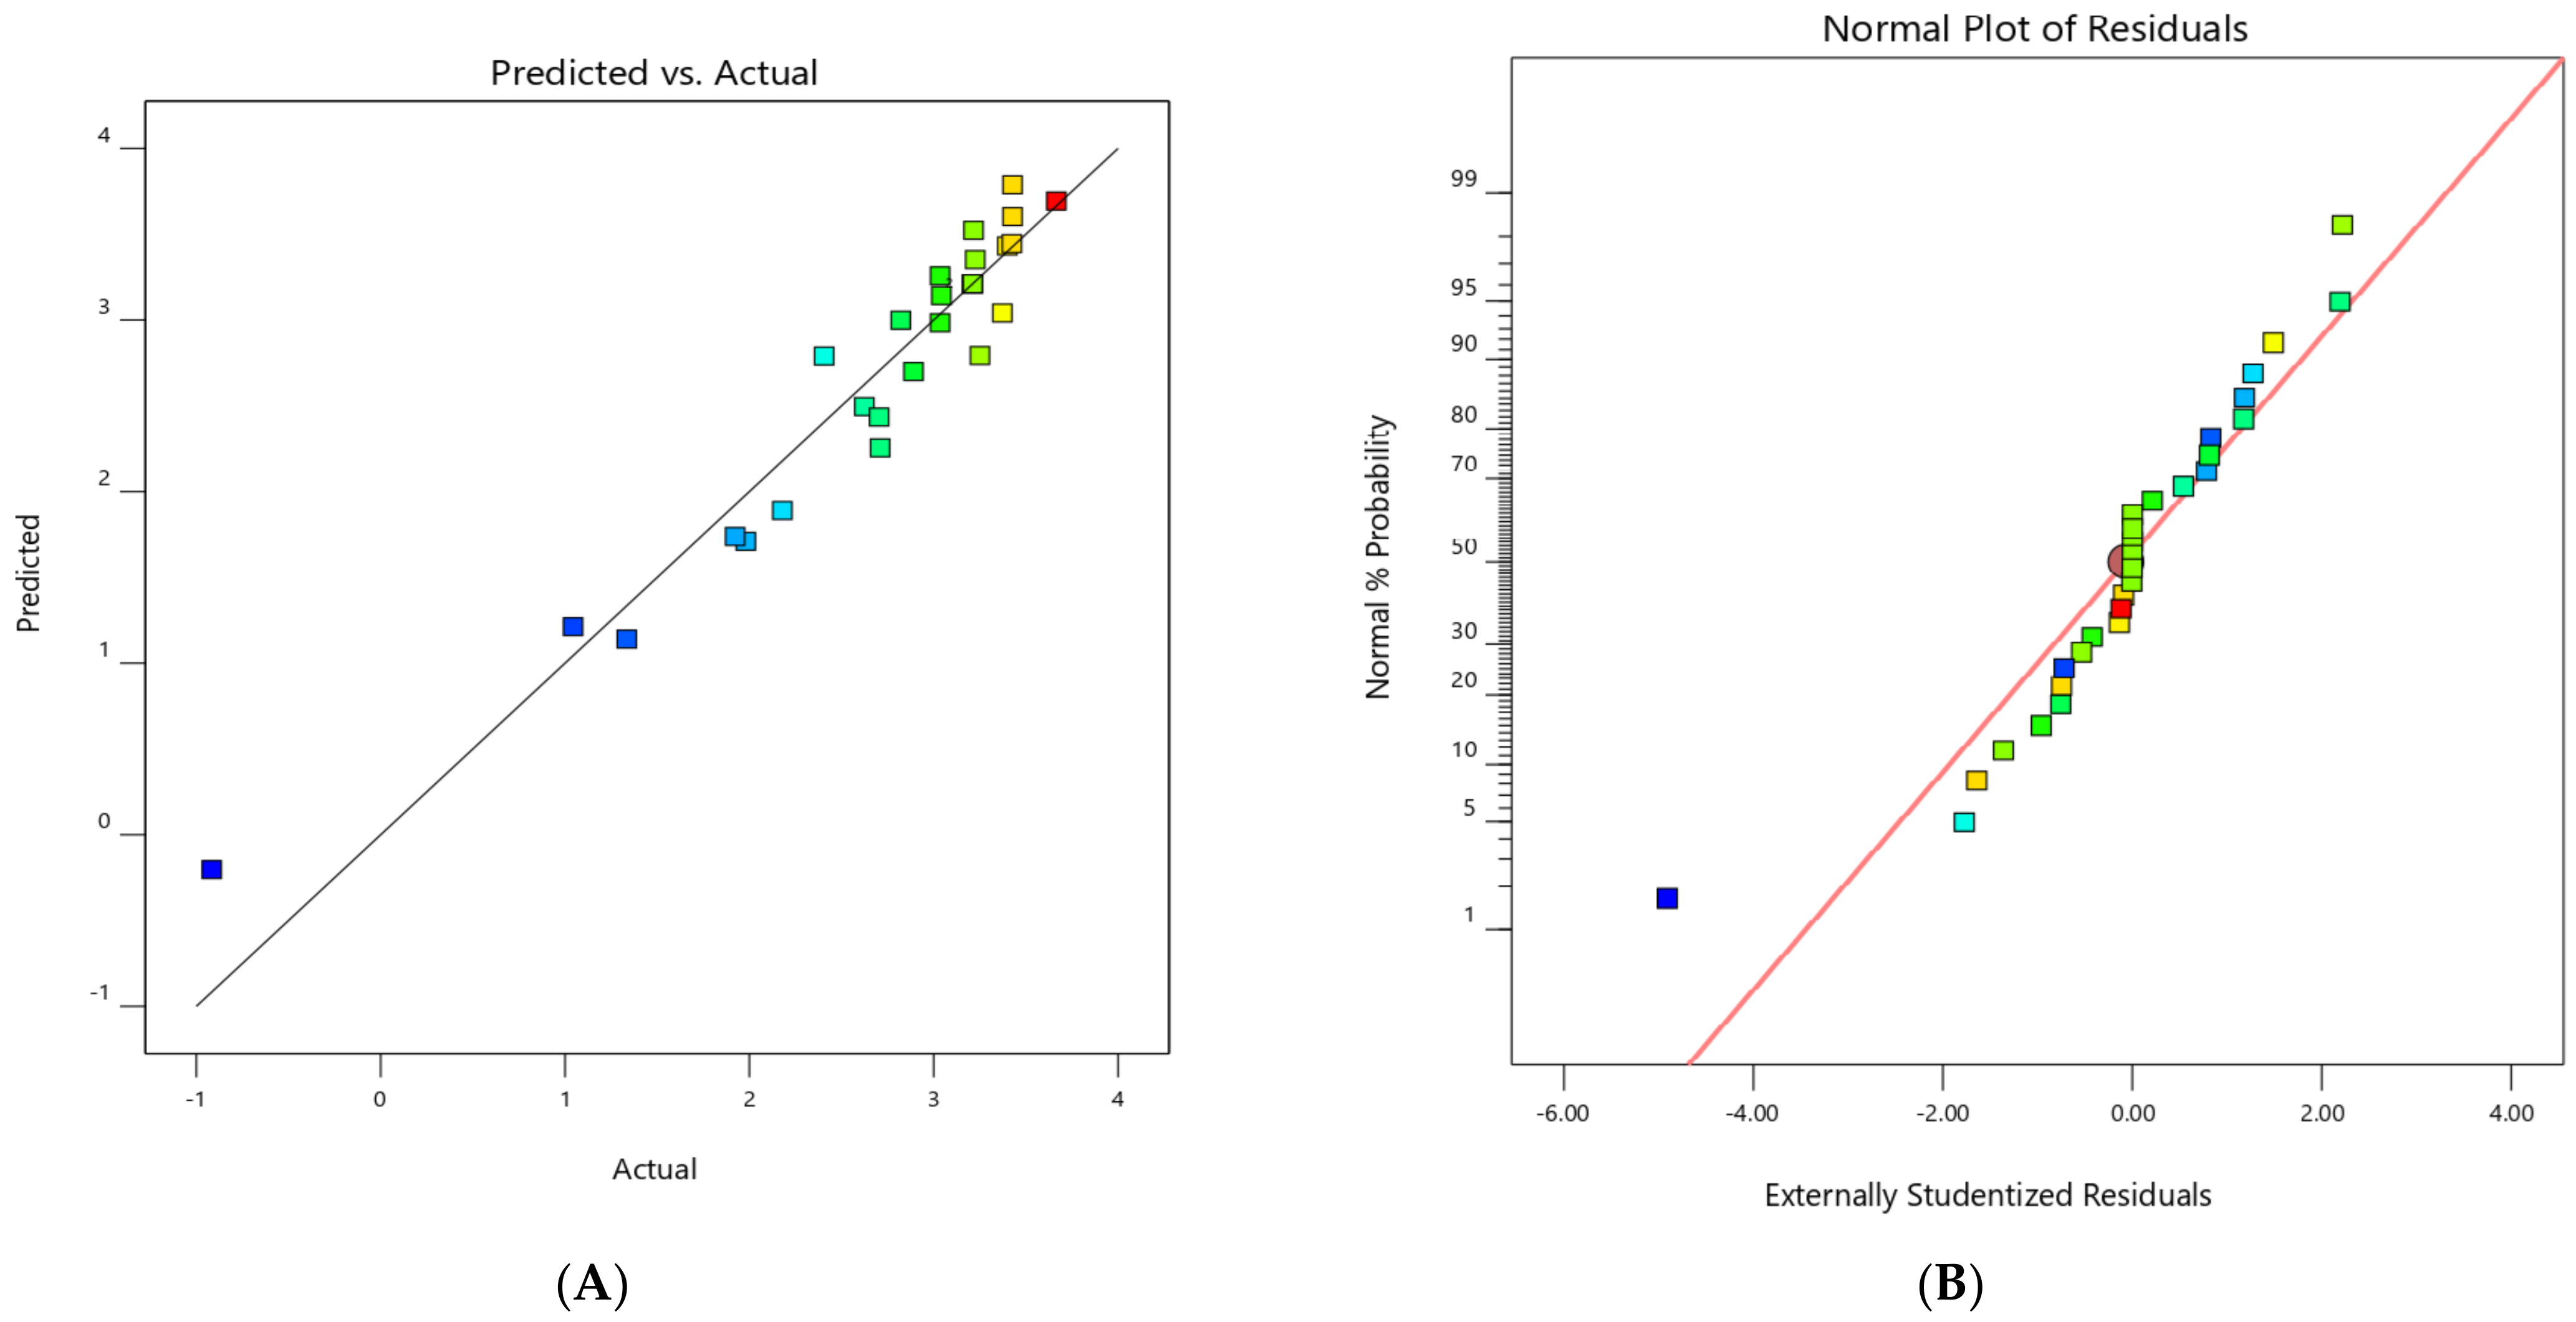
3.2. Evaluating the Suggested Model’s Precision and Validity

Experimental data on Na elimination were compared with model predictions to see if the model was applicable. As can be seen in Figure 4A, values are distributed in a straight line with a high degree of uniformity. Moreover, this figure shows that the experimental results are consistent with the predicted data line, demonstrating an accurate prediction of responses and a good fit between modeled and collected data. Additionally, a residual plot was used to confirm the model. This plot demonstrates the independence and normality of the residuals. Figure 4B shows the plot of normal % probability versus externally studentized residuals; a normal plot of residuals shows that residuals tend to lie on or near the straight line; this verifies the satisfied distribution and indicates the model’s usefulness for data fitting.

3.3. The Influence of Main Factors in the Modified Solvay Process

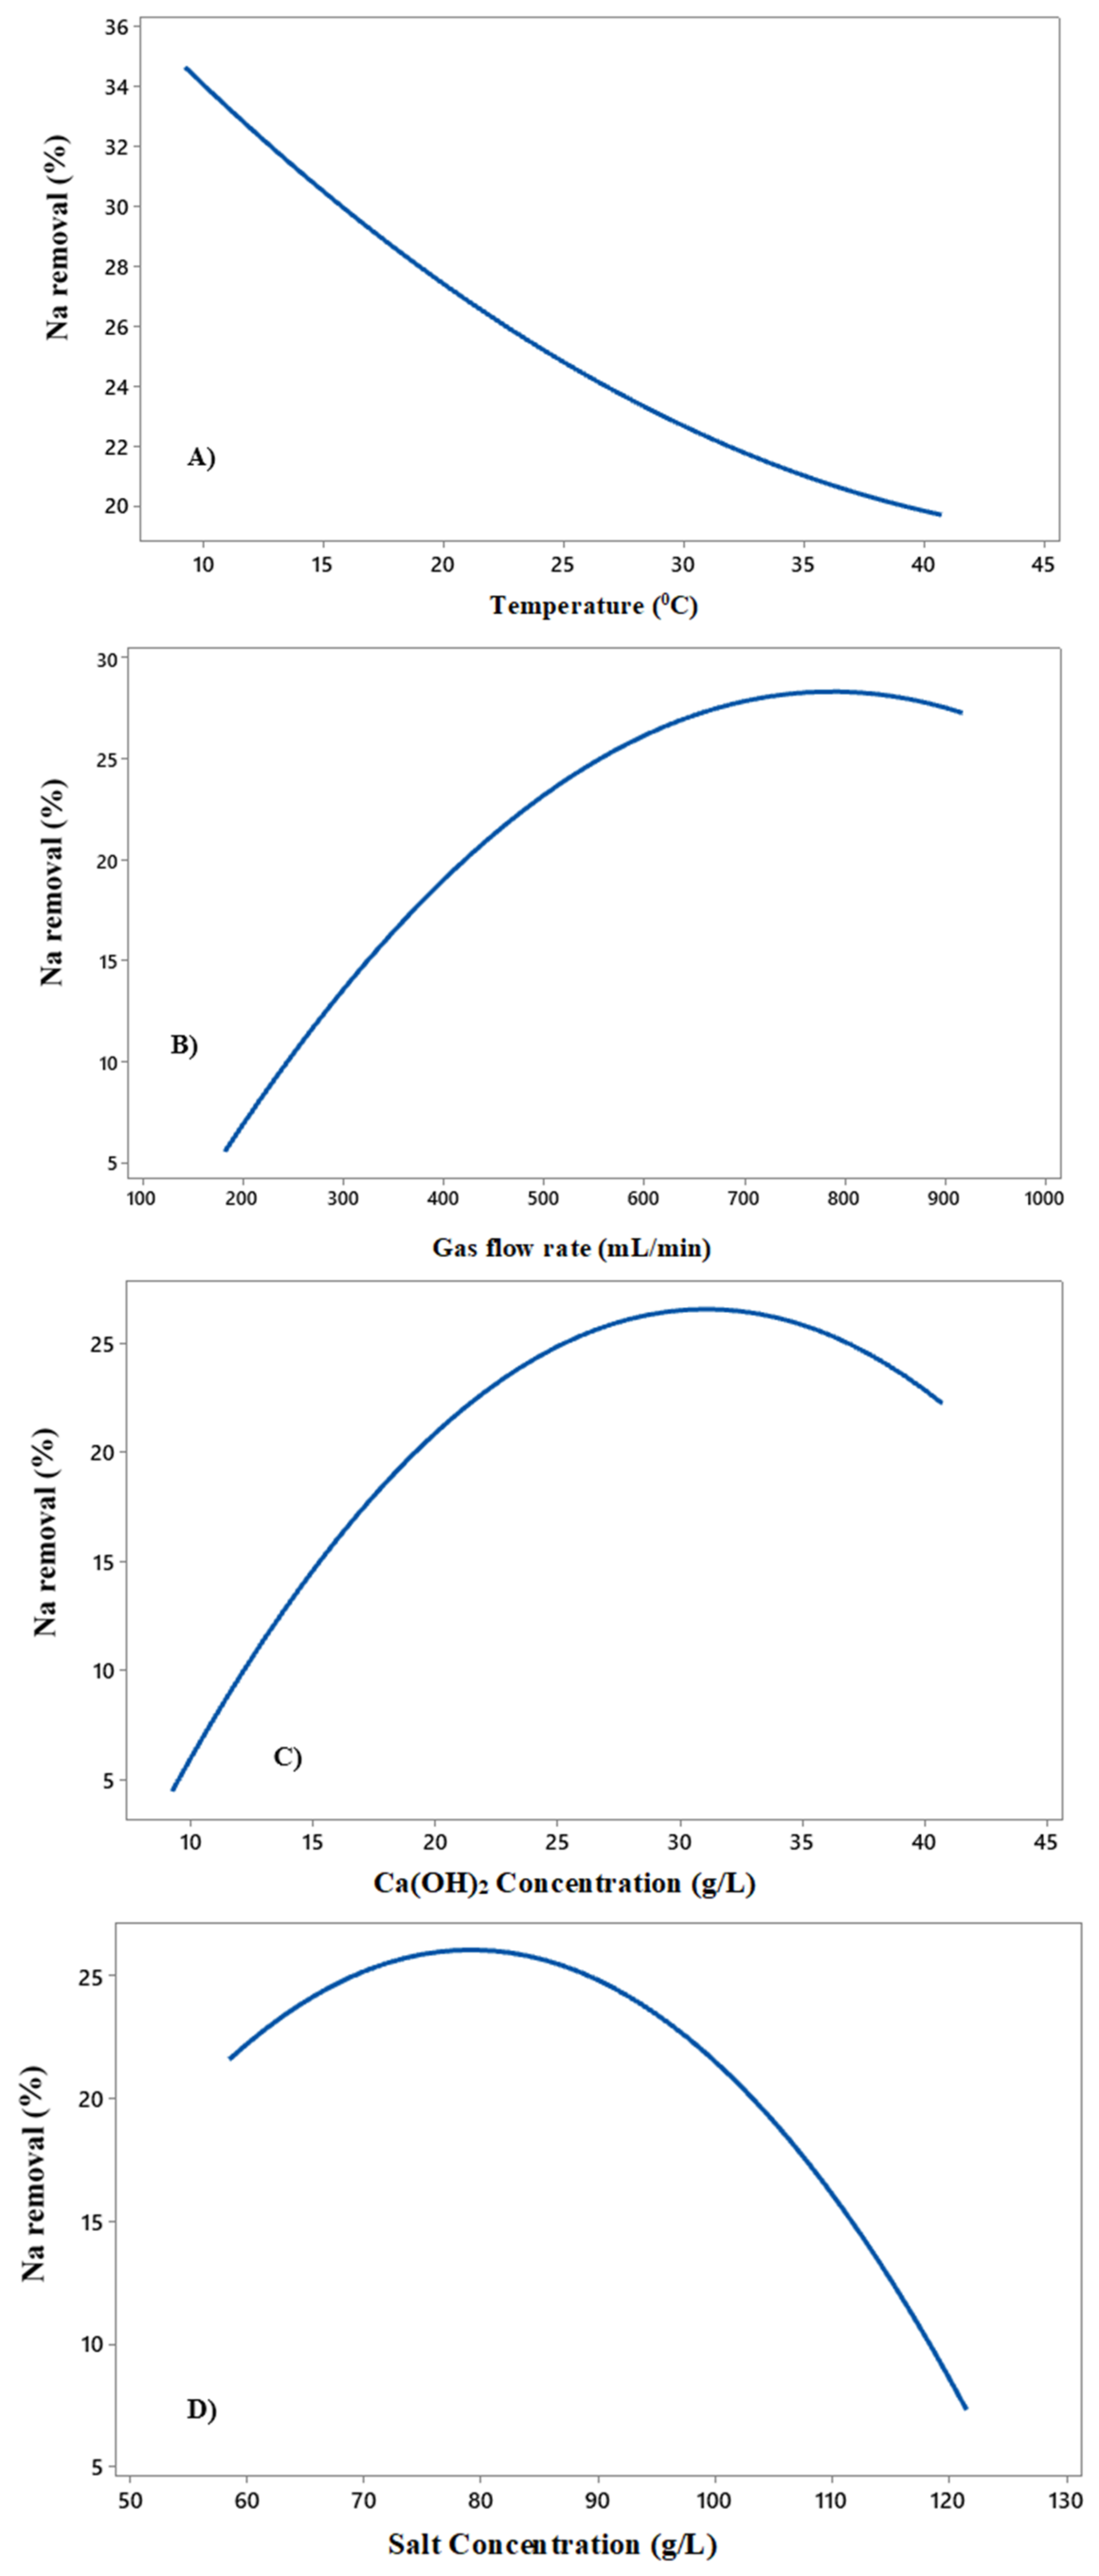
3.3.1. The Effect of Temperature on the Reaction

Figure 5A presents the effects of different temperatures from 10 °C to 40 °C on the modified Solvay process. At a low temperature (10 °C), it will be more suitable for increasing the solubility of carbon dioxide, decreasing the solubility of sodium bicarbonate and its precipitation, and then increasing the removal of sodium to about 35% of the brine. Therefore, temperature 10 °C can be determined as the optimal reaction temperature. In studies conducted by Mohammad et al. [35] and Muftah et al. [36], 35% sodium removal was achieved at a rection temperature of 20 °C. In contrast, we reached this level of sodium removal at a lower temperature.

3.3.2. The Influence of the Rate of Gas Flow on the Reaction

The influence of the rate of gas flow on the effectiveness of Na elimination was displayed in Figure 5B. It can be seen that by boosting the gas flow rate from 200 to 800 mL/min, sodium removal enhanced by about 30%. The rise in reaction rate, which is related to an increment in CO2 molecules injected into the reactor, can explain this phenomenon. In contrast, a flow rate exceeding 800 mL/min may have a little detrimental influence on the Na removal efficiency; this is attributed to the reduction of the carbon dioxide residence time in the reactor, which leads to a decrease in the reaction rate. A decrease in pH during the reaction at high gas flow rate can also be explained by the increase in reactor-loaded CO2 molecules per unit time [24].

3.3.3. The Effect of Calcium Hydroxide Concentration on the Reaction

Na removal in the modified Solvay process relies heavily on the amount of calcium hydroxide, an important reactant in the process. Figure 5C presents the effect of calcium hydroxide concentration on sodium removal. When the concentration of calcium hydroxide increased from 10 to about 33 g/L, the sodium removal rose from 3 to more than 25%. As expected, the pH was maintained in the alkaline state by increasing the concentration of calcium hydroxide during the longer reaction time [24]. However, Figure 5C displays that sodium removal decreased with an increment in the amount of calcium hydroxide above 33 g/L because this rise in amount prevents the materials in the reactor from mixing well, thus reducing the removal of sodium. Enhanced resistance to mass transfer between reactants can account for this phenomenon. Calcium hydroxide excess may also result in the creation of CaCO3, which competes with the bicarbonate of soda.

3.3.4. The Effect of Sodium Chloride Concentration

As can be seen in Figure 5D, the sodium removal enhanced from 20 to about 27% when the sodium chloride salt concentration enhanced from 60 to 80 g/L. However, it was observed that with further increment in sodium chloride amount, sodium removal also decreased, and excess sodium chloride did not react. An increment in the resistance to mass transfer between components participating in the reaction can potentially explain this behavior.

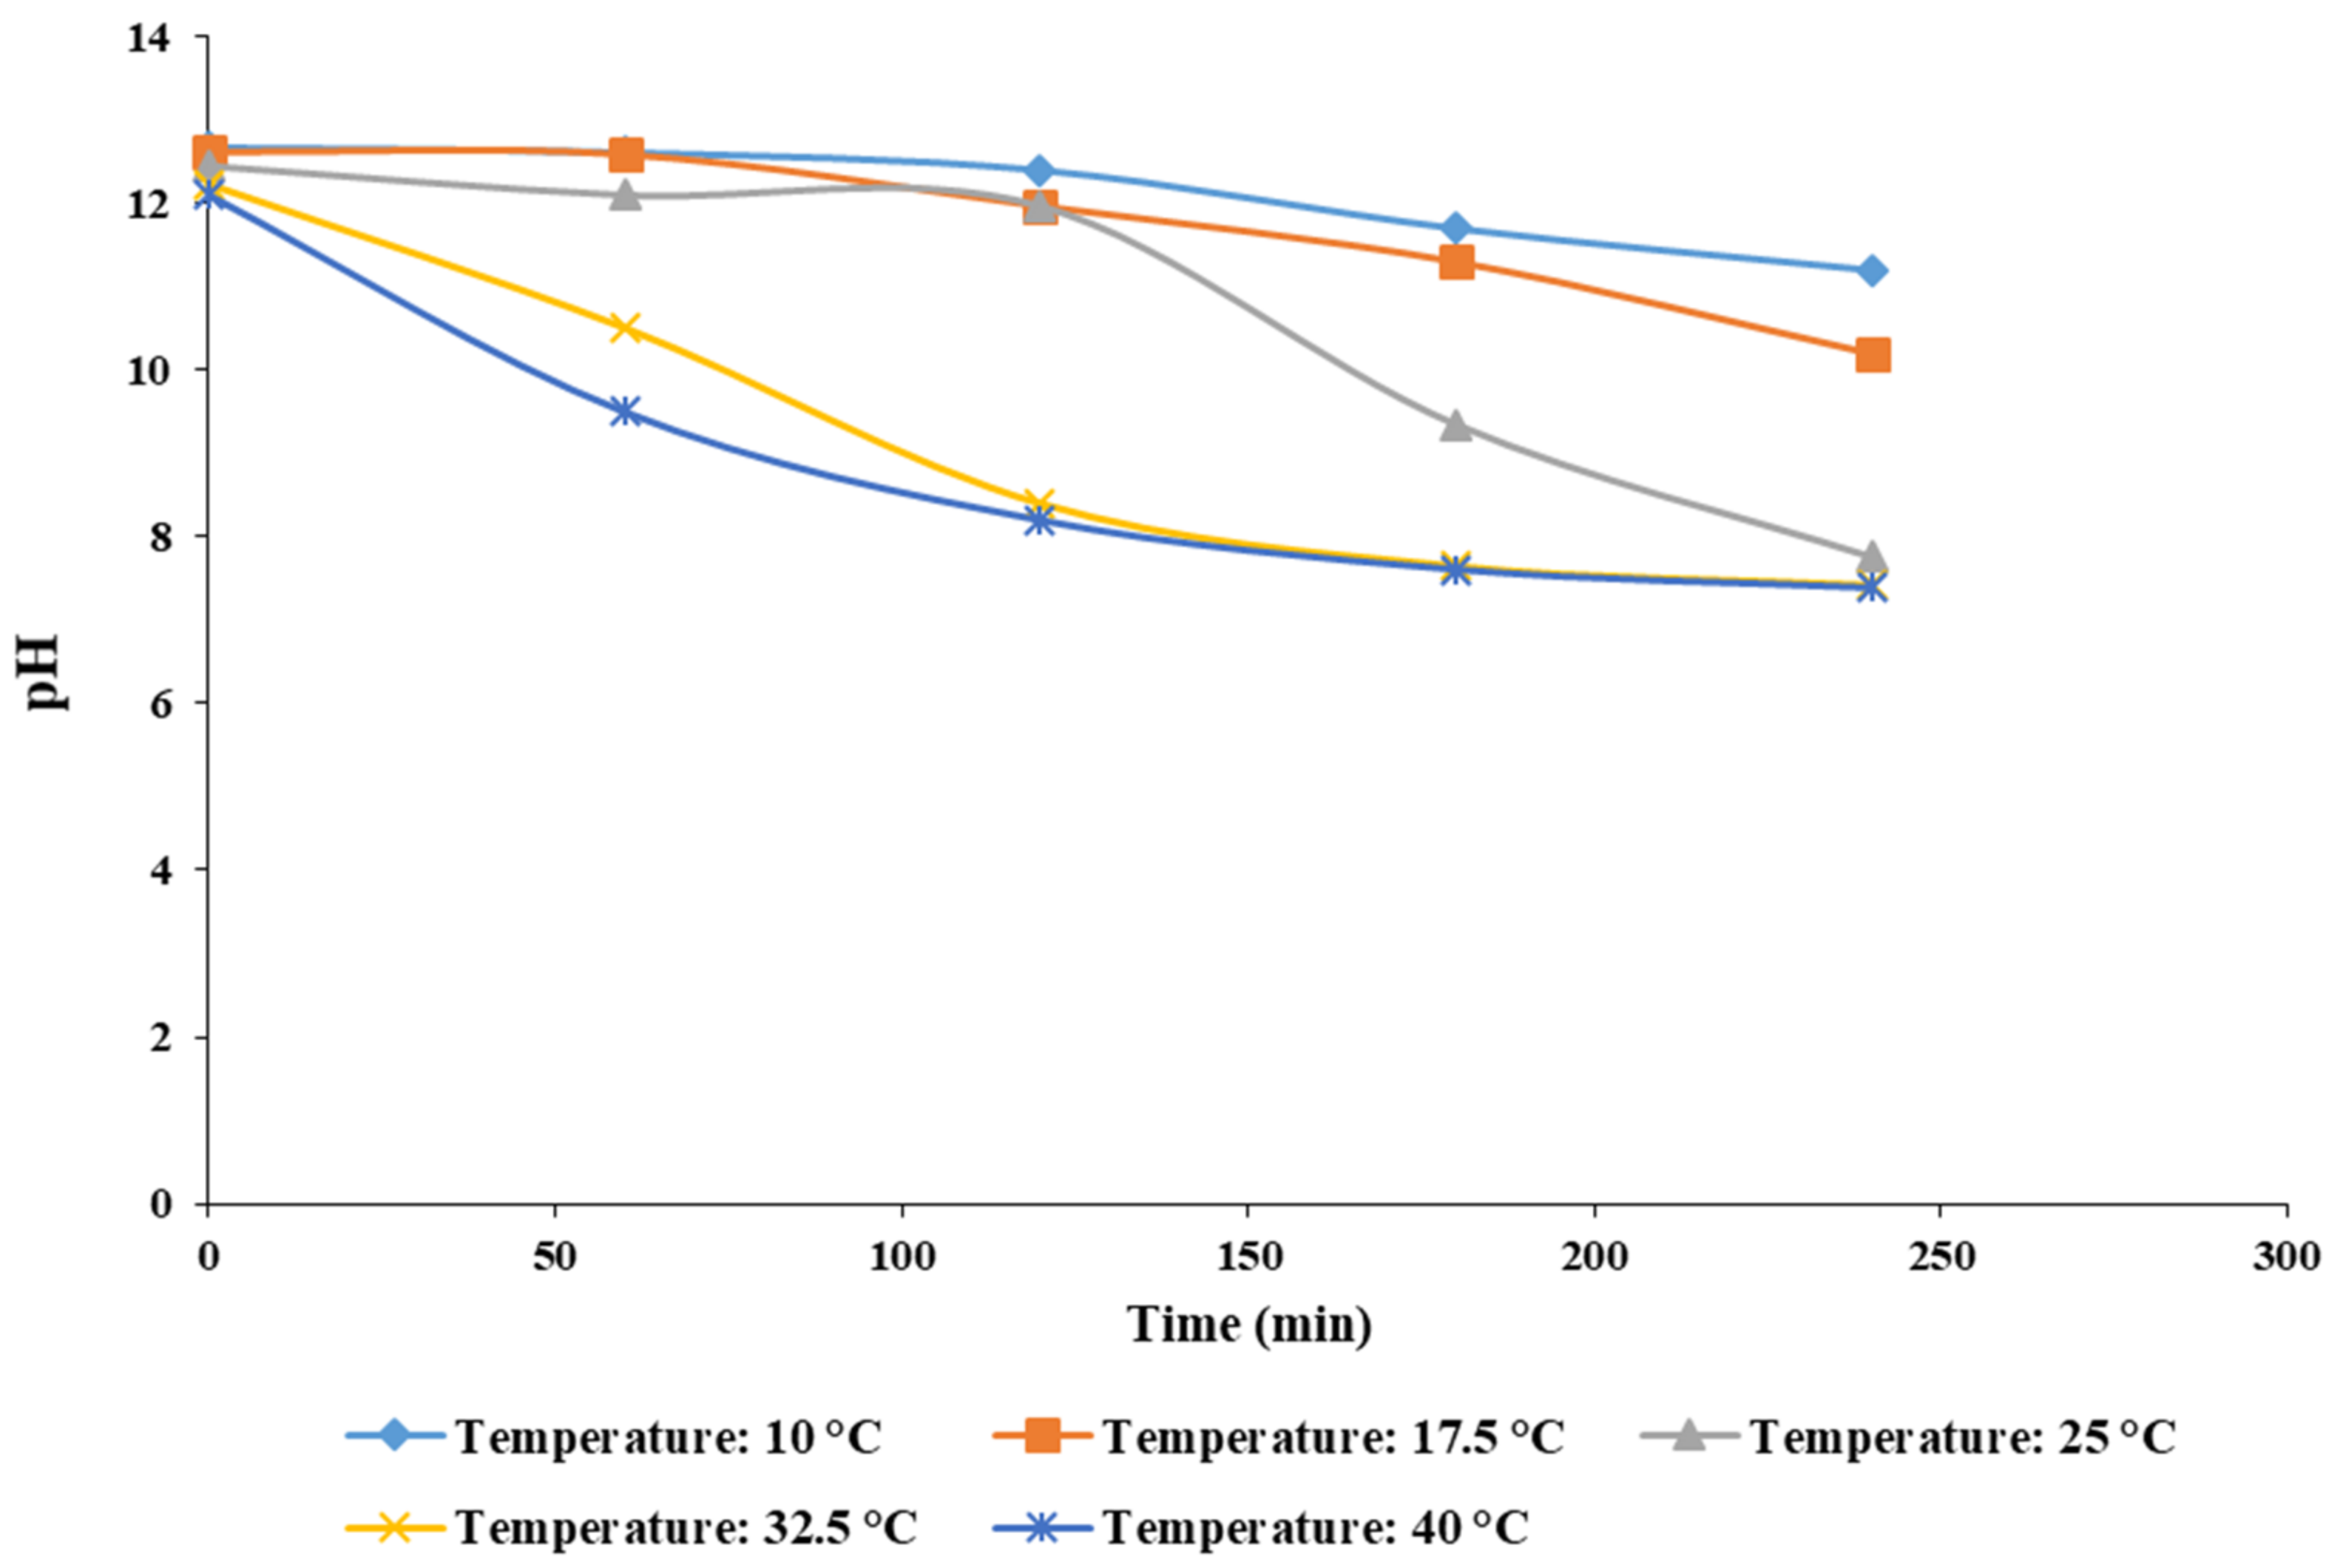
3.3.5. Effect of Reaction Temperature on pH

In response to rising temperatures, the equilibrium position is moved to counteract this increase by the absorption of excess heat and the formation of hydrogen and hydroxide ions, thereby causing increasing Kw (the ionic products of water) and decreasing pH [24]. Figure 6 revealed the effect of different temperatures on pH changes during reaction times. As can be seen from Figure 6, the pH became more stable at a lower temperature (10 or 17.5 °C) with higher basicity, and the conditions for precipitation of sodium bicarbonate were therefore better. Since CO2 dissolving in brine produces carbonic acid (H2CO3), which is decomposed into bicarbonate at low pH (high temperature). Consequently, there is a direct correlation between the concentrations of sodium cations and bicarbonate anions in brine solution and bicarbonate of soda precipitation.

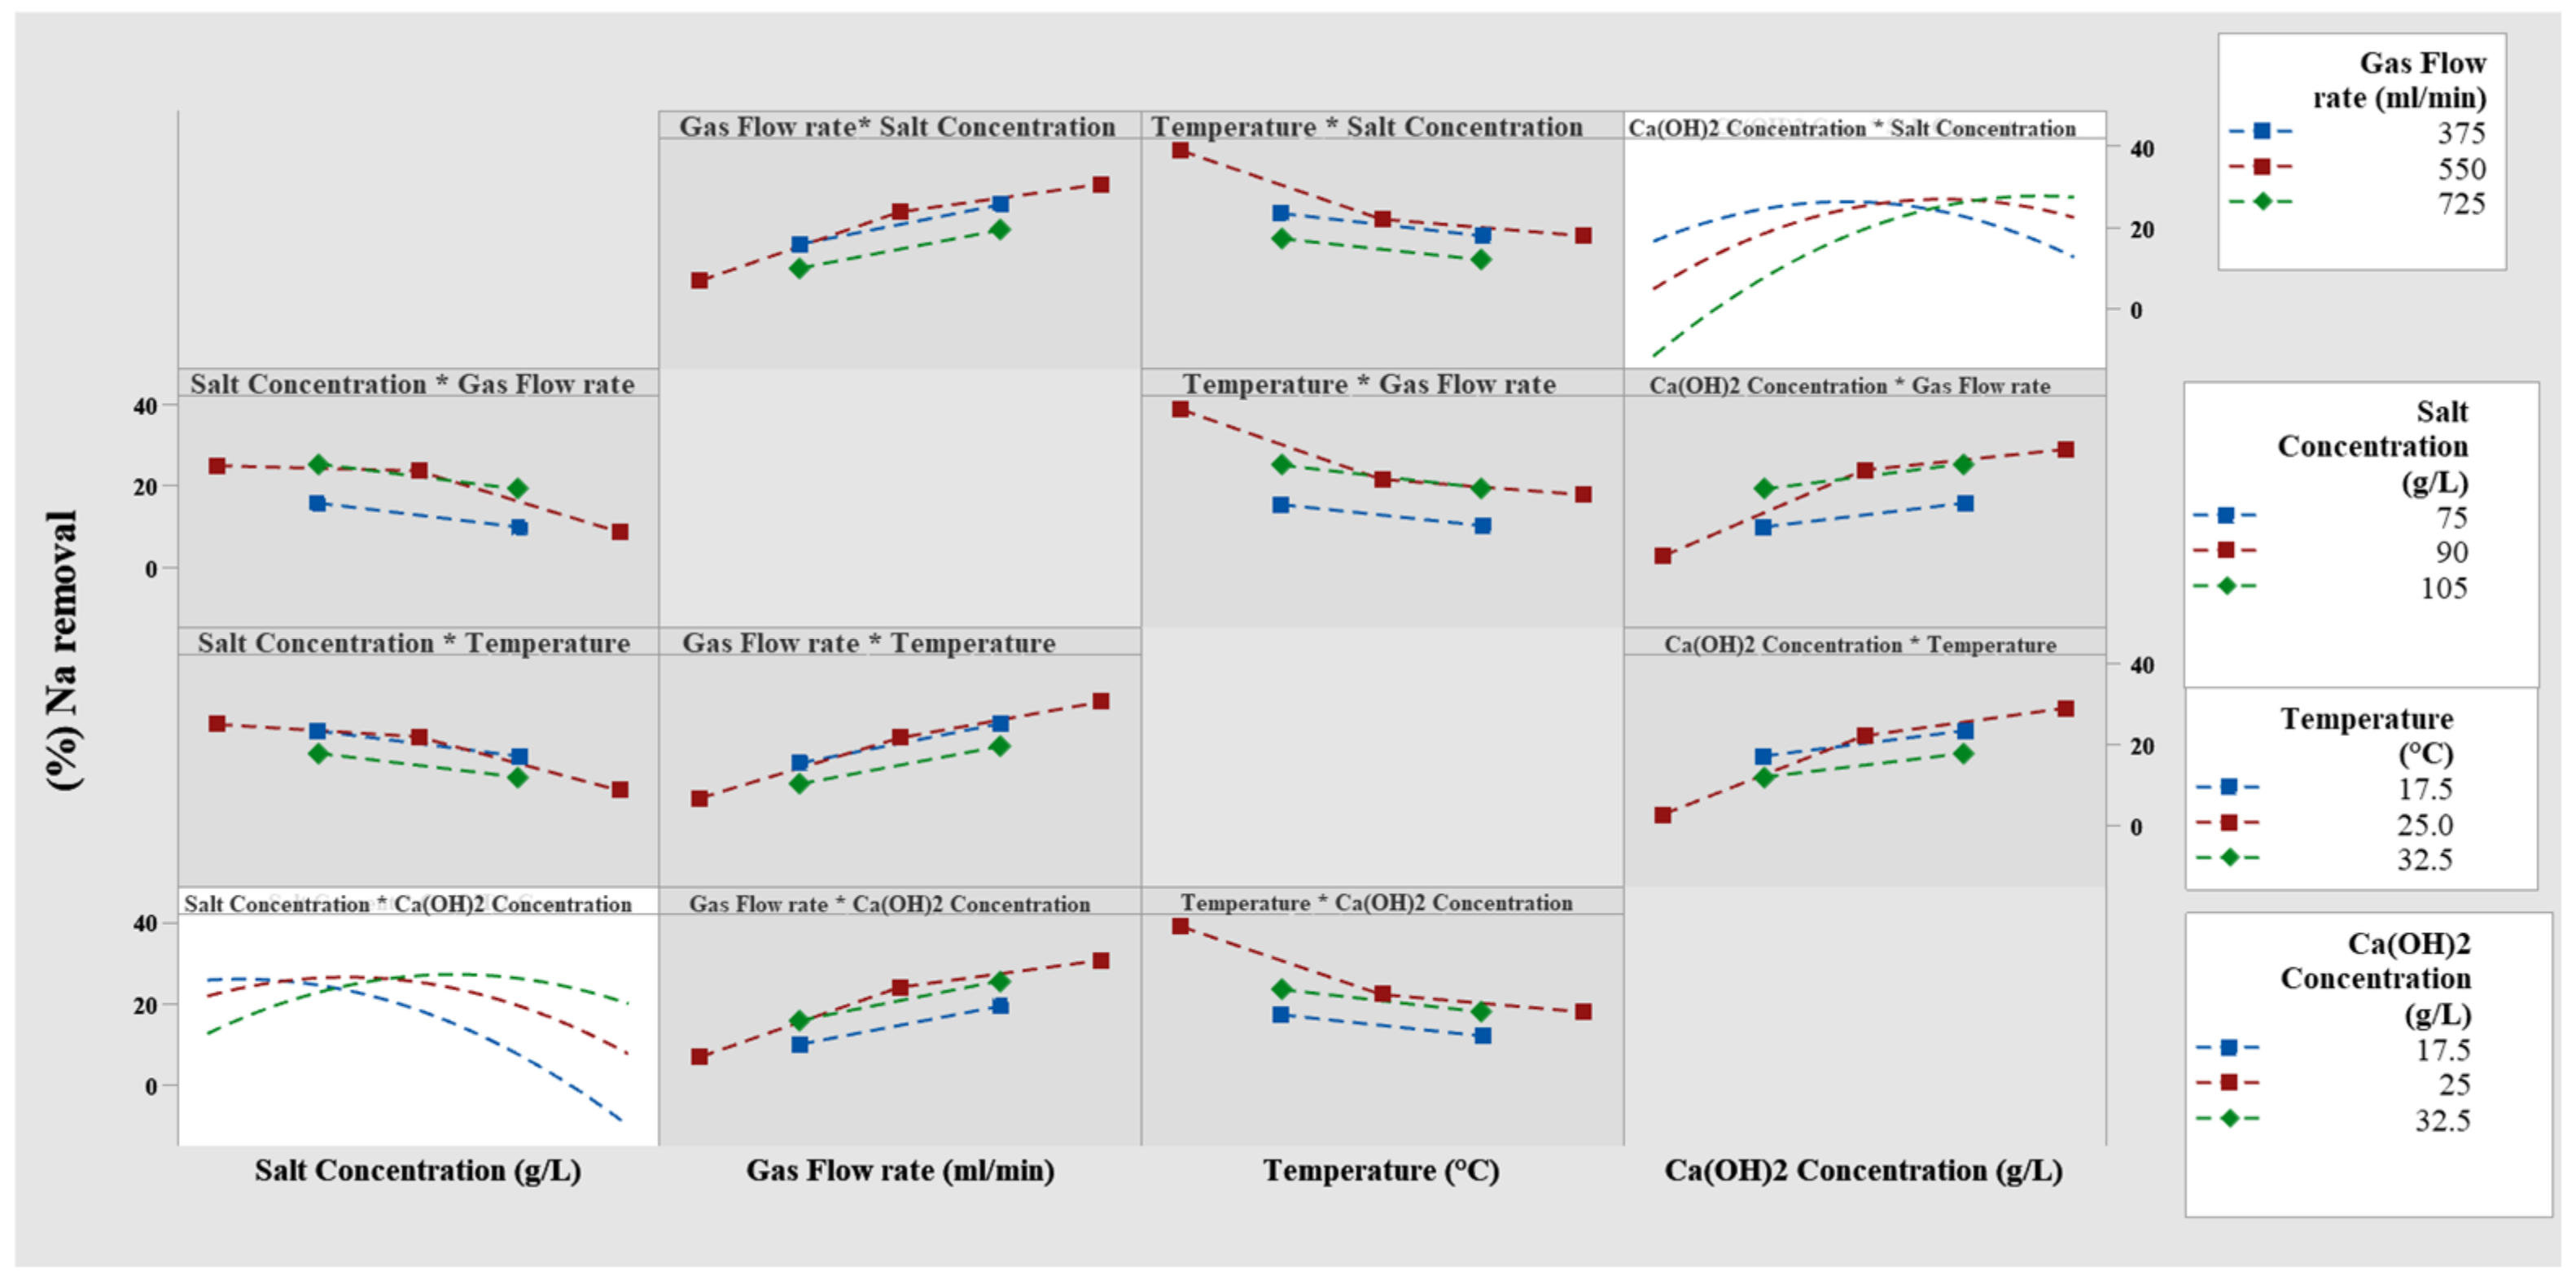
3.4. The Effect of Interaction between Factors in the Reaction

The interaction between factors affecting the reaction, including sodium chloride concentration, gas flow rate, temperature, and calcium hydroxide concentration, was shown by the interaction charts, two-dimensional contour, and three-dimensional response surface.

3.4.1. Investigation of the Charts of Interaction Effects between Factors

Figure 7 revealed the interaction between sodium chloride concentration, gas flow rate, temperature, and calcium hydroxide concentration. According to this figure, among the six charts, the chart that determines the interaction between the concentration of NaCl and Ca(OH)2 had the highest interaction effect on sodium removal rate (%). When the curves in each graph are parallel, the interaction effect on sodium removal rate (%) decreases. This effect is detectable in the variance table (Table 3) according to the p-value (p < 0.05).

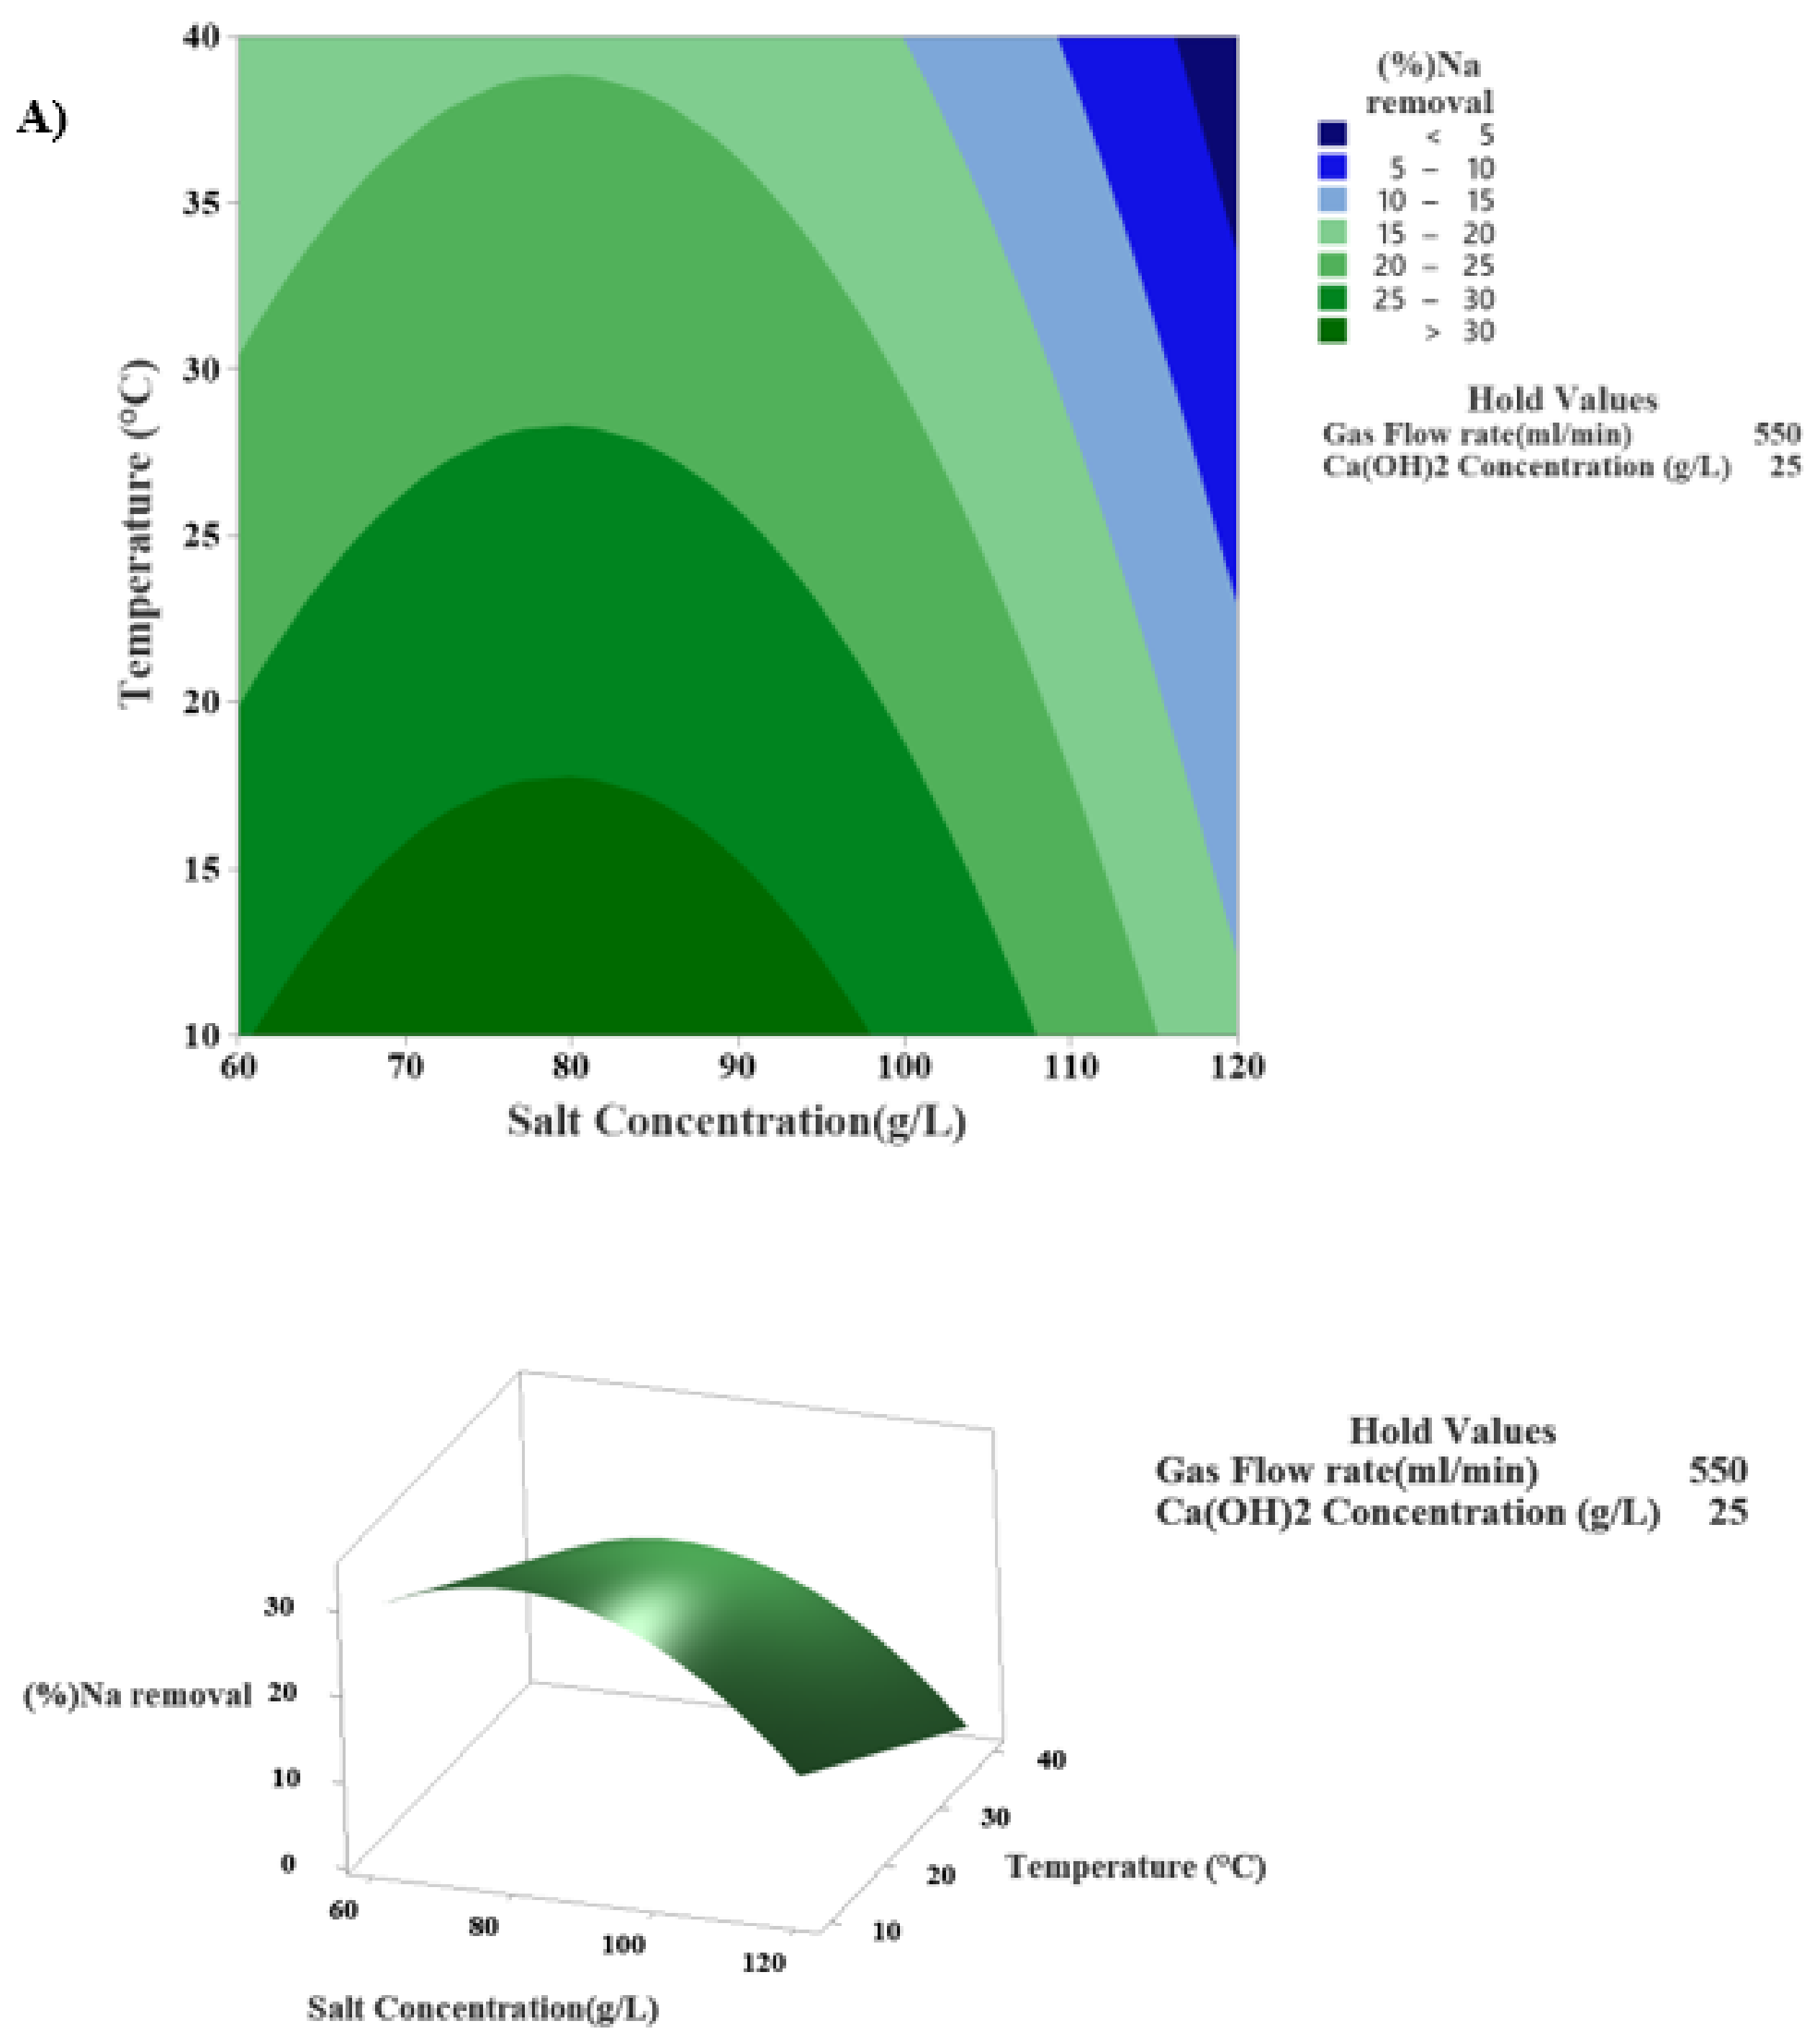
3.4.2. Investigation of the Interaction Effect of Temperature and Sodium Chloride Concentration in the Modified Solvay Process for Sodium Removal

As can be seen from the two-dimensional contour (Figure 8A), the constant gas flow rate of 550 mL/min and calcium hydroxide concentrations of 25 g/L could cause the highest sodium removal up to more than 30% marked in darker green in the chart. This area can be seen in the range of sodium chloride concentrations of slightly more than 60 and less than 100 g/L and temperatures from 10 to about 17 °C. A concentration of 120 g/L sodium salt and a temperature of 40 °C could result in the least sodium removal to less than 5% that was determined in dark blue. In summary, it can be concluded from the chart and the desired constant conditions that at 10 °C and a concentration of 80 g/L sodium chloride, desired sodium removal is possible. This result can also be seen in the three-dimensional chart of the response surface (Figure 8A).

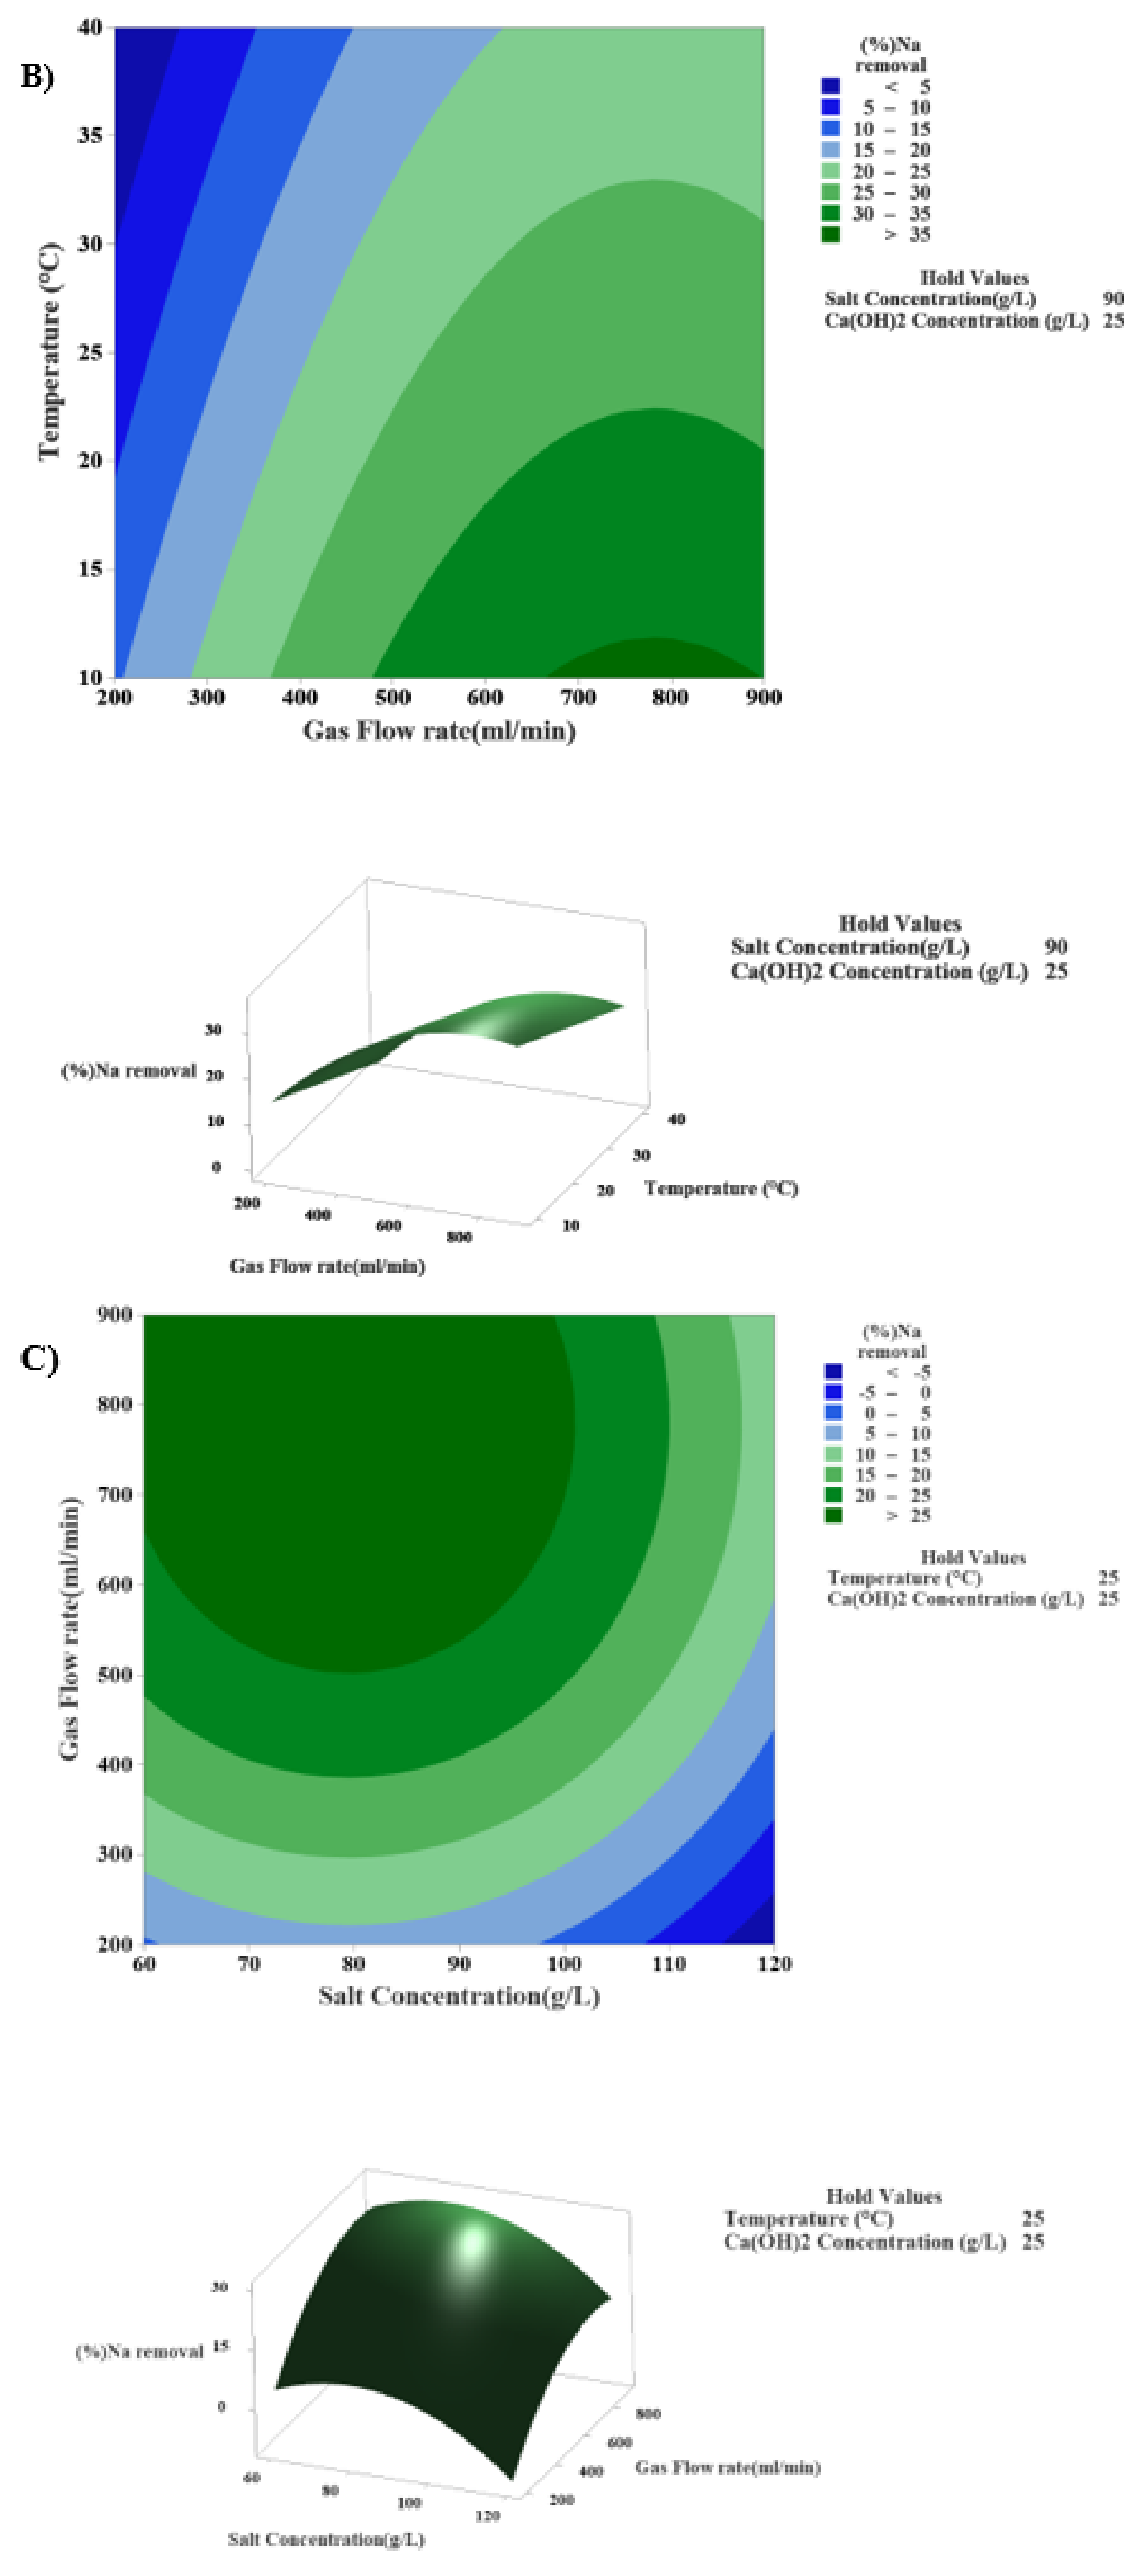
3.4.3. The Interaction Effects of Temperature and the Rate of Gas Flow in the Modified Solvay Process on Sodium Removal

The effects of gas flow rate and reaction temperature were shown in Figure 8B under constant conditions with a sodium chloride concentration of 90 g/L and a calcium hydroxide concentration of 25 g/L. According to the contour chart, sodium was removed 25 to 30% when the flow rate was between 700 and about 900 mL/min, and the temperature was 10–12 °C. The response surface chart showed that increasing the temperature decreased the sodium removal while increasing the gas flow rates from 200 to about 800 mL/min enhanced the sodium removal.

3.4.4. The Interaction Effect of Sodium Chloride Concentration and Gas Flow Rate in Modified Solvay Process on Sodium Removal

A contour chart illustrated the interaction between gas flow rate and sodium chloride concentrations during the reaction at constant temperature and calcium hydroxide concentration (Figure 8C). It was observed that in a constant amount of gas flow rate, by increasing the amount of sodium chloride salt concentration too much, the response will move in an unfavorable direction (less sodium removal). When sodium chloride concentration is constant, increasing the gas flow rate improves the conditions for further sodium removal. These effects can also be seen in the chart of the response surface.

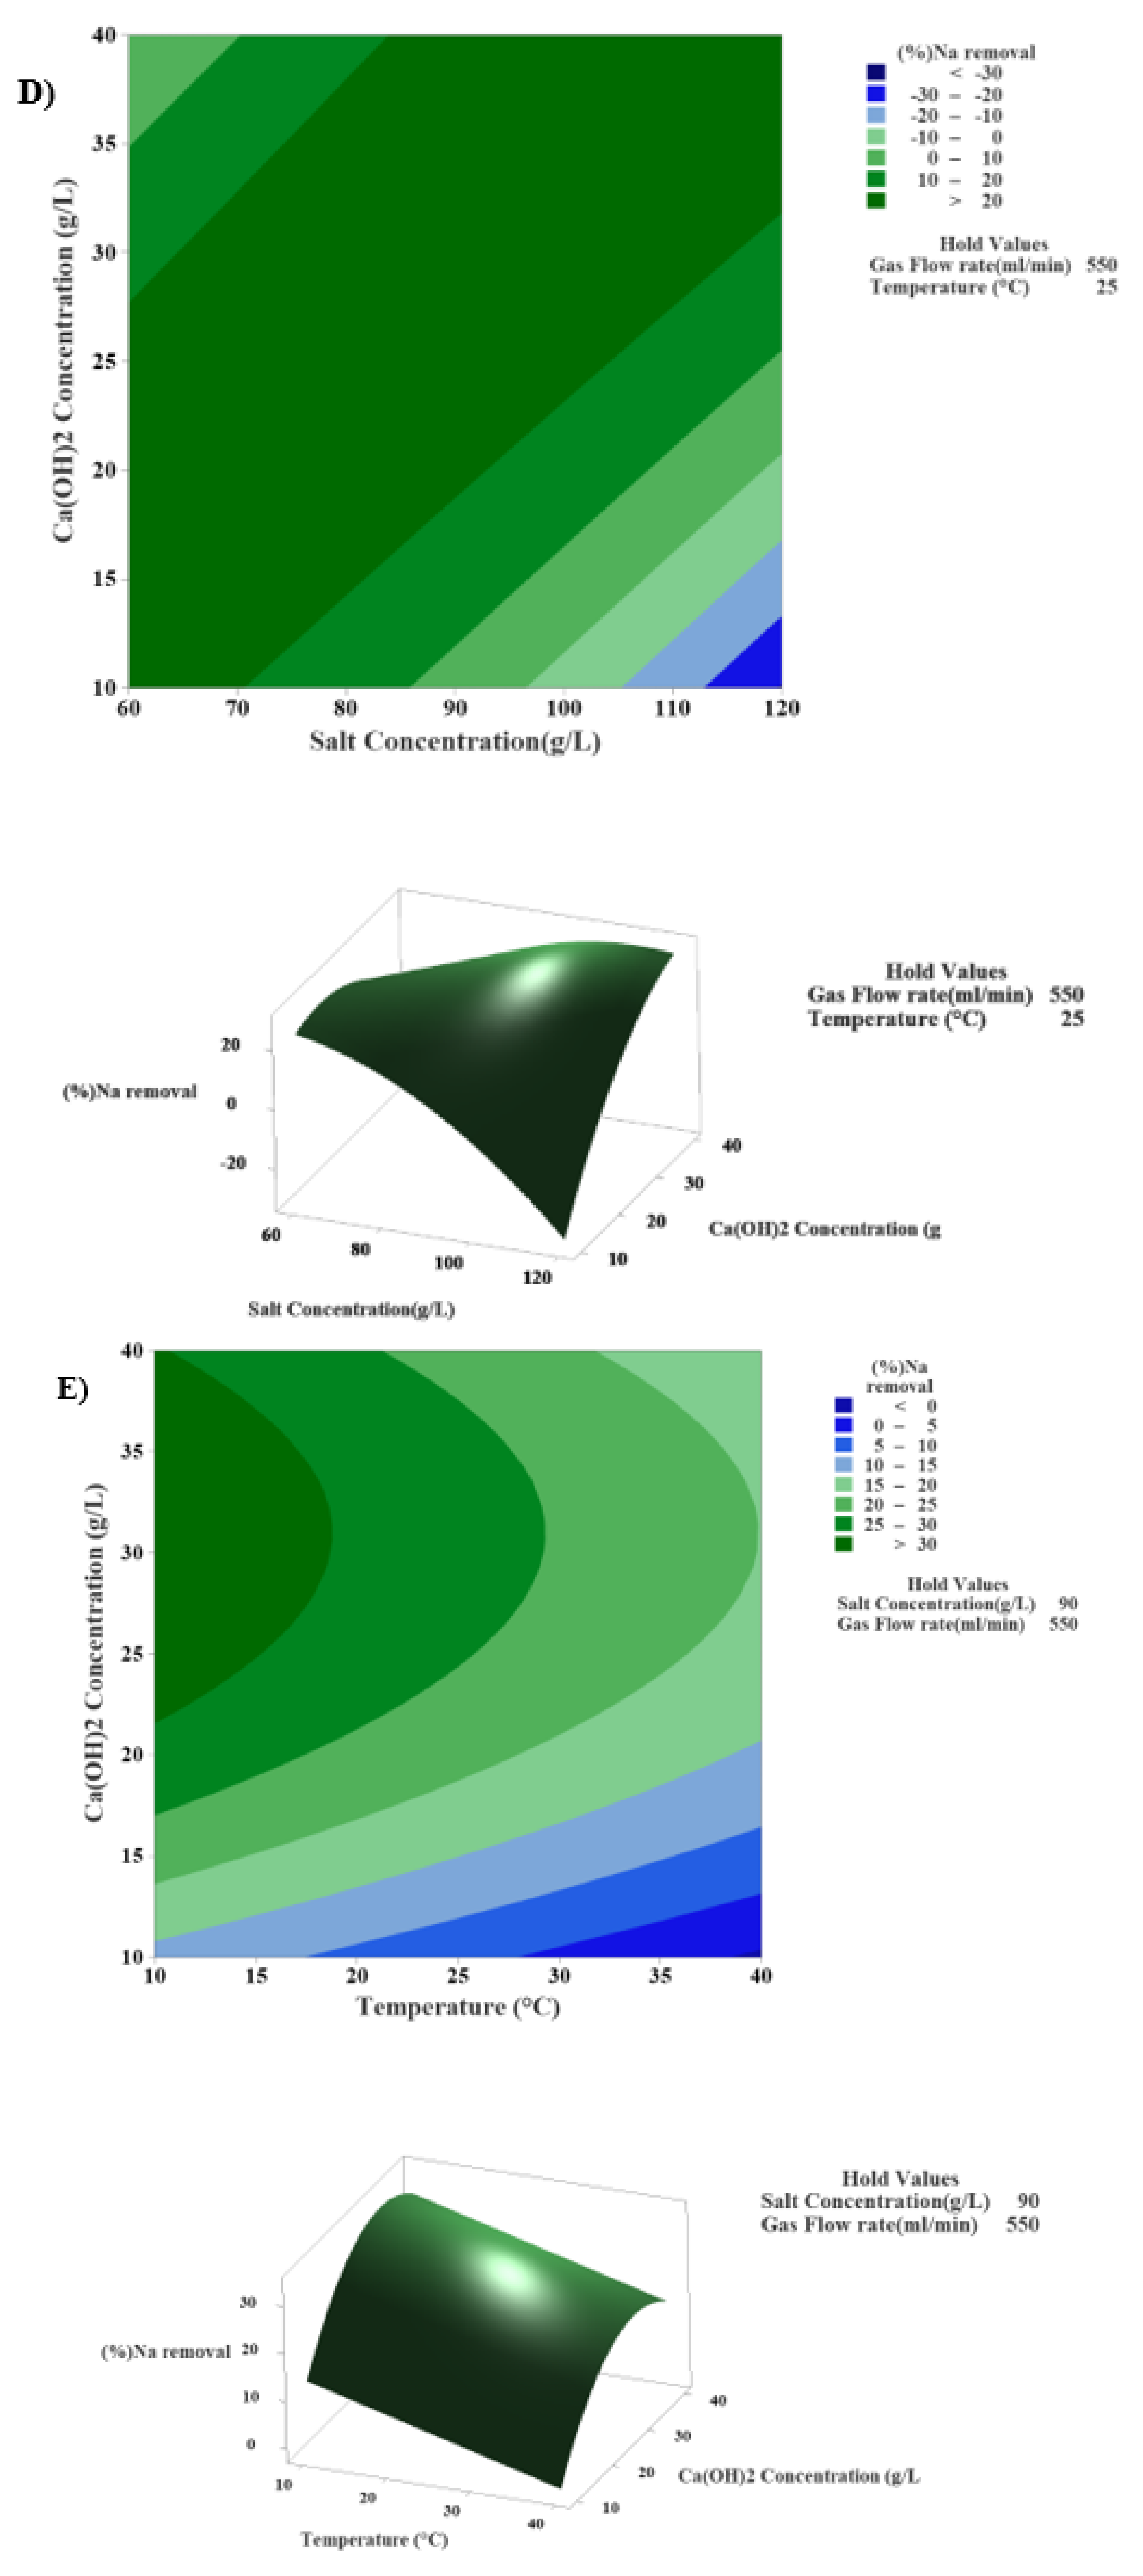
3.4.5. The Interaction Effect of Sodium Chloride and Calcium Hydroxide Concentrations in the Modified Solvay Process on Sodium Removal

From Figure 8D, it can be seen that appropriate ratios of sodium chloride concentration and calcium hydroxide concentration should be used so that their interaction points in the sodium removal range become more than 20% to achieve the desired response. As can be seen in Figure 8D, when the calcium hydroxide concentration was 10 g/L, and the sodium chloride concentration was 120 g/L, the least amount of sodium was removed.

3.4.6. The Interaction Effect of Calcium Hydroxide Concentration and Temperature in the Modified Solvay Process on Sodium Removal

According to Figure 8E, a temperature of 10–17 °C and a calcium hydroxide concentration of about 25 to 40 g/L can remove sodium by more than 30%. The two-dimensional and three-dimensional charts illustrated that at constant calcium hydroxide concentration with excessive temperature rise, conditions for sodium removal decrease. However, at constant temperatures, excessive reduction in calcium hydroxide concentration also leads to a reduction in sodium removal.

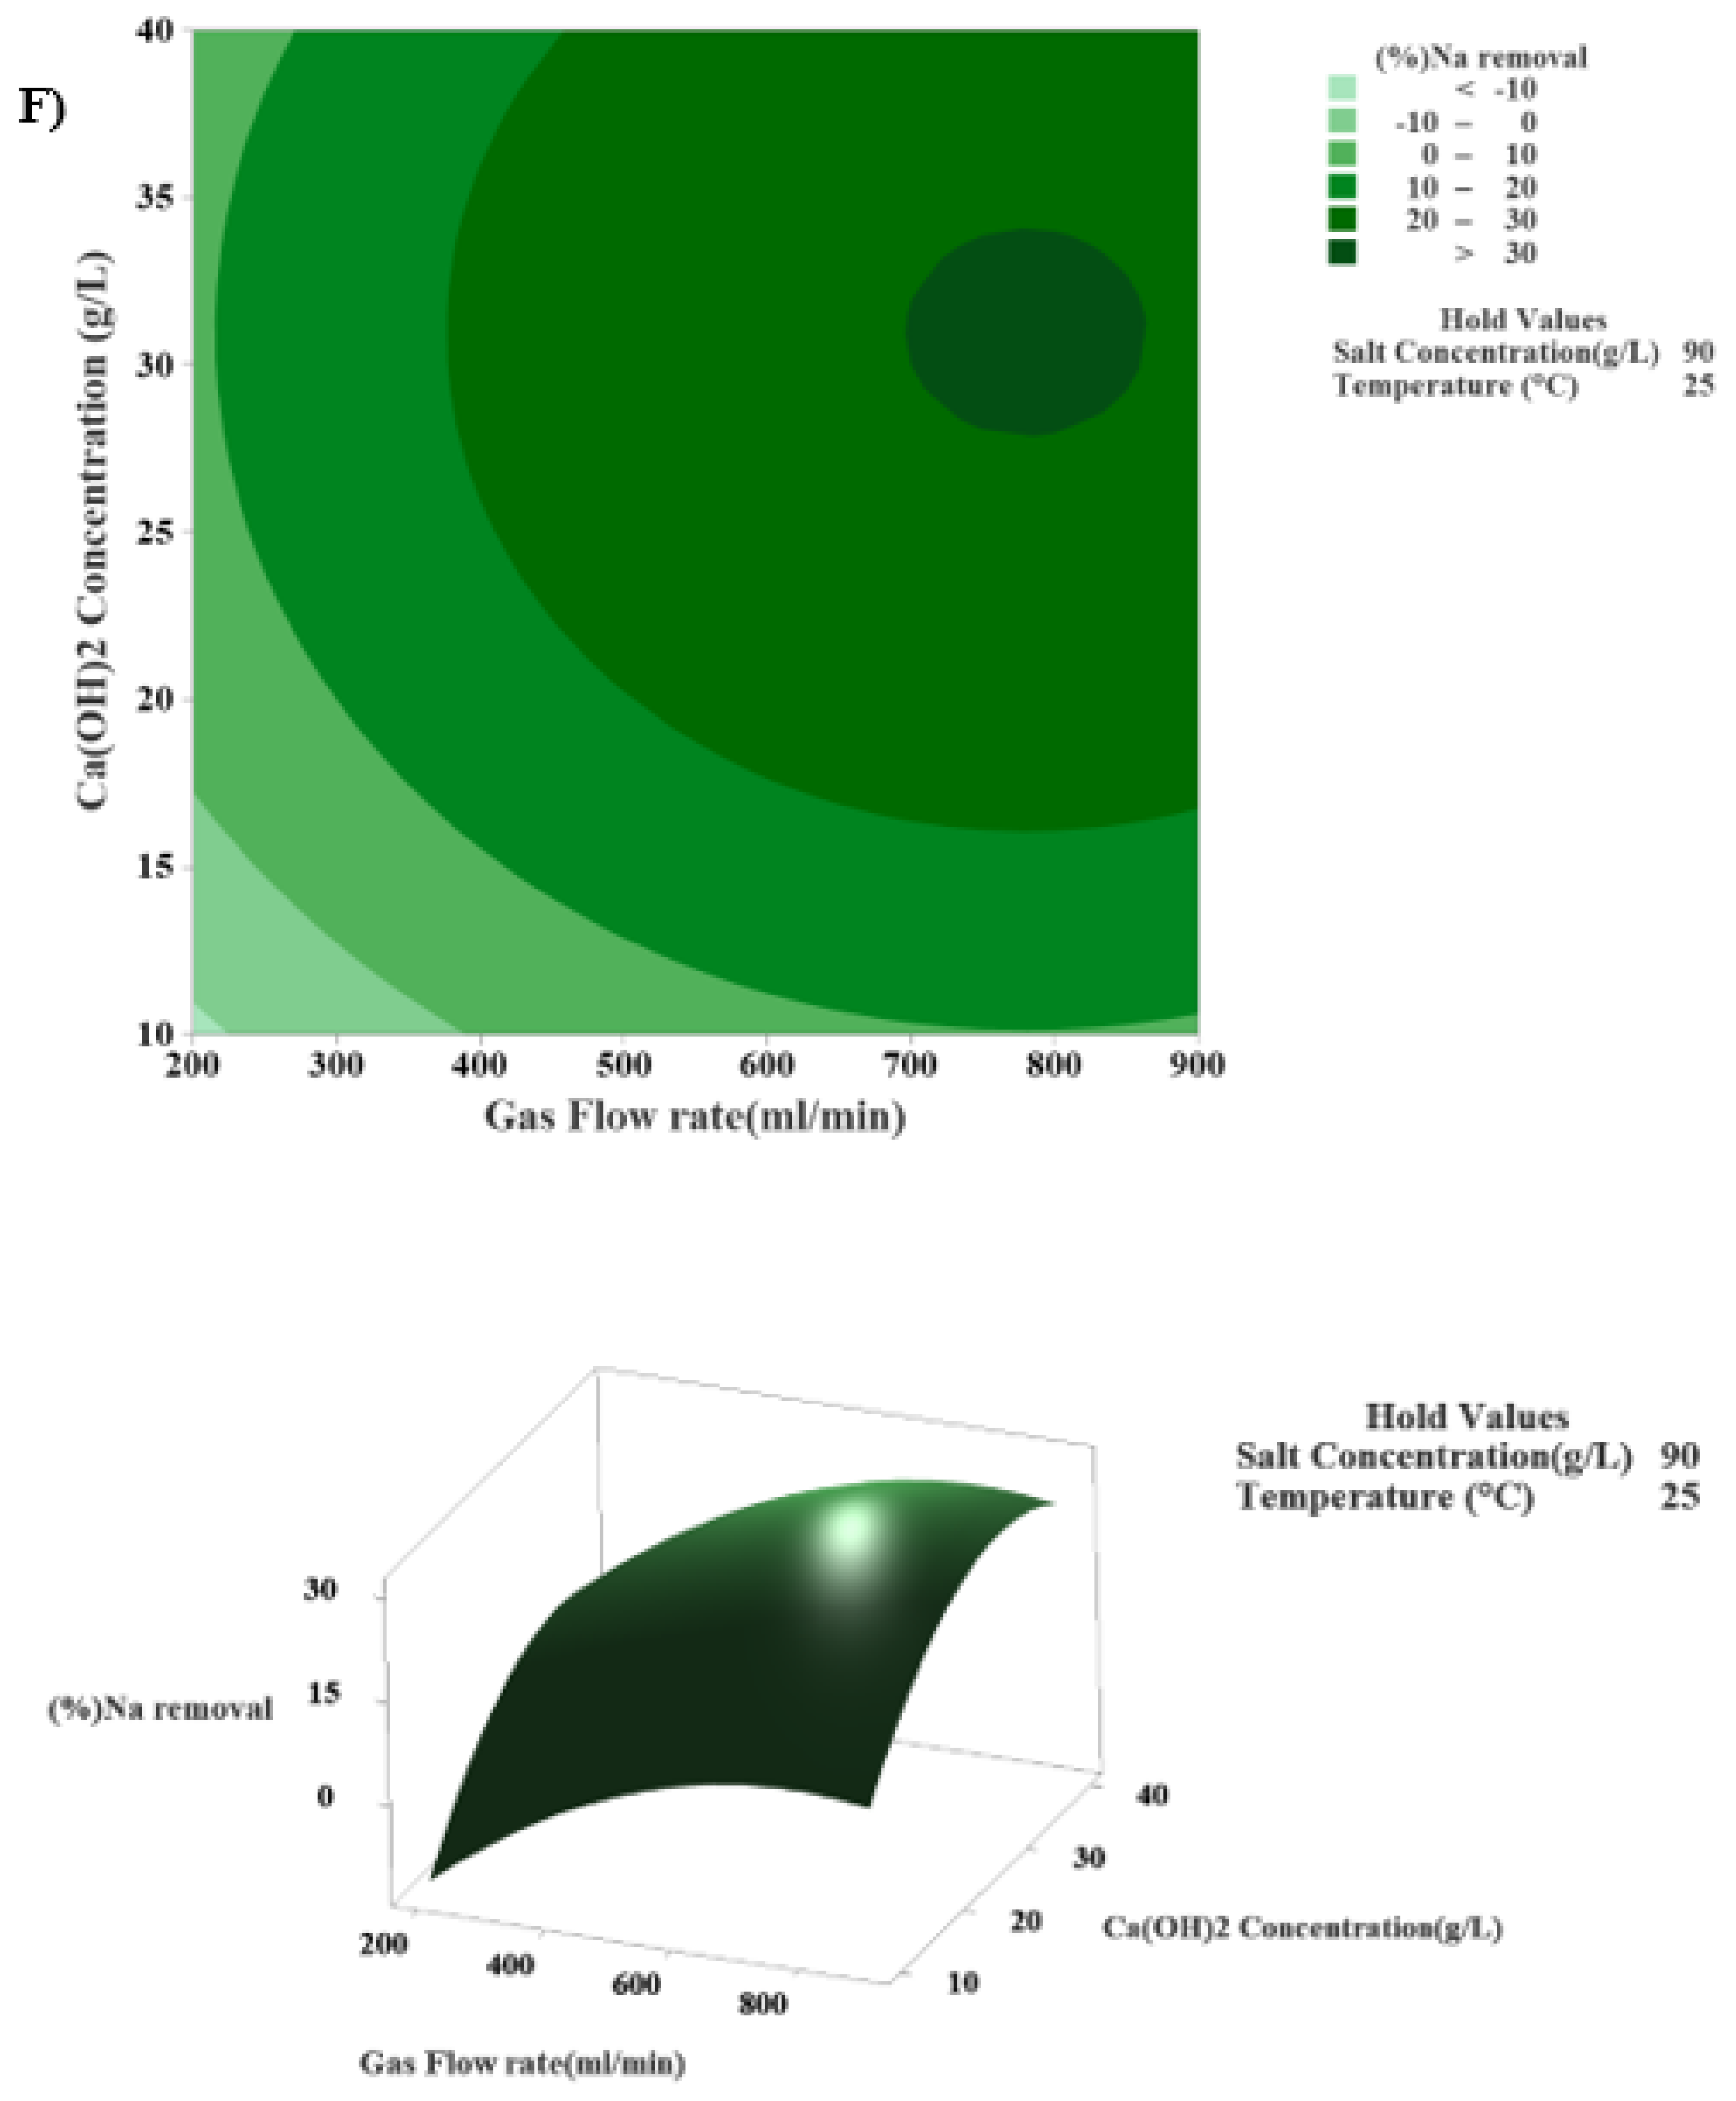
3.4.7. The Interaction Effect of Calcium Hydroxide Concentration and Gas Flow Rate in the Modified Solvay Process on Sodium Removal

Figure 8F shows the contour chart of the interaction between the gas flow rate and calcium hydroxide concentration factors at a constant sodium chloride concentration of 90 g/L and temperature of 25 °C. It was observed that at the constant condition of the rate of gas flow of about 800 mL·min−1 and a concentration of calcium hydroxide slightly higher than 30 g/L, the best results were obtained with a sodium removal of more than 30%. These results can also be seen in the 3D response surface chart.

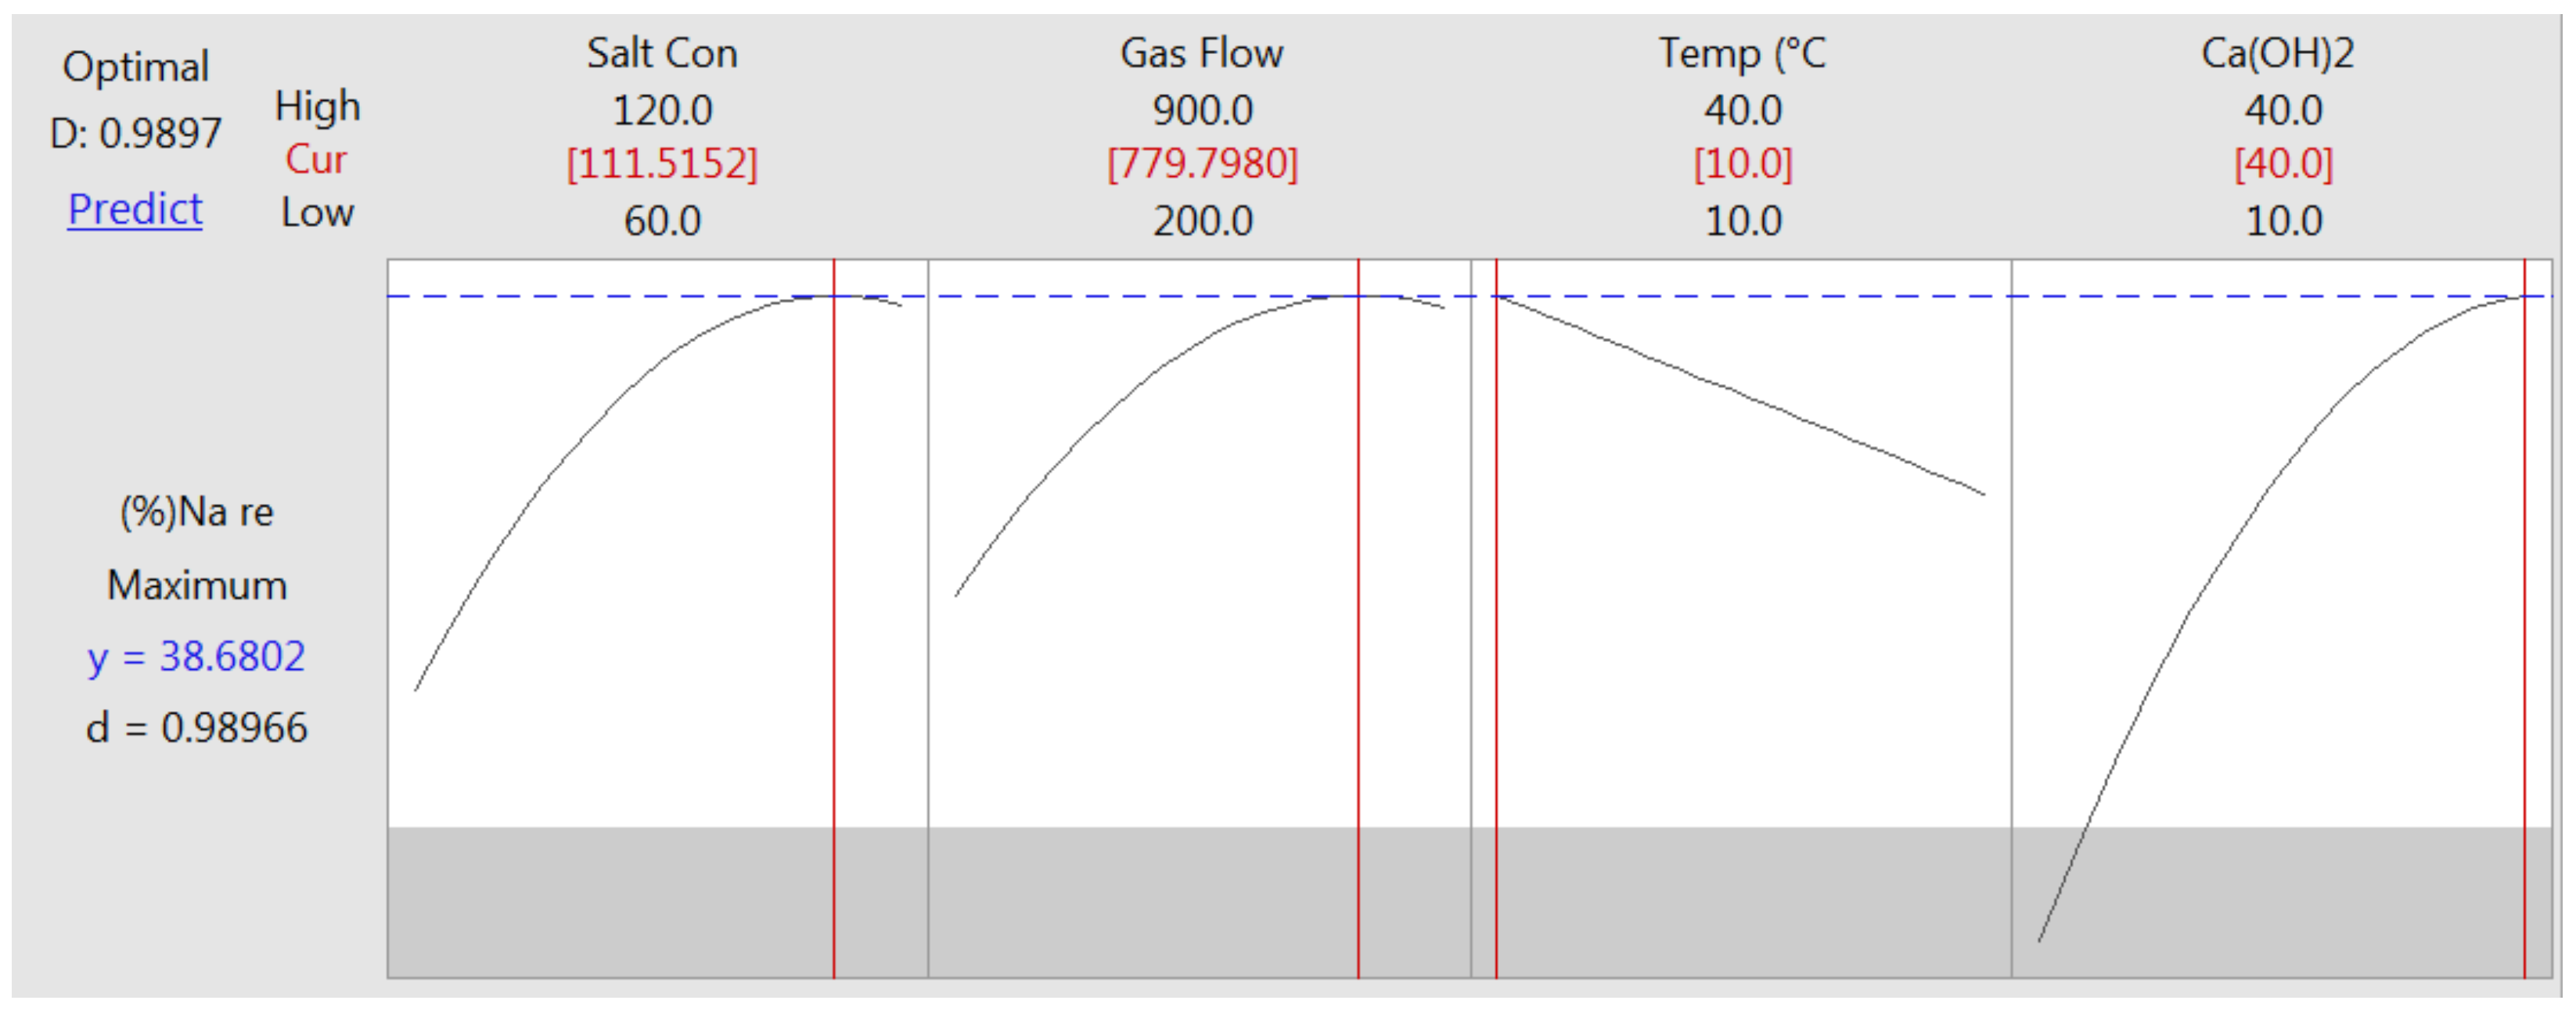
3.5. Determining the Optimal Conditions for More Effective Removal of Sodium

According to Figure 9, the conditions proposed by the software to achieve the most efficient conditions for the removal of sodium by 38.68% were determined using calcium hydroxide concentration of 40 g/L, a sodium chloride concentration of 111.5152 g/L, an operating temperature of 10 °C, and a rate of gas flow of 779.798 mL·min−1. Notably, according to the contour and response surface charts (Figure 8D) and the correlation between the values of calcium hydroxide and sodium chloride concentrations, the optimal value of each factor is determined based on the value used by the other. Using the optimal values specified in Figure 9, the optimal ratio of sodium chloride to calcium hydroxide concentration was approximately 2.79.

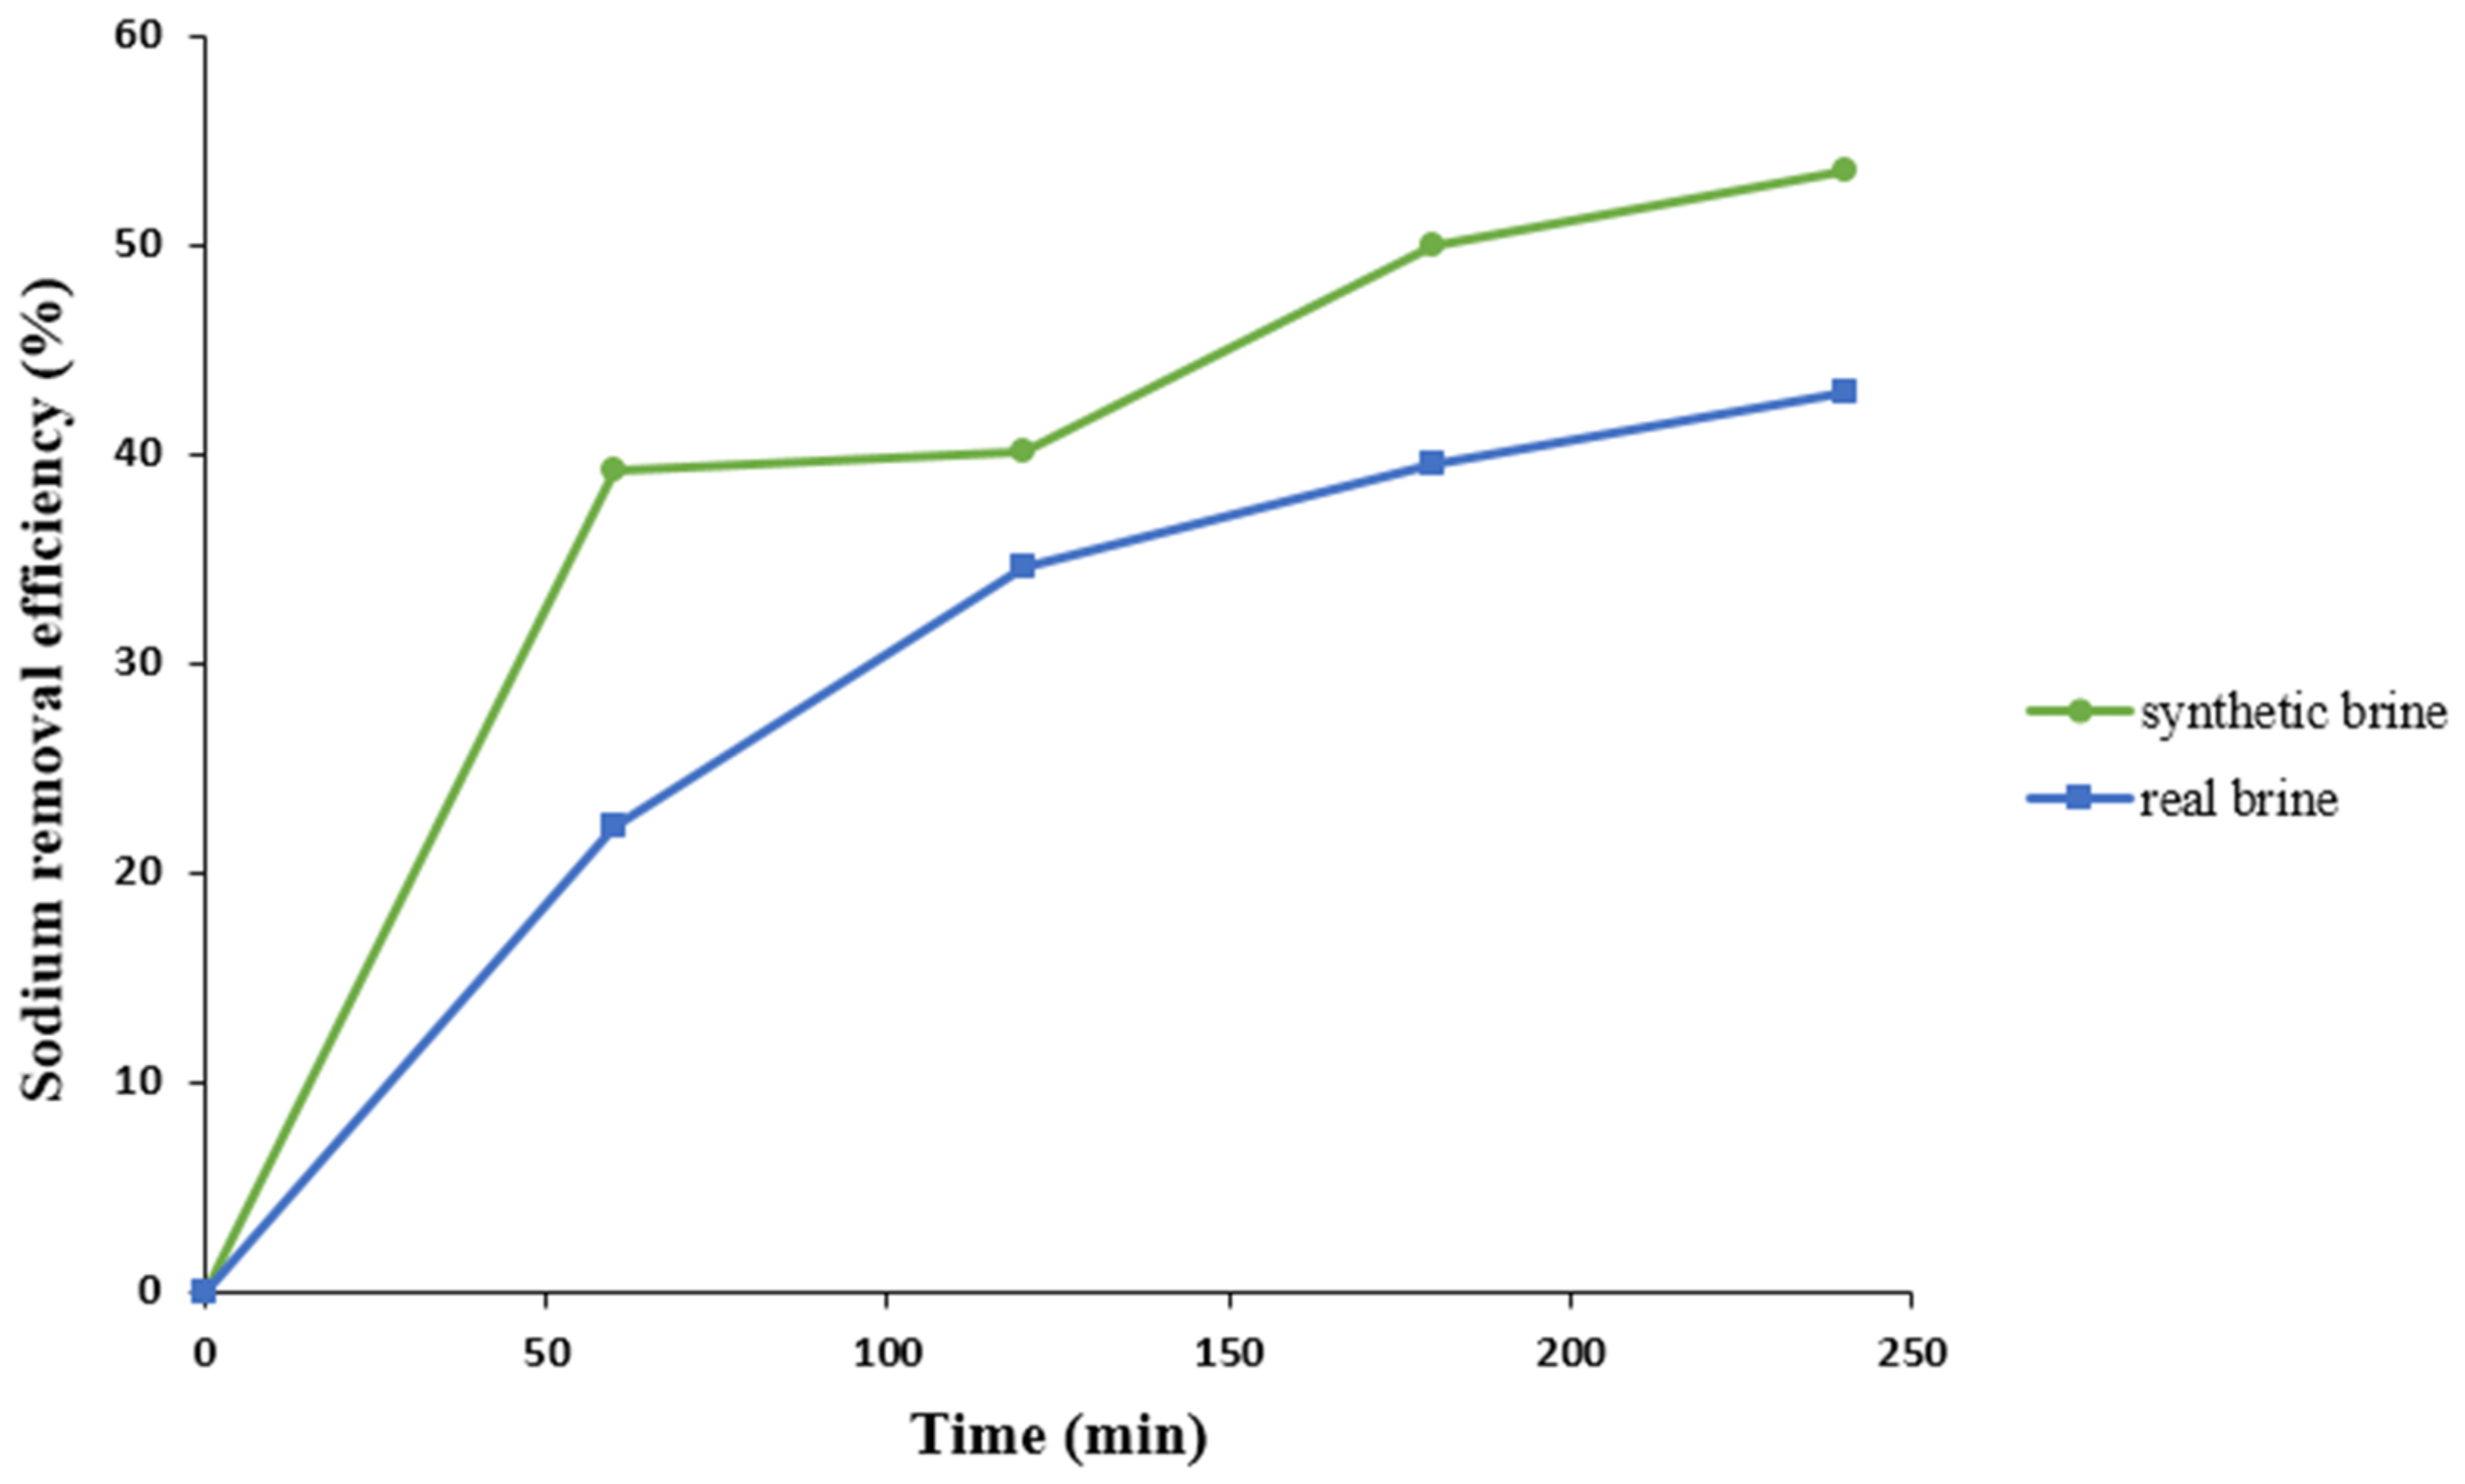
3.5.1. Sodium Removal Efficiency in Synthetic Brine under Optimum Operating Conditions

Figure 10 illustrates the sodium removal efficiency (green line) under optimum conditions with a sodium chloride concentration of 111.5151 g/L, calcium hydroxide concentration of 40 g/L, temperature of 10 °C, and gas flow rate of 779.798 mL/min during the reaction time of 4 h. According to the maximum sodium removal predicted by the software, this efficiency should be 39%, but with increasing accuracy and the number of experiments ran under optimal conditions, the sodium removal efficiency was 53.51%.

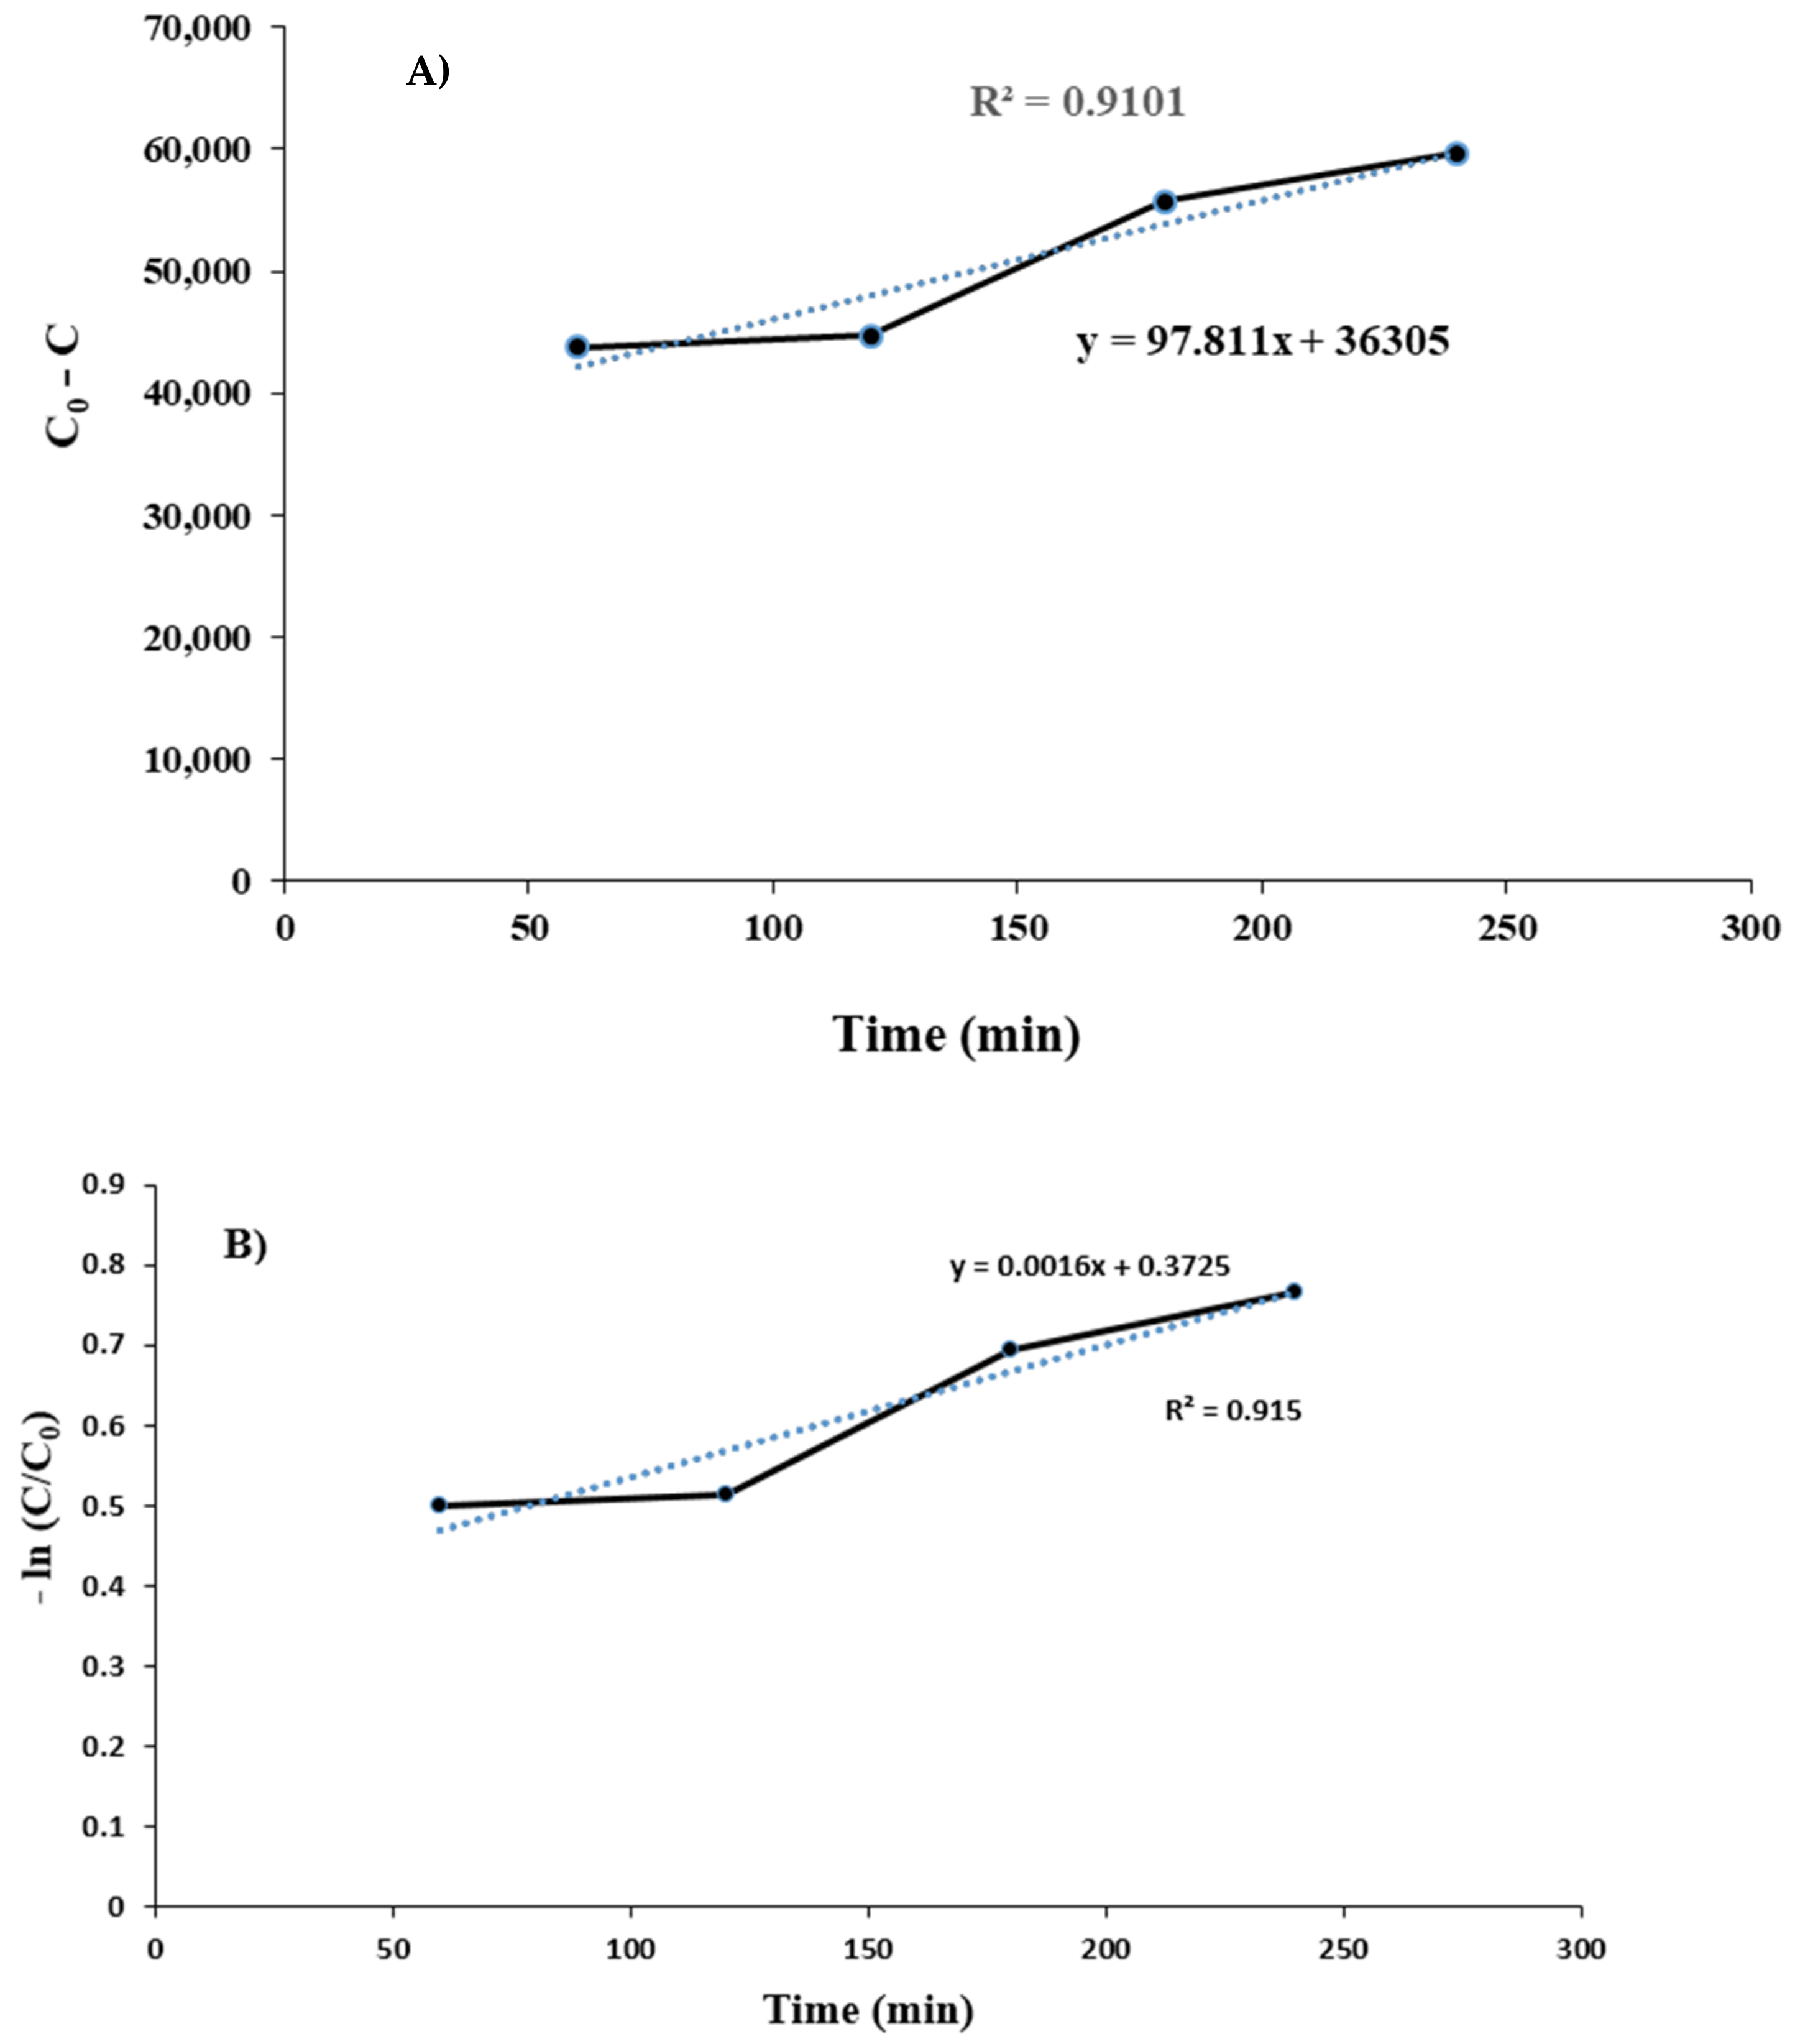
Investigation of Process Kinetics in the Presence of Synthetic Brine under Optimal Conditions

To determine the reaction order and the sodium removal rate from the synthetic brine, the heterogeneous modified Solvay process based on calcium hydroxide was studied under optimal conditions at different reaction times. As can be seen from Table 5, the zero, first, and second-order kinetics were used to describe the data.
The coefficient of determination (R2) for kinetic models of zero, first and second orders were 0.9101, 0.915, and 0.9141, respectively. The results of removal kinetics in the modified Solvay process have been shown in Figure 11A–C. As can be seen, the results are presented in Table 6.

3.5.2. Sodium Removal Efficiency in Real Brine during Optimal Operating Conditions

Figure 10 shows the sodium removal efficiency (blue line) in the desalination reject brine under optimal conditions with a concentration of sodium chloride of 63 g/L, the concentration of calcium hydroxide of 22.6 g/L (according to the optimal ratio determined), the temperature of 10 °C and the gas flow rate of 779.798 mL/min during the modified Solvay process. In this figure, only 43% of sodium concentration was removed. This phenomenon can be attributed to the presence of impurities in real brine. By preventing mass transfer, these impurities will inhibit the effective capturing of carbon dioxide, resulting in less precipitation of sodium bicarbonate and eventually removing less sodium. However, this amount of optimum sodium removal is higher than the amount of removal performed by Muftah et al. (29% and 35% for the ammonia-based Solvay process and the calcium oxide-based Solvay process, respectively) [24].

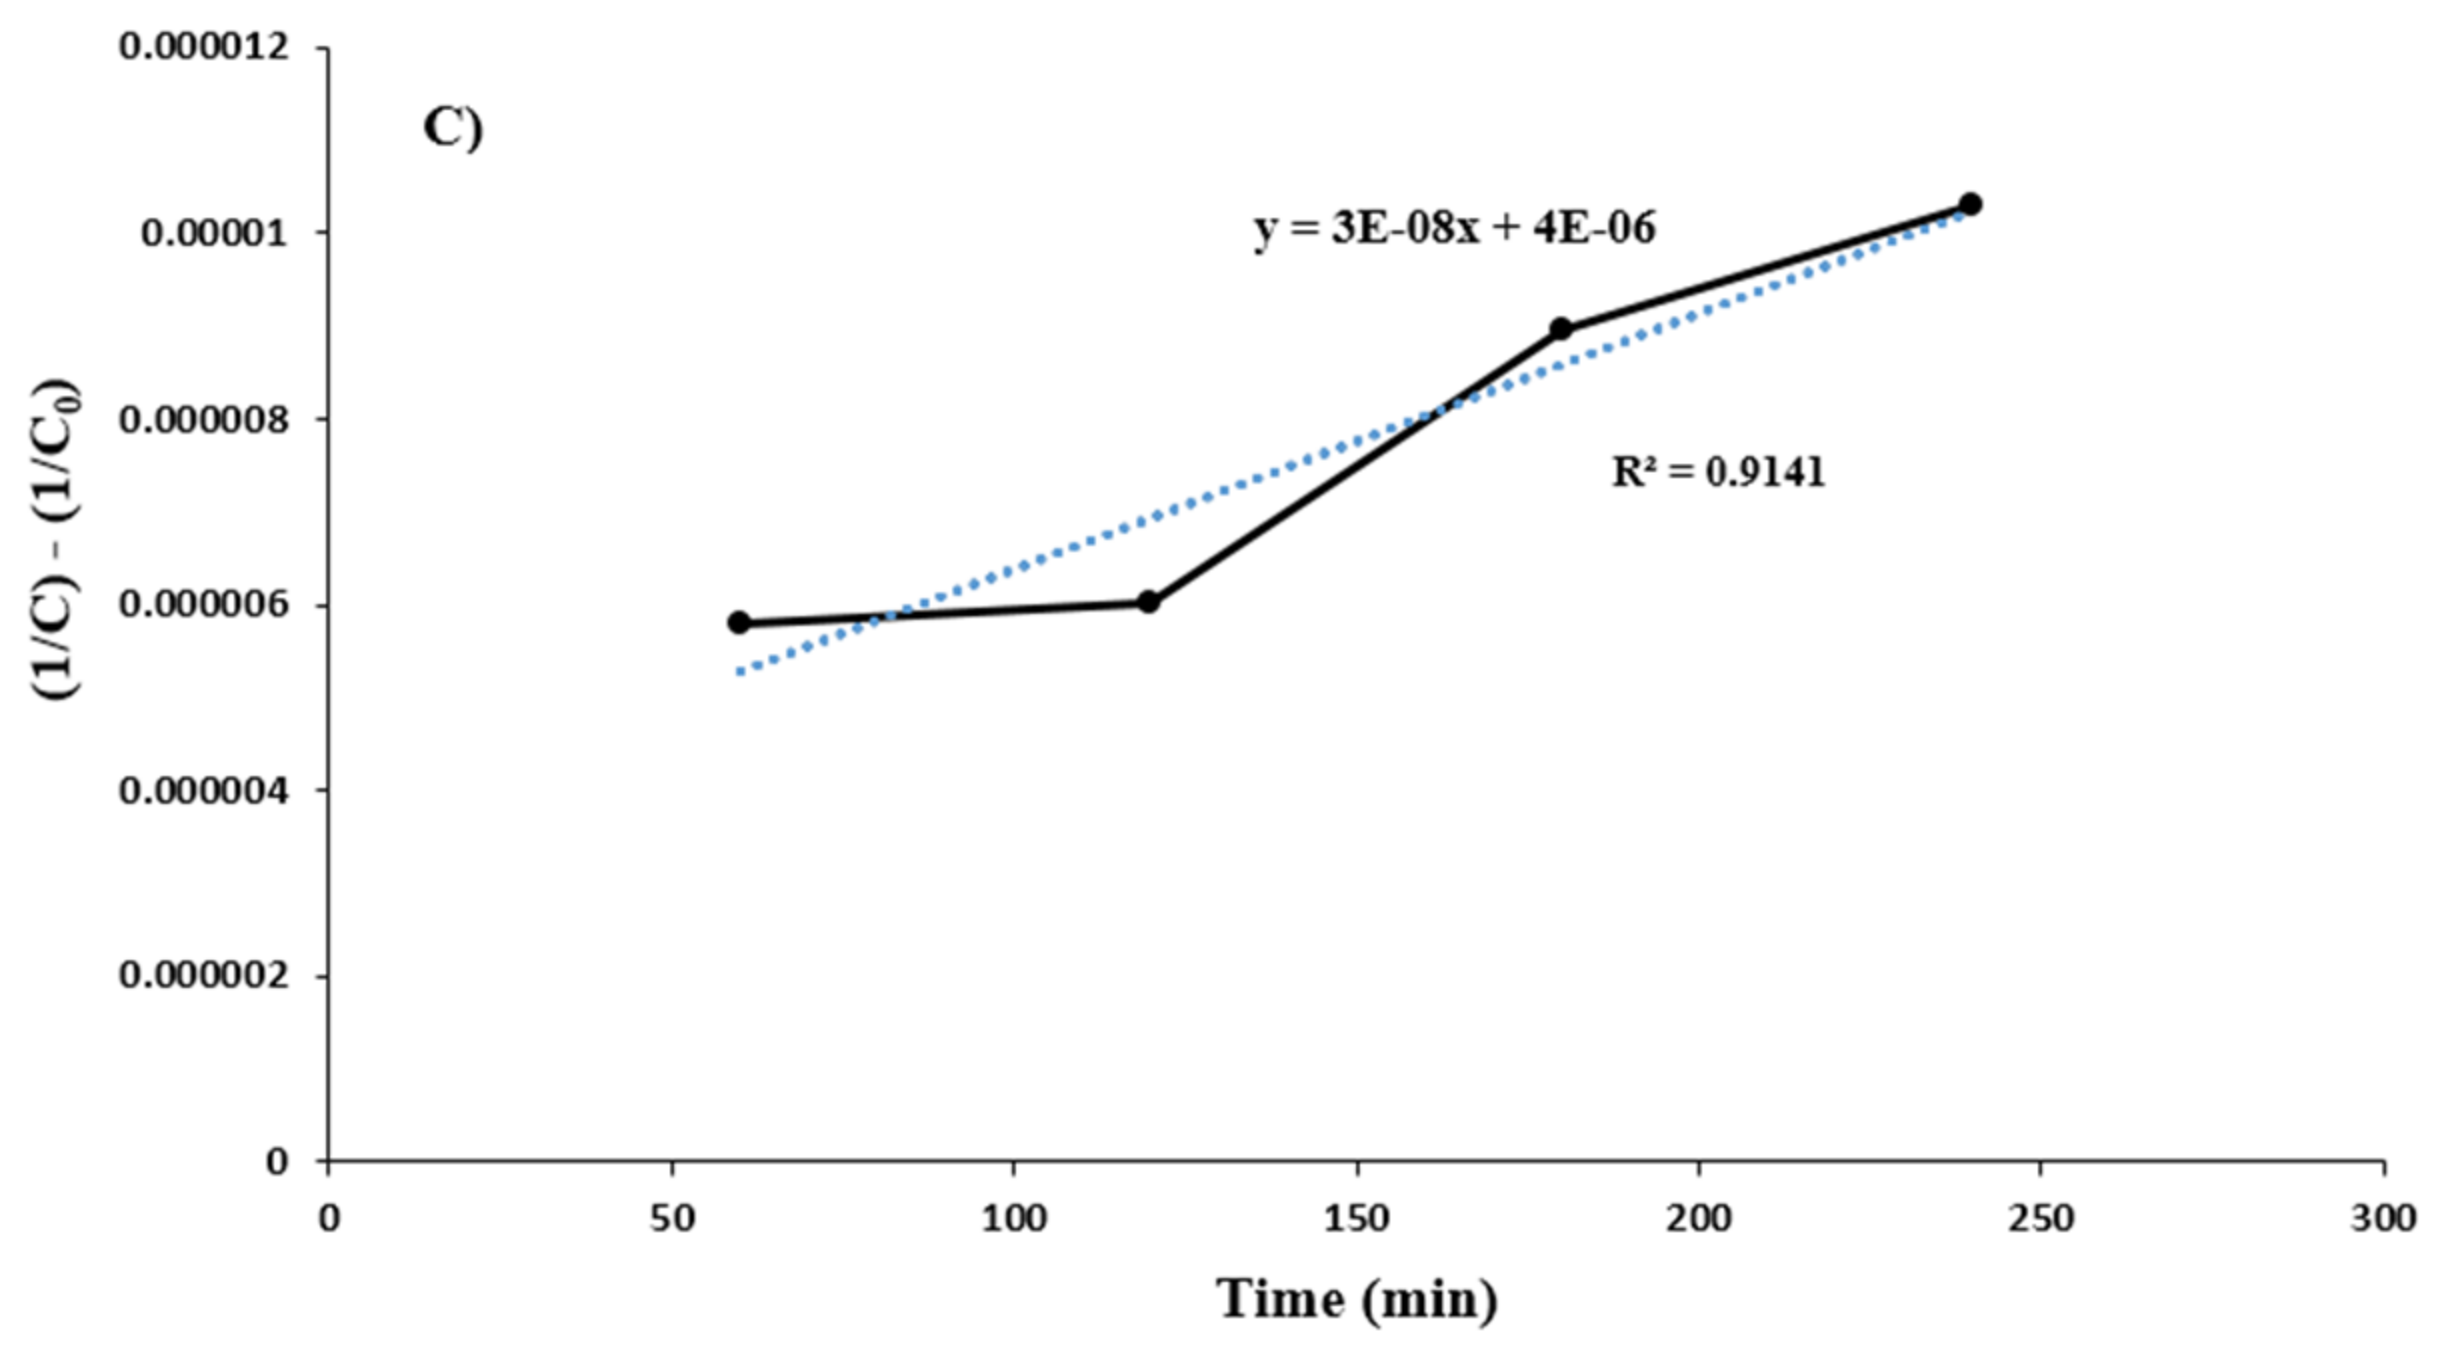
Investigation of Process Kinetics in the Presence of Real Brine under Optimal Conditions

The kinetics of the modified Solvay process for real brine rejected from the desalination plant with an initial concentration of 63 g/L of brine under optimal conditions during the reaction time of 4 h was evaluated. The kinetics of first, second, and third orders were determined according to Figure 12A–C, respectively. As (1/C0) − (1/C) was linearly related to time and had a high linear correlation to time changes, it can be concluded that the desired reaction follows a second kinetic model. The general results are summarized in Table 7.

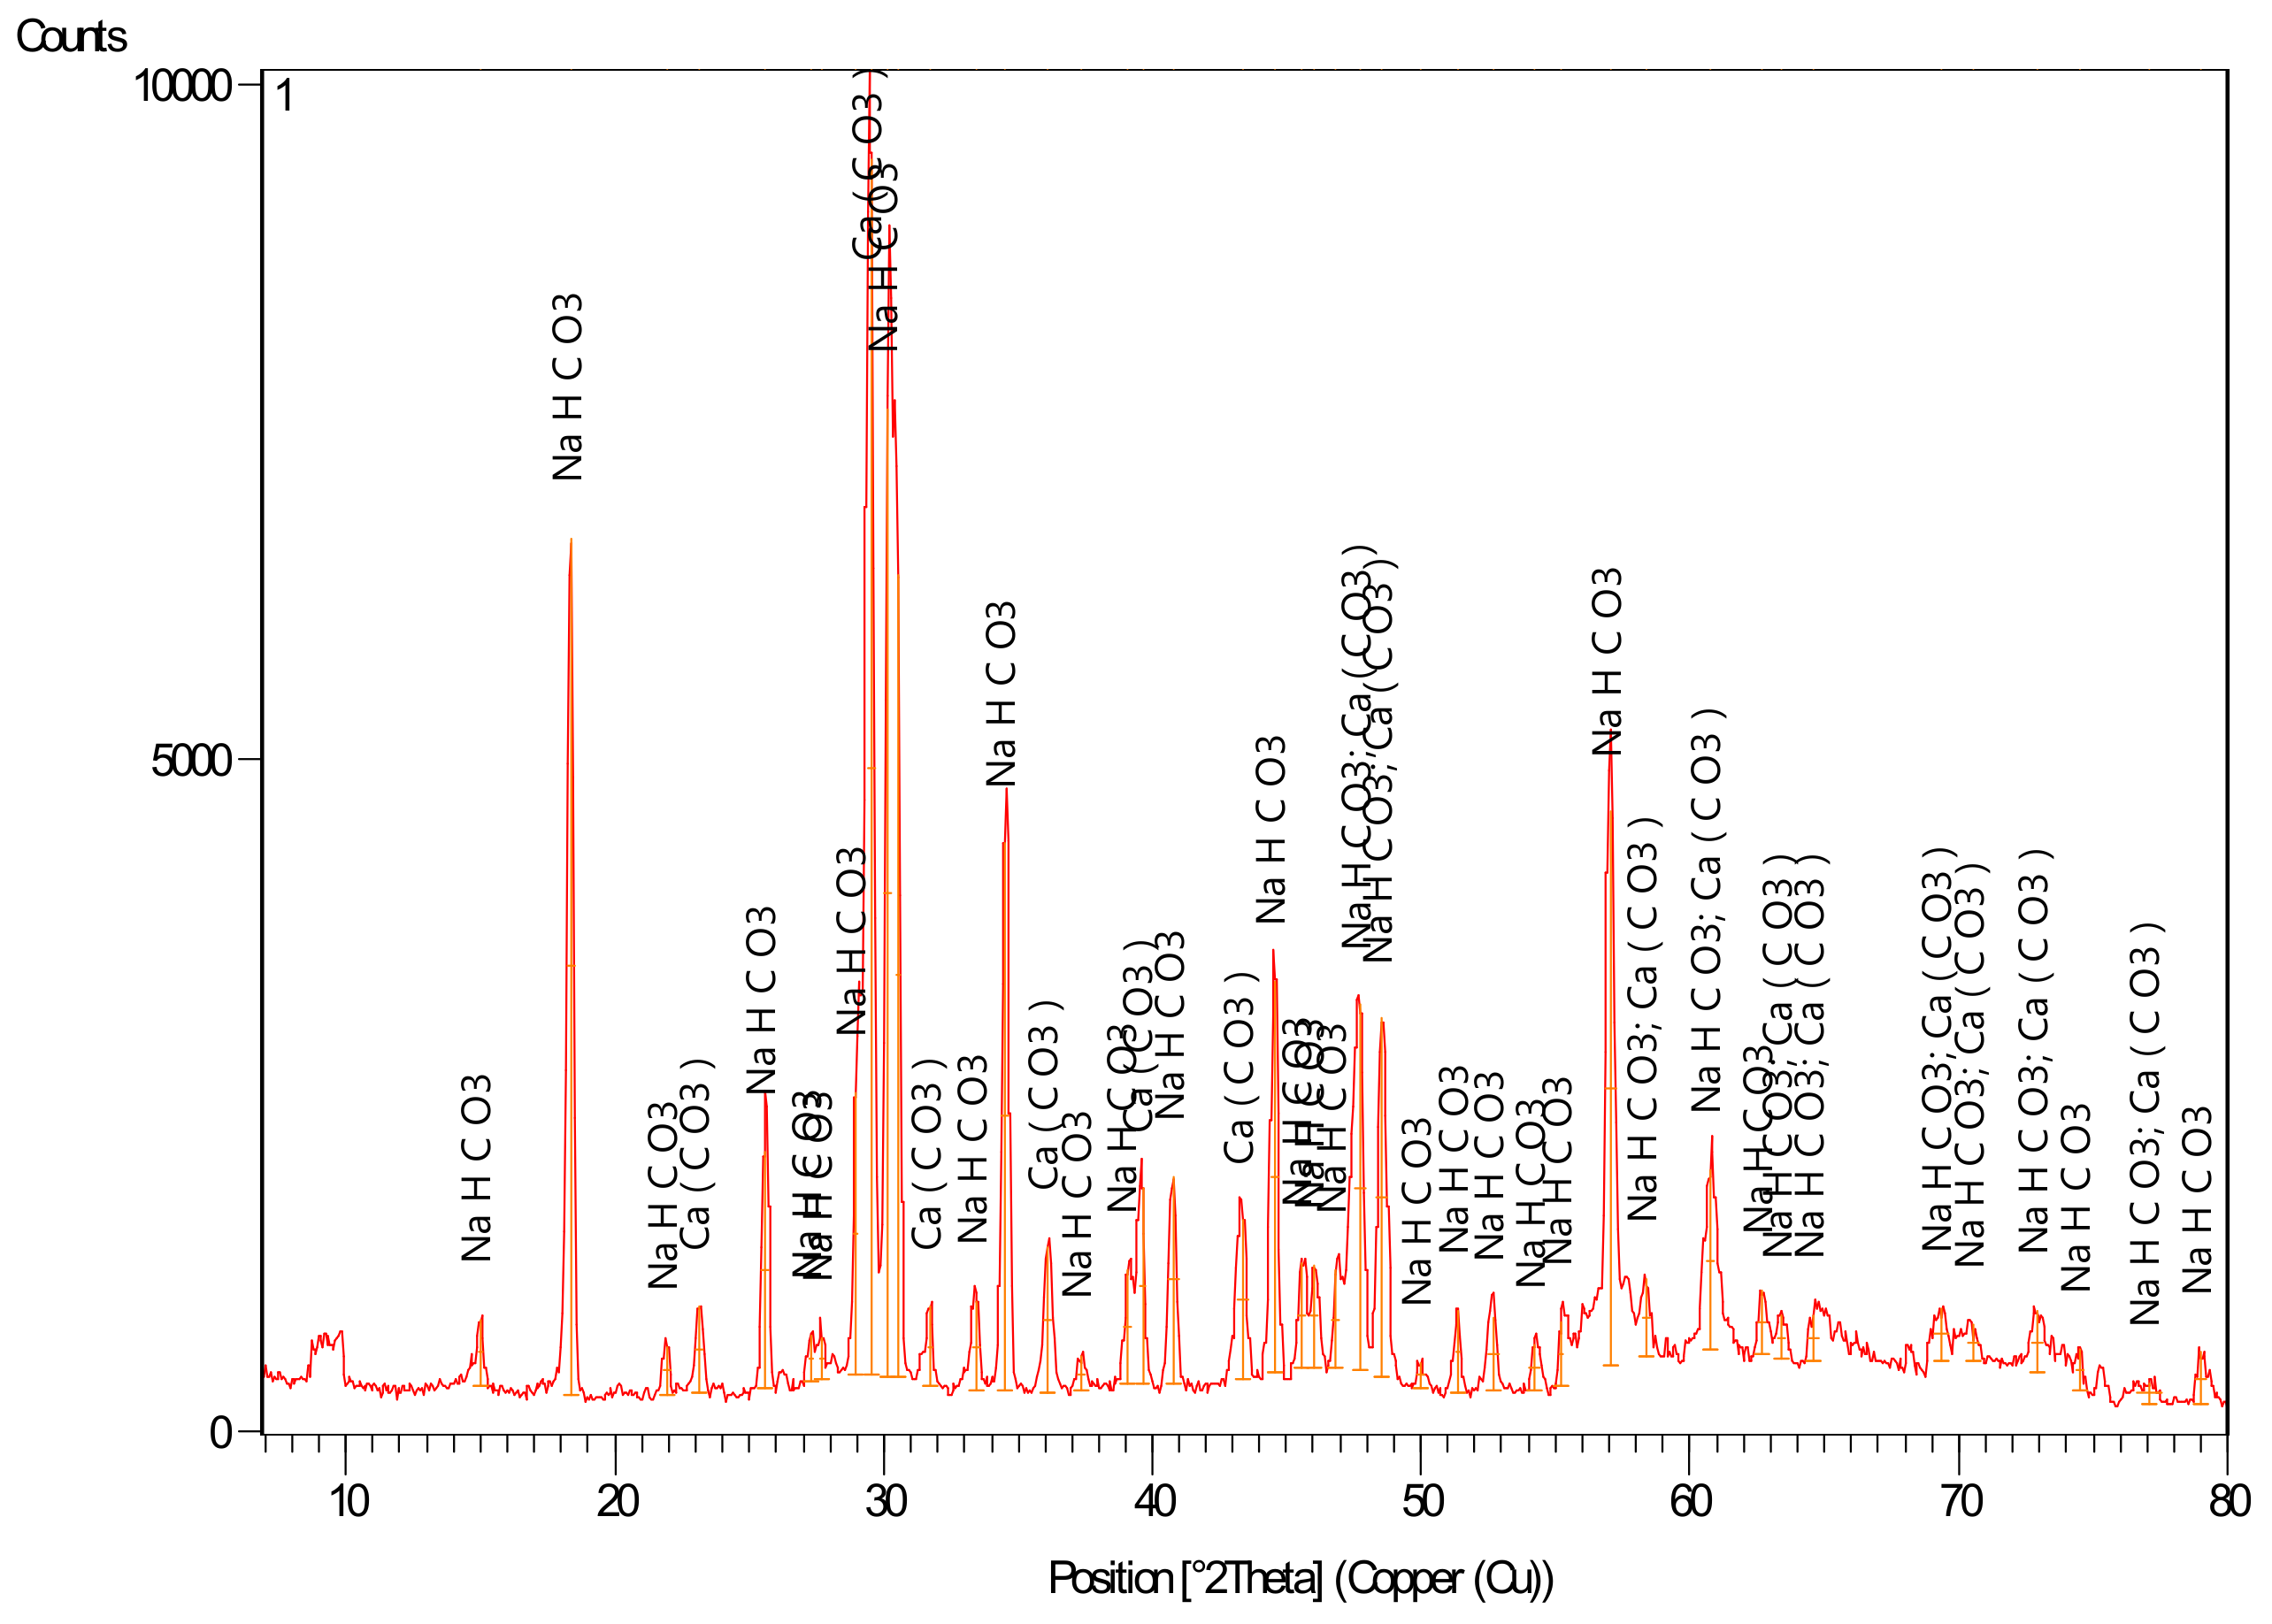
3.6. Production of Solid Sodium Bicarbonate

As mentioned earlier, one of the goals of the modified Solvay process is to remove the sodium ions in the brine and convert it to solid sodium bicarbonate during the process. Due to the removal of 43% of sodium for the real brine rejected from the desalination plant with a salinity content of 63 g/L during the modified Solvay process, under optimal conditions including the concentration of calcium hydroxide by 22.6 g/L, the temperature of 10 °C and the rate of gas flow of 779/798 mL·min−1; X-ray diffraction spectroscopy analysis of solid sodium bicarbonate product was performed. Figure 13 shows this analysis. According to this figure, there was also a certain amount of calcium carbonate impurity in this product, which can be related to the excess of calcium in the input brine, because in this case, the amount of calcium specified from the optimum condition (ratio of sodium chloride concentration to the concentration of calcium hydroxide = 2.79) was slightly higher and this excess will appear as calcium carbonate precipitation.

4. Conclusions

In this study, using experimental design software and performing experiments based on a central composite design by response surface methodology, the effect of various factors such as temperature, calcium hydroxide concentration, initial salt concentration, and gas flow rate were investigated. The interaction between these factors was analyzed by two-dimensional contour diagrams and three-dimensional response surface charts to remove sodium from synthetic and real brine during the modified Solvay process.
The optimal conditions for each of these factors included a temperature of 10 °C, Ca(OH)2/NaCl concentration ratio of 0.36, and the rate of gas flow of 800 mL/min for synthetic brine, respectively. The sodium removal efficiency was enhanced with increasing concentration of calcium hydroxide, gas flow rate, and initial sodium chloride salt to their optimum values, while with increasing temperature, this removal percentage decreased. Furthermore, stabilizing the pH in the alkaline state boosts the removal efficiency of sodium. By performing the process under optimal conditions when using synthetic and real brine, the removal efficiency of sodium increased 53.51% and 43%, respectively. In the last step, the kinetics of sodium removal reaction under optimal conditions when using synthetic and real brine for reactions with zero, first, and second-order kinetic models were investigated. The results showed that the sodium removal reaction in both cases followed the second-order kinetic.
Ultimately, it can be concluded that the calcium oxide-based modified Solvay method can maintain the pH in alkaline conditions without the use of ammonia. This process can also reduce the environmental impact of rejected brine by simultaneously absorbing carbon dioxide, reducing the salinity in the brine, and then storing them in solid sodium bicarbonate.
Due to the broad scope of this topic, lack of facilities, cost, and time, there are still many gaps in this field, and forthcoming studies could help fill them. The following items are suggested for further investigation based on the findings of this study:
  • Investigation and calculation of carbon dioxide capture under optimal conditions.
  • Using lime for magnesium precipitation and sodium carbonate for calcium precipitation in the modified Solvay process input as a pretreatment.
  • Analyzing the effect of reaction time on the shape and size of sodium bicarbonate crystals.
  • Capturing the carbon dioxide output from the process and reusing it as an input gas.
  • Determining the gas-liquid mass transfer model in the bubble column reactor.
  • Accurate economic estimation to use this method on an industrial scale.

Author Contributions

Conceptualization, T.S., M.A. (Mohsen Abbasi) and M.A. (Mohammad Akrami), Experimental tests, T.S. and M.J.D., Software, T.S. and M.M.P., Analyzing results, T.S., M.M.P. and M.A. (Mohsen Abbasi), visualization, M.J.D. and S.O., Supervision, M.A. (Mohsen Abbasi), Writing manuscript, M.M.P., Writing—review and editing, M.M.P., S.O. and M.A. (Mohammad Akrami). All authors have read and agreed to the published version of the manuscript.

Funding

This research received no external funding.

Institutional Review Board Statement

Not applicable.

Informed Consent Statement

Not applicable.

Data Availability Statement

Not applicable.

Conflicts of Interest

The authors declare no conflict of interest.

References

  1. Al-Amshawee, S.; Yunus, M.Y.B.M.; Azoddein, A.A.M.; Hassell, D.G.; Dakhil, I.H.; Hasan, H.A. Electrodialysis desalination for water and wastewater: A review. Chem. Eng. J. 2020, 380, 122231. [Google Scholar] [CrossRef]
  2. Elgallal, M.; Fletcher, L.; Evans, B. Assessment of potential risks associated with chemicals in wastewater used for irrigation in arid and semiarid zones: A review. Agric. Water Manag. 2016, 177, 419–431. [Google Scholar] [CrossRef]
  3. Al-Saleh, S.; Khan, A. Evaluation of Belgard EV 2000 as antiscalant control additive in MSF plants. Desalination 1994, 97, 87–96. [Google Scholar] [CrossRef]
  4. Bello, A.S.; Zouari, N.; Da’Ana, D.A.; Hahladakis, J.N.; Al-Ghouti, M.A. An overview of brine management: Emerging desalination technologies, life cycle assessment, and metal recovery methodologies. J. Environ. Manag. 2021, 288, 112358. [Google Scholar] [CrossRef]
  5. Zaichenko, V.M.; Shterenberg, V.Y. Capture of CO2 at Thermal Power Stations as One of the Main Trends towards Reducing Anthropogenic Carbon Dioxide Emissions. Therm. Eng. 2019, 66, 440–449. [Google Scholar] [CrossRef]
  6. Ye, Q. Hou’s Process for Soda Manufacture in China. J. Eng. Stud. 2009, 1, 368–379. [Google Scholar]
  7. Hertog, S.; Luciani, G. Energy and Sustainability Policies in the GCC; London School of Economics: London, UK, 2009. [Google Scholar]
  8. Boulamanti, A.; Tzimas, E. Methanol synthesis using captured CO2 as raw material: Techno-economic and environmental assessment. Appl. Energy 2016, 161, 718–732. [Google Scholar]
  9. Anwar, M.; Fayyaz, A.; Sohail, N.; Khokhar, M.; Baqar, M.; Yasar, A.; Rasool, K.; Nazir, A.; Raja, M.; Rehan, M.; et al. CO2 utilization: Turning greenhouse gas into fuels and valuable products. J. Environ. Manag. 2020, 260, 110059. [Google Scholar] [CrossRef]
  10. Sema, T.; Naami, A.; Fu, K.; Edali, M.; Liu, H.; Shi, H.; Liang, Z.; Idem, R.; Tontiwachwuthikul, P. Comprehensive mass transfer and reaction kinetics studies of CO2 absorption into aqueous solutions of blended MDEA–MEA. Chem. Eng. J. 2012, 209, 501–512. [Google Scholar] [CrossRef]
  11. Shatat, M.; Worall, M.; Riffat, S. Opportunities for solar water desalination worldwide. Sustain. Cities Soc. 2013, 9, 67–80. [Google Scholar] [CrossRef]
  12. Shatat, M.; Worall, M.; Riffat, S. A combined approach for the management of desalination reject brine and capture of CO2. Desalination 2010, 251, 70–74. [Google Scholar]
  13. Mohammad, A.F. Optimization of a Combined Approach for the Treatment of Desalination Reject Brine and Capture of CO2. Master’s Thesis, United Arab Emirates University, Abu Dhabi, United Arab Emirates, 2015. [Google Scholar]
  14. Børseth, K.E. Method for Desalination of Water and Removal of Carbon Dioxide from Exhaust Gases. Patent No. AU2003206275, 14 February 2003. [Google Scholar]
  15. Grauer, P.; Krass, F. Method and Device for Binding Gaseous CO2 to Sea Water for the Flue Gas Treatment with Sodium Carbonate Compounds. U.S. Patent 20100196244, 5 August 2010. [Google Scholar]
  16. Constantz, B.R.P.V.; Farsad, K.; Fernandez, M. Desalination Methods and Systems that Include Carbonate Compound Precipitation; Calera Corporation: Los Gatos, CA, USA, 2010. [Google Scholar]
  17. Jibril, B.E.-Y.; Ibrahim, A.A. Chemical conversions of salt concentrates from desalination plants. Desalination 2001, 139, 287–295. [Google Scholar] [CrossRef]
  18. Mohammad, A.F.; Al-Marzouqi, A.H.; El-Naas, M.H.; Van der Bruggen, B.; Al-Marzouqi, M.H. A New Process for the Recovery of Ammonia from Ammoniated High-Salinity Brine. Sustainability 2021, 13, 10014. [Google Scholar] [CrossRef]
  19. Mourad, A.A.-H.I.; Mohammad, A.F.; Al-Marzouqi, A.H.; El-Naas, M.H.; Al-Marzouqi, M.H.; Altarawneh, M. KOH-Based Modified Solvay Process for Removing Na Ions from High Salinity Reject Brine at High Temperatures. Sustainability 2021, 13, 10200. [Google Scholar] [CrossRef]
  20. Mourad, A.A.-H.; Mohammad, A.F.; Al-Marzouqi, A.H.; El-Naas, M.H.; Al-Marzouqi, M.H.; Altarawneh, M. CO2 capture and ions removal through reaction with potassium hydroxide in desalination reject brine: Statistical optimization. Chem. Eng. Process.-Process Intensif. 2022, 170, 108722. [Google Scholar] [CrossRef]
  21. Mourad, A.A.I.; Mohammad, A.F.; Altarawneh, M.; Al-Marzouqi, A.H.; El-Naas, M.H.; Al-Marzouqi, M.H. Effects of potassium hydroxide and aluminum oxide on the performance of a modified solvay process for CO2 capture: A comparative study. Int. J. Energy Res. 2021, 45, 13952–13964. [Google Scholar] [CrossRef]
  22. Mustafa, J.; Mourad, A.; Al-Marzouqi, A.H.; El-Naas, M. Simultaneous treatment of reject brine and capture of carbon dioxide: A comprehensive review. Desalination 2020, 483, 114386. [Google Scholar] [CrossRef]
  23. Dindi, A.; Quang, D.V.; AlNashef, I.; Abu-Zahra, M.R. A process for combined CO2 utilization and treatment of desalination reject brine. Desalination 2018, 442, 62–74. [Google Scholar] [CrossRef]
  24. El-Naas, M.H.; Mohammad, A.F.; Suleiman, M.I.; Al Musharfy, M.; Al-Marzouqi, A.H. A new process for the capture of CO2 and reduction of water salinity. Desalination 2017, 411, 69–75. [Google Scholar] [CrossRef]
  25. Dindi, A.; Quang, D.V.; Abu Zahra, M. Simultaneous carbon dioxide capture and utilization using thermal desalination reject brine. Appl. Energy 2015, 154, 298–308. [Google Scholar] [CrossRef]
  26. Huang, H.P.; Shi, Y.; Li, A.W.; Chang, S.G. Dual alkali approaches for the capture and separation of CO2. Energy Fuels 2001, 15, 263–268. [Google Scholar] [CrossRef] [Green Version]
  27. Álvarez, L.M.; Balbo, A.L.; Mac Cormack, W.; Ruberto, L.A.M. Bioremediation of a petroleum hydrocarbon-contaminated Antarctic soil: Optimization of a biostimulation strategy using response-surface methodology (RSM). Cold Reg. Sci. Technol. 2015, 119, 61–67. [Google Scholar] [CrossRef]
  28. Zhu, X.; Tian, J.; Liu, R.; Chen, L. Optimization of Fenton and electro-Fenton oxidation of biologically treated coking wastewater using response surface methodology. Sep. Purif. Technol. 2011, 81, 444–450. [Google Scholar] [CrossRef]
  29. Bezerra, M.A.; Santelli, R.E.; Oliveira, E.P.; Villar, L.S.; Escaleira, L.A. Response surface methodology (RSM) as a tool for optimization in analytical chemistry. Talanta 2008, 76, 965–977. [Google Scholar] [CrossRef]
  30. Bhattacharya, S. Central composite design for response surface methodology and its application in pharmacy. In Response Surface Methodology in Engineering Science; IntechOpen: London, UK, 2021. [Google Scholar]
  31. Heidari, M.; Vosoughi, M.; Sadeghi, H.; Dargahi, A.; Mokhtari, S.A. Degradation of diazinon from aqueous solutions by electro-Fenton process: Effect of operating parameters, intermediate identification, degradation pathway, and optimization using response surface methodology (RSM). Sep. Sci. Technol. 2021, 56, 2287–2299. [Google Scholar] [CrossRef]
  32. Malekian, R.; Abedi-Koupai, J.; Eslamian, S.S.; Mousavi, S.F.; Abbaspour, K.C.; Afyuni, M. Ion-exchange process for ammonium removal and release using natural Iranian zeolite. Appl. Clay Sci. 2011, 51, 323–329. [Google Scholar] [CrossRef]
  33. Karimifard, S.; Moghaddam, M.R.A. Enhancing the adsorption performance of carbon nanotubes with a multistep functionalization method: Optimization of Reactive Blue 19 removal through response surface methodology. Process Saf. Environ. Prot. 2016, 99, 20–29. [Google Scholar] [CrossRef]
  34. Boubakri, A.; Hafiane, A.; Bouguecha, S.A.T. Application of response surface methodology for modeling and optimization of membrane distillation desalination process. J. Ind. Eng. Chem. 2014, 20, 3163–3169. [Google Scholar] [CrossRef]
  35. Mohammad, A.F.; El-Naas, M.H.; Suleiman, M.I.; Al Musharfy, M. Optimization of a solvay-based approach for CO2 capture. Int. J. Chem. Eng. Appl. 2016, 7, 230–234. [Google Scholar] [CrossRef] [Green Version]
  36. Muftah, E.-N. Process for Capture of Carbon Dioxide and Desalination. Patent No. WO2017029509A1, 23 February 2017. [Google Scholar]
Figure 1. Scheme of the Solvay process based on calcium oxide.
Sustainability 14 02298 g001
Figure 2. Experimental setup of modified Solvay process: 1—Double-walled Pyrex reactor, 2—pH electrode, 3—pH meter, 4—air stone, 5—magnetic stirrer, 6—water bath, 7—Filter, P—pressure gauge, R—rotameter.
Sustainability 14 02298 g002
Figure 3. Calibration chart for conversion of electrical conductivity to total soluble solids in (A) 10,000 to 50,000 (mg/L). (B) 60,000 to 120,000 (mg/L).
Sustainability 14 02298 g003
Figure 4. Experimental data vs. the statistical model’s expected data (A) and normal residuals’ normal probability (B).
Sustainability 14 02298 g004
Figure 5. Linear regression of sodium removal (%) at temperatures of 10 °C to 40 °C (A), different gas flow rates (B), various calcium hydroxide concentration (C), and different sodium chloride salt concentration (D).
Sustainability 14 02298 g005
Figure 6. The effect of temperature on pH during different reaction times.
Sustainability 14 02298 g006
Figure 7. Charts of the effect of interaction between factors in sodium removal (%).
Sustainability 14 02298 g007
Figure 8. (A) Contour and response surface chart of the interaction effect of sodium chloride concentration (g/L) and temperature (°C) on sodium removal (%) under constant conditions (gas flow rate (550 mL/min) and calcium hydroxide concentration (25 g/L)). (B) Contour and response surface chart of the interaction effect of gas flow rate (mL/min) and tem-perature for sodium removal (%) under constant conditions (sodium chloride concentration 90 (g/L) and calcium hydroxide concentration 25 (g/L)). (C) Contour and response surface chart of the interaction effect of gas flow rate (mL/min) and sodium chloride concentration (g/L) to remove sodium (%) under constant conditions (calcium hydroxide concentration 25 (g/L) and temperature 25 (°C)). (D) Contour and response surface chart of the interaction effect of sodium chloride salt concentration (g/L) and calcium hydroxide concentration (g/L) to remove sodium (%) under constant conditions (gas flow rate 550 (mL/min) and temperature 25 (°C)). (E) Contour and response surface chart of the interaction effect of calcium hydroxide concentration (g/L) and temperature (°C) to remove sodium (%) under constant conditions (gas flow rate 550 (mL/min) and sodium chloride concentration 90 (g/L)). (F) Contour and response surface chart of the interaction effect of gas flow rate (mL/min) and calcium hydroxide concentration (g/L) to remove sodium (%) at constant conditions (temperature 25 (°C) and sodium chloride concentration 90 (g/L)).
Sustainability 14 02298 g008aSustainability 14 02298 g008bSustainability 14 02298 g008cSustainability 14 02298 g008d
Figure 9. Chart of optimization of operational variables for sodium removal.
Sustainability 14 02298 g009
Figure 10. Sodium removal efficiency under optimal conditions (calcium hydroxide concentration 40 (g/L), sodium chloride concentration 111.5152 (g/L), temperature 10 °C and gas flow rate 779.798 (mL/min) in synthetic and real brine.
Sustainability 14 02298 g010
Figure 11. Kinetics of sodium removal from synthetic brine under optimal process conditions, (A): Zero-order (B): First-order (C): Second-order.
Sustainability 14 02298 g011aSustainability 14 02298 g011b
Figure 12. Kinetics of sodium removal for real brine under optimal process conditions, (A): Zero-order (B): First-order (C): Second-order.
Sustainability 14 02298 g012
Figure 13. X-ray diffraction spectroscopy analysis of solid sodium bicarbonate product.
Sustainability 14 02298 g013
Table 1. Selected factors and levels for designing experiments of the modified Solvay.
FactorSurface 1Surface 2Surface 3Surface 4Surface 5
X1: Salt concentration (g/L)607590105120
X2: gas flow rate (mL/min)20375550725900
X3: Temperature (°C)1017.52532.540
X4: Calcium hydroxide concentration (g/L)1017.52532.540
Table 2. CCD points and observed responses.
RunX1: Concentrations of Sodium Chloride (g/L)X2: Gas Flow Rate (mL/min)X3: Temperature (°C)X4: Concentrations of Calcium Hydroxide (g/L)Actual Na Removal (%)Predicted Na Removal (%)
17537517.517.520.8021.12
29055025.025.024.8525.45
39055010.025.039.0834.57
49055025.025.024.7925.45
59055025.040.029.1628.28
69055025.025.024.8425.45
712055025.025.08.849.06
87537532.532.511.0912.15
910572532.517.57.947.29
1010572517.532.530.8132.16
117572532.532.520.9422.51
129055025.025.024.8325.45
137572532.517.524.9424.37
149020025.025.06.847.25
157537517.532.516.8018.26
169055025.010.02.843.38
1710537532.517.50.400.35
189055040.025.018.0018.34
196055025.025.025.1624.60
2010537517.517.53.804.04
217572517.532.525.8226.62
227572517.517.530.8031.48
239055025.025.024.8425.45
249055025.025.024.8225.45
2510572517.517.513.7914.40
2610572532.532.524.9426.05
279090025.025.030.7029.97
287537532.517.515.0214.01
2910537532.532.514.9415.69
309055025.025.024.8225.45
3110537517.532.520.8022.80
Table 3. ANOVA results of quadratic model to remove Na.
SourceDFAdj SSAdj MSF-Valuep-Value
Model142489.42177.81519.250.000
Linear41648.62412.15644.610.000
X11276.29276.28529.910.000
X21641.18641.18369.400.000
X31303.67303.66832.870.000
X41427.49427.48646.270.000
Square4415.08103.77011.230.000
X1 × X11157.73157.72617.070.001
X2 × X21103.89103.89011.250.004
X3 × X318.238.2290.890.359
X4 × X41193.09193.09320.900.000
2-Way Interaction6425.7170.9527.680.001
X1 × X210.100.0980.010.919
X1 × X310.100.0980.010.919
X1 × X41425.08425.08146.010.000
X2 × X310.180.1830.020.890
X2 × X410.130.1280.010.908
X3 × X410.130.1280.010.908
Error16147.819.238
Lack-of-Fit10147.8114.78137,854.32<0.00001
Pure Error60.18650.099
Total302637.23
Table 4. Model Summary Statistic.
SourceStd. Dev.R2Adjusted R2Predicted R2PRESSRemarks
Linear0.67200.55490.48370.329517.01
2FI0.49660.81520.71800.424914.59
Quadratic0.35900.94440.92830.885011.14Suggested
Cubic0.16960.99210.9671−0.142828.98
Table 5. Equations and linear forms of kinetic models.
Kinetic ModelEquationLinear Form of Equation
Zero order r c = d C d t = k 0 C C 0 = k o t
first order r c = d C d t = k 1 C ln C C 0 = k 1 t
second order r c = d C d t = k 2 C 2 1 C 1 C 0 = k 2 t
Table 6. Results of process kinetics for the solution of 111.5152 (g/L) of synthetic brine under optimal conditions.
Kinetic ModelZero OrderFirst OrderSecond Order
R20.91010.9150.9141
K0 (mg·L−1·min−1)97.811--
K1 (min−1)-0.0016-
K2 (L·mg−1·min−1)--3 × 10⁻⁸
Table 7. Results of modified Solvay process kinetics for a concentration of 63 (g/L) of real brine under optimal conditions.
Kinetic ModelZero OrderFirst OrderSecond Order
R20.91150.93240.9532
K0 (mg·L−1·min−1)70.783--
K1 (min−1)-0.0017-
K2 (L·mg−1·min−1)--4 × 10⁻⁸
Publisher’s Note: MDPI stays neutral with regard to jurisdictional claims in published maps and institutional affiliations.

