Article

Digitalization Platform for Mechanistic Modeling of Battery Cell Production

1
Institute of Machine Tools and Production Technology (IWF), Sustainable Manufacturing and Life Cycle Engineering, Technische Universität Braunschweig, Langer Kamp 19b, 38106 Braunschweig, Germany
2
Battery LabFactory Braunschweig (BLB), Technische Universität Braunschweig, Langer Kamp 19, 38106 Braunschweig, Germany
3
Institute of Energy and Process Systems Engineering (InES), Technische Universität Braunschweig, Franz-Liszt-Straße 35, 38106 Braunschweig, Germany
4
Institute for Particle Technology (iPAT), Technische Universität Braunschweig, Franz-Liszt-Straße 35, 38106 Braunschweig, Germany
5
Institute of Applied Materials—Electrochemical Technologies, Karlsruhe Institute of Technology, Adenauerring 20b, 76131 Karlsruhe, Germany
*
Author to whom correspondence should be addressed.
Sustainability 2022, 14(3), 1530; https://doi.org/10.3390/su14031530
Submission received: 15 December 2021 / Revised: 12 January 2022 / Accepted: 25 January 2022 / Published: 28 January 2022

Abstract

:
The application of batteries in electric vehicles and stationary energy-storage systems is widely seen as a promising enabler for a sustainable mobility and for the energy sector. Although significant improvements have been achieved in the last decade in terms of higher battery performance and lower production costs, there remains high potential to be tapped, especially along the battery production chain. However, the battery production process is highly complex due to numerous process–structure and structure–performance relationships along the process chain, many of which are not yet fully understood. In order to move away from expensive trial-and-error operations of production lines, a methodology is needed to provide knowledge-based decision support to improve the quality and throughput of battery production. In the present work, a framework is presented that combines a process chain model and a battery cell model to quantitatively predict the impact of processes on the final battery cell performance. The framework enables coupling of diverse mechanistic models for the individual processes and the battery cell in a generic container platform, ultimately providing a digital representation of a battery electrode and cell production line that allows optimal production settings to be identified in silico. The framework can be implemented as part of a cyber-physical production system to provide decision support and ultimately control of the production line, thus increasing the efficiency of the entire battery cell production process.

1. Introduction

1.1. Motivation for a Model-Based Digitalization Platform

The widespread emergence of battery technology together with the need for the global automotive industry to mitigate climate change are responsible for a major paradigm shift in the mobility and energy sector. Combined with carbon-free energy, electric vehicles (EV) and stationary energy-storage systems offer immense decarbonization potential for sectors currently based on fossil fuels. In particular, the mobility sector, which contributes 24% of direct emissions from fuel combustion, is in the center of a dynamic transition that can already be noticed by the increasing shares in new registrations and ambitious targets from policy makers [1,2]. Consequently, the demand for battery cells is predicted to increase by a factor of ten from 282 GWh in 2020 to 2623 GWh in 2030, mostly due to electromobility [3]. The increasing interest and effort in battery technology in the last decade has led not only to a significant improvement in the performance (energy/power density and safety) but simultaneously also to battery cell costs dropping by 80% from USD 668 in 2013 to USD 137 in 2020 [4]. Future trends in battery technology including silicon-blended anodes, lithium-sulfur, or all-solid-state battery cells promise even higher performance, which will foster new fields of application and drive the shift towards a battery-powered mobility and energy-storage sector.
Despite the remarkable success of batteries in the last decade, further progress is required to help increase energy density (i.e., the range of EVs) and decrease the cost and the charging times. Besides the cell materials and cell design, the battery cell production process especially provides significant room for improvement. The battery production chain consists of heterogeneous process steps with a vast amount of parameters and numerous (only partly understood) process–product structure and product structure–performance relationships inside single process steps but also along the entire production chain. As a consequence, the battery cell production cannot compete with the yield rates of the electronic industry, and, currently, low double-digit scrap rates are reported [5]. The scrap material and the resulting high energy demand significantly increase the overall environmental impact of batteries. In addition, the battery cell is a complex product in which its final performance properties, such as energy density or capacity, are determined by various structural parameters of the individual components (i.e., electrodes, separator, and electrolyte). Slight changes in the structural parameters can result in drastic limitations of the electrochemical performance of the battery cell. A trial-and-error-based improvement strategy to produce a battery cell in an already ramped up production line, especially on an industrial scale, is typically avoided due to the risk of expensive production downtime, impaired battery cell quality, and increased scrap rates. Consequently, there is a demand for a framework that allows a non-invasive improvement of the battery cell and its process chain to further continue the emergence of a battery-driven mobility and energy sector. Herein, we introduce a framework that is able to integrate mechanistic models of the production processes and the battery cell resulting in a digital representation of the real world that can determine the effect of the production process on the battery cell performance. The proposed framework is based on transparent process–product structure as well as product structure–performance relationships instead of expensive trial-and-error runs and enables low-cost and knowledge-based improvements. By improving the battery performance and the reducing production cost due to lower scrap rates, the implementation of the framework can overcome the barriers to electric-vehicle success and ultimately contribute to a more sustainable mobility and energy sector.

1.2. Existing Approaches to Make Cause–Effect Relations Transparent

Lithium-ion battery cells are manufactured in a complex process chain, composed of highly specialized processes. Convergent and divergent material flows as well as multiple parameter dependencies link these processes and lead to manifold cause–effect relationships. In general, the process chain is divided into three phases: electrode production, cell production, and cell conditioning. The electrode production is predominantly characterized by batch and continuous processes, starting with the mixing of active material, conductivity additives, a binder, and a solvent to form a homogeneous electrode slurry. Next, the slurry is continuously or intermittently coated onto a foil. The selection of the most appropriate process technology depends on a variety of factors, such as the electrode specifications and the cell format (i.e., pouch, cylindrical, or prismatic) [6]. The foil is then dried and compressed by a two roller calender. Configuring the calendering process requires a deep understanding of process parameters and structural parameters of the incoming product as well as their cause–effect relations. At this step, for example, a reduction in the electrode porosity leads to more particles being in contact and, consequently, a higher electrode conductivity. Additionally, a reduction in the porosity decreases the electrolyte diffusion within the pores [7]. The cell production is characterized by discrete processes and takes place in a dry room. First, the cell production starts with a final drying process. Subsequently, electrodes are slit in the correct width and length. In the production of pouch cells, cathodes, anodes, and separator sheets are stacked together during packaging. The stack is contacted internally and inserted into a pouch bag, which is then filled with electrolyte and sealed. Alternatively, the cathode, separator, and anode are winded, and the resulting electrode coils are inserted into cylindrical or prismatic cans. Finally, cell conditioning takes place outside the dry room and includes the formation and aging processes [6].
Each production step is characterized by a variety of process-specific parameters that determine the intermediate product structure as well as the final battery cell performance [8,9]. As a consequence, the initial processes influence the parameters of the subsequent processes, increasing the complexity of the cause–effect relations [10]. A deep understanding of these relations along the battery cell production is therefore essential to support a knowledge-based improvement in processes and battery cell quality and, consequently, a more competitive battery production with reduced environmental impacts. Current works regarding cause–effect relations in the battery cell production present different scopes and methodologies. The scopes range from selected parameters and specific processes [7,11,12] to a more holistic approach of the entire process chain and the battery cell quality [9,10,13,14]. Considering the methodology, the majority of the works present either data- or mechanistic-based approaches.
Data-based methodologies apply mathematical algorithms to generate models that fit the cause–effect relations present in experimental data. This approach is also called a black box since a clear understanding of the phenomena that define the relations is not provided. As a consequence, non-intuitive relations may be identified. However, the findings cannot be extrapolated to new datasets as the fit is assured only for the data used to train the model. In addition, this methodology strongly depends on the acquisition and the quality of the data [8,15]. A framework to support data acquisition, preparation, and analysis in battery cell manufacturing is proposed by [8]. The data-mining framework CRISP-DM is applied to assess and identify the most important intermediate product features based on their influences on the cell capacity. Primo and colleagues focus on the calendering process and present the application of the advanced statistics methods (e.g., ANCOVA, PCA, and k-means) to study the cause–effect relations between selected process parameters and electrode properties as well as their influence on the battery cell capacity [7]. Hoffmann and colleagues also propose a data-based approach to discuss the relations between intermediate product features on the cell characterization data by applying statistical analysis [14].
Compared to data-based models, mechanistic models are derived from validated equations that describe a phenomenon and require, therefore, knowledge of the modeled system. Based on that, cause–effect relations are identified, and a deep understanding of these relations is provided, different from data-based approaches. Another benefit of mechanistic models is the possibility to extrapolate the models and apply them to new systems and processes, without new experimental data [11,15]. The use of mechanistic models to assess cause–effect relations along the battery cell production is proposed by i.a. [9]. Herein, the propagation of manufacturing uncertainties was studied with a multilevel model that couples process chain and battery cell simulations. Ngandjong and colleagues presented a Discrete Element Method (DEM) simulation to study relations on a process level and assess the effect of calendering on the mesostructural and macroscale electrochemical properties of the battery cell [11]. The same DEM simulation paradigm was proposed by Sangrós Giménez and colleagues to analyze the evolution of the electrode structure during calendering [12]. In addition, the simulation results were used to model the electrical and ionic conductivities as well as the adhesion strength.
Similarly, mechanistic models can be used to describe the electrochemical behavior of the battery cell. Depending on the modeling approach, the electrochemical models can be separated into lumped electrochemical models, Doyle–Fuller–Newman models [16,17], and electrochemical full-3D models. The Doyle–Fuller–Newman-model type, also known as the Pseudo-2-Dimensional (P2D) model, represents a widespread solution since it allows a detailed investigation of the physico-chemical mechanisms inside the battery cell with a reasonable computational effort. These models can then be used to identify optimal electrode and cell structures by rigorous mathematical optimization [18]. They may further be connected to production models. For example, Lenze and colleagues have used a P2D model to support experimental analysis to understand relationships between the calendering process and, e.g., the effective ionic conductivity within the electrolyte and solid active material, which in turn affect battery cell performance [19].
While numerous modeling approaches focus on cause–effect relations within individual processes or within the battery cell, there is a clear demand for a comprehensive framework that allows to address the interaction of battery production and the battery cell. Against this background, this article presents a framework that allows the coupling of mechanistic process models with a battery cell model within a generic platform concept to describe the impact of individual processes on the structure of the battery cell components and, consequently, on the performance properties of the final battery cells. The developed framework can ultimately be used to support battery production and the design process of battery cells by providing crucial but inexpensive insights in the process-product mechanisms, which allows a more effective production and thus a more sustainable product.

2. Methodology

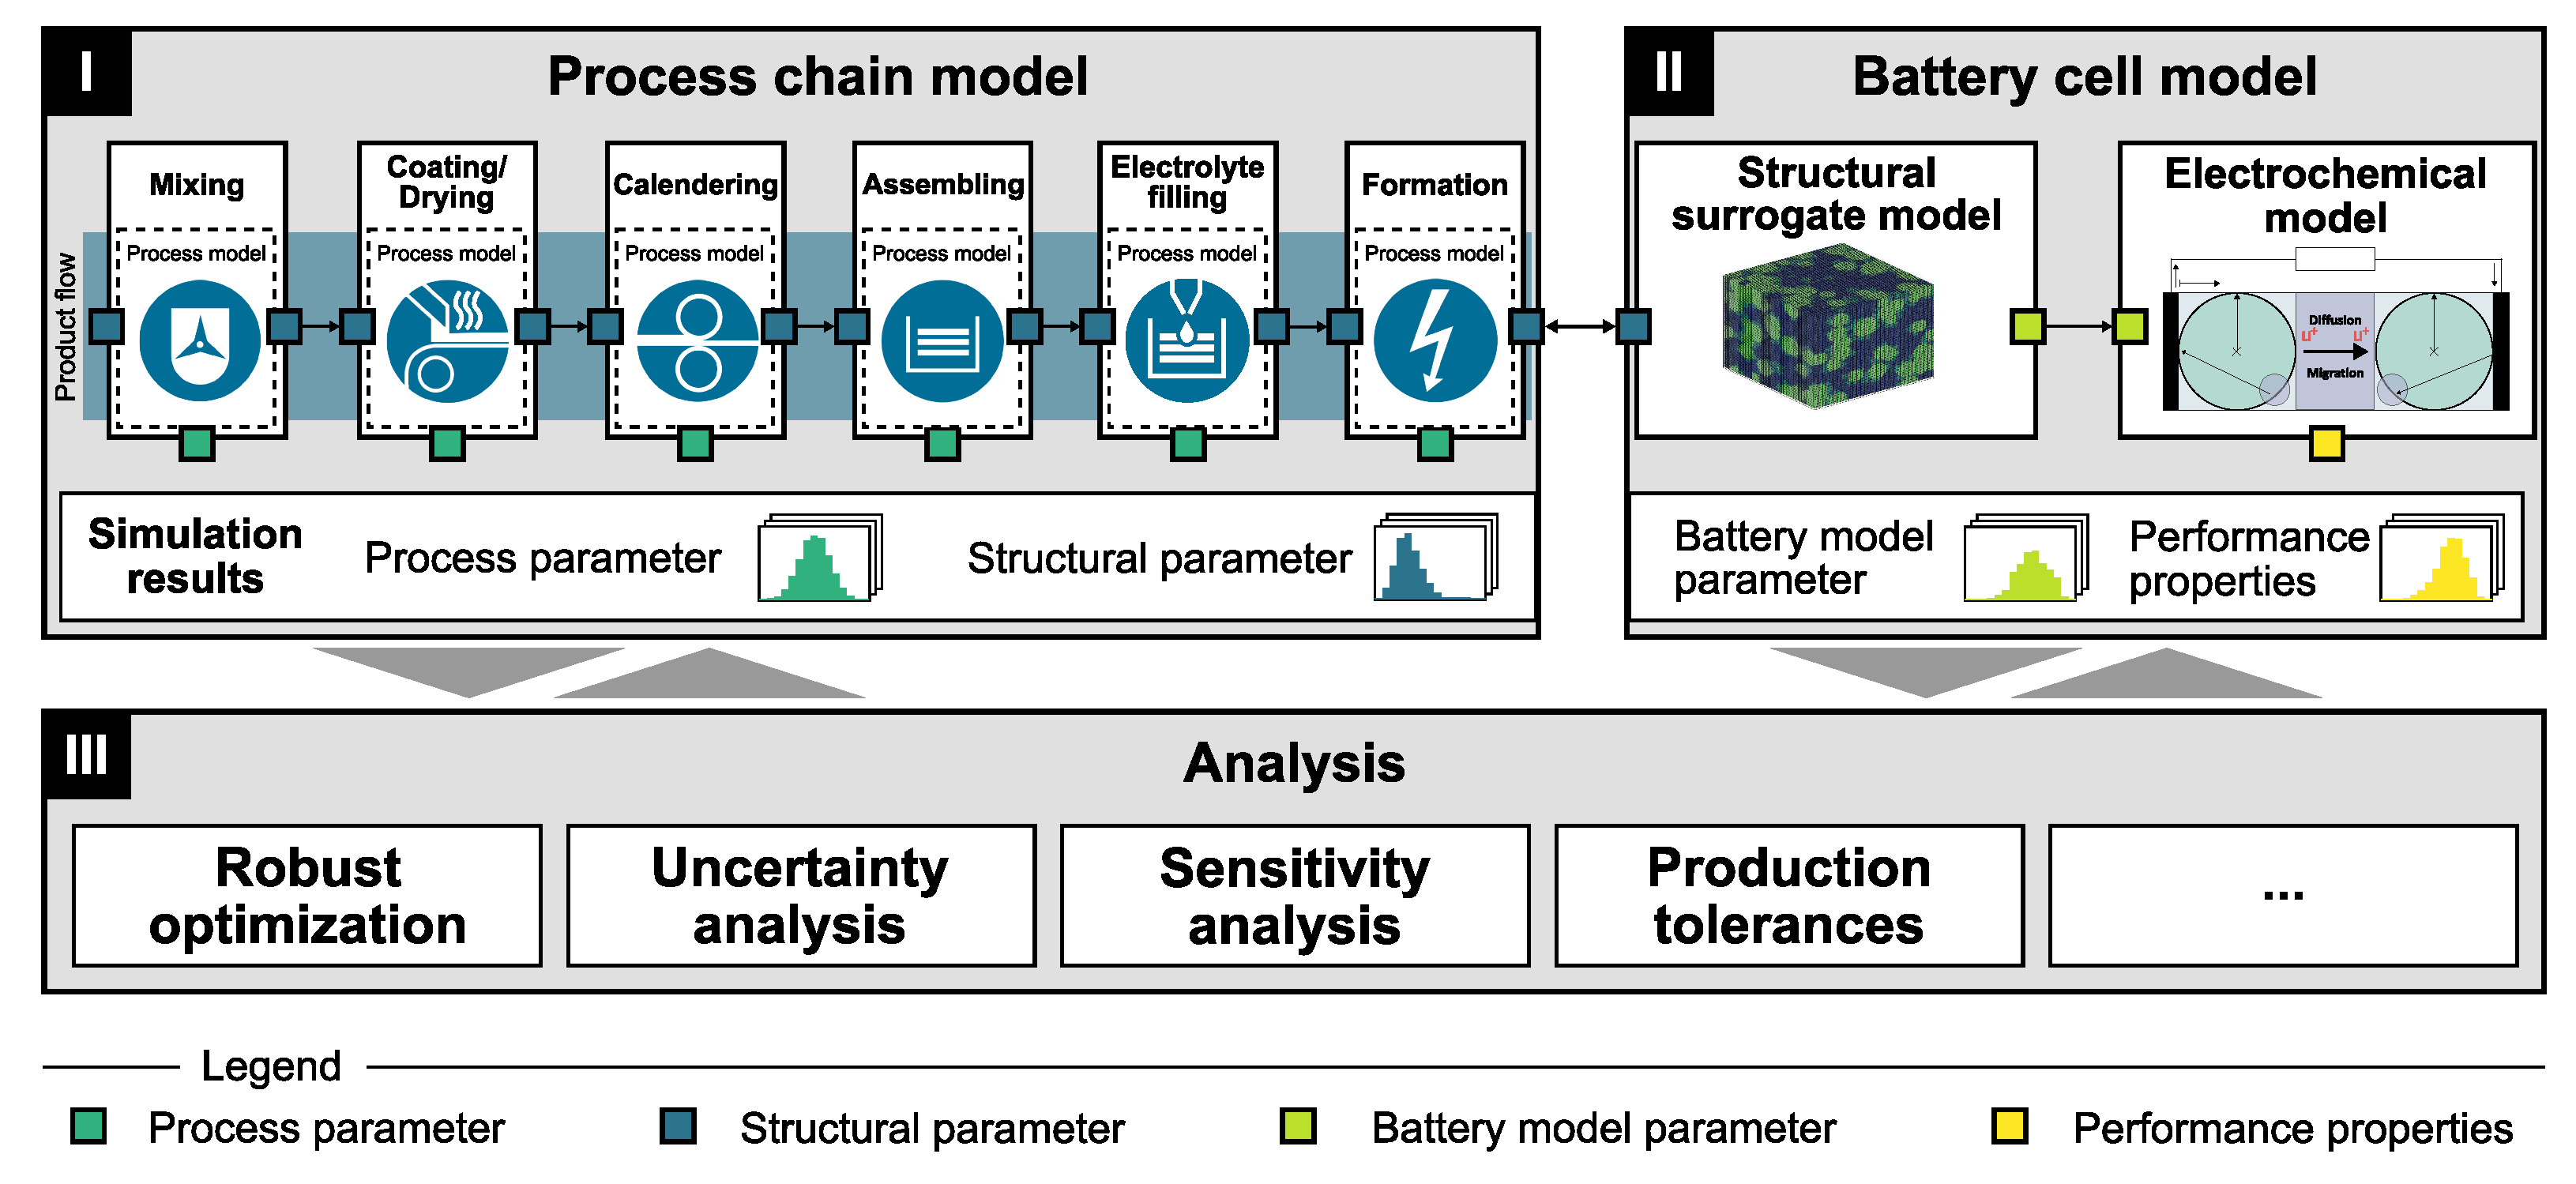
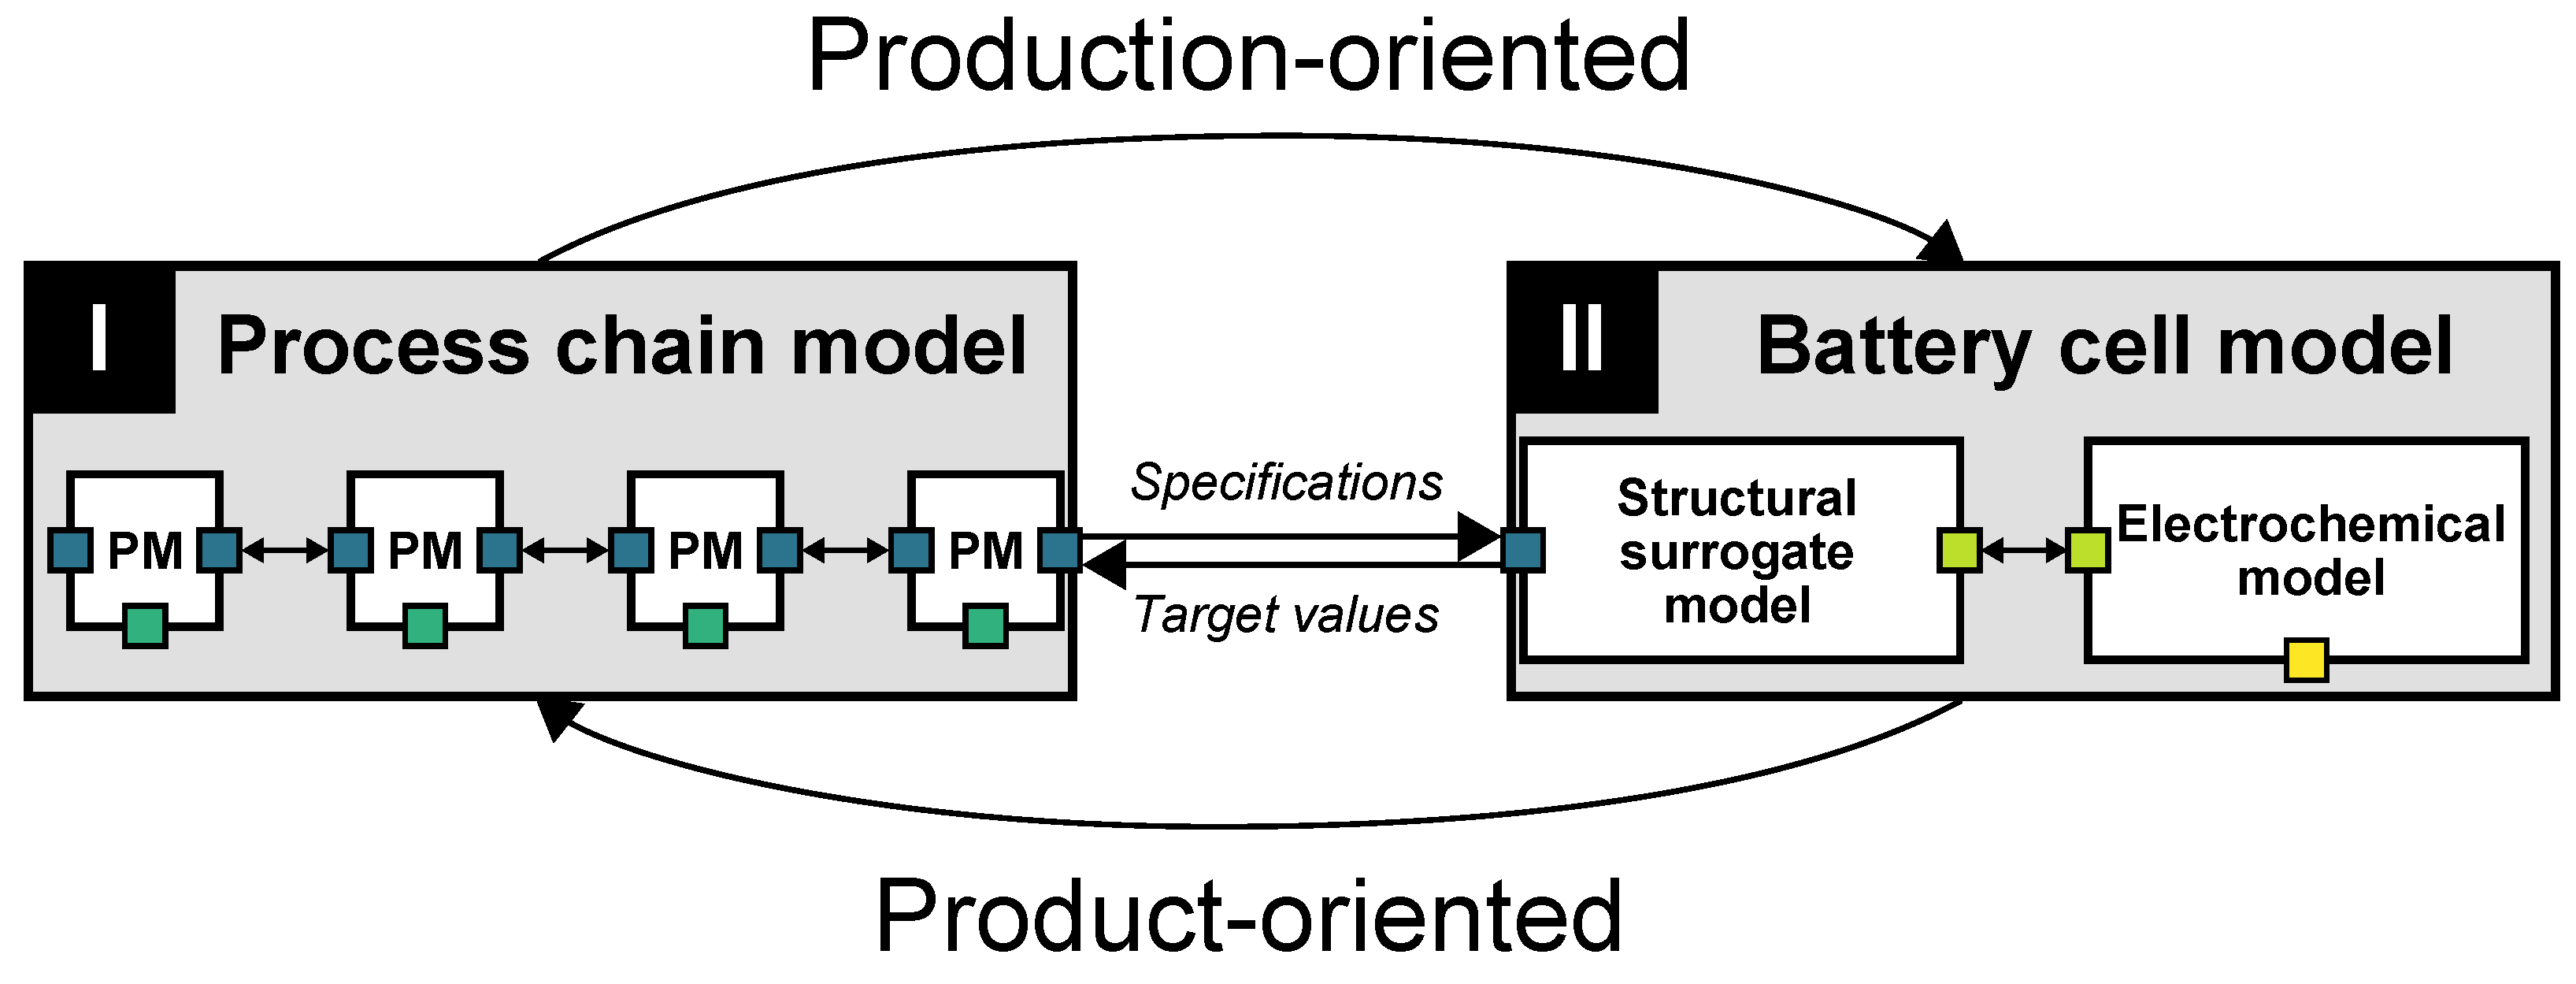
2.1. Concept of the Modeling Framework

The modeling framework is able to combine mechanistic models for the process chain and the battery cell, which are integrated into one platform with defined intersections. It consists of the three modules: (I) the process chain model, (II) the battery cell model, and (III) analysis (Figure 1), and it builds up on previous works [9,20]. The modeling framework is based on the process–structure–performance relationship. It describes the influence of individual production processes on the structure of the intermediate and final products, which in turn predetermine the performance of the final battery cell [6].
The process–structure relationship and the structure–performance relationship were modeled based on mechanistic cause–effect relationships within the (I) process chain model and the (II) battery cell model, respectively. Both modules are connected via the structural parameters of the battery cells, which is the output of (I) and the input for (II). The combined process chain and battery cell model enables an in silico analysis of process–product interactions considering not only nominal values but additionally uncertain process and structural parameters, which are caused by machine and material imprecision. The machine and material imprecision propagate as parameter uncertainties along the process chain model and ultimately result in uncertain battery cell performance properties. The simulation results can subsequently be accessed for various analysis functions (III) such as robust optimization, uncertainty/sensitivity analysis, or identification of production tolerances.
The combined process chain and battery cell model is a digital representation of the battery production and the battery cell, which can serve as an integral element of the cyber world within a cyber-physical production system. The model approach allows a low-cost scenario analysis, whereby its results can be transferred to the real production line and support the battery cell developers during the design process or the worker at the machine. The use of the digital representation lies in the quantification of production influences on the intermediate product characteristics and consequently on the battery cell performance.
Both the process chain and the battery cell model can be starting points for such an evaluation (Figure 2). Based on the process chain model, it is possible to determine the extent to which changes in the process parameters affect the structure and, subsequently, the extent to which changes in the structure affect the performance properties of the battery cell (production-oriented). In this case, the process chain model is used to determine specifications of the structural parameters, which are then transferred to the battery cell model. In contrast, the battery cell model can also be used initially to design a battery cell with a desired performance (product-oriented). The structural parameters determined as a result, e.g., via an optimization, are consequently target values for the subsequent calculations of the process chain model. Consequently, the process chain model needs to be adjusted iteratively in order to achieve these structural parameters.

2.2. Process Chain Model (I)

The process chain model describes the respective process–product mechanisms in each process and consists of individual model containers for each process step. Each process model container can hold different types of process models such as analytical (e.g., based on mass or energy balances) or numerical models (e.g., computational fluid dynamics or discrete-element-method models) (Figure 3).
The characteristics of the respective raw material and the intermediate or final product within the processes are defined by structural parameters. These structural parameters include both material-intrinsic characteristics such as the bulk density of the active material but also structural characteristics of the individual component such as the coating thickness of the electrodes. Structural parameters can be both input S P i , k i and output S P i , k o parameters of process models, where the subscripts i denote the process step; k indicates the respective structural parameter; and the superscript i or o represents an input or output. Process parameters P P i , j define the impact of a process on the raw material and the intermediate product, respectively, and thus are input parameters of process models, where j represents the respective process parameter of the process. Overall, process models can be formulated such that:
S P i , k o = f ( P P i , j , S P i , k i )
Depending on the selected process step, the structure of the incoming raw material or intermediate products can remain unchanged (e.g., active material bulk density during mixing) or be altered due to the process parameters (e.g., porosity during calendering). Furthermore, new structural characteristics might also arise as part of the process step (e.g., porosity after drying). This behavior is reflected by the interconnectivity of the structural parameters between different process steps in the process chain model. Each model container possesses structural parameter intersections based on the input and output requirements of the process model. Consequently, output structural parameters can be passed on to the subsequent model container but can also skip several process steps until the structural parameter is required again. The interconnectivity of the structural parameters ultimately result in an interdependent network of structural parameters, which reflects the high complexity of the battery cell process chain. The level of complexity, which is addressed within the process model influences the degree of conformity between the measured and the modeled process dependencies. Typically, process modelers start with the main cause–effect relations and continuously increase the level of complexity of the model. Process models must be validated not only on process level but also on the process chain level to ensure reliable results of the process chain simulation.
Numerous mechanistic modeling approaches exist, which are available for modeling the cause–effect relations in the different process steps. Analytical models are typically used for a top-down description of the process mechanisms and can be solved in less than a few seconds. However, there are also highly complex bottom-up approaches such as the Discrete Element Method (DEM), the Computational Fluid Dynamic (CFD), or the Finite Element Method (FEM). These bottom-up approaches are based on particle–particle interactions or describe the behavior of the fluid or component using partial differential equations or force balances. Compared to analytical equations, the complex bottom-up approaches require long computation times (from several hours to multiple days) and are typically solved in a separate software environment.
The selection of the mechanistic modeling approach depends on the respective process step. DEM simulations are suited for particle-oriented process steps such as dry mixing, drying, or calendering [12,21], whereas CFD simulations are often used for dispersion, coating, or electrolyte filling [22]. Analytical models, however, can be used widely for various process steps throughout the process chain. They range from first-principle equations, e.g., for drying of anodes [23], to semi-empirical models that fit measured data supported by structural parameters [24,25,26].

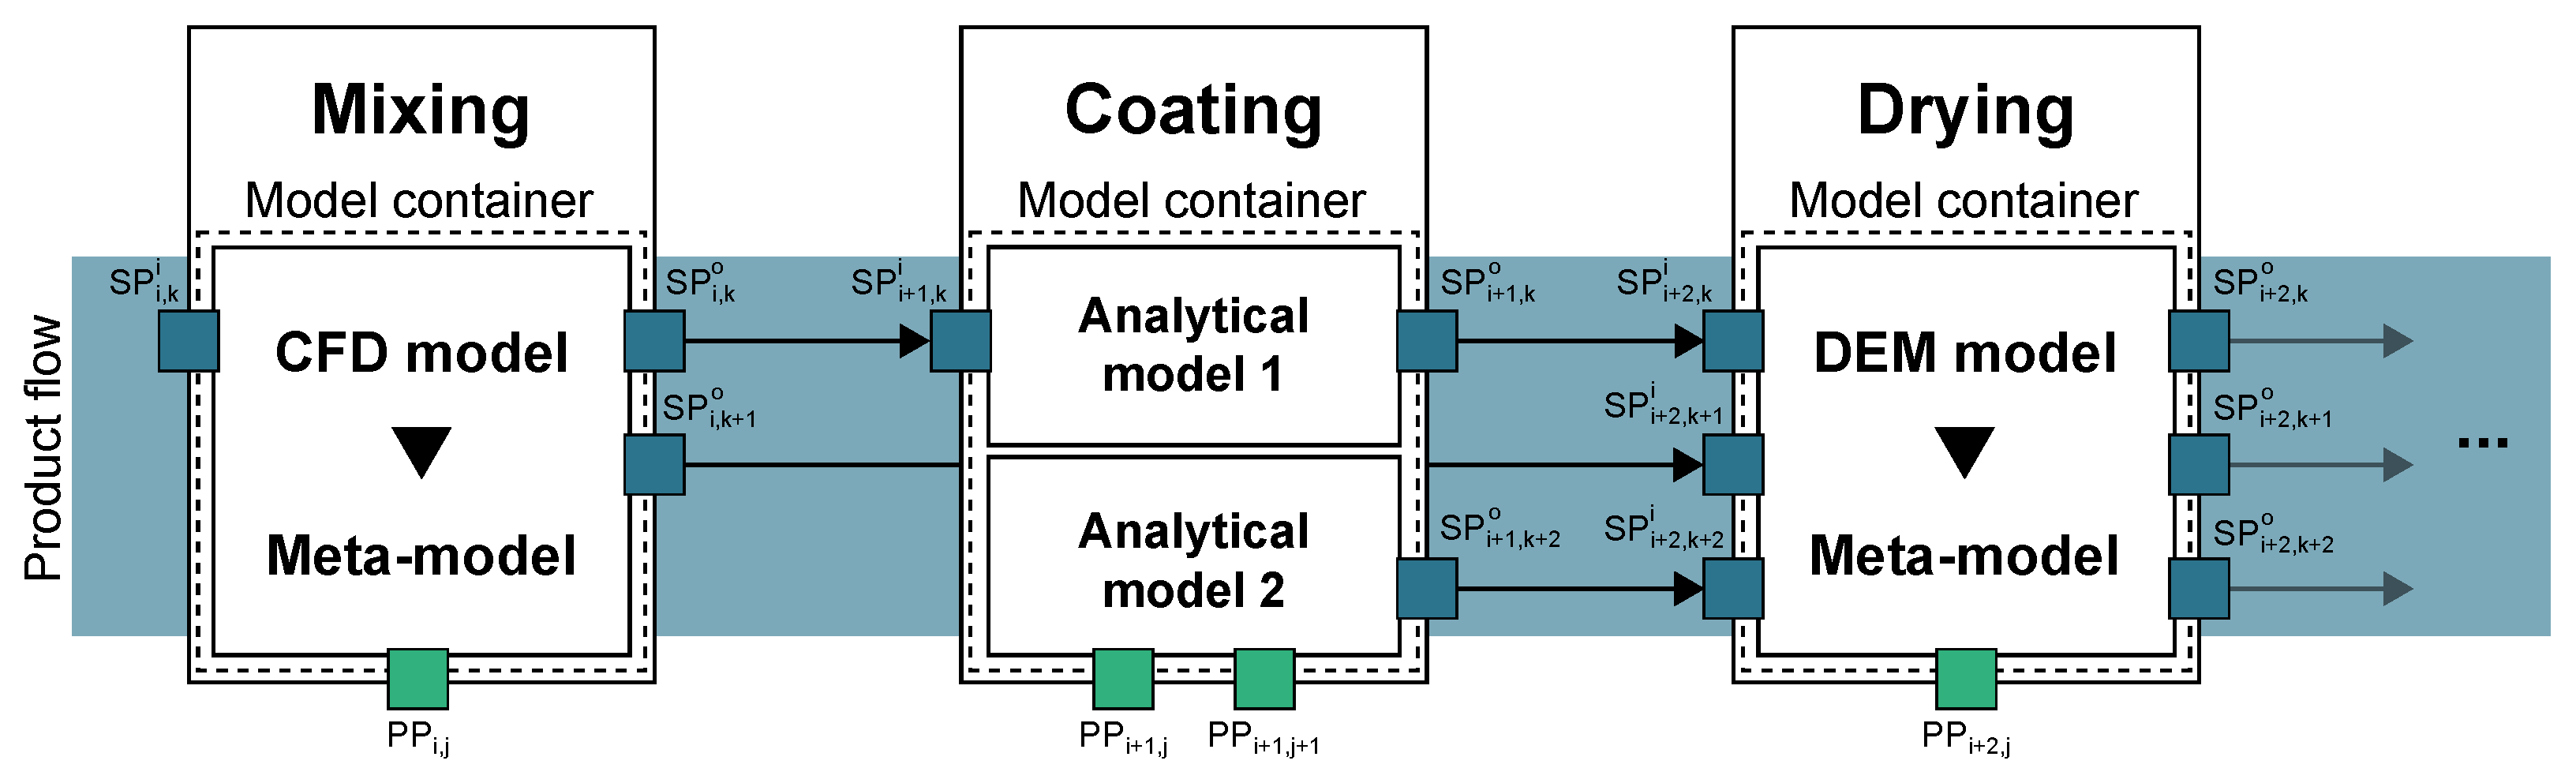
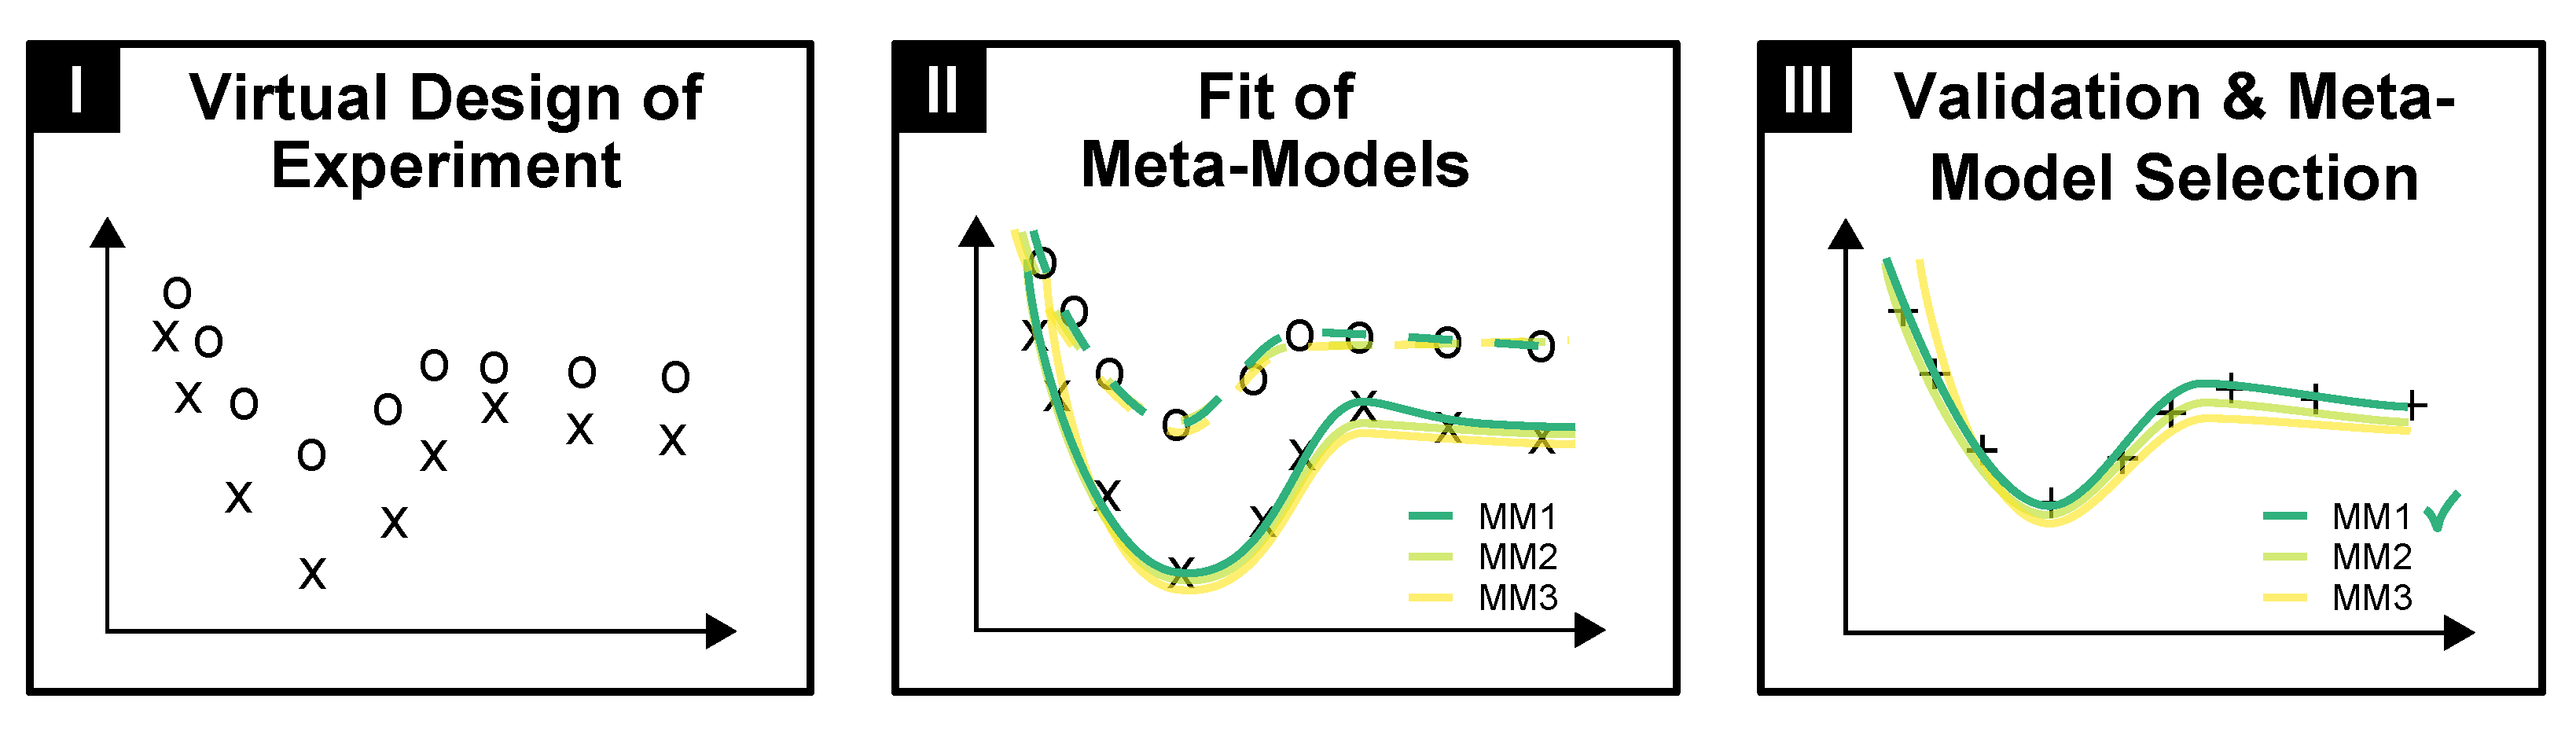
2.2.1. Meta-Modeling of Bottom-Up Models

Coupling of bottom-up models into an integrated process chain model causes significant challenges since various software environments must be coupled for the respective process model and controlled with a suitable middleware. In addition, the computational effort of DEM, CFD, or FEM simulations for single-process steps alone already results in long computation times (≫hours), which can add up to multiple days for the entire process chain. Target-oriented decision support for product design or even in-line control in the production process as part of a cyber-physical production system [13] can therefore not be realized with numerical models. Consequently, a meta-modeling of the original bottom-up model was proposed. The meta-model can approximate the complexity of the results of the bottom-up model by a variety of data-based models. These data-based approximations can be implemented in a single programming software such as Python. In addition, the computation times can be reduced to a few seconds, which allows an in-line implementation of the platform concept of the battery cell production and battery cell.
The meta-modeling consists of three steps (Figure 4). In the first step, a virtual Design of Experiment (DoE) is conducted on the numerical model. The procedure of the virtual DoE mimics the DoE for physical experiments and is used to determine how and how much each input parameter (process parameter and structural parameter) affects the output parameter of the process model. For this purpose, the DoE proposes a systematic approach that takes into account possible higher-order interactions between the input parameters while minimizing the number of simulation runs.
Minimum, medium, and maximum values of the input parameters were included to achieve a comprehensive coverage of the respective design space. The result of the virtual DoE was a table of input parameter configurations with the respective calculated output parameter values using the numerical model. The necessary sample size for the DoE was determined by the number of input parameters and the order of their interaction. In addition, potential stochastic variations within the numerical model, e.g., through random particle placement at the beginning of a simulation, may require a repeated computation of the virtual DoE to consider the variations within the model.
In the second step, different meta-models were fit to the input–output parameter data from the virtual DoE. The goal was to achieve a minimal deviation between the data of the virtual DoE and the meta-model. Suited meta-models include linear regression, artificial neural networks, polynomial chaos expansion, and Kriging. Different meta-models should be tested and compared regarding, e.g., their root-mean-square-error, goodness of fit, or Akaike information criterion.
In the third step, new test data were selected within the previously defined design space to verify that the meta-models not only fit but are also able to predict the model outputs. The best fitting meta-model was selected based on the evaluation criteria determined for the training and test data. Since meta-models are purely data-based and thus do not describe causation but correlation, meta-models should not be used for extrapolation outside the design space.

2.2.2. Combining Process Models to Formulate the Process Chain Model

The meta-models and analytical models of the different process steps can be combined to a process chain model, which can then be used to determine the structural parameters of the intermediate and final products. For this purpose, the structural parameters of the raw material and the process parameters of the different process steps must be defined. Based on the respective process model, the structural parameters for the subsequent intermediate products and the final product can be determined. In order to account for the deviations along the process chain, the structural parameters of the raw material and the process parameters must be characterized by uncertain parameters. The respective distribution of the parameter can be described by either defined (e.g., via normal, log-normal, or uniform) or non-parametric (e.g., Kernel density estimation) distribution functions. The uncertain structural parameters of the raw material and the process parameters indicate that the structural parameters in the following process steps are also uncertain. The deviations of the structural parameters can mitigate or build up during their propagation along the process chain due to the impact of the process model.
In order to represent the material flow of the production line with the process chain model, the intermediate products of each process must be discretized in defined segments, e.g., the suspension volume during mixing or the length of the electrode. For these defined segments, the deviating structural parameters of the respective intermediate products are then determined using a Monte Carlo simulation of the process model. The uncertain structural parameters represent a stochastic rather than a spatially resolved characterization of the defined segment. The Monte Carlo approach allows for deviations within a battery cell (subcell) but also between different battery cells (cell-to-cell) [27]. Figure 5 shows an example of the uncertainty of a structural parameter that changes during the production process. Cell-to-cell variations can be caused not only by stochastic variations but also by systemic changes in the process over time, e.g., due to heating of the machine. The low computational effort for analytical models and meta-models enables larger sample sizes to approximate the respective distribution of the structural parameter. At the end of the process chain model, the uncertain structural parameters of the final battery cell are transferred to the battery cell model.

2.3. Battery Cell Model (II)

The process chain model defines the structural parameters of the final product at the end of the manufacturing process. However, the quality of the lithium-ion battery cell is rated by performance characteristics during the operation. Hence, the battery cell model must be able to provide a result concerning the functionality during operation of the battery cell based on the structural parameters of the final product. Thus, functionality includes aspects such as general performance considerations (e.g., capacity and energy density), aging, and safety. The choice of the battery cell model highly depends on the objectives.
Modeling the operation of lithium-ion battery cells is complex, due to various physical processes interacting on multiple lengths and timescales. Selecting a suitable model in terms of complexity and computational cost is of high interest for the modeling framework. In general, electrochemical models can be divided into three categories: (i) lumped electrochemical models, (ii) Doyle–Fuller–Newman (DFN)-type models, and (iii) electrochemical full-3D models. The models are listed according to increasing complexity. The lumped electrochemical models (i) are non-discretized models without consideration of physicochemical principles. They allow fast calculation, but the models are based on fitting experimental data; therefore, the prediction for different battery functions is poor. The Doyle–Fuller–Newman-type models (ii), often referred to as the Pseudo-2-Dimensional (P2D) model, are commonly applied in the literature [16,17,28,29,30]. Those models consider discretized mass and charge transport in one linear coordinate in the electrolyte and electrode and one radial coordinate in the active material particle. The chemical and electrochemical kinetics are also incorporated in the model. Consideration of various physical processes leads to more accurate predictions in terms of battery operation and consequently enables design optimization of the battery cell [18]. However, homogenization of the electrode volume simplifies the various processes, and local effects, like lithium plating, cannot be considered in detail. The DFN-type models are widely applied, and several extensions are available for increased model precision. The electrochemical full-3D models (iii) consider the three-dimensional electrode microstructure [31]. It can be an artificial structure generated by a stochastic approach or a reconstruction based of, e.g., micro-computed tomography (micro-CT) or focused ion beam scanning electron microscope (FIB-SEM) images. The models consider the spatial current distribution and thus are able to represent local effects of the microstructure on the physical processes.
In general, each presented model approach can be implemented as a battery cell model within the modeling framework. However, the following requirements should be considered: The model should be able to estimate different performance characteristics and parameters, e.g., charge/discharge behavior, internal resistance, and aging. These should be correlated to the structural parameters of the electrode and cell, material parameters, cell design, and battery operation. Furthermore, the model must be able to not only represent the functionality but also predict certain effects. Therefore, physical-based models like the DFN type models and the electrochemical full-3D models are preferred for application. When investigating uncertainties within the battery production, a large number of model runs are required, resulting in high computational costs. Hence, in the following, the less computationally intensive DFN-type models are applied within the modeling framework.
However, certain extensions are necessary since the process chain model does not provide all necessary parameters for the DFN-type models. Beside structural parameters, characteristic material parameters like the active surface area of the electrode, the effective diffusivity within the particles as well as the electrolyte, and the effective electrical and ionic conductivity of the electrolyte are required to determine the electrochemical performance of the battery cell using a DFN-type model. These effective parameters can be modeled based on the structural parameters of the electrodes, e.g., according to [32,33]. Both the additional parameters and the structural parameters from the process chain model are defined as battery model parameters (BMPl). Various models can be found in the literature to calculate the additional parameters based on the structural parameters. While conventional approaches such as the Bruggeman correlation for calculating the tortuosity only provide a rough estimate of the physical property of the electrode [34], more recent approaches were presented by [32,33] that reflect the three-dimensional structure of the electrode, thus providing a more accurate description of the additional parameters. The battery model parameters can then be used in a DFN-type model to compute the performance of the battery cells.

2.4. Analysis (III)

The analysis module represents a collection of mathematical methods to derive knowledge from the simulation results of the process chain and the battery cell model. Depending on the mathematical method, both the absolute impact as well as the impact of uncertain input parameters on output parameters can be analyzed. The former addresses how discrete changes in an input parameter affects the output parameter of a model, while the latter considers the effects of deviation around a mean value. The consideration of uncertain parameters is particularly important against the background of the high quality requirements and the still high reject rates in battery production. Valuable methods are the robust optimization to identify stable production points that result in low deviating performance characteristics. Moreover, new methods can be developed to generate further knowledge, e.g., a model-based identification of production tolerances [35].
Furthermore, uncertainty analysis and sensitivity analysis are widely used methods to quantify the propagation of uncertain parameters within a model and to identify particularly sensitive input parameters. The parameters considered in the process chain model and the battery cell model form an interwoven network of highly interdependent parameters with many opposing process-product mechanisms that impede the identification of sensitive parameters. Sensitivity analysis methods such as the variance-based analysis of covariance (ANCOVA) indices method can be used to not only identify but additionally quantify the sensitivity of the input parameter uncertainty on the output parameter uncertainty. The ANCOVA method belongs to the Global Sensitivity Analysis (GSA) methods, which do not only focus on the nominal value of a measurement (such as derivative-based methods) but rather explore the role of parameter uncertainty. Additionally, GSA investigates the impact of combined input parameter variations on the output parameter uncertainty instead of only one-at-a-time methods where input parameters are changed individually, which is why GSA methods reflect the complexity of battery production more accurately. ANCOVA indices quantify the contribution of an input parameter to the variance of the output parameter, i.e., when the uncertainty of an input parameter is removed, the uncertainty of the output parameter is reduced by the value of the input parameter sensitivity index. The ANCOVA method is easily interpretable and is based on the ANCOVA decomposition developed by [36]. For a given model with output Y, where each parameter X i is uncertain:
Y = f X 1 , X 2 , , X k
the response is decomposed into partial variances and covariances. A functional decomposition, unknown for a given model, is required to perform the covariance decomposition. The functional decomposition of model M ( X ) is specified by:
M X = M 0 + i = 1 n M i X i + 1 i , j n M i , j X i , X j + + M 1 , , n X
The ANCOVA indices are formulated on the basis of the ANCOVA decomposition and the variance-covariance separation of the partial variances, which are the uncorrelated and the correlated effects [37]:
S i = C o v [ M i x i , Y ] V a r [ Y ]
S i U = V a r [ M i x i ] V a r [ Y ]
S i C = C o v [ M i x i , Y M i x i ] V a r [ Y ]
where S i denotes the total share of variance of Y due to x i ; S i U represents the uncorrelated share of variance of Y due to x i ; and S i C describes the correlated share of variance of Y resulting from x i . The total share of variance of an input variable is the sum of the respective uncorrelated and the correlated share:
S i = S i U + S i C
The ANCOVA indices method is related to the more widely known Sobol’ method. However, the ANCOVA method can also consider dependent input parameters, where the Sobol’ method is limited to independent input parameters. This is critical for larger parameter networks based on nested models such as in the present framework. An extensive description of the ANCOVA indices can be found in the literature [37]. The use of ANCOVA indices represents one potential analysis function that allows to benefit the digital representation from the process chain and the battery cell.

3. Use Case

3.1. Exemplary Implementation

In the following, the modeling framework is applied to a use case in which the sensitivities of the input parameters of the process chain model on the capacity and volumetric energy density of the battery cell are determined. This allows to identify the respective parameters that provide the largest potential to reduce the uncertainty of the battery cell performance. The process parameters of the process chain model are adjusted in such a way that a reference cathode of the German Federal Ministry of Education and Research (BMBF) competence cluster ProZell with a mass loading of 14.3 mg cm−2 and a coating density of 2.95 g cm−3 is created virtually. A normal distribution with a standard deviation of 0.5% was assumed for the formulation parameters and process parameters for all processes, resulting in subcell deviation. Material-intrinsic parameters such as the particle density of the individual materials (active material, conductive additive, and polymer binder) were set constant. Cell-to-cell deviations due to temporal changes in the production processes were not regarded. A product-oriented workflow of the combined process chain and battery cell models was selected where the mass loading and the energy density were predefined by the reference cell. Subsequently, the influence of propagating uncertainties along the process chain and into the battery cell were investigated, and a sensitivity analysis was conducted as part of the analysis module. Since the process chain model exclusively focuses on the production of cathodes, only a cathode half-cell P2D model was implemented to evaluate the performance properties. The sensitivity analysis is an extension of the previously published work in [9] and focuses on the composition of the dry mixture and slurry as well as the processing of the coating on the substrate.

3.2. Process Chain Model

The process chain model focuses on the process steps of the electrode production. The individual process models are predominantly analytical models except for the drying process, which is described by a meta-model of a discrete-element-method model. Within the dry mixing and dispersion process, the densities of the dry mixture ρ s o l i d s (Equation (8)) and the slurry ρ s l u r r y (Equation (9)) are characterized by:
ρ s o l i d s = ( ω A M ρ A M + ω C A ρ C A + ω P B ρ P B ) 1
ρ s l u r r y = ( x s o l i d s · ( ω A M ρ A M + ω C A ρ C A + ω P B ρ P B ) + ( 1 x s o l i d s ρ s o l v e n t ) ) 1
where ω represents the mass fraction and ρ the density of the active material (AM), conductive additive (CA), and polymer binder (PB). x s o l i d s is the solid content of the slurry and ρ s o l v e n t the density of the solvent. Furthermore, the coating process is based on a slot die coater, where the coating thickness h w e t (Equation (10)) and the mass loading m w e t (Equation (11)) of the wet film are modeled according to [38]:
h w e t = V ˙ v · w
m w e t = ρ s l u r r y · h w e t
V ˙ , v, and w are the volume flow of the slurry provided by the pump, the substrate velocity, and the coating width, respectively.
For the drying process, the dry mass loading m d r y is computed using Equation (12)
m d r y = m w e t · x s o l i d s
The structure formation during the drying process was simulated using a purely DEM-based simulation (Figure 6). The active material is represented by means of a discretized particle size distribution consisting of five different size classes and the carbon black by means of monodisperse agglomerate particles for computational reasons. As shown by Bockholt and colleagues, the dry mixing process has a high influence on the appearance of the carbon black and on its porosity [39]. One third of the carbon black volume was assumed in this case as a carbon black film on the AM particles, while two thirds of the porous black volume is represented by the carbon black agglomerates. The wet film thickness was assumed as the initial layer height. The particles were randomly distributed within the wet film. The viscous fluid friction was represented using Stokes friction assuming the fluid viscosity of a binder solution. Van der Waals forces between particles were also considered by implementing a corresponding model in the contact model. The subsidence of the fluid surface was simulated by the sinking of a plate pushing the particles towards the flow collector. Since there is a constant evaporation rate during the first structure forming drying phase, a constant velocity was assumed for the sinking velocity of the plate [40]. A significant increase in the forces acting on the plate indicate reaching the final layer thickness.
The results of the DEM model were transformed into a data-based meta-model (Figure 7). Since only the wet mass loading was changed as input for the drying model and not the process parameter film shrinking rate in the present use case, a meta-model with a single independent variable can be determined, which reduces the amount of necessary simulations in the design of experiment. For this purpose, the porosity for seven different wet mass loadings ranging from 14.2 to 35.4 mg cm−2 were computed to provide a sufficient data basis for the meta-model. The DEM simulation at each of the seven different input wet mass loadings was repeated five times for stochastically varying particle configurations of the cathode. The resulting porosity data were fitted with a linear, quadratic, and exponential regression function. The exponential function shows the highest agreement with the DEM data, i.e., a higher coefficient of determination R2 or a lower root mean square error RMSE and a corrected Akaike information criterion AICc, which is why it was selected as the meta-model for the drying process.
Moreover, the coating thickness h d r y after drying (Equation (13)) and the density of the coating ρ d r y after drying (Equation (14)) can be determined analytically:
h d r y = m d r y ρ s o l i d s · ( 1 ϵ d r y )
ρ d r y = m d r y / h d r y
For the calendering process, the porosity after calendering ϵ c a l was modeled according to a semi-empirical approach developed by [24] (Equation (15)):
ϵ c a l = ϵ m i n + ( ϵ d r y ϵ m i n ) · e x p ( q L γ c )
The minimal porosity ϵ m i n is a structural parameter, which can be determined experimentally by calendering electrode sheets at a minimal calendering gap. The line load q L is a process parameter that reflects the load acting on the electrode between the calender rolls. Finally, the compaction resistance γ c is a characteristic parameter of the electrode and is influenced by the temperature of the calender rolls and the mass loading [26]. The coating thickness and the coating density after the calendering process can be modeled similarly to the respective models presented for the drying process (Equation (13)). Finally, the solid phase volume fractions of the materials X i (active material, conductive additive, and polymer binder) were modeled according to their geometric volume contribution (Equation (16)):
X i = ( 1 ϵ c a l ) · ω i ρ i ω i ρ i
The considered process chain ends after the calendering process. The related model provides key characteristics of the cathode via the structural parameters along the process chain. The subsequent battery cell model consisting of a structure surrogate model and a P2D model focuses on the electrode level, which is why the cell assembly can be omitted in the use case. The initial formulation, raw material, and process parameters as well as the resulting structural parameters of the intermediate products are summarized in Appendix A Table A2.

3.3. Battery Cell Model

The process chain model ends with the calendering process, where the ensuing structural parameters are passed on to the battery cell model, which was introduced in Section 2.3. The first part of the battery cell model, the structure surrogate model, computes the effective transport parameters for the electrochemical model, namely, the effective electrical conductivity, the active surface area, and the effective tortuosity. The structure surrogate model applied in the framework was developed by [33]. In a first step, it stochastically generates three-dimensional voxel-based microstructures (Figure 8) and subsequently converts them into resistor networks to evaluate their effective electric and ionic conductivity, diffusivity, and active surface area as a function of structure properties such as composition and material distribution. This allows a more realistic prediction of effective parameters than conventional approaches such as the Bruggeman relation [34], since it takes into account not only the porosity but also the volume fractions of the solid phase [32], the particle sizes and their distribution [33,41], and the spatial distribution of the particles [33]. Due to the high computational expense of creating and evaluating the actual microstructure with the 3D structure model, a semi-empirical surrogate model using simplified algebraic equations was trained to reproduce the effective parameters as a function of the electrode structure [32].
Subsequently, these effective parameters, i.e., the effective electrical conductivity of the solid phase κ s , e f f , the electrochemically active surface area a s , and the effective tortuosity τ e f f were transferred to the electrochemical model, which carries out a discharge simulation to determine the volumetric energy density of the manufactured cathode. A complete overview of the input parameters for the P2D model can be found in Table A2 in Appendix A. The implemented model was a half cell cathode P2D model, where the governing equations were taken from [9]. The model was parameterized using experimental discharge curves: a formation curve was used for the initial and maximum capacities in the solid phase, c 0 and c m a x , and curves with different discharge current densities were used for the solid diffusion coefficient, D s , the reaction rate constant in the Butler–Volmer equation, k, and the intrinsic electronic conductivity of the active material, κ A M .

3.4. Analysis

The product-oriented simulation workflow was used to investigate the propagation of the uncertain formulation and process parameters along the process chain and into the final performance properties. For this purpose, the process parameters for the process chain model were determined iteratively to obtain the target values for the mass loading and density after calendering: 14.3 mg cm−2 and 2.95 g cm−3, respectively. A standard deviation of 1% was assumed for the formulation and process parameters. Material-intrinsic parameters such as the densities were considered constant. A comprehensive overview of the process and structural parameter values can be found in Table A2 in Appendix A. The structural parameters were transferred to the structure surrogate model to compute the battery model parameters. Finally, the battery model parameters were utilized to determine the performance properties of the battery cell. The volumetric energy density and the discharge capacity for the given battery cell were 1892 ± 8 Wh L electrode 1 and 2.41 ± 0.07 mAh cm−2, respectively, for a current density of 1 mA cm−2 (approx. 0.4 C). The volumetric energy density is solely related to the volume of the cathode coating and not the volume of the battery cell.
The focus of the use case is to identify the input parameters with the largest impact on the uncertainty of the performance characteristics using the ANCOVA method. The ANCOVA indices are used to identify the sensitivities between the different parameters’ domains: process parameters (including formulation parameters), structural parameters, and performance properties. The battery model parameters were considered implicitly by integrating the ANCOVA of the structure surrogate model with the P2D model. The ANCOVA sensitivities for the process chain model were estimated using the OpenTURNS library in Python [42]. To determine the individual sensitivity indices, the process models of the process chain model must first be transformed into nested models to enable calculation of the structural parameters using only the process parameters, the formulation parameters, and the starting raw material parameters. Accordingly, the sensitivities of the structural parameters of each process step can be determined as a function of the initial input parameters. Since the initial input parameters are independent, the uncorrelated indices S i U equal the total share of variance S i . Next, the sensitivity indices for the battery model parameters were determined. However, the structural parameters at the end of the process chain model are dependent since they are the result of the same input parameters, which is why correlated ANCOVA indices must be considered. The following matrix shows the correlation between the structural parameters (in order from top to bottom: weight fraction of the active material ω A M and conductive additive ω C A (weight fraction of polymer binder ω P B was determined implicitly by subtracting ω A M and ω C A from 1 in order to ensure mass balance, which is why it does not need to be considered in the correlation matrix), dry mass loading m d r y , and density of the calendered coating ρ c a l ) that are the input to the battery cell model:
R = 1 0.007 0.122 0.965 0.007 1 0.026 0.069 0.122 0.026 1 0.063 0.965 0.069 0.063 1
The ANCOVA indices for the performance properties were determined as a function of the battery model parameters. The ANCOVA sensitivities for the battery cell model were estimated by applying UQLab, an open source MATLAB-based software framework for uncertainty quantification with a focus on academic research [43]. Following [43], the ANCOVA sensitivities in the framework were determined based on a polynomial chaos expansion (PCE). The PCE is a meta-model representing the battery cell model. It is generated by sampling the computational models by a suitable built basis of polynomial functions. Further information regarding PCE can be taken from the literature [44,45] including its use for sensitivity [46]. The validity of the estimated PCE-based meta-model for the P2D model is shown in Figure 9, where the model response of the computational P2D model and the meta-model are displayed for the same set of input parameters.
The overall sensitivities between the different parameter domains are visualized in a Sankey diagram (Figure 10) to provide an intuitive approach about the sensitivity propagation within the parameter network. While it is tempting to multiply the individual sensitivity indices by the different parameter domains to directly determine the impact of the process parameter uncertainty on the performance properties, such a combination is only allowed for strictly linear models where the respective variances can be decomposed individually. Since the utilized models are non-linear, multiplying the sensitivity indices does not result in an accurate depiction of the sensitivities along multiple models. Consequently, the incoming and outgoing sensitivity flows in the Sankey diagram do not necessarily need to be equal. The approach allows to identify and quantify the sensitivities and additionally provides a visual approach for the sensitivities bridging the different parameter domains. For the given scenario, the sensitivities of the weight fractions, the dry mass loading, and the coating density were identified as the structural parameters and the process parameters, respectively (the weight fractions as formulation parameters were assigned to the process parameters), that serve as input for the battery cell model.
The sensitivities in the process chain model were heterogeneously distributed over all process parameters. It can be noted that the uncertainty of the process parameters that belong to the formulation (weight fractions and solids content) indicated a larger impact on the structural parameters at the end of the process chain than the uncertainty of the considered process parameters for coating (slot die width, volume flow, and web velocity) or calendering (line load) for a scenario where all process parameters deviate equally with a standard deviation of 1% from the mean. Here, it must be emphasized again that the sensitivity indices focus on the uncertainty influence of an input parameter and not on its nominal influence. Exemplarily, no significant influence of line load uncertainty on the coating density uncertainty after calendering can be observed for the defined production scenario, although there was clearly a strong nominal influence where increased line load causes increased coating density. The reason behind local insensitivities in this case can be low local gradients in the model.
Although a partially strong correlation of the dry mass loading, coating density, and weight fractions occur at the end of the process chain model (see correlation matrix in Equation (17)), the ANCOVA analysis of the battery cell model reveals only low correlated ANCOVA indices for the investigated performance properties volumetric energy density and discharge capacity (Table 1).
Based on the ANCOVA sensitivity indices, the most influential input parameter for the volumetric energy density was the weight fraction of the active material and, for the discharge capacity, the dry mass loading. The total ANCOVA sensitivities of the discharge capacity were slightly increased due to the correlative contributions. The sensitivity to volumetric energy density was highest for the weight fraction of the active material, since the fraction of active material essentially determines the energy storage capability per volume. The density of the calendered coating has a smaller though significant effect on the sensitivity in this scenario but is likely to have a greater effect on the sensitivity at higher C-rates when kinetic limitations of the physico-chemical processes (diffusion, migration, and reaction) occur. The discharge capacity is area-related and thus predominantly impacted by the dry mass loading. Consequently, an increase in mass loading essentially increases the amount of active material being able to store lithium and thus increases the capacity.
In order to decrease the uncertainties in the volumetric energy density or discharge capacity, the Sankey diagram can be analyzed to identify the main levers between the different parameter domains. The Sankey diagram for the scenario studied shows that the reduction in the uncertainty of the weight fraction of the active material causes the largest reduction in the uncertainty of the volumetric energy density, both directly and via the coating density. Similarly, the uncertainty in the discharge capacity can be most effectively reduced by lowering the uncertainty in the weight fraction of the active material and by reducing the uncertainty in the process parameters of the coating process. When analyzing the sensitivities in the process chain and the battery cell model, it must be considered that the sensitivity indices are only valid for the selected input parameter uncertainty and nominal values. In case any of the two are changed, the sensitivity indices must be recalculated.

4. Conclusions

A comprehensive framework to model process-product interdependencies in battery production was presented. The framework consists of a process chain model, a battery cell model, and an analysis module and is based on the process–structure–performance relationship. The process chain model describes how the processes affect the structure of the intermediate and final products, and the battery cell model characterizes how the structure impacts the battery cell performance. The framework operates on a modular platform concept in which the different models are seamlessly connected via the sharing of different structural and battery model parameters. While theoretically both mechanistic and data-based models can be integrated into the platform, the use of mechanistic models is preferred as those allow extrapolation beyond the initially investigated design space. The mechanistic models can be differentiated into quick-to-solve analytical models and computationally-intensive numerical models. In order to provide model results in a reasonable time span, numerical models were subjected to a meta-modeling approach in which the results of a virtual design of experiments are used to fit suitable data-based methods that can be integrated into the platform. By combining the different models, a digital representation of the process chain and the battery cell was established, which offers a non-expensive environment for targeted experiments regarding different production- and product-related aspects, e.g., cell performance or process quality. The process chain and battery cell modules were complemented by an analysis module that provides different mathematical methods to generate knowledge of the process chain and the battery cell. The methods include—but are not limited to—uncertainty and sensitivity analyses in order to investigate the propagation of parameter uncertainties and quantify the impact of input parameter uncertainty on output parameter uncertainty.
The framework was applied to a use case in which the sensitivity of process parameters on performance properties was analyzed for the cathode production. The process chain model comprised the process steps of mixing, dispersion, coating, drying, and calendering. The drying process was modeled with a DEM approach and consequently transformed into a meta-model. For the battery cell model, a combined structure surrogate model and a Pseudo-2-Dimensional model was applied. The performance characteristics as well as the required process parameters were determined for a defined cathode structure. The ANCOVA method was used to quantify the sensitivities along the different parameter domains. Finally, the sensitivities spanning the different parameter domains were visualized in a Sankey diagram to enable an intuitive analysis of the sensitivities within the process chain and the battery cell.
In conclusion, sensitive input parameters were identified and adjusted to reduce the final output parameter uncertainty. Transferred to the real production, this means that the levers along the process chain that promote a high fluctuation of the final performance properties can be identified in a targeted and systematic manner. This analysis function thus makes an important contribution to improving the required process quality in battery cell production, which can reduce the environmental impact of battery production.
Overall, implementing the framework and conducting digital experiments allows a targeted decision support for the product and production design, which provides a significant benefit for the production and product quality as well as the environmental impact of battery production. Besides identifying the impact of different process parameters on the final battery cell performance, the framework can also be actively employed in product development to determine optimal structural parameters of the electrodes regarding different target criteria (e.g., energy density and robustness), which can then be used as target values for the process chain model. In the future, the digitalization platform for mechanistic models holds the potential for a model-based control in real-time in the different process steps as part of a cyber-physical production system. For this purpose, more process models need to be further implemented in the platform to describe the most relevant process-product interactions along the process chain, especially focusing on the anode production and cell assembly. Furthermore, the process chain model will be extended by considering the material and energy flows along the process chain via a model of the production chain. First approaches for material and energy flow models in battery production have already been presented, e.g., in [47], and allow to include further production-relevant performance indicators such as the required energy demand or the utilization of the machines.

Author Contributions

Conceptualization, M.T., O.S., H.K. and M.L.; methodology, M.T. and O.S.; validation, M.T., O.S., H.K. and M.L.; writing—original draft preparation, M.T., O.S., G.V.S., H.K. and M.L.; writing—review and editing, G.V.S., U.K., D.S., A.K. and C.H.; visualization, M.T., O.S. and H.K.; supervision, U.K., D.S., A.K. and C.H.; project administration, M.T., O.S., G.V.S., H.K., U.K., D.S. and C.H.; funding acquisition, U.K., A.K. and C.H. All authors have read and agreed to the published version of the manuscript.

Funding

The authors gratefully thank the German Ministry of Education and Research (BMBF) for funding this work in the project Sim4Pro (03XP0242A).

Institutional Review Board Statement

Not applicable.

Data Availability Statement

Not applicable.

Acknowledgments

The authors would like to thank Alexander Diener and the project MiKal within the BMBF competence cluster ProZell for providing electrode data for the parametrization and validation of the DEM model. We acknowledge support by the Open Access Publication Funds of Technische Universität Braunschweig.

Conflicts of Interest

The authors declare no conflict of interest.

Appendix A

Table A1. Overview of included formulation, process, and structural parameters for the process chain model.
ParameterUnitResults
Formulation ω A M -0.94 ± 1.0%
ω C A -0.03 ± 1.0%
ω P B -0.03 ± 1.0%
x s o l i d -0.7 ± 1.0%
Raw material ρ A M g cm−34.75
ρ C A g cm−31.80
ρ P B g cm−31.70
ρ s o l v e n t g cm−31.03
Mixing ρ s o l i d s g cm−34.31 ± 0.9%
Dispersion ρ s l u r r y g cm−32.20 ± 1.2%
Coating V ˙ cm3 h−1696 ± 1.0%
vm min−11.0 ± 1.0%
wmm125 ± 1.0%
h w e t µm92.8 ± 1.7%
M w e t mg cm−220.5 ± 2.1%
Drying ϵ d r y %43.9 ± 0.3%
m d r y mg cm−214.3 ± 2.8%
h d r y µm59.2 ± 2.6%
ρ c o a g cm−32.42 ± 0.9%
Calendering q L N mm−184 ± 1.0%
ϵ m i n %17.6 ± 0.3%
γ c N mm−1129 ± 2.4%
ϵ c a l %31.5 ± 0.4%
h c a l µm48.5 ± 3.0%
ρ c o a g cm−32.95 ± 0.9%
X A M -0.58 ± 0.3%
X C A -0.05 ± 1.3%
X P B -0.05 ± 1.2%
Table A2. Battery model parameters used in the applied model previously presented in [9]. The diffusion coefficient in the electrolyte, ionic conductivity, and transference number are a function of the electrolyte concentration. (* CBM—carbon binder matrix).
ParameterSymbolUnitSeparatorCathode
Coating thickness δ m-4.85 × 10⁻⁵
Porosity ϵ -0.50.315
Particle size R p m-5.5 × 10⁻⁶
Tortuosity τ -15.9449
Maximum capacity solid c m a x mol m−3-4.3221 × 10⁴
Initial capacity solid c 0 mol m−3-1.5467 × 10⁴
Initial capacity electrolyte c e mol m−3-1 × 10³
Diffusion coefficient solid D s m2 s−1-9.5594 × 10⁻¹⁵
Diffusion coefficient electrolyte D e m2 s−1- f ( c L i ) [48]
Electronic conductivity AM κ A M S m−1-0.0309
Electronic conductivity CBM * κ C B M S m−1-760
Ionic conductivity κ e S m−1- f ( c L i ) [48]
Transference number t p -- f ( c L i ) [48]
Charge transfer coefficient α --0.5
Reaction rate constantks−1-1.1717 × 10⁻⁹
Double layer capacitance C D L F m−2-0.2

References

  1. IEA. Tracking Transport 2020; Technical Report; IEA: Paris, France, 2020. [Google Scholar]
  2. Niestadt, M.; Bjørnåvold, A. Electric Road Vehicles in the European Union Trends, Impacts and Policies; Technical Report April; European Parliament Briefing: Strasbourg, France, 2019. [Google Scholar]
  3. WEF. A Vision for a Sustainable Battery Value Chain in 2030 Unlocking the Full Potential to Power Sustainable Development and Climate Change Mitigation; World Economic Forum: Geneva, Switzerland, 2019. [Google Scholar]
  4. Henze, V. Battery Pack Prices Cited below $100/kWh for the First Time in 2020, While Market Average Sits at $137/kWh; Bloomberg New Energy Finance: New York, NY, USA, 2020. [Google Scholar]
  5. Michaelis, S.; Rahimzei, E. Roadmap Batterie-Produktionsmittel 2030–Update 2020; VDMA: Frankfurt am Main, Germany, 2020. [Google Scholar]
  6. Kwade, A.; Haselrieder, W.; Leithoff, R.; Modlinger, A.; Dietrich, F.; Droeder, K. Current status and challenges for automotive battery production technologies. Nat. Energy 2018, 3, 290–300. [Google Scholar] [CrossRef]
  7. Primo, E.N.; Touzin, M.; Franco, A.A. Analyzing the Link Between Process Parameters and Electrode Properties by Advanced Statistics. Batter. Supercaps 2021, 4, 834–844. [Google Scholar] [CrossRef]
  8. Turetskyy, A.; Thiede, S.; Thomitzek, M.; Drachenfels, N.V.; Pape, T.; Herrmann, C. Toward Data-Driven Applications in Lithium-Ion Battery Cell Manufacturing. Energy Technol. 2020, 8, 1900136. [Google Scholar] [CrossRef] [Green Version]
  9. Schmidt, O.; Thomitzek, M.; Röder, F.; Thiede, S.; Herrmann, C.; Krewer, U. Modeling the Impact of Manufacturing Uncertainties on Lithium-Ion Batteries Modeling the Impact of Manufacturing Uncertainties on Lithium- Ion Batteries. J. Electrochem. Soc. 2020, 167, 60501. [Google Scholar] [CrossRef]
  10. Kornas, T.; Knak, E.; Daub, R.; Bührer, U.; Lienemann, C.; Kampker, A.; Thiede, S.; Herrmann, C. A Multivariate KPI-Based Method for Quality Assurance in Lithium-Ion-Battery Production. Procedia CIRP 2019, 81, 75–80. [Google Scholar] [CrossRef]
  11. Ngandjong, A.C.; Lombardo, T.; Primo, E.N.; Chouchane, M.; Shodiev, A.; Arcelus, O.; Franco, A.A. Investigating electrode calendering and its impact on electrochemical performance by means of a new discrete element method model: Towards a digital twin of Li-Ion battery manufacturing. J. Power Sources 2021, 485, 229320. [Google Scholar] [CrossRef]
  12. Giménez, C.S.; Schilde, C.; Froböse, L.; Ivanov, S. Mechanical, Electrical, and Ionic Behavior of Lithium-Ion Battery Electrodes via Discrete Element Method Simulations. Energy Technol. 2019, 8, 1900180. [Google Scholar] [CrossRef]
  13. Turetskyy, A.; Wessel, J.; Herrmann, C.; Thiede, S. Data-driven cyber-physical System for Quality Gates in Lithium-ion Battery Cell Manufacturing. Procedia CIRP 2020, 93, 168–173. [Google Scholar] [CrossRef]
  14. Hoffmann, L.; Grathwol, J.K.; Haselrieder, W.; Leithoff, R.; Jansen, T.; Dilger, K.; Dröder, K.; Kwade, A.; Kurrat, M. Capacity Distribution of Large Lithium-Ion Battery Pouch Cells in Context with Pilot Production Processes. Energy Technol. 2020, 8, 1900196. [Google Scholar] [CrossRef]
  15. Hitzmann, B.; Herwig, C.; Remelhe, M.P.; Ulonska, S.; Wuerth, L.; Prata, A.; Steckenreiter, T. Between the Poles of Data-Driven and Mechanistic Modeling for Process Operation Do. Chem. Ing. Tech. 2017, 89, 542–561. [Google Scholar] [CrossRef]
  16. Fuller, T.F.; Soc, J.E.; Fuller, T.F.; Doyle, M.; Newman, J. Simulation and optimization of the dual lithium ion insertion cell. Electrochem. Soc. 1994, 141, 1. [Google Scholar] [CrossRef] [Green Version]
  17. Newman, J.; Thomas, K.E.; Hafezi, H.; Wheeler, D.R. Modeling of lithium-ion batteries. J. Power Sources 2003, 121, 838–843. [Google Scholar] [CrossRef]
  18. Witt, D.; Wilde, D.; Baakes, F.; Belkhir, F.; Röder, F.; Krewer, U. Myth and Reality of a Universal Lithium-Ion Battery Electrode Design Optimum: A Perspective and Case Study. Energy Technol. 2021, 9, 2000989. [Google Scholar] [CrossRef]
  19. Lenze, G.; Röder, F.; Bockholt, H.; Haselrieder, W.; Kwade, A.; Krewer, U. Simulation-Supported Analysis of Calendering Impacts on the Performance of Lithium-Ion-Batteries. J. Electrochem. Soc. 2017, 164, A1223. [Google Scholar] [CrossRef]
  20. Thomitzek, M.; Schmidt, O.; Röder, F.; Krewer, U.; Herrmann, C.; Thiede, S. Simulating Process-Product Interdependencies in Battery Production Systems. Procedia CIRP 2018, 72, 346–351. [Google Scholar] [CrossRef]
  21. Giménez, C.S.; Schilde, C.; Fröbose, L.; Finke, B.; Kwade, A. Numerical simulation of the behavior of lithium-ion battery electrodes during the calendaring process via the discrete element method. Powder Technol. 2019, 349, 1–11. [Google Scholar] [CrossRef]
  22. Mayer, J.K.; Almar, L.; Asylbekov, E.; Haselrieder, W.; Kwade, A.; Weber, A.; Nirschl, H. Influence of the Carbon Black Dispersing Process on the Microstructure and Performance of Li-Ion Battery Cathodes. Energy Technol. 2020, 8, 1900161. [Google Scholar] [CrossRef]
  23. Kumberg, J.; Baunach, M.; Eser, J.C.; Altvater, A.; Scharfer, P.; Schabel, W. Investigation of Drying Curves of Lithium-Ion Battery Electrodes with a New Gravimetrical Double-Side Batch Dryer Concept Including Setup Characterization and Model Simulations. Energy Technol. 2021, 9, 2000889. [Google Scholar] [CrossRef]
  24. Meyer, C.; Bockholt, H.; Haselrieder, W.; Kwade, A. Characterization of the calendering process for compaction of electrodes for lithium-ion batteries. J. Mater. Process. Technol. 2017, 249, 172–178. [Google Scholar] [CrossRef]
  25. Meyer, C.; Kosfeld, M.; Haselrieder, W.; Kwade, A. Process modeling of the electrode calendering of lithium-ion batteries regarding variation of cathode active materials and mass loadings. J. Energy Storage 2018, 18, 371–379. [Google Scholar] [CrossRef]
  26. Meyer, C.; Weyhe, M.; Haselrieder, W.; Kwade, A. Heated Calendering of Cathodes for Lithium-Ion Batteries with Varied Carbon Black and Binder Contents. Energy Technol. 2019, 8, 1900175. [Google Scholar] [CrossRef]
  27. Laue, V.; Schmidt, O.; Dreger, H.; Xie, X.; Röder, F.; Schenkendorf, R.; Kwade, A.; Krewer, U. Model-Based Uncertainty Quantification for the Product Properties of Lithium-Ion Batteries. Energy Technol. 2020, 8, 1900201. [Google Scholar] [CrossRef]
  28. Doyle, M.; Fuller, T.F.; Newman, J. Modeling of Galvanostatic Charge and Discharge of the Modeling of Galvanostatic Charge and Discharge of the Lithium/Polymer/Insertion Cell. J. Electrochem. Soc. 1993, 140, 1526. [Google Scholar] [CrossRef]
  29. Colclasure, A.M.; Kee, R.J. Thermodynamically consistent modeling of elementary electrochemistry in lithium-ion batteries. Electrochim. Acta 2010, 55, 8960–8973. [Google Scholar] [CrossRef]
  30. Legrand, N.; Raël, S.; Knosp, B.; Hinaje, M.; Desprez, P.; Lapicque, F. Including double-layer capacitance in lithium-ion battery mathematical models. J. Power Sources 2014, 251, 370–378. [Google Scholar] [CrossRef]
  31. Hein, S.; Feinauer, J.; Westhoff, D.; Manke, I.; Schmidt, V.; Latz, A. Stochastic microstructure modeling and electrochemical simulation of lithium-ion cell anodes in 3D. J. Power Sources 2016, 336, 161–171. [Google Scholar] [CrossRef] [Green Version]
  32. Laue, V.; Röder, F.; Krewer, U. Joint structural and electrochemical modeling: Impact of porosity on lithium-ion battery performance. Electrochim. Acta 2019, 314, 20–31. [Google Scholar] [CrossRef]
  33. Laue, V.; Wolff, N.; Röder, F.; Krewer, U. Modeling the Influence of Mixing Strategies on Microstructural Properties of All-Solid-State Electrodes. Energy Technol. 2020, 8, 1801049. [Google Scholar] [CrossRef]
  34. Bruggeman, D. Berechnung verschiedener physikalischer Konstanten von heterogenen Substanzen. Annalen der Physik 1935, 416, 636–664. [Google Scholar] [CrossRef]
  35. Thomitzek, M.; Schmidt, O.; Abraham, T.; Cerdas, F.; Röder, F.; Krewer, U.; Herrmann, C. Model-based identification of production tolerances in battery production. Procedia CIRP 2021, 104, 1059–1064. [Google Scholar] [CrossRef]
  36. Li, G.; Rabitz, H.; Yelvington, P.E.; Oluwole, O.O.; Bacon, F.; Kolb, C.E. Global Sensitivity Analysis for Systems with Independent and/or Correlated Inputs. J. Phys. Chem. A 2010, 114, 6022–6032. [Google Scholar] [CrossRef] [PubMed]
  37. Caniou, Y. Global Sensitivity Analysis for Nested and Multiscale Modelling; Université Blaise Pascal-Clermont-Ferrand II: Clermont-Ferrand, France, 2012. [Google Scholar]
  38. Schmitt, M. Slot Die Coating of Lithium-Ion Battery Electrodes; KIT Scientific Publishing: Karlsruhe, Germany, 2015. [Google Scholar]
  39. Bockholt, H.; Haselrieder, W.; Kwade, A. Intensive powder mixing for dry dispersing of carbon black and its relevance for lithium-ion battery cathodes. Powder Technol. 2016, 297, 266–274. [Google Scholar] [CrossRef]
  40. Jaiser, S.; Friske, A.; Baunach, M.; Scharfer, P.; Schabel, W. Development of a three-stage drying profile based on characteristic drying stages for lithium-ion battery anodes. Dry. Technol. 2017, 35, 1266–1275. [Google Scholar] [CrossRef]
  41. Conforto, G.; Ruess, R.; Schröder, D.; Trevisanello, E.; Fantin, R.; Richter, F.H.; Janek, J. Editors’ Choice—Quantification of the Impact of Chemo-Mechanical Degradation on the Performance and Cycling Stability of NCM-Based Cathodes in Solid-State Li-Ion Batteries. Electrochem. Soc. 2021, 168, 070546. [Google Scholar] [CrossRef]
  42. Baudin, M.; Dutfoy, A.; Iooss, B.; Popelin, A.L. OpenTURNS: An industrial software for uncertainty quantification in simulation. In Handbook of Uncertainty Quantification; Ghanem, R., Higdon, D., Owhadi, H., Eds.; Springer International Publishing: Cham, Switzerland, 2016. [Google Scholar]
  43. Marelli, S.; Sudret, B. UQLab: A framework for uncertainty quantification in Matlab. In Vulnerability, Uncertainty, and Risk: Quantification, Mitigation, and Management; American Society of Civil Engineers: Reston, VA, USA, 2014; pp. 2554–2563. [Google Scholar]
  44. Wiener, N. The Homogeneous Chaos. Am. J. Math. 1938, 60, 897–936. [Google Scholar] [CrossRef]
  45. Sudret, B. Global sensitivity analysis using polynomial chaos expansions. Reliab. Eng. Syst. Saf. 2008, 93, 964–979. [Google Scholar] [CrossRef]
  46. Lin, N.; Xie, X.; Schenkendorf, R.; Krewer, U. Efficient Global Sensitivity Analysis of 3D Multiphysics Model for Li-Ion Batteries. Electrochem. Soc. 2018, 165, A1169. [Google Scholar] [CrossRef] [Green Version]
  47. Ventura, G.; Thomitzek, M.; Abraham, T.; Herrmann, C. Bottleneck reduction strategies for energy efficiency in the battery manufacturing. Procedia CIRP 2021, 104, 1017–1022. [Google Scholar]
  48. Kremer, L.S.; Hoffmann, A.; Danner, T.; Hein, S.; Pri, B.; Westhoff, D.; Dreer, C.; Latz, A.; Schmidt, V.; Wohlfahrt-Mehrens, M. Manufacturing Process for Improved Ultra-Thick Cathodes in High-Energy Lithium-Ion Batteries. Energy Technol. 2020, 8, 1900167. [Google Scholar] [CrossRef]
Figure 1. Schematic concept of the modeling framework consisting of three modules: (I) process chain model, (II) battery cell model, and (III) analysis.
Sustainability 14 01530 g001
Figure 2. Simulation workflow for a production-oriented and product-oriented utilization of the modeling framework.
Sustainability 14 01530 g002
Figure 3. Process chain model implemented by a concatenation of model containers, which are connected via structural parameters. Exemplary models are presented for the process steps of mixing, coating, and drying.
Sustainability 14 01530 g003
Figure 4. Meta-modeling approach consisting of (I) virtual design of experiment, (II) fit of meta-models, and (III) validation and meta-model selection.
Sustainability 14 01530 g004
Figure 5. Cell-to-cell and subcell deviations within different segments (S1–S10) throughout the process.
Sustainability 14 01530 g005
Figure 6. Initial wet film (left) and final structure (right).
Sustainability 14 01530 g006
Figure 7. Porosity after drying as a function of different mass loadings.
Sustainability 14 01530 g007
Figure 8. Exemplary voxel-based 3D microstructure.
Sustainability 14 01530 g008
Figure 9. Validation of the PCE meta-model for the P2D model based on polynomial chaos expansion.
Sustainability 14 01530 g009
Figure 10. Sankey diagram of the sensitivities between the different parameter domains focusing on the structural parameters that are required for the battery cell model.
Sustainability 14 01530 g010
Table 1. Sensitivity indices (total, uncorrelated, and correlated) of the battery cell model for the input parameter weight fractions of the active material ω A M and conductive additive ω C A , dry mass loading m d r y , and coating density ρ c a l for a discharge rate of 1 C.
Vol. Energy DensityDischarge Capacity
S i S i U S i C S i S i U S i C
ω A M 0.760.77−0.010.250.230.02
ω C A 0.000.000.000.000.000.00
m d r y 0.000.000.000.750.720.03
ρ c a l 0.240.240.000.000.000.00
1.001.01−0.011.000.950.05
Publisher’s Note: MDPI stays neutral with regard to jurisdictional claims in published maps and institutional affiliations.

