
The Importance of Employees’ Knowledge in Sustainable, Green Manufacturing: Numerical Modeling Approach


1
Faculty of Mechanical Engineering, University of Maribor, 2000 Maribor, Slovenia
2
School of E-Business and Logistics, Beijing Technology and Business University, Beijing 100048, China
*
Author to whom correspondence should be addressed.
Sustainability 2022, 14(3), 1344; https://doi.org/10.3390/su14031344
Submission received: 5 January 2022
/
Revised: 20 January 2022
/
Accepted: 21 January 2022
/
Published: 25 January 2022
(This article belongs to the Special Issue From Lean to Green Manufacturing)
Abstract
:The employees’ knowledge level is crucial because it ensures the long-term social, environmental, and financial sustainability of a company’s operations on the global market. In doing so, there is a problem of how to measure the employees’ knowledge level within the segment, and improve it based on performed measures. In our research, we proposed the use of real-world problem solving for the purpose of determining and improving the employees’ knowledge level potential. In the study, we present a numerical modeling approach to evaluate real-world problem-solving capabilities and find out how the captured data influence the important parameters for determining the employee’s knowledge level. We have measured seven parameters (number of solutions, technological feasibility of the proposed solutions, team thinking activities, age, prior knowledge about sustainable production methods, and education level). By using linear regression, we have defined general forms of functional dependencies that enable the individual company to calculate and, if necessary, increase the employees’ knowledge level for their team. The results of the research show the correlation dependence of individual parameters, in which we found a close relationship between the employees’ knowledge level and age, as well as the technological feasibility of proposed solutions and educational level. In the final phase of the research, we conducted an experiment with mixed groups consisting of participants from different age groups, with the results showing a high degree of intergenerational integration importance.
1. Introduction
Given the global trends and the increasing importance of sustainable and green production systems, and despite the increasingly automated and robotized world, employees’ knowledge is ever more important. Jobs historically held by less skilled employees are becoming more a thing of the past in the developed world, and the machines that replace them represent financial and time benefits that companies cannot overlook. The situation is very different for research and development departments (R&D), an area where the need for diverse knowledge and collaboration in teams has increased significantly. According to recent research, companies are seeking highly skilled employees who can think openly and integrate different skills into real-world problem solving. However, the problem here is determining the method service or manufacturing companies can use to evaluate their employees’ knowledge level, and how we can take it to the next level, using deterministic methods of numerical modeling.
In the past, research focused mainly on creativity and innovation, finding new ideas for solving existing problems or developing new products [1]. To determine the importance of real-world problem solving, we need holistic views on the creative process that can take place within service or production companies [2]. Employees’ knowledge is important to produce new and useful (technologically feasible) solutions that can be used to solve existing or potential problems [3]. The encouragement of employees’ thinking activity is beginning to be reflected in R&D departments, where it should be promoted [4]. Employees’ high knowledge level contributes to a more effective launch of new problem solutions, reflected in new products or services. The link between employees’ knowledge, real-world problem solving, and the development of solutions is based on a large number of newly presented ideas for sustainable products [5]. However, we must be aware that the process of generating new solutions can be very difficult, especially when we are talking about technologically feasible solutions [6]. In the field of employees’ knowledge level, which relate both to work organization and to systemic and social aspects, evolutionary techniques, economic considerations, development, and evolution have been very important over the years [7].
Scientists have found many mutual correlations between employees’ knowledge level and enterprise efficiency, the level of which has often been measured with reflection on the employees’ education level. The relationship between education level and employee’s knowledge can be improved through intercultural and interdisciplinary integration [8]. According to scientific results, we can find that the number of solutions decreases with a decreasing employees’ education level [9,10]. Various findings relate to the different disciplines of research, the quality and quantity of the solutions presented, and the cultural and geographical characteristics of the research group [11]. Employees’ knowledge level also varies according to cultural influences and the tasks and observation groups [12]. For determining the employees’ knowledge, the researchers propose several different methods of recording a knowledge level. In some cases, they focus on examples of real-world problem solving, figural examples, and verbal methods [13]. As a result of the research, different methods show correlations between different observed parameters. Depending on the different correlations found, we can improve the level of employees’ knowledge and, thus, contribute to a more efficient operation inside the production or service company [14]. To improve the employees’ knowledge level, the authors propose the use of interdisciplinary methods in the field of creative and innovative engagement [15]. The determination of the employees’ knowledge scale can be determined using the C-K theory, where the scale of the problem-solving level capability is designated as a set of restrictive heuristics activated in employees’ thinking activity [16]. The importance of knowing the appropriate employees’ knowledge level can play an important role in the sustainable and green production systems, raising the level of social, environmental, and financial justification [17].
In the past, researchers have mainly compared the levels of creativity thinking capabilities in relation to age, in children in elementary schools [18], secondary schools, and faculties [19]. The findings relate mainly to the number of creative ideas that the participants give in different methods for assessing the problem-solving level. The results differ in the direction of education in which the participants are present. So, in the elementary school, children will find more general thinking solutions, and in further education the given ideas determine the orientation toward certain areas in which students are trained and educated [20]. Unlike the results of the level of creativity in school youth, entrepreneurship concentrates primarily on raising the level of creativity to improve the procedures for finding solutions to existing problems, developing new products and eligibility for research investments [21]. The implementation of the methodology of introducing and using methods for assessing the level of employees’ knowledge leads to an improvement of the business and competitiveness of the company on the global market [22], and thus raising the employees’ knowledge in the company leads to the sustainable development of the company [23]. Depending on the sustainability-oriented company [24], this can only ensure the robustness of its products on the market and the long-time financial sustainability of the company [25,26].
As one of the most recent methods of encouraging real-world problem solving, R&D teams are asked to play creativity games which stimulate open thinking in a relaxed environment, promoting the employees’ enrolment and thinking activity. However, approaches for evaluating employees’ knowledge level are not sufficiently explored [27], especially in the daily activities of R&D departments.
In our research study, we want to investigate whether there is a positive influence of employees’ knowledge level (solving a real-world problem in the field of green and sustainable manufacturing [28]) by comparing it with additional parameters: the number of solutions generated, the technological feasibility of the proposed solutions, the team thinking activity, age, prior knowledge of sustainable production methods, and education level. We also present a method based on linear regression for determining the employees’ knowledge level in different production and service companies. With the help of the proposed approach and real-word problem solving, individual teams can develop their own model of employees’ knowledge level assessment, and, using the proposed numerical modeling approach, they can raise or improve their employees’ knowledge level. In Table 1, a comparison of the proposed research work goals and existing solutions in the related literature is presented (× marks research arias under the consideration).
2. Methods and Methodology
We decided to use the board game method to evaluate the level of knowledge of the employees in the field of green and sustainable manufacturing. The design of the experiment was as follows: Gathering R&D teams in different companies, using a board game to evaluate their knowledge and ideas to solve real problems in the field of green and sustainable manufacturing, classifying and evaluating the obtained results, and proposing a method to increase the knowledge level of employees. In the second section, we present a detailed description of the board game, the game process, and the classification of the research participants.
2.1. The Real-World Problem Solving Study
Participants must solve the real-world problems from Table 2. Participants in individual teams must choose one alphabet letter from A to F, and one number from 1 to 6, before the moderator presents the contents and topics of the individual real-world problem.
The themes can be tailored to a theoretical or practical problem that arises in the production or service company. The combination of the picked number and letter will present their real-world challenge problem [27], for which they must create as many solutions as possible, using their individual and team knowledge. The number of team members is ten, but it can be different, depending on the individual company’s capability. The study is presented and moderated by one moderator. His/her task is to present the study to all the participants and give the teams the necessary tools (pen, paper, board, etc.) on which to write their solutions. The moderator leads the discussion at the end of the study and gives the concluding thoughts. The playing time of the study is limited to 45 min, which is divided as follows: The introductory 10 min are intended for the presentation of the study (the moderator must present the respective topics individually), followed by 10 min of creating solutions and problem solving by the teams. In the last 25 min, the moderator leads a discussion about the findings of the given solutions among the teams. He also gives sub-questions related to the given solutions. In the discussion, all the solutions (feasible and unfeasible) are considered, and the teams are encouraged to give a wide range of different solutions. The teams share their opinions and suggestions, and active group comments are encouraged by the moderator. The project’s main goal of determining the number of proposed solutions, their feasibility, team thinking activity, etc., was not presented to the participants of the study. They were given only the specific purposes of performing the study and a detailed presentation of the real-world problems, as well as a terminological and substantive presentation of the study procedure.
2.1.1. Study Procedure
Step 1: The moderator divides participants into groups and presents the main goal of the study. The moderator presents individual real-world problems from columns A to F and from columns 1 to 6 (teams must pick one letter and one number). In case of possible uncertainties, the moderator gives examples of choices to the participants and clarifies some basic assumptions. The teams draw out one option from a single column. The chosen topic is a real-world problem that the members of the team must solve collectively, providing as many solutions as possible. Choosing different options and combinations of the problem makes it possible to measure the number of proposed solutions, given the fact that the problem is selected by their company and that the team members must respond quickly to the chosen topic.
Step 2: Represents the core of solving and creating innovative solutions to the problem chosen by the teams. In the event of problems, the moderator helps and encourages the teams to provide as many solutions and suggestions as possible. Team members cooperate and solve the problem together and, as a team, write or sketch their solutions.
Step 3: The moderator collects the given solutions and leads the discussion among the individual members of the teams. The teams comment on the solutions and suggestions and evaluate their technological feasibility.
Step 4: The study is completed by a mutual exchange of the proposed solutions between individual teams and the moderator. Exchanging views on the given creative solutions and discussion concludes the study.
The purpose of performing the study is to obtain as many problem solutions as possible to solve the real-world problem. The problem posed concerns application-oriented problems in companies and businesses. Depending on the team performing the activity, we can evaluate the feasibility of the solutions (team theoretical knowledge) that can be transferred directly into practice.
2.1.2. Research Team Description
The research covers one hundred and twenty-seven participants, of which: seventy-two from production companies and fifty-five form service companies. From the one hundred and twenty-seven participants, there were forty-nine women and seventy-eight men. All participants were informed about the survey and agreed to publish the research results. The companies under study were from Europe and are listed in Table 3. In the mixed team study, both evaluating companies were based in Europe. The survey was conducted between February 2021 and October 2021. In the research, we focused on capturing information on the number of generated solutions, the solutions’ technical feasibility, team thinking activities, age, prior knowledge about sustainable production, and education level. The main goal of the research was to measure the number of proposed real-world problems, with the obtained results showing the importance of employees’ knowledge.
2.1.3. Classification
For the numerical and graphical representation of the obtained results, we have classified all parameters according to five levels. The classification was used to analyze the interdependencies of the measured parameters.
- The number of real-world problems proposed by the teams refers to the given solutions of the entire team within 10 min of solving the selected real-world problem. The solutions were recorded on the leaflets, commented on, and shared with the other teams afterwards. The moderator motivated the teams to give as many different solutions as possible. The teams and the number of final solutions were divided into the levels. The level classification method is shown in Equations (1) and (2), where nl represents the number of the level, n the number of observed suggestions, s is the level step, nsmax is the maximum number of solutions, and nsmin the minimum number of solutions. The classification can be individualized according to the instruction or company. Classifying the number of solutions into levels is the basis for comparing employees’ knowledge levels to all other parameters.nl = 1 + 3.32 × log(n)s = (nsmax − nsmin)/n
- In researching the determination of the number of solutions related to the age of participants and the correlation to other important parameters (solutions’ technical feasibility, activity thinking, prior knowledge, and education), we focused on six teams; in all six companies, one hundred and twenty-seven participants were involved. The teams’ classification is presented in Table 3.
- The level of prior knowledge relates to knowledge in the field of sustainable production systems methods in view of the above-mentioned seven-age groups. We have divided these into five groups according to the prior knowledge in the field of sustainable production systems presented in Table 4.
- Regarding the number of solutions provided by the team members to solve the real-world problem, it was necessary to determine the levels of technical feasibility of the solutions to solve the real-world problem. The number of feasible solutions is defined in percentages according to the total number of solutions given. For example, 8/13 means that eight of thirteen solutions can be solved with today’s existing sustainability-oriented technologies, which means a feasibility of 62%. The levels of feasibility are presented in Table 5. The definition of the feasibility of the solutions is based on the available technologies that are able to solve the problem addressed by the submitted proposals. In our case, the criterion of the solutions’ feasibility was estimated using the evaluations of three evaluators, namely:
- An independent expert in the field of sustainable production systems.
- A member of an evaluating company’s technical management team, although this member did not participate actively in the study; he or she was only monitoring the solutions’ technical feasibility.
- The study moderator, who directed and followed the study closely.
The task of the evaluators was to evaluate which of the solutions were technologically feasible and, thus, to determine the levels of technological feasibility presented in Table 4.
- Thinking activity relates to the number of active participants within an individual member group. For example, 7/10 (70% team thinking activity) means that those seven members of the team actively contributed solutions within the 10-min real-world solving time and participated actively in the final discussion and the exchange of solutions and suggestions. Of course, the activity of team members is also dependent on the moderator, who needs to present the real-world solving study as attractively and as motivationally as possible. In our case, the moderator was the same in all evaluating groups. The assessment of the teams’ thinking activity consisted of observations given by three observers: an independent expert in the field of sustainable production systems, a member of the institution in which the study was performed, and the study moderator. The levels of the teams’ thinking activity are presented in Table 6.
- The parameter that we have considered in our survey also relates to the education level within the team members. Since the research was carried out in different production and service companies in different fields, we divided the research participants into five groups regarding their education level, as shown in Table 7.
2.2. Measures
The results received from the real-world solving study [27] play was based on the number of new solutions generated by the teams in a limited time (10 min). We have considered all the solutions that were written or drawn/sketched on the leaflets of solutions. Based on the given number of solutions, we continued the distribution and deployment of all participants in levels according to other parameters. The classification of the results is shown in Table 8. All the level classifications and calculations are made regarding the above-described individual parameters’ classification.
3. Numerical Modeling Results
According to the input data, a linear regression was performed [29] between the individual parameters. We were interested in the dependence of the number of solutions fns, on the technological feasibility of the solutions fsf, the team thinking activity fta, the average age of the team members fa, the prior knowledge about sustainable production systems methods fpk, and the education level fel. Using the Minitab [30] software environment, we performed a linear regression of the specified parameters for the purpose of determining individual correlations. In the Minitab statistical environment, the following simulation parameters were used:
- -
- linear type of the regression model,
- -
- 95% confidence and prediction intervals, and
- -
- Pearson correlation type.
Considering that, as a production or service company, we want to have as many real-world solutions as possible, according to our approach, we proposed the evaluation of the number of solutions with the level 5. Based on the simple linear equations below, we could calculate the necessary missing parameters that could lead us to a higher number of new solutions and higher employee knowledge capabilities. Depending on the missing parameters, we can improve our development team, and we can adjust the parameters to the optimal function for getting the maximum number of real-world solutions.
All the numerical results of the linear regression analysis are based on a five-level classification of participants according to the parameters considered, as shown in Table 7; consequently, the values of the correlation and determination factors are independent of the number of participants in a single group. The values presented allow for the application of the proposed approach for individual or general assessments of creativity potential.
3.1. Linear Regression Models
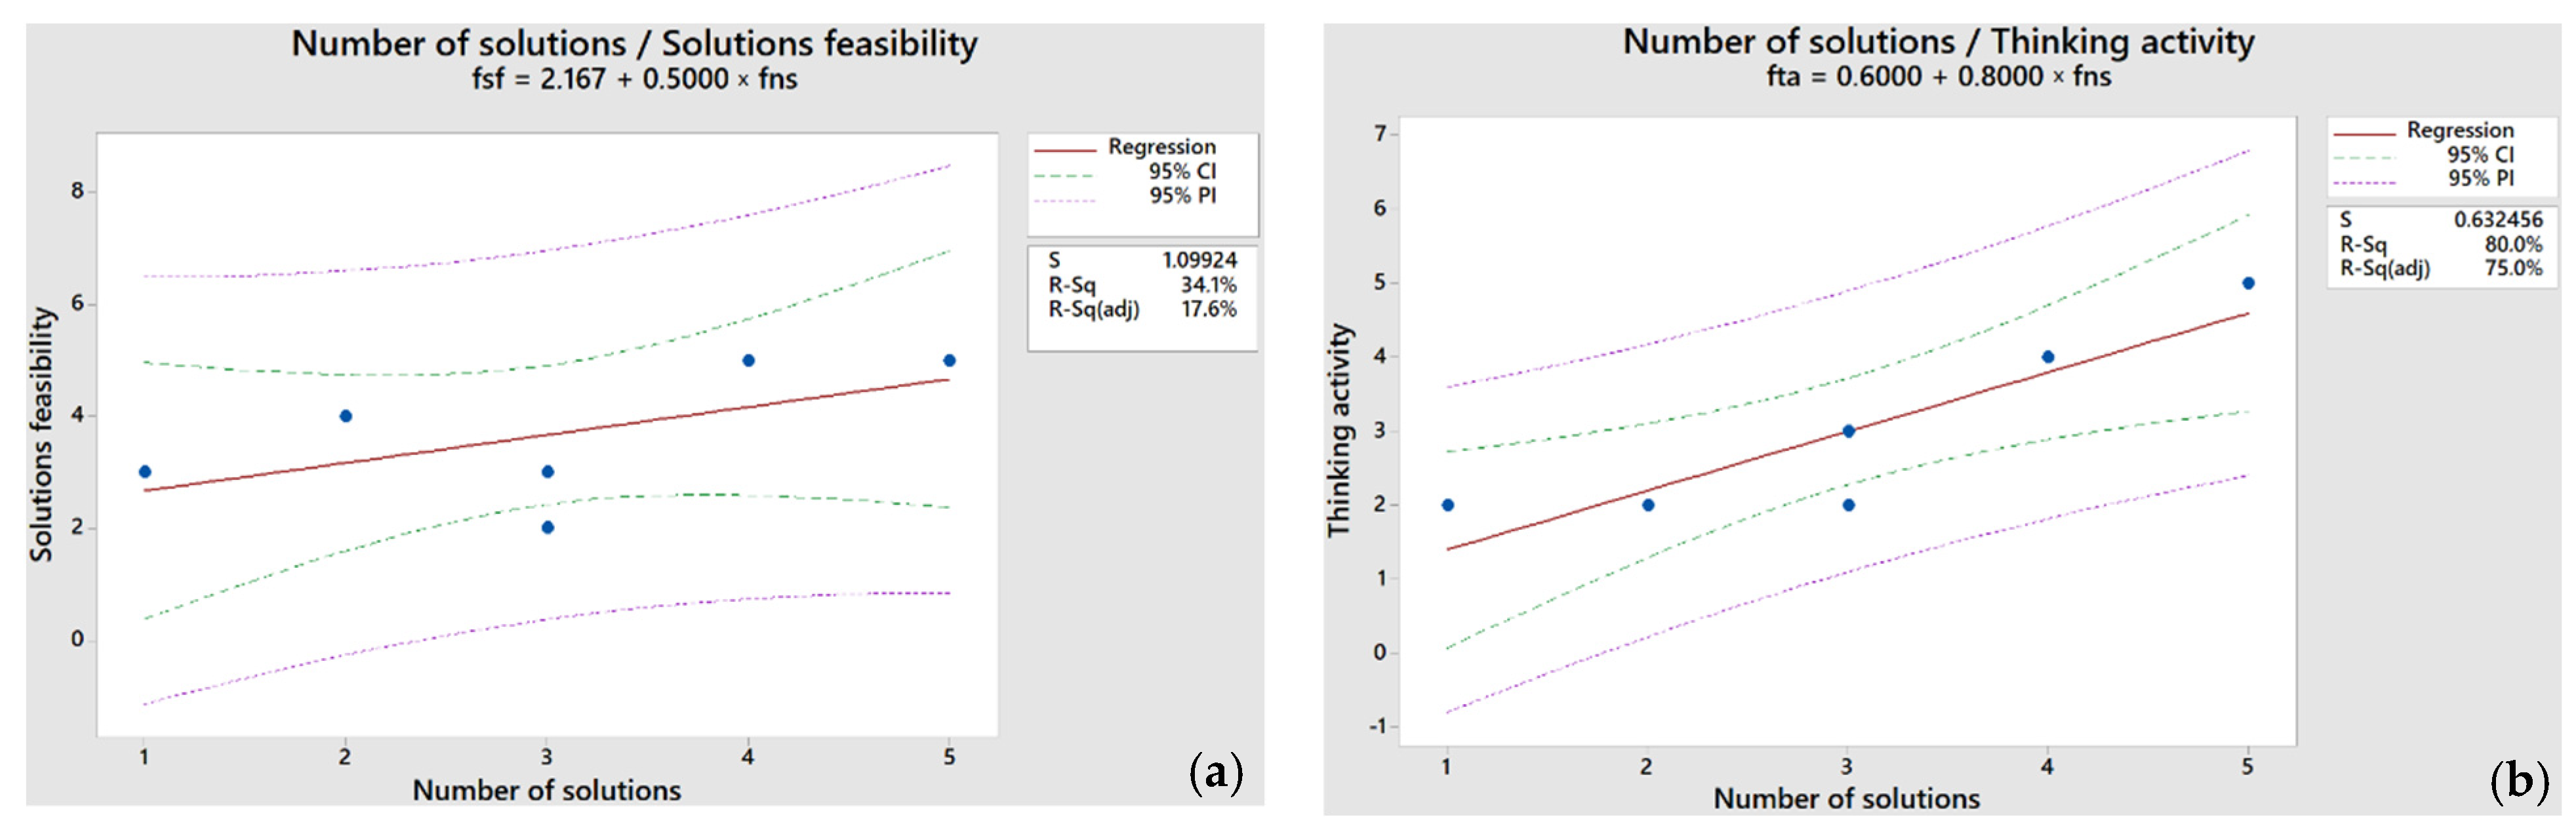
Regarding the next presented Equations and Figures, first for Equation (3) and Figure 1a, there is a positive correlation between the number of generated solutions and the number of technologically feasible solutions. A positive linear regression with a regression constant of 2.167 and a regression coefficient of 0.5000 is a display with a rising line. The 95% confidence interval indicates that five of the six input data are within the specified interval. The standard error of the linear regression S is 1.099, and the determination factor r2 = 0.341.
fsf = 2.167 + 0.5000 × fns
Positive linear regression is also reflected in the correlation between the number of solutions and the team thinking activity, with a regression constant of 0.6000, a regression coefficient of 0.8000 (Equation (4)), a standard calculation error of S = 0.6324, and a determining factor r2 of 0.800. With the confidence interval from Figure 1b, we can see that five of the six values are within the boundaries of the interval.
fta = 0.6000 + 0.8000 × fns
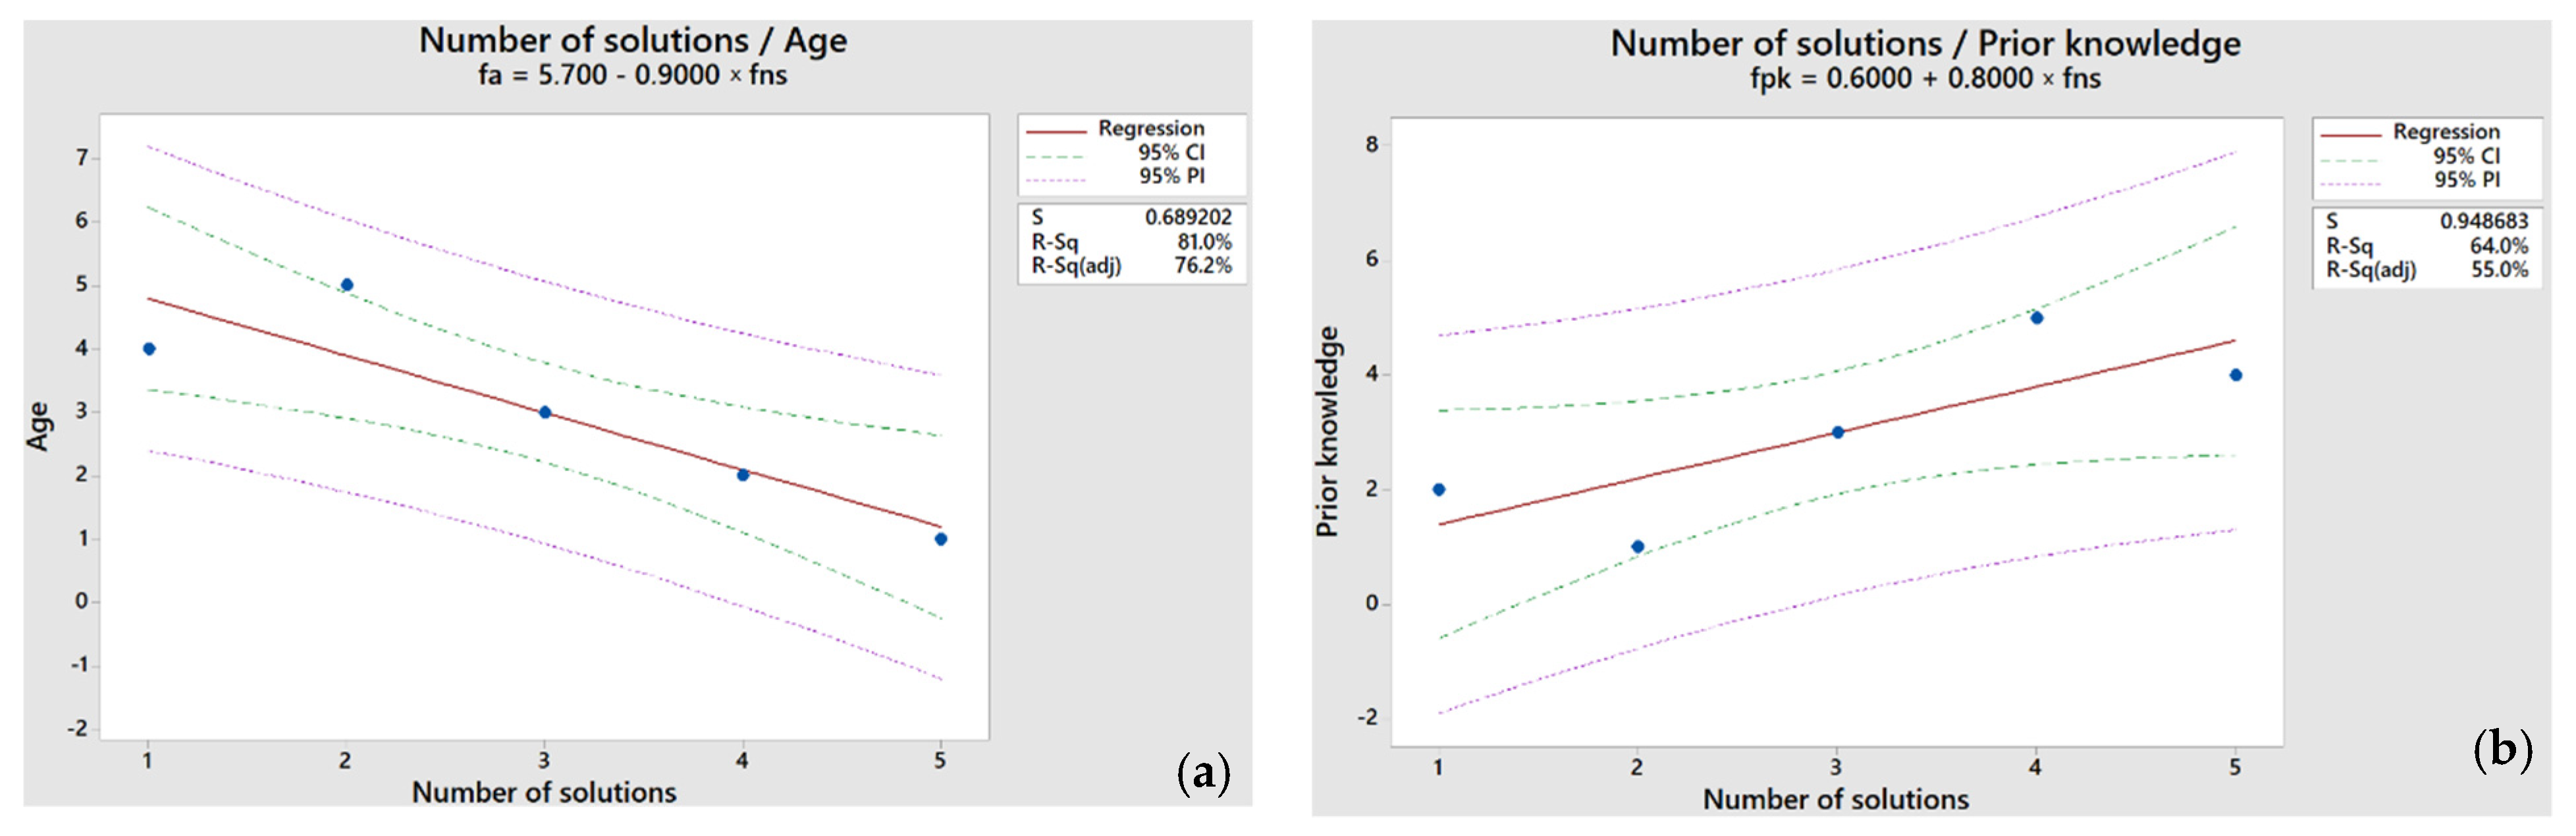
A negative linear regression can be observed in the following two functional dependencies in the negative correlation between the number of solutions and the team’s average age. The higher the average age, the smaller is the number of generated solutions. This is reflected in Equation (5), in which the regression constant is 5.700, and the regression coefficient is −0.9000, which determines the decreasing linear function. The standard calculation error is S = 0.6892, and the coefficient of determination r2 is 0.810. Results are shown on the left side of Figure 2a. Within 95% of the confidence interval, there are five of the six input data.
fa = 5.700 − 0.900 × fns
The positive linear connection in our case of input data is shown in the connection between the number of solutions and prior knowledge of the sustainable production systems. Equation (6) shows a positive linear regression in which the regression constant is 0.6000, and the regression coefficient is 0.8000. The graphical staging of the obtained solutions in Figure 2b shows a standard calculation error of S = 0.9486, and the determination factor r2 is 0.640.
fpk = 0.6000 + 0.8000 × fns
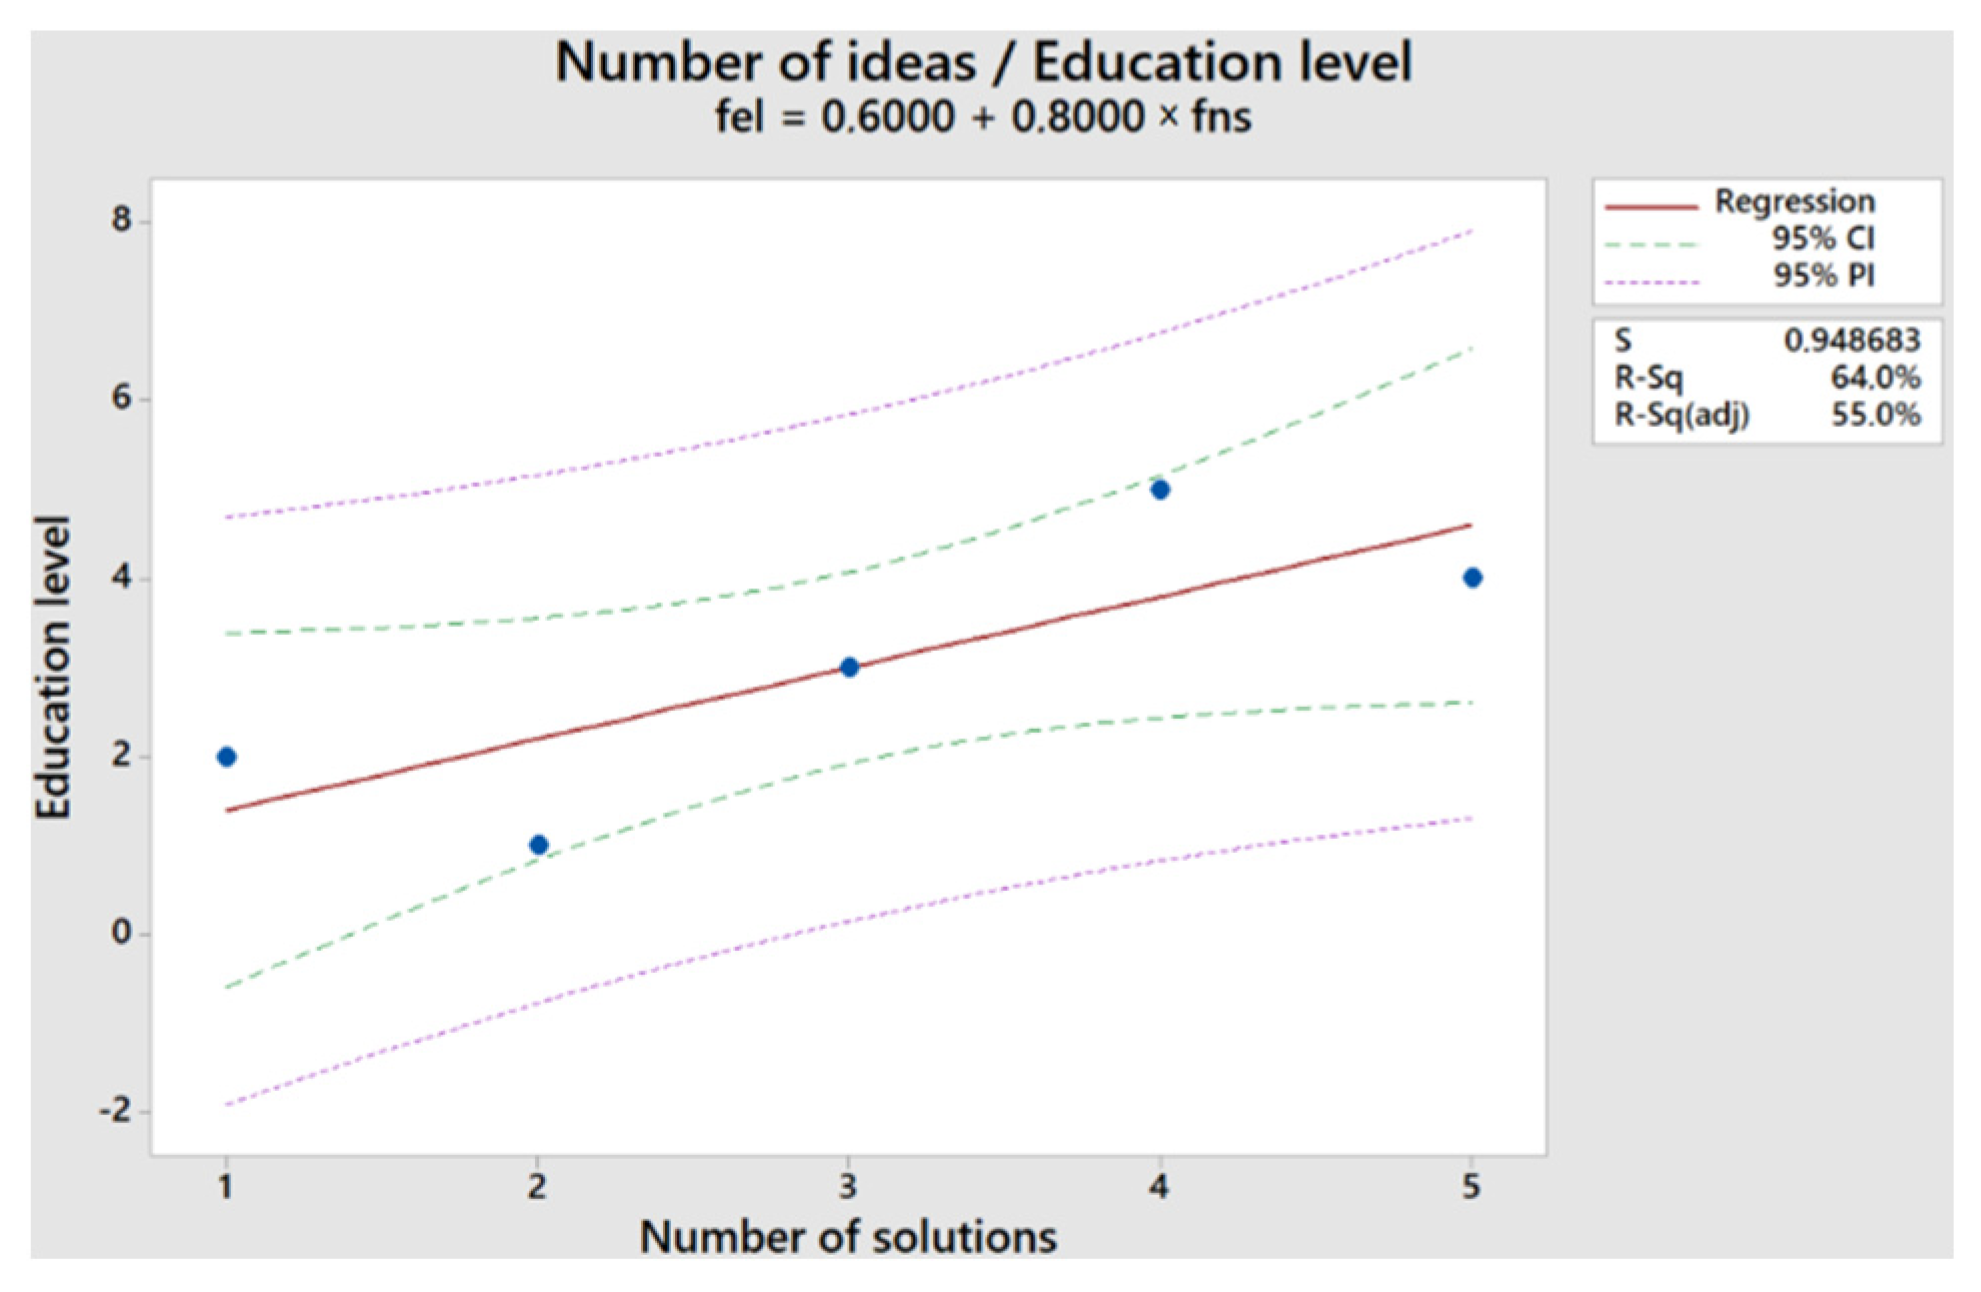
In relation to the positive correlation between the number of solutions and the solutions’ feasibility, the expected level of knowledge has a positive effect on the number of solutions presented by the linear regression Equation (7) and the calculation results in Figure 3. The positive slope of the linear equation is represented by a positive regression coefficient of 0.6000, and the regression constant is 0.8000. The standard calculation error S is 0.9486, and the determination factor r2 is 0.640.
fel = 0.6000 + 0.8000 × fns
3.2. Corellation Matrix
In Section 3.1, we presented individual linear correlations between the solutions’ feasibility, team thinking activity, age, prior knowledge, and education level according to the number of generated solutions. In the following, correlations are presented between all of the above-mentioned criteria. A very high negative correlation can be found in the interaction between prior knowledge about sustainable production systems methods and age, which is reflected by the coefficient of correlation where r is −0.900. In our case, companies with a higher prior knowledge are high-tech companies with a younger average employee age. In addition, a very high positive correlation is shown by the correlation between the prior knowledge, depending on the educational level. During their education, the employees gain more and more knowledge about sustainable production systems and the importance of formal an informal addition training. In our case, this relates to occupations in technological disciplines, where solving engineering problems is often based on new and innovative solutions. Of course, the level of knowledge of sustainable production systems does not increase only during formal education. It continues to the time of active engagement in companies, which is well demonstrated by the coefficient of correlation r, 1.000.
A high negative positive correlation is shown in the coefficient of correlation r, which is −0.900, linking the educational level and the age of the participants. As mentioned above, in our case well-educated employees were working in the service or production high tech companies, where knowledge is very important to make new products and services. A high positive correlation is reflected in the team thinking activity, which seeks new solutions, and in the number of solutions given by the team. The greater the team thinking activity, the greater the number of new real-world proposed solutions. In our example, the relationship between the number of solutions and the team thinking activity is shown with a correlation coefficient of r2 = 0.894.
In our case, a moderate positive correlation is shown in three interdependencies. The coefficient of correlation between the team thinking activity and the technological feasibility of solutions is 0.783, which proves that the technological feasibility of solutions depends on the activities of thinking within the group. A moderate positive correlation is also shown in the correlation between the technological solutions’ feasibility and the level of education, which can be confirmed by the hypothesis that education, especially in the technological direction, influences the technological feasibility of solutions positively. Given the educational structure, we can assume the number of feasible solutions. It follows that the development team must be well-educated in the company, in addition to ensuring interdisciplinary connectivity and openness to a wide range of innovative solutions. The correlation coefficient between the educational level and the solutions’ feasibility is 0.467. With a correlation coefficient of 0.783 between the team’s thinking activity and the level of education, we can find a moderate positive association. The higher the educational level, the higher the team thinking activity.
Lower positive correlations appear in the coefficient of correlation of 0.467 between the prior knowledge and the solutions’ feasibility. In this case, a preliminary knowledge of the sustainable production system methods influences the technological feasibility of solutions positively. Thus, in this case, the importance of the awareness of sustainable production knowledge techniques is perceived for the purpose of technologically feasible solutions. We can think of two explanations for the negative correlation coefficient of −0.467 between age and the solutions’ feasibility. Of course, the technological feasibility of the solutions entails a lot of experience in how to solve problems and which resources we have at our disposal. On the other hand, we can conclude that even younger well-educated engineers can provide high-tech solutions. The detailed numerical results are shown in Table 9. Positive moderate correlations are shown between the number of solutions and the solutions’ feasibility, where the correlation coefficient is 0.584. Given the diversity of the research group, we cannot show high positive correlations between the mentioned parameters from the production and services companies. In our case, there is also a high coefficient of correlation between the education level and the number of solutions: 0.800. There is a high negative correlation, with a correlation coefficient of −0.894 between the thinking activity and age. We can see that companies with younger well-educated employees are more aware of the importance of applying sustainable production system methods in solving real-world problems. The moderate-high positive correlation is shown in the correlation coefficient of 0.800 between prior knowledge and the number of solutions. The moderate–high correlation can be attributed to the broad age group of the research teams, based on which we find that the previous knowledge is influenced by the positive number of solutions given. It should be emphasized that this connection can be completely different within a homogeneous research team. The high negative correlation is reflected in the correlation coefficient −0.900 between the age and the number of solutions given. Thus, we can determine that the number of solutions presented dropped with age.
3.3. Mixed Group Experiment
In view of the results presented above and the correlations between factors (number of solutions, solutions’ feasibility, thinking activity, education level, age, and prior knowledge), we assembled an experiment with two mixed groups of participants for evaluating the employees’ knowledge level. The teams consisted of eight individuals, including:
- Four Faculty students,
- Four production company employees,
- Four service company employees and
- Four high-tech new technology incubator employees.
The mixed team was thus composed of differently aged members, with different prior knowledge and educational levels. All participants had not participated in the study previously. The aim of such mixed teams was to evaluate the influence of the different age groups on the number of proposed solutions, their feasibility, and their team thinking activity.
The timing and playing procedure of the real-world solving problem and the execution process were inherently identical to those of the groups presented above. The study was moderated by the same moderator, with the same modified real-world problems. The participants of the study did not know what the study’s main goal of solving was (getting as many solutions as possible to solve the chosen problem). Thus, only the intended objectives were specified, and not the objectives of the research.
Table 9 shows the results of the study to highlight the importance of the employees’ knowledge in two mixed groups. The results are presented with the number of proposed solutions, the technological feasibility of the solutions, and the team thinking activity in the performed study. The levels of individual parameters are shown according to the previous definitions in the Method and Methodology Section. The ninth column shows the average age of the participants in the group.
From the results in Table 10, we find that these two mixed groups of participants provided the largest number of solutions for the real-world problem. Seventeen and twenty-four solutions were given, the highest number among all the teams participating in this research. Of these seventeen and twenty-four solutions, 82% and 87.5% were feasible, given the technologies currently available. However, we detected a high degree of intra-group connectivity, which corresponded to a 90% and 100% team thinking activity. From the results of the mixed group experiment, we can conclude that different ages and intergenerational collaboration are very important, and the teams in this case have a high employee knowledge potential. It can be observed that the cooperation of the members within the teams was coordinated with different views, and they were able to generate many solutions for solving the real-world problem.
4. Discussion
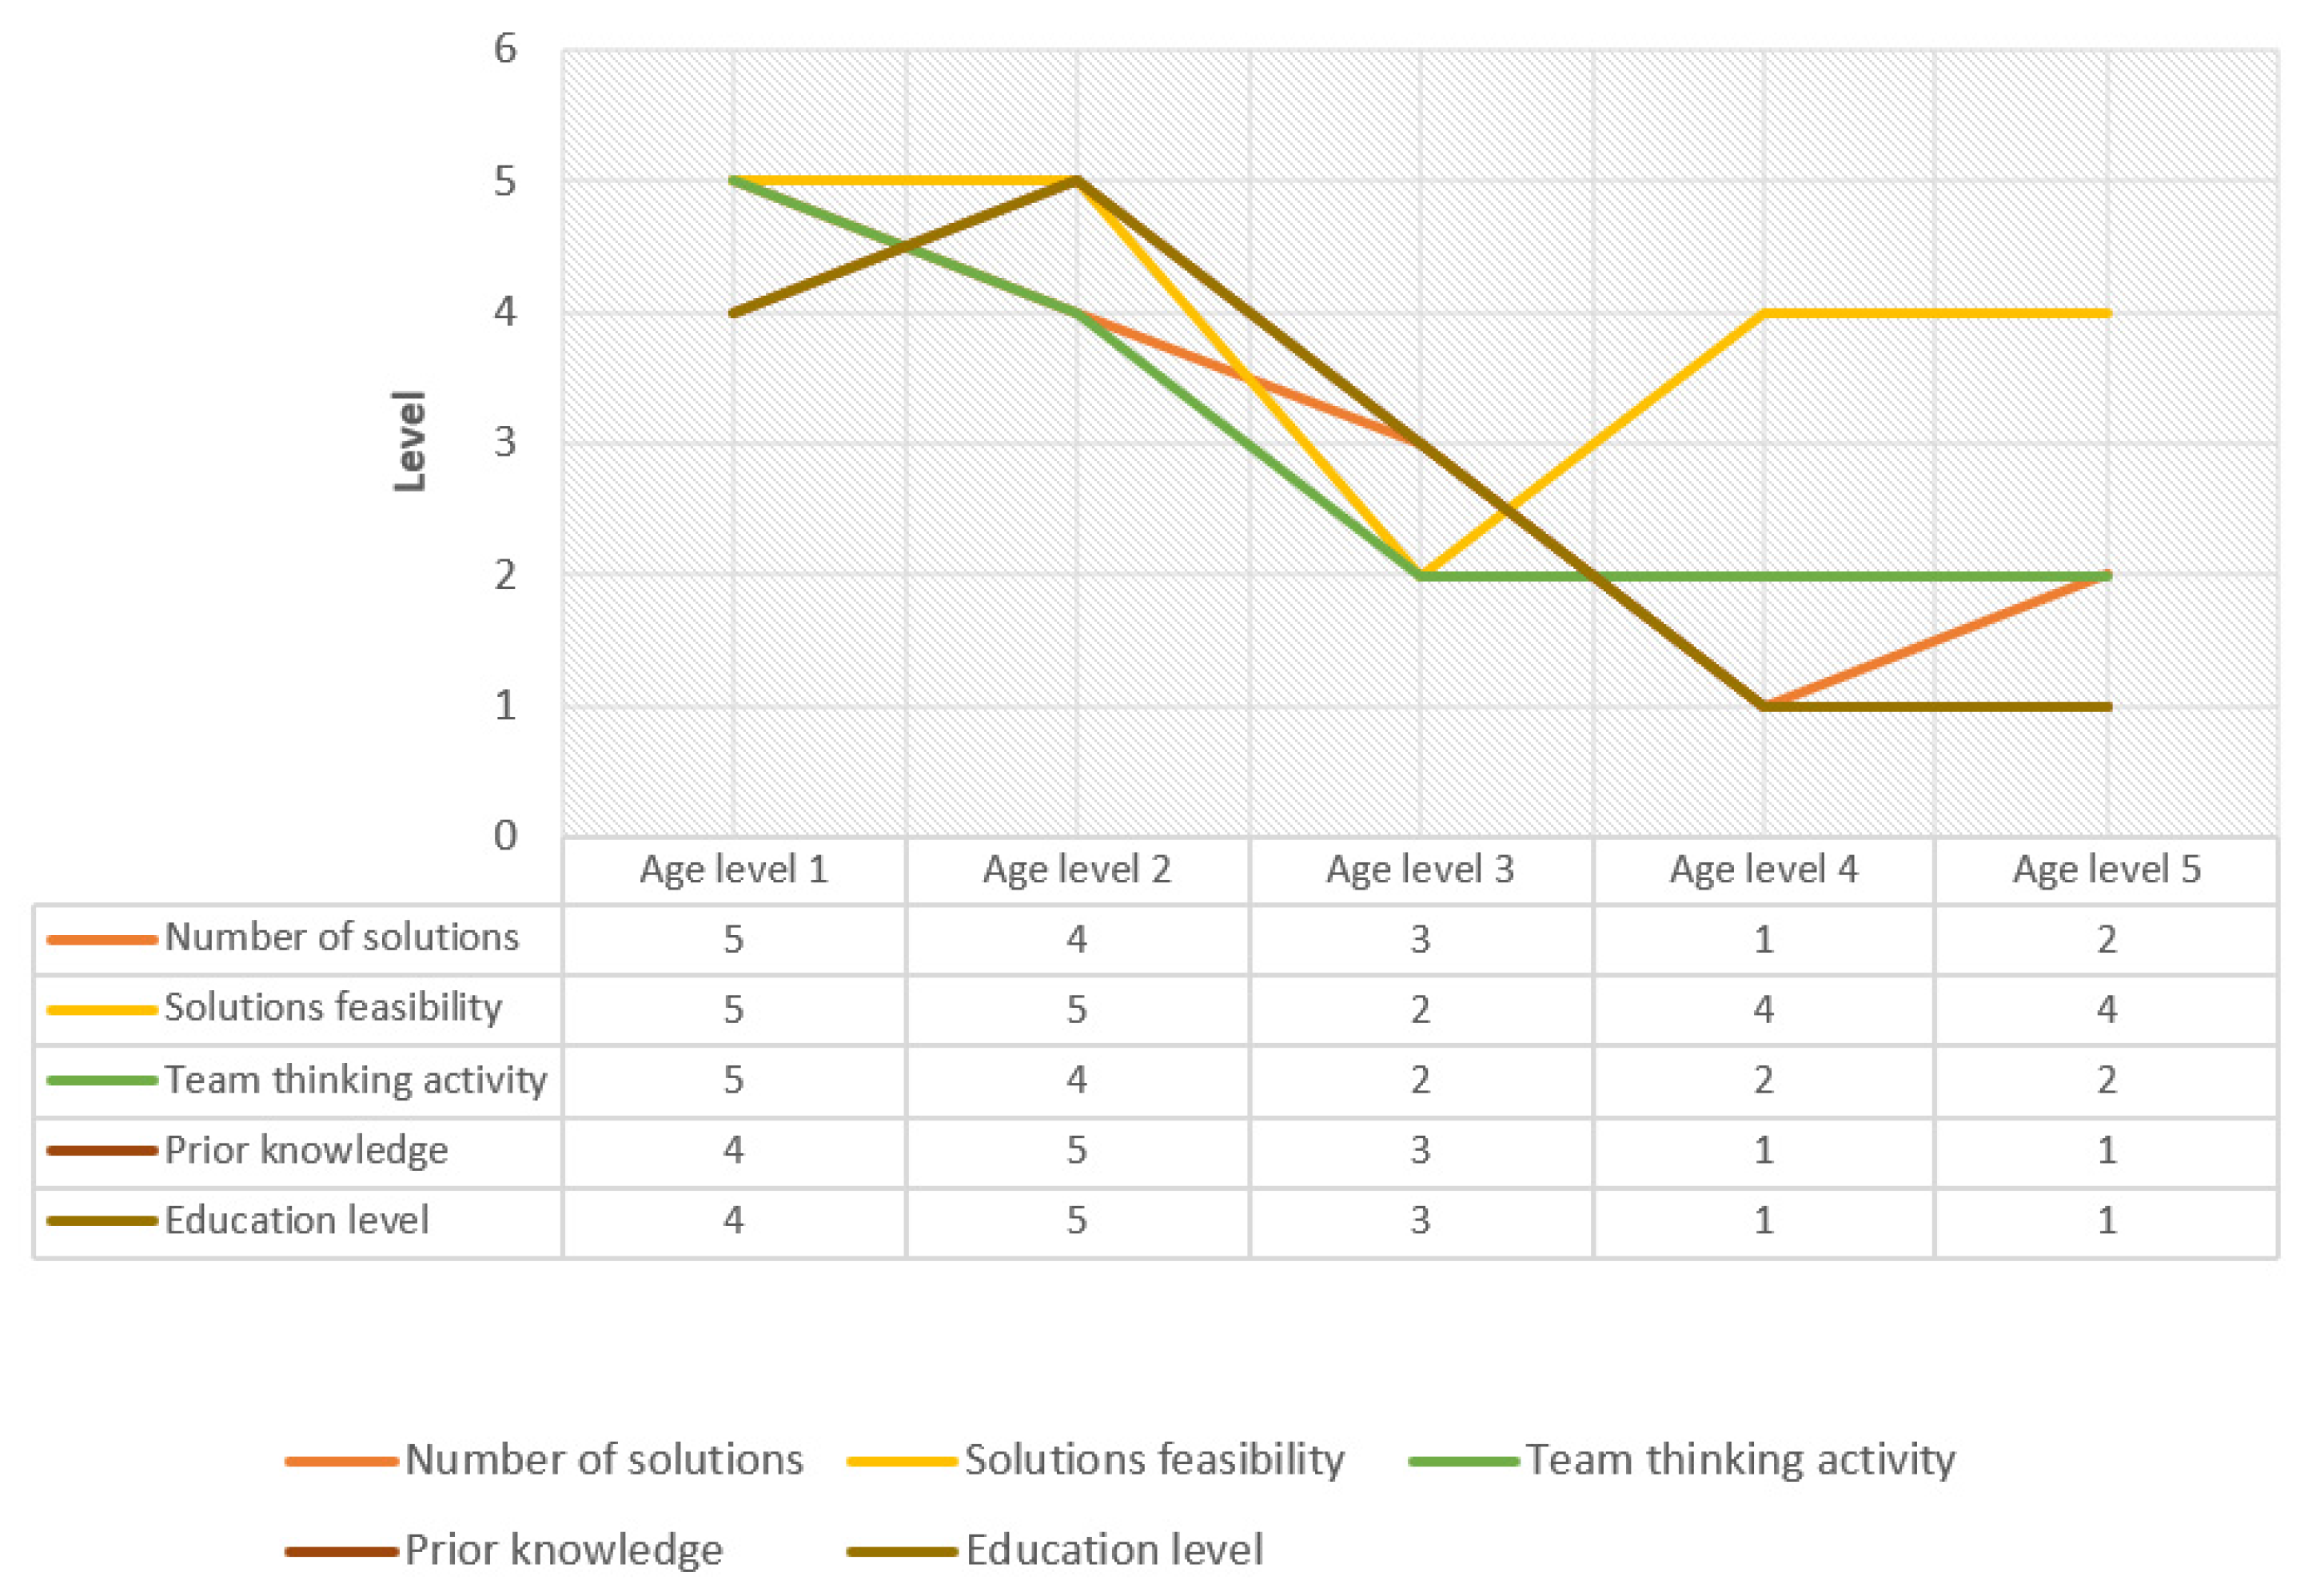
Our research estimates the importance of employees’ knowledge according to six parameters (number of solutions, technological solutions’ feasibility, thinking activity, age, prior knowledge, and education level). With the help of the performed study, we have gained results from one hundred and twenty-seven participants, divided into six uniform groups and two mixed groups. Using the obtained results, we performed the classification of parameters with respect to a five-level age classification (as classified in Table 2), which were fundamental input data for the performed linear regression for determining the mathematical functions and correlations between the individual parameters. We have presented a simple approach of how each production or service company can analyze its own employees’ knowledge level and, consequently, improve the parameters for raising sustainable production awareness. The conclusions and considerations in relation to the importance of employees’ knowledge are presented in Section 4.1, Section 4.2, Section 4.3 and Section 4.4. In Figure 4, we can see individual comparisons between the age of the participants, divided into a five-level model (classification according to Table 7), and five parameters that influence the employees’ knowledge level.
4.1. Number of Solutions vs. Age
First, let us look at the orange graph in Figure 4, that shows the correlation between the age (average company team age) and the number of solutions generated by participants in a particular age group. We can conclude that, in our case, most of the solutions were given by the youngest participants, who provided many solutions for the real-world problem. The number of solutions given by high-tech company employees is on the top of our diagram, which can be linked to the topics shown in Table 7 and relate, in many cases, to technological real-world problems. According to the orange graph, we can conclude that the number of solutions in the following age groups is falling steeply. Participants who, according to their age, were in the middle ages of life, show fewer solutions, as confirmed in the literature [11]. Considering that our research covered a wide range of age groups, we can say that the number of solutions is greatest among middle-aged, well-educated employees.
4.2. Solutions Feasibility vs. Age
The correlation between technological feasibility and age is shown in the yellow graph in Figure 4, based on which we find that the technological solutions’ feasibility of the given solutions is high when the age is low (corelated to the well-educated high-tech companies’ employees) and increases with the age and employees experience. This can be attributed to the formal and non-formal education that the participants in all groups were exposed to. Each level in the educational process contributes to the adequacy of the solutions provided. In our case, this applies to the participants of companies A, B, and C, who are engaged in the development activity of new products and services. In the professions—which, in our case, are related to technology—we notice that the solutions given by the participants in the groups are, in most cases, related to the profession in which they are educated or in which they operate. Technological feasibility can partly limit the number of solutions given, as participants are unconsciously burdened with selecting the kind of solutions they will give. In our case, the moderator challenged open and unlimited real-world solutions regarding their feasibility, but the technological orientation of a particular group can still be seen from the results.
4.3. Team Thinking Activity vs. Age
As already stated above, in our case, the same moderator moderated all groups. However, the number of active participants who participated in the study differs among the individual age groups (green graph). We can observe that the least active participants are from the oldest age group. Depending on the observations misleading the moderator immediately after the study, we can say that, in some respects, the elderly do not find it sensible to perform the study for the purpose of evaluating employees’ knowledge level. In these cases, the members of the group showed some deviation from the importance of problem solving.
4.4. Prior Knowledge and Education Level vs. Age
Considering that the parameters of prior knowledge about sustainable production system methods and educational level are strongly linked, we have compared them together with age (booth graphs, brown and dark green, having the same values). It is a well-known fact that a certain level of knowledge comes with a formal education, which is also conditioned by appropriate terminological periods. Formal education, however, adds an informal education over the years, but both qualifications and their level depend on the intellectual capabilities and limitations of the individual. The graph in brown shows the previous knowledge, and the dark green graph shows the level of education, which have the same values, presented in Figure 4. Regarding age, both graphs are falling. In our study the youngest employees were the most formally and informally educated (additional training) in relation to sustainable production systems. Based on the results presented, we find that formal and informal knowledge is necessary for an appropriate level of knowledge within production or service companies.
5. Conclusions
In the presented research work, we wanted to show the importance of the employees’ knowledge, which can be promoted and evaluated by applying the knowledge of green sustainable production systems within a company that wants to be more competitive in the global market. We have presented a new numerical modeling approach using a real-world problem-solving case in which we have shown the importance of promoting the knowledge of employees and the key parameters to elevate a team’s level of knowledge.
We used linear regression methods to show the interdependencies, and the results were formulated and presented numerically to show the interdependencies of the parameters. The results obtained in the first phase of the research were used to create a general decision-making model that can be used by any manufacturing or service company to determine the employees’ knowledge level. The classification of the obtained results is presented graphically and numerically. The obtained results are related to the results reported in the literature [5]. The main contribution compared to their research works is our model for decision-making and knowledge level assessment, with the main objective of increasing the knowledge level of team members. On the other hand, the main results are related to the individual dependence on different team characteristics. We have shown that with the proposed method, the evaluation of the current knowledge level of the team is known and can be increased, if necessary.
With the aim of testing our approach and the first-phase numerical results, we have shown the importance of the mixed group study, which in our case has produced high quality results in terms of the number of given solutions in solving problems from the field of green and sustainable manufacturing [31]. However, we must emphasize that our results refer more to the technology-oriented problem, which is focused on solving existing and new technological challenges [32,33]. This poses some limitations. Moreover, most of our participants are educated in the technological field. Based on the tests of the presented approach, we can claim the overall usefulness and effectiveness of using the proposed approach to measure the knowledge level of the employees and consequently to ensure the long-term viability of our company. The presented results suggest that the knowledge level of individual team members can be improved, thus increasing and improving the knowledge and awareness of green and sustainable systems.
In future steps of the research, we will extend the data collection to an even larger number of participants. Given the positive results of mixed groups, we will focus on the evaluation and importance of mixed R&D teams in companies, including mixed nationality teams and team members with different initial knowledge education (not just focusing mainly on technology-based professions). Using a larger database, we will perform more detailed statistical analyses based on the evaluation of correlation factors between different parameters of employees’ knowledge capabilities. We believe that in the era of Industry 4.0 and the awareness of sustainably oriented companies [34], the importance of R&D team members’ knowledge is essential for achieving positive social, economic, and environmental outcomes.
Author Contributions
Conceptualization, R.O. and H.Z.; methodology, R.O. and H.Z.; software, R.O., H.Z.; validation, B.B., R.O. and H.Z.; data curation, H.Z. and R.O.; writing—original draft preparation, R.O. and H.Z.; writing—review and editing, R.O., H.Z. and B.B.; visualization, H.Z. and R.O.; supervision, B.B.; funding acquisition, R.O. and B.B. All authors have read and agreed to the published version of the manuscript.
Funding
This research was funded by the Slovenian Research Agency (ARRS), Research Core Grant number P2-0190.
Institutional Review Board Statement
Not applicable.
Informed Consent Statement
Informed consent was obtained from all subjects involved in the study.
Data Availability Statement
Not applicable.
Acknowledgments
We would like to express our deep gratitude to the University of Maribor, especially the Laboratory for Production and Operations Management and the Laboratory for Discrete System Simulation and companies’ employees for the opportunity to carry out our research work. We thank all anonymous reviewers and the editor for their comments. With the corrections, suggestions, and comments made, the manuscript has gained in scientific value.
Conflicts of Interest
The authors declare no conflict of interest.
References
- Getzels, J.W.; Jackson, P.W. Creativity and Intelligence: Explorations with Gifted Students; Wiley: Oxford, UK, 1962. [Google Scholar]
- Sternberg, R.J.; Lubart, T.I. Defying the Crowd: Cultivating Creativity in a Culture of Conformity; Free Press: New York, NY, USA, 1995. [Google Scholar]
- Sternberg, R.J.; Sternberg, R.J. Handbook of Creativity; Cambridge University Press: Cambridge, UK, 1999. [Google Scholar]
- Stacey, R.D. Complexity and Creativity in Organizations; Berrett-Koehler Publishers: San Francisco, CA, USA, 1996. [Google Scholar]
- Leber, M.; Ivanisevic, A.; Borocki, J.; Radisic, M.; Slusarczyk, B. Fostering alliances with customers for the sustainable product creation. Sustainability 2018, 10, 3204. [Google Scholar] [CrossRef]
- Alves, J.; Jose Marques, M.; Saur, I.; Marques, P. Creativity and innovation through multidisciplinary and multisectoral cooperation. Creat. Innov. Manag. 2007, 16, 27–34. [Google Scholar] [CrossRef]
- Fagerberg, J.; Martin, B.R.; Andersen, E.S. Innovation Studies: Evolution and Future Challenges; Oxford University Press: Oxford, UK, 2013. [Google Scholar]
- Teng, C.-C.; Hu, C.-M.; Chang, J.-H. Triggering creative self-efficacy to increase employee innovation behavior in the hospitality workplace. J. Creat. Behav. 2019, in press. [CrossRef]
- Simonton, D.K. Age and literary creativity: A cross-cultural and transhistorical survey. J. Cross-Cult. Psychol. 1975, 6, 259–277. [Google Scholar] [CrossRef]
- Andersson, E.; Berg, S.; Lawenius, M.; Ruth, J.-E. Creativity in old age: A longitudinal study. Aging Clin. Exp. Res. 1989, 1, 159–164. [Google Scholar] [CrossRef]
- Simonton, D.K. Age and outstanding achievement: What do we know after a century of research? Psychol. Bull. 1988, 104, 251–267. [Google Scholar] [CrossRef]
- Lubart, T.I.; Sternberg, R.J. Creativity across time and place: Life span and cross-cultural perspectives. High Abil. Stud. 1998, 9, 59–74. [Google Scholar] [CrossRef]
- Wu, C.H.; Cheng, Y.; Ip, H.M.; mcBride-Cheng, C. Age differences in creativity: Task structure and knowledge base. Creativ. Res. J. 2005, 17, 321–326. [Google Scholar] [CrossRef]
- Binnewies, C.; Ohly, S.; Niessen, C. Age and creativity at work: The interplay between job resources, age and idea creativity. J. Manage. Psychol. 2008, 23, 438–457. [Google Scholar] [CrossRef] [Green Version]
- Rietzschel, E.F.; Zacher, H. Workplace Creativity, Innovation, and Age. In Encyclopedia of Geropsychology; Pachana, N.A., Ed.; Springer: Singapore, 2015. [Google Scholar] [CrossRef]
- Agogué, M.; Poirel, N.; Pineau, A.; Houde, O.; Cassotti, M. The impact of age and training on creativity: A design-theory approach to study fixation effects. Think. Skills Creat. 2014, 11, 33–41. [Google Scholar] [CrossRef] [Green Version]
- Ojstersek, R.; Acko, B.; Buchmeister, B. Simulation study of a flexible manufacturing system regarding sustainability. Int. J. Simul. Model. 2020, 19, 65–76. [Google Scholar] [CrossRef]
- Claxton, A.F.; Pannells, T.C.; Rhoads, P.A. Developmental trends in the creativity of school-age children. Creat. Res. J. 2005, 17, 327–335. [Google Scholar] [CrossRef]
- Tekin, M.; Tasgin, Ö. Analysis of the creativity level of the gifted students. Procedia Soc. Behav. Sci. 2009, 1, 1088–1092. [Google Scholar] [CrossRef] [Green Version]
- Haavold, P.Ø. An empirical investigation of a theoretical model for mathematical creativity. J. Creat. Behav. 2018, 52, 226–239. [Google Scholar] [CrossRef]
- Crépon, B.; Duguet, E.; Mairessec, J. Research, innovation and productivity: An econometric analysis at the firm level. Econ. Innov. New Technol. 1998, 7, 115–158. [Google Scholar] [CrossRef]
- Markard, J.; Truffer, B. Technological innovation systems and the multi-level perspective: Towards an integrated framework. Res. Policy 2008, 37, 596–615. [Google Scholar] [CrossRef]
- Smith, A.; Voß, J.-P.; Grin, J. Innovation studies and sustainability transitions: The allure of the multi-level perspective and its challenges. Res. Policy 2010, 39, 435–448. [Google Scholar] [CrossRef]
- Baron, R.A.; Tang, J. The role of entrepreneurs in firm-level innovation: Joint effects of positive affect, creativity, and environmental dynamism. J. Bus. Ventur. 2011, 26, 49–60. [Google Scholar] [CrossRef]
- Hu, Y.; Aziz, E.-S.S.; Chassapis, C. Creativity-based design innovation environment in support of robust product development. Int. J. Interact. Des. Manuf. 2016, 10, 335–353. [Google Scholar] [CrossRef]
- Ogrizek, B.; Reher, T.; Leber, M.; Buchmeister, B. Concept of intelligent supporting information system for development of new appliances. Adv. Prod. Eng. Manag. 2017, 12, 196–204. [Google Scholar] [CrossRef] [Green Version]
- Epstein, R. The Big Book of Creativity Games: Quick, Fun Activities for Jumpstarting Innovation; McGraw Hill Professional: New York, NY, USA, 2000. [Google Scholar]
- Song, M.; Yang, M.X.; Zeng, K.J.; Feng, W. Green knowledge sharing, stakeholder pressure, absorptive capacity, and green innovation: Evidence from Chinese manufacturing firms. Bus. Strat. Environ. 2020, 29, 1517–1531. [Google Scholar] [CrossRef]
- Neter, J.; Kutner, M.H.; Nachtsheim, C.J.; Wasserman, W. Applied Linear Statistical Models; Irwin: Chicago, IL, USA, 1996. [Google Scholar]
- Ryan, B.F.; Joiner, B.L. Minitab Handbook; Duxbury Press: Boston, MA, USA, 2001. [Google Scholar]
- Hun, J.; Chen, H.; Xu, J. External knowledge sourcing and green innovation growth with environmental and energy regulations: Evidence from manufacturing in China. Sustainability 2017, 9, 342. [Google Scholar] [CrossRef] [Green Version]
- Ojstersek, R.; Buchmeister, B. Simulation modeling approach for collaborative workplaces’ assessment in sustainable manufacturing. Sustainability 2020, 12, 4103. [Google Scholar] [CrossRef]
- Kogler, C.; Rauch, P. Game-based workshops for the wood supply chain to facilitate knowledge transfer. Int. J. Simul. Model. 2020, 19, 446–457. [Google Scholar] [CrossRef]
- Sun, H.; Teh, P.-L.; Linton, J.D. Impact of environmental knowledge and product quality on student attitude toward products with recycled/remanufactured content: Implications for environmental education and green manufacturing. Bus. Strat. Environ. 2018, 27, 935–945. [Google Scholar] [CrossRef]
Figure 1.
Correlation between number of solutions and solutions’ feasibility (a), correlation between number of solutions and thinking activity (b).
Figure 1.
Correlation between number of solutions and solutions’ feasibility (a), correlation between number of solutions and thinking activity (b).

Figure 2.
Correlation between number of solutions and age (a), correlation between number of solutions and prior knowledge (b).
Figure 2.
Correlation between number of solutions and age (a), correlation between number of solutions and prior knowledge (b).

Figure 3.
Correlation between number of solutions and education level.

Figure 4.
Graphical results of level comparisons.


Table 1.
Proposed work and related literature comparative table.
| Key Word | Proposed Work | Related Literature | ||||||||||||
|---|---|---|---|---|---|---|---|---|---|---|---|---|---|---|
| [5] | [6] | [7] | [8] | [9,10] | [13] | [14,15] | [16] | [17,23] | [26] | [29] | [30] | [31,32,33] | ||
| employees’ knowledge | × | × | × | × | × | |||||||||
| Ideas and creativity | × | × | × | × | × | × | × | × | × | × | ||||
| sustainability | × | × | × | × | ||||||||||
| green manufacturing | × | × | ||||||||||||
| numerical modeling | × | × | ||||||||||||
| linear regression | × | × | ||||||||||||
Table 2.
Sustainable and green manufacturing real-world problems.
| Part 1 (Problems) | Part 2 (Methods/Solutions) | ||
|---|---|---|---|
| A | Process waste | 1 | Recycle |
| B | Lean manufacturing | 2 | Economic justification |
| C | Products costs | 3 | Green technology |
| D | Employees’ satisfaction | 4 | Employees’ enrolment |
| E | Green manufacturing | 5 | Market dynamics |
| F | Sustainable manufacturing | 6 | Processes optimization |
Table 3.
Teams’ classification.
| Teams’ Description | Average Age (Year) | Age SD (Year) |
|---|---|---|
| 1. Production company A, research and development team. | 39 | 4.1 |
| 2. Service company A, support service company. | 47 | 5.3 |
| 3. Production company B, metal parts production. | 51 | 4.6 |
| 4. Service company B, high-tech software development. | 29 | 3.8 |
| 5. Production company C, high-tech hardware development and manufacturing. | 32 | 4.2 |
| 6. Mix company C, company outsource employees’ group. | 42 | 5.2 |
Table 4.
Teams’ prior knowledge classification.
| Group Classification | Prior Knowledge Description |
|---|---|
| Group 1 (no prior knowledge) | They do not have any knowledge of sustainable and green manufacturing, their solutions refer only to their own judgments. |
| Group 2 (basic prior knowledge) | They have basic knowledge provided by practical lessons or enterprises’ internal knowledge support. |
| Group 3 (general prior knowledge) | They have general knowledge provided by practical lessons or enterprises’ external knowledge support. |
| Group 4 (wide theoretical prior knowledge) | They have a wide theoretical knowledge provided by extensive education in the field of sustainable and green manufacturing. |
| Group 5 (deep practical and theoretical prior knowledge) | They have a deep theoretical knowledge provided by extensive education in the field of sustainable and green manufacturing. In addition, they are transferring daily theoretical knowledge to a real-world environment. |
Table 5.
Solutions’ feasibility classification.
| Solutions’ Feasibility Level | Percentage (%) |
|---|---|
| Level 1 | 0–55 |
| Level 2 | 56–65 |
| Level 3 | 66–75 |
| Level 4 | 76–85 |
| Level 5 | 86–100 |
Table 6.
Teams’ thinking activity classification.
| Team Thinking Activity | Percentage (%) |
|---|---|
| Level 1 | 0–60 |
| Level 2 | 70 |
| Level 3 | 80 |
| Level 4 | 90 |
| Level 5 | 100 |
Table 7.
Teams’ education level classification.
| Education Level | Education |
|---|---|
| Level 1 | Secondary school |
| Level 2 | Secondary school + additional training (at) |
| Level 3 | Faculty education |
| Level 4 | Faculty education + basic additional training (at) |
| Level 5 | Faculty education + deep additional training (at) |
Table 8.
Results measures and level classification.
| No. of Solutions’ | Level | Solutions’ Feasibility | Level | Thinking Activity | Level | Age [Years] | Level | Prior Knowledge | Level | Education Level | Level | |
|---|---|---|---|---|---|---|---|---|---|---|---|---|
| Production company A | 14 | 3 | 8/14 (57%) | 2 | 7 (70%) | 2 | 39 | 3 | General | 3 | Faculty education | 3 |
| Service company A | 10 | 1 | 7/10 (70%) | 3 | 7 (70%) | 2 | 47 | 4 | Basic | 2 | Secondary school + at | 2 |
| Production company B | 11 | 2 | 9/11 (82%) | 4 | 7 (70%) | 2 | 51 | 5 | None | 1 | Secondary School | 1 |
| Service company B | 21 | 5 | 20/21 (95%) | 5 | 9 (95%) | 5 | 29 | 1 | Wide theoretical | 4 | Faculty education + basic at | 4 |
| Production company C | 17 | 4 | 15/17 (88%) | 5 | 9 (90%) | 4 | 32 | 2 | Deep | 5 | Faculty education + deep at | 5 |
| Mix company C | 15 | 3 | 10/15 (67%) | 3 | 9 (80%) | 3 | 42 | 3 | General | 3 | mix | / |
Table 9.
Correlations between number of solutions, solutions’ feasibility, thinking activity, age, and prior knowledge.
Table 9.
Correlations between number of solutions, solutions’ feasibility, thinking activity, age, and prior knowledge.
| Number of Solutions | Solutions’ Feasibility | Thinking Activity | Age | Prior Knowledge | |
|---|---|---|---|---|---|
| Solutions’ feasibility | 0.584 | ||||
| Thinking activity | 0.894 | 0.783 | |||
| Age | −0.900 | −0.467 | −0.894 | ||
| Prior knowledge | −0.800 | 0.467 | 0.783 | −0.900 | |
| Education level | 0.800 | 0.467 | 0.783 | −0.900 | 1.000 |
Table 10.
Results of the mixed team study.
| Number of Solutions | Level | Solutions’ Feasibility | Level | Thinking Activity | Level | Average Age [Years] | |
|---|---|---|---|---|---|---|---|
| Mixed group 1 | 17 | 5 | 14/17 (82%) | 4 | 9 (90%) | 5 | 34.7 |
| Mixed group 2 | 24 | 5 | 21/24 (87.5%) | 5 | 10 (100%) | 5 | 29.5 |
Publisher’s Note: MDPI stays neutral with regard to jurisdictional claims in published maps and institutional affiliations. |
© 2022 by the authors. Licensee MDPI, Basel, Switzerland. This article is an open access article distributed under the terms and conditions of the Creative Commons Attribution (CC BY) license (https://creativecommons.org/licenses/by/4.0/).
Share and Cite
MDPI and ACS Style
Ojstersek, R.; Zhang, H.; Buchmeister, B. The Importance of Employees’ Knowledge in Sustainable, Green Manufacturing: Numerical Modeling Approach. Sustainability 2022, 14, 1344. https://doi.org/10.3390/su14031344
AMA Style
Ojstersek R, Zhang H, Buchmeister B. The Importance of Employees’ Knowledge in Sustainable, Green Manufacturing: Numerical Modeling Approach. Sustainability. 2022; 14(3):1344. https://doi.org/10.3390/su14031344
Chicago/Turabian StyleOjstersek, Robert, Hankun Zhang, and Borut Buchmeister. 2022. "The Importance of Employees’ Knowledge in Sustainable, Green Manufacturing: Numerical Modeling Approach" Sustainability 14, no. 3: 1344. https://doi.org/10.3390/su14031344
Note that from the first issue of 2016, this journal uses article numbers instead of page numbers. See further details here.