
Determinants of Sustainable Cross-Border Cooperation: A Structural Model for the Hungarian Context Using the PLS-SEM Methodology

 , ,
, ,
Abstract
:1. Introduction
- Is cross-border cooperation a multidimensional construct with direct and indirect influence variables?
- Does the development of transport infrastructure have a positive impact on cross-border cooperation?
- Does tourism affect cross-border cooperation? If so, is this impact direct or indirect?
- Do socio-economic conditions influence cross-border cooperation? If so, directly or indirectly?
2. Theoretical Framework and Hypotheses on the Development of Cross-Border Cooperation
2.1. Improving External Competitiveness
2.2. Development of a Theoretical Model
3. Methodology
4. Results
4.1. Survey Data
4.2. Evaluation of the Measurement Model
4.3. Evaluation of Model Structure
4.4. Figures, Tables, and Schemes
4.5. Mediation Analysis
4.6. Impact Assessment
4.7. IPM Analysis
5. Discussion and Conclusions
5.1. Contribution to Research
5.2. Managerial, Theoretical and Research Implications
5.3. Limitations and Recommendations for Future Studies
5.4. Conclusion
Author Contributions
Funding
Institutional Review Board Statement
Informed Consent Statement
Data Availability Statement
Acknowledgments
Conflicts of Interest
References
- Interreg Europe—30 Stories. Interreg Europe. 2020. Available online: https://www.interregeurope.eu/30stories/ (accessed on 12 October 2021).
- Hardi, T. Cities, regions and transborder mobility along and across the border. Discuss. Pap. 2010, 82, 5–27. [Google Scholar]
- Noferini, A.; Berzi, M.; Camonita, F.; Durà, A. Cross-Border Cooperation in the EU: Euroregions amid Multilevel Governance and Re-Territorialization. Eur. Plan. Stud. 2020, 28, 35–56. [Google Scholar] [CrossRef]
- Sereda, A.V.; Mikhaylichenko, Y.G.; Baklanov, P.Y.; Kachur, A.N.; Lappo, A.D.; Danilova, L.V. Contribution of an Integrated Maritime Policy to the Dialogue of Civilisations: The Asia-Pacific Case. J. Mar. Sci. Eng. 2021, 9, 610. [Google Scholar] [CrossRef]
- Martinez, O.J. The Dynamics of Border Interaction: New Approaches to Border Analysis. In Global Boundaries: World Boundaries Series 1; Schofield, C.H., Ed.; Routledge: London, UK, 1994; pp. 1–15. [Google Scholar]
- Kolesnikov, N.G. Border and peripherality as factors of economic development of the region North and the market: The formation of the economic order. Sev. Rynok Form. Èkonomičeskogo Porâdka 2012, 3, 117–120. [Google Scholar]
- Van Houtum, H.J. The Development of Cross-Border Economic Relations, a Theoretical and Empirical Study of the Influence of the State Border on the Development of Cross-Border Economic Relations between Firms in Border Regions of The Netherlands and Belgium; CentER: Tilburg, The Netherlands, 1998. [Google Scholar]
- Khmeleva, G.A. Platform Approach—The Future of Cross-Border Cooperation in the Digital Era. In Digital Technologies in the New Socio-Economic Reality, Lecture Notes in Networks and Systems; Ashmarina, S.I., Mantulenko, V.V., Eds.; Springer: Cham, Switzerland, 2022; Volume 304, pp. 189–196. [Google Scholar]
- Kurnikova, M.V.; Tóth, B.I.; Dodorina, I.V. Development of a Harmonized Digital System for Cross-Border Cooperation in the EU. In Digital Technologies in the New Socio-Economic Reality, Lecture Notes in Networks and Systems; Ashmarina, S.I., Mantulenko, V.V., Eds.; Springer: Cham, Switzerland, 2022; Volume 304, pp. 157–166. [Google Scholar] [CrossRef]
- Ţigu, G.; Andreeva, M.; Nica, A.M. Education and training needs in the field of visitors receiving structures and tourism services in the Lower Danube region. Amfiteatru Econ. J. 2010, 12, 735–760. [Google Scholar]
- Medeiros, E. Cross-border transports and cross-border mobility in EU border regions. Case Stud. Transp. Policy 2019, 7, 1–12. [Google Scholar] [CrossRef]
- Fujimura, M. Cross-Border Transport Infrastructure, Regional Integration and Development. ADBI Discuss. Pap. 2004, 16. Available online: https://hdl.handle.net/10419/53503 (accessed on 14 September 2021).
- Mitrică, B.; Mocanu, I.; Dumitraşcu, M.; Grigorescu, I. Socio-economic disparities in the development of the Romania’s border areas. Soc. Indic. Res. 2017, 134, 899–916. [Google Scholar] [CrossRef]
- Kropinova, E. Cross-national and Cross-Border Cooperation for Sustainable Tourism Development in the Baltic Sea Region. Sustainability 2021, 13, 2111. [Google Scholar] [CrossRef]
- Hutárová, D.; Kozelová, I.; Špulerová, J. Tourism Development Options in Marginal and Less-Favored Regions: A Case Study of Slovakia´s Gemer Region. Land 2021, 10, 229. [Google Scholar] [CrossRef]
- Programme: Interreg V-A Austria-Hungary. Available online: https://cohesiondata.ec.europa.eu/programmes/2014TC16RFCB010 (accessed on 14 September 2021).
- Interreg Romania-Hungary. Available online: https://interreg.eu/programme/interreg-romania-hungary/ (accessed on 14 September 2021).
- Annual Implementation Report 2019 of the Interreg V-A Slovakia-Hungary Cooperation Programme. Available online: https://www.skhu.eu/cmsadmin/asset/preview?id=5f5b807c323ef15a384199e5&0.7492055417879164 (accessed on 14 September 2021).
- Annual Implementation Report 2020.Cooperation Programme Interreg V-A Slovenia–Hungary in the Programming Period 2014–2020. May 2021. Available online: http://www.si-hu.eu/en2/download/AIR-2020-Interreg-SI-HU_2.pdf (accessed on 14 September 2021).
- Interreg V-A Hungary-Croatia Co-Operation Programme. Available online: https://interreg.eu/programme/interreg-hungary-croatia/ (accessed on 14 September 2021).
- Hungary Trade Statistics: Exports, Imports, Products, Tariffs, GDP and Related Development Indicator. Available online: https://wits.worldbank.org/CountryProfile/en/HUN (accessed on 14 September 2021).
- Daniluk, A. Cross-Border Co-Operation by Polish and Belarusian Companies in the Aspect of Increasing the Competitiveness.Economic and Social Development. In Proceedings of the International Scientific Conference on Economic and Social Development, Madrid, Spain, 15–16 September 2017; pp. 598–608. [Google Scholar]
- Wasiluk, A. Companies’ Understanding of Trans-border Cooperation: An Empirical Study in Poland and Republic of Belarus. Eurasian Business Perspectives. In Eurasian Studies in Business and Economics; Bilgin, M., Danis, H., Demir, E., Can, U., Eds.; Springer: Cham, Switzerland, 2019; Volume 10/1, pp. 309–324. [Google Scholar] [CrossRef]
- Korshunov, L.A.; Nikonov, N.M. Network Interactions in the Great Altai Region. Ekon. Reg. 2017, 13, 1123–1137. [Google Scholar] [CrossRef]
- Setnikar Cankar, S.; Seljak, J.; Petkovšek, V. Factors that influence cross-border cooperation between businesses in the Alps–Adriatic region. Econ. Res. Ekon. Istraživanja 2014, 27, 304–319. [Google Scholar] [CrossRef]
- Buitrago, R.R.E.; Camargo, M.I.B.; Vitery, F.C. Emerging Economies’ Institutional Quality and International Competitiveness: A PLS-SEM Approach. Mathematics 2021, 9, 928. [Google Scholar] [CrossRef]
- World Economic Forum. The Global Competitiveness Report 2010–2011; World Economic Forum: Geneva, Switzerland; Available online: https://www3.weforum.org/docs/WEF_GlobalCompetitivenessReport_2010-11.pdf (accessed on 14 September 2021).
- Porter, M. Competitive Strategy: Techniques for Analyzing Industries and Competitors., 2nd ed.; The Free Press: New York, NY, USA, 1998; 397p. [Google Scholar]
- Porter, M. Competitive Advantage: Creating and Sustaining Superior Performance; Simon and Schuster: New York, NY, USA, 2008; p. 592. [Google Scholar]
- Porter, M. The Economic Performance of Regions. Reg. Stud. 2003, 37, 549–578. [Google Scholar] [CrossRef]
- Porter, M.E. The Competitive Advantage of Nations; Free Press: New York, NY, USA, 1990. [Google Scholar]
- Camagni, R.; Capello, R. Regional Competitiveness and Territorial Capital: A Conceptual Approach and Empirical Evidence from the European Union. Reg. Stud. 2013, 47, 1383–1402. [Google Scholar] [CrossRef]
- Boschma, R.A. Proximity and Innovation: A Critical Assessment. Reg. Stud. 2005, 39, 61–74. [Google Scholar] [CrossRef]
- Almeida, P.; Kogut, B. Localization of Knowledge and the Mobility of Engineers in Regional Networks. Manag. Sci. 1999, 45, 905–917. [Google Scholar] [CrossRef] [Green Version]
- Stiglitz, J.E. Globalization, Technology, and Asian Development. Asian Dev. Rev. 2003, 20, 1–18. [Google Scholar]
- Viladecans-Marsal, E.; Arauzo-Carod, J.-M. Knowledge Spillovers and Firm Location: An Analysis of Barcelona’s 22@ District. Documents de Treball de l’IEB 2009, 38. Available online: https://ieb.ub.edu/wp-content/uploads/2018/04/2009-IEB-WorkingPaper-38.pdf (accessed on 14 September 2021).
- Knickel, M.; Neuberger, S.; Klerkx, L.; Knickel, K.; Brunori, G.; Saatkamp, H. Strengthening the Role of Academic Institutions and Innovation Brokers in Agri-Food Innovation: Towards Hybridisation in Cross-Border Cooperation. Sustainability 2021, 13, 4899. [Google Scholar] [CrossRef]
- Stuss, M.M.; Makieła, Z.J.; Stańczyk, I. Role of Competences of Graduates in Building Innovations via Knowledge Cross-fer in the Part of Carpathian Euroregion. Sustainability 2020, 12, 10592. [Google Scholar] [CrossRef]
- Bufon, M.; Markelj, V. Regional Policies and Cross-Border Cooperation: New Challenges and New Development Models in Central Europe. Rev. Română De Geogr. Politică 2010, 12, 18–28. [Google Scholar]
- Bradley, J.; Best, M. Rethinking regional renewal: Towards a cross-border economic development zone in Ireland. J. Cross Bord. Stud. Irel. 2012, 7, 37–58. [Google Scholar]
- Fink, G.; Meierewert, S. Issues of time in international, intercultural management: East and central Europe from the perspective of Austrian managers. J. East Eur. Manag. Stud. 2004, 9, 61–84. [Google Scholar] [CrossRef] [Green Version]
- Wendt, J.A.; Grama, V.; Ilieş, G.; Mikhaylov, A.S.; Borza, S.G.; Herman, G.V.; Bógdał-Brzezińska, A. Cross-port Infrastructure and Political Factors as Determinants of Tourism Development in the Cross-Border Region of Bihor and Maramureş. A Comparative Analysis. Sustainability 2021, 13, 5385. [Google Scholar] [CrossRef]
- Saxena, G.; Ilbery, B. Integrated rural tourism—A border case study. Ann. Tour. Res. 2008, 35, 233–254. [Google Scholar] [CrossRef]
- Khadaroo, J.; Seetanah, B. Cross-port infrastructure and tourism development. Ann. Tour. Res. 2007, 34, 102. [Google Scholar] [CrossRef]
- Sorupia, E. Rethinking the role of Cross-portation in tourism. In Proceedings of the Eastern Asia Society for Cross-Portation Studies, Bangkok, Thailand, 21–24 September 2005; Volume 5, pp. 1767–1777. [Google Scholar]
- Dinu, A.-M. The importance of Cross-portation to tourism development. Acad. J. Econ. Stud. 2018, 4, 183–187. [Google Scholar]
- Pietrzak, M.B.; Balcerzak, A.P.; Gajdos, A.; Arendt, L. Entrepreneurial environment at regional level: The case of Polish path towards sustainable socio-economic development. Entrep. Sustain. Issues 2017, 5, 190–203. [Google Scholar] [CrossRef] [Green Version]
- Zaitseva, N.A.; Semenova, L.; Larionova, A.A.; Yumatov, K.; Hamnaeva, N.I. The role of human resource capacity to ensure the competitiveness of the cross-border cooperation projects in the tourism and hospitality industry. Int. Electron. J. Math. Educ. 2016, 11, 1961–1970. [Google Scholar]
- Raposo, M.L.; Ferreira, J.J.M.; Fernandes, C.I. Local and cross-border SME cooperation: Effects on innovation and performance. Rev. Eur. Dir. Econ. Empresa 2014, 23, 157–165. [Google Scholar] [CrossRef] [Green Version]
- Ravlić, S.; Glavaš, J.; Šimunić, M. The impact of the IPA Cross-border co-operation Hungary-Croatia 2007–2013 programme-infrastructure, tourism and human capital. Zb. Veleučilišta Rijeci 2020, 8, 135–149. [Google Scholar] [CrossRef]
- Hosten, N.; Rosenberg, B.; Kram, A. Project Report on Telemedicine: What We Learned about the Administration and Development of a Binational Digital Infrastructure Project. Healthcare 2021, 9, 400. [Google Scholar] [CrossRef]
- Bagozzi, R.P.; Philipps, L.W. Representing and testing organizational theories: A holistic construal. Adm. Sci. Q. 1982, 27, 459–489. [Google Scholar] [CrossRef]
- Hair, J.F.; Hult, G.T.M.; Ringle, C.M.; Sarstedt, M.; Danks, N.P.; Ray, S. An Introduction to Structural Equation Modeling. In Partial Least Squares Structural Equation Modeling Using R.; Springer: Cham, Switzerland, 2010; pp. 1–29. [Google Scholar] [CrossRef]
- Williams, L.J.; Vandenberg, R.J.; Edwards, J.R. 12 Structural Equation Modeling in Management Research: A Guide for Improved Analysis. Acad. Manag. Ann. 2009, 3, 543–604. [Google Scholar] [CrossRef]
- Checkland, P. Towards a Systems Based Methodology for Real-World Problem Solving. J. Syst. Eng. 1972, 3, 87–116. [Google Scholar]
- Wold, H.O. Soft modelling: Intermediate between traditional model building and data analysis. Banach Cent. Publ. 1980, 6, 333–346. [Google Scholar] [CrossRef] [Green Version]
- Henseler, J.; Ringle, C.M.; Sarstedt, M. Using Partial Least Squares Path Modeling in International Advertising Research: Basic Concepts and Recent Issues. In Handbook of Partial Least Squares: Concepts, Methods and Applications in Marketing and Related Fields; Okzaki, S., Ed.; Springer: Berlin, Germany, 2012; pp. 252–276. [Google Scholar]
- Roldán, J.; Sánchez-Franco, M. Variance-Based Structural Equation Modeling: Guidelines for Using Partial Least Squares in Information Systems Research. In Research Methodologies, Innovations and Philosophies in Software Systems Engineering and Information Systems; Mora, M., Steenkamp, A., Johnston, L., Gamon, J., Eds.; IGI Global: Hershey, PA, USA, 2012; pp. 193–221. [Google Scholar]
- Henseler, J.; Ringle, C.M.; Sarstedt, M. Testing measurement invariance of composites using partial least squares. Int. Mark. Rev. 2016, 33, 405–431. [Google Scholar] [CrossRef]
- Hair, J.F., Jr.; Hult, G.T.M.; Ringle, C.; Sarstedt, M. A Primer on Partial Least Squares Structural Equation Modeling; SAGE Publications: Thousand Oaks, CA, USA, 2013. [Google Scholar]
- Sarstedt, M.; Ringle, C.M.; Cheah, J.H.; Ting, H.R.; Moisescu, O.I.; Radomir, L. Structural model robustness checks in PLS-SEM. Tour. Econ. 2020, 26, 531–554. [Google Scholar] [CrossRef]
- Hair, J.; Hollingsworth, C.L.; Randolph, A.B.; Chong, A.Y.L. An updated and expanded assessment of PLS-SEM in information systems research. Ind. Manag. Data Syst. 2017, 117, 442–458. [Google Scholar] [CrossRef]
- Ramli, N.A.; Latan, H.; Nartea, G.V. Why Should PLS-SEM Be Used Rather Than Regression? Evidence from the Capital Structure Perspective. In Partial Least Squares Structural Equation Modeling; Avkiran, N.K., Ringle, C.M., Eds.; Springer: Cham, Switzerland, 2018; pp. 171–209. [Google Scholar]
- Hair, J.F., Jr.; Sarstedt, M.; Ringle, C.M.; Gudergan, S.P. Advanced Issues in Partial Least Squares Structural Equation Modeling; SAGE Publications: Thousand Oaks, CA, USA, 2017. [Google Scholar]
- Ringle, C.M.; Sinkovics, R.R.; Henseler, J. The Use of Partial Least Squares Path Modeling in International Marketing. In New Challenges to International Marketing; Emerald Group Publishing Limited: West Yorkshire, UK, 2009; pp. 277–319. [Google Scholar]
- Abbas, J.; Raza, S.; Nurunnabi, M.; Minai, M.S.; Bano, S. The Impact of Entrepreneurial Business Networks on Firms’ Performance Through a Mediating Role of Dynamic Capabilities. Sustainability 2019, 11, 3006. [Google Scholar] [CrossRef] [Green Version]
- Cheah, J.H.; Sarstedt, M.; Ringle, C.M.; Ramayah, T.; Ting, H. Convergent validity assessment of formatively measured constructs in PLS-SEM: On using single-item versus multi-item measures in redundancy analyses. Int. J. Contemp. Hosp. Manag. 2018, 30, 3193–3210. [Google Scholar] [CrossRef]
- Wold, H. Soft modeling: The basic design and some extensions. Syst. Under Indirect. Obs. 1982, 2, 343. [Google Scholar]
- Garson, G.D. Partial Least Squares: Regression and Structural Equation Models; Asheboro, N.C., Ed.; Statistical Associates Publishers: USA, 2016; Available online: https://scholar.google.com.hk/scholar?hl=en&as_sdt=0%2C5&q=Partial+Least+Squares%3A+Regression+and+Structural+Equation+Models&btnG= (accessed on 1 October 2021).
- Hair, J.F.; Ringle, C.M.; Sarstedt, M. PLS-SEM. J. Mark. Theory Pract. 2011, 19, 139–152. [Google Scholar] [CrossRef]
- Hair, J.F.; Hult, G.T.; Ringle, C.M.; Sarstedt, M. A Primer on Partial Least Squares Structural Equation Modeling, 2nd ed.; SAGE Publications: Thousand Oaks, CA, USA, 2017. [Google Scholar]
- Fornell, C.; Larcker, D. Structural equation models with unobservable variables and measurement error. J. Mark. Res. 1981, 18, 39–50. [Google Scholar] [CrossRef]
- Daskalakis, S.; Mantas, J. Evaluating the impact of a service-oriented framework for healthcare interoperability. Stud. Health Technol. Inform. 2008, 136, 285–290. [Google Scholar]
- Henseler, J.; Hubona, G.; Ray, P.A. Using PLS path modeling in new technology research: Updated guidelines. Ind. Manag. Data Syst. 2016, 116, 2–20. [Google Scholar] [CrossRef]
- Hu, L.-T.; Bentler, P.M. Cutoff criteria for fit indexes in covariance structure analysis: Conventional criteria versus new alternatives. Struct. Equ. Modeling 1999, 6, 1–55. [Google Scholar] [CrossRef]
- Cohen, J. Statistical Power Analysis for the Behavioural Sciences, 2nd ed.; Lawrence Erlbaum: Hillside Mahwah, NJ, USA, 1988; Available online: http://www.utstat.utoronto.ca/~brunner/oldclass/378f16/readings/CohenPower.pdf (accessed on 20 October 2021).
- Regulation (EU) No 1315/2013 of the European Parliament and of the Council of 11 December 2013 on Union Guidelines for the Development of the Trans-European Transport Network and Repealing Decision No 661/2010/EU. Available online: https://eur-lex.europa.eu/legal-content/EN/TXT/?uri=celex%3A32013R1315 (accessed on 20 October 2021).
- Trans-European Road Network, TEN-T (Roads): 2019 Performance Report. CEDR Working Group 3.5. Available online: https://www.cedr.eu/download/Publications/2020/CEDR-Technical-Report-2020-01-TEN-T-2019-Performance-Report.pdf (accessed on 20 October 2021).
- Serbian President Inspects Belgrade-Budapest Railway Project. Source: Xinhua. Available online: http://www.xinhuanet.com/english/2021-03/26/c_139836275_2.htm (accessed on 20 October 2021).
- Khan, S.; Khan, M.K.; Muhammad, B. Impact of financial development and energy consumption on environmental degradation in 184 countries using a dynamic panel model. Environ. Sci. Pollut. Res. 2021, 28, 9542–9557. [Google Scholar] [CrossRef]
- Khan, M.K.; Teng, J.Z.; Khan, M.I.; Khan, M.O. Impact of globalization, economic factors and energy consumption on CO2 emissions in Pakistan. Sci. Total Environ. 2019, 688, 424–436. [Google Scholar] [CrossRef]
- Muhammad, B.; Khan, M.K. Foreign direct investment inflow, economic growth, energy consumption, globalization, and carbon dioxide emission around the world. Environ. Sci. Pollut. Res. 2021, 28, 55643–55654. [Google Scholar] [CrossRef]


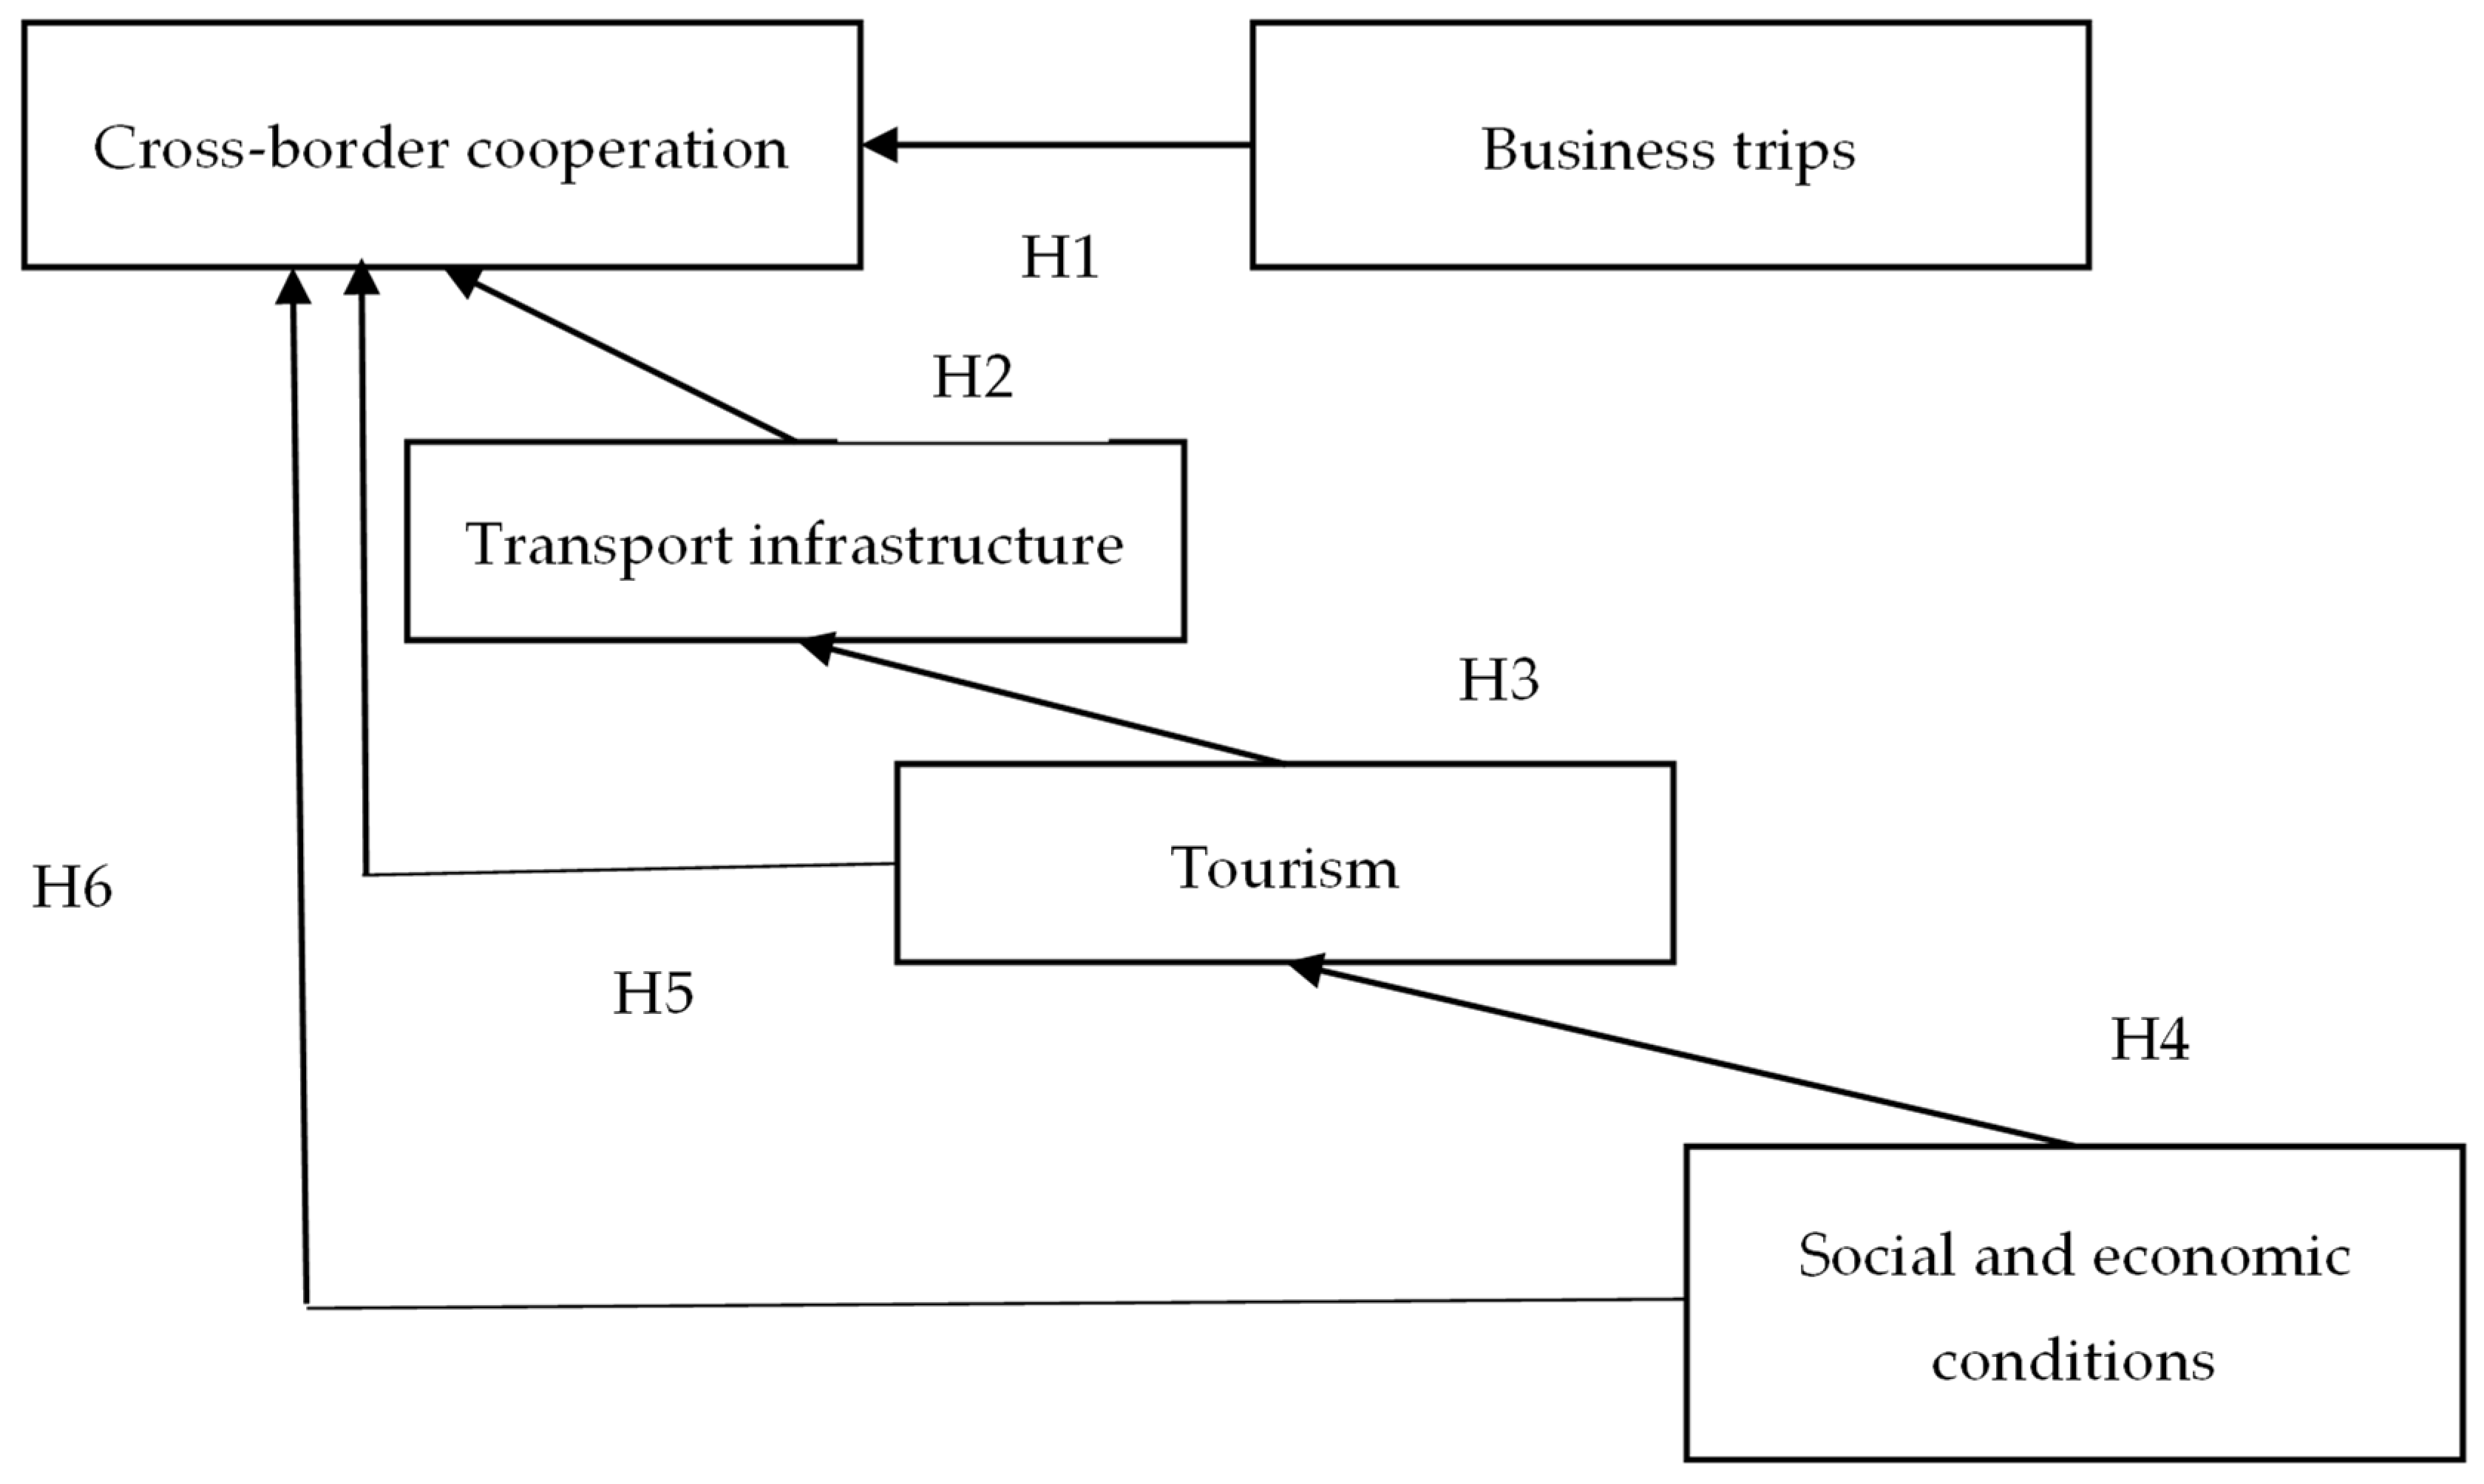
| Construct | Description | Testable Hypothesis |
|---|---|---|
| Cross-border cooperation | Cross-border cooperation is a multidimensional construct. The number of business trips characterizes cross-border cooperation. | H1 |
| Transport infrastructure | Transport infrastructure provides connectivity between territories, as it enables the exchange of goods and people between neighboring countries. It includes road networks, electric rail networks, and navigable inland waterways networks. | H2 |
| Tourism | To a large extent, this determines the state of the infrastructure. Countries are developing infrastructure not only for entrepreneurship but also for tourism. | H3 |
| Socio-economic conditions | If architecture is of direct interest to tourists, then socio-economic conditions (Internet penetration, research and development costs, e-commerce, and proportion of renewable sources in final consumption) make these artifacts most attractive for tourists and ensure a comfortable stay for them. | H4 |
| Mediation analysis | Mediation is manifested in the existence of an intermediate variable between two interconnected constructs.The study verified the existence of proxy variables influencing the design of cross-border cooperation. | H5 H6 |
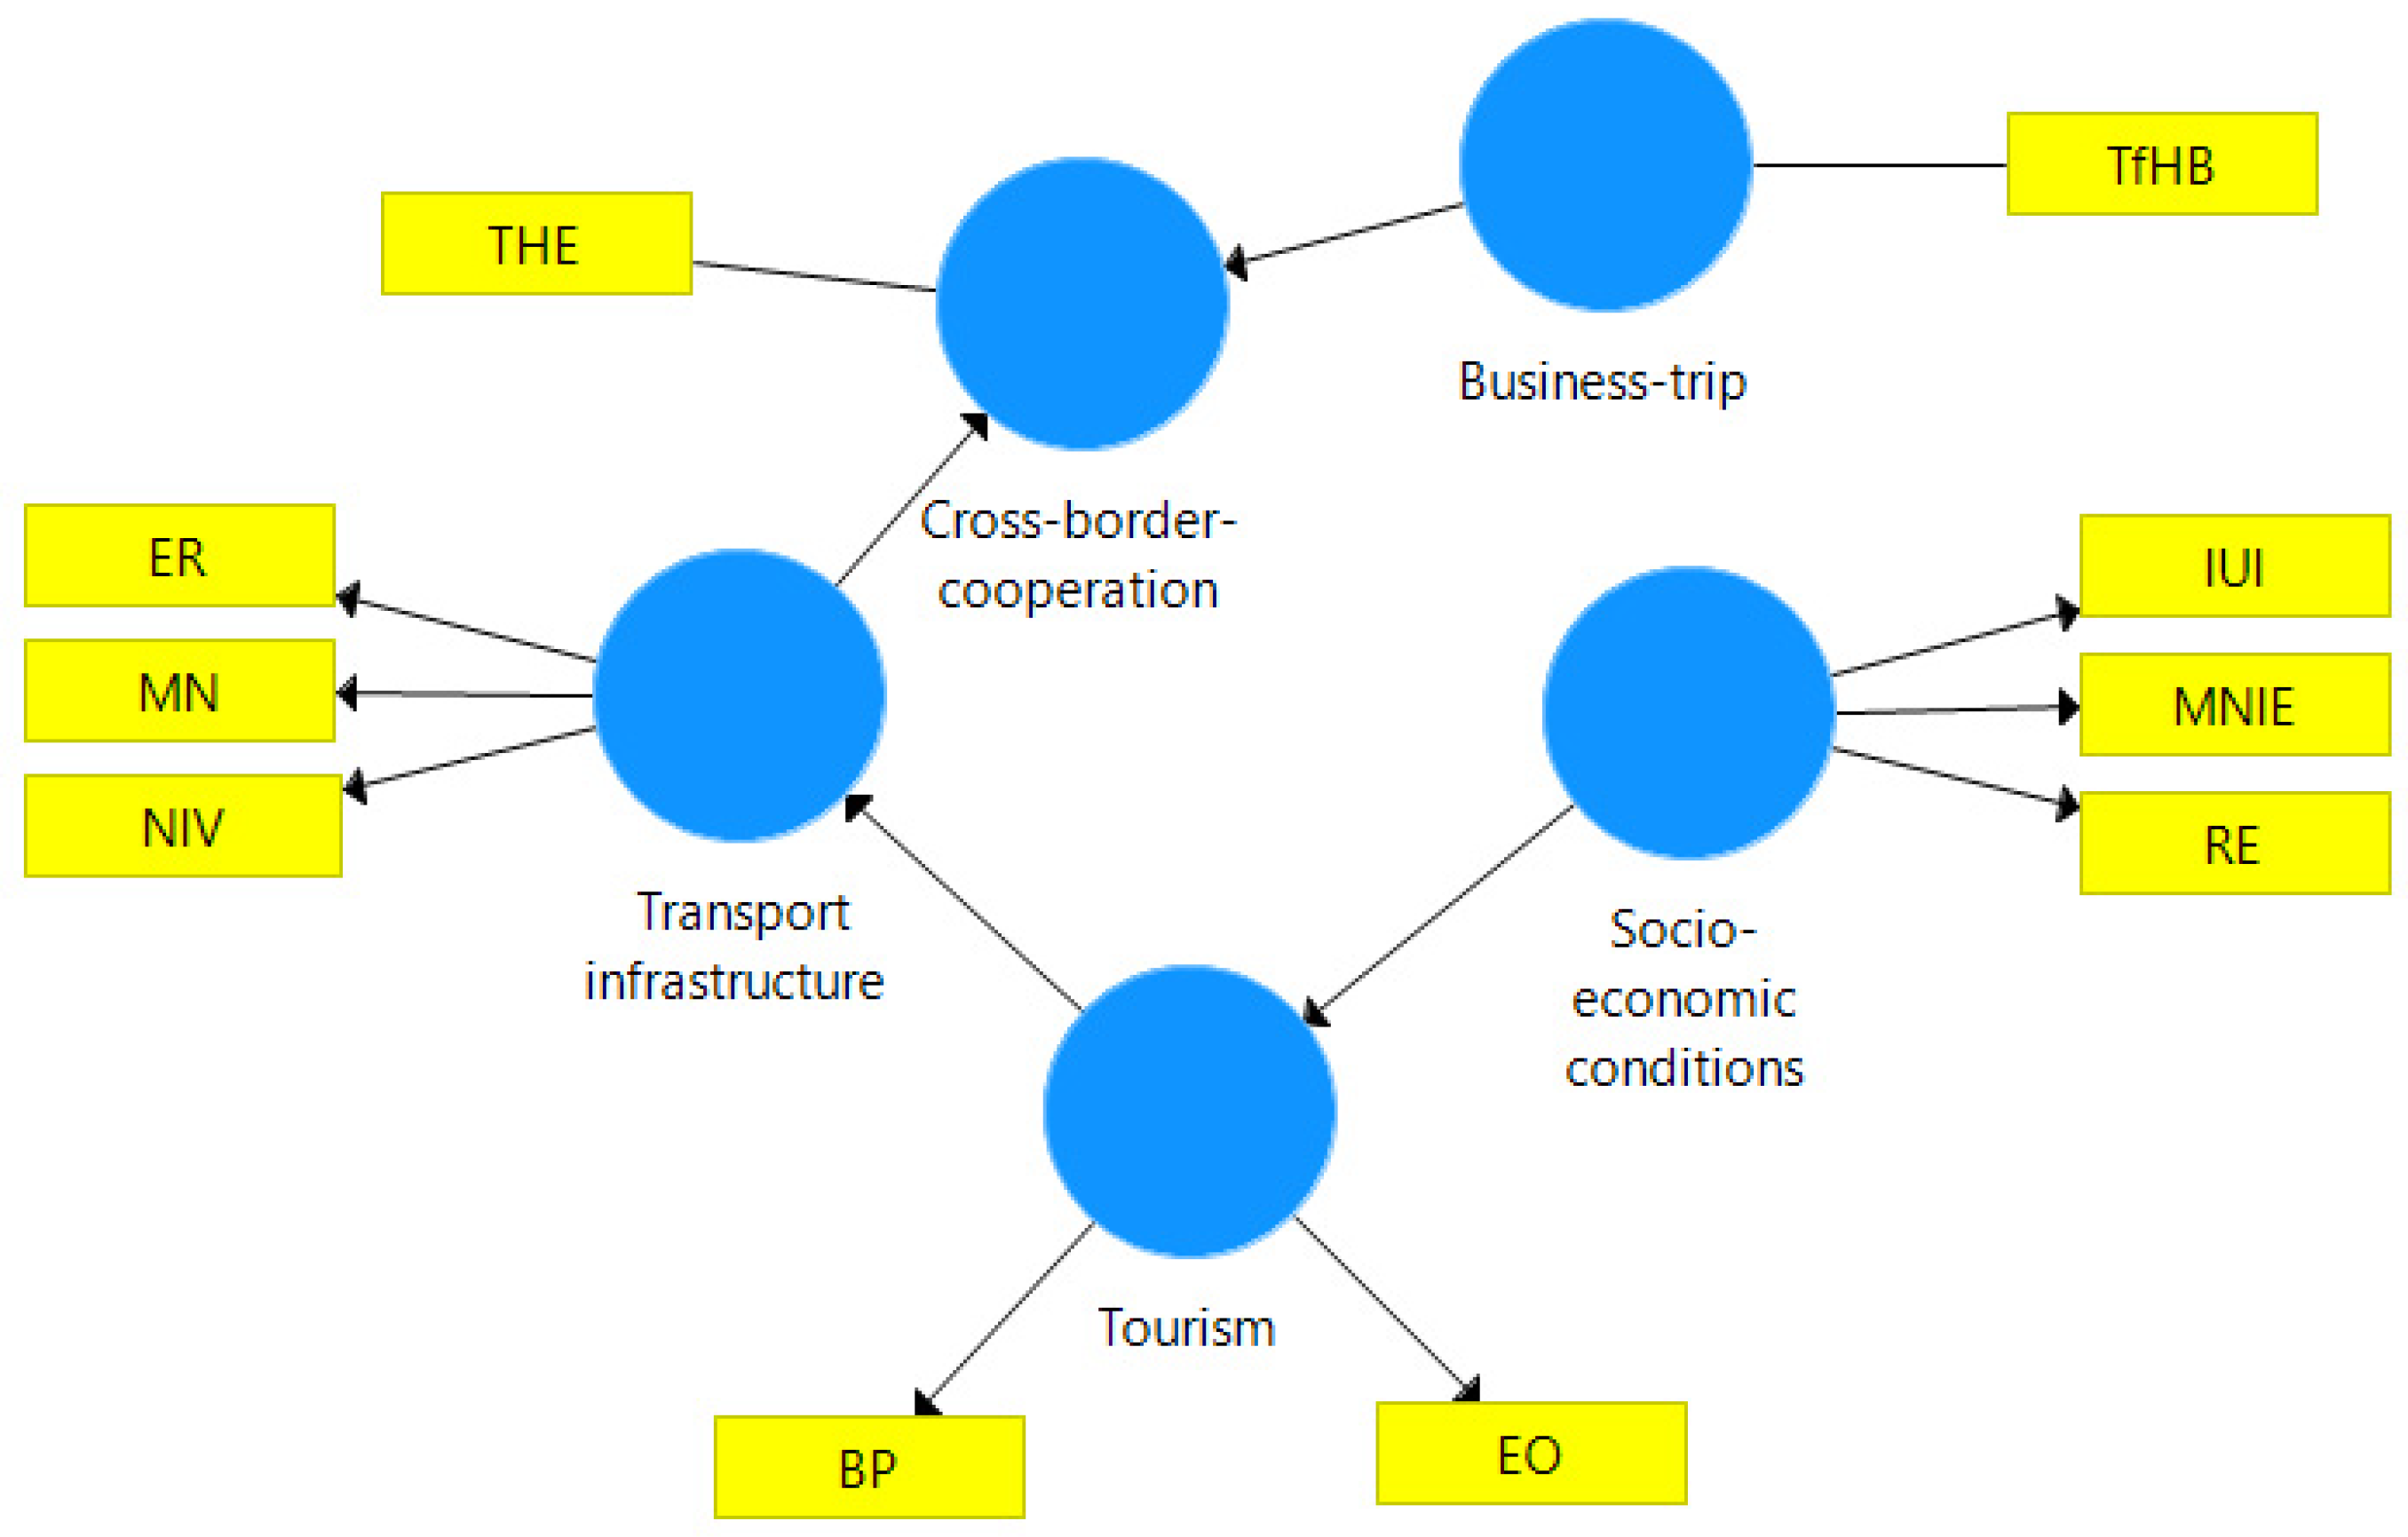
| Hypothesis | Item Code | Indicators |
|---|---|---|
| H1 | TfHB | Number of trips by country from Hungary, 1 night or over, purpose: business trip |
| H2 | THE | High-tech exports, percentage |
| EX | Export (US$ thousand) | |
| H3 | ER | Electrified railway lines |
| MN | Motorways networks, km. | |
| NIV | Navigable inland waterways networks, km. | |
| H3 | BP | Number of bed-places, hotels; holiday and other short-stay accommodation; camping grounds, recreational vehicle parks, and trailer parks |
| EO | Expenditure outbound total, 1 night or over, thousand euro | |
| H4 | IUI | Individuals using the internet for ordering goods or services from other EU countries, all Individuals, percentage of individuals |
| MNIE | Median equalized net income, Euro | |
| RE | Share of renewable energy in gross final energy consumption, percentage | |
| FDI | Foreign direct investment, net inflows (BoP, current US$) | |
| PE58 | Population by educational attainment level, tertiary education (levels 5–8) from 25 to 64 years | |
| FL2 | Number of foreign languages known percentage, 2 languages |
| Construct | Item Code | Outer Loadings | R2 | Cronbach’s Alpha (CA) | Composite Reliability Test (CR) | Average Variance Extracted (AVE) |
|---|---|---|---|---|---|---|
| Business-trip | 1.000 | 1.000 | 1.000 | |||
| TfHb | 1.000 | |||||
| Cross-border cooperation | 0.674 | 1.000 | 1.000 | 1.000 | ||
| EX | 1.000 | |||||
| Transport infrastructure | 0.465 | 0.700 | 0.798 | 0.576 | ||
| ER | 0.763 | |||||
| MN | 0.903 | |||||
| NIV | 0.574 | |||||
| Tourism | 0.713 | 0.799 | 0.890 | 0.802 | ||
| BP | 0.874 | |||||
| EO | 0.917 | |||||
| Socio-economic conditions | 0.756 | 0.884 | 0.719 | |||
| IUI | 0.827 | |||||
| MNIE | 0.949 | |||||
| RE | 0.756 |
| Business-Trip | Transport Infrastructure | Socio-Economic Conditions | Tourism | |
|---|---|---|---|---|
| Transport infrastructure | 0.705 | |||
| Socio-economic conditions | 0.349 | 0.656 | ||
| Tourism | 0.055 | 0.796 | 1.066 | |
| Cross-border cooperation | 0.710 | 0.769 | 0.319 | 0.545 |
| Transport Infrastructure | Socio-Economic Conditions | Tourism | Cross-Border Cooperation | |
|---|---|---|---|---|
| Business-trip | 1.374 | |||
| Transport infrastructure | 1.374 | |||
| Socio-economic conditions | 1.000 | |||
| Tourism | 1.000 |
| Hypothesis | Original Sample (O) | Sample Mean (M) | Standard Deviation (STDEV) | T Statistics (O/ STDEV) | p -Values | Results of the Hypothesis Test |
|---|---|---|---|---|---|---|
| H1: Business-trip > Cross-border cooperation | 0.458 | 0.458 | 0.093 | 4.917 | 0.000 (<0.01) | Confirmed |
| H2: Transport infrastructure > Cross-border cooperation | 0.483 | 0.486 | 0.108 | 4.454 | 0.000 (<0.01) | Confirmed |
| H3: Tourism > Transport infrastructure | 0.682 | 0.687 | 0.100 | 6.797 | 0.000 (<0.01) | Confirmed |
| H4: Socio-economic conditions > Tourism | 0.844 | 0.842 | 0.050 | 16.909 | 0.000 (<0.01) | Confirmed |
| Hypothesis | Original Sample (O) | Sample Mean (M) | Standard Deviation (STDEV) | T Statistics (O/STDEV) | p-Values |
|---|---|---|---|---|---|
| H5: Tourism—>Cross-border cooperation | 0.329 | 0.341 | 0.110 | 3.008 | 0.000 |
| H6: Socio-economic conditions—>Cross- border cooperation | 0.278 | 0.291 | 0.103 | 2.707 | 0.000 |
| Transport Infrastructure | Socio-Economic Conditions | Tourism | Cross-Border Cooperation | |
|---|---|---|---|---|
| Transport infrastructure | 0.458 | |||
| Socio-economic conditions | 0.576 | 0.844 | 0.278 | |
| Tourism | 0.682 | 0.329 |
| Transport Infrastructure | Tourism | Cross-Border Cooperation | |
|---|---|---|---|
| Business-trip | 0.468 | ||
| Transport infrastructure | 0.521 | ||
| Socio-economic conditions | 2.484 | ||
| Tourism | 0.869 |
| Cross-Border Cooperation Impact | LV Performance | |
|---|---|---|
| Business-trip | 0.458 | 13.768 |
| Transport infrastructure | 0.483 | 49.410 |
| Socio-economic conditions | 0.278 | 33.548 |
| Tourism | 0.329 | 36.259 |
| Cross- border cooperation | 40.004 |
Publisher’s Note: MDPI stays neutral with regard to jurisdictional claims in published maps and institutional affiliations. |
© 2022 by the authors. Licensee MDPI, Basel, Switzerland. This article is an open access article distributed under the terms and conditions of the Creative Commons Attribution (CC BY) license (https://creativecommons.org/licenses/by/4.0/).
Share and Cite
Khmeleva, G.A.; Kurnikova, M.V.; Nedelka, E.; Tóth, B.I. Determinants of Sustainable Cross-Border Cooperation: A Structural Model for the Hungarian Context Using the PLS-SEM Methodology. Sustainability 2022, 14, 893. https://doi.org/10.3390/su14020893
Khmeleva GA, Kurnikova MV, Nedelka E, Tóth BI. Determinants of Sustainable Cross-Border Cooperation: A Structural Model for the Hungarian Context Using the PLS-SEM Methodology. Sustainability. 2022; 14(2):893. https://doi.org/10.3390/su14020893
Chicago/Turabian StyleKhmeleva, Galina Anatolievna, Marina Viktorovna Kurnikova, Erzsébet Nedelka, and Balázs István Tóth. 2022. "Determinants of Sustainable Cross-Border Cooperation: A Structural Model for the Hungarian Context Using the PLS-SEM Methodology" Sustainability 14, no. 2: 893. https://doi.org/10.3390/su14020893