Article

A Diachronic Analysis of a Changing Landscape on the Duero River Borderlands of Spain and Portugal Combining Remote Sensing and Ethnographic Approaches

by
Kyle P. Hearn
1,* and
Jesús Álvarez-Mozos
2
1
Department of Human Sciences and Education, Public University of Navarre, 31006 Pamplona, Spain
2
Department of Engineering, Institute for Sustainability and Food Chain Innovation (IS-FOOD), Public University of Navarre, 31009 Pamplona, Spain
*
Author to whom correspondence should be addressed.
Sustainability 2021, 13(24), 13962; https://doi.org/10.3390/su132413962
Submission received: 16 November 2021 / Revised: 6 December 2021 / Accepted: 14 December 2021 / Published: 17 December 2021
(This article belongs to the Special Issue Multi-Temporal Analysis of Landscapes and Urban Areas)

Abstract

:
The Arribes del Duero region spans the border of both Spain and Portugal along the Duero River. On both sides of the border, the region boasts unique human-influenced ecosystems. The borderland landscape is dotted with numerous villages that have a history of maintaining and managing an agrosilvopastoral use of the land. Unfortunately, the region in recent decades has suffered from massive outmigration, resulting in significant rural abandonment. Consequently, the once-maintained landscape is evolving into a more homogenous vegetative one, resulting in a greater propensity for wildfires. This study utilizes an interdisciplinary, integrated approach of “bottom up” ethnography and “top down” remote sensing data from Landsat imagery, to characterize and document the diachronic vegetative changes on the landscape, as they are perceived by stakeholders and satellite spectral analysis. In both countries, stakeholders perceived the current changes and threats facing the landscape. Remote sensing analysis revealed an increase in forest cover throughout the region, and more advanced, drastic change on the Spanish side of the study area marked by wildfire and a rapidly declining population. Understanding the evolution and history of this rural landscape can provide more effective management and its sustainability.

1. Introduction

Since the mid-20th century, a demographic shift from rural to urban society has occurred in much of the world [1,2]. In the European Union, Spain and Portugal are among the most affected in this demographic shift, in terms of rural agricultural land abandonment. According to the European Commission, by 2030 Spain is expected to lose the highest level of agricultural land due to land abandonment in the European Union, at over 1 million hectares. Portugal, despite its smaller percentage of arable land, is expected to be three percent above the EU average of land abandonment [3]. Worldwide, causes of rural land abandonment vary among demographic [4], political [5], socioeconomic, and ecological shifts [6,7]. Although rural abandonment has undoubtedly led to more wild vegetative growth, in some regions it has had positive effects as a means of carbon sequestration, the improvement of water quality, or the prevention of soil erosion [8,9]. For the Mediterranean region, however, it has often led a decrease in biodiversity [10].
The biodiversity found in Mediterranean ecosystems evolved as a result of the historical development of a “mosaic” of habitats created by human agrosilvopastoral use of the landscape [11,12]. Rural abandonment has contributed to a loss of biodiversity and habitats, but the consequent increase in vegetative growth [13,14] has also been a significant cause of wildfire, particularly in southern Europe [15,16].
Recognizing the demographic decline of rural agropastoral economies and communities, governments have looked to strategies to mitigate the ecological and socioeconomic effects of these changes [17]. Focusing on both the rural and the ecological characteristics of these regions, natural parks and biosphere reserves have been created in order to readjust the ecosystem services of the landscapes from ones based on provisioning (food production, fuel, and water) to another favoring support services, represented by ecological protection and the promotion of rural tourism [18,19]. Although perhaps introducing a new source of regional income through ecological and cultural tourism from natural park creation, the policy of preserving forest resources has only exacerbated the increase in vegetative growth initially caused by land abandonment and puts into question the idea of landscape sustainability defined by Wu as the “capacity of a landscape to consistently provide long-term, landscape specific ecosystem services essential for maintaining and improving human well-being” [20]. These preservation policies have had social consequences as well. Residents, accustomed to traditional land use, often struggle to make these adjustments from the more top-down decisions, often resulting in resentment and even conflict [5,21,22,23,24].
The loss of rural landscapes throughout the world and particularly in Europe has both ecological and cultural implications. Policies to prevent this loss, and approaches to analyze it, require strategies that recognize the synergy of the ecological and cultural aspects of landscape. An interdisciplinary “toolbox”, implementing methods from archaeology, ethnography, and the environmental sciences, is essential to monitor the land cover diachronic changes in rural landscapes that have become more intensified in the last 60 years [25,26]. Monitoring land cover over time has been accomplished using a plethora of tools, from the incorporation of georeferenced historic maps [25], multi-source spatial data [27], and satellite image analysis [28,29,30], plus the combination of socioeconomic data with satellite image analysis [31]. Documenting temporal regional changes using a variety of sources will be necessary to effectively protect, manage, and plan for the future of these rapidly changing landscapes.
Building on previous interdisciplinary archaeological/historical landscape studies conducted in the region [32,33,34,35], this research adds to the diachronic analyses of the anthropic influence on this landscape. This study aims to demonstrate the land cover changes that have occurred as a result of socioeconomic factors and human decisions since the early 1980s to the present day. It will detail this land cover evolution through the integration of three data sets: (1) Ethnographic data, (2) Remote sensing spectral analysis, and (3) Demographic statistical data.

2. Materials and Methods
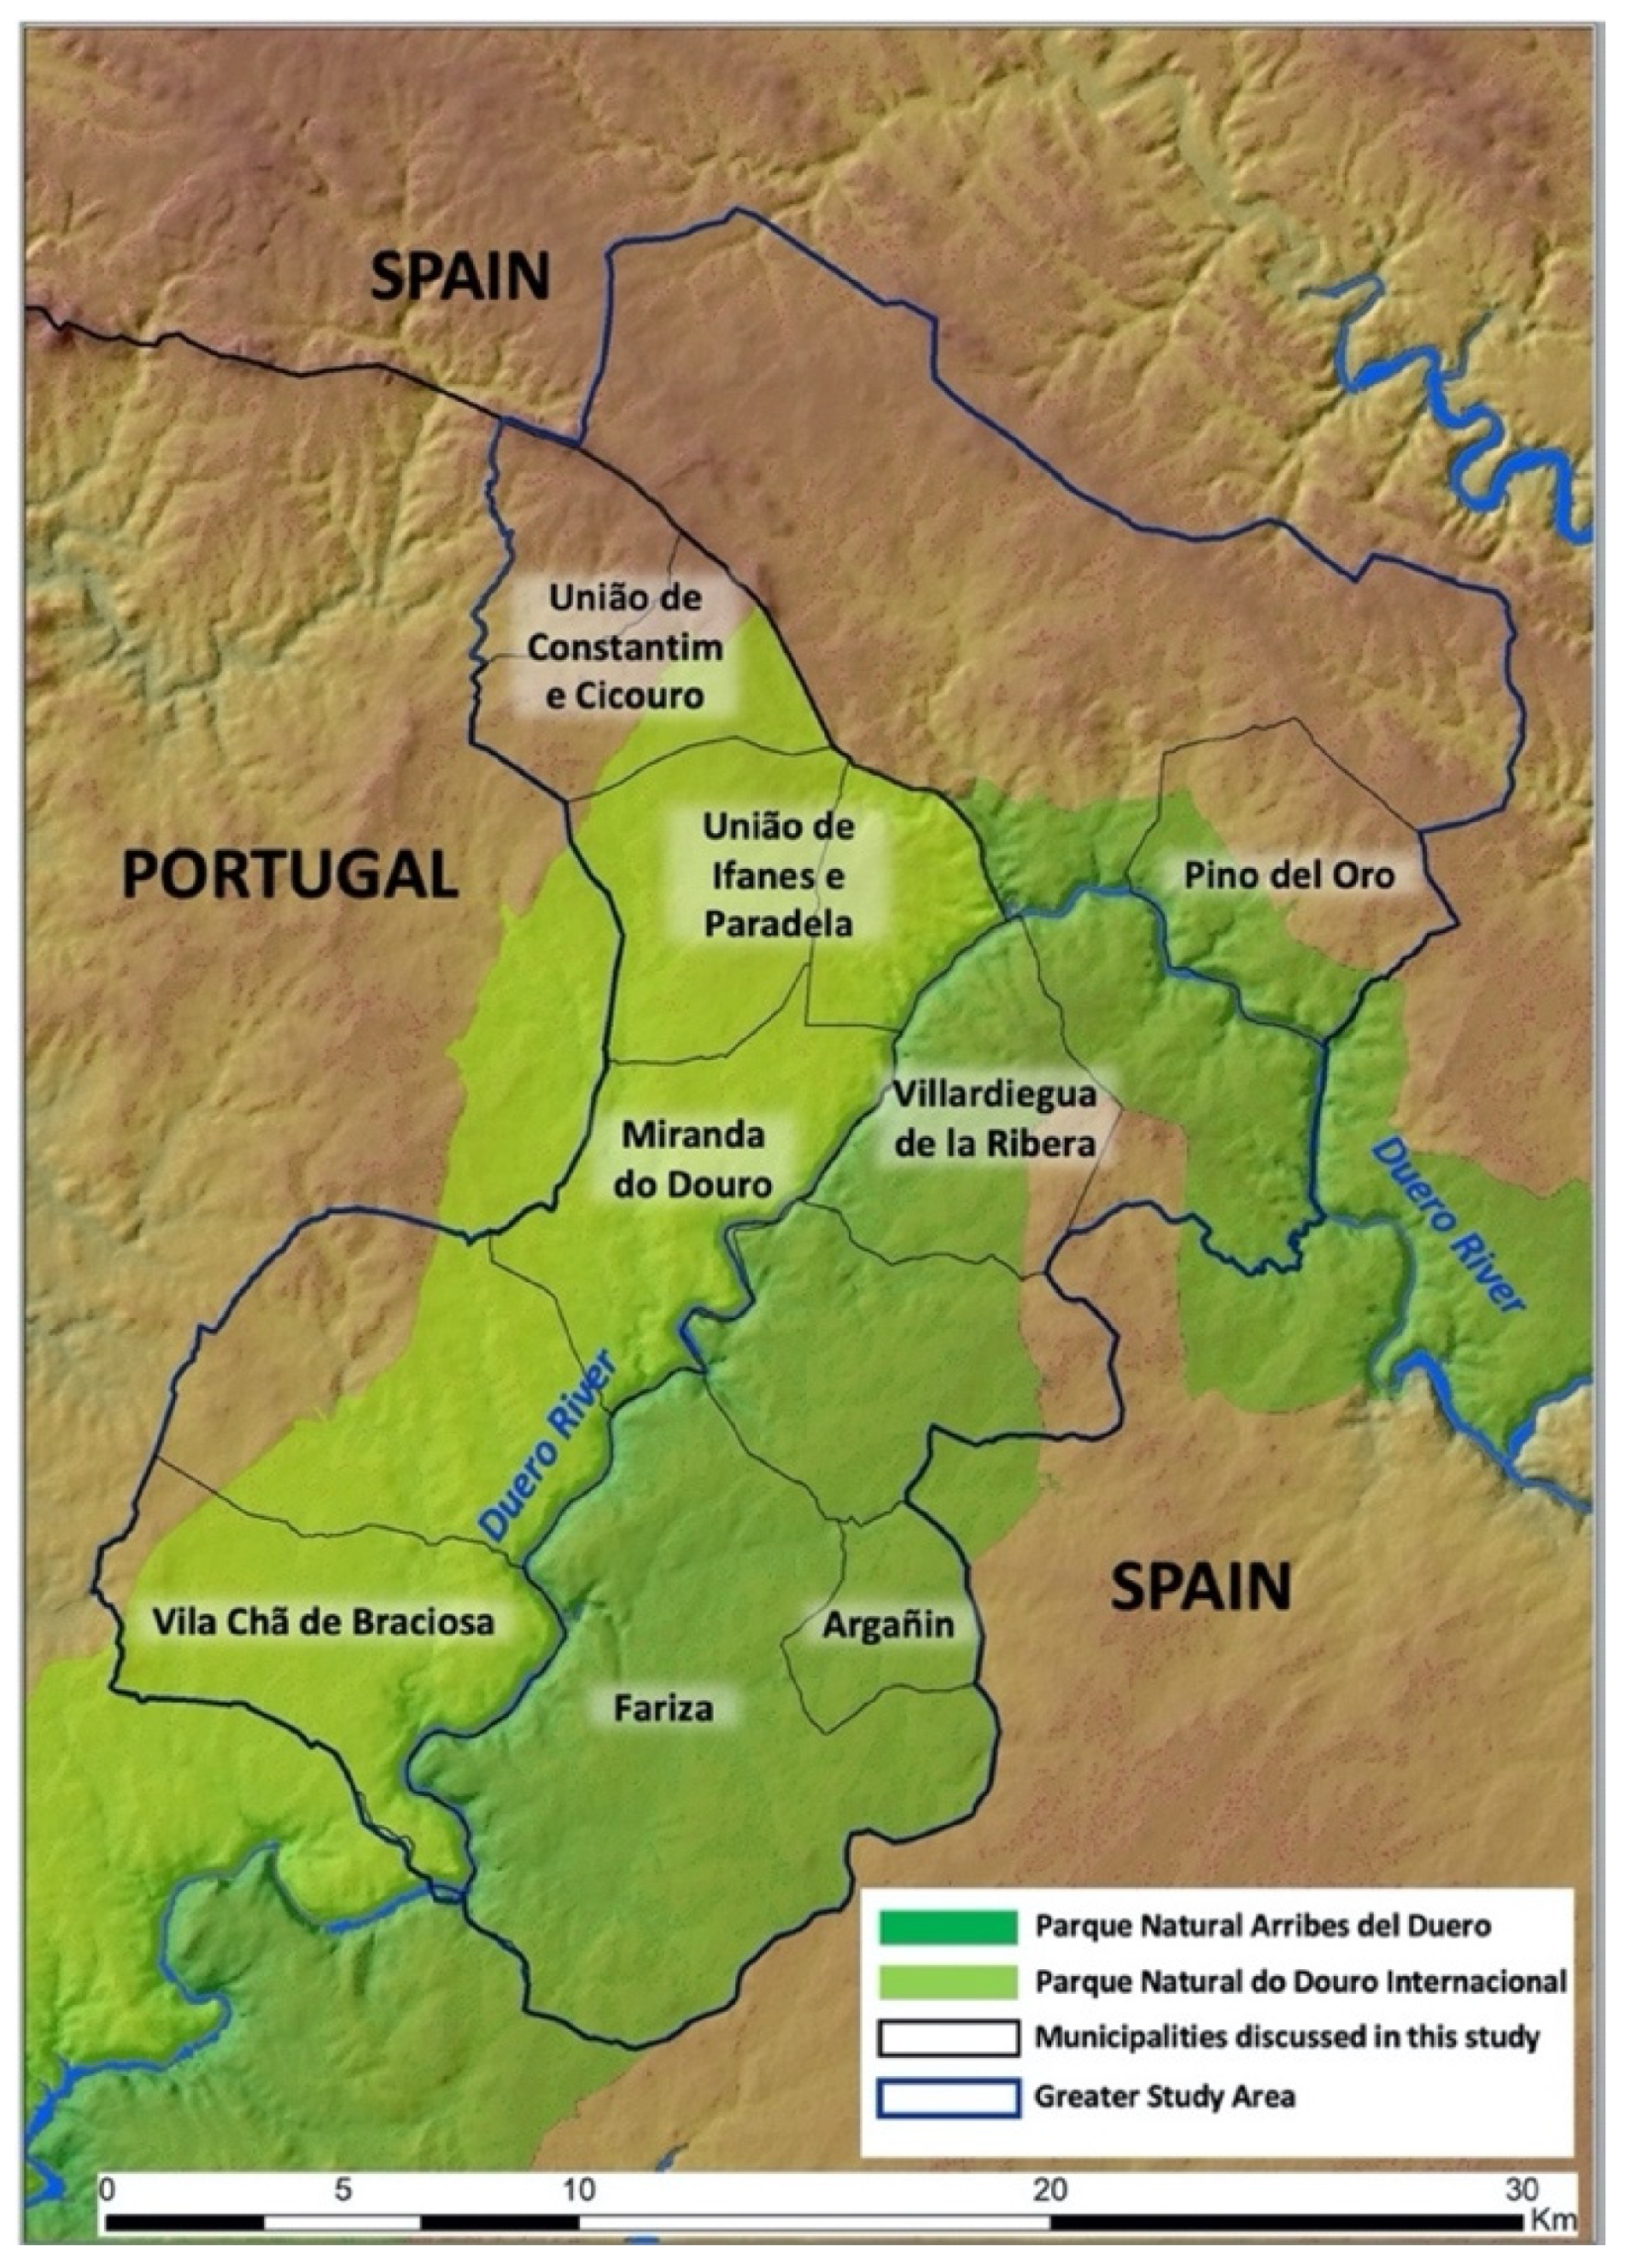
2.1. The Study Area

The study area is composed of two parallel border regions between Portugal and Spain, expanding over an area of 56,764 hectares (Figure 1). The Duero River, forming much of the border between these two nations, forms both an ecological and cultural focal corridor. Expanding outward from the banks of this iconic river, the research area includes eight pilot case study municipalities on both sides of the border. In Portugal, they consist of four parishes in the county of Miranda do Douro: Constantim-Cicouro (3633 ha), Ifanes-Paradela (4470 ha), Miranda do Douro (3551 ha), and Vila Chã de Braciosa (4293 ha) in the south. Opposite of these parishes, to the east on the Spanish side of the Duero River, the study area consists of four Spanish municipalities: Pino del Oro (2960 ha), Villardiegua de la Ribera (2887 ha), Argañín (1265 ha), and Fariza (9044 ha).
The region has two microclimates: a warmer, less fluctuating, Mediterranean one in the river valley, and the other, located on the high plains on both sides of the Duero River. Prone to extreme seasonal variation, the high plains region has more continental-type temperature variation [36,37]. The natural vegetation in these microclimate zones is varied as well. Within the sheltered deep river valley, several Quercus species can be found with Pistacia terebinthus and Juniperus oxycedrus subsp. Badia. These stands are mixed with scrub vegetation such as Lavandula stoechas, Cytisus multifloris, and Daphne gnidum. Extending out onto the plains away from the river both Quercus ilex and Quercus pyrenaica become the more dominant arboreal wild species [36,37]. Mixed with cereal crop agriculture on the plains are other scrub species such as Cytisus scoparious, Genista hystrix, and Cistus landanifer. In lesser alluvial systems on the plains, ash trees Fraxinus angustifolia interspersed with several species of willow (Salix fragilis, Salix atrocinerea and Salix salviifolia) can be found as well.
Over the centuries, humanity has significantly altered the landscape with agrosilvopastoralism. Viticulture and various Mediterranean tree crops have become established. Cereal crops, namely rye, wheat, and barley, were planted in soils most suitable for their cultivation in the larger expanses away from the cluster settlements in each municipality. Horticulture for subsistence/domestic consumption dominated the village core and nearby surrounding plots. Intermixed with the agriculture on the larger plots extending from the village core was a system of crop rotation dating to the late Middle Ages/Early Modern period [38,39,40]. In municipal areas that were not apt for agriculture due to overly acidic or rocky soil quality [36], scrub and wooded vegetation was common, which in turn was used for rough grazing. On the wooded canyon cliffs descending to the Duero River, caprine rough pasturing was most prevalent. As populations stabilized and increased in these villages in the early Modern Period, the landscape was carefully managed, evolving into a sustained agrosilvopastoral one. Until the arrival of butane gas and, later, electricity in the early to mid-20th century, municipal woodlands were pruned, provided fuel for cooking and heating, and were also used as building material.
Beginning in the 1950s and 1960s, however, socioeconomic conditions began to pressure the residents of these rural regions to migrate internally or emigrate abroad to urban industrial centers [41,42,43]. This outmigration led to a gradual large-scale rural abandonment that has resulted in not only a significant population decrease, but also landscape change unseen in the history of the region.
By the beginning of the 21st century, governments began to recognize the ecological singularity of the Duero River landscape. This led to the creation of three protected areas; the Douro International Natural Park in Portugal in 1998, which later merged with the Arribes del Duero Natural Park, created by Spain in 2003, to form an internationally protected park zone (Figure 1). Later in 2015, after an effort by both countries, UNESCO recognized and superimposed yet another protected layer, the Meseta Iberica Biosphere Reserve, under UNESCO’s Man and the Biosphere program (MAB) [44].
The Spanish and Portuguese municipalities covered in this study were chosen because they have been part of recent or ongoing landscape archaeological research conducted by the Social Structure and Territory Landscape Archaeology (EST-AP) group of the Spanish National Research Council (CSIC) that has documented human environment interaction dating back to the protohistoric period [32,34,45,46,47,48]. Additionally, the municipalities were selected because they were either completely within or possessed significant territory within the internationally protected natural park zone (Figure 1). Most importantly, they were found to be representative of the vegetative and topographic diversity found in the region incorporating land along the Duero River and on the exterior plains [36,37,49]. Since all of the case study municipalities are not contiguous, the greater study area was expanded partially beyond the political borders of the municipalities to demonstrate the extent of vegetation corridor continuity. The entire study area is completely within the limits of the much larger Meseta Iberica biosphere reserve.

2.2. Satellite Imagery

Eight Landsat scenes were downloaded as level 2A products from the Earth Explorer service of the United States Geological Survey (USGS) (Table 1). Level 2A products are obtained after the atmospheric correction of Level 1 images and are distributed in surface reflectance units, also known as Bottom of Atmosphere (BOA) reflectance, which is the optimum magnitude for multitemporal analysis. Landsat overpasses the study area in the Path 203 and Row 31. Due to the long track record, some of the scenes used were acquired by Landsat 5 Thematic Mapper (TM) (available between 1984 and 2013) and some others by its heir the Landsat 8 Operational Land Imager (OLI) (available since 2013). The use of Landsat 7 imagery was avoided due to the striping pattern caused by the SLC-off effect, which would require further pre-processing [49] and cause an additional degree of uncertainty. The selected images were cloud-free scenes acquired in mid-summer (mostly in August), a period when the difference between (rainfed) agropastoral lands and natural vegetation is expected to be enhanced. With the exception of the 1984 to 1988 span, the time increment between captures was completed in five-year periods. The 1984 year was chosen as the first available year for Landsat 5. Using Landsat 5 data from the early 1980s also allowed the analysis to complement the dramatic population decline continuing to the present day. The analysis focused on visible (RGB), near infrared (NIR) and short-wave infrared (SWIR) spectral bands, with a spatial resolution (pixel size) of 30 m.

2.3. Landscape Analysis: Methodology

2.3.1. Ethnographic Perception Studies

As part of the integrated approach to diachronic landscape history and evolution of this study, this landscape change analysis incorporates an ethnographic, soft landscape perception study that details the landscape history and change within human memory from a bottom-up perspective. Landscape perception studies involve determining stakeholders’ knowledge, awareness, and values attributed to a landscape [50,51].
Throughout 2017 and 2018, perception studies were conducted through a combination of personal interviews with informants and participant observation. To better interpret the perceptions of the landscape from many perspectives and to assure the saturation of results, informants from the four Portuguese municipalities and the four Spanish municipalities of the study area were interviewed. Forty-nine respondents in total participated. To maintain a diversity of opinion in the perceptions, a composite of different stakeholders were identified in their relationship to the landscape in the region.
All interviews were semi-structured ethnographic interviews. All informants gave their informed consent before they participated in the study. The style of interviewing was open-ended, with volunteer samples in all cases. The interviews were approximately between 20 min to 2 h and took place in a public setting or in the interviewee’s home. The questions for local inhabitants during these interviews sought to ascertain their connection with the landscape. Additionally, question themes related to their opinion of the cultural and natural resource management of the region. Government officials were interviewed from various levels. The question themes dealt largely with issues regarding the current state of management of park lands, the enforcement of park environmental regulations, and the importance, recognition, and maintenance of both immaterial and material cultural resources found in the park lands [35]. A chain (snowball) sampling method was employed to confirm information and allow for a saturation of results [52,53]. After the interviews, recordings were transcribed and then coded for themes using the grounded theory approach. From the transcripts, informants’ responses to questions were categorized forming themes of this iterative process [54,55,56].

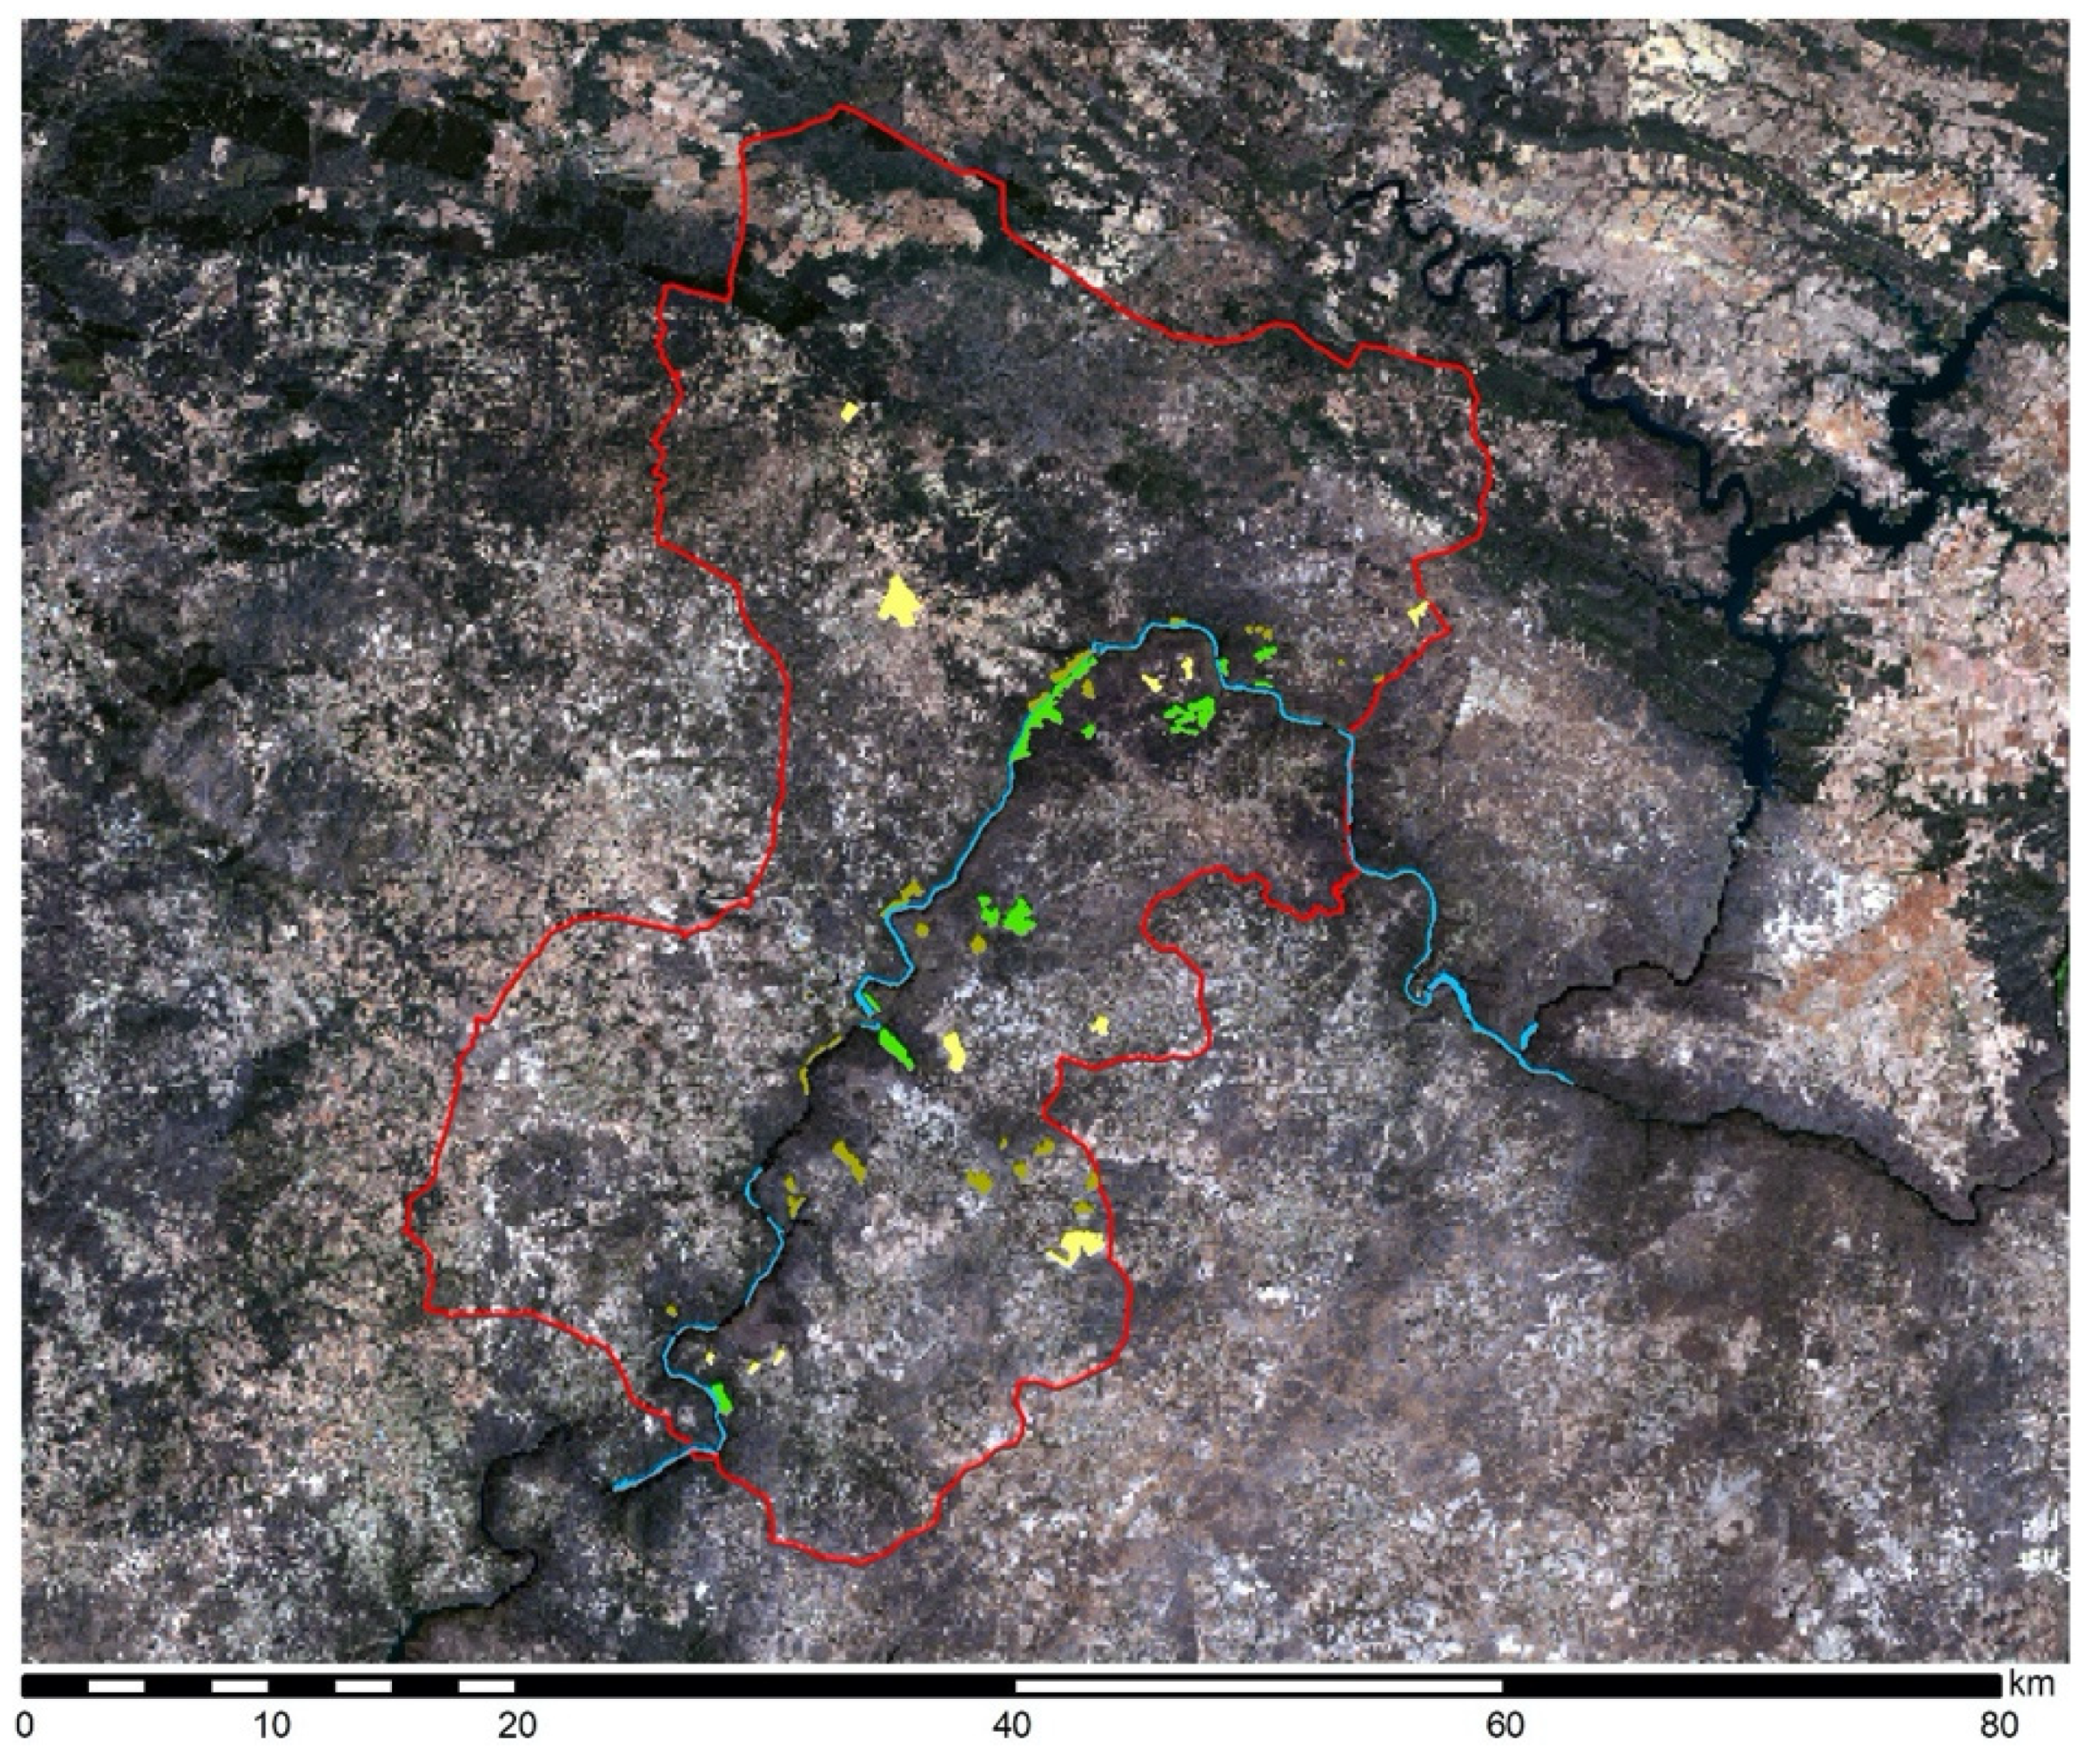
2.3.2. Selection of Stable Samples

Detecting land cover change through time might be approached with different methodologies [57]. In this study, Post-Classification Comparison (PCC) [58,59,60] was implemented to evaluate change by comparing land cover maps obtained with supervised classification in the individual years of the study period. With this aim, a set of reference data was built for classification training and validation, which could be used consistently in the different years of the analysis. Following similar studies [61], land samples that were diachronically consistent were used, i.e., areas that remained stable during the whole study period. Using stable samples is an efficient option for studies such as this, which are based on archived satellite imagery [62].
For this reason, available aerial photography from different time periods was used to delineate different samples representative of the main landscape types. Using aerial photography or very high resolution (VHR) satellite imagery for delineating ground reference samples is a common practice in land cover analyses [61,63]. A series of aerial photography ranging from 1946 to the present were used for digitization (see supplementary data, List S1). Even if aerial photographs are of greater detail than the input imagery used for the classification (Landsat data), reference samples digitized from them are subject to interpreter errors [64] and are difficult to quantify. For this reason, three additional sources of information were used to complement aerial photographs and improve the definition of representative reference samples: (1) field visits, (2) a vector file with the boundaries of the wildfires that have occurred since 2001 (prior to this, wildfire occurrence data was only available for Spain from 1989 to 1999 in the study area, at 335 total hectares burnt), and (3) historical municipal level maps (planimetries) of the late 19th to early 20th century for Spain. Although the latter did not offer the accuracy of an aerial photo or satellite image, they do identify landscape vegetative areas, using a specific nomenclature (Figure 2).
While the diversity of landscape units within the international park zone is well documented [36,37], the past anthropic influence marked by intensive use on the landscape was narrowed to demonstrate the vegetative change from agrosilvopastoral use to transition scrubland and forest cover. This study is focused on detecting the change, impact, and consequences of agrosilvopastoral abandonment and subsequent landscape policy decisions in the region. Narrowing the land cover classes to reflect the traditional land use allowed for greater precision in the subsequent classification analyses and avoided an excessive complexity in the legend that would complicate the interpretation of results. The selected classes were:
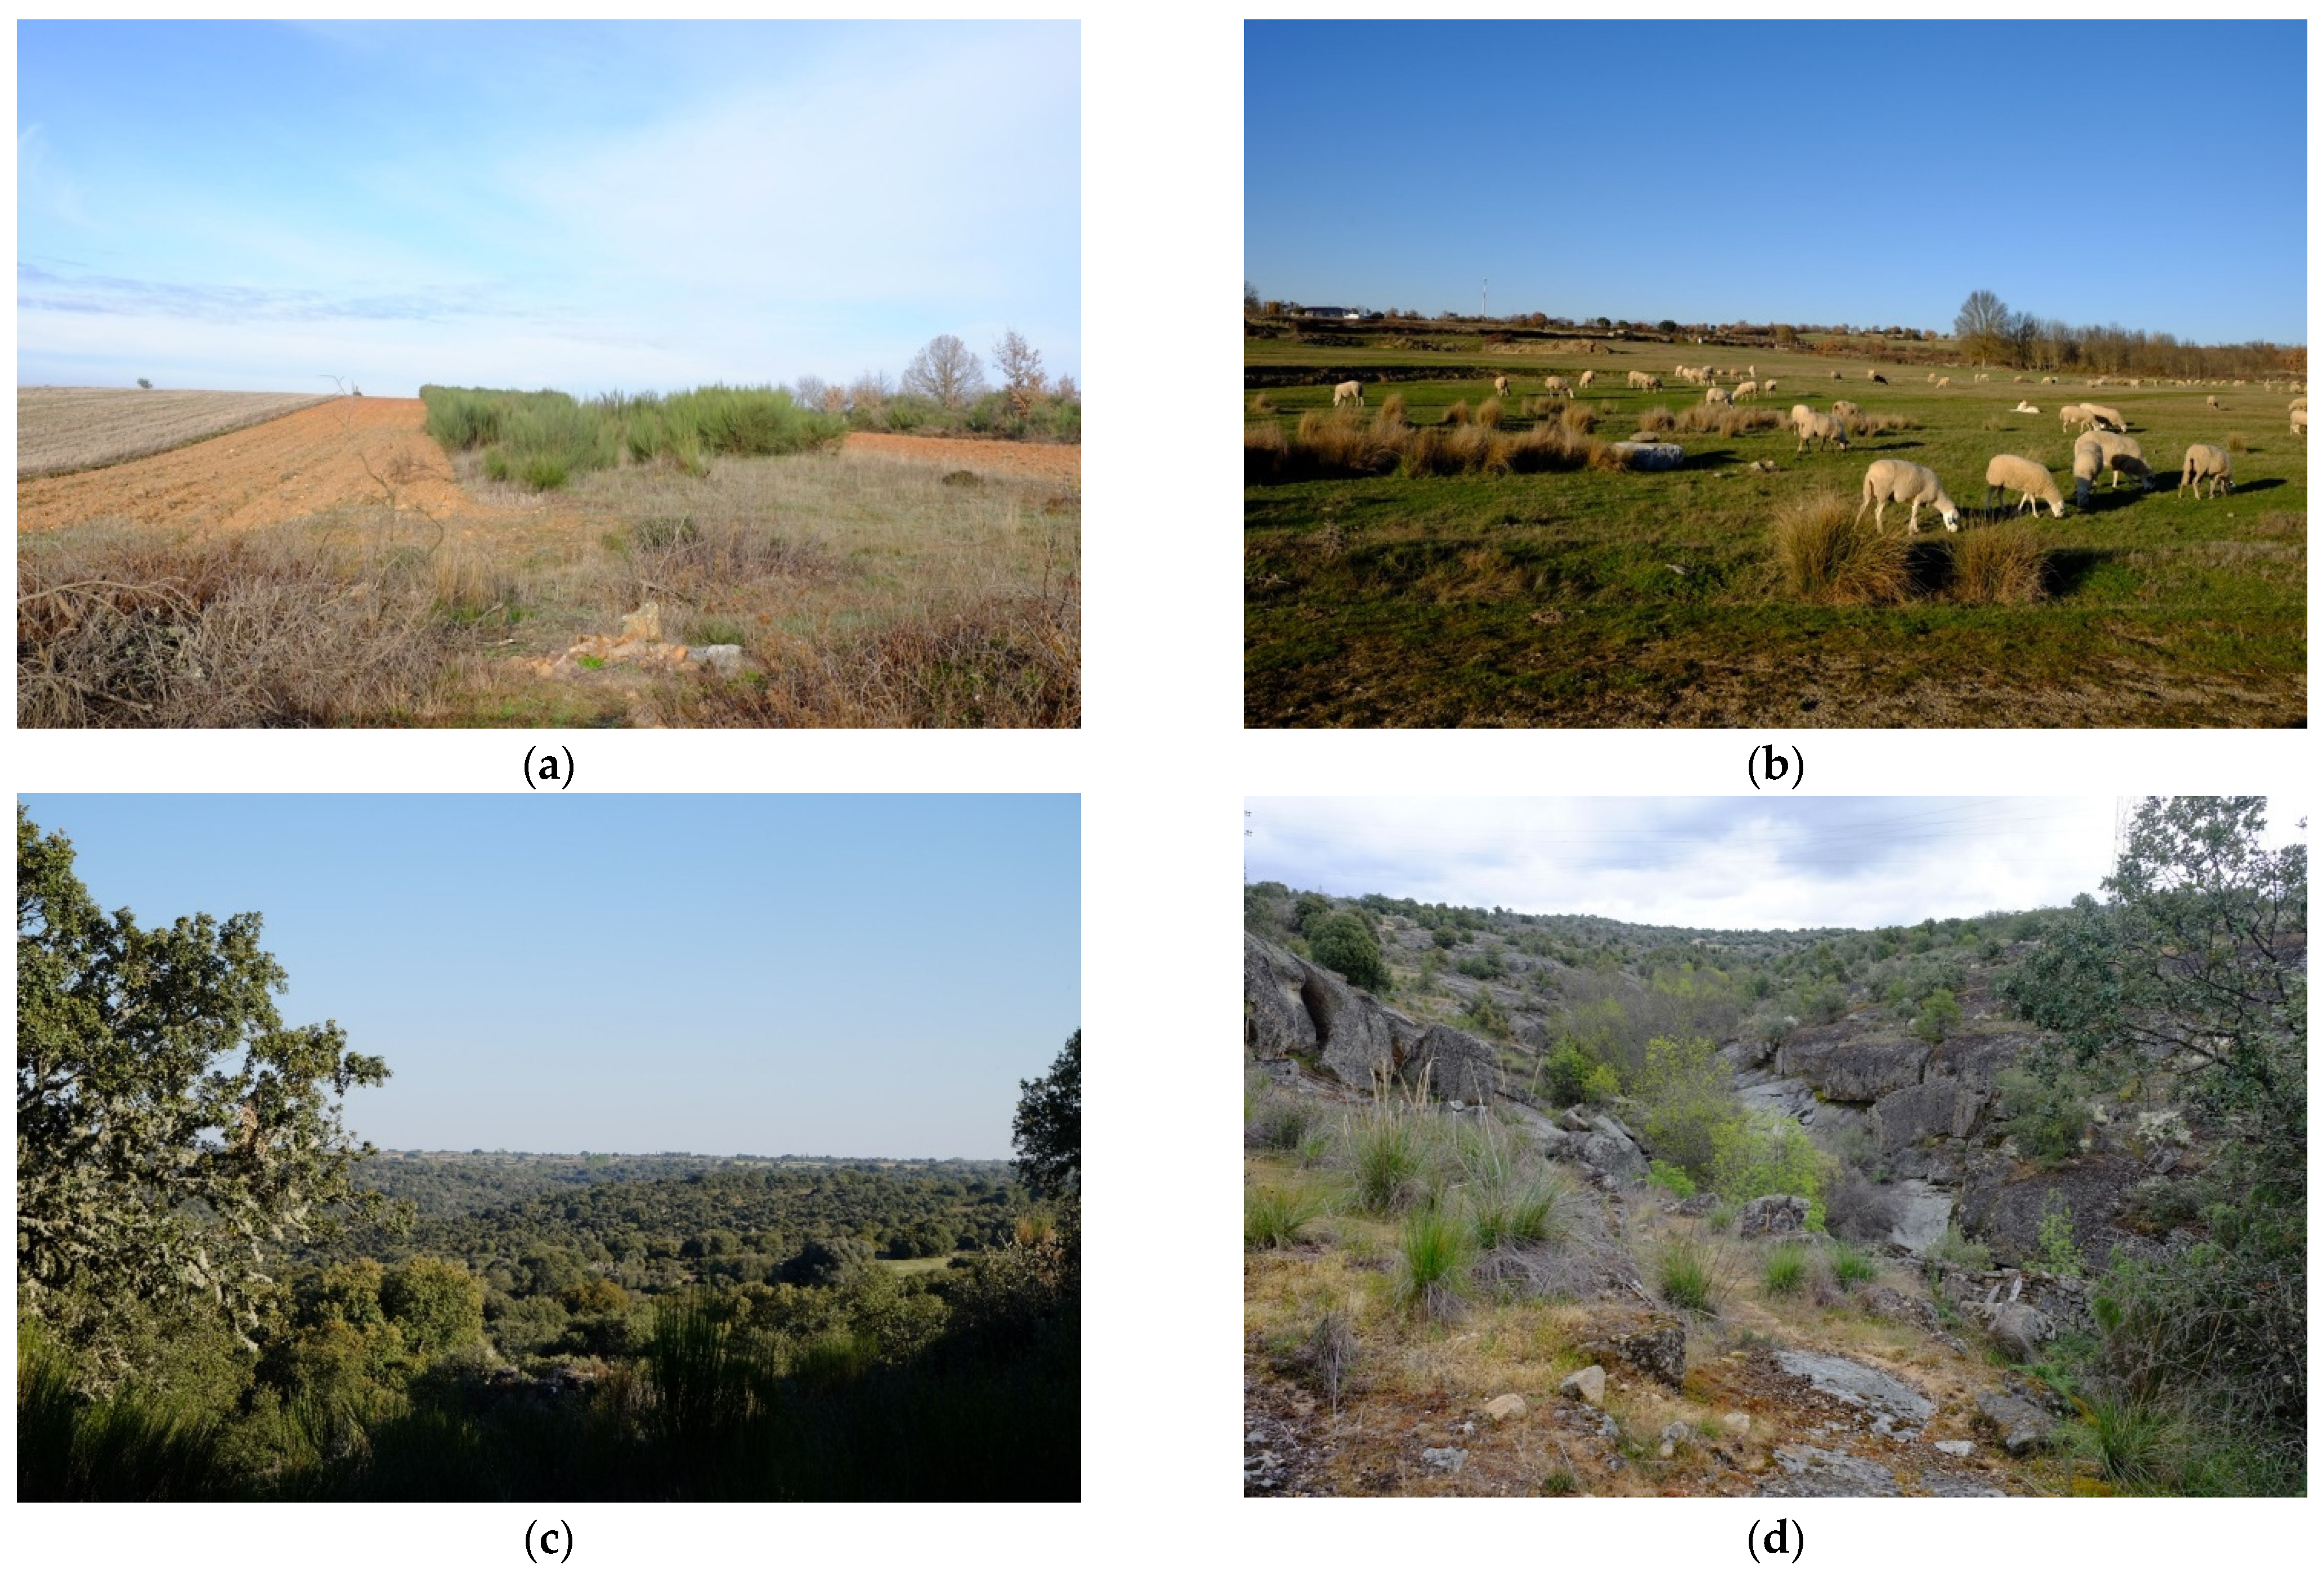
  • Agropastoral lands, where a system of annual, biennial, or triennial crop rotation allowed for the cultivation of cereal crops followed by periods of fallow, whereby ovine or bovine grazing was allowed in the same areas. In other cases, where the soil quality was poor for cultivation, the lands were dominated by grazing only with occasional plots for agriculture (Figure 3a,b);
  • Chaparral forest, dominated by Quercus (ilex and pyrenaica) and Juniperus species. Originally limited to the ravines and hilltops of the municipal common lands along the course of the Duero, they can now be seen, with aerial photography over a span of 70 years, expanding on the plain’s interior from the Duero. Rough grazing is known to occur in these areas (Figure 3c);
  • Scrubland, areas of occasional Quercus species, but dominated by shrubland vegetation such as Lavandula stoechas, Cytisus multiflorus, Retama sphaerocarpa, and Daphne gnidium. It can be found along the upper banks of major and minor riparian systems and on the interior plains. Similar to the chaparral forest class, some rough grazing is known to occur in these areas as well. (Figure 3d);
  • Water surfaces and fluvial systems with minor systems having confluence into the primary river of the landscape, the Duero River.
Stable samples were drawn as polygons delineating the four classes of representative areas as they were found on the landscape, consistently unaltered in the whole aerial photograph time series. It was assured that samples were spatially distributed throughout the study area to capture landscape heterogeneity [61] (Figure 4). The delineated land area for the different classes was kept close to 200 ha for each land cover class, to have balanced samples for the subsequent analyses (Table 2). Considering the total area of the study site, the reference samples accounted for a proportion of 1.47%.
Since the spectral bandwidth and pre-processing of Landsat 5 and Landsat 8 sensors are not exactly the same, the scenes need to be adjusted [66] to ensure the consistency of the time series and a reliable multitemporal analysis. Furthermore, since the scenes acquisition dates (day of the year) differed slightly (Table 3), and the actual meteorology of each year might also slightly differ, a linear cross-calibration approach was determined as the most appropriate approach to match the scenes’ radiometry and to make them comparable [67]. Using the set of stable samples, a band correlation analysis was carried out with all the scenes in the time series. The Pearson correlation coefficient (R) was computed for each scene pair on each band. The scene that achieved the highest overall R was selected as a reference. This resulted in being the Landsat 5 TM scene acquired in 1998 (Table 1). Using this reference, the remaining scenes were corrected with a linear equation that matched them to the 1998 scene. Although the resulting corrections were minor, this process ensured a precise match between the radiometry of the different scenes, which is necessary for the subsequent multitemporal analyses.

2.3.3. Image Classification

After a preliminary analysis based on vegetation indices (see supplementary data, Table S1, Figures S1–S3), a supervised classification was performed for each scene, resulting in a temporal sequence of land cover maps [68,69,70,71,72]. The classification was accomplished using the Random Forests (RF) algorithm [73], commonly used in similar studies [74,75,76]. RF is an ensemble machine learning technique that generates a large number (n_tree = 100 trees in this study) of Decision Trees (DT) and assigns the final class as the majority voting of the individual DTs. RF outperforms previous DT-based algorithms and has become a standard in the remote sensing community [77]. Two features make RF particularly robust: (1) each DT is built upon a random subsample (bootstrap) of the training set, and (2) DTs are created by subdividing the sample set at each node according to the best splitting variable, selected among a random subset of the predictive variable set. The size (m_try) of this subset is normally (as well as in this study) taken as the square root of the total number of predictive variables. Therefore, independency is granted among the DTs forming the forest, resulting in classifiers that effectively handle predictive variables that might be poor predictors or even correlated with each other. As any supervised classification algorithm, RF requires a training set containing samples of the classes of interest. From the total number of samples available (Table 2), 5000 pixels (~50%) were randomly selected as training samples and the rest were used for accuracy analysis [78]. The four different classes were balanced in the training set to avoid class imbalance issues [79].
RF classifications were evaluated using standard accuracy metrics calculated on the external (i.e., independent) sample set kept for accuracy evaluation. As an indicator of the general performance of each classification, the Overall Accuracy (OA) was used, which is the % of correct predictions in the test dataset. Moreover, for each class the recall and precision metrics were computed, which represent the commission and omission errors, respectively. Finally, since RF algorithm was applied per pixel, the obtained land-cover maps were post-processed to reduce their eventual noisy appearance using a majority (mode) filter, using the eight nearest neighbors to the nearest cell (a window size of 3 × 3 and a replacement threshold value where half the cells have the same value and are contiguous).
The area of each of the classes over the successive years was calculated from the obtained classifications. Finally, the percent of change for each class was calculated for each of the eight municipalities and the larger study area. Changes for the classes were determined successively between the five-year increments, with the percent of change calculated and compared to the starting year of 1984.

3. Results

3.1. Initial Landscape Perception Studies: Perceptions of Current Landscape Challenges and Issues

After extensive participant observation and interviews with a cross section of the many stakeholders of the protected borderland region, two first order categories were detected, and several important themes were found to be common among all stakeholders regardless of their position with the regional or local government. The categories were: perceptions of conservation; management and protection of cultural resources; and the perceptions of conservation, management, and protection of natural resources (Table 4).
The most prevalent theme from the perception studies conducted throughout all the municipalities was the impact of the mass human exodus from the region resulting in an increase in vegetation and wildfires. Even in Miranda do Douro, which had seen an increase in population, informants expressed a collective concern for the depopulation of the region as a whole. Natural park creation, while lauded by regional and national officials, was not well received by remaining residents due to stringent restrictions on traditional land use, such as controlled burns and tree and brush provisioning reduction. With a focus on ecological preservation, national park creation played a significant role in vegetative change on the landscape. Moreover, it cemented the type of landscape use and ecosystem services preferred on the landscape, stymieing the traditional agrosilvopastoral landscape.

3.2. Land Cover Changes

3.2.1. Land Cover Classification-Accuracy Analysis

Accuracy values of the supervised classification were high, considering all of the classes together with a mean overall accuracy (OA) of 95.1% (Table 5). Water and agropastoral classes with little diversity registered mean percentiles above 97%. Forest and scrubland, despite their diversity of vegetation growth, also registered in the 90th percentile. Consequently, all accuracy values were considered high enough to be reliable classifications.

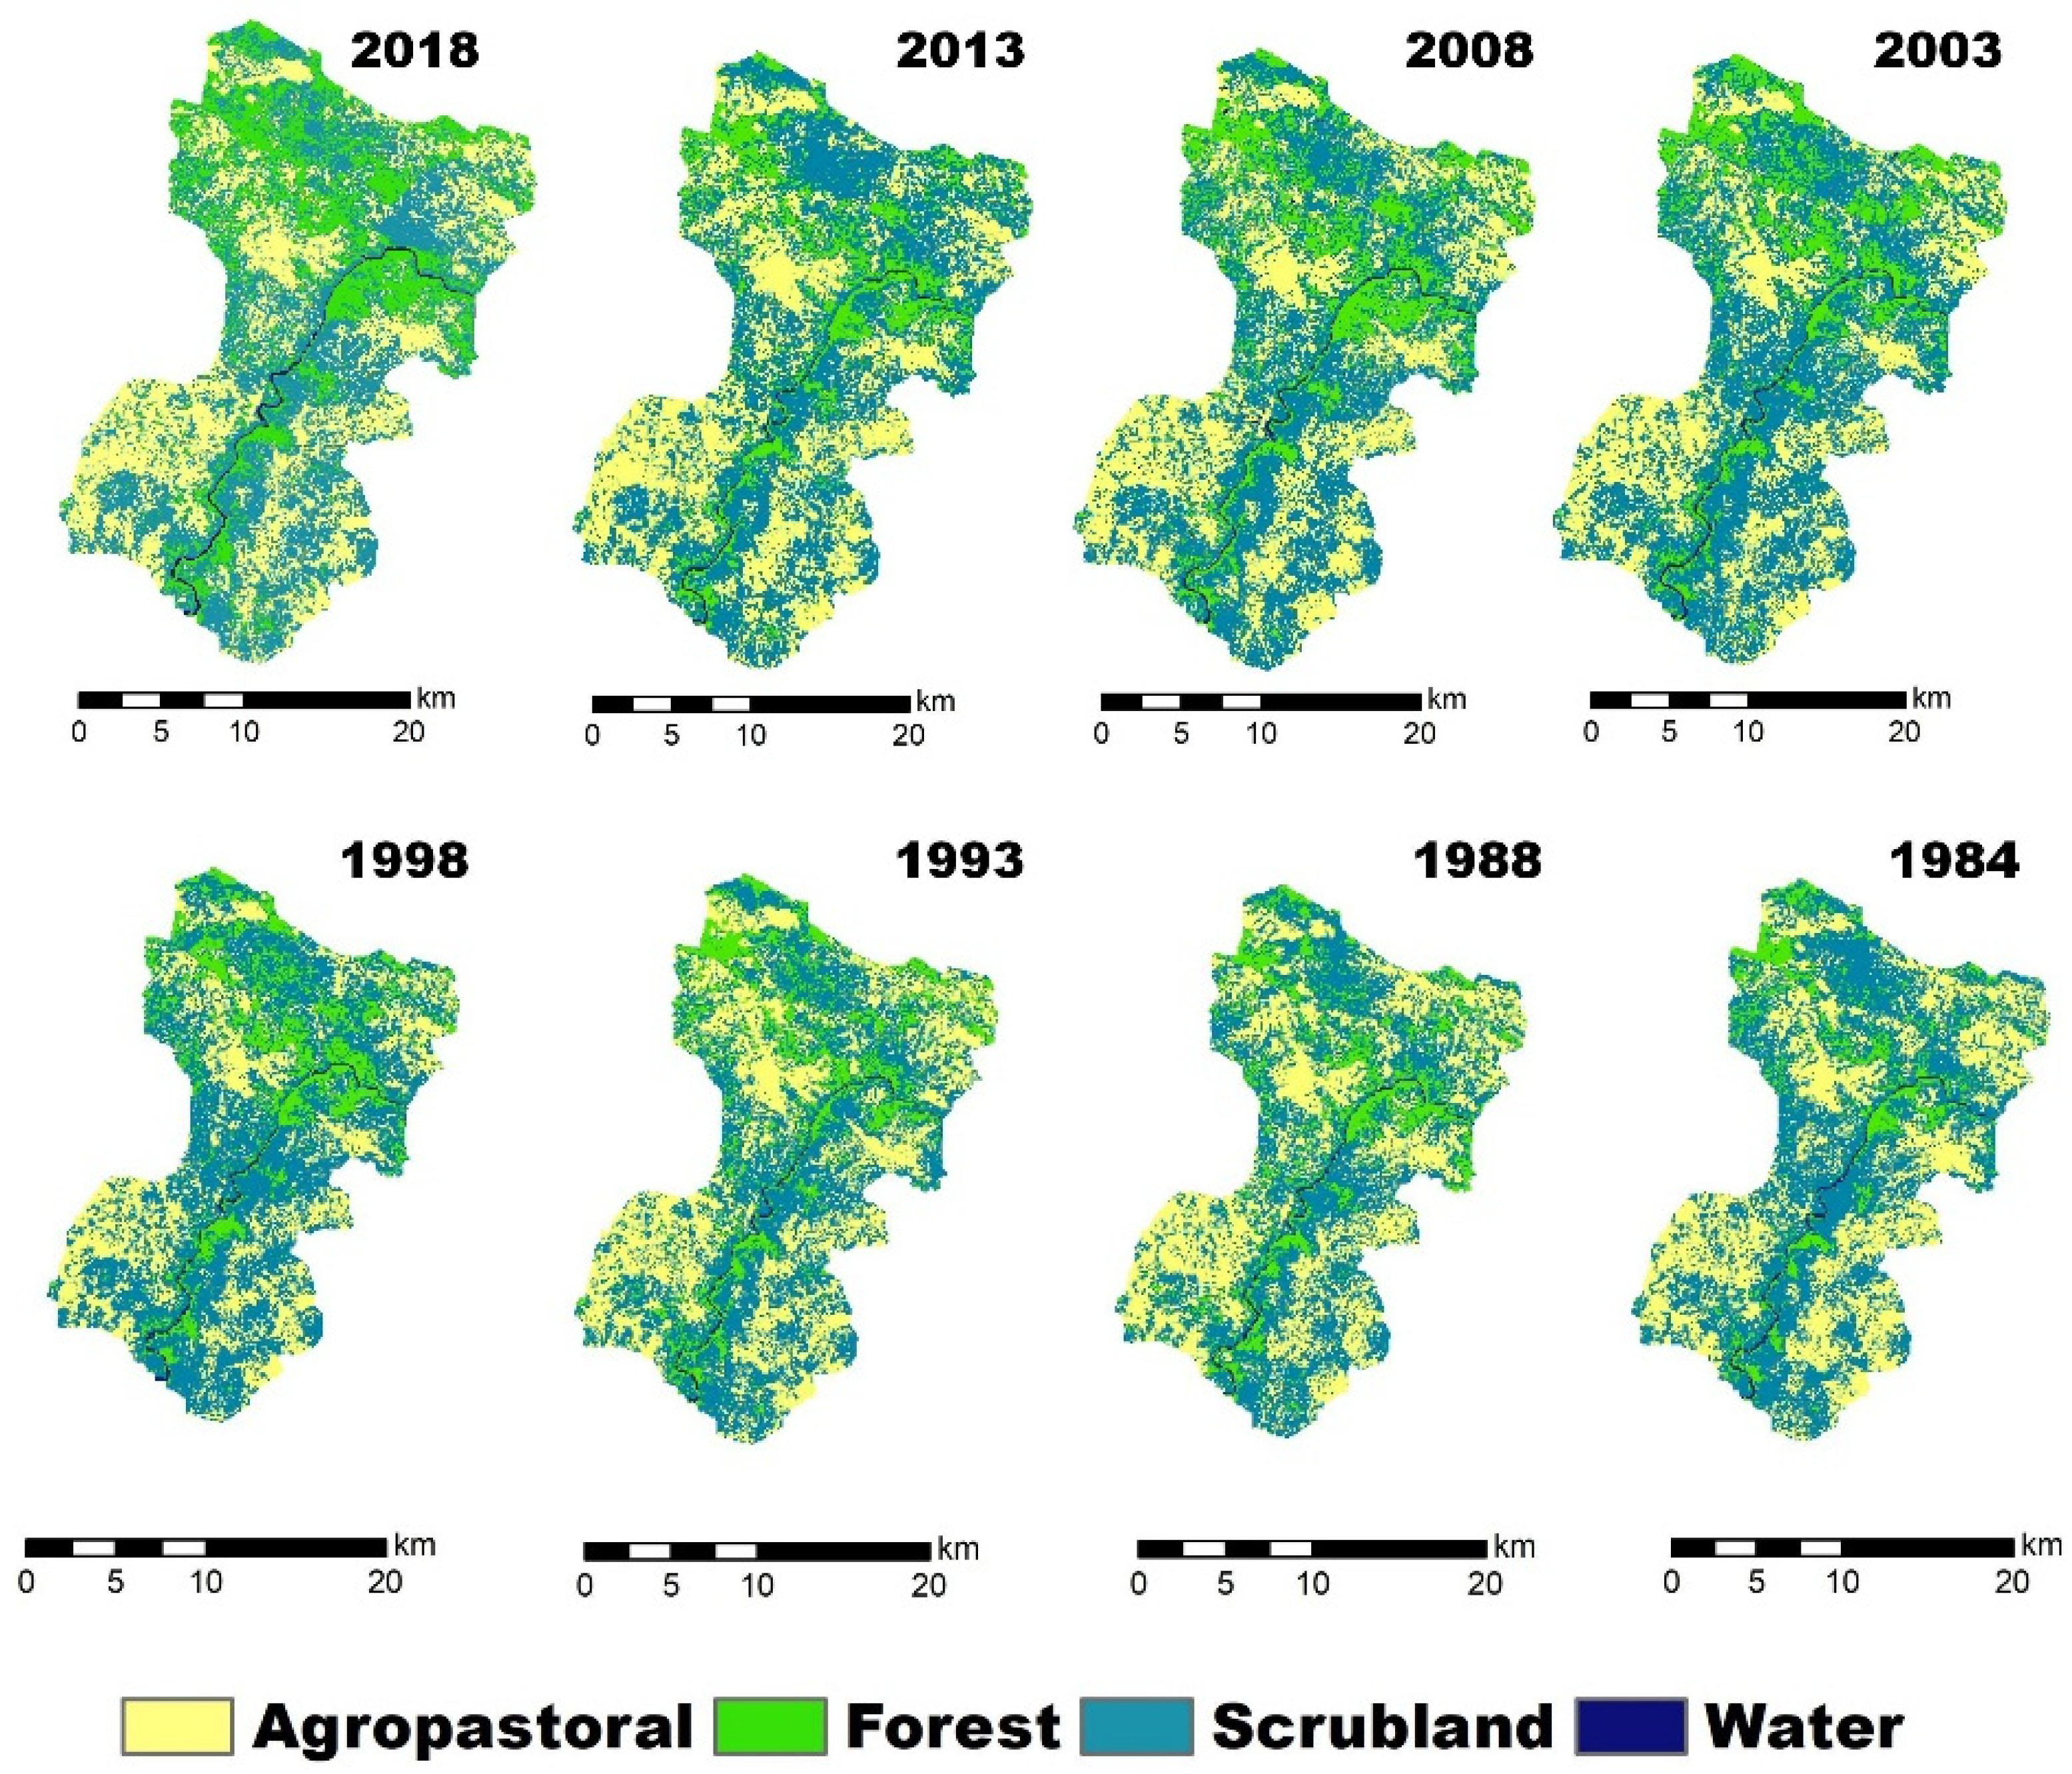
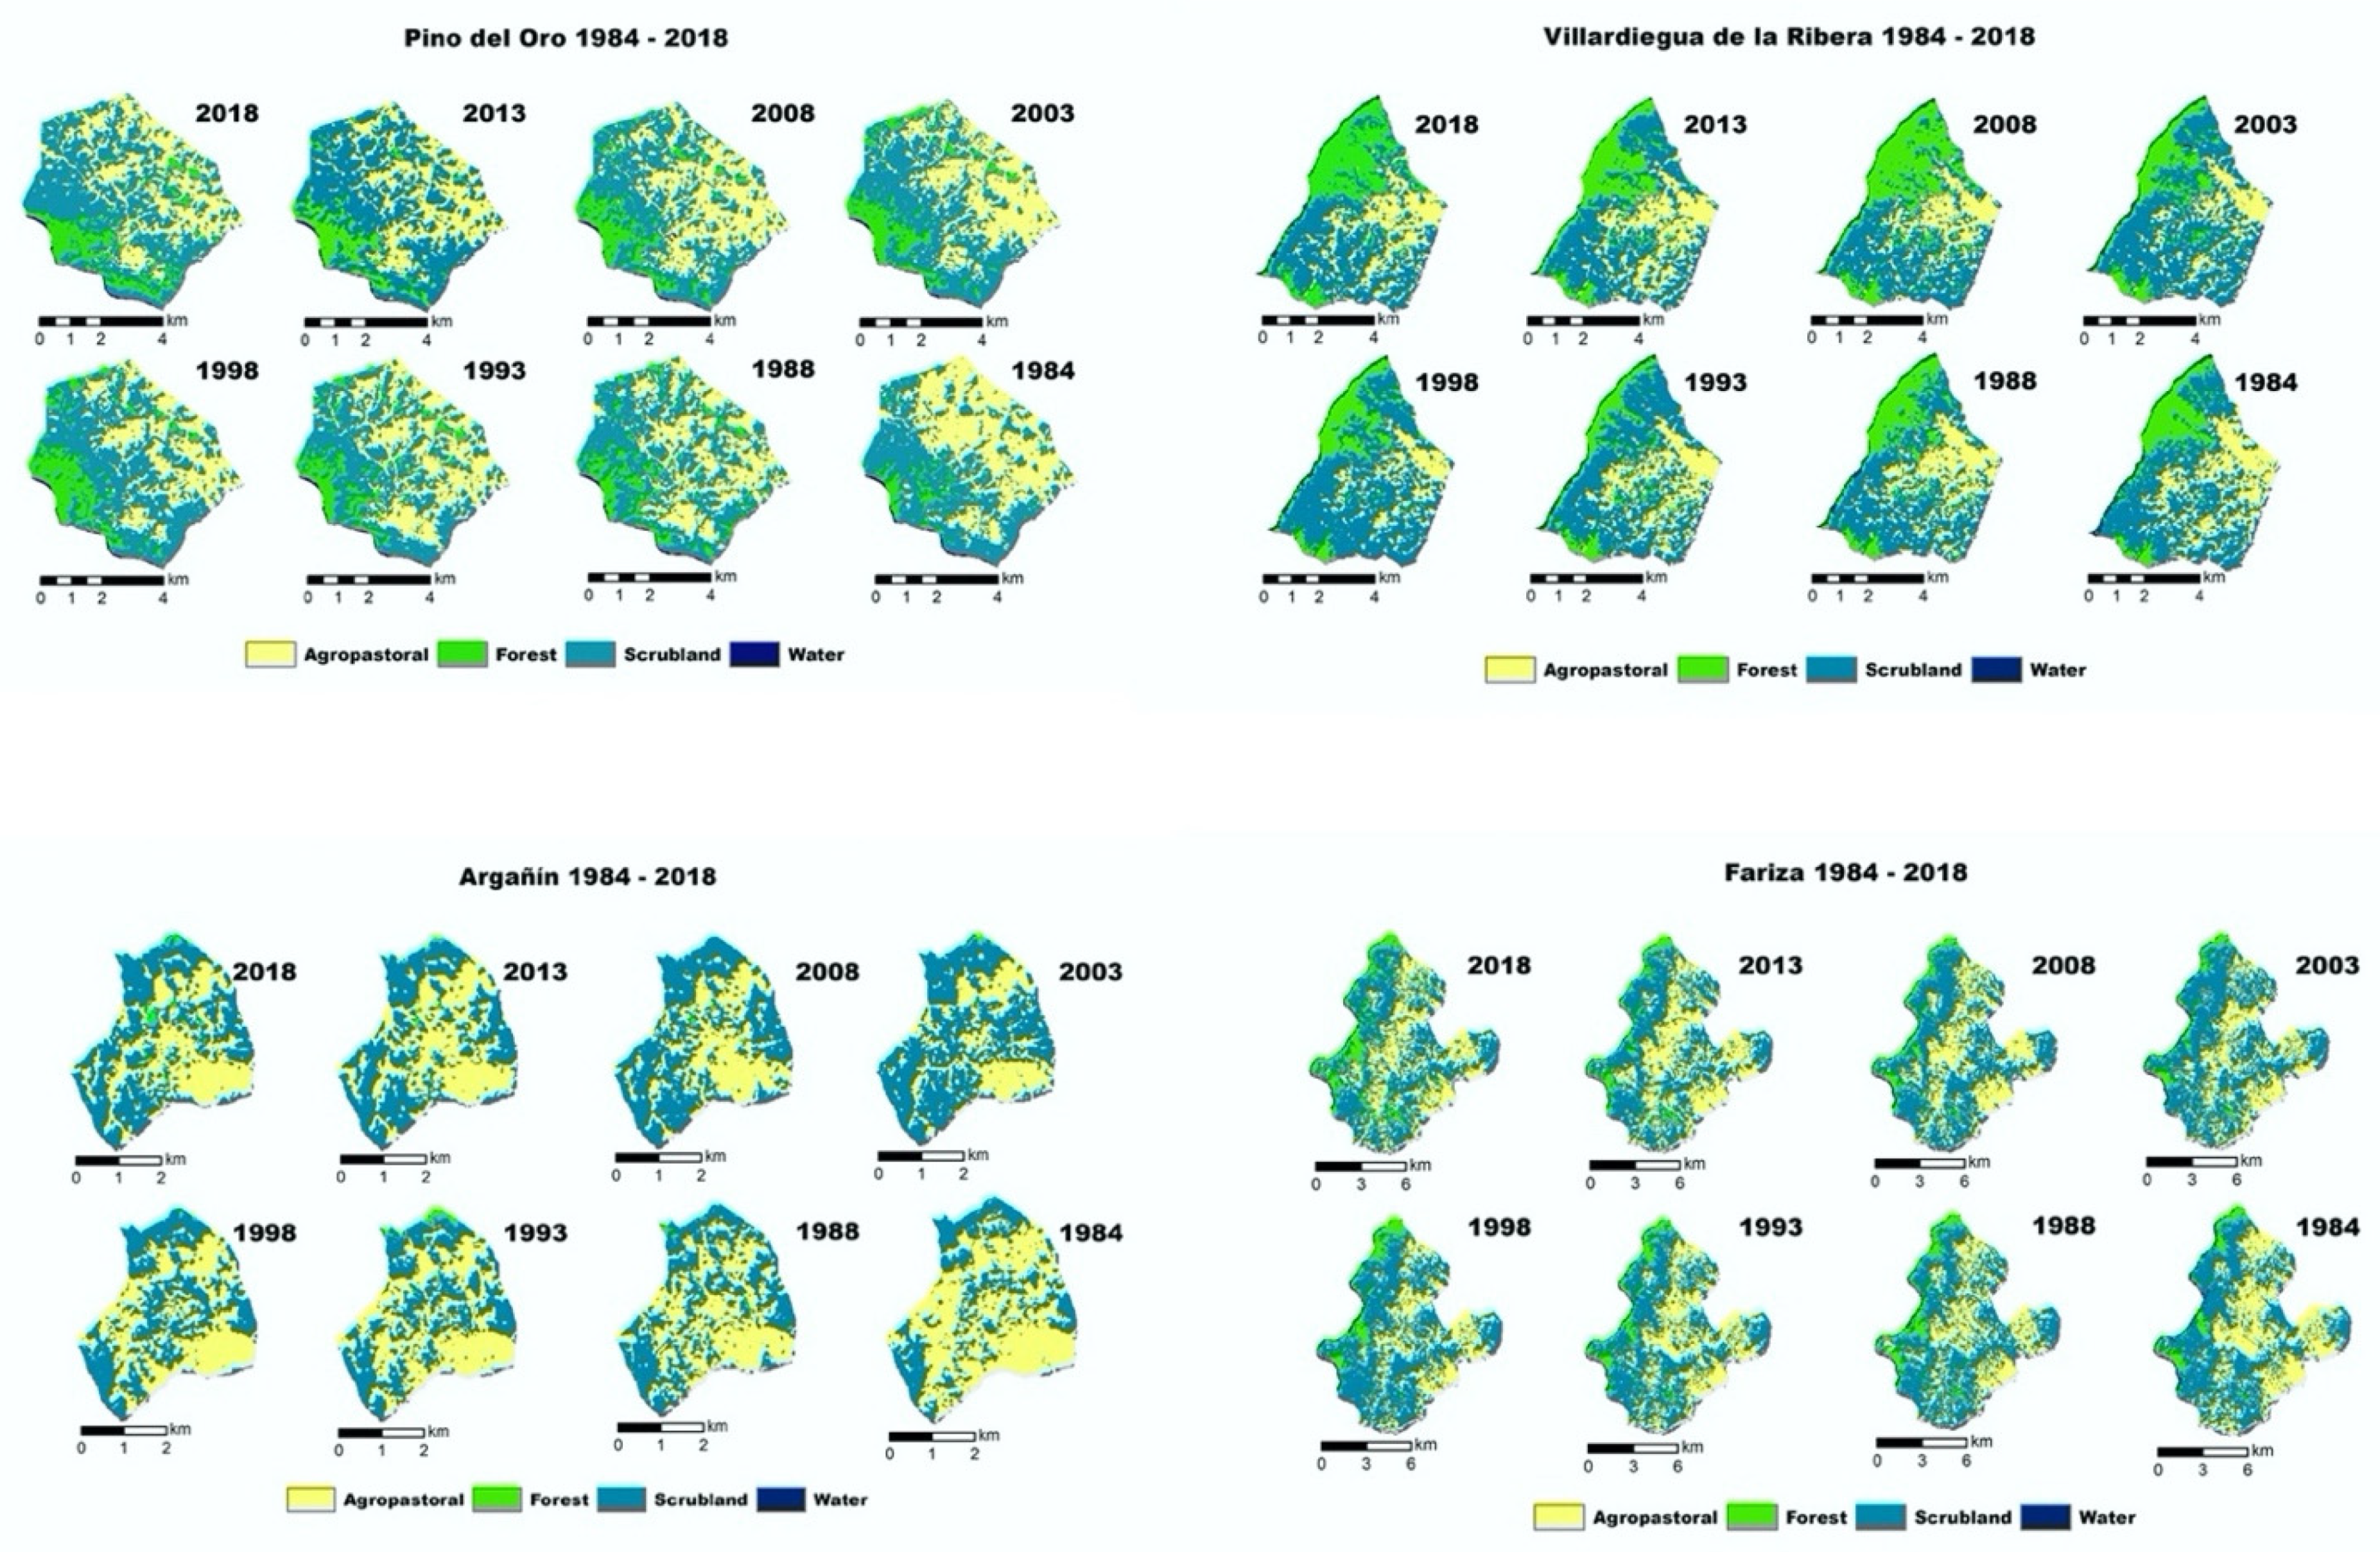
3.2.2. Land Cover Classification-Greater Study Area Land Cover Changes

The landcover maps classified under the categories of agropastoral, forest, scrubland, and water were quantitatively analyzed (Figure 5). Beginning in 1984, throughout the entire study area, the borderland area was dominated by scrubland at 50% and agropastoral lands at 39% (Table 6). Variations in both classes occurred, with slight spikes in 1988 in agropastoral land at 39% and with an increase to 53% in the scrubland class. Both classes, however, saw losses of 4% and 7.6% in agropastoral and scrubland classes, respectively. Forest cover, at only 9.81% in 1984, saw only increases with some slight negative fluctuation between years, while never returning to that same percentage. Most notably, by 2018, forest cover had more than doubled to 21.6% (Table 6). As expected, surface water, largely represented as the Duero River, had only negligible changes.

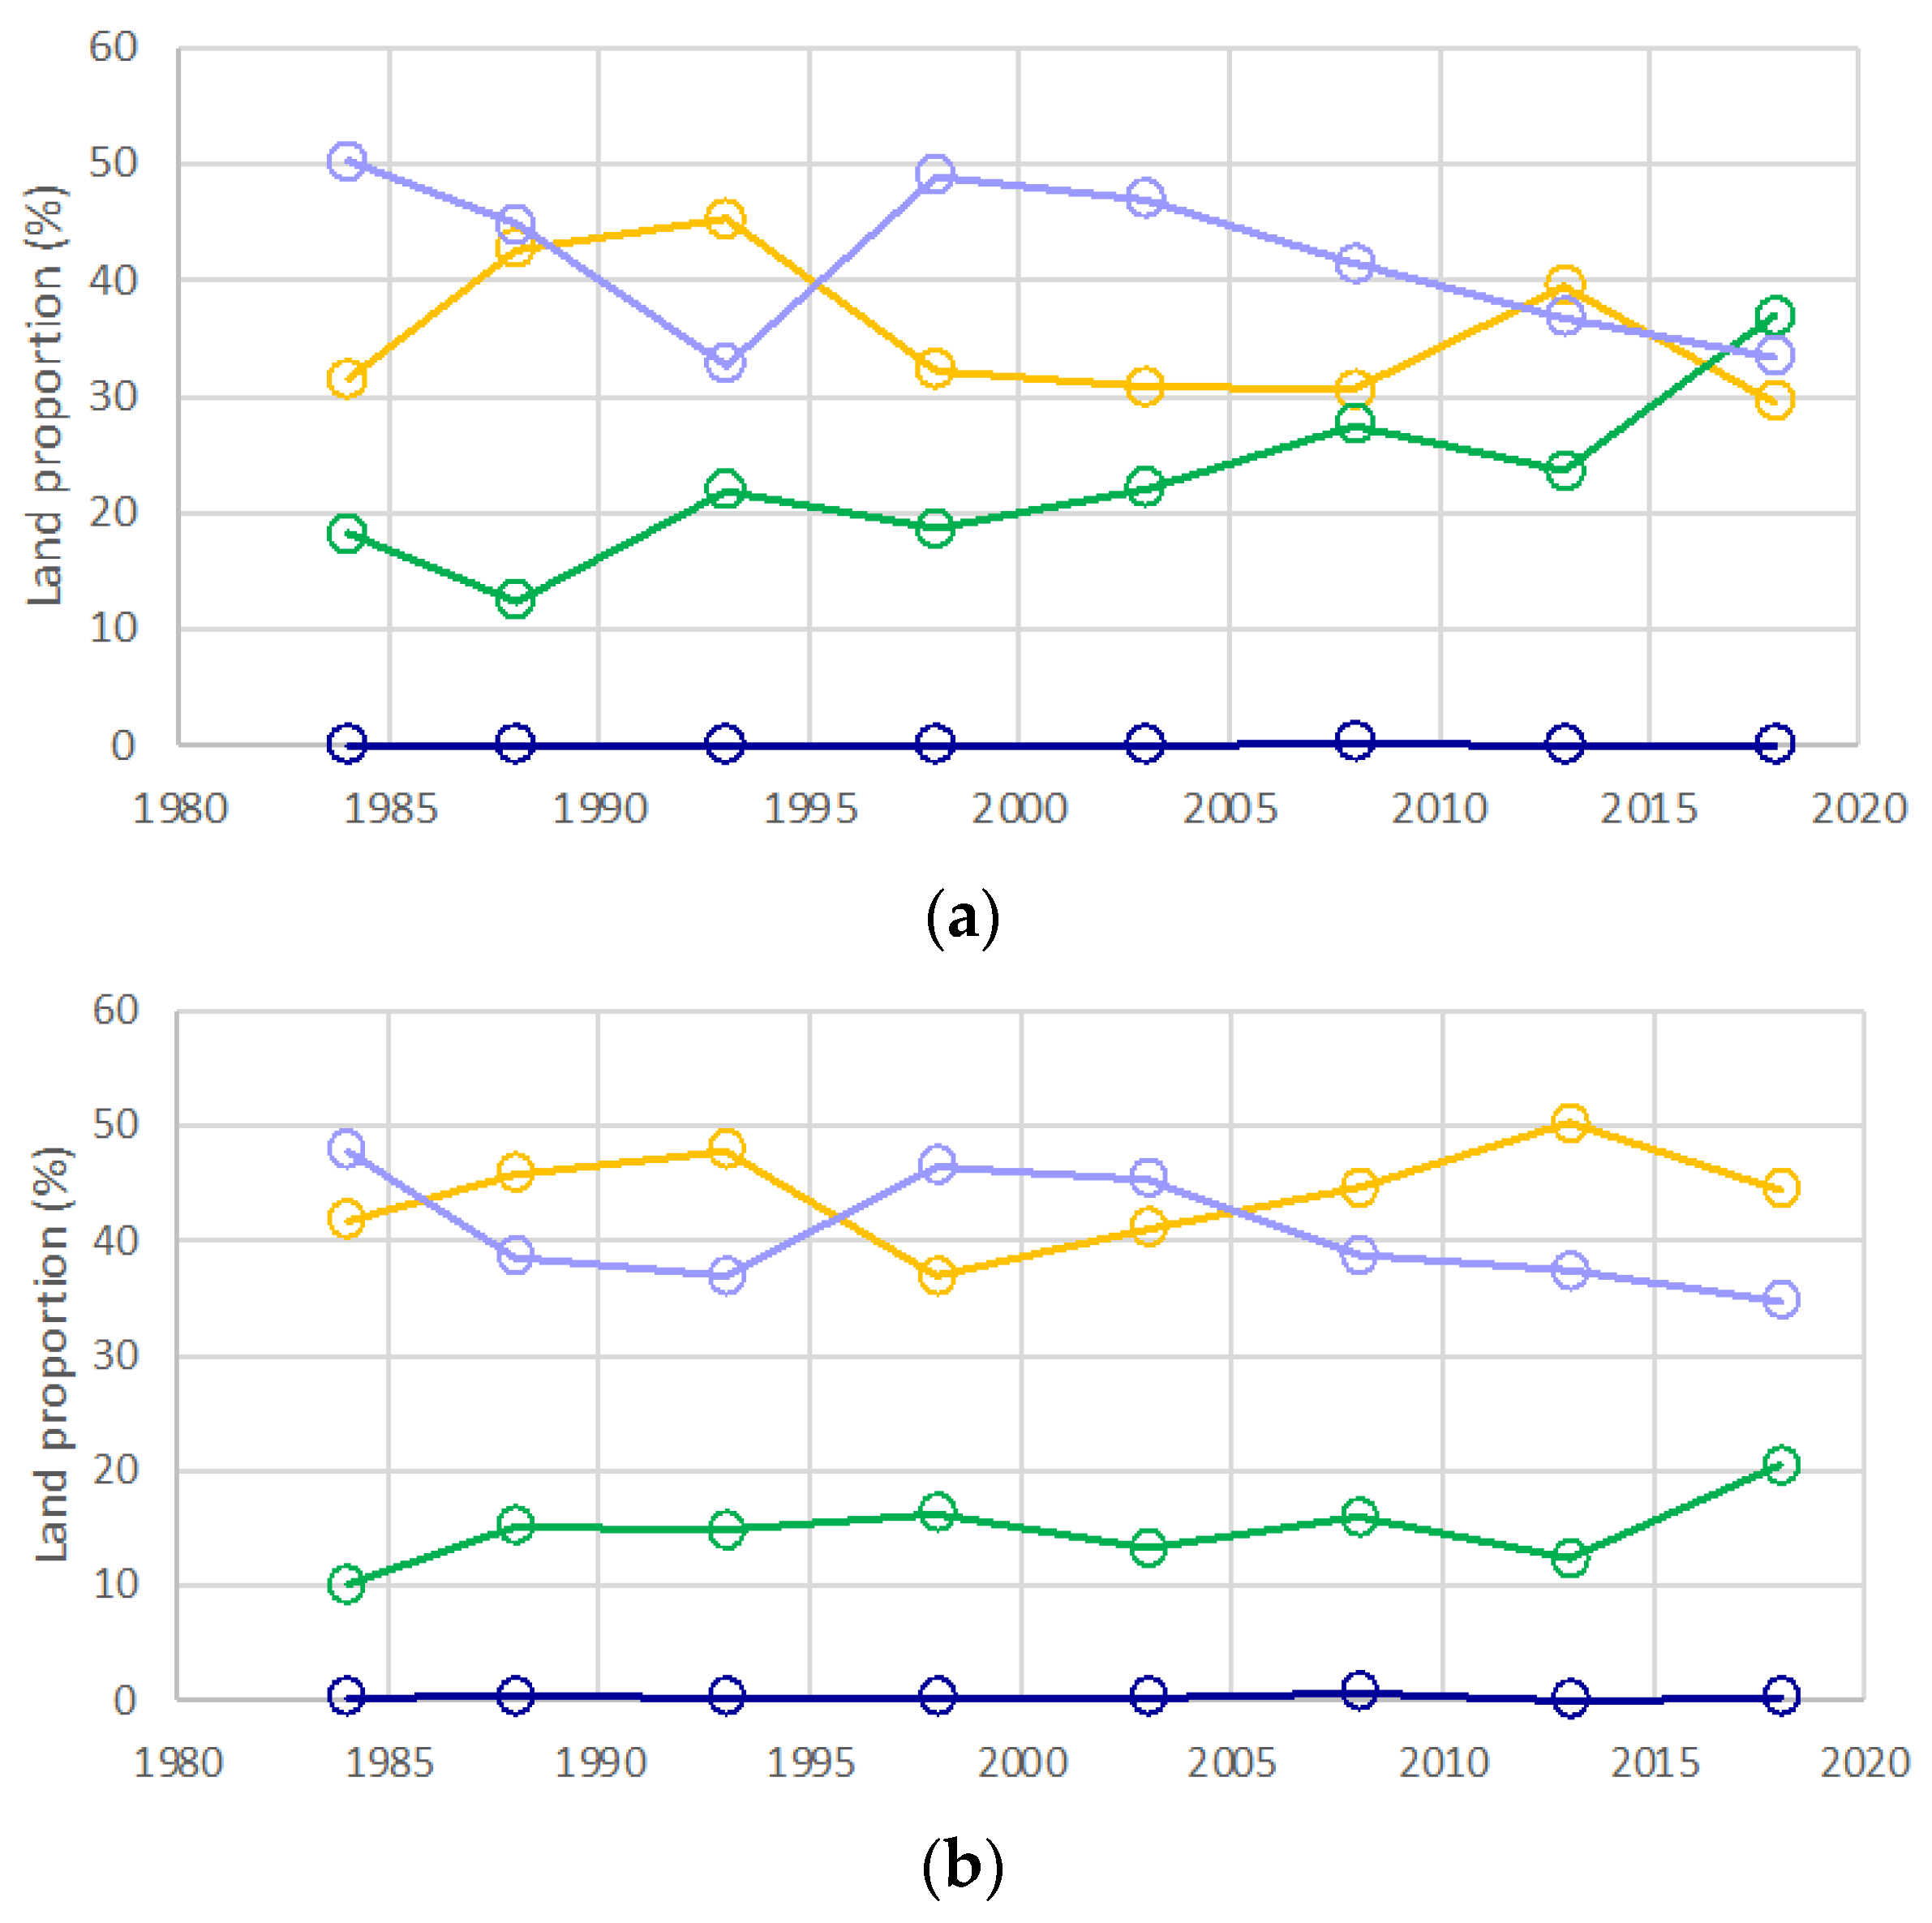
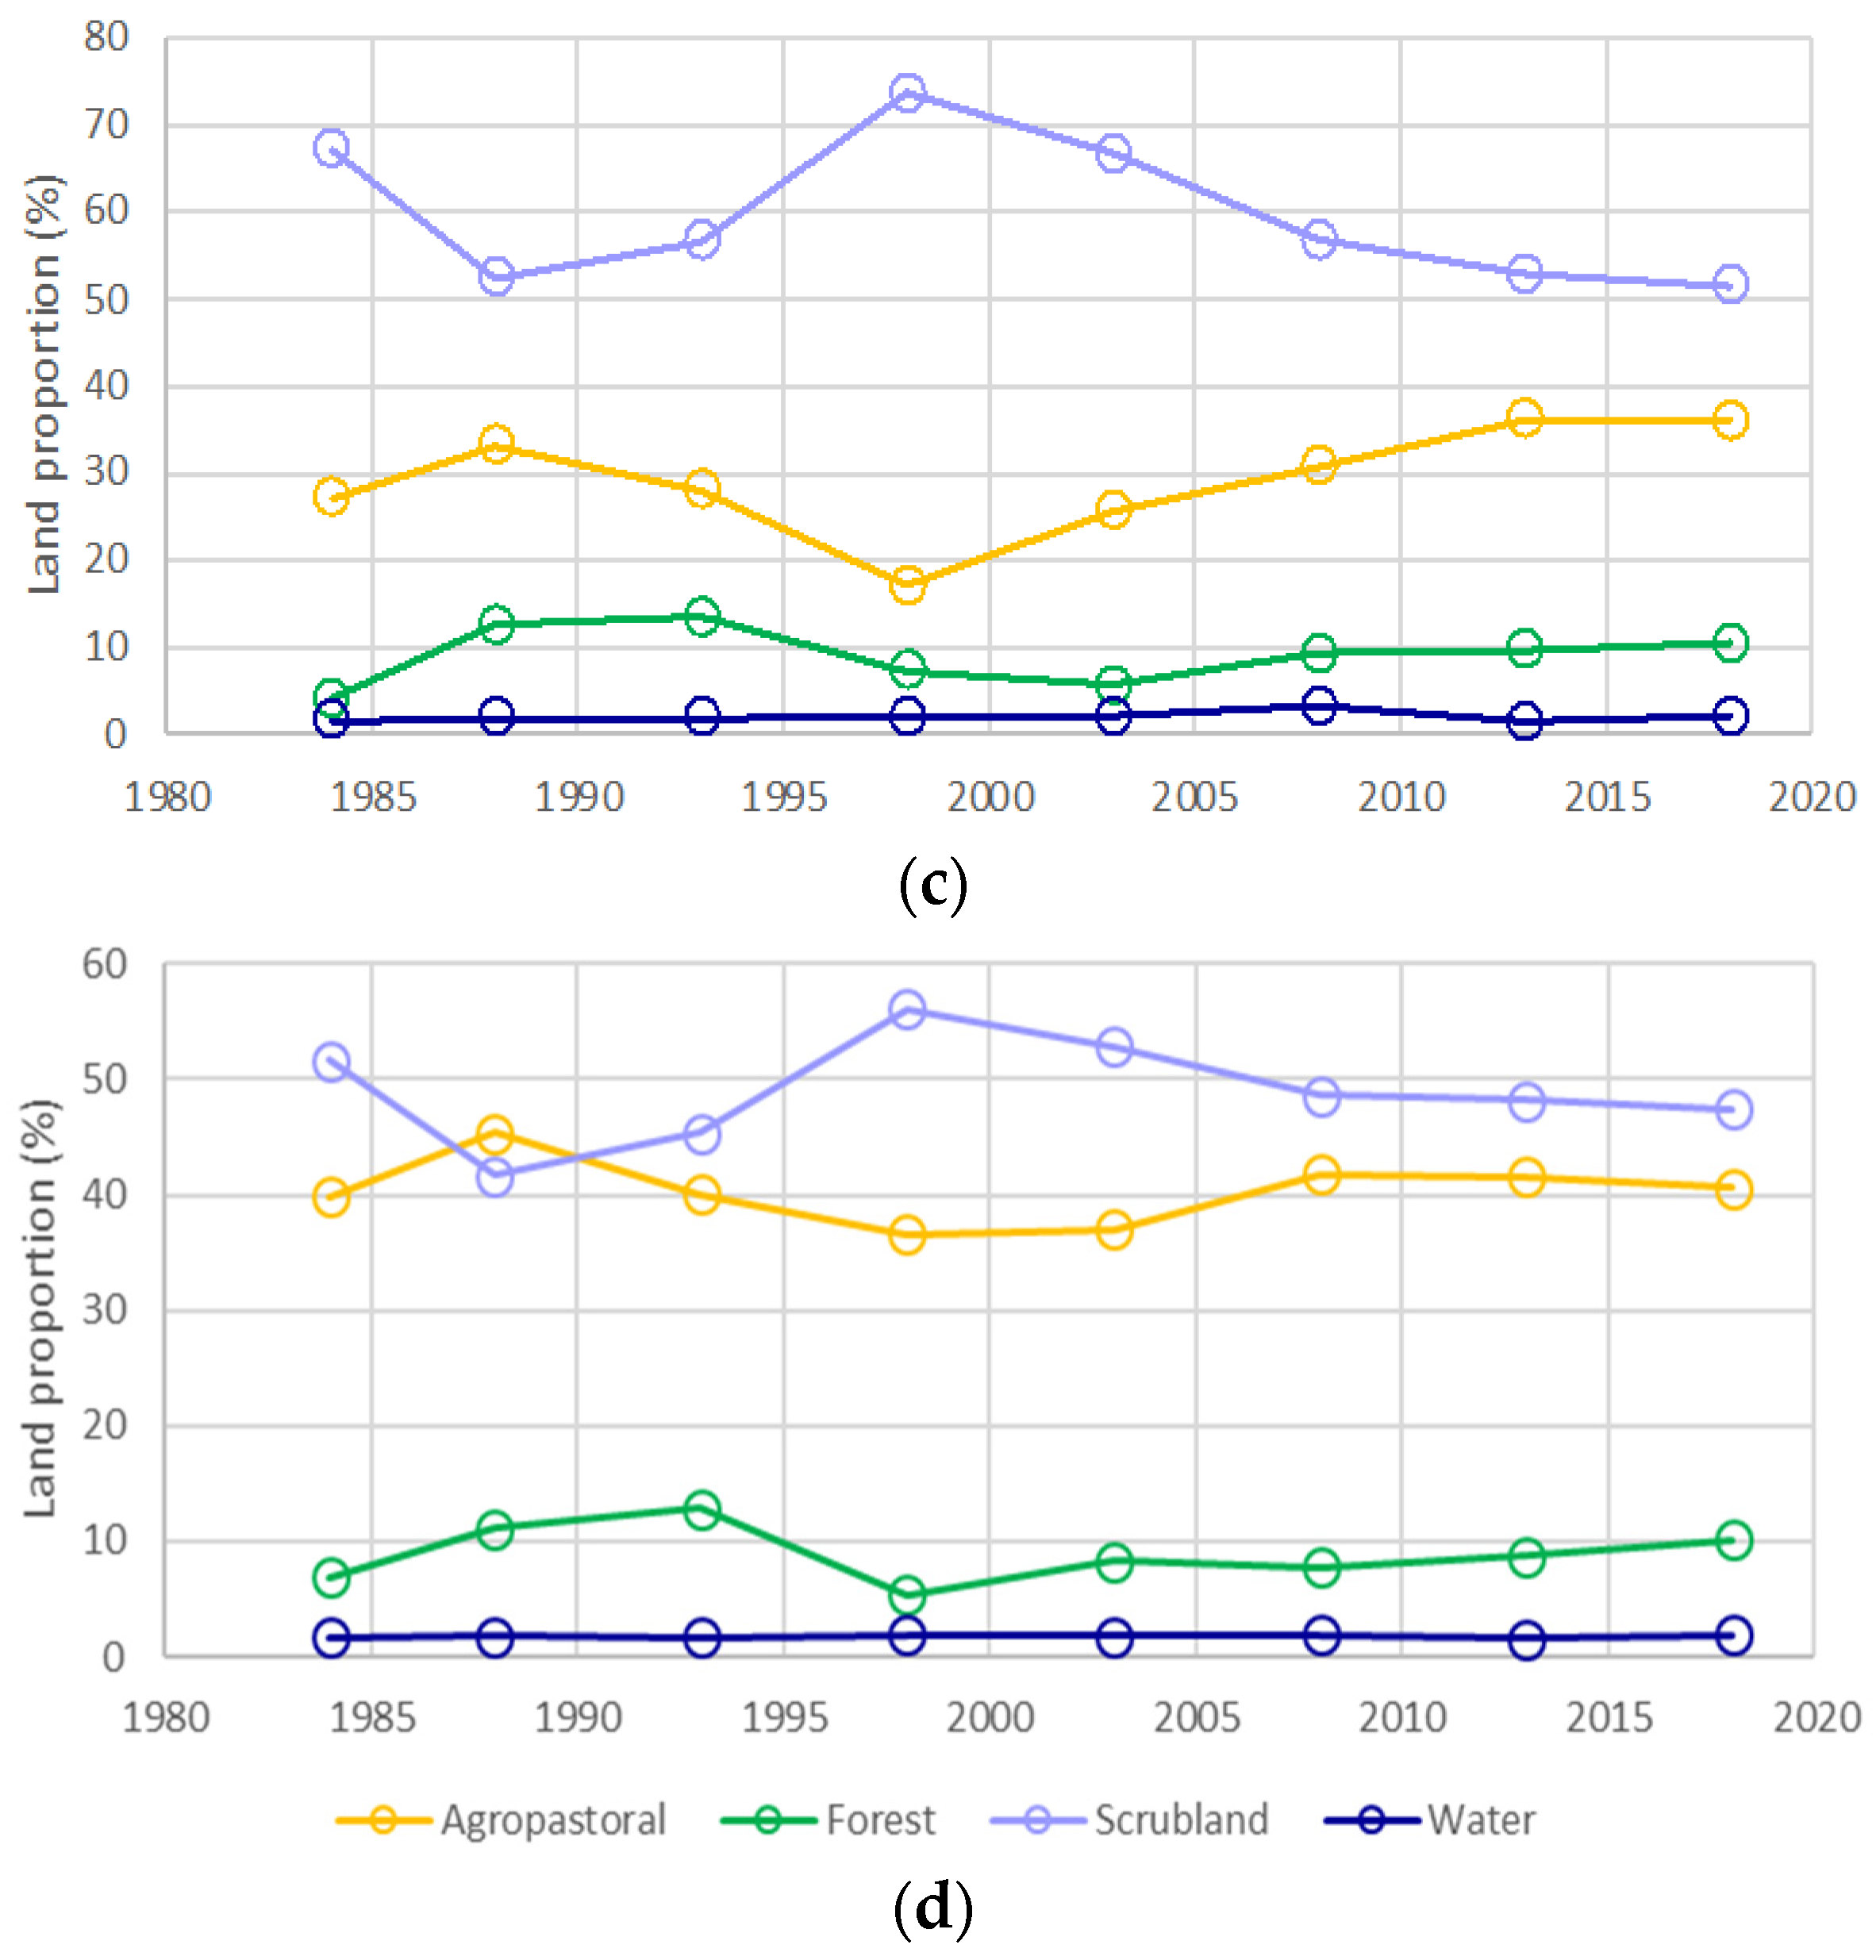
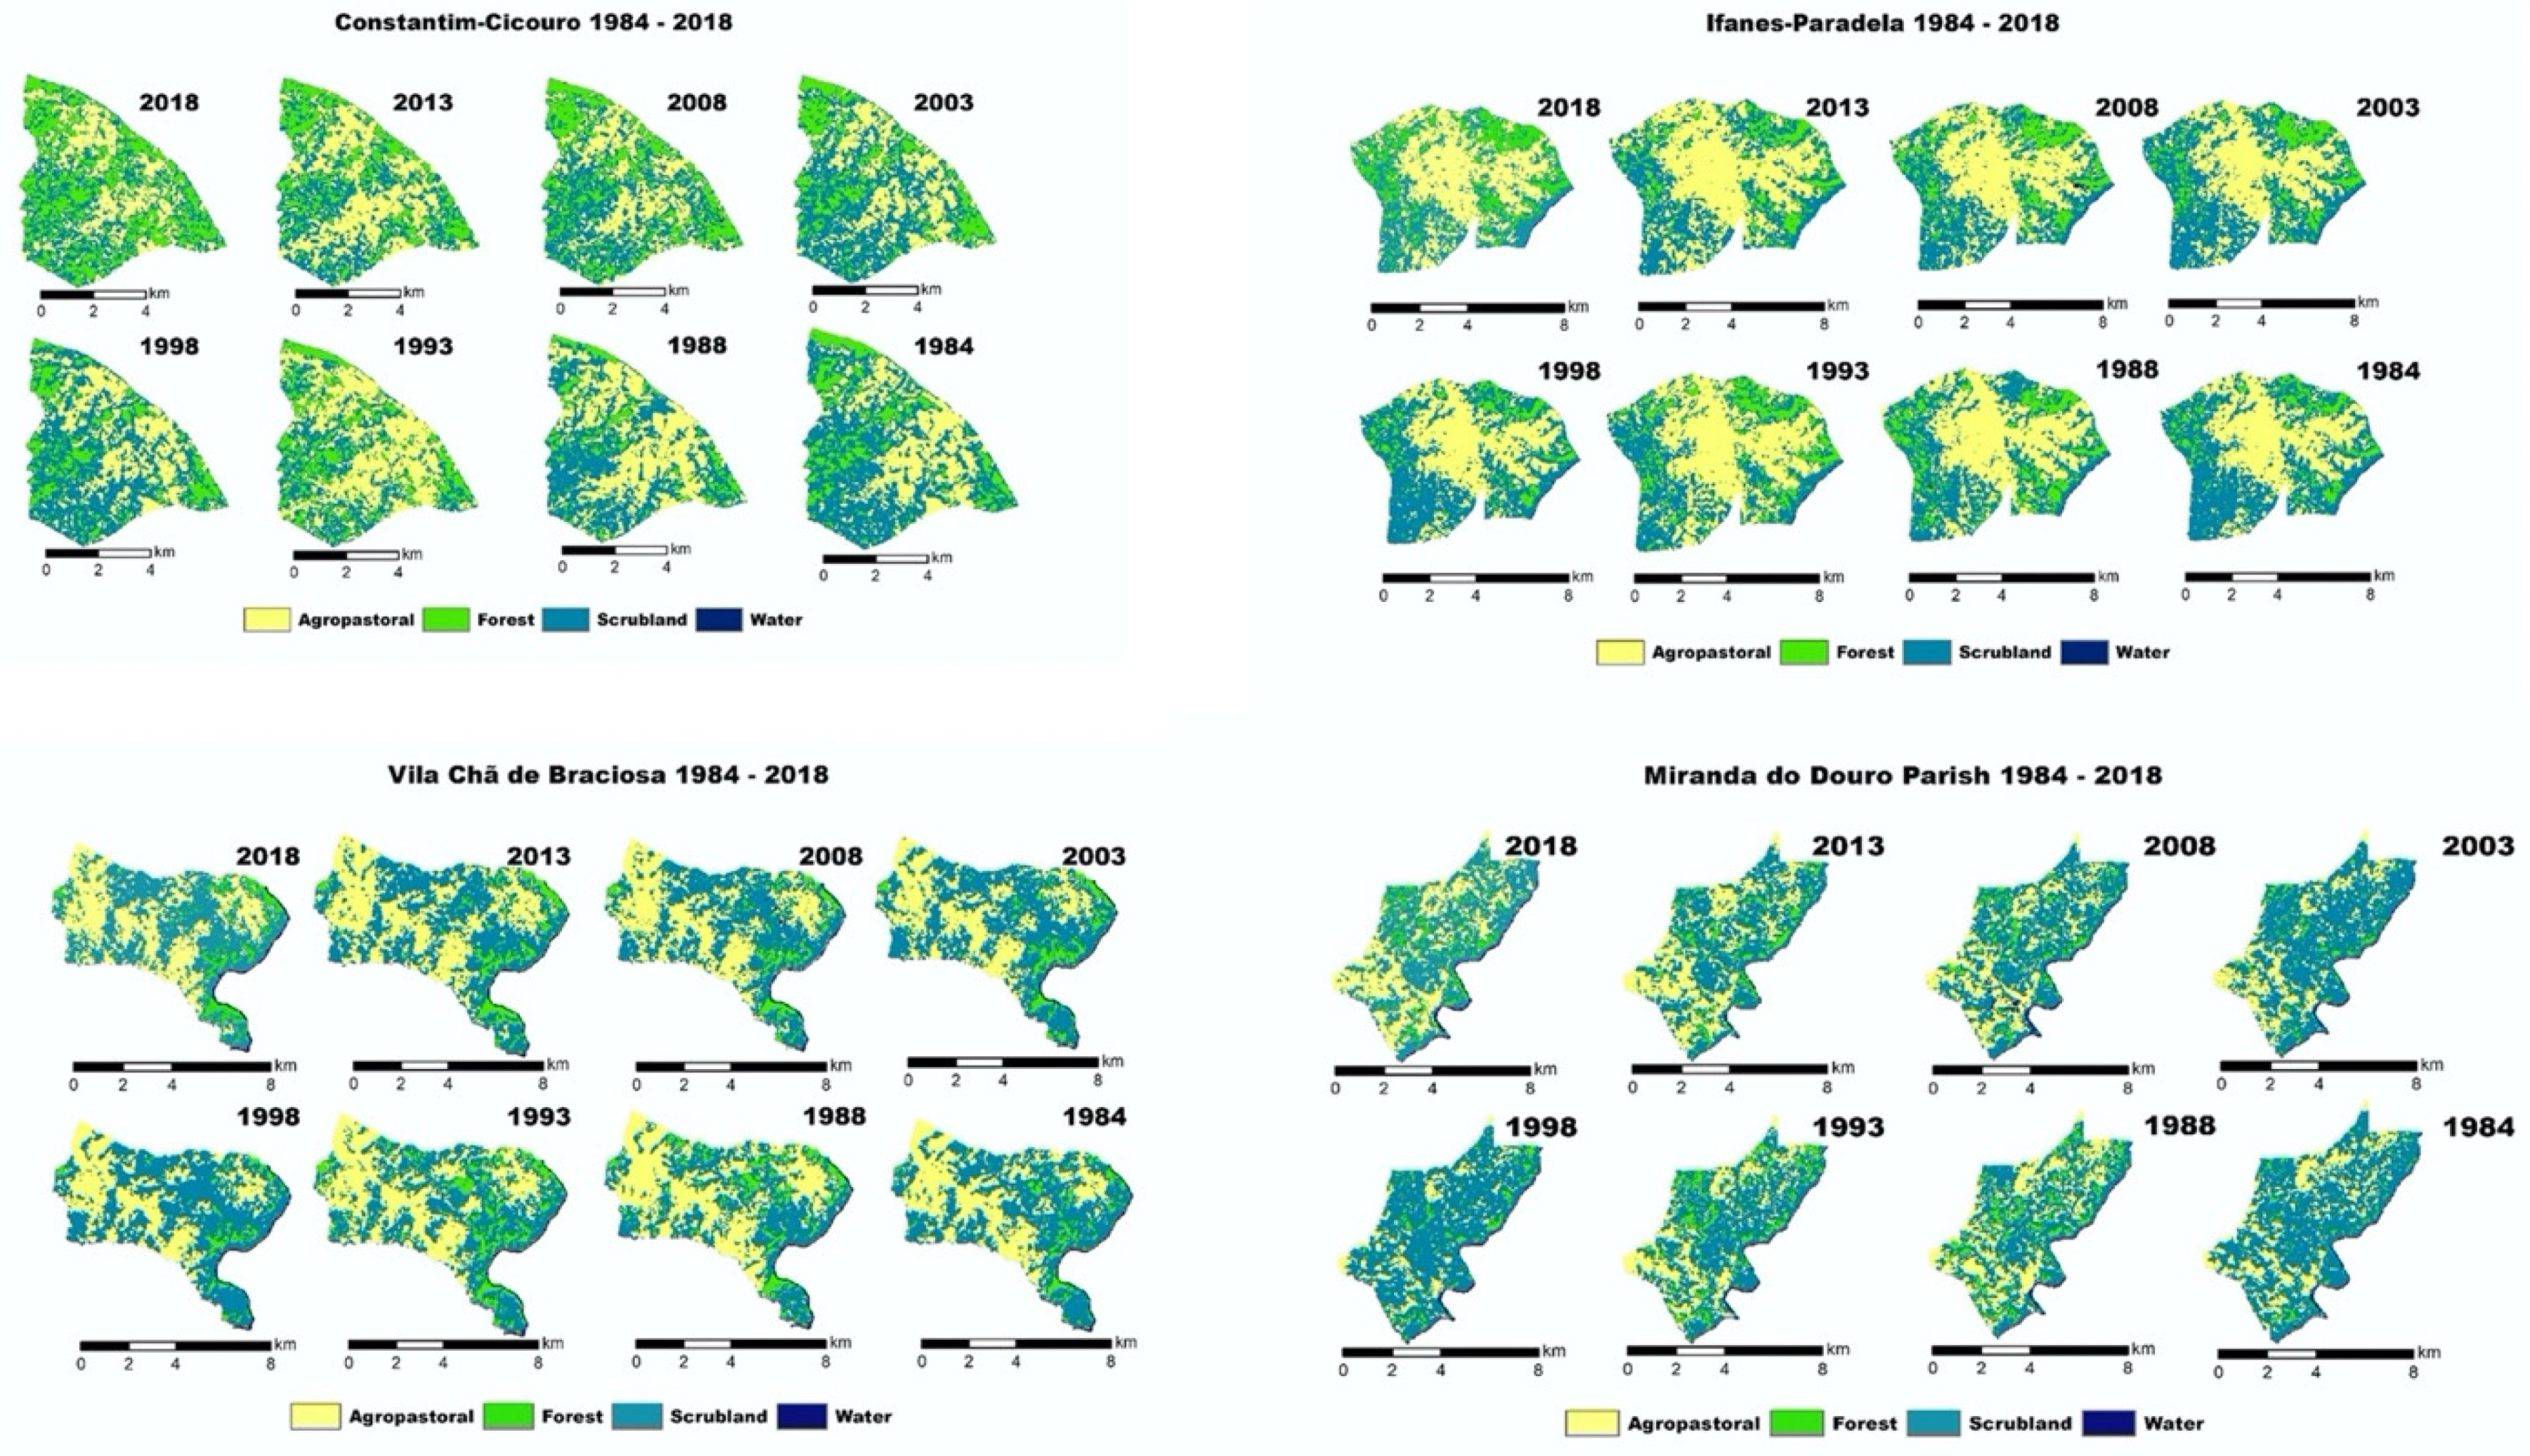
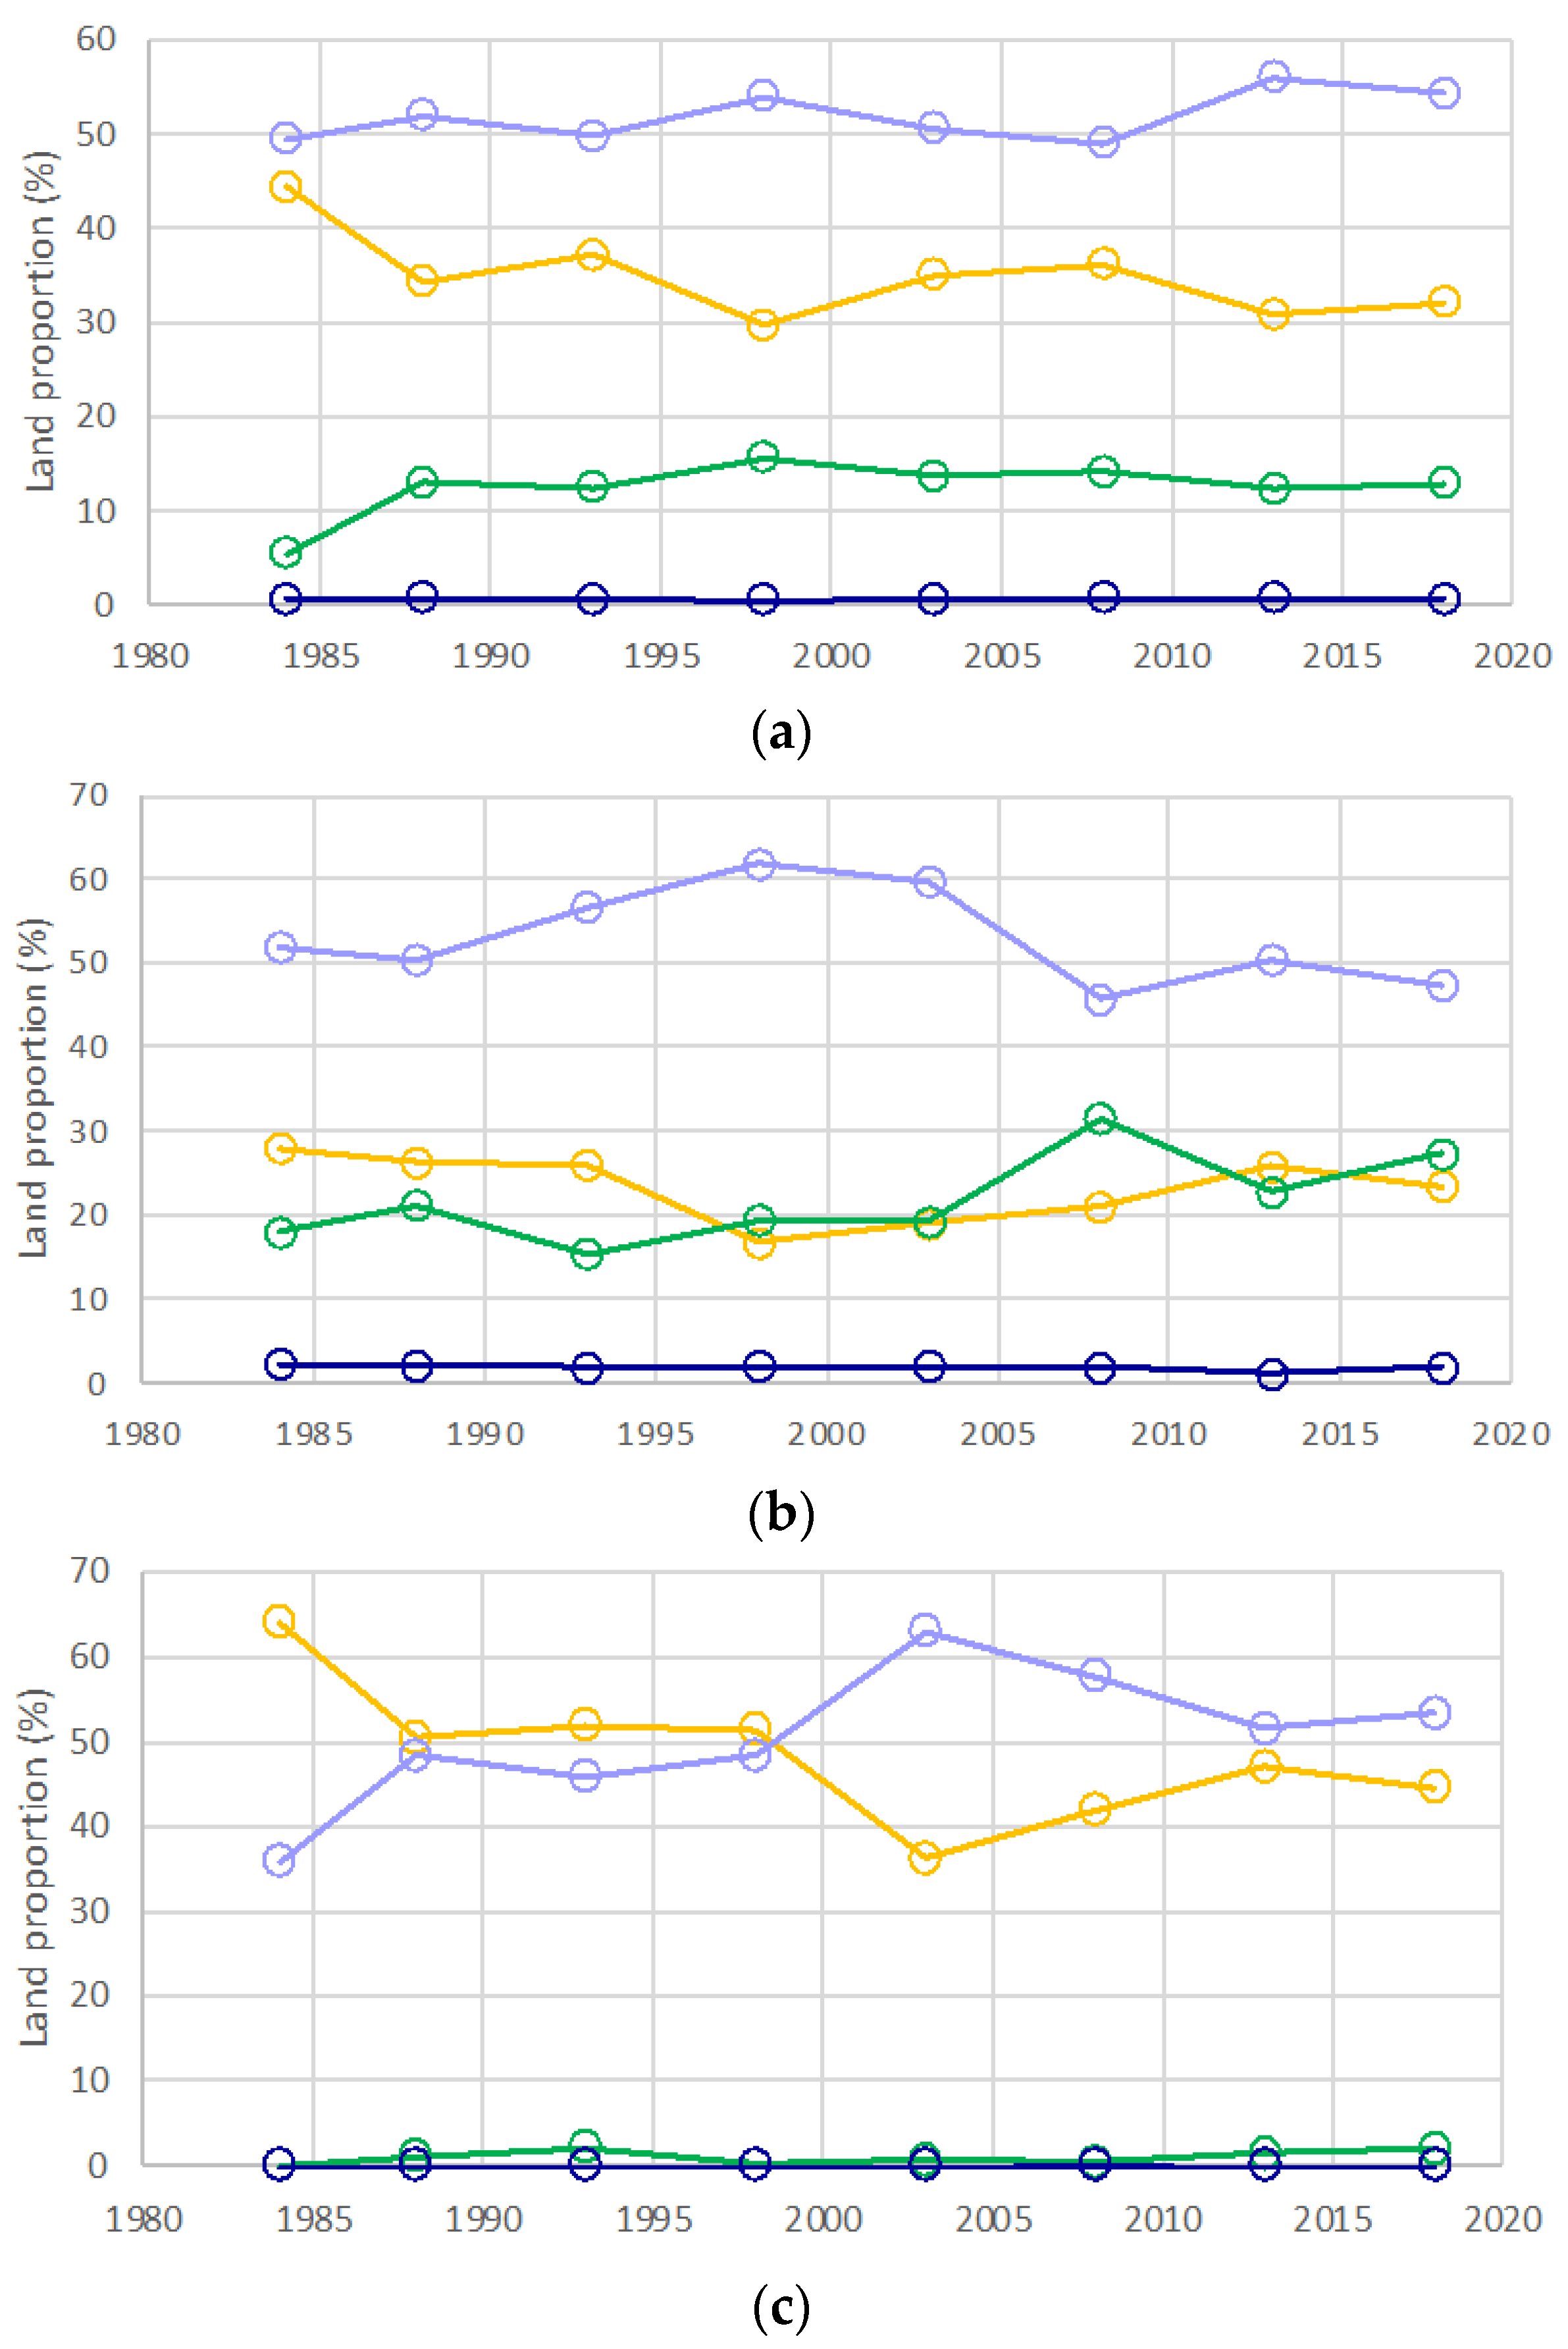
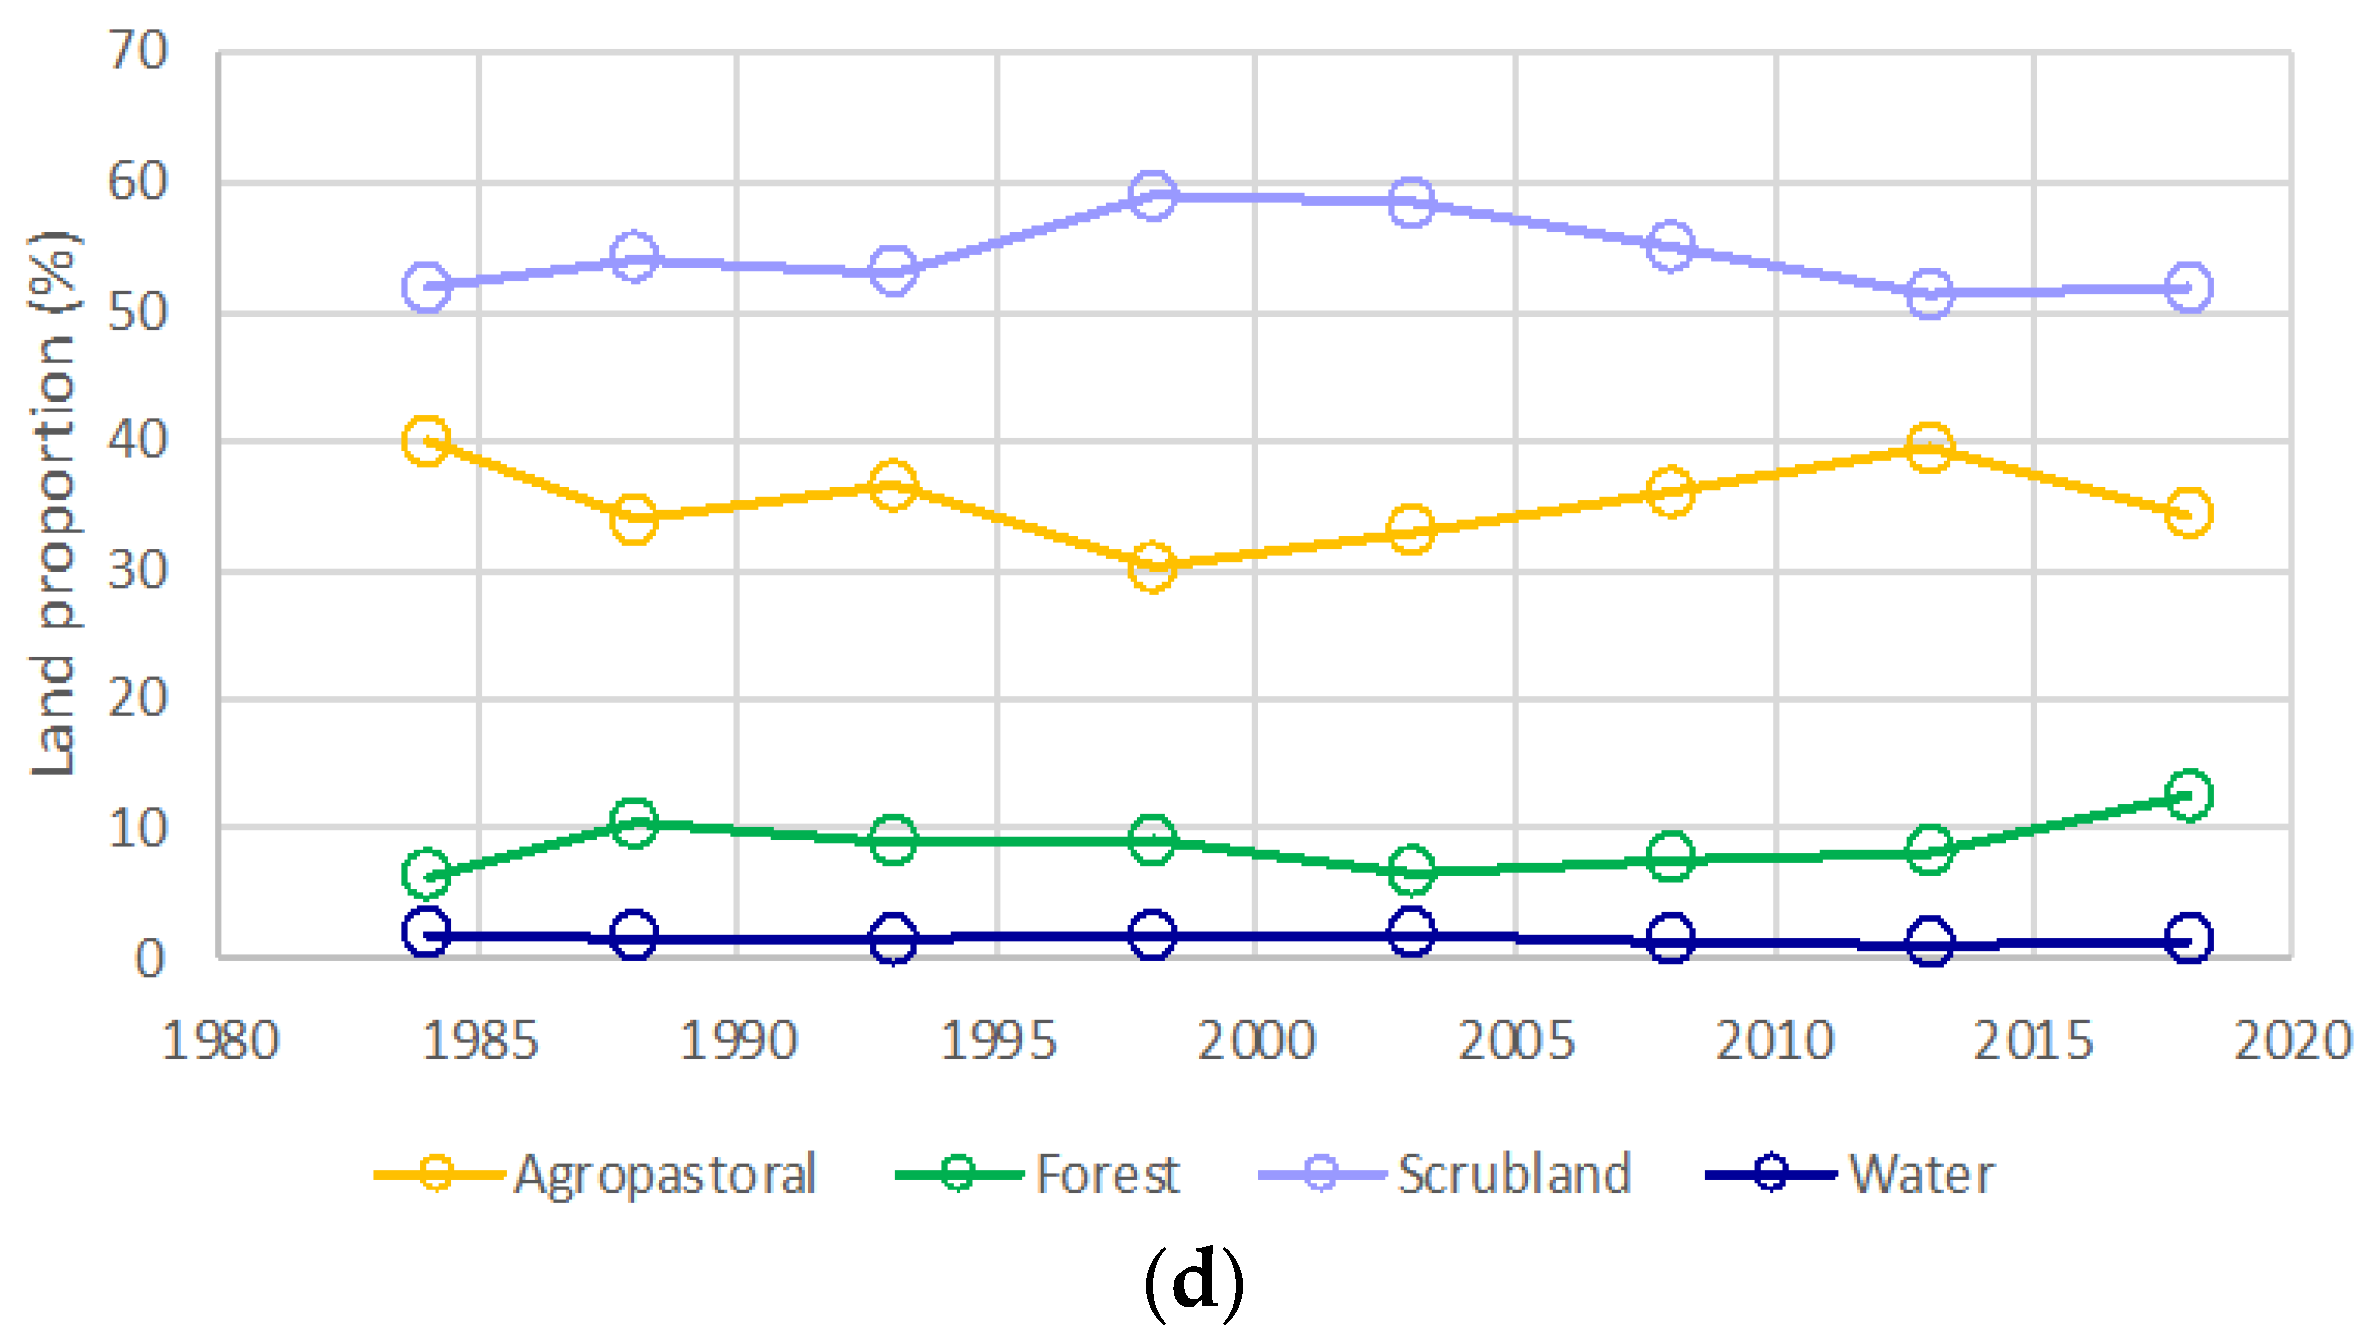
3.2.3. Land Cover Classification-Municipal Level Land Cover Changes

The general study area data provide an overview of the land cover changes occurring in the region. A more nuanced understanding of the landscape land cover change is seen, however, when the same analysis is applied to the municipalities covered in the ethnographic study. All municipal maps were extracted from the original greater study area map. As with the general study area, forest cover in all municipalities increased between 1984 and 2018 (Figure 6, Figure 7, Figure 8 and Figure 9).

Portugal

In 1984, the Constantim-Cicouro area had a significant scrubland land cover of 50%. By 2018, after some fluctuation, it had decreased to 33%. Forest cover rose from 18% to 37% (Figure 6a).
Scrubland in Ifanes-Paradela was significant at 48% in 1984. By 2018, it had decreased to 35%. Forest cover more than doubled between 1984 and 2018, from 10% to 20% (Figure 6b).
In Miranda do Douro municipality, the agropastoral class rose from 27% in 1984 to 36% in 2018. Scrubland, beginning with a majority of land cover in 1984, at 67% of the total area, declined to 52% by 2018. Forest cover, at 4% in 1984, more than doubled to 10% by 2018 (Figure 6c).
Although less pronounced than the other Portuguese parishes, Vila Chã de Braciosa followed the same trends as the others, with a slight decrease in scrubland from 52% to 47%, between 1984 and 2018. It had an increase in forest cover from 7% to 10% of the total municipal area (Figure 6d).

Spain

Forest cover in 1984 in Pino del Oro was at 5.45% and more than doubled to 12.92% by 2018. In 1984, agropastoral land cover was at 44.41%, yet had decreased gradually to 32.13% by 2018 (Figure 8a).
In Villardiegua de la Ribera, both the agropastoral and scrubland classes saw decreases in land cover between 1984 and 2018. The agropastoral class, beginning at 28% in 1984, decreased to 23% in 2018. Scrubland in 1984 was at 52% and decreased to 47% in 2018. Forest cover began at 18% in 1984 and increased to 27% in 2018 (Figure 8b).
Agropastoral land cover dominated the landscape of Argañín in 1984 at 64%, followed by scrubland at 36%. Forest only meagerly appeared at 0.09%. By 2018, agropastoral land cover had decreased gradually to register at 45%. Scrubland showed the most significant increase to 53%. Forest cover also increased to 2% in 2018 (Figure 8c).
Scrubland, being the majority of land cover in Fariza in 1984 at 52%, barely altered throughout the temporal analysis, remaining in the low 50th percentile, still at 52% in 2018. The agropastoral class began at 40% in 1984 and registered a decrease to 34% in 2018. Forest land cover more than doubled between 1984 and 2018, from 6% to 13% (Figure 8d).

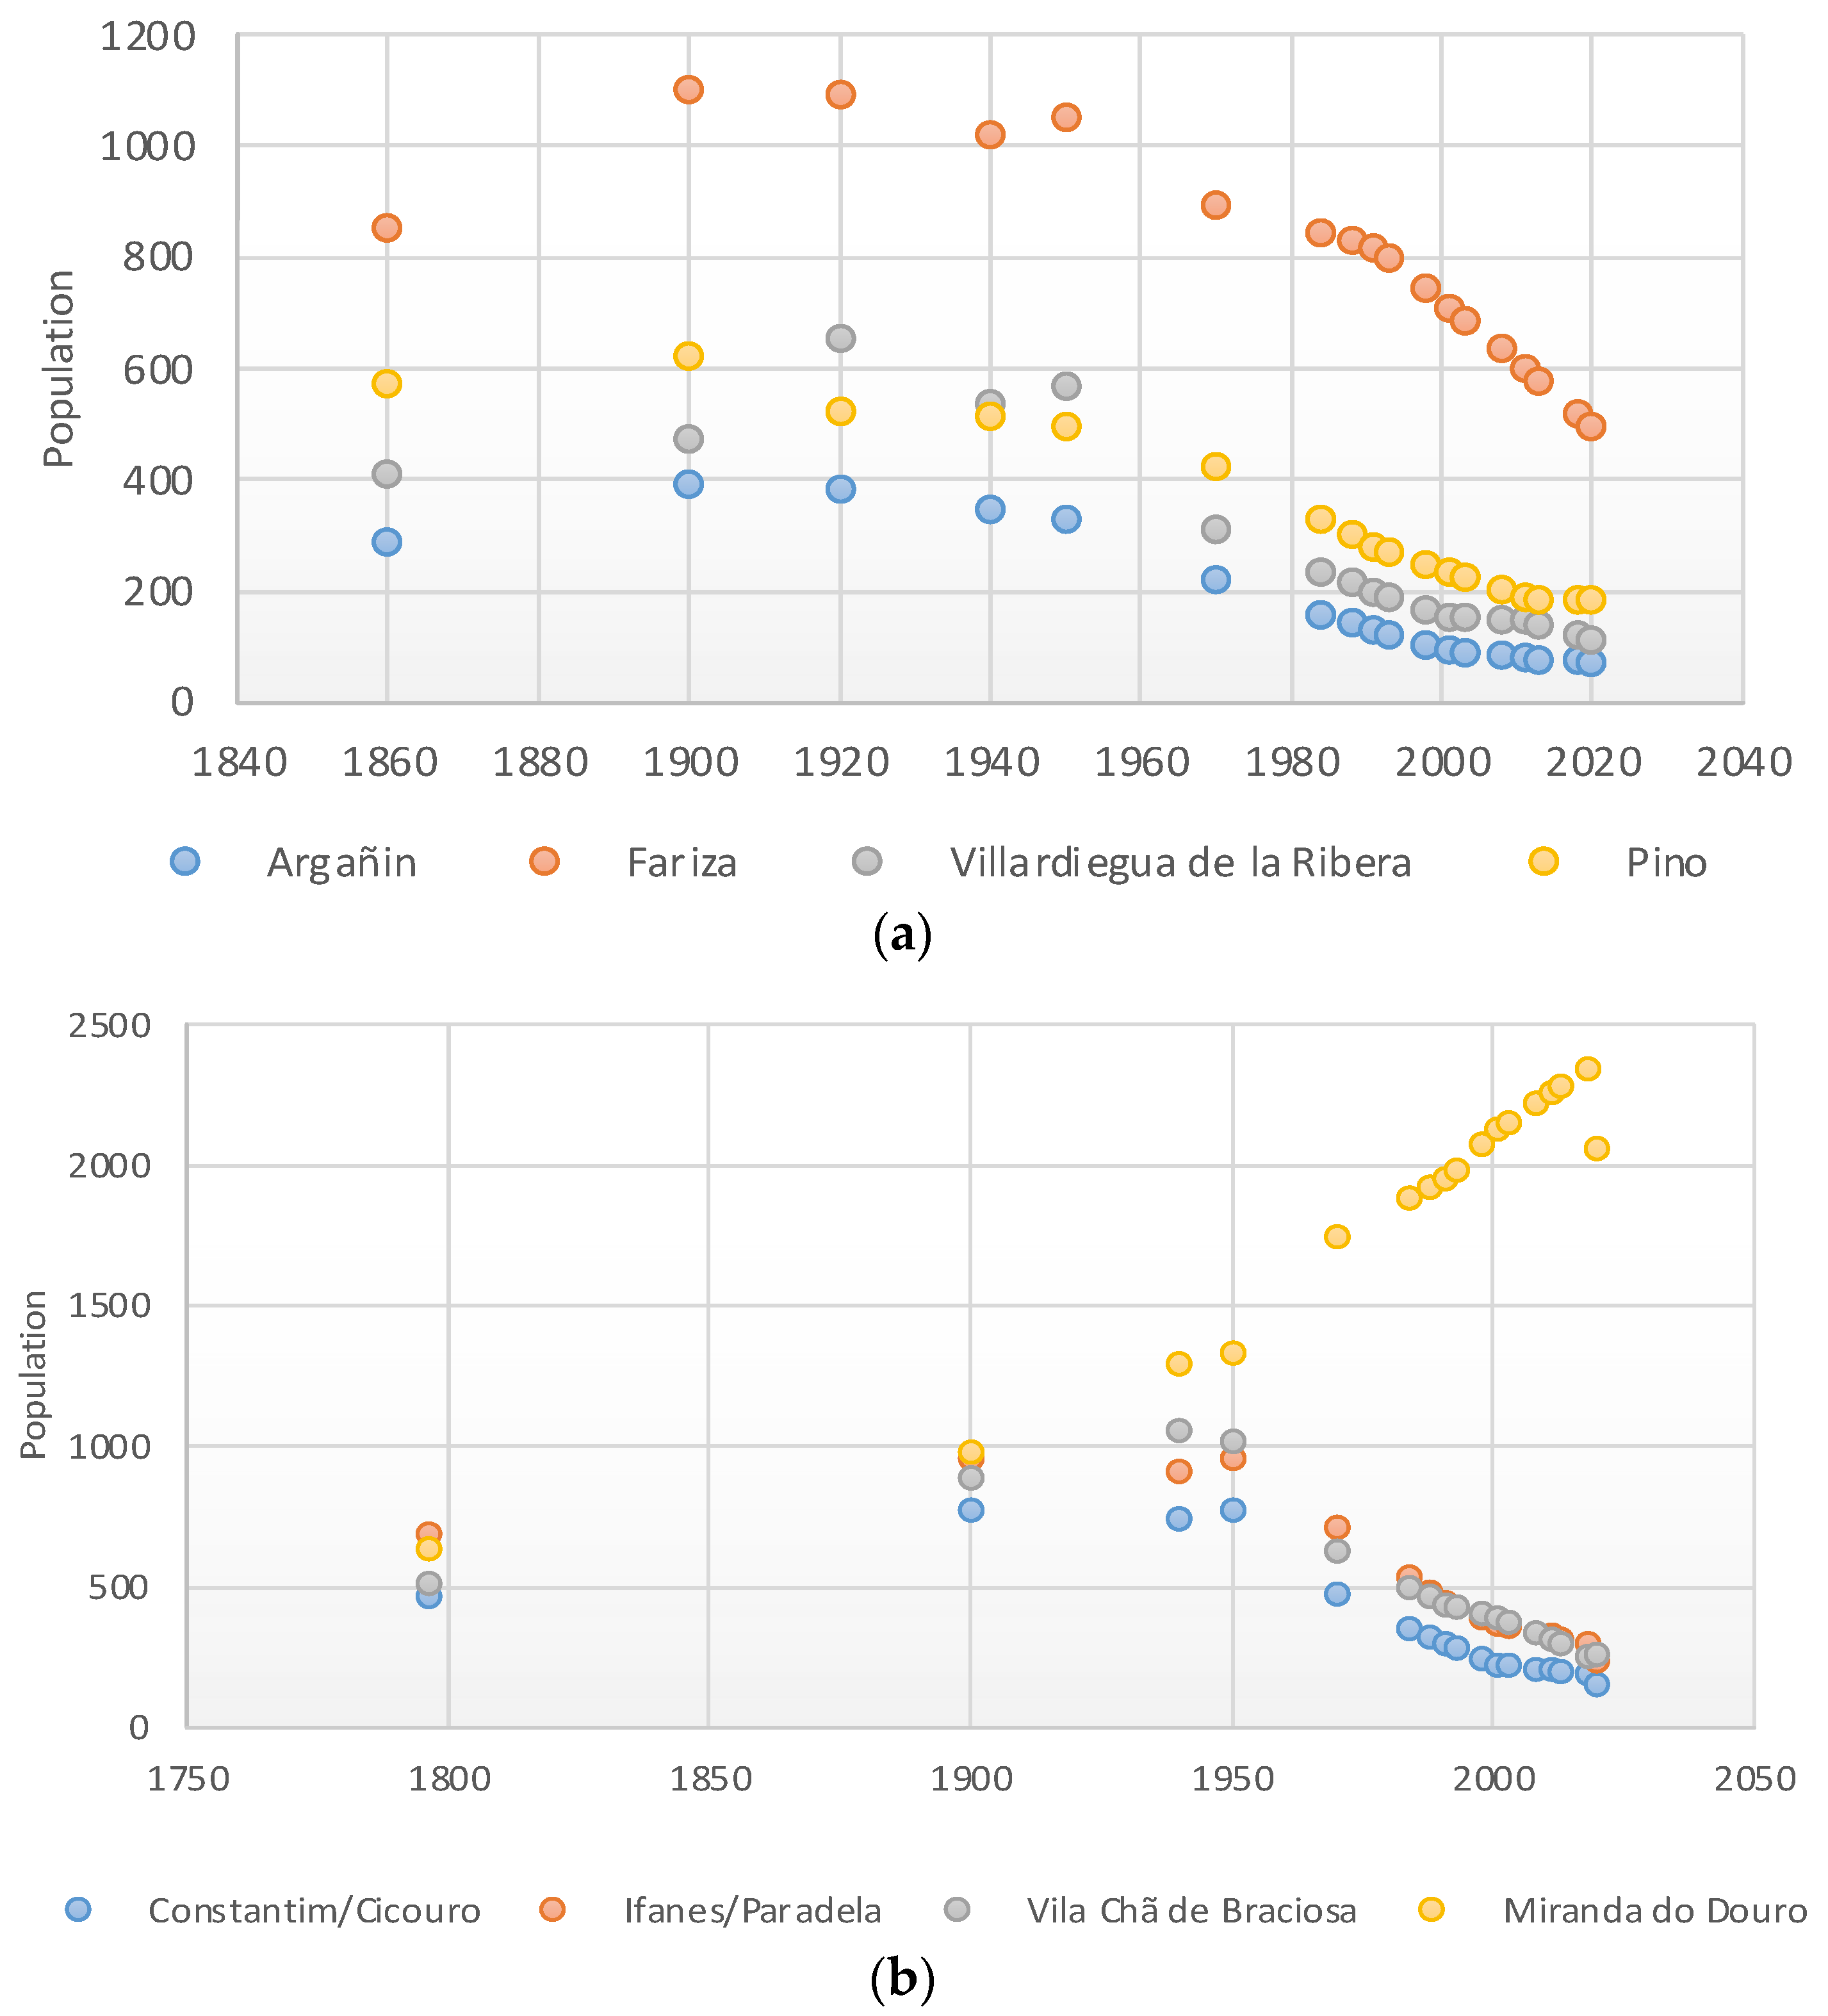
3.2.4. Population and Land Cover Class Correlation Analysis

With emigration from this region being a significant driver of landscape change, the Pearson coefficient was calculated among the three land cover vegetation classes (agropastoral, scrubland, and forest) in all eight municipalities and the available population data (Table 7). Since water was such an insignificant amount of land cover, it was not included in the correlation analysis. As Landsat scenes were captured in between years of official census recording, matching population years with Landsat scene years was achieved through the interpolation of both the Spanish and Portuguese population (Figure 10a,b). All municipalities, except for Miranda do Douro, followed predictable declines in population. Since the recent publication of 2020 census, however, Miranda do Douro has seen a slight decline in population [80].
Forest land cover and population showed negative correlations with forest land cover increasing and population decreasing in six of the eight municipalities. A positive correlation of agropastoral land cover declining with population was most significant with three of the four Spanish municipalities.
Scrubland-population correlations varied between negative and positive among the municipalities. Most notable were the negative correlations in Pino del Oro and Argañín, indicating a decrease in population and an increase in scrubland. Ifanes-Paradela had a notable positive correlation with both decreasing population and scrubland (Table 7).

4. Discussion

At the heart of this research are the effects of the gradual abandonment of the traditional agrosilvopastoral activities as a result of the socioeconomic factors that led residents to emigrate. Today, the remaining residents still engaged in agropastoralism maintain a tense relationship with government authorities tasked to manage the integrity of the natural parks and prevent wildfires. According to ethnographic sources, the region in the past had few wildfires. Today wildfires are considered to be one the greatest threats to ecological integrity in the Duero River borderlands region [36,81]. From interviews with residents who worked the landscape as agropastoralists from the 1970s and earlier, when asked to describe the landscape in the decades before the migration, the common response was “it was cleaner” in reference to the absence of so much overgrown vegetation and the prevalence of farming and grazing. [35].

4.1. Ethnographic Analysis

The common thread of the perception study was one of loss–loss of a traditional way of life as well as its socioeconomic and environmental effects on the landscape. Many interviewed struggled to find solutions to the problem of this loss through the development of tourism or a resurgence in the rural agropastoral economy, but felt hindered by the lack of public investment to increase tourism infrastructure and publicity. Additionally, returning to the original agropastoral economy was often viewed pessimistically and with disdain because it was perceived as very laborious, poorly compensated, and unattractive to younger generations. Although the region had been recognized for its environmental singularity with the declaration of the parklands, this distinction was now seen as more of a hindrance and viewed negatively by those few residents who maintained the traditional agrosilvopastoral use of the landscape. In all municipalities, residents expressed a concern with the new vegetative growth where there had once been farming and grazing. Public officials now fined and sometimes obstructed residents from using the land as before the creation of the protected zones. Fines are issued to residents who cut down, prune, or use controlled burns to remove certain species of trees on private land without prior approval. For many residents, this was viewed as an affront to their traditional land use. Despite the park and biosphere declaration, informants believed that the continued existence of their region, their traditions, and their way of life were in danger and would eventually disappear due to not only the loss of their population, but also public neglect, mismanagement, and the environmental impact of these decisions. These factors further exacerbated this perception of loss.
The perceptions of the Duero River borderland landscape from the stakeholders allowed for a more in-depth quantitative analysis, to demonstrate the impact of these human decisions on the landscape vegetation from the 1980s to the present.

4.2. Land Cover Change

The overall trend in the study area shows a significant increase in forests (from 10% to 22%), linked to a decrease in agropastoral lands (from 39% to 35%) and in scrubland (from 50% to 42%). At the municipal level there were some particularities, yet the loss of agropastoral lands and the increase in natural vegetation coincided with a steady rural abandonment process demonstrated by population statistics. The only exception was Miranda do Douro. It is the largest municipality in the area and was the only one with a population increase, where a loss of agropastoral land could not be perceived.
Although obtained land cover change trends are consistent in the long-term, short-term differences can be observed that might not be related to real changes in land cover but rather to classification issues [82]. For instance, in 1998, in some Portuguese municipalities the scrubland area was larger than the five-year period preceding or after it. These short-term changes need to be interpreted with care, since they might reflect particularities in the climatic conditions of that particular year, or other issues, which affected vegetation growth and made the separation of scrubland-agropastoral or scrubland-forest more difficult. In effect, 1998 was a particularly dry year with only 282 mm of rainfall recorded in the meteorological station of Zamora (40 km from the study area), which has a historical mean of 379 mm. Such anomalous years are challenging from the point of view of classification, since vegetation growth and dynamics might differ substantially from their normal pattern [83]. In addition, it must be considered that agropastoral lands in the area typically follow a rotation cycle with long fallow periods, where spontaneous vegetation might grow, enhancing the confusion with scrubland areas during fallow years. It is also important to consider that scrublands might have scattered Quercus trees and some tall shrubs, so the confusion with forests might also occur. Last, but not least, wildfires (a significant driver for land cover change) in the area during the study period might clearly impact classification results.

4.3. Drivers for Land Cover Change

Long-term land cover change and the current state of landscape vegetation are a result of not only demographic change in the Duero River borderlands region but also a consequence of an interplay of several drivers that include: agrosilvopastoral abandonment, government landscape management, and preservation policies, wildfires, and post-fire vegetation recovery (Table 8). All have had a significant impact since the mid-20th century. Increasing abandonment since the 1960s, followed by afforestation programs beginning in the 1990s and then natural park creation by the early 2000s, have all contributed to further vegetative growth. Moreover, policy decisions restricting past land use (cutting, burning, cultivation, pasturing) have also had an impact. The damage caused by wildfire has counteracted the growth somewhat, with an increase in fire events since 2000, but forest growth has nevertheless seen modest to significant increments in all municipalities and the greater study area.

4.3.1. Emigration and Migration

Ethnographic data have fueled the idea of change on this borderland landscape’s history. Emigration resulting in agropastoral lifestyle abandonment and the transformation of vegetation land cover have been the primary indicators of change for the long-term residents in the area. In the study area, the effects of this abandonment are most pronounced in Spain. Agropastoral land cover declined moderately to highly in three out of four of the Spanish case study municipalities. The Portuguese case studies, although demonstrating small losses in agropastoral land cover, did not reach the significant levels found in Spain. Portuguese demographic data for the greater Miranda do Douro county (which includes all of the Portuguese municipalities covered in this study) from the agricultural census confirms these findings with a detectable rise in small scale agriculture from 21,470 hectares of agricultural land utilized in 2001 to the next available data of 21,813 hectares in 2011 [84]. Although not a significant increase, the amount of people still maintaining agropastoralism has ameliorated, to a small degree, the effects of population decline from migration and emigration. A social diagnostic report from the Miranda do Douro county authorities, however, projects this increase as unsustainable due to the fact the average age of agricultural workers at the time of the last agricultural census was 64 years old [84]. Important to note as well is that, unlike in Spain, which has experienced a population decline in all municipalities in this study, the municipality of Miranda do Douro has trended upwards in population growth. Recent census data, however, show a decline in population [80].

4.3.2. Government Policies–Park and Biosphere Zones Effects on Residents
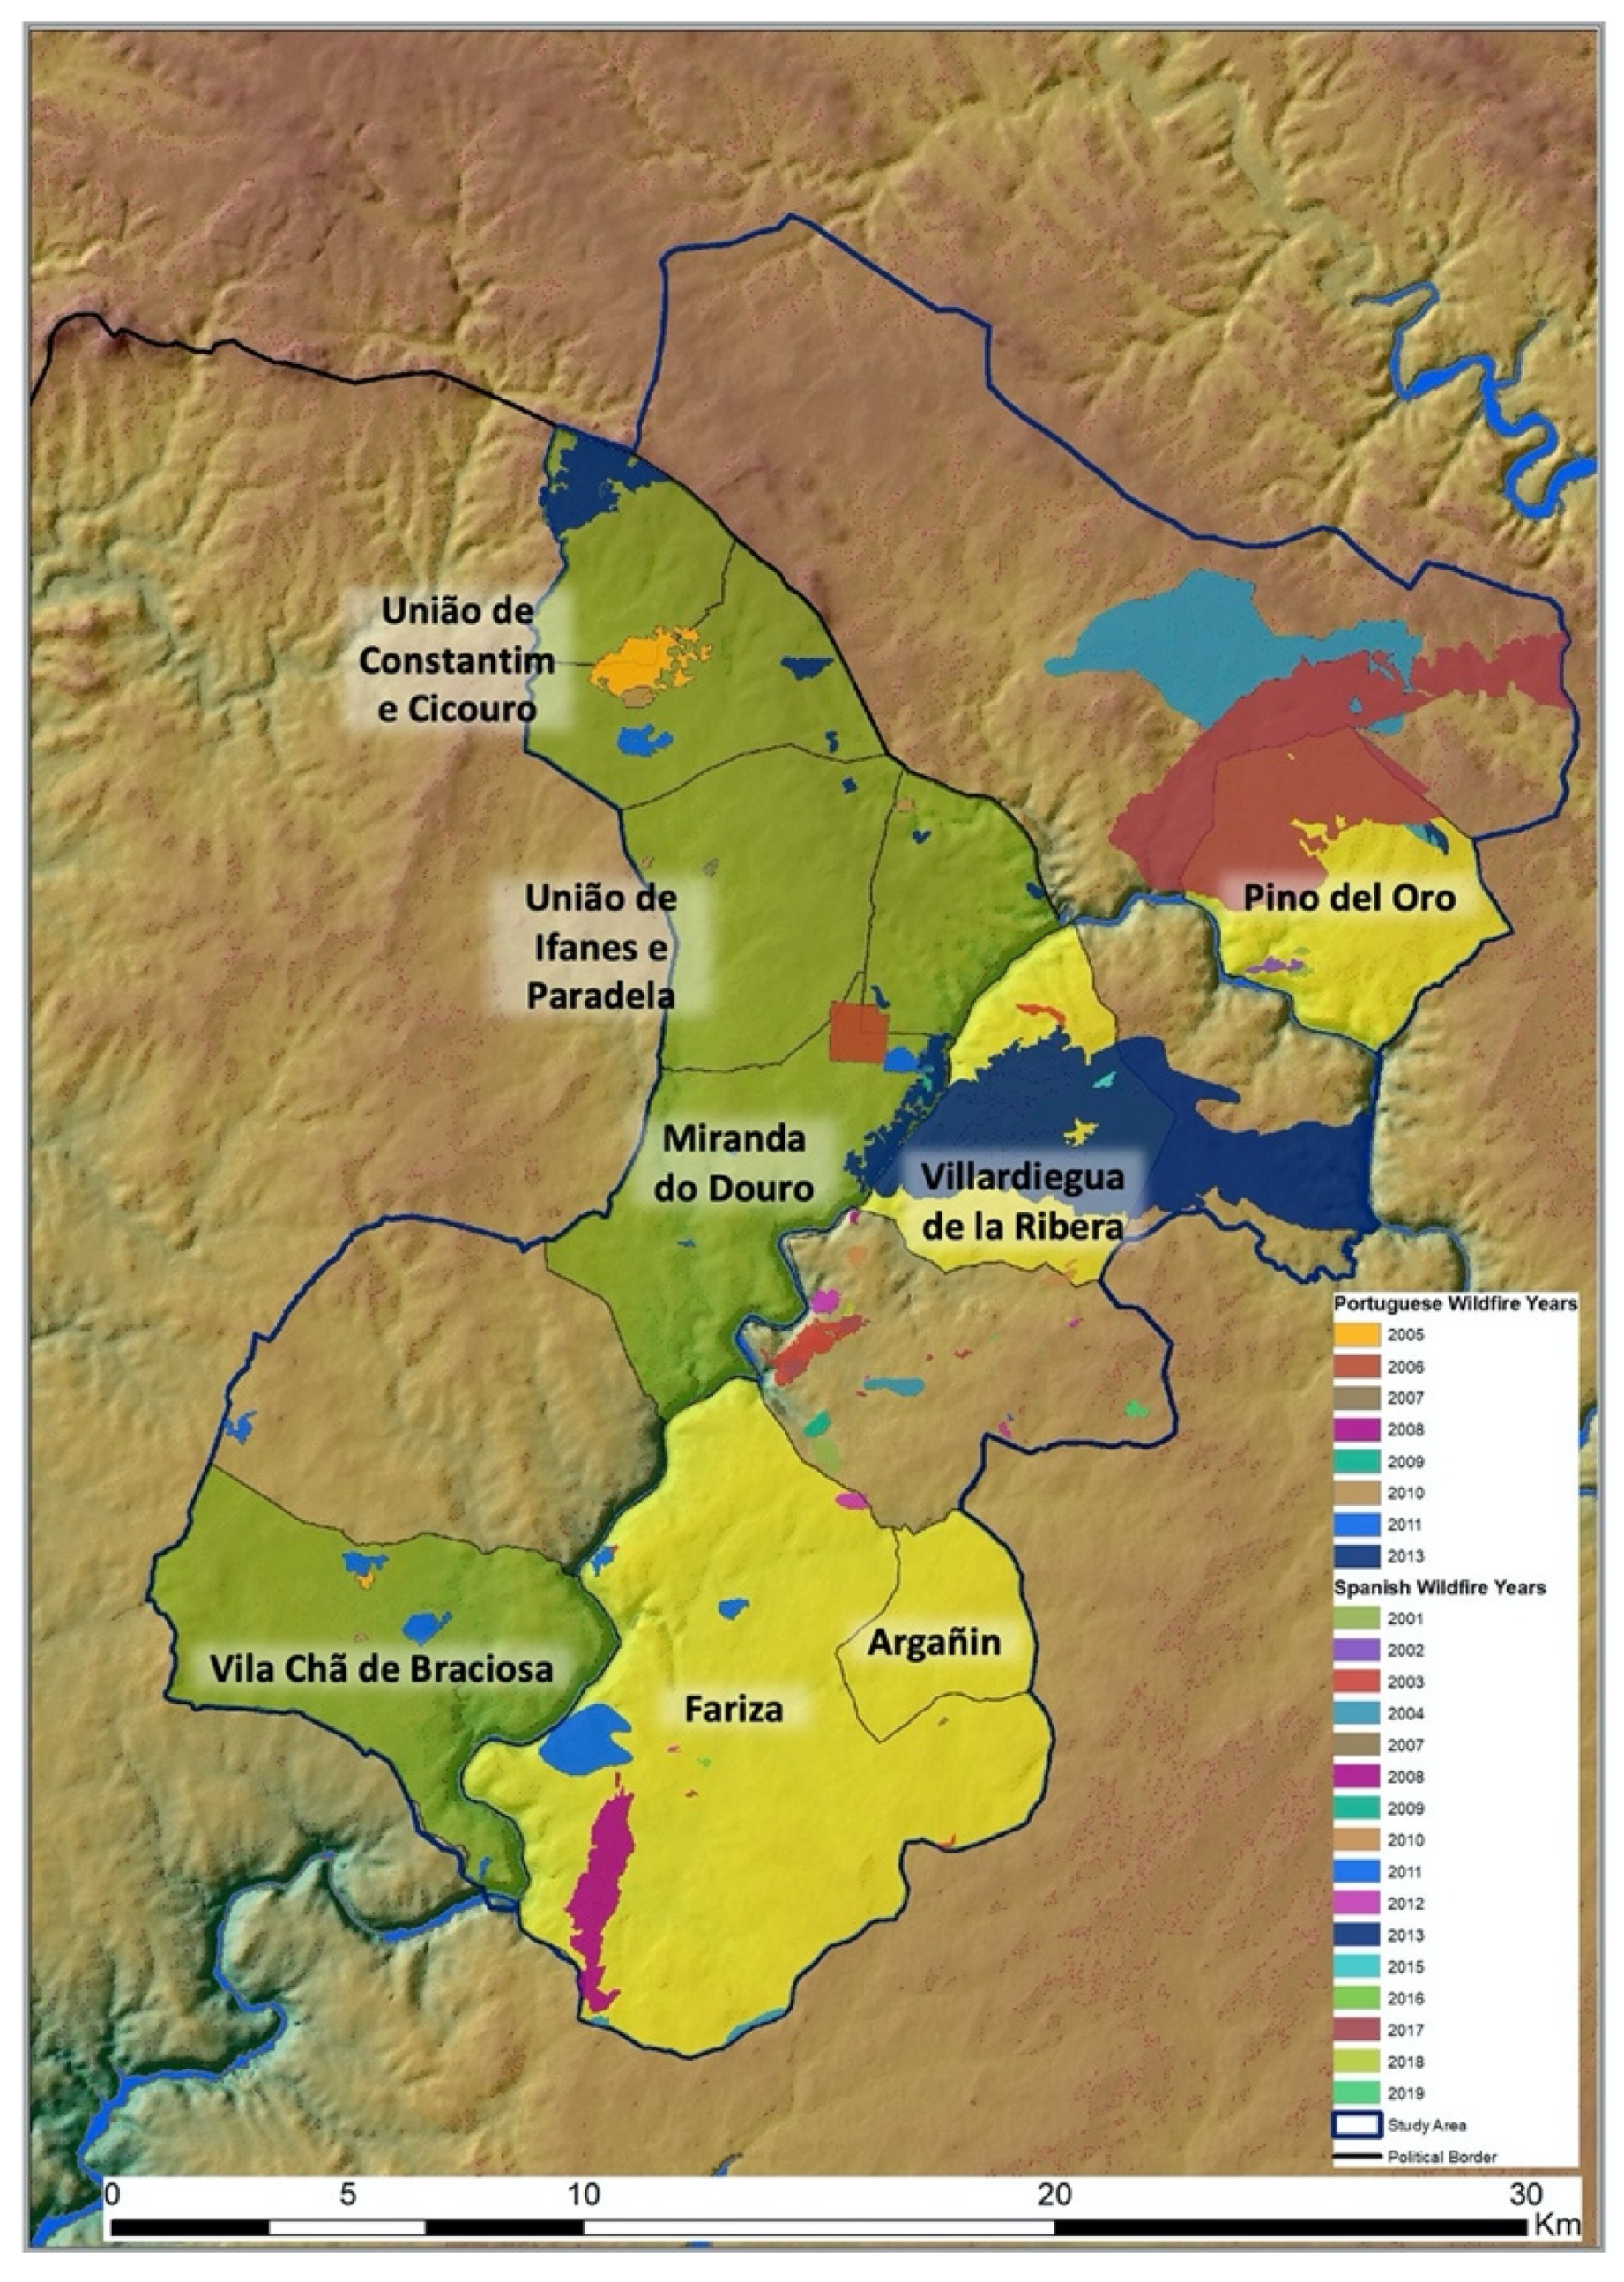
Forest land cover increased in all the case study municipalities in the study between 1984 and 2018. Within the greater study area there was a nearly 12% increase from 1984. Human policy decisions between the two nations have played a role in this increment. Most notable are the creation of the international natural park zone followed by the UNESCO-designated biosphere reserve. With the objective of protecting the singularity of the natural ecosystem, new restrictions and monitoring have been placed on past agrosilvopastoral land use, instead favoring forest growth and a more preservation-style management. Although compliant and largely in agreement with the new landscape management laws, particularly those aimed at preventing wildfires, residents indicated that past landscape agrosilvopastoral management before the mass migration allowed for more biodiversity of plants and animals [35,85]. According to residents, this previous type of land management also controlled fires, due to more people living on and cultivating/pasturing the landscape thus reducing what they perceived as the overgrowth of vegetation.

4.3.3. Wildfires

Wildfire has had a significant impact on the landscape, its people, and even policy. Offsetting forest growth to an extent has been the occurrence of wildfires in recent years. This factor is typical of other findings in Spain near protected areas [86]. In Portugal, the data from the county report of areas at risk of wildfire and specially prepared GIS data from the Castile and Leon government’s Territory and Environment division have provided information detailing the location, date, and extent of wildfire (Figure 11) [87]. From Figure 11, wildfires, since 2000, have been more extensive and damaging on the Spanish side of the border. From Table 6, forest cover, despite its overall increase from 1984 to 2018, dropped 2.38% between 2008 and 2013 (years in which there were significant wildfire events). Scrubland (Table 6) registered notable drops of 4.16% between 2003 and 2008 and 4.75% between 2013 and 2018, which were years of significant wildfires (Figure 11). Even before GIS data were available, in the period from 1984 to 1988, the province of Zamora registered a total of 61,130.6 hectares burned [88]. NBR data in the neighboring municipalities of Fariza and Argañín dropped significantly to register negatively for 1988, indicating a fire in the area (see supplementary data, Table S1 and Figure S3). In Pino del Oro in 2015 and in 2017, wildfires caused massive damage with NBR in 2018 showing a significant decrease from the previous year (see supplementary data, Figure S3).
Another important factor with wildfire is the regeneration of the vegetation biomass post fire. Long an important element of the landscape, whether occurring naturally or provoked, fire has been viewed by many residents in the region until more recent decades as a natural phenomenon. With rural abandonment however, shrubland and pasture lands have seen excessive regrowth with taller, more extensive grasses and shrubs [89] resulting in more “homogenization” and fuel for future, more frequent, and intense wildfires [90,91,92].

4.3.4. Afforestation Programs-Portugal

Despite the recurrent wildfire occurring both before and since the natural park and biosphere declarations, there have been national rural land management strategies in both nations aimed at afforestation and watershed management. On the Portuguese side of the border, governmental policies regarding land use differed from Spain, with Portugal implementing afforestation programs for both environmental and economic benefit. Two programs had a significant impact on forest growth in Portugal: the European Economic Community Initiatives (EEC, No 2080/92, https://op.europa.eu/s/oJB2) [accessed on 16 February 2021] in the 1990s and RURIS, the joint EU and Portuguese government forestation program (https://www.ifap.pt/fta-ruris-regras) [accessed on 16 February 2021], in the early 2000s [93]. Mostly detectable in the Ifanes-Paradela and Constantim-Cicouro municipalities, these programs contributed to an increase in forested areas in the study area.

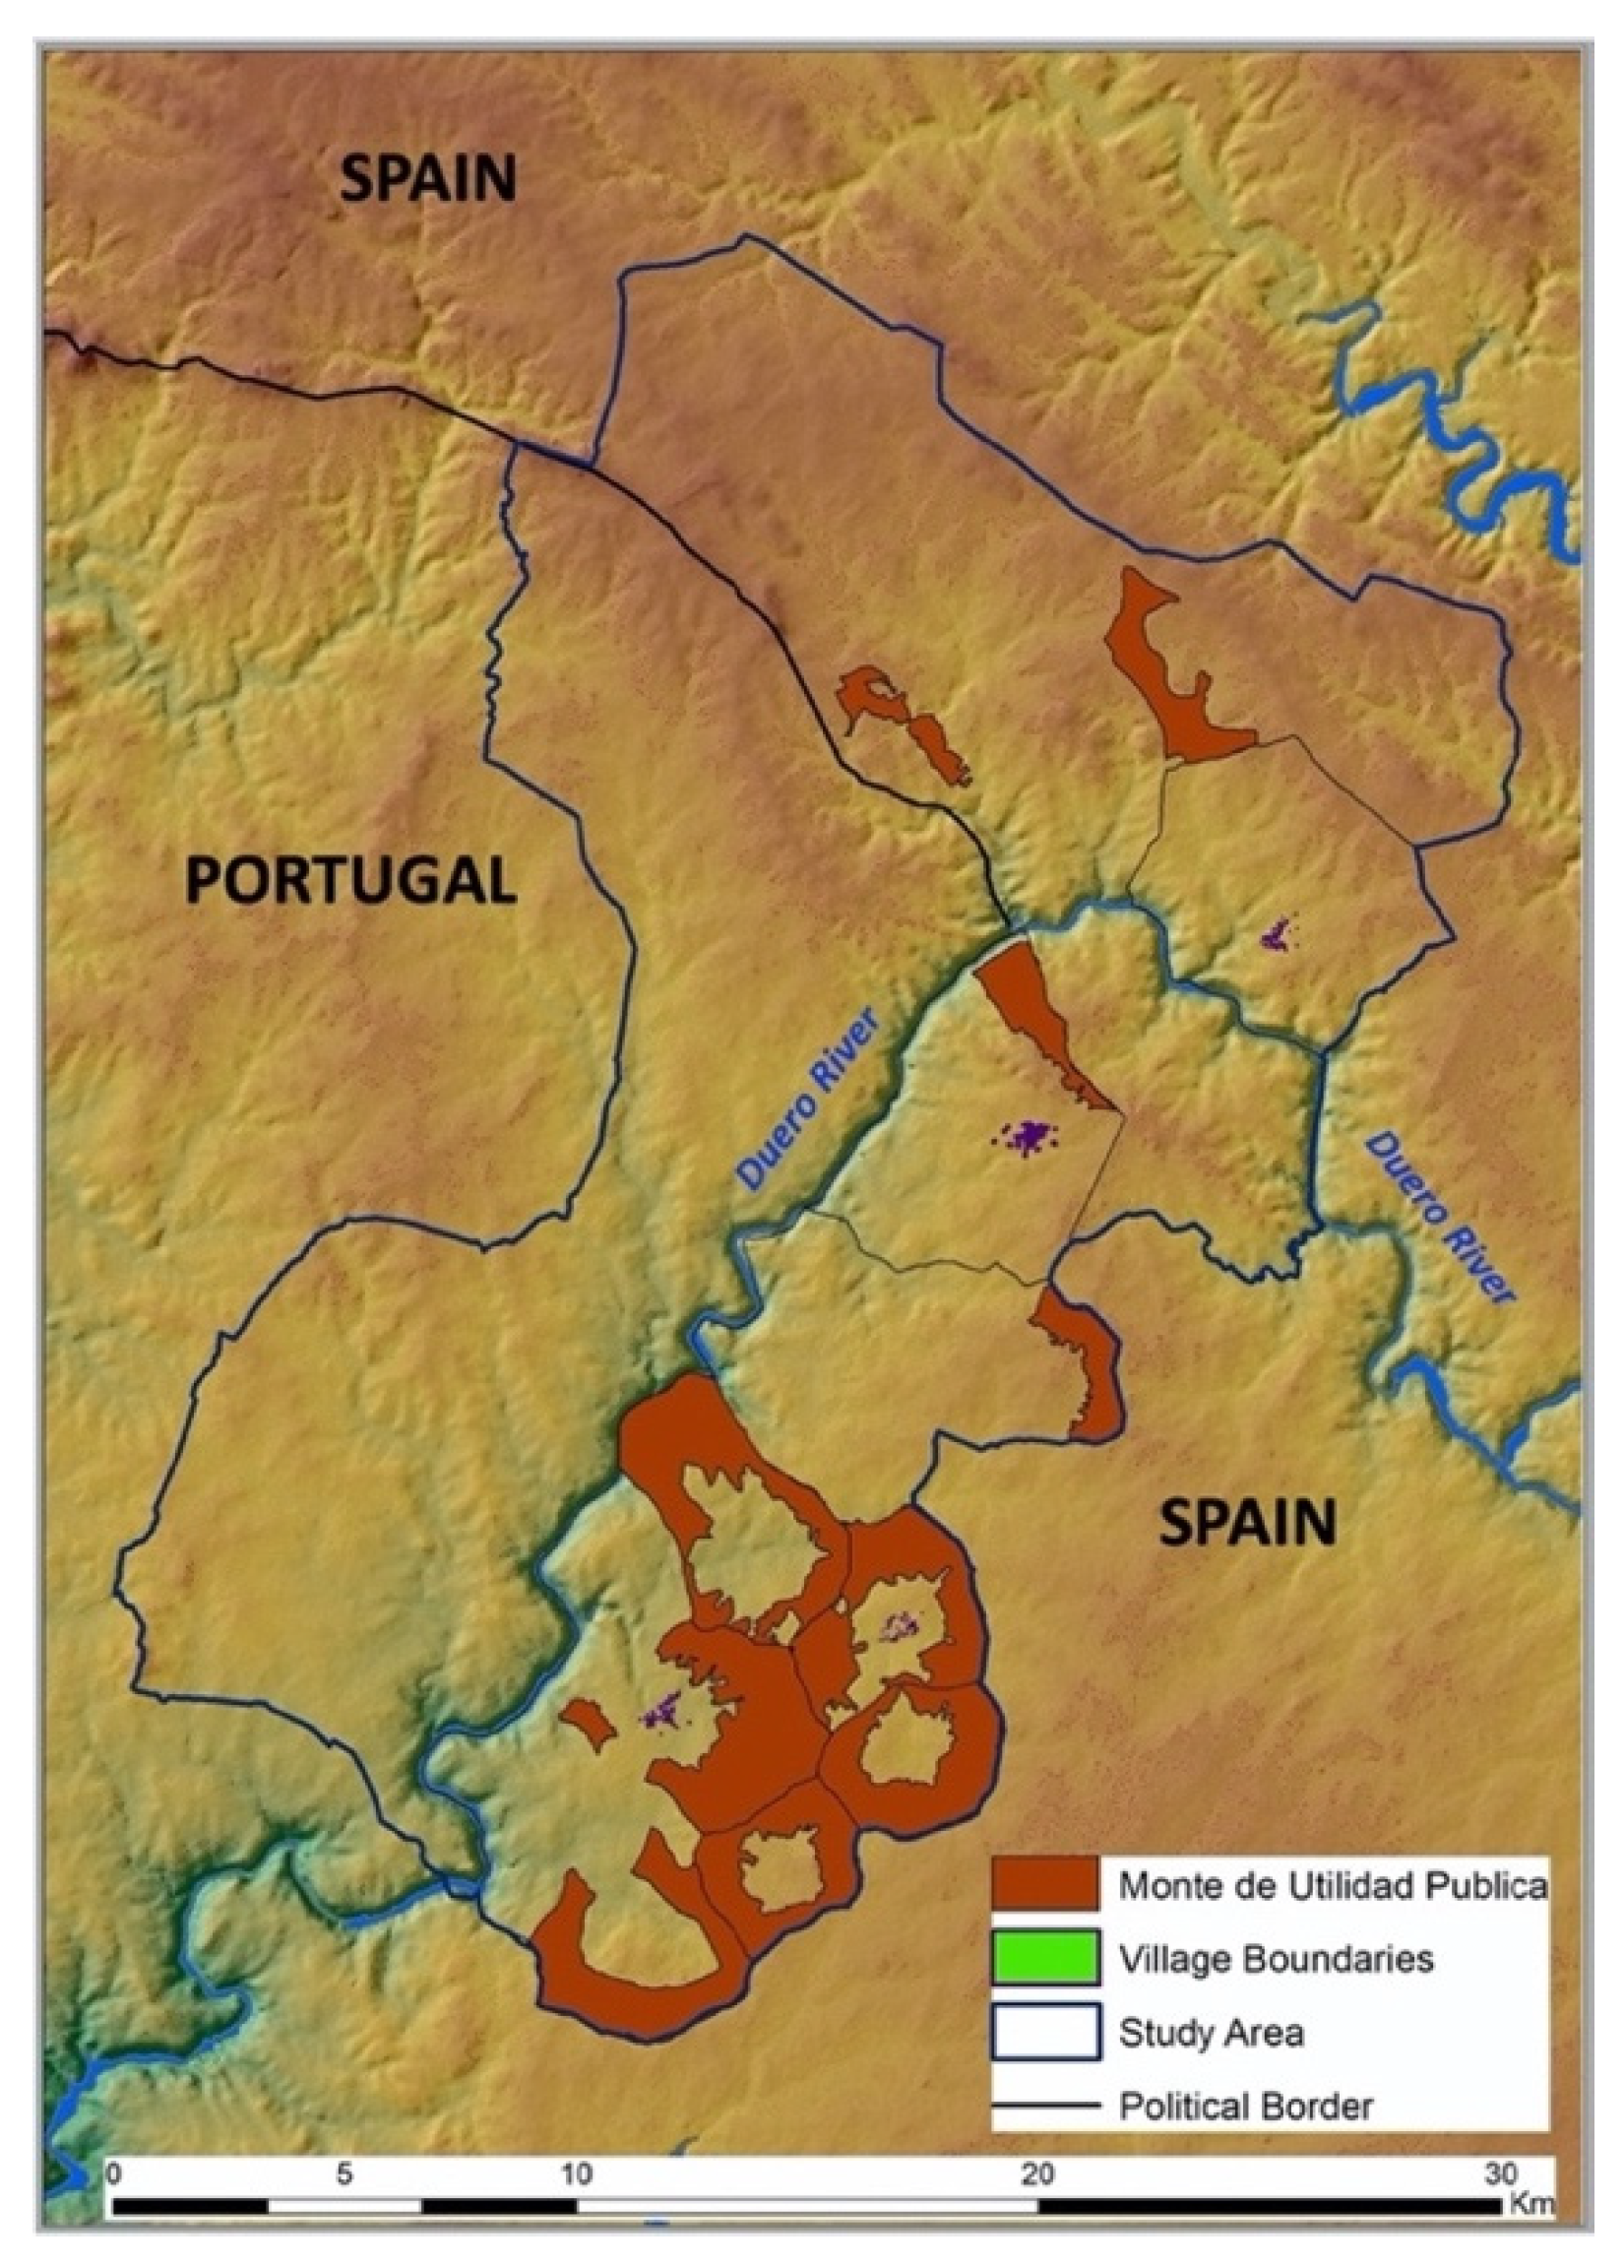
4.3.5. Historic Public Watershed Management

On the Spanish side of the border, afforestation, although present in the province of Zamora, did not occur in the case study municipalities. Reforestation has occurred in Spain and more specifically Zamora, under the same initiative in the 1990s as in Portugal under the EEC 2080/92 and later in the diverse rural development program called Fondo Europeo Agrícola de Desarrollo Rural (FEADER) http://www.redruralnacional.es/fondo-europeo-agrario-de-desarrollo-rural-feader-. In areas where rural lands were within the parameters and jurisdiction of a natural park (as in the case of all of the Spanish municipalities in this study being within the Arribes del Duero Natural Park) reforestation was curtailed according the norms established by the Red Natura 2000 network of natural preserves in the European Union [94]. Instead, long term land management policies positively affected another land cover class, scrubland. In Spain, a public land watershed management system called Montes de Utilidad Pública (MUP) was initiated by the national government and maintained by the regional and provincial governments [95]. In some Spanish municipalities, large swaths of land fall under this administration and protection (Figure 12). In the study area, within these protected areas, rough grazing is permitted but cultivation is not. Scrubland predominates and is maintained in these publicly managed areas, but with rural abandonment and less pastoralism some of these areas have seen more arboreal growth. In Argañín, a municipality with MUP lands, there was a detectable rise in scrubland from 1984 to 2018, as found in other studies. In addition, there was a minor increase in forest cover at the expense of a decline in agropastoral land [96]. Fariza, also with significant lands under MUP jurisdiction, mirrored Argañín’s statistics, but they were less pronounced: a 6% increase in forest land cover and scrubland registering a very minor increase.

5. Conclusions

In the Duero River borderland region beginning with the protohistoric and Roman periods to the mid-20th century, the population has waxed and waned throughout the centuries. One factor though that has been consistent throughout: land cover has been influenced by the prevalence of agrosilvopastoralism. Since the mid-20th century, a new story is being told: a story of population decline, of rural abandonment, and of changing perceptions of this landscape from stakeholders who now value the landscape less for its traditional land use but instead for its ecological singularity and, to a lesser degree, the socioeconomic benefits that can be reaped from this ecological distinction and its evolving land cover.
In this study, we have applied an effective integrated methodological approach to interpreting the reasons for temporal land cover change. After implementing an initial time series of vegetation indices for the region, we developed a quantifiably accurate and effective landscape classification with stable training sites, which was used to demonstrate diachronic land cover change over a 34-year period. Combined with both ethnographic testimony and analysis of demographic statistical data, this integrated approach has furthered our understanding of the causes and has provided nuance to temporal landscape change, by adding a more “bottom up” approach that cannot be fully understood by only looking down from space.
Not a monolithic region of identical characteristics, the analysis demonstrated gradations of land cover changes when conducting a transborder analysis. It highlighted the national and historical differences in land management governmental policies and demographic change. Spanish land abandonment was the greatest in the region, and our land cover change findings complement current national and European demographic studies. Throughout the international borderland study area, however, both qualitative and quantitative data illustrated that forest land cover has increased since 1984 because of not only agrosilvopastoral abandonment, but also other policy drivers aimed at afforestation and forest preservation, with the creation of protected natural areas as well. Due to increased forest cover throughout the region, and in some municipalities cases of increased scrubland, wildfire has been and will continue to be an ever-present threat, particularly in the excessively hot and vegetation-drying summer months.
Applying Wu’s definition of landscape sustainability to this region [20], our results demonstrate that the landscape is less sustainable today than it was under the more agrosilvopastoral type of management common until the ongoing, gradual population decline that began in the 1960s.
Looking to the future of this borderland landscape, Portugal and Spain are coupled with a two-pronged concern: (1) How to manage the landscape and its land cover once its population dedicated to agropastoralism (particularly in the case of Portugal) retires. Spain, already having lost much of its agropastoralism, is a nearby signpost for what lies ahead for Portugal. (2) How to effectively manage its park resources in a sustainable manner to maintain biodiversity and economic development, as well as to avoid ecological and economic loss because of wildfire. As ecosystem services continue to change in the region from one less dependent on agropastoralism to one dominated by cultural tourism and ecotourism, future research such as this one, which assess the impacts of these changing dynamics, will be essential for the long-term sustainable development of the landscape.

Supplementary Materials

The following are available online at https://www.mdpi.com/article/10.3390/su132413962/s1, List S1: List of aerial photography consulted, Table S1: Vegetation indices for greater study area, Figure S1: Normalized Difference Vegetation Index (NDVI) calculated for study area municipalities (1984–2018), Figure S2: Bare Soil Index (BSI) calculated for study area municipalities (1984–2018), Figure S3: Normalized Burn Ratio (NBR) calculated for study area municipalities (1984–2018).

Author Contributions

Conceptualization, K.P.H. and J.Á.-M.; methodology, K.P.H. and J.Á.-M.; software, K.P.H. and J.Á.-M.; formal analysis, K.P.H. and J.Á.-M.; investigation, K.P.H. and J.Á.-M.; writing—original draft preparation, K.P.H. and J.Á.-M.; writing—review and editing, K.P.H. and J.Á.-M.; visualization, K.P.H. and J.Á.-M. All authors have read and agreed to the published version of the manuscript.

Funding

This research was supported by a doctoral research fellowship from the Universidad Pública de Navarra with the Institute for Advanced Social Science Research (I-COMMUNITAS). This research was partly funded by the Spanish Research Agency, Ministry for Science and Innovation through projects PID2019-104297GB-I00 and PID2019-107386RB-I00 / AEI / 10.13039/501100011033, and by the Department of Economic Development of the Government of Navarre through project 0011-1365-2021-000072.

Institutional Review Board Statement

Not applicable.

Informed Consent Statement

Informed consent was obtained from all informants involved in study.

Data Availability Statement

Data available upon request due to privacy concerns.

Acknowledgments

We are grateful for the support from Almudena Orejas of the Spanish National Research Council and Eloísa Ramírez of the Universidad Pública de Navarra. Special thanks also go to Marisol Velasco Fernández of the Servicio Territorial de Medio Ambiente de Zamora in Spain, for the careful preparation of the wildfire shapefiles for the study area. We also wish to express our warmest gratitude to the residents of the Spanish and Portuguese municipalities who participated in this study. All supporters have given their consent to be acknowledged.

Conflicts of Interest

The funders had no role in the design of the study; in the collection, analyses, or interpretation of data; in the writing of the manuscript, or in the decision to publish the results.

References

  1. Brown, D.G.; Johnson, K.M.; Loveland, T.R.; Theobald, D.M. Rural land-use trends in the conterminous United States, 1950–2000. Ecol. Appl. 2005, 15, 1851–1863. [Google Scholar] [CrossRef] [Green Version]
  2. van Vliet, J.; de Groot, H.L.F.; Rietveld, P.; Verburg, P.H. Manifestations and underlying drivers of agricultural land use change in Europe. Landsc. Urban Plan. 2015, 133, 24–36. [Google Scholar] [CrossRef] [Green Version]
  3. Castillo, C.P.; Kavalov, B.; Diogo, V.; Jacobs-Crisioni, C.; e Silva, F.B.; Lavalle, C. Agricultural Land Abandonment in the EU within 2015–2030; JRC Working Papers; Joint Research Centre (Seville Site): Seville, Spain, 2018. [Google Scholar]
  4. Zhang, Y.; Li, X.; Song, W. Determinants of cropland abandonment at the parcel, household and village levels in mountain areas of China: A multi-level analysis. Land Use Policy 2014, 41, 186–192. [Google Scholar] [CrossRef]
  5. Strijker, D. Marginal lands in Europe: Causes of decline. Basic Appl. Ecol. 2005, 6, 99–106. [Google Scholar] [CrossRef]
  6. Abolina, E.; Luzadis, V.A. Abandoned agricultural land and its potential for short rotation woody crops in Latvia. Land Use Policy 2015, 49, 435–445. [Google Scholar] [CrossRef]
  7. Terres, J.-M.; Scacchiafichi, L.N.; Wania, A.; Ambar, M.; Anguiano, E.; Buckwell, A.; Coppola, A.; Gocht, A.; Källström, H.N.; Pointereau, P.; et al. Farmland abandonment in Europe: Identification of drivers and indicators, and development of a composite indicator of risk. Land Use Policy 2015, 49, 20–34. [Google Scholar] [CrossRef]
  8. Nave, L.E.; Walters, B.F.; Hofmeister, K.L.; Perry, C.H.; Mishra, U.; Domke, G.M.; Swanston, C.W. The role of reforestation in carbon sequestration. New For. 2019, 50, 115–137. [Google Scholar] [CrossRef]
  9. Barry, L.E.; Yao, R.T.; Harrison, D.R.; Paragahawewa, U.H.; Pannell, D.J. Enhancing ecosystem services through afforestation: How policy can help. Land Use Policy 2014, 39, 135–145. [Google Scholar] [CrossRef]
  10. MacDonald, D.; Crabtree, J.R.; Wiesinger, G.; Dax, T.; Stamou, N.; Fleury, P.; Gutierrez-Lazpita, J.; Gibon, A. Agricultural abandonment in mountain areas of Europe: Environmental consequences and policy response. J. Environ. Manag. 2000, 59, 47–69. [Google Scholar] [CrossRef]
  11. Covas, R.; Blondel, J. Biogeography and history of the Mediterranean bird fauna. Ibis (Lond 1859) 1998, 140, 395–407. [Google Scholar] [CrossRef]
  12. Suárez-Seoane, S.; Osborne, P.E.; Baudry, J. Responses of birds of different biogeographic origins and habitat requirements to agricultural land abandonment in northern Spain. Biol. Conserv. 2002, 105, 333–344. [Google Scholar] [CrossRef]
  13. Herrando, S.; Anton, M.; Sardà-Palomera, F.; Bota, G.; Gregory, R.D.; Brotons, L. Indicators of the impact of land use changes using large-scale bird surveys: Land abandonment in a Mediterranean region. Ecol. Indic. 2014, 45, 235–244. [Google Scholar] [CrossRef]
  14. Otero, I.; Boada, M.; Badia, A.; Pla, E.; Vayreda, J.; Sabaté, S.; Gracia, C.A.; Peñuelas, J. Loss of water availability and stream biodiversity under land abandonment and climate change in a Mediterranean catchment (Olzinelles, NE Spain). Land Use Policy 2011, 28, 207–218. [Google Scholar] [CrossRef]
  15. Tonini, M.; Parente, J.; Pereira, M.G. Global assessment of rural–urban interface in Portugal related to land cover changes. Nat. Hazards Earth Syst. Sci. 2018, 18, 1647–1664. [Google Scholar] [CrossRef] [Green Version]
  16. Moreira, F.; Viedma, O.; Arianoutsou, M.; Curt, T.; Koutsias, N.; Rigolot, E.; Barbati, A.; Corona, P.; Vaz, P.; Xanthopoulos, G.; et al. Landscape–wildfire interactions in southern Europe: Implications for landscape management. J. Environ. Manag. 2011, 92, 2389–2402. [Google Scholar] [CrossRef] [Green Version]
  17. Oficina Nacional de Prospectiva y Estrategia Promover un Desarrollo Territorial Equilibrado, Justo y Sostenible. Available online: https://www.lamoncloa.gob.es/presidente/actividades/Documents/2021/200521-Estrategia_Espana_2050_6.pdf (accessed on 9 November 2021).
  18. Reid, W.V.; Mooney, H.A.; Cropper, A.; Capistrano, D.; Carpenter, S.R.; Chopra, K. Millennium Ecosystem Assesment. Ecosystems and Human Well-Being: Synthesis, 1st ed.; Island Press: Washington, DC, USA, 2005. [Google Scholar]
  19. Carvalho-Santos, C.; Monteiro, A.T.; Arenas-Castro, S.; Greifeneder, F.; Marcos, B.; Portela, A.P.; Honrado, J.P. Ecosystem services in a protected mountain range of Portugal: Satellite-based products for state and trend analysis. Remote Sens. 2018, 10, 1573. [Google Scholar] [CrossRef] [Green Version]
  20. Wu, J. Landscape sustainability science: Ecosystem services and human well-being in changing landscapes. Landsc. Ecol. 2013, 28, 999–1023. [Google Scholar] [CrossRef]
  21. Trillo-Santamaría, J.-M.; Carril, V.P. La Reserva de la Biosfera Meseta Ibérica como espacio natural protegido transfronterizo: ¿herramienta de conservación o marca promocional? Doc. D’anàlisi Geogràfica 2018, 64, 493–508. [Google Scholar] [CrossRef] [Green Version]
  22. Kovács, E.; Kelemen, E.; Kalóczkai, Á.; Margóczi, K.; Pataki, G.; Gébert, J.; Málovics, G.; Balázs, B.; Roboz, Á.; Krasznai Kovács, E.; et al. Understanding the links between ecosystem service trade-offs and conflicts in protected areas. Ecosyst. Serv. 2015, 12, 117–127. [Google Scholar] [CrossRef] [Green Version]
  23. Hidle, K. How national parks change a rural municipality’s development strategies–The Skjåk case, Norway. J. Rural. Stud. 2019, 72, 174–185. [Google Scholar] [CrossRef]
  24. van der Zanden, E.H.; Verburg, P.H.; Schulp, C.J.E.; Verkerk, P.J. Trade-offs of European agricultural abandonment. Land Use Policy 2017, 62, 290–301. [Google Scholar] [CrossRef]
  25. Picuno, P.; Cillis, G.; Statuto, D. Investigating the time evolution of a rural landscape: How historical maps may provide environmental information when processed using a GIS. Ecol. Eng. 2019, 139, 105580. [Google Scholar] [CrossRef]
  26. Liu, D.; Toman, E.; Fuller, Z.; Chen, G.; Londo, A.; Zhang, X.; Zhao, K. Integration of historical map and aerial imagery to characterize long-term land use change and landscape dynamics: An object-based analysis via Random Forests. Ecol. Indic. 2018, 95, 595–605. [Google Scholar] [CrossRef]
  27. Weissteiner, C.J.; Boschetti, M.; Böttcher, K.; Carrara, P.; Bordogna, G.; Brivio, P.A. Spatial explicit assessment of rural land abandonment in the Mediterranean area. Glob. Planet. Chang. 2011, 79, 20–36. [Google Scholar] [CrossRef]
  28. Müller, D.; Leitão, P.J.; Sikor, T. Comparing the determinants of cropland abandonment in Albania and Romania using boosted regression trees. Agric. Syst. 2013, 117, 66–77. [Google Scholar] [CrossRef]
  29. Estel, S.; Kuemmerle, T.; Alcántara, C.; Levers, C.; Prishchepov, A.; Hostert, P. Mapping farmland abandonment and recultivation across Europe using MODIS NDVI time series. Remote Sens. Environ. 2015, 163, 312–325. [Google Scholar] [CrossRef]
  30. Yoon, H.; Kim, S. Detecting abandoned farmland using harmonic analysis and machine learning. ISPRS J. Photogramm. Remote Sens. 2020, 166, 201–212. [Google Scholar] [CrossRef]
  31. Melendez-Pastor, I.; Hernández, E.I.; Navarro-Pedreño, J.; Gómez, I. Socioeconomic factors influencing land cover changes in rural areas: The case of the Sierra de Albarracín (Spain). Appl. Geogr. 2014, 52, 34–45. [Google Scholar] [CrossRef]
  32. Romero Perona, D. Territorio y formaciones sociales en la zona Astur-Lusitana del Duero. Ph.D. Thesis, Universitat de Valencia, Valencia, Spain, 2015. [Google Scholar]
  33. Sánchez-Palencia, J.; Beltrán, A. Minería y Civitates del Noreste de Portugal (MinCiNEP IV) Memoria de la Campaña 2014–15. Madrid, Spain, Unpublished work; 2015. [Google Scholar]
  34. Sánchez-Palencia, F.J.; Romero, D.; Beltrán, A. Enclosures and settlement strategies in the Arribes del Duero (Zamora-Bragança). In Archaeology in the River Duero Valley; Cambridge Scholars Publishing: Cambridge, UK, 2018; pp. 147–173. [Google Scholar]
  35. Hearn, K.P. Mapping the past: Using ethnography and local spatial knowledge to characterize the Duero River borderlands landscape. J. Rural Stud. 2021, 82, 37–53. [Google Scholar] [CrossRef]
  36. Marino, J.; Bergua, S.; Piedrabuena, M. The vegetal heritage in the Zamoran Arribes del Duero: The formations of the juniper forests of Juniperus oxycedrus L. subsp. badia (H. Gay) Debeaux. Cuad. Geogr. 2017, 56, 90–115. [Google Scholar]
  37. Sánchez-Vicente, D. Arribes del Duero: Una vision interdisciplinar. In El Hombre y el Medio Ambiente; Ramos-Castellanos, P., Ed.; Ediciones Universidad de Salamanca: Salamanca, Spain, 2010; pp. 214–244. [Google Scholar]
  38. Prada-Llorente, E.I. Sayago: Evolución Histórica y Proyección Futura de su Estructura Eerritorial. Ph.D. Thesis, Escuela Técnica Superior de Arquitectura de Madrid, Madrid, Spain, 2001. Available online: https://oa.upm.es/586/ (accessed on 16 November 2021).
  39. Prada-Llorente, E. Estudio Comparado Tierra de Sayago (Zamora)-Concelho de Miranda (Distrito de Braganza); Madrid, Spain, 2011; Available online: https://www.mapa.gob.es/es/ministerio/servicios/informacion/sayago_miranda_tcm30-103103.pdf (accessed on 16 November 2021).
  40. Riesco-Chueca, P. Antecedentes y primeros pasos del cultivo en hojas en Zamora y provincias vecinas. Stud. Zamorensia 2015, 14, 109–132. [Google Scholar] [CrossRef]
  41. Marques, J.C. A emigração portuguesa em tempos de inmigração. Polígonos. Rev. Geogr. 2011, 20, 115–129. [Google Scholar] [CrossRef]
  42. Blanco Rodríguez, J.A. La emigraciĀn castellana y leonesa en el marco de las migraciones españolas. In Actas del congreso, Proceedings of the Un proceso que continúa: Migración castellana y leonesa; Blanco Rodríguez, J.A., Ed.; UNED Zamora: Zamora, Spain, 2011; pp. 9–16. Available online: https://dialnet.unirioja.es/servlet/libro?codigo=512487 (accessed on 16 November 2021).
  43. Vilar Ramírez, J.B. Las emigraciones españolas a Europa en el siglo XX: Algunas cuestiones a debatir. Migr. Exil. Cuad. AEMIC 2000, 1, 131–159. [Google Scholar]
  44. Ministerio de Agricultura Alimentación y Medio Ambiente Resolución de 16 de julio de 2015, de parques nacionales, por la que se publica la aprobación por la UNESCO de dos reservas de la biosfera españolas: Reserva de la Biosfera del Macizo de Anaga, Tenerife, y Reserva de la Biosfera Transfronteriza Meseta. Available online: https://www.boe.es/boe/dias/2015/08/27/pdfs/BOE-A-2015-9446.pdf (accessed on 2 November 2021).
  45. Sánchez-Palencia, F.J.; Currás, B. El contexto geoarqueologico: La zona minera de Pino del Oro. In El Bronce de Picon (Pino del Oro). Procesos de Cambio en el Occidente de Hispania; Sastre, I., Beltrán, A., Eds.; Junta de Castilla y Leon: Valladolid, Spain, 2010; pp. 15–38. [Google Scholar]
  46. Vázquez-Calvo, M.C.; Fort González, R.; Romero, D.; Beltrán, A.; Sánchez-Palencia, F.J. Roman bedrock mortars: New findings for interpreting data at the Roman Pino del Oro gold mines (Spain). Mediterr. Archaeol. Archaeom. 2016, 16, 139–148. [Google Scholar] [CrossRef]
  47. Sánchez-Palencia, F.J. La mineria Romana de Pino del Oro y de su entorno inmediato (Zamora). In Minería Romana en Zonas Interfronterizas de Castilla y Leon y Portugal; Sánchez-Palencia, F.J., Ed.; Consejería de Cultura y Turismo: Valladolid, Spain, 2012; pp. 181–214. [Google Scholar]
  48. Romero, D. El contexto arqueológico: El yacimiento de El Picón. In El bronce de El Picón (Pino del Oro). procesos de cambio en el occidente de Hispania; Sastre, I., Beltrán, A., Eds.; Junta de Castilla y Leon: Valladolid, Spain, 2010; pp. 39–50. [Google Scholar]
  49. Marino Alfonso, J.L.; Poblete Piedrabuena, M.Á.; Beato Bergua, S. The landscapes of natural interest in Arribes del Duero (Zamora, Spain). Investig. Geogr. 2020, 2020, 95–119. [Google Scholar] [CrossRef] [Green Version]
  50. Howard, S.M.; Lacasse, J.M. An evaluation of gap-filled Landsat SLC-off imagery for wildland fire burn severity mapping. Photogramm. Eng. Remote Sens. 2004, 70, 877–880. [Google Scholar]
  51. Castillo, A.; Dominguez, M.; Yanez, A. Citizen perception about world heritage and archaeology in three Spanish cities: First methodological case studies. Complutum 2016, 27, 295–314. [Google Scholar] [CrossRef] [Green Version]
  52. Santoro, A.; Venturi, M.; Agnoletti, M. Landscape perception and public participation for the conservation and valorization of cultural landscapes: The case of the Cinque Terre and Porto Venere UNESCO site. Land 2021, 10, 93. [Google Scholar] [CrossRef]
  53. Yu, Y.; Parsons, A.J.; Wainwright, J.; Prell, C.; Hubacek, K. Perceptions of desert landscape: A case study in southern New Mexico. Area 2013, 45, 459–468. [Google Scholar] [CrossRef]
  54. Riechers, M.; Balázsi, Á.; Abson, D.J.; Fischer, J. The influence of landscape change on multiple dimensions of human-nature connectedness. Ecol. Soc. 2020, 25, 3. [Google Scholar] [CrossRef]
  55. Bernard, H.R. Research Methods in Anthropology: Qualitative and Quantitative Approaches, 4th ed.; Altamira Press: Lanham, MD, USA, 2006. [Google Scholar]
  56. Berthelsen, C.B.; Lindhardt, T.; Frederiksen, K. A discussion of differences in preparation, performance and postreflections in participant observations within two grounded theory approaches. Scand. J. Caring Sci. 2017, 31, 413–420. [Google Scholar] [CrossRef] [PubMed]
  57. Chun-Tie, Y.; Birks, M.; Francis, K. Grounded theory research: A design framework for novice researchers. SAGE Open Med. 2019, 7, 2050312118822927. [Google Scholar] [CrossRef] [PubMed] [Green Version]
  58. Hansen, M.C.; Loveland, T.R. A review of large area monitoring of land cover change using Landsat data. Remote Sens. Environ. 2012, 122, 66–74. [Google Scholar] [CrossRef]
  59. Thonfeld, F.; Steinbach, S.; Muro, J.; Kirimi, F. Long-term land use/land cover change assessment of the Kilombero catchment in Tanzania using random forest classification and robust change vector analysis. Remote Sens. 2020, 12, 1057. [Google Scholar] [CrossRef] [Green Version]
  60. Midekisa, A.; Holl, F.; Savory, D.J.; Andrade-Pacheco, R.; Gething, P.W.; Bennett, A.; Sturrock, H.J. Mapping land cover change over continental Africa using Landsat and Google Earth Engine cloud computing. PLoS ONE 2017, 12, e0184926. [Google Scholar] [CrossRef]
  61. Li, W.; MacBean, N.; Ciais, P.; Defourny, P.; Lamarche, C.; Bontemps, S.; Houghton, R.A.; Peng, S. Gross and net land cover changes in the main plant functional types derived from the annual ESA CCI land cover maps (1992–2015). Earth Syst. Sci. Data 2018, 10, 219–234. [Google Scholar] [CrossRef] [Green Version]
  62. Buchner, J.; Yin, H.; Frantz, D.; Kuemmerle, T.; Askerov, E.; Bakuradze, T.; Bleyhl, B.; Elizbarashvili, N.; Komarova, A.; Lewińska, K.E.; et al. Land cover change in the Caucasus Mountains since 1987 based on the topographic correction of multi-temporal Landsat composites. Remote Sens. Environ. 2020, 248, 111967. [Google Scholar] [CrossRef]
  63. Stehman, S.V.; Foody, G.M. Key issues in rigorous accuracy assessment of land cover products. Remote Sens. Environ. 2019, 231, 111199. [Google Scholar] [CrossRef]
  64. Tarko, A.; Tsendbazar, N.-E.; de Bruin, S.; Bregt, A.K. Producing consistent visually interpreted land cover reference data: Learning from feedback. Int. J. Digit. Earth 2021, 14, 52–70. [Google Scholar] [CrossRef]
  65. McRoberts, R.E.; Stehman, S.V.; Liknes, G.C.; Næsset, E.; Sannier, C.; Walters, B.F. The effects of imperfect reference data on remote sensing-assisted estimators of land cover class proportions. ISPRS J. Photogramm. Remote Sens. 2018, 142, 292–300. [Google Scholar] [CrossRef]
  66. Instituto Geográfico Nacional Instituto Geográfico Nacional. Available online: http://centrodedescargas.cnig.es/CentroDescargas/index.jsp (accessed on 15 August 2021).
  67. Markham, B.L.; Helder, D.L. Forty-year calibrated record of earth-reflected radiance from Landsat: A review. Remote Sens. Environ. 2012, 122, 30–40. [Google Scholar] [CrossRef] [Green Version]
  68. Vogelmann, J.E.; Helder, D.; Morfitt, R.; Choate, M.J.; Merchant, J.W.; Bulley, H. Effects of Landsat 5 Thematic Mapper and Landsat 7 Enhanced Thematic Mapper plus radiometric and geometric calibrations and corrections on landscape characterization. Remote Sens. Environ. 2001, 78, 55–70. [Google Scholar] [CrossRef] [Green Version]
  69. Schultz, M.; Clevers, J.G.P.W.; Carter, S.; Verbesselt, J.; Avitabile, V.; Quang, H.V.; Herold, M. Performance of vegetation indices from Landsat time series in deforestation monitoring. Int. J. Appl. Earth Obs. Geoinf. 2016, 52, 318–327. [Google Scholar] [CrossRef]
  70. Key, C.H.; Benson, N.; Ohlen, D.; Howard, S.; McKinley, R.; Zhu, Z. The normalized burn ratio and relationships to burn severity: Ecology, remote sensing and implementation. In Proceedings of the 9th Forest Service Remote Sensing Applications Conference. American Society for Photogrammetry and Remote Sensing; Greer; Greer, J., Ed.; San Diego, CA, USA, 2002. Available online: https://www.indexdatabase.de/db/r-single.php?id=62 (accessed on 16 November 2021).
  71. Roy, P.S.; Sharma, K.P.; Jain, A. Stratification of density in dry deciduous forest using satellite remote sensing digital data—An approach based on spectral indices. J. Biosci. 1996, 21, 723–734. [Google Scholar] [CrossRef]
  72. Huang, S.; Tang, L.; Hupy, J.P.; Wang, Y.; Shao, G. A commentary review on the use of normalized difference vegetation index (NDVI) in the era of popular remote sensing. J. For. Res. 2021, 32, 1–6. [Google Scholar] [CrossRef]
  73. Hislop, S.; Jones, S.; Soto-Berelov, M.; Skidmore, A.; Haywood, A.; Nguyen, T.H. A fusion approach to forest disturbance mapping using time series ensemble techniques. Remote Sens. Environ. 2019, 221, 188–197. [Google Scholar] [CrossRef]
  74. Breiman, L. Random Forests. Mach. Learn. 2001, 45, 5–32. [Google Scholar] [CrossRef] [Green Version]
  75. Gislason, P.O.; Benediktsson, J.A.; Sveinsson, J.R. Random Forests for land cover classification. Pattern Recognit. Lett. 2006, 27, 294–300. [Google Scholar] [CrossRef]
  76. Rodriguez-Galiano, V.F.; Chica-Olmo, M.; Abarca-Hernandez, F.; Atkinson, P.M.; Jeganathan, C. Random Forest classification of Mediterranean land cover using multi-seasonal imagery and multi-seasonal texture. Remote Sens. Environ. 2012, 121, 93–107. [Google Scholar] [CrossRef]
  77. Wessels, K.J.; van den Bergh, F.; Roy, D.P.; Salmon, B.P.; Steenkamp, K.C.; MacAlister, B.; Swanepoel, D.; Jewitt, D. Rapid Land Cover Map Updates Using Change Detection and Robust Random Forest Classifiers. Remote Sens. 2016, 8, 888. [Google Scholar] [CrossRef] [Green Version]
  78. Belgiu, M.; Drăguţ, L. Random forest in remote sensing: A review of applications and future directions. ISPRS J. Photogramm. Remote Sens. 2016, 114, 24–31. [Google Scholar] [CrossRef]
  79. Souverijns, N.; Buchhorn, M.; Horion, S.; Fensholt, R.; Verbeeck, H.; Verbesselt, J.; Herold, M.; Tsendbazar, N.-E.; Bernardino, P.N.; Somers, B.; et al. Thirty years of land cover and fraction cover changes over the Sudano-Sahel using Landsat time series. Remote Sens. 2020, 12, 3817. [Google Scholar] [CrossRef]
  80. Millard, K.; Richardson, M. On the importance of training data sample selection in random forest image classification: A case study in peatland ecosystem mapping. Remote Sens. 2015, 7, 8489–8515. [Google Scholar] [CrossRef] [Green Version]
  81. Instituto Nacional de Estatística Censos 2021. Available online: https://www.ine.pt/xportal/xmain?xpgid=ine_main&xpid=INE (accessed on 9 November 2021).
  82. Abercrombie, S.P.; Friedl, M.A. Improving the consistency of multitemporal land cover maps using a hidden Markov model. IEEE Trans. Geosci. Remote Sens. 2016, 54, 703–713. [Google Scholar] [CrossRef]
  83. Kern, A.; Marjanović, H.; Dobor, L.; Anić, M.; Hlásny, T.; Barcza, Z. Identification of years with extreme vegetation state in central Europe based on remote sensing and meteorological data. Southeast Eur. For. 2017, 8, 1–20. [Google Scholar] [CrossRef] [Green Version]
  84. Câmara Municipal Miranda do Douro. Diagnóstico Social do Concelho de Miranda do Douro. Miranda do Douro. 2014. Available online: https://www.cm-mdouro.pt/cmmirandadouro/uploads/writer_file/document/62/Diagn_stico-Social-2014-FINAL.pdf (accessed on 16 November 2021).
  85. Paniagua, A. Local people unprotected by protected (depopulated) natural areas: The case of Sierra Norte Guadalajara, Spain. GeoJournal 2018, 83, 993–1004. [Google Scholar] [CrossRef]
  86. Rodríguez-Rodríguez, D.; Martínez-Vega, J.; Echavarría, P. A twenty year GIS-based assessment of environmental sustainability of land use changes in and around protected areas of a fast developing country: Spain. Int. J. Appl. Earth Obs. Geoinf. 2019, 74, 169–179. [Google Scholar] [CrossRef]
  87. Município de Miranda do Douro. Revisão do Plano Diretor Municipal de Miranda do Douro: Anexo A–áreas Florestais Percorridas por Incêndio; Miranda do Douro, Portugal, 2015. Available online: https://ssaigt.dgterritorio.pt/i/Planta_de_condicionantes_30901_29.jpg (accessed on 16 November 2021).
  88. Miteco Estadísticas de Incendios Forestales. Available online: https://www.miteco.gob.es/es/biodiversidad/estadisticas/Incendios_default.aspx (accessed on 2 November 2021).
  89. Hernando, F.M.; Cascos, C.; de Celis, A.J.G.; Baraja-Rodríguez, E. Dinámica de los incendios forestales en Castilla y León. Bol. La Asoc. Geógrafos Españoles 2008, 48, 39–70. [Google Scholar]
  90. Romero-Calcerrada, R.; Perry, G.L.W. Landscape change pattern (1984–1999) and implications for fire incidence in the SPA Encinares del río Alberche y Cofio (Central Spain). In Forest Fire Research and Wildland Fire Safety; Viegas, D., Ed.; Milpress Science Publishers: Rotterdam, The Netherlands, 2002; pp. 1–11. [Google Scholar]
  91. Romero-Calcerrada, R.; Perry, G.L. The role of land abandonment in landscape dynamics in the SPA ‘Encinares del río Alberche y Cofio, Central Spain, 1984–1999. Landsc. Urban Plan. 2004, 66, 217–232. [Google Scholar] [CrossRef]
  92. García-Ruiz, J.M.; Lasanta, T.; Nadal-Romero, E.; Lana-Renault, N.; Álvarez-Farizo, B. Rewilding and restoring cultural landscapes in Mediterranean mountains: Opportunities and challenges. Land Use Policy 2020, 99, 104850. [Google Scholar] [CrossRef]
  93. Nobre, S. Apoio à florestação de terras agrícolas: O caso do Planalto Mirandês e da Terra Fria. VIII Colóquio Ibérico Estud. Rurais. 2010, pp. 1–17. Available online: https://bibliotecadigital.ipb.pt/handle/10198/7319 (accessed on 16 November 2021).
  94. Gallego-Martínez, D.; Jiménez-Blanco, J.I.; Sebastián-Amarilla, J.A.; Zambrana-Pineda, J.F.; Zapata-Blanco, S. Polítca forestal y producción de los montes públicos españoles: Una visión de conjunto, 1861–1933. Rev. Hist. Econ.-J. Iber. Lat. Am. Econ. Hist. 2002, 20, 509–541. [Google Scholar]
  95. Stellmes, M.; Röder, A.; Udelhoven, T.; Hill, J. Mapping syndromes of land change in Spain with remote sensing time series, demographic and climatic data. Land Use Policy 2013, 30, 685–702. [Google Scholar] [CrossRef]
  96. Delgado, J.; Llorens, P.; Nord, G.; Calder, I.R.; Gallart, F. Modelling the hydrological response of a Mediterranean medium-sized headwater basin subject to land cover change: The Cardener River basin (NE Spain). J. Hydrol. 2010, 383, 125–134. [Google Scholar] [CrossRef]
Figure 1. The internationally protected Duero River borderland region of the study area.
Sustainability 13 13962 g001
Figure 2. Planimetry map of Pino (del Oro) municipality detailing land cover types from 1907. Permission: Obra derivada de PACON 1870-1977 CC-BY 4.0 ign.es [65].
Sustainability 13 13962 g002
Figure 3. Photographs depicting the main land cover classes in the study site: (a) agropastoral land (agricultural plot), (b) agropastoral land (pasture), (c) chaparral forest, and (d) scrubland. No photograph is provided for water.
Sustainability 13 13962 g003
Figure 4. Study area (in red) with diachronically consistent training samples over Landsat 8 real color composite image 2013. Polygon colors are as follows, yellow: agropastoral lands, olive: scrublands, green: chaparral forests, and blue: water.
Sustainability 13 13962 g004
Figure 5. Land cover maps of the study area from 2018 to 1984.
Sustainability 13 13962 g005
Figure 6. Percentage of land cover change in Portuguese municipalities: (a) Constantim-Cicouro, (b) Ifanes-Paradela, (c) Miranda do Douro, and (d) Vila Chã de Braciosa.
Sustainability 13 13962 g006aSustainability 13 13962 g006b
Figure 7. Temporal land cover change maps of Spanish Municipalities (1984–2018).
Sustainability 13 13962 g007
Figure 8. Percentage of land cover change in Spanish municipalities: (a) Pino del Oro, (b) Villardiegua de la Ribera, (c) Argañín, and (d) Fariza.
Sustainability 13 13962 g008aSustainability 13 13962 g008b
Figure 9. Temporal land cover change maps of Spanish Municipalities (1984–2018).
Sustainability 13 13962 g009
Figure 10. Population trends in study area by year: (a) Spanish and (b) Portuguese municipalities.
Sustainability 13 13962 g010
Figure 11. Portuguese municipalities (green) and Spanish (yellow) wildfire burn areas.
Sustainability 13 13962 g011
Figure 12. Public watershed management areas (MUPs) in the Spanish part of the study area.
Sustainability 13 13962 g012
Table 1. Landsat scenes used in the study.
SensorDateScene Cloud Cover (%)
Landsat 8 OLI14 August 20180
31 July 20130
Landsat 5 TM2 August 20080
5 August 20035
23 August 19981
9 August 19930
27 August 19885
1 September 19849
Table 2. Summary of the stable temporally consistent sample polygons delineated for each class.
ClassNo. of PolygonsTotal Area (ha)No. of Pixels
1Agropastoral lands112142385
2Scrubland291932145
3Chaparral forests202322578
4Water441982198
Table 3. Cross-correlation matrix. Values in the matrix indicate the mean Pearson correlation coefficient (R) between the spectral bands of each scene pair. The last column gives the mean R, used to select the 1998 scene that maximizes it. Colors illustrate different correlation values.
19841988199319982003200820132018Mean
1984 0.9700.9450.9650.9590.9170.9480.9560.951
19880.970 0.9430.9710.9570.9400.9590.9650.958
19930.9450.943 0.9370.9700.8790.9320.9210.932
19980.9650.9710.937 0.9690.9400.9660.9800.961
20030.9590.9570.9700.969 0.9240.9720.9600.959
20080.9170.9400.8790.9400.924 0.9310.9460.925
20130.9480.9590.9320.9660.9720.931 0.9710.954
20180.9560.9650.9210.9800.9600.9460.971 0.957
Table 4. Most common perceptions from all stakeholders on the Duero Borderland Region.
Perceptions of Conservation, Management, and Protection of Cultural ResourcesPerceptions of Conservation, Management, and Protection of Natural Resources
Concern about the disappearance of the villages due to migration and mortality of older residentsConcern with the landscape’s increased propensity for wildfires
Desire to develop more sustainable and profitable cultural and ecological tourismRemaining residents are restricted in managing their lands by the park/biosphere laws and are fined for infractions
More concern with the loss of community solidarity, the natural landscape, and its diachronic change rather than archaeological heritageRemaining residents are restricted in managing their lands by the park/biosphere laws and are fined for infractions
Table 5. Land cover classification accuracy analysis results.
YearOAAgropastoralForestScrublandWater
RecallPrecisionRecallPrecisionRecallPrecisionRecallPrecision
198493.398.395.395.192.193.686.699.699.3
198894.198.395.395.891.394.590.399.699.4
199393.998.796.195.290.594.289.399.799.6
199895.598.896.996.793.795.791.699.899.8
200394.699.298.495.490.394.890.199.799.4
200896.498.997.797.594.396.794.099.799.5
201396.698.997.695.891.094.790.4100.0100.0
201896.299.598.796.792.896.493.599.999.8
Mean95.198.897.096.092.095.190.799.799.6
Table 6. Land cover changes from 1984 to 2018, compared to starting year.
YearAgropastoral (ha)(%)Change (%)Forest (ha)(%)Change (%)Scrubland (ha)(%)Change (%)Water (ha)(%)Change (%)
198422,22139.2 55669.8 28,45550.1 5230.9
198822,37439.40.3802014.14.325,88245.6−4.54890.9−0.1
199321,81538.4−0.7875815.45.625,73745.3−4.84540.8−0.1
199817,33030.5−8.6866015.35.530,27253.33.25020.90.0
200318,76533.1−6.1871115.45.528,76850.70.55200.90.0
200820,20335.6−3.6956018.48.626,40546.5−3.65971.10.1
201321,36537.6−1.5820914.54.726,80347.2−2.93870.7−0.2
201819,93635.1−4.012,26321.611.824,10742.5−7.74590.8−0.1
Table 7. Pearson coefficient (r) calculated for land cover classes and population trends in municipalities in study area.
Constantim-CicouroIfanes-ParadelaMiranda do DouroVila Chã de BraciosaPino del OroVillardiegua de la RiberaArgañínFariza
Agropastoral-population0.35−0.200.410.040.670.500.800.02
Scrubland-population0.470.51−0.360.00−0.500.15−0.780.16
Forest-population−0.74−0.560.07−0.03−0.58−0.59−0.32−0.36
Table 8. Drivers of landscape vegetation change since the 1960s.
DriverTypeTime PeriodCountryEffect
Emigration and migrationSocial1960s–presentBothGradual abandonment of agrosilvopastoral land and activities
Park and biosphere creationPolicyPortugal: 1998
Spain: 2003
Biosphere: 2015
BothProtected zones enforce preservation policies that control and limit past landscape agrosilvopastoral use for remaining residents
Wildfire events (larger and more frequent)Natural or human provoked2000s to presentBothLoss of hundreds of hectares of forest and scrubland. Inter-year vegetation recovery
Afforestation programsPolicy1990s to presentPortugalIncrease in hectares of forest cover class
Public watershed management lands (MUPs)PolicyLate 19th C–presentSpainLed to an increase in both scrubland and forest growth in areas not burned in wildfires
Publisher’s Note: MDPI stays neutral with regard to jurisdictional claims in published maps and institutional affiliations.

