Article

Digital Echelons and Interfaces within Value Chains: End-to-End Marketing and Logistics Integration

by
Sergey Evgenievich Barykin
1,*,
Elena Aleksandrovna Smirnova
2,
Dan Chzhao
2,
Irina Vasilievna Kapustina
1,
Sergey Mikhailovich Sergeev
3,*,
Yuri Yurievich Mikhalchevsky
4,
Alexander Viktorovich Gubenko
4,
Gennady Aleksanrovich Kostin
4,
Elena De La Poza Plaza
5,
Lilya Saychenko
6 and
Nikita Moiseev
7
1
Graduate School of Service and Trade, Peter the Great St. Petersburg Polytechnic University, 195251 St. Petersburg, Russia
2
Department of Logistics and Supply Chain Management, St. Petersburg State University of Economics, 191023 St. Petersburg, Russia
3
Graduate School of Industrial Management, Peter the Great St. Petersburg Polytechnic University, 195251 St. Petersburg, Russia
4
Top Management Department, Saint Petersburg State University of Civil Aviation, 196210 St. Petersburg, Russia
5
Center for Economic Engineering (INECO), Universitat Politècnica de València, 46022 Valencia, Spain
6
Department of Development and Exploration of Oil and Gas Wells, St. Petersburg Mining University, 199106 St. Petersburg, Russia
7
Department of Mathematical Methods in Economics, Plekhanov Russian University of Economics, 117997 Moscow, Russia
*
Authors to whom correspondence should be addressed.
Sustainability 2021, 13(24), 13929; https://doi.org/10.3390/su132413929
Submission received: 15 October 2021 / Revised: 10 December 2021 / Accepted: 13 December 2021 / Published: 16 December 2021

Abstract

:
The goals of real business in the context of the digital transformation of international logistics networks and marketing channels have necessitated the application of a scientifically based theoretical approach to the development of a formalized description acceptable for predictive planning based on leading indicators. In the context of globalization and interstate and regional economic unions, this will lead to achieving the maximum end-to-end integration of digital platforms. Based on the analysis, the article presents the integration of digital logistics and marketing approaches with the mathematical models of the ecosystem organization of economic relations. The features of the organization of economic relations between contractors involved in the execution of virtual transactions and the material movement of resources were analyzed. The researchers considered prerequisites for the analytical description of interconnections between the participants of digital platforms in cross border e-commerce. The authors’ approach is based on the idea of both a sales funnel in marketing and a conversion funnel in digital transformation. Considering the integration of logistics and marketing, authors offer the definition of business echelons as stages of the consumer value creation. The theoretical contribution of this article consists in constructing a mathematical description of business echelons along the entire value chain. The developed analytical description of business echelons is acceptable both for embedding a digital management support system into various software products, and for conducting in-depth analysis and finding optimal solutions.

1. Introduction

The idea of forming a consumer value chain was proposed by M. Porter in his book [1]. The concept of the Porter’s value chain is based on the process view of organizations, the idea of seeing a manufacturing (or service) organization as a system made up of subsystems, each with inputs, transformation processes and outputs (https://www.ifm.eng.cam.ac.uk/research/dstools/value-chain-/, accessed on 1 December 2021). M. Porter’s earlier ideas about competitiveness could be found interesting for the researcher [2], as well as his recent publication [3].
According to principal M. Porter’s idea, the researcher could select five primary activities: “Inbound Logistics”, “Operations”, “Outbound Logistics”, “Marketing and Sales” (informing buyers with facilitating their purchase) as well as “Service”. The authors developing M. Porter’s approach rely on the concept being applied to the conversion of the sales funnel and digital logistics [4,5,6,7]. The researchers consider that a full promotion cycle of any product includes various stages of the consumer value chain. Each of these stages is a complete business echelon, which can be assessed both by material quantitative indicators, and by indicators of economic efficiency of the technologies used and the conditions under which this activity is conducted. The consumer value is seriously influenced by the components that depend on the management organization of each of these echelons. The authors suppose that the consumer value creation could be the result of a chain of conversion of raw materials into a product ready for sale.
The research problem could be described as organizing business interactions within the consumer value chain on the basis of the digital transformation of both logistics networks and marketing channels, as well as international economic relations. The purpose of the research is developing a theoretical construction of the process of interaction between the business echelons within value chains.
Authors suggest the approach to the effective organization of interaction, globally and within the entire value chain, should be on the basis of dynamically modeling the process of creation of the consumer value in the form of promotion through the business echelons. Authors could prove that the considered interaction is necessary for sustainable promotion, under the conditions of a competitive environment and market uncertainty. The basic mathematical relations are provided for the analytical description of business echelons.
The scientific novelty of the suggested concept lies in a developed end-to-end integration model of digital logistics and marketing channels, allowing a holistic view of the consumer value creation process, instead of a scattered data set on individual business processes. In this regard, the authors propose to introduce the term “interaction interface”. The interface parameters in this paradigm make it possible to assess the quality of the process of promoting goods and services using economically significant indicators that depend both on time and on the scale of processes in the business echelon under consideration. The implementation of mathematical relations will allow one to analyze the processes in the interaction of participants in business echelons. Such a presentation, first of all, provides a field for application of mathematical optimization methods. Second, it provides an algorithmic basis for creating not only management decision support systems, but also a complete transition to the implementation of artificial intelligence systems in critical areas of decision making in business. Third, it allows the reconstruction of intermediate industry solutions, according to the data obtained in the process of solving optimization problems in the sequence of the most profitable construction of the entire chain of promoting objects of labor through business echelons.
The practical significance of the developed approach consists of combination of methods for analyzing the flow of business data outgoing from Internet platforms and from the means of economic and mathematical modeling, making it possible to fundamentally influence the management work of all business echelons. In addition, an extremely important argument for predictive planning is taken into account—the time spent on passing the stages. Participants in each subsequent business echelon rely on the indicators obtained at the previous stage of interaction in the consumer value chain.

2. Materials and Methods

2.1. Models of Ecosystem

The researchers consider the definition of the business echelons as various stages of the consumer value chain regarding the full promotion cycle of any product. Explaining the term “echelon” as a rule refers to the context of the supply chain and logistics of theoretical approaches, e.g., modeling and optimization of multi-echelon supply chain design [8], and quantitative indicators for social sustainability assessment of upstream (a set of connected firms that involve raw material extraction and transformation), midstream (production and assembly), and downstream (sales and services) echelons of supply chains [9]. The work [10] studies Logistics layout of a three-echelon hybrid Closed-Loop Supply Chain model which consists of a single manufacturer, a 3PL, and multiple retailers. A two-echelon supply chain model (with single buyer and vendor) is formulated in the paper [11], when lead time demand is stochastic in nature and with the correlated demands and returns in the work [12]. A multi-echelon supply chain model for solid waste management systems is developed in the paper [13]. An effective multi-echelon supply chain under stochastic and fuzzy environments is explored in the article [14]. Authors agree with the critical point of view that the disadvantage of traditional supply chain management is that each echelon in the supply chain replenishes its own inventory by considering local inventory position but not the end customer [15]. In accordance with the fractal-based echelon [15], for vendor managed inventory, firstly, the manufacturer (vendor) manages the distributor’s (buyer’s) inventories, secondly, the distributor (vendor) manages the retailer’s (buyer’s) inventories. Authors find such an approach interesting, and propose to consider the sequence of interactions, taking into account the features of supply chains transforming to the digital supply networks, incorporating ecosystem partners [16].
In the context of the digital transformation of the economy, logistics is becoming one of the most effective tools to search for new organizational and managerial solutions [17]. Since both logistics and supply chain management in the modern literature are considered “as one of the priority areas of the ongoing transformation of the economy associated with introduction of digital technologies in economic processes” [18,19], solving the problem of improving economic relations in cross-border e-commerce is transformed into the task of ecosystem organization of economic relations.
Studying the ecosystem organization in cross-border e-commerce considers the investigation of the nature of relations between counterparties in a common digital space. Operating technological platforms allows aggregating all types of resources (information, financial, human, natural, etc.) around itself for production and distribution of goods and services based on the customer-focused approach. The examples of successful digital platforms are Alibaba International Station, AliExpress, Amazon, Dunhuang, etc.
A model of ecosystem organization of economic relations in cross-border e-commerce based on a trade-only digital platform
The authors consider two main approaches to the development of e-commerce based on the creation of a digital platform.
The first option is a trade-only digital platform model. This model describes just a digital trading platform without any possibility of providing other services, such as logistics services. The examples of the trade-only platform model are Taobao and Pinduoduo.
The model of ecosystem organization of economic relations in cross-border e-commerce based on a trade-only digital platform considers the division of all participants in cross-border e-commerce into two main groups:
1. The focus group is the core of the e-commerce logistics ecosystem, which creates a digital platform, plays the role of a leadership group, thus becoming a focal company in the ecosystem organization model of economic relations in cross-border e-commerce.
2. The key group includes sellers and buyers of goods and services. The key group companies invest tangible property, information and other resources in the ecosystem and use the services provided by the focus group and logistics companies.
The rest of the participant groups are not included in the trade-only digital platform, but stay in direct interaction with its participants.
3. Logistics companies belonging to the third group in the process of circulation of e-commerce transactions provide the logistics services necessary for the enterprises of the key group.
4. Service companies provide services related to transactions, personnel training, software development and implementation, provision of network services, etc.
5. Related enterprises form a group with a relatively low level of collaboration with the ecosystem. These are mainly social groups, related institutions, management institutions, consulting companies and research institutes.
6. Governmental institutions. The authors’ approach considers identifying a group that is not included in the ecosystem structure, but affects it through the creation of regulations and subsequent monitoring of their observance at the national level. This group includes tax and customs services, transport inspection, phytosanitary and epidemiological control services, quality control services, etc.
7. International trade and economic organizations and agreements. This group is also not included in the ecosystem structure, but affects it through the creation of regulations and subsequent monitoring of their observance at the national level. First of all, this group includes international supranational bodies, international organizations, associations, unions, etc.
A model of ecosystem organization of economic relations in cross-border e-commerce based on an open digital platform
Another model constitutes an open digital platform that provides both marketplaces and services (operational and logistics) to participants. The examples of the open digital platform model are JD.com and Tmall.
This model is also based on dividing all participants in cross-border e-commerce into seven main groups. But unlike the trade-only digital platform model, the open digital platform model directly includes all seven groups of interconnected participants.
1. The focus group that organizes the digital platform, coordinates and allocates resources.
2. The key group includes sellers and buyers of goods and services.
3. A logistics system representing the third group. Logistics service providers and infrastructure logistics facilities form a logistics network of e-commerce enterprises on a digital platform.
4. Service companies constitute a group supporting the focal and key ecosystem groups.
5. Related enterprises form a group that intermittently and irregularly collaborates with the main ecosystem groups.
6. Governmental institutions.
7. International trade and economic organizations and agreements.
According to the authors, an important issue in the development of digital platforms within value chains is the task of adapting to constantly changing customer requirements. To solve this problem, it is also important to study the Chinese the trend of “digitally-powered physical retail innovation” (Omnichannel fulfillment, in-store digitization, also called “phygital” as a mash-up of the words “physical” and “digital”, and new go-to-market models) [20]. Chinese online retail sales in 2019 were expected to swell to USD 1.5 trillion, exceeding the retail sales of the ten next largest markets in the world amounting at USD 1.2 trillion (in descending order of the volume: United States, United Kingdom, Japan, South Korea, Germany, France, India, Russia, Brazil, Indonesia, Argentina), in accordance with the McKinsey report about China’s sudden rise as a global leader in e-commerce [20]. Mostly, goods and services are sold directly between a business and end-user consumers [21]. Business-to-consumer (B2C) is the most popular form of e-commerce in China. It should be taken into account that an e-commerce firm has a dual role acting as a platform: firstly, as a retailer it sells its products directly to consumers and, secondly, as a marketplace it provides a forum for independent retailers to sell their products directly to consumers. The interaction between platform participants definitely influences the adaptation of the value chain to changing customer requirements in a global environment.
Considering the great role of Chinese economy, the economic relations in BRICS countries (namely Brazil, Russia, India, China and South Africa) and, consequently, over the world, authors agree with the relevance of exploring the role of competition law and the new processes of value generation in the era of digital capitalism in the work [22]. Additionally, researchers find it reasonable to consider the thesis (in the abovementioned work) of the competition between platforms and ecosystems (“intra-platform/ecosystem competition”). Authors could agree with the relevance of the deep scientific approach to explore the nature of consumer welfare in the digital era. In this regard, the Chinese cities’ tier system (https://www.morganstanley.com/ideas/china-small-cities-economic-growth, accessed on 1 December 2021), in devising marketing strategy, is very useful for understanding the approaches to planning the complexity and the sequence of participants of the entire value chain. Studying the interactions between the participants of digital platforms aims to enhance the sustainability of logistics networks and marketing channels. Thus, authors found the issue of the analytical description of the process of considered business interactions within value chains relevant.
A prerequisite for the developed approach is the formation of the ecosystem organization’s specific features on the example of cross-border e-commerce between China and Russia. Developing open digital platforms provides services to several groups of interconnected participants in cross-border e-commerce which are under consideration in this section.

2.2. Data-Driven Value Creation E-Commerce in the Context of Investigating the Prerequisites for the Business Echelons’ Approach

Frameworks widely used for formulating and implementing a strategy, such as AARRR Acquisition–Activation–Retention–Referral–Revenue (and its modified version RARRA Retention–Activation–Referral–Revenue–Acquisition), initially reflected the transformation of a sales funnel into a different quality, called a conversion funnel. Since both models focused on achieving the maximum efficiency of promotion in a competitive environment, the set of metrics applied in them provides a basis that is convenient for constructing mathematical models and algorithms for a wide range of applications. The basis for creation of such intelligent systems has become possible due to the widespread introduction of the organization of methods of production, based on the principles of development programs under the auspices of the Industry 4.0 doctrine. The transformation of digital logistics and marketing channels is determined by the evolutionary development of the logistics system and marketing instruments, the reliability and efficiency of which can be tested in practice [23,24,25,26].
When analyzing the state and dynamics of development of the cross-border e-commerce between China and Russia, it is necessary to conduct a comprehensive study of conditions for formation and development of mutual trade between the countries. No doubt, development of the cross-border e-commerce market between China and Russia is driven by development of the Chinese–Russian cooperation in all spheres of the economy. The investigation of the features of development of mutual trade between China and Russia could allow the consideration of the business echelons in detail.
A comparative analysis of the key economic indicators of China and Russia is presented in Table 1 and Table 2.
The data presented in the table shows that China outranks Russia by a number of indicators, in particular in terms of the GDP volume and the GDP annual growth rate. However, the ratio of GDP per capita in China is lower than in Russia, and wages in China are higher than in Russia. At the same time, the unemployment rate in both countries is within comparable limits.
The current balance of GDP in China amounted to 1.9% in 2020, while in Russia this value amounted to 3.9% in 2019. At the same time, China’s trade balance is five times higher than Russia’s trade balance, amounting to 51.5 USD billion and 10.206 USD billion, respectively, according to the data on the first half of the year 2021.
In terms of imports and exports, China significantly outperforms Russia: the imports in China amount to USD 229.9 billion, while in Russia this value is equal to USD 24.61 billion. A similar situation is observed with exports: in China this indicator amounts to USD 281.4 billion, while in Russia this value is equal to USD 19.9 billion.
China’s international investment position corresponds to USD 2400.8 billion, while in Russia this value is equal to USD 471 billion. This signifies the great investment attractiveness of China.
In terms of international foreign exchange reserves, China outperforms Russia five times—USD 3214 billion and USD 596.521 billion, respectively, according to the data on the first half of the year 2021.
The dynamics of the mutual trade turnover between China and Russia in years 2000–2018 (Table 3) reflects the overall picture of the foreign trade turnover of each country under consideration. The growing mutual interest of China and Russia in development of trade and economic relations could have a positive impact on implementing the concept of digital echelons in international trade.
Despite a slight decline in the values of the indicators under consideration in years 2019 and 2020, which is characteristic in general for the dynamics of the countries’ foreign trade turnover, one can observe a positive trend in the mutual trade between China and Russia, which indicates an increase in importance of the partner countries.
This is due to the influence of not only economic, but also political factors. In particular, this is due to the introduction of sanctions against goods from China and Russia by a number of countries (for example, the US sanctions policy aimed at restricting the import of Chinese goods; the sanctions policy of a number of countries aimed at restricting the import of Russian goods and the measures responsive to these restrictions). All this has led to mutual rapprochement and increased trade cooperation between China and Russia, including in the field of the cross-border e-commerce.
The e-commerce market is developing dynamically. It is growing especially rapidly in China. The growth dynamics of the e-commerce market in China is shown in Table 4 (on the basis of data derived from https://dzswgf.mofcom.gov.cn/sjcx.html, accessed on 1 December 2021).
In terms of the volume of transactions in e-commerce of China, there is a slight decline (growth rate in 2020 amounted to 4.5%, while in 2019 it amounted to 6.7%), under an overall positive trend. The volume of domestic retail e-commerce in the B2C and C2C markets tends to grow with a slight decrease of its rate (the growth rate in 2020 amounted to 10.9%, while in 2019 it amounted to 16.5%). At the same time, the number of express deliveries is growing significantly. In 2019, this value was equal to 63.523 billion deliveries, and in 2020 it was already 83.358 billion deliveries, which corresponds to an increase in this market segment by about a third (31.2%). Such an increase in the number of express deliveries puts a strain on logistics.
The proposed approach considers an end-to-end integration model of digital logistics and marketing channels, based on the holistic view of the consumer value creation process. Authors offer the definition of the interface of the interaction as an interface evaluating the quality of the value creation process in relevant business echelons using economically significant indicators that depend both on time and on the scale of considered echelons. The term interface usually refers to human–computer interaction (e.g., generalized brain–computer interface technology comprising of three stages: interface, interaction, and intelligence [27]). Authors find the human-chatbot interactions, and its potential similarity to a human-to-human conversation in the workplace, interesting [28]. Researchers agree that chatbots create more personal customer interactions than those afforded by traditional menu-based web applications. Intelligent knowledge-based conversational agent system architecture aims to support customer services in e-commerce sales and marketing [29]. Different types of customer knowledge can be applied in interaction interfaces in the sequence of business echelons, aiming to improve the quality of consumer value creation process. The development of mathematical models reflecting the material flows on networks requires the involvement of a mathematical apparatus [30], allowing to describe both the business echelons and the interaction interfaces being newly defined (on the basis of the integration of digital logistics networks and marketing channels). The authors consider a mathematical approach with a statement that is proved in the works [31,32].
The main purpose of this section of the article is to show the possibility of obtaining aggregated data suitable for use as arguments of a mathematical model. The authors understand that statistics for two years is not sufficient to formulate conclusions suitable for practical applications, but this goal was not set. The researchers aim to show that the available data stream of economic indicators, when processed, provides a basis for predictive analytics. For this, the mathematical model developed in the article is used. Technological solutions widely presented on the market in the Big-Data segment, as well as interstate agreements between Russia and China on standardization, exchange of information and machine-readable data in digital transport corridors, allow collection of the necessary data over a long horizon.

3. Results

3.1. Theoretical Fundamentals

The sequence of echelons can be viewed as a series of stages in the creation of a consumer value chain. The series of stages under consideration can be located along a certain axis. From the economic point of view, the process of consumer value creation is extended in time from the stage of commercial interest, aimed at promoting a product or a service to the consumer and initiating the entire value creation chain, up to the completion of payment of the market value for a product or a service.
To formalize, the promotion through the echelons could be defined as a change of a parameter corresponding to the axis X , where X [ 0 , M ] , and M is the length of the echelons chain. The current time is denoted as t . The movement between the echelons of the process of transforming the initial product (for example, from the ownership of a raw material deposit) to the final consumer product (sale on the commodity market) occurs both in time t and along the axis X .
For the activity to be successful and competitive, it is necessary to assess both the dynamics of the process and the significant indicator of economic efficiency. To build a mathematical model, this dependence Q ( x , t ) is defined as a function reflecting the stages of the promotion echelons x and the process current time t .
This mathematical formalism allows one to make an end-to-end description of the entire commercial process chain and reflects the level of its efficiency at every moment t at the echelon x X .
Accordingly, next, an expression for the dynamics can be obtained by a virtual shift of the process located at the echelon x 1 from the moment of time t = t * along the axis of echelons X . Authors introduce a key indicator W ( x , t ) necessary to assess the dynamics of changes of the economic efficiency indicator in the following form:
W ( x , t ) = Q ( x 2 , t * ) Q ( x 1 , t * ) x 2 x 1 , where x 1 and x 2 are taken as the previous and subsequent echelons of promotion, respectively.
In practice, the indicator presented is of an integrated nature. It is based on business metrics. The authors used both financial metrics ROI, ROMI, ROAS, etc., and the key marketing metrics CPOs, ARPU, CAC, NPS, etc., since, during the transition to the digital concept of Industry 4.0, it is online analytics that provide a stream of relevant data used in algorithms of intelligent management decision-making systems. It is pointless to give prominence to any of the metrics used, as well as to specify a full list of them, since, by depending on the segment of a business activity, the impact of each metric unfolds in the general economic context. There is also no doubt that there is always a correlation between them.
Considering W ( x , t ) from the point of view of the organization of the echelons chain, it is also possible to use it to assess the consistency of the successive stages of the promotion of the objects of labor. Authors will assess the effectiveness of the management activities by measuring the maximum transition rate, calculated as:
lim x 2 x 1 W = Q x | x = x 1
If the dependence W ( x , t ) is built along the axis of echelons X , a dynamic model will be obtained that allows us to describe the passing of a business process in time.
Some similarities can be noted with the common bounce rate metric. However, the proposed calculation W ( x , t ) has a more general meaning, since it reflects the integral indicator. Authors will consider it as the degree of efficiency of interaction at the interface level of successive echelons through which the objects of labor [32,33] pass.
In this case, the economically significant indicator is calculated in dynamics. For this, the ratio Q x | x = x 1 Δ t is determined as an estimate of the volume of the activity passing over the planned interval Δ t , transited from the echelon x 1 to the volume Q x | x = x 2 Δ t at the exit from the echelon x 2 .
To form an algorithm, the ratio could be written:
( W ( x 1 ) W ( x 2 ) ) Δ t = Q x | x = x 1 Δ t ( Q x | x = x 2 Δ t ) ,
which will serve as the basis for further calculations.

3.2. Mathematical Model

The problem set is in close agreement with the applications of the queuing theory. If authors consider the dynamics of the passage of a business process through the echelons of transformation, then after each echelon there is an output stream serving as an input stream for the next echelon. It should be noted that in the conditions of market uncertainty and competitive environment, all processes are inevitably stochastic in nature. Since there is a sequence of transformations T q 1 , T q 2 , , T q M , where q i is designated as a probabilistic characteristic of the flow transition through the echelons interaction interface. Such formalism allows one to apply the Rényi transformation. Researchers only need to change the scaling along the time axis t .
In such a setting, according to Rényi’s proof, the chain of business transformations in M echelons, Rényi’s theorem, the sequential passage through the stages of commercial interaction is equivalent to the reduction of the transformation T q 1 q 2 q M . This means that the chain of flow converges with a high degree of certainty to a flow described by an exponential distribution. The only prerequisite for implementation of such a transformation is the requirement for uniformity expressed as:
lim n q 1 q 2 q n = 0
In practice, this prerequisite reflects the standardization of effectiveness of the echelons’ interactions.
The developed analytical description of business echelons of the consumer value chain is the basis for the complete mathematical modeling of material flow through the chain of echelons at all stages, from the initial stage of obtaining raw materials to making payments by the consumer for the value received.

3.3. Interpretation of the Developed Economic and Mathematical Model

Taking the obtained expressions as a basis, it becomes possible to combine the dynamics of the process of passing through the chain of echelons with indicators of the success of business organization at each stage. To solve this problem, we additionally define a function g ( x ) . This allows one to introduce the echelon efficiency index x = x 1 , x 2 , , x M to the mathematical model, which corresponds to the KPI (key performance indicators) of this stage. The dependency g ( x ) also has an integral nature and depends both on the professionalism of management, and on the quality of framework development, the market presence strategy, the degree of penetration of digital methods into activities of echelons, and the level of technological equipment used for M2M (machine to machine) interaction in the business chain.
The level of organization of interaction between echelons at stage x is correlated with g ( x ) , and the higher the value is, the higher the level is. If we use the term transition conversion at stage x , then authors carry out its calculation using the following ratio:
g ( x ) 1 Δ x ( Q ( x , t 2 ) Q ( x , t 1 ) ) = g ( x ) 1 Δ x   Δ Q .
For a correct calculation, it is necessary to take into account the influence of the competitive environment on the entire value chain. To do this, authors define a function D ( x , t ) that reflects the impact of external factors on the right side of the equation relative to the key indicator W ( x , t ) . The nature of D ( x , t ) is also integral, driven by the influence of the competitive environment, legislative restrictions, current regulations in this business segment and other market factors.
Ultimately, in a discrete form, the dynamic equation of the process of passing of objects of labor through the business echelons takes the form:
  Q   x | x = x 1 Δ t (   Q   x | x = x 2 Δ t ) = g n 1 Δ   x     ( Δ Q D ( x , t ) Δ t )
Using the Lagrange transformation, researchers formulate the limiting form of the mathematical model, reducing it to a partial differential equation:
g n 2 Q   t 2 + D ( x , t ) =   Q   t
The authors are trying to combine the dynamic model of passage through the chain of echelons with the level of organization of their interaction on the interfaces of informational and physical contact. To do this, first authors need to introduce KPI indicators to the equations. Then, authors determine the numerical indicators, reflecting the information flows of data used as arguments for the digital model of processes at the boundaries of echelons.
The authors show that when passing to the next business echelon in the sequence under consideration, the degree of the organization of procedures, and the applied technological solutions and operations are determined by the quality of management. Authors designate the marginal performance as   μ n , where n is the number of the echelon by the argument X . Next, authors determine the intensity λ n of the output flow from the previous echelon at the input to x n . The characteristic of possibilities x n is set by the parameter m n . Applying the calculation by the considered formulas, authors write the final expression for the determination of conversion on the interaction interfaces of the echelons as a set of formulas convenient for programming. For the conversion characterizing the KPI along the entire chain, authors get a vector with the dimension M :
G ¯ = { g n } , where it is denoted:
g n = 1 λ n m + s m n s μ n m + s m n ! [ k =   0 m λ n k k ! μ n k + λ n m + 1 m n ! μ n m + 1 ( 1 ( λ n m n μ n ) s m n λ n μ n ) ] 1
Since the presented mathematical model was developed taking into account the disturbing influence of competitive market environment, the calculation of the indicator D ( x , t ) includes an index of influence   ν ( t ) , or losses.
In this case, the calculation expression takes the form:
D ( x , t ) = 1 ν ( t ) λ [ k =   0 n α n k k ! + α n m n m n ! Y ] 1 α n m n m n ! Y ,
denoted are, respectively:
α n = λ n / μ n ;
Y = s =   1 α n s k =   1 s ( m n + k ν ( t ) μ n ) .
The set of mathematical relations obtained above forms a system of equations. Their implementation, with the application of any available software package for solving modeling problems using computers, will make it possible to analyze the processes in interaction of participants in business echelons. At the same time, it becomes possible not only to calculate the quantitative indicators of the material flow, taking into account the extension over time, but also to determine the degree of economic efficiency of the management of each business echelon.

3.4. Approbation of the Economic and Mathematical Model

The dynamic analysis in the case of system solutions containing differential equations requires determination of the initial conditions. For economic applications, the most acceptable estimate of the change in demand for the final product is the Verhulst equation. Under the accepted conditions stated above, the following set of parameters is specified during the study:
Q 0 ( t ) , the volume of potential demand for the final product at the beginning of its promotion;
Ω —the support base of this market segment;
θ —the dynamics of promotion through the echelons.
Then, using the known relation obtained by Verhulst heuristically:
d   Q 0 ( t ) d   t = θ     Q 0 ( t ) ( 1 Q 0 ( t ) Ω ) .
After carrying out simple transformations, the following analytical solution can be presented:
Q 0 ( t ) = Ω     Q 0 *   e θ   t Ω + Q 0 * ( e θ   t 1 ) .
If this expression is differentiated, the formula for calculating the dynamics of the process can be written:
Q 0 ( t ) = θ     Ω     Q 0 *   e   θ   t ( Ω Q 0 * ) [ Ω + Q 0 *   ( e θ     t 1 ) ] 2 .
Modeling using a package of applied programs for solving systems of differential equations, and using expressions (1)–(3) of this work, makes it possible to visually evaluate the process. In this study, the addition of Q ( x , t ) is of interest. At the same time, all possible variants of the quantitative dependence Q ( x , t ) are first covered, then a solution is selected corresponding to the passage from the initial moment to the final one, corresponding to the optimum of a given criterion of economic efficiency.

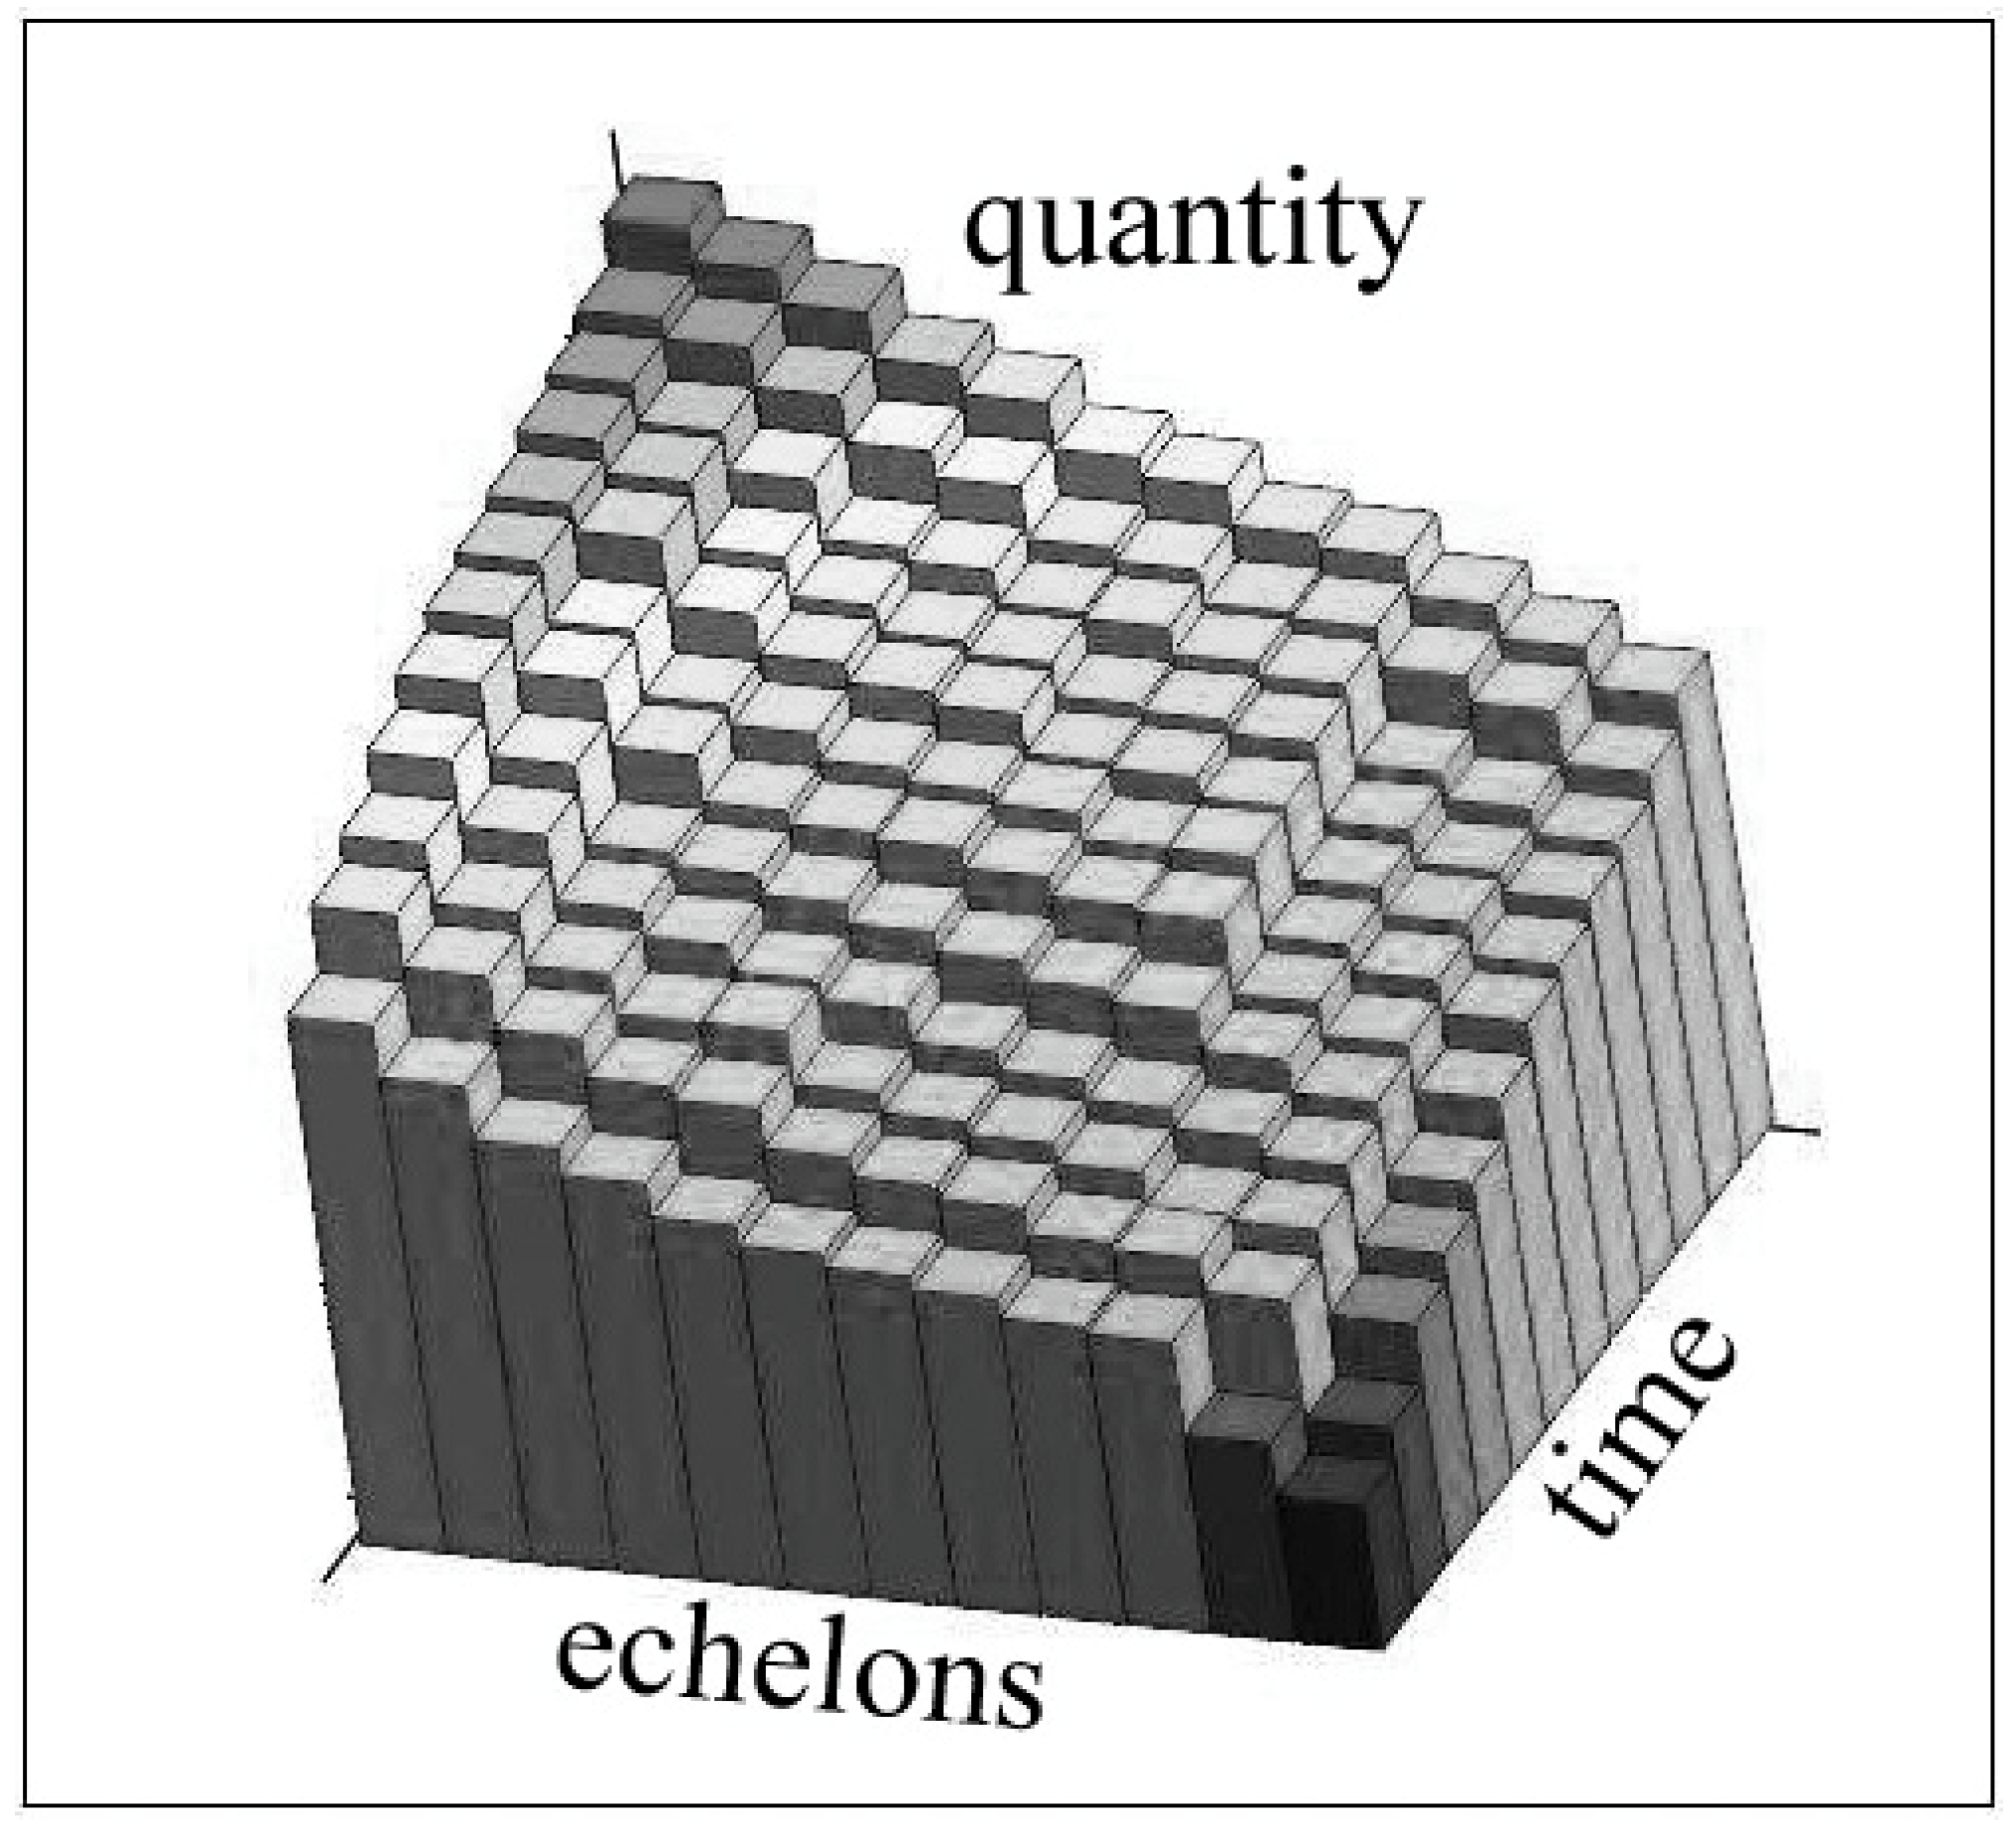
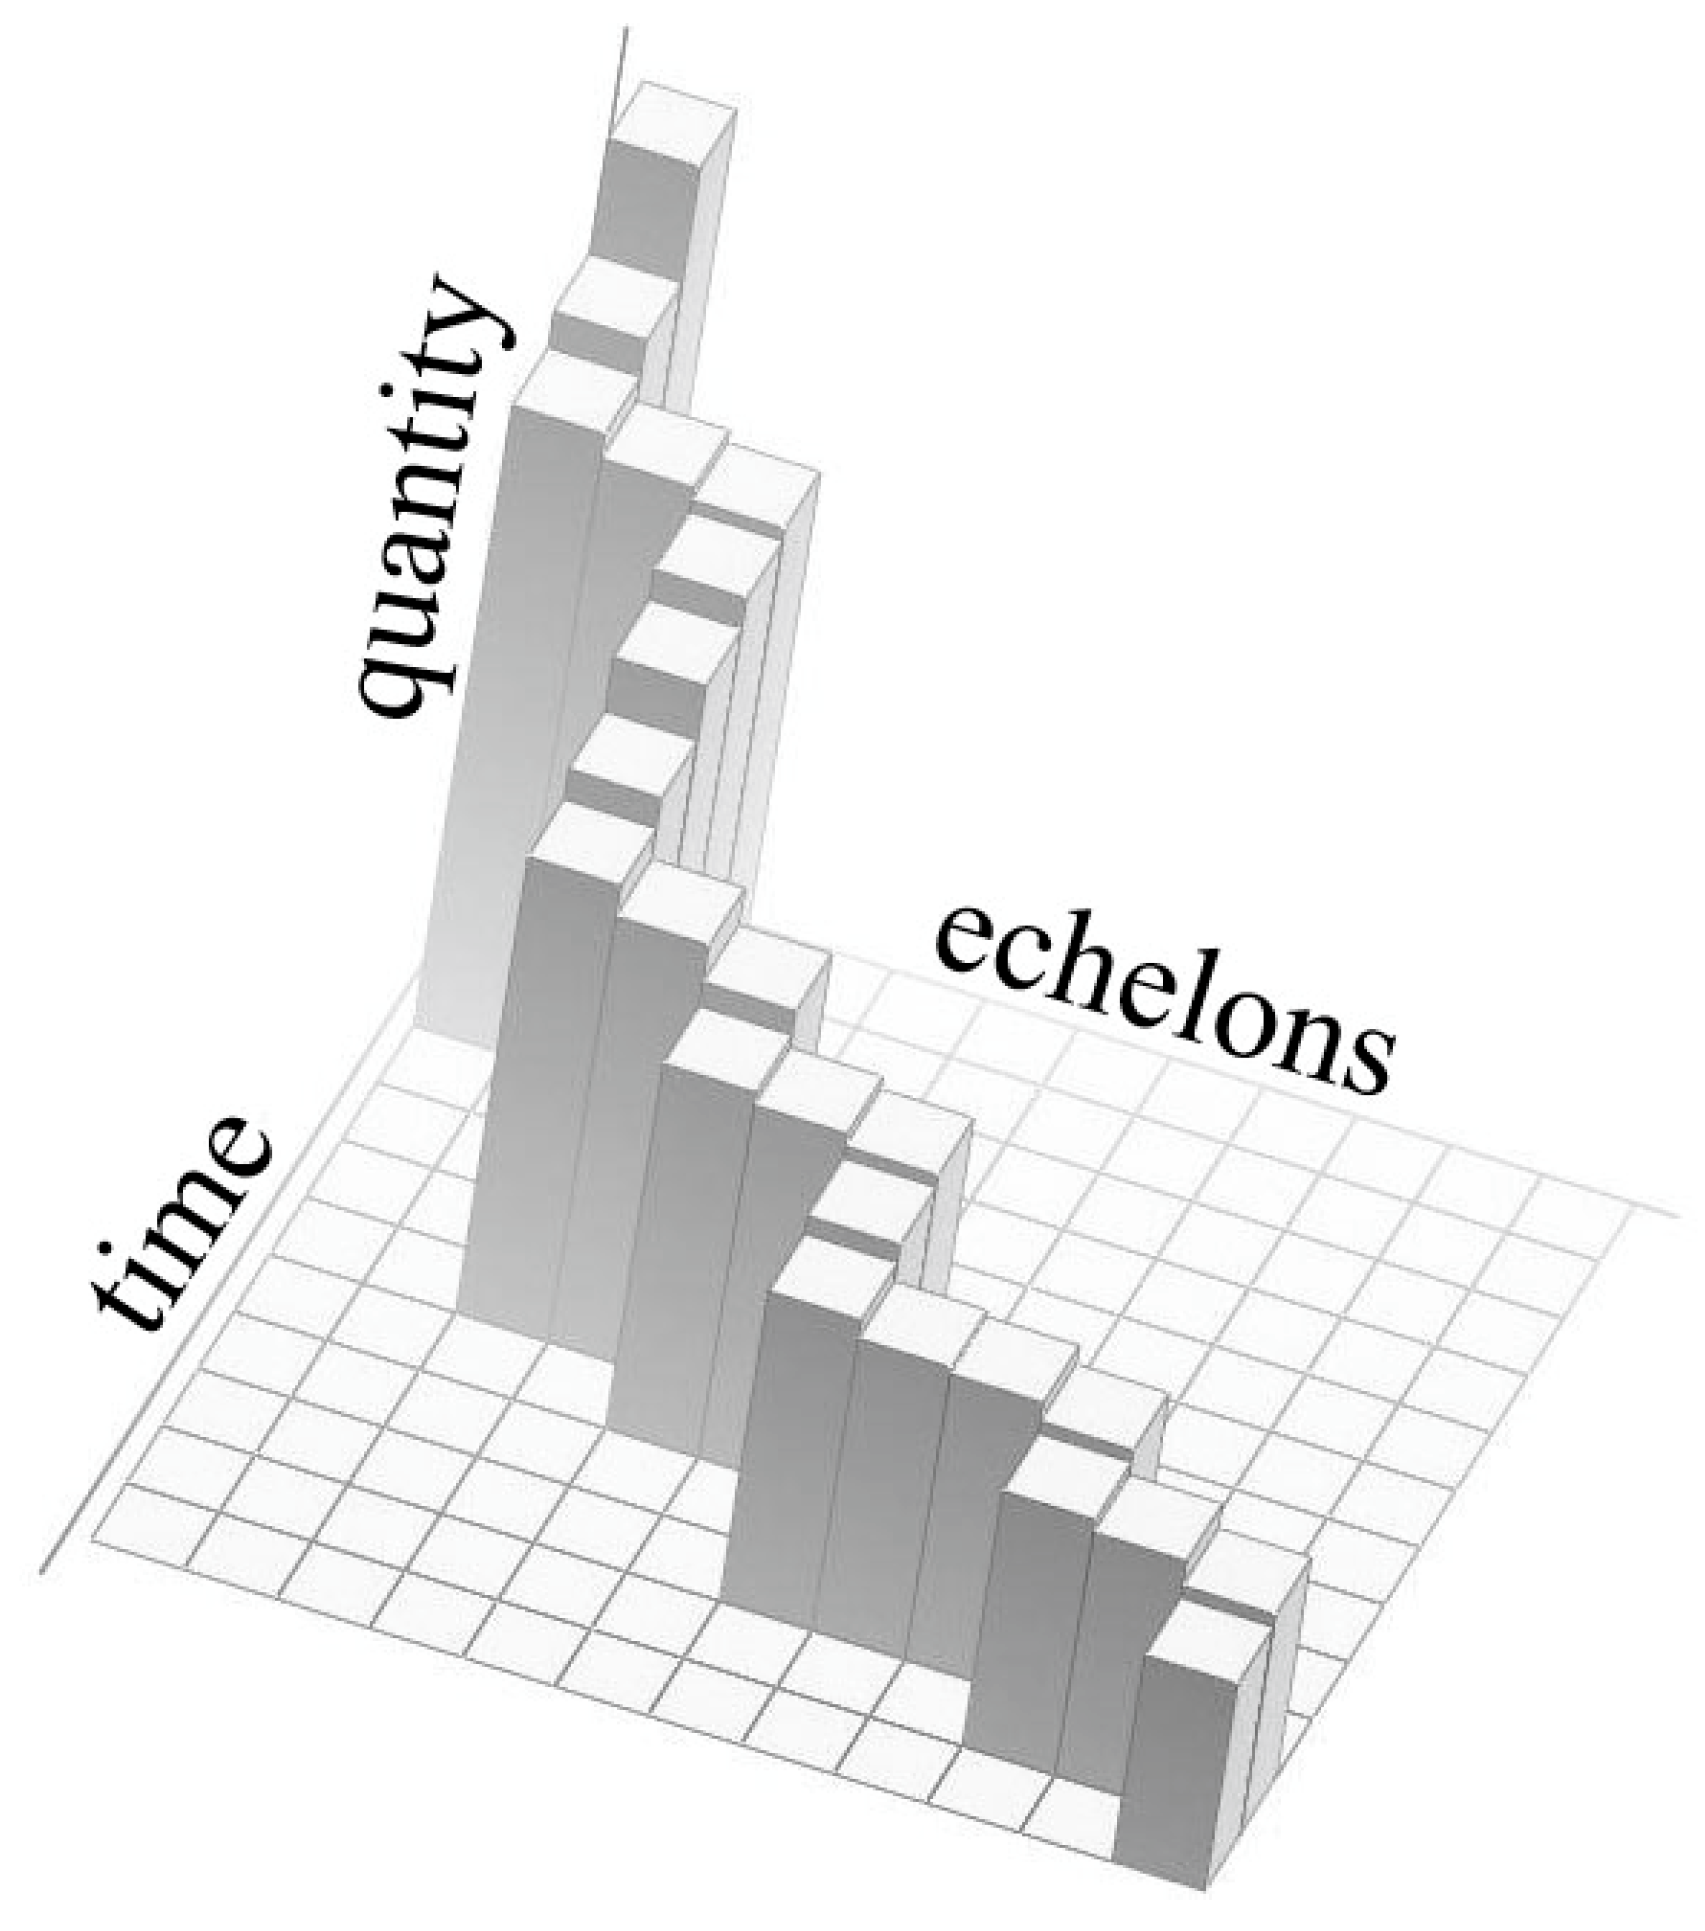
3.5. Visualization of Business Echelons

The optimal interaction of transaction participants at the levels of business echelons is possible, based on the solution of the above system of differential equations.
The visualization of business echelons is possible in Figure 1, which demonstrates the results of computer calculations. On the time axis (time), uneven values of the transit time of the corresponding business echelons are calculated. On the axis (echelons), the business echelons are reflected in sections corresponding to the complexity of the process. The height of the columns corresponds to the quantitative indicators of the material flow (quantity).
This diagram clearly confirms that only a dynamic model can describe the process of moving up the business echelons.
It also becomes possible to find the optimal mode of operation, based on the criterion of economic efficiency for this, from the general solution. A sequence of business echelons reflecting the interaction between participants in business activities is highlighted, which brings the total maximum profit. Figure 2 shows the most cost-effective sequence of business echelons calculated on a computer.
The final solution contains discreteness, expressed by a countable set of business echelons in the consumer value chain. If the data on the change in parameters over time are not obtained in real time, but after some planned reporting periods, then instead of the discrete Verhulst equation, authors use the Feigenbaum presentation. This will not affect the programming of the problem or the process of calculations using computer technology in any way, due to the use of iterative algorithms.
The drivers of real business development, as integrated with digital technologies as possible, are, today, the algorithms, mathematical models, and predictive planning based on leading indicators. The models applied in previous analytical schemes, based on the sales funnel, in the context of global digital transformation, have crystallized into the concept of the conversion funnel, which requires an appropriate methodological justification. The mathematical model obtained in this work serves as the basis for a structured description of the sequence of business echelons in the customer value chain. The provided system of formalisms and the corresponding calculated dependencies are intended to be embedded in various software products of digital management support systems. This scheme provides ample opportunities for an in-depth analysis and searching for optimal solutions, based on the criteria of an economic nature.

3.6. Validation of the Developed Model

The methodology proposed in this section for assessing the effectiveness of promotion by business echelons can be a subject of discussion. The authors proceeded from the assumption of the need to ensure end-to-end mutual correspondence of all stages inherent in a particular type of business or commercial activity. In practice, this means a comparable quality of management at each stage of promotion. For this, authors proposed to use the degree of decrement, being successfully used in practice, and similar to that used in modeling the conversion funnel to assess management.
Validation is based on practical recommendations for doing business. To compare the level of management quality that ensures the interaction of participants in the business process, we used the exponential regression decrement indicator. Based on the calculations, it became possible to tabulate a set of data on the level of key performance indicators (Table 5).
The presented data are segmented according to grades of management quality assessment. The calculation was carried out for two variants, N = 8 ;   N = 12 , of the length of the business echelons sequence within the consumer value chain.

4. Discussion

The authors could discuss that the suggested approach presents the integration of digital logistics and marketing points of views based on the mathematical models of the ecosystem organization of economic relations. The researchers take into account that the prerequisites of the developed approach stem from the specific features of the ecosystem organization in Chinese–Russian case cross-border e-commerce, including a trade-only digital platform and an open digital platform. Authors offer both definitions of business echelons and interaction interfaces within value chains, allowing one to disclose the process of interaction between the participants in cross-border e-commerce. The article provides a theoretical description of business processes within the logistic network of the value chain. Results are mostly theoretical and provide mathematical models, with a suggestion of their potential application. The possible areas of research could be based on the concept of digital twins and the digitalization of logistics business processes [34,35,36].
The authors’ approach, based on the idea of implementing a strategy, initially reflected the transformation of a sales funnel into a different quality called a conversion funnel. The marketing approach is focused on achieving the maximum efficiency of promotion in a competitive environment. So, the set of applied metrics provides a basis that is convenient for constructing mathematical models and algorithms for a wide range of applications.
Competition forces the business to look for more complex schemes, which complicates the overall structure of interaction between the owner of the resources and the end user. At the same time, the depth of the chains of advance echelons increases. Decision making in management is designed to cover the situation throughout the business’ ecosystem, within which the results of labor are shifted. This completely excludes the possibility of managing processes based on the intuition and experience of individual managers. Only the processing of arrays of information using big data technology, as well as the application of the proposed direction of mathematical modeling, combining economics and the theory of optimal processes, will give an acceptable result and a basis for predictive planning. From the authors’ point of view, the theoretical fundamentals for the creation and development of such intelligent systems consider the integration of marketing approach and logistics network theory, taking into account the Industry 4.0 doctrine.
Currently, the influence of the concept of sustainable development, green logistics, is increasing. It is the optimization of the promotion of business echelons that will help reduce the load on infrastructure on a national scale, which is dictated by the current trend towards minimizing environmental damage. Undoubtedly, it is necessary to implement new business models which are relevant to the environmental, and social goals of transforming the infrastructure and opening the door to new entrants [37]. In this regard, it is interesting to note that the Russian industry’s interest in the ecological topic is steadily increasing [38]. The chain of transformation of raw materials into a finished product, and its sale to the consumer includes many autonomous stages that belong to different business echelons. The efficiency of the implementation of a business scheme depends on the consistency of their interaction. The research goal was to shift the emphasis in this work to the possibility of using a mathematical model to apply the well-developed apparatus of the theory of optimal processes. Authors attempt to theoretically substantiate the possibility of using the digital data flow for predictive analytics, which in turn requires a developed mathematical model. Since it is precisely the opportunity to formalize the transition processes at the stages of creation of a consumer value chain, it provides a basis for digitalization [4,5,6,7]. The formulated concept of echelons allows one to clearly divide the entire business process into stages between echelons and, at the same time, take into account the influence of the time factor, which is important for assessing the economic performance of a business. This mathematical representation provides a fundamental basis for business development within the framework of the Industry 4.0 concept. Authors suppose that most types of economic relations will continue to exist only on the basis of the principles of algorithmic support and artificial intelligence systems, being introduced in the managerial decision-making process. In the digital economy, only mathematical models enable one to predict market parameters and effectively making economically sound management decisions using scientific optimization methods.
The authors propose to discuss the possibilities of applying the developed approach in the context of the concept of sustainable development [39,40], bioeconomies [41], as well as taking into account the changes in various conditions of the functioning of logistics networks under the influence of changes in the monetary policy [42,43,44].

5. Conclusions

A real business activity is always extended in time. This circumstance is of the most importance, since it significantly affects the cost of investments, the loan costs, the financing conditions, and other factors caused by bank rates and the influence of inflationary processes. It becomes possible to divide the cycle of the formation of business echelons into stages due to the formulated concept of echelons.
The analysis of the dynamics of promotion through the business echelons is necessary to find the most effective organization of interaction at the full value chain scale, which in the first place is necessary for sustainable promotion under the conditions of a competitive environment and market uncertainty. The basis for the creation of such intelligent systems has become possible due to the widespread introduction of methods of production organization, based on the principles of development programs under the auspices of the Industry 4.0 doctrine. The solution to such large-scale tasks requires research aimed at the theoretical construction of the process of interaction between the echelons of the value chain. According to its results, the researchers further create a significant set of parameters, reflecting the values flowing in time that characterize all aspects of the process. On such a basis, it becomes possible to formalize the problem mathematically, which is already in the arguments of the digital interaction of information flows. In this case, the main criterion for the possibility of implementing such a scheme will be the real time collection of the data flow and, if necessary, the statistical processing of data. The combination of methods for analyzing business data, from Internet platforms and from the means of economic and mathematical modeling, makes it possible to fundamentally influence the functioning of business echelons of the value chain. The authors suggest the approach of digital integration of both logistics networks and digital marketing channels based on the mathematical modeling of business echelons.
The application of such a concept makes it possible to form a holistic view of the stages of interaction between participants in the process of consumer value creation, instead of a scattered data set on individual stages of information exchange. The proposed holistic approach corresponds to the transformation of a model into a description of a system, with an input represented as a set of unique parameters corresponding to interaction surfaces in terms of the number of business echelons involved in this process.
The evaluation of the success of the applied technologies, taking into account the competition and uncertainty of the market situation, assumes that the output parameter characterizes not only the economically justified quantity of products, but also a complete list of significant indicators of the business process. The authors note the fact that the echelons’ interaction interface parameters in this paradigm make it possible to assess the quality of the promotion process using economically significant indicators that depend both on time and on the volume of interaction between echelons. In accordance with the authors’ opinion, we could draw a parallel with the S section of the Gartner cycle and try to explain how the path of technology development regards the implementation in the context of the value chain. The theoretical construction of the business echelons’ chain aims to show the logic of business interactions based on the digital transformation of logistics and trade. Authors propose the mathematical description of the structure of the business echelons’ chain. The obtained mathematical formalisms also correlate with the principles of Augmented Analytics and the concentration of efforts in the field of machine learning. In addition, structurally, the transition to Industry 4.0 is unthinkable without the Decision Intelligence algorithmic base for the implementation of Digital Culture. The formulas obtained as a result of the work are abstract, they rely on data of any dimension, and within the framework of the trend to the Formative artificial intelligence, their application for the automation of decision making allows their unlimited scaling (Operationalizing and Scaling).
The advantages of the model of the ecosystem organization of economic relations in cross-border e-commerce based on an open digital platform, in our opinion, consist of the integrated, standardized and personalized provision of logistics services, which makes it possible to increase the efficiency of the functioning of the cross-border e-commerce ecosystem. Nevertheless, experience shows that the model of the ecosystem organization of economic relations in cross-border e-commerce, based on a trade-only digital platform, also has the potential to improve operational efficiency through a constant rotation of enterprises that are not a part of the trade-only digital platform.

Author Contributions

All authors contributed substantially to the entirety of the work reported. S.E.B. and I.V.K. performed project administration, both Y.Y.M. and A.V.G., as well as G.A.K. provided supervision, S.E.B. and S.M.S. prepared a conceptualization, both E.A.S. and L.S. as well as E.D.L.P.P. performed data curation, as well as formal analysis, E.A.S. and D.C. contributed to the literature review, S.E.B. and N.M. developed the methodology and edited the manuscript. All authors have read and agreed to the published version of the manuscript.

Funding

The research of S.E.B., S.M.S. and I.V.K. is partially funded by the Ministry of Science and Higher Education of the Russian Federation under the strategic academic leadership program ‘Priority 2030’ (Agreement 075-15-2021-1333 dated 30 September 2021).

Institutional Review Board Statement

Not applicable.

Informed Consent Statement

Not applicable.

Data Availability Statement

Data sharing is not applicable to this article.

Acknowledgments

Authors would like to thank anonymous referees and take into account all valuable comments in future scientific research.

Conflicts of Interest

The authors confirm that there are no conflict of interest to declare for this publication.

References

  1. Porter, M.E. Competitive Advantage: Creating and Sustaining Superior Performance; The Free Press (Macmilan): New York, NY, USA, 1985; ISBN 0-684-84146-0. [Google Scholar]
  2. Porter, M.E. Competitive Strategy: Techniques for Analysing Industries and Competitors; The Free Press (Macmilan): New York, NY, USA, 1980; ISBN 0684841487. [Google Scholar]
  3. Porter, M.E.; Kramer, M.R. Creating Shared Value. In Managing Sustainable Business; Springer: Dordrecht, The Netherlands, 2019; pp. 323–346. [Google Scholar]
  4. Shmatko, A.; Barykin, S.; Sergeev, S.; Thirakulwanich, A. Modeling a Logistics Hub Using the Digital Footprint Method—The Implication for Open Innovation Engineering. J. Open Innov. Technol. Mark. Complex. 2021, 7, 59. [Google Scholar] [CrossRef]
  5. Barykin, S.Y.; Kapustina, I.V.; Sergeev, S.M.; Yadykin, V.K. Algorithmic foundations of economic and mathematical modeling of network logistics processes. J. Open Innov. Technol. Mark. Complex. 2020, 6, 189. [Google Scholar] [CrossRef]
  6. Borisoglebskaya, L.N.; Sergeev, S.M.; Provotorova, E.N.; Zaslavskiy, A.A. Digital algorithms for supply chain automation of mechanical engineering production. IOP Conf. Ser. Mater. Sci. Eng. 2020, 862, 042025. [Google Scholar] [CrossRef]
  7. Pilipenko, O.V.; Provotorova, E.N.; Sergeev, S.M.; Rodionov, O.V. Automation engineering of adaptive industrial warehouse. J. Phys. Conf. Ser. 2019, 1399, 044045. [Google Scholar] [CrossRef]
  8. Yue, D.; You, F. Game-theoretic modeling and optimization of multi-echelon supply chain design and operation under Stackelberg game and market equilibrium. Comput. Chem. Eng. 2014, 71, 347–361. [Google Scholar] [CrossRef]
  9. Popovic, T.; Barbosa-Póvoa, A.; Kraslawski, A.; Carvalho, A. Quantitative indicators for social sustainability assessment of supply chains. J. Clean. Prod. 2018, 180, 748–768. [Google Scholar] [CrossRef]
  10. Ullah, M.; Asghar, I.; Zahid, M.; Omair, M.; AlArjani, A.; Sarkar, B. Ramification of remanufacturing in a sustainable three-echelon closed-loop supply chain management for returnable products. J. Clean. Prod. 2021, 290, 125609. [Google Scholar] [CrossRef]
  11. Sarkar, B.; Guchhait, R.; Sarkar, M.; Pareek, S.; Kim, N. Impact of safety factors and setup time reduction in a two-echelon supply chain management. Robot. Comput. Integr. Manuf. 2019, 55, 250–258. [Google Scholar] [CrossRef]
  12. Mitra, S. Inventory management in a two-echelon closed-loop supply chain with correlated demands and returns. Comput. Ind. Eng. 2012, 62, 870–879. [Google Scholar] [CrossRef]
  13. Zhang, Y.; Huang, G.H.; He, L. A multi-echelon supply chain model for municipal solid waste management system. Waste Manag. 2014, 34, 553–561. [Google Scholar] [CrossRef] [PubMed]
  14. Gumus, A.T.; Guneri, A.F. A multi-echelon inventory management framework for stochastic and fuzzy supply chains. Expert Syst. Appl. 2009, 36, 5565–5575. [Google Scholar] [CrossRef]
  15. Ryu, K.; Moon, I.; Oh, S.; Jung, M. A fractal echelon approach for inventory management in supply chain networks. Int. J. Prod. Econ. 2013, 143, 316–326. [Google Scholar] [CrossRef]
  16. Burke, R.; Mussomeli, A.; Laaper, S.; Hartigan, M.; Sniderman, B. The Smart Factory. Responsive, Adaptive, Connected Manufacturing; Deloitte University Press: New York, NY, USA, 2017. [Google Scholar]
  17. Barykin, S.Y.; Smirnova, E.A.; Sharapaev, P.A.; Mottaeva, A.B. Development of the Kazakhstan digital retail chains within the EAEU E-commerce. Acad. Strateg. Manag. J. 2021, 20, 1–18. [Google Scholar]
  18. Scherbakov, V.; Silkina, G. Conceptual model of Logistics Vocational Education in the Digital Economy. In Proceedings of the International Conference on Digital Technologies in Logistics and Infrastructure (ICDTLI 2019), St. Petersburg, Russia, 4–5 April 2019; Volume 1, pp. 120–125. [Google Scholar] [CrossRef] [Green Version]
  19. Scherbakov, V.; Silkina, G. Logistics of smart supply chains. In Proceedings of the International Conference on Digital Technologies in Logistics and Infrastructure (ICDTLI 2019), St. Petersburg, Russia, 4–5 April 2019; Volume 1, pp. 66–71. [Google Scholar] [CrossRef] [Green Version]
  20. Bu, L.; Wang, J.; Wei Wang, K.; Zipser, D. China Digital Consumer Trends: Discovering the Next Wave of Growth. Available online: https://www.mckinsey.com/~/media/mckinsey/featured%20insights/china/china%20digital%20consumer%20trends%20in%202019/china-digital-consumer-trends-in-2019.ashx#:~:text=China’s%20rise%20as%20a%20global,markets%20in%20the%20world%20–%20combined (accessed on 1 December 2021).
  21. Wu, P.; Xiao-chuan Weng, C.; Joseph, S.-A. Crossing the Rubicon? The implications of RCEP on anti-monopoly enforcement on dominant E-commerce platforms in China. Comput. Law Secur. Rev. 2021, 42, 105608. [Google Scholar] [CrossRef]
  22. BRICS. HSE-Skolkovo Institute for Law and Development; BRICS: Oxford, UK, 2019. [Google Scholar]
  23. Aslam, H.; Khan, A.Q.; Rashid, K.; Rehman, S. Achieving supply chain resilience: The role of supply chain ambidexterity and supply chain agility. J. Manuf. Technol. Manag. 2020, 31, 1185–1204. [Google Scholar] [CrossRef]
  24. Frederico, G.; Garza-reyes, J.A. Supply Chain Strategy Reboot—Supply Chain Management Review. Available online: https://www.researchgate.net/publication/343189112_Supply_chain_strategy_reboot_-_Supply_Chain_Management_Review (accessed on 1 December 2021).
  25. Bag, S.; Wood, L.C.; Mangla, S.K.; Luthra, S. Procurement 4.0 and its implications on business process performance in a circular economy. Resour. Conserv. Recycl. 2020, 152, 104502. [Google Scholar] [CrossRef]
  26. Giordano, G. A Hybrid Supply Chain. Plast. Eng. 2020, 76, 9–11. [Google Scholar] [CrossRef]
  27. Gao, X.; Wang, Y.; Chen, X.; Gao, S. Interface, interaction, and intelligence in generalized brain–computer interfaces. Trends Cogn. Sci. 2021, 25, 671–684. [Google Scholar] [CrossRef] [PubMed]
  28. Nguyen, Q.N.; Sidorova, A.; Torres, R. User interactions with chatbot interfaces vs. Menu-based interfaces: An empirical study. Comput. Hum. Behav. 2021, 107093. [Google Scholar] [CrossRef]
  29. Ngai, E.W.T.; Lee, M.C.M.; Luo, M.; Chan, P.S.L.; Liang, T. An intelligent knowledge-based chatbot for customer service. Electron. Commer. Res. Appl. 2021, 50, 101098. [Google Scholar] [CrossRef]
  30. Borisoglebskaya, L.N.; Provotorov, V.V.; Sergeev, S.M.; Kosinov, E.S. Mathematical aspects of optimal control of transference processes in spatial networks. IOP Conf. Ser. Mater. Sci. Eng. 2019, 537, 042025. [Google Scholar] [CrossRef]
  31. Borisoglebskaya, L.N.; Provotorova, E.N.; Sergeev, S.M. Commercial software engineering under the digital economy concept. J. Phys. Conf. Ser. 2019, 1399. [Google Scholar] [CrossRef]
  32. Zhabko, A.P.; Shindyapin, A.I.; Provotorov, V.V. Stability of weak solutions of parabolic systems with distributed parameters on the graph. Vestn. Sankt-Peterbg. Univ. Prikl. Mat. Inform. Protsessy Upr. 2019, 15, 457–471. [Google Scholar] [CrossRef]
  33. Krasnov, S.; Sergeev, S.; Zotova, E.; Grashchenko, N. Algorithm of optimal management for the efficient use of energy resources. E3S Web Conf. 2019, 110, 02052. [Google Scholar] [CrossRef]
  34. Barykin, S.E.; Borisoglebskaya, L.N.; Provotorov, V.V.; Kapustina, I.V.; Sergeev, S.M.; De La Poza Plaza, E.; Saychenko, L. Sustainability of Management Decisions in a Digital Logistics Network. Sustainability 2021, 13, 9289. [Google Scholar] [CrossRef]
  35. Barykin, S.Y.; Kapustina, I.V.; Sergeev, S.M.; Kalinina, O.V.; Vilken, V.V.; De La Poza Plaza, E.; Putikhin, Y.Y.; Volkova, L.V. Developing the physical distribution digital twin model within the trade network. Acad. Strateg. Manag. J. 2021, 20, 1–18. [Google Scholar]
  36. Silkina, G.Y.; Shevchenko, S.Y.; Sharapaev, P.A. Digital innovation in process management. Acad. Strateg. Manag. J. 2021, 20, 1–25. [Google Scholar]
  37. Shabalov, M.Y.; Zhukovskiy, Y.L.; Buldysko, A.D.; Gil, B.; Starshaia, V.V. The influence of technological changes in energy efficiency on the infrastructure deterioration in the energy sector. Energy Rep. 2021, 7, 2664–2680. [Google Scholar] [CrossRef]
  38. Litvinenko, V.; Meyer, B. Syngas Production: Status and Potential for Implementation in Russian Industry; Springer: Heidelberg, Germany, 2017; ISBN 9783319709635. [Google Scholar]
  39. Filser, M.; Kraus, S.; Roig-Tierno, N.; Kailer, N.; Fischer, U. Entrepreneurship as catalyst for sustainable development: Opening the black box. Sustainability 2019, 11, 4503. [Google Scholar] [CrossRef] [Green Version]
  40. Gupta, R.; Mejia, C.; Kajikawa, Y. Business, innovation and digital ecosystems landscape survey and knowledge cross sharing. Technol. Forecast. Soc. Chang. 2019, 147, 100–109. [Google Scholar] [CrossRef]
  41. Kuckertz, A. Bioeconomy transformation strategies worldwide require stronger focus on entrepreneurship. Sustainability 2020, 12, 2911. [Google Scholar] [CrossRef] [Green Version]
  42. An, J.; Mikhaylov, A.; Jung, S.-U. A Linear Programming Approach for Robust Network Revenue Management in the Air-line Industry. J. Air Transp. Manag. 2021, 91, 101979. [Google Scholar] [CrossRef]
  43. Mikhaylov, A. Development of Friedrich von Hayek’s theory of private money and economic implications for digital currencies. Terra Econ. 2021, 19, 53–62. [Google Scholar] [CrossRef]
  44. An, J.; Mikhaylov, A.; Richter, U.H. Trade War Effects: Evidence from Sectors of Energy and Resources in Africa. Heliyon 2020, 6, e05693. [Google Scholar] [CrossRef] [PubMed]
Figure 1. Possible visualization of business echelons.
Sustainability 13 13929 g001
Figure 2. Possible visualization of the most cost-effective sequence of business echelons.
Sustainability 13 13929 g002
Table 1. Comparative analysis of the key economic indicators of China and Russia (on the basis of the data derived from https://take-profit.org/statistics/countries, accessed on 1 December 2021).
Indicator for ComparisonChinaRussia
Indicator ValuePeriodIndicator ValuePeriod
GDP volume, USD bln14,723year 20201484year 2020
GDP annual growth rate, %7.92 qrt of year 2021−0.71 qrt of year 2021
GDP growth rate, %1.32 qrt of year 2021−0.24 qrt of year 2020
GDP per capita, USD8405year 202011,787year 2020
Annual inflation rate, %1.1June 20216.5June 2021
Interest, %3.85July 20215.5June 2021
Unemployment rate, %52 qrt of year 20214.9May 2021
Salary, USD/month1201.123year 2019766.09April 2021
Table 2. Comparative analysis of the key trade indicators of China and Russia (https://take-profit.org/statistics/countries, accessed on 1 December 2021).
Indicator for ComparisonChinaRussia
Indicator ValuePeriodIndicator ValuePeriod
Current balance to GDP, %1.9year 20203.9year 2019
Trade balance, USD bln51.5June 202110.206May 2021
Cash flows, USD bln−71.11 qrt of year 202124.8691 qrt of year 2021
Exports, USD bln281.41 qrt of year 202119.9May 2021
International investment position, USD bln2400.8year 20204712 qrt of year 2021
International foreign exchange reserves, USD bln3214June 2021591.521June 2021
Imports, USD bln229.9June 202124.61May 2021
Table 3. Dynamics of the mutual trade between China and Russia in years 2010–2020, USD million (drafted according to https://take-profit.org/statistics/countries and https://russian-trade.com/statistics/by-country/china/export/2018/, accessed on 1 December 2021).
Indicators2014201520162017201820192020
Mutual trade turnover91,26563,54966,03486,975108,284110,918103,969
From Russia to China37,49228,60128,01238,91956,06656,79149,060
From China to Russia53,77334,94838,02248,05652,21854,12754,908
Table 4. Dynamics of development of e-commerce in China in years 2019–2020.
IndicatorsYear 2019Growth Rate, % by Year 2018Year 2020Growth Rate, % by Year 2019
E-commerce transactions volume (Yuan trln)34.816.70%37.24.50%
Domestic retail e-commerce volume (B2C+C2C) (Yuan trln)10.6316.50%11.7610.90%
Cross-border retail e-commerce volume (Yuan trln)-38.20%1.6931.10%
Number of express deliveries (bln)63.52325.30%83.35831.2%
Table 5. Level of organization of material flow promotion by business echelons.
Management QualityDecrement at N = 8Decrement at N = 12
Optimal performance level0.090.08
Good level of interaction0.1250.11
There are significant reserves of work organization0.20.16
Large losses in the process of passing business echelons0.350.24
Weak management0.440.28
Bad management0.550.33
Publisher’s Note: MDPI stays neutral with regard to jurisdictional claims in published maps and institutional affiliations.

