Article

The Temporal-Spatial Pattern and Coupling Coordination of the Green Transition of Farmland Use: Evidence from Hubei Province

1
College of Public Administration, Central China Normal University, Wuhan 430079, China
2
College of Public Administration, Huazhong University of Science and Technology, Wuhan 430074, China
3
College of City Construction, Jiangxi Normal University, Nanchang 330022, China
4
Institute of Real Estate, Jiangxi Normal University, Nanchang 330022, China
5
School of Public Administration, Huazhong Agricultural University, Wuhan 430070, China
*
Authors to whom correspondence should be addressed.
Sustainability 2021, 13(21), 11892; https://doi.org/10.3390/su132111892
Submission received: 1 October 2021 / Revised: 22 October 2021 / Accepted: 25 October 2021 / Published: 27 October 2021

Abstract

:
The green transition of farmland use is a future trend in China’s modern agriculture and green development. However, its research framework, including its evaluation system, temporal-spatial distribution, and driving mechanisms, has not been established in the existent literature. With the 17 cities in Hubei Province as an example, we evaluated the green transition of farmland use and explore the characteristics and driving mechanisms of the temporal and spatial evolution from 2000–2019. The findings were as follows: First, the green transition of farmland use in Hubei Province is in infancy, but it has great potential. Second, the growth rate of the green transition of farmland use has noticeable regional differences in the east, central, and western areas of the province. Third, the three dimensions of spatial transition, functional transition, and model transition in the green transition of farmland use have significant spatial differences in coupling and coordination, and decoupling is becoming increasingly prominent. Based on the research findings, we put forward targeted countermeasures and suggestions.

1. Introduction

The green transition of farmland use (GTFU) refers to the evolution of farmland functions, spatial patterns, and utilization models to a higher level, which are also the inherent requirements of green development, rural revitalization, and food security in modern-day China. Farmland use is an essential basis for the interaction and coupling of the human–land relationship in rural areas [1]. Under green development, farmland use focuses on changing from stable quantity to quality improvement and emphasizes the trinity of “Quantity, Quality and Ecology” [2]. GTFU is an effective measure to realize the coordinated development of farmland use and the environment [3]. The future development plan of China, the 14th Five Plan, also requires the in-depth implementation of sustainable development strategies, promoting a comprehensive green transition of economic and social development, and adherence to the strictest farmland protection system, which also urgently calls for GTFU.
China is currently facing significant challenges in terms of GTFU. There is no doubt that farmland use in China has progressed in utilization efficiency and production profit. However, farmland use in China shows characteristics of chemical fertilizers and the over-dependence pesticides, marginalization, extensive pollution, and intensification [4,5]. With China’s rapid industrialization and urbanization, the acceleration of economic development, and the continuous enhancement of human activities, the disorderly spread and expansion of the material space of urbanization and industrialization, the interaction and coupling between population, industry, and towns have been continuously strengthened. This process has led to rapid changes in the spatial layout of China’s urban and rural areas, industrial development structure, and rural geographic morphology. The accelerated flow of potential energy between urban and rural factors has led to problems such as the non-agricultural, non-grain, extensive, and marginal use of farmland [6,7]. Rural diseases such as the aging of farmers and the hollowing out of rural areas have become significant problems [1]. Moreover, the deterioration of the rural ecological environment and agricultural non-point source pollution frequently occur in most villages [8].
This phenomenon has aroused continuous attention from academia. The current research includes in-depth discussions on farmland use transition and farmland green use, but scholars have not yet combined the two dimensions and put forward the Green Transition of Farmland Use framework. The measurement of GTFU and the understanding of its spatial and temporal distribution pattern and coupling coordination would be of great help in solving the existing problems of farmland use in China. Thus, the one purpose of this research is to establish an evaluation framework and to evaluate the development of GTFU. Additionally, the research will then analyze the internal coupling and coordination relationship between the sub-systems of GTFU so as to explore the mechanisms of for its different development status.
Hypothesis 1. 
The development level of GTFU in the study area is significantly different in time and space and increases with the development of social economy.
Hypothesis 2. 
There are significant spatio-temporal differences in the coupling coordination of the internal subsystems of GTFU.
Focusing on the needs of green development, rural revitalization, high-quality agricultural development, and food security in China, the current research takes 17 prefecture-level cities in Hubei Province, China, in which the contradiction between cultivated land use and economic development is prominent, as the research area and evaluates GTFU from 2000 to 2019. This research will explore the temporal and spatial distribution of GTFU and its driving mechanisms based on the results of this evaluation. Moreover, at the same time, policy implications will provide a decision-making reference for the green transition policy system of farmland use in Hubei Province as well as in China and other world regions.

2. Literature Review

2.1. The Research about Farmland Use Transition

Farmland use transition (FUT) was born out of land-use transition and related research paradigms and research theories all originating from land-use transition. Farmland use transition refers to the change in the time series of a country’s (or region’s) farmland use. Its essence is one of the manifestations of land use/cover change (LUCC). It emphasizes the use of farmland that is compatible with the level of regional socio-economic development [9,10,11].
The existent research focuses on the transition forms, transition characteristics, dynamic mechanism, food security, and ecological environment of farmland use transition. (1) Transition forms: At present, there are two main ways to divide farmland use transition: one divides farmland use transition into spatial transition and functional transition [12]. The spatial transition includes the area change and landscape pattern change. Area change is characterized by remote sensing image technology and land transfer matrix technology [13]. Landscape pattern change is generally measured by indicators such as the landscape pattern index and farmland fragmentation [14]. Although scholars have identified significant differences in classifying farmland functions, we unify the main functions into three dimensions: production function, ecological function, and living function. At present, academia generally adopts methods such as the comprehensive evaluation of indicators [15], functional value, and functional property quality [16,17,18] to evaluate farmland functions. The other method divides the FUT into two types: recessive transition and explicit transition [11]. Recessive transition usually refers to the transition of quality, property rights, business methods, inherent input, and output capabilities, while explicit transition refers to the transition in quantity and spatial structure [14].
(2) Transition characteristics: Scholars mostly use satellite image interpretation data to characterize the transition characteristics of farmland use [19,20,21,22]. Some scholars use economic methods to describe these characteristics. Establishing an FUT evaluation system with geography and economic methods, Niu et al. [2] measured the FUT values and analyzed the spatial agglomeration characteristics of farmland use transition in the Huanghuaihai Plain.
(3) Driving mechanism: Scholars have engaged in fruitful and in-depth discussions on the dynamic mechanisms of farmland use transition. They believe that natural factors, input structure, output benefits, planting structure, transportation location and other micro-factors, population density, economic development, national policies, and macro-economic factors are the primary driving mechanisms for FUT [12,15,19,23,24,25,26,27]. For example, Song et al. believe that the current farmland use structure, input structure, planting structure, and economic development status affect farmland use transition [12]. Shi et al [25] found that natural factors are the basis for the transition of farmland use, socio-economic factors are the key driving force for the transition of farmland use, and Xu et al. [26] believed that the transportation location factor is also an essential spatial factor.
(4) The impacts on food security: Farmland is a fundamental land resource and a primary element to ensure food security. Scholars generally believe that the non-agriculturalization, non-grain, marginalization of farmland and agricultural pollution during farmland use profoundly affect food security [11,28,29,30,31,32,33,34]. For example, Sun used the coefficient of variation method to evaluate the “input indicators” of grain production, analyzed the spatiotemporal evolution of the coupling relationship between cropland use transition and food production, and concluded that the cropland use transition has a positive impact on food security [31]. Mailikai Aimaiti et al. have reached a similar conclusion in the research on the coupling relationship between farmland use transition and grain production in the oasis of the Yarkand River Plain [32].
(5) The impact on the ecological environment: The ecological system is closely related to the farmland use system. Scholars have conducted rich and in-depth discussions on the relationship between FUT and the ecological environment and believe that the current FUT has produced specific adverse effects on the ecological environment [25,34]. However, some scholars hold different views and believe that the transition of farmland use reduces emissions [34].

2.2. The Research about Farmland Green Use

Scholars have conducted extensive research on the connotation, actual conditions, and influencing factors of farmland green use: (1) Connotation: Regarding the connotation of farmland green use (FGU), academia has not yet formed a unified definition. The concept originated from the “green economy” and the “Global Green New Deal” proposed by the United Nations Environment Programme in 2008. Scholars often use the terms “green agriculture” or “green development of agriculture”.
However, judging from the existing literature, academia does not strictly distinguish between “farmland green use” and “green development of agriculture.” The two have a solid conceptual connotation, evaluation indicators, research methods, and control strategies. Farmland green use belongs to ecology and economics and can be an essential means to transform traditional farmland use with “green development.” Academia generally believes that farmland green use is a comprehensive, coordinated, and sustainable model, and its connotation is constantly becoming more enriched and developed [22,23,24,35,36].
(2) The situation evaluation: In measuring farmland green use, scholars generally use DEA methods to evaluate farmland green use from five dimensions: environmental friendliness, resource conservation, space-intensiveness, efficient output, and advanced technology [33]. In terms of the current situation being evaluated, academia generally believes that farmland green use in China is developing rapidly, but it is still relatively low [37,38]. Scholars have researched farmland green use efficiency and evolutionary regulations [39].
(3) Influencing factors: At the level of the factors affecting FGU, some scholars have constructed an evaluation system for farmland green use to grasp the development level and the influencing factors in a multi-dimensional and broad perspective. For example, Yu et al. believe that gender, age, herd mentality, soil fertility, and planting scale are the deep root causes of farmland green use [40]. Some scholars have also studied the impact of macro factors on farmland green use from the perspective of national strategy, agricultural policy, and technological innovation [38,41].
In conclusion, academia has conducted in-depth discussions around GTFU from forms, characteristics, mechanisms, and impacts, but the research on its transition model is still insufficient. Under green development, the ecological and green use of farmland will become the future trend of farmland use transition. The GTFU will become a research hotspot for farmland use transition in the future. To respond to significant strategic needs such as green development and ecological civilization, we have to design a set of scientific indicators to measure the outcome of GTFU and to further identify the temporal-spatial regulations and mechanisms of GTFU.

3. Data Sources and Methodology
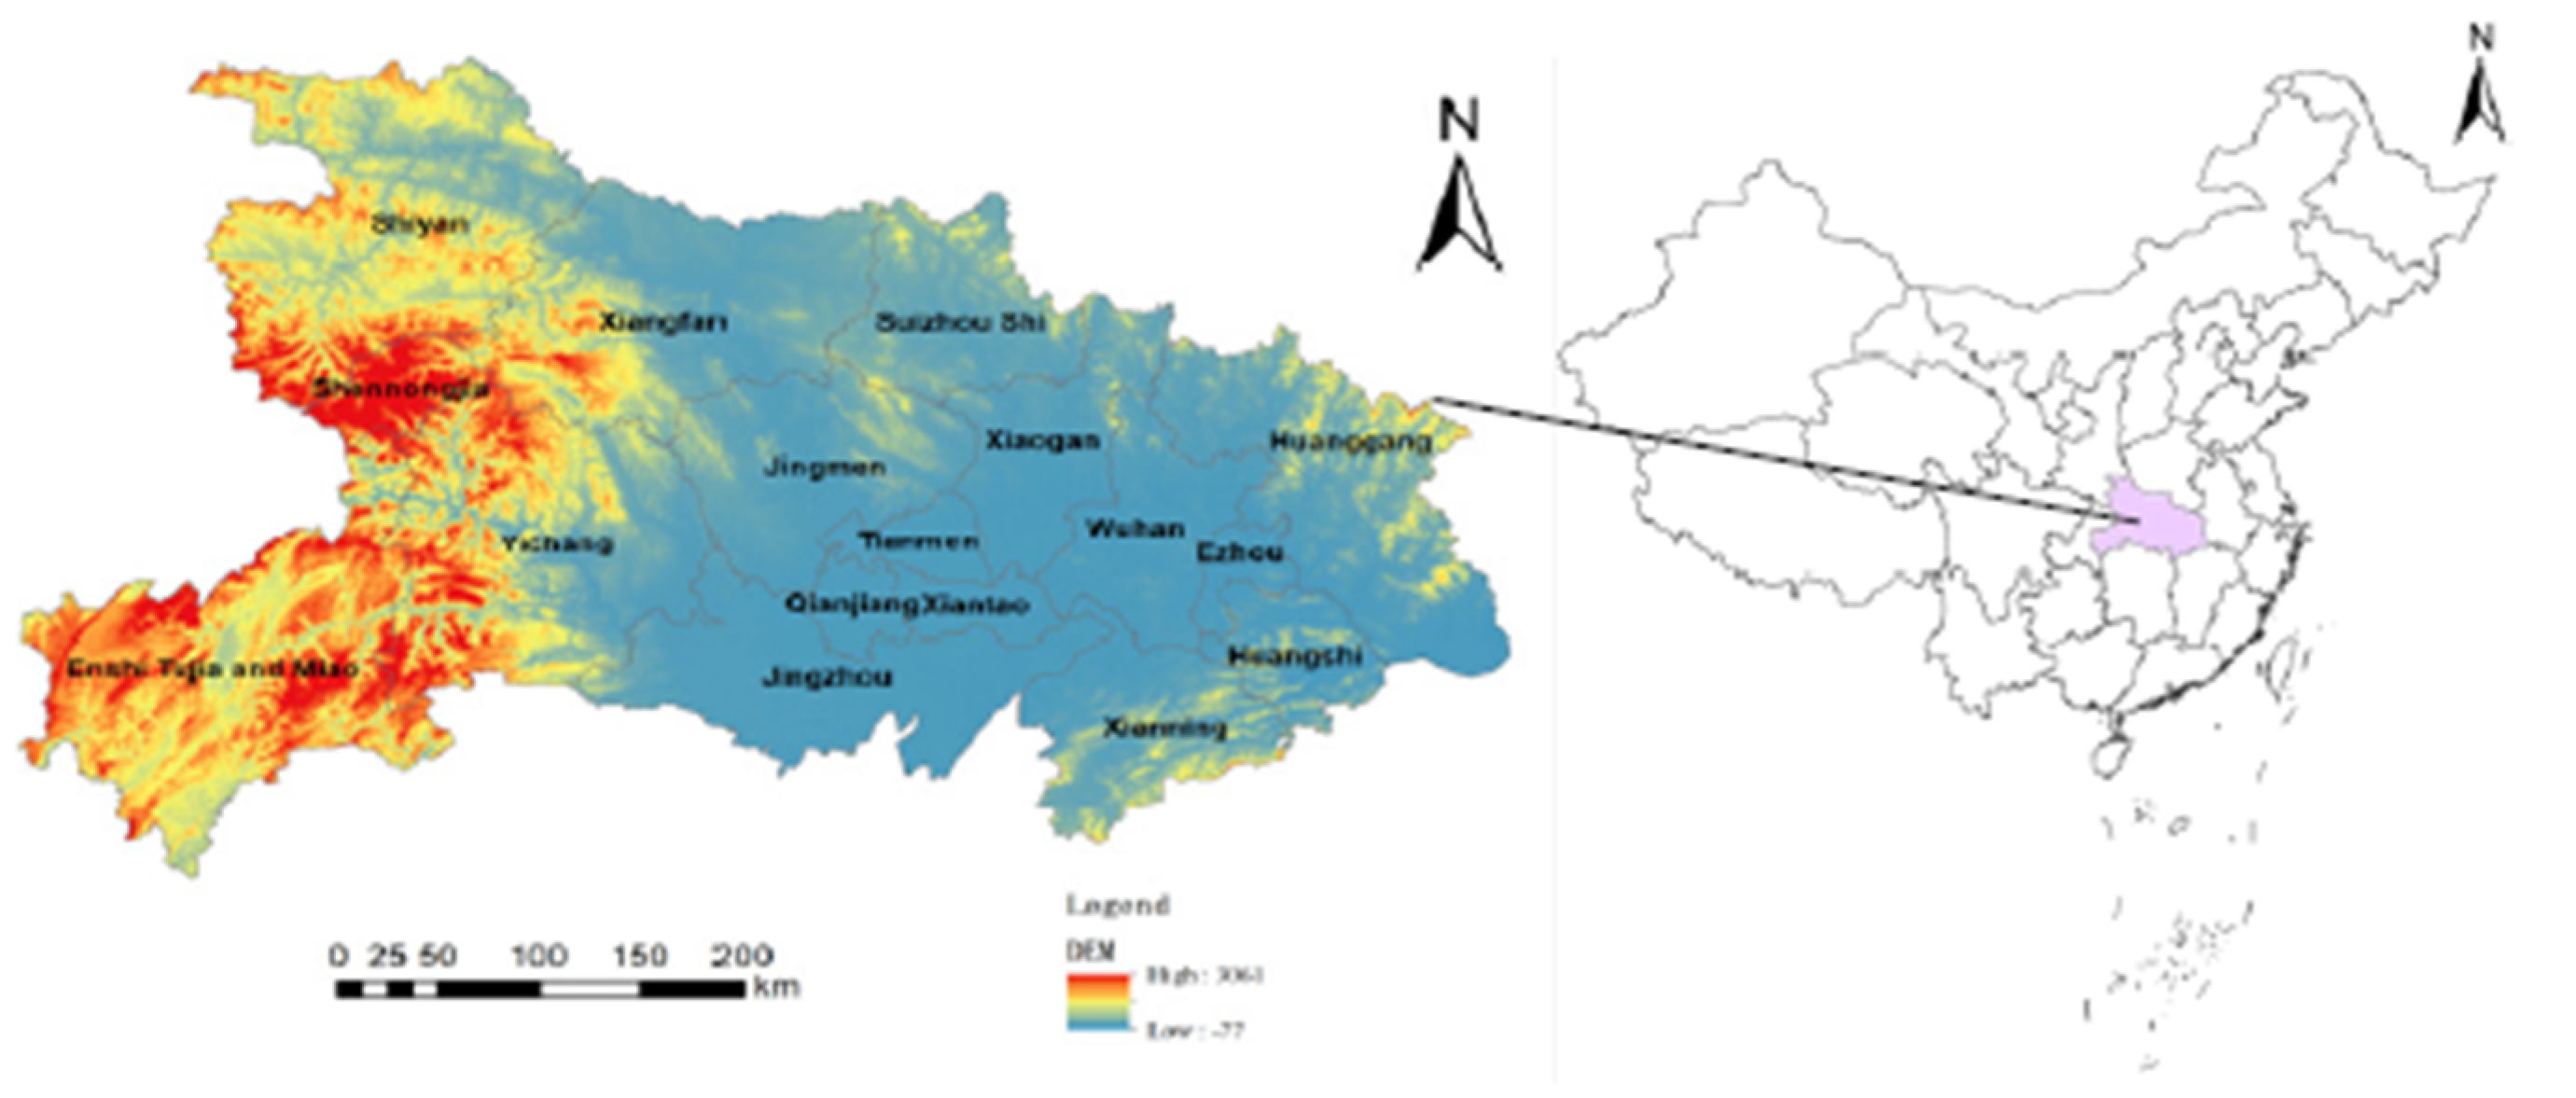
3.1. Research Area

Hubei Province is located in the central region of China. The terrain is roughly surrounded by mountains in the east, west, and north, with a low and flat middle and an incomplete basin that opens slightly to the south. In the province’s total area, mountains account for 56%, hills account for 24%, and plain lakes account for 20%. Hubei Province is located in the subtropical zone. With the exception of its alpine areas, most of the province has a subtropical monsoon humid climate [42]. Since the reform and opening up, farmland resources in Hubei have been inefficiently used and have been seriously lost, and the function of food production has been weakened [43]. GTFU has faced significant challenges. Given the important strategic position of Hubei Province and the uneven utilization of cultivated land, exploring the characteristics and possible reasons for the green transformation of farmland use in this region should be representative (Figure 1).

3.2. Data Sources

Land use data: The land use data used in this paper come from the interpretation data from Landsat TM (30 m), which was provided by the Chinese Academy of Sciences (2000, 2005, 2010, 2015, 2018), and the classification system is the current land use classification standard (GB/T21010-2007). We calculated the fragmentation degree of the farmland landscape and the area of farmland that has returned to forest and grassland environments based on the Landsat TM data.
Socio-economic data: The socio-economic data, mainly in Quality and Structure of spatial transition as well as the functional transition and model transition, come from the China Economic and Social Big Data Research Platform (https://data.cnki.net/, access on 24 October 2021). This type of data is annual data, which is the main data source for calculating GTFU, and the entropy method was used to calculate the weight and evaluation value.
Geodata: Geodata such as DEM come from the 1:4,000,000 databases of China’s National Basic Geographic Information System (http://nfgis.nsdi.gov.cn, access 24 October 2021). This type of data is mainly used to characterize the topographic information of the three regions in the east, middle, and west of Hubei Province and to analyze the regional differences in terms of coupling and coordination.
Due to part of the data being unavailable, we used interpolation and moving average methods to supplement the data [12,17].

3.3. Methodology

This research evaluates GTFU, identifying its coupling pattern, distribution, and driving mechanisms over spatial and temporal dimensions. The research methods adopted here are the entropy weight method and the coupling coordination degree model.

3.3.1. The Evaluation of GTFU

Combining existent literature [8,10,11,12,13,14,15,16,17,19,35,36,37,38,39,40,41] and comprehensively considering data availability and the difficulty of quantification, an evaluation index system was established under scientific, systematic, and hierarchical means (Table 1).
In detail, the spatial transition and functional transition indicators mainly refer to the existing indicator framework of Song and Long et al. [8,10,11,12,17,19] on FUT and the model transition indicators are summarized based on the existing indicators of GFU [35,36,37,38,39,40,41]. The above-mentioned indicator framework has been recognized and adopted by scholars, so we have adopted them selectively. Due to the overlap of a small number of indicators between the three dimensions, the merging was conducted under the premise of ensuring the integrity of the indicator system in the construction of the indicator framework (Table 1). Since the weight of each indicator is relatively small in the time calculation process, the result error caused by the merging operation is acceptable.
Spatial transition mainly measures the apparent morphological changes of farmland use from quantity, structure, and morphology. Functional transition mainly measures the recessive farmland changes from production function, living function, and ecological function. Model transition focuses on green development to measure the green utilization of farmland from the dimensions of resource conservation, environmental friendliness, space intensiveness, and advanced technology.
We used the entropy weight method to calculate the weight and the evaluation scores of GTFU. The main steps are as follows:
Data standardization: There are differences in the dimensions and magnitudes of the GTFU indicators, and the positive and negative signs of the indicators and the indicator data need to be standardized. the positive and negative indicators should be standardized separately.
Positive indicator:
X i j = ( X i j min X j ) / ( max X j min X j )
Negative indicator:
X i j = ( max X j X i j ) / ( max X j min X j )
Calculate the ratio of
X i j :   Y i j = X i j / i = 1 m X i j
Calculate the information entropy:
e j = k i = 1 m ( Y i j × L n Y i j )
k = 1 L n m , 0 e j 1 , and when Y i j = 0 , then Y i j × L n Y i j = 0
Calculate information redundancy:
d j = 1 e j
Calculate the weights:
w i = d j / j = 1 n d j
Calculate the evaluation values:
U i = w i × X i j
X i j , X i j are the original and standardized value of indicator j in a specific i year, and min X j , max X j are the minimum and maximum values of the indicator j in all years, respectively. m is the number of research years, and n is the number of indicators. The weight and the standardized index value are multiplied to obtain the evaluation value of the index in a specific year.

3.3.2. Coupling Pattern of GTFU Evolution

In this paper, the coupling and coordination degree model was used to measure the coupling and coordination effects of the three dimensions of the GTFU. The main reason for adopting the coupling coordination degree model is to measure the coupling and coordination effects of space transition, function transition, and mode transition in GTFU, by focusing not only on mutual restriction but also on the quality of the coordination between the three principal layers and because adopting coupling coordination model is scientifically reasonable.
The main steps are as follows:
C = U 1 × U 2 × × U n ( U 1 + U 2 + + U n n ) n n
T = α 1 U 1 + α 2 U 2 + α n U n
U i represents different GTFU evaluation results in Equation (7). C, T are the overall coupling degree, the comprehensive coordination degree. α i represents the weights.

4. Result and Analysis

4.1. The Temporal-Spatial Characteristics of GTFU Evolution

Regarding the weights, the current indicator that has the most significant impact on GTFU in Hubei Province is grain production per capita, which essentially reflects that food security is still the core function of the use of farmland in Hubei Province at this stage (Table 1). It is closely related to the current primary national conditions in Hubei and even those in China. From the perspective of the principal layer, the spatial transition has the lowest weight, only 0.144, the model transition has a weight of 0.1712, ranking second, and the functional transition has a weight of 0.6848, which is much higher than the weight of the other two dimensions. Even without considering the weight of grain production per capita, the weight of the functional transition reaches 0.2014, and the weight is still the highest. This shows that functional transition has the greatest impact on GTFU at the current stage and that the promotion of GTFU development should start with functional transition.
Based on the weights, we calculated the evaluations of GTFU from the temporal and spatial dimensions to observe the characteristics of GTFU. The results are discussed below.

4.1.1. The Temporal Pattern of GTFU Evolution

The entropy method was used to calculate the GTFU development level in various cities in Hubei Province from 2000 to 2019, and the results are shown in Table 2. The measurement results show that GTFU in Hubei Province exhibited two prominent characteristics in the studied period. First, the overall GTFU evaluation value was relatively low, as most evaluations were no more than 0.25. Due to the lack of scientific and reasonable comparison standards, it is hard to judge the GTFU development status. Thus, we use the average level of Hubei Province as the evaluation standard to evaluate the GTFU development in various cities.
From 2000 to 2019, the evaluation results for Qianjiang, Shiyan, Jingmen, Huanggang, and Enshi were higher than the average level of Hubei Province. (Table 2). Cities with higher-than-average GTFU evaluations are distributed in the mountainous and plain areas of Hubei Province, and they do not show prominent agglomeration characteristics.
Second, the GTFU evaluation value shows a clear increasing trend over time. We calculated the annual growth rates of the three dimensions of the evaluation values fir spatial transition, function transition, and model transition according to Table 1 and plotted the density curve (Figure 2). Figure 2a shows that the kurtosis coefficient of the annual growth rate of spatial transition is close to 3, a normal distribution. The growth rate of the spatial transition is mainly distributed between −0.11–0.10. The average growth rate is 0.04, the standard deviation is 0.25, and the skewness coefficient is more significant than 0.98, indicating that the overall spatial transition from 2000 to 2019 has shown a growth trend. The result of the spatial transition shows that the transition of functions of various cities in Hubei Province is quite different, which is inseparable from the considerable difference in the geographical environment of “mountains-plains-low hills” from west to east Hubei Province.
Figure 2b shows that the growth rate of the GTFU function transition in Hubei Province is highly concentrated and is mainly clustered between 0.02 and 0.11, with a skewness coefficient as high as 72. A few cities have higher growth rates and fewer outliers. Nevertheless, the difference is significant, resulting in the density curve showing “sharp peak and fat tail” characteristics. The functional transition mainly reflects the changes in the production, life, and ecological functions of farmland. The high degree of agglomeration indicates that the use of farmland in various regions of Hubei Province is showing a solid balance, which is inseparable from the implementation of agricultural policies and the extensive use of science and technology.
The characteristics of the density curve of the model transition are similar to those of the spatial transition (Figure 2c). However, the density value is higher than the spatial transition value. The growth rate is distributed to the right of 0, indicating that the model transition is in a continuous growth trend that is inseparable from China’s ecological civilization construction and agricultural modernization strategy.

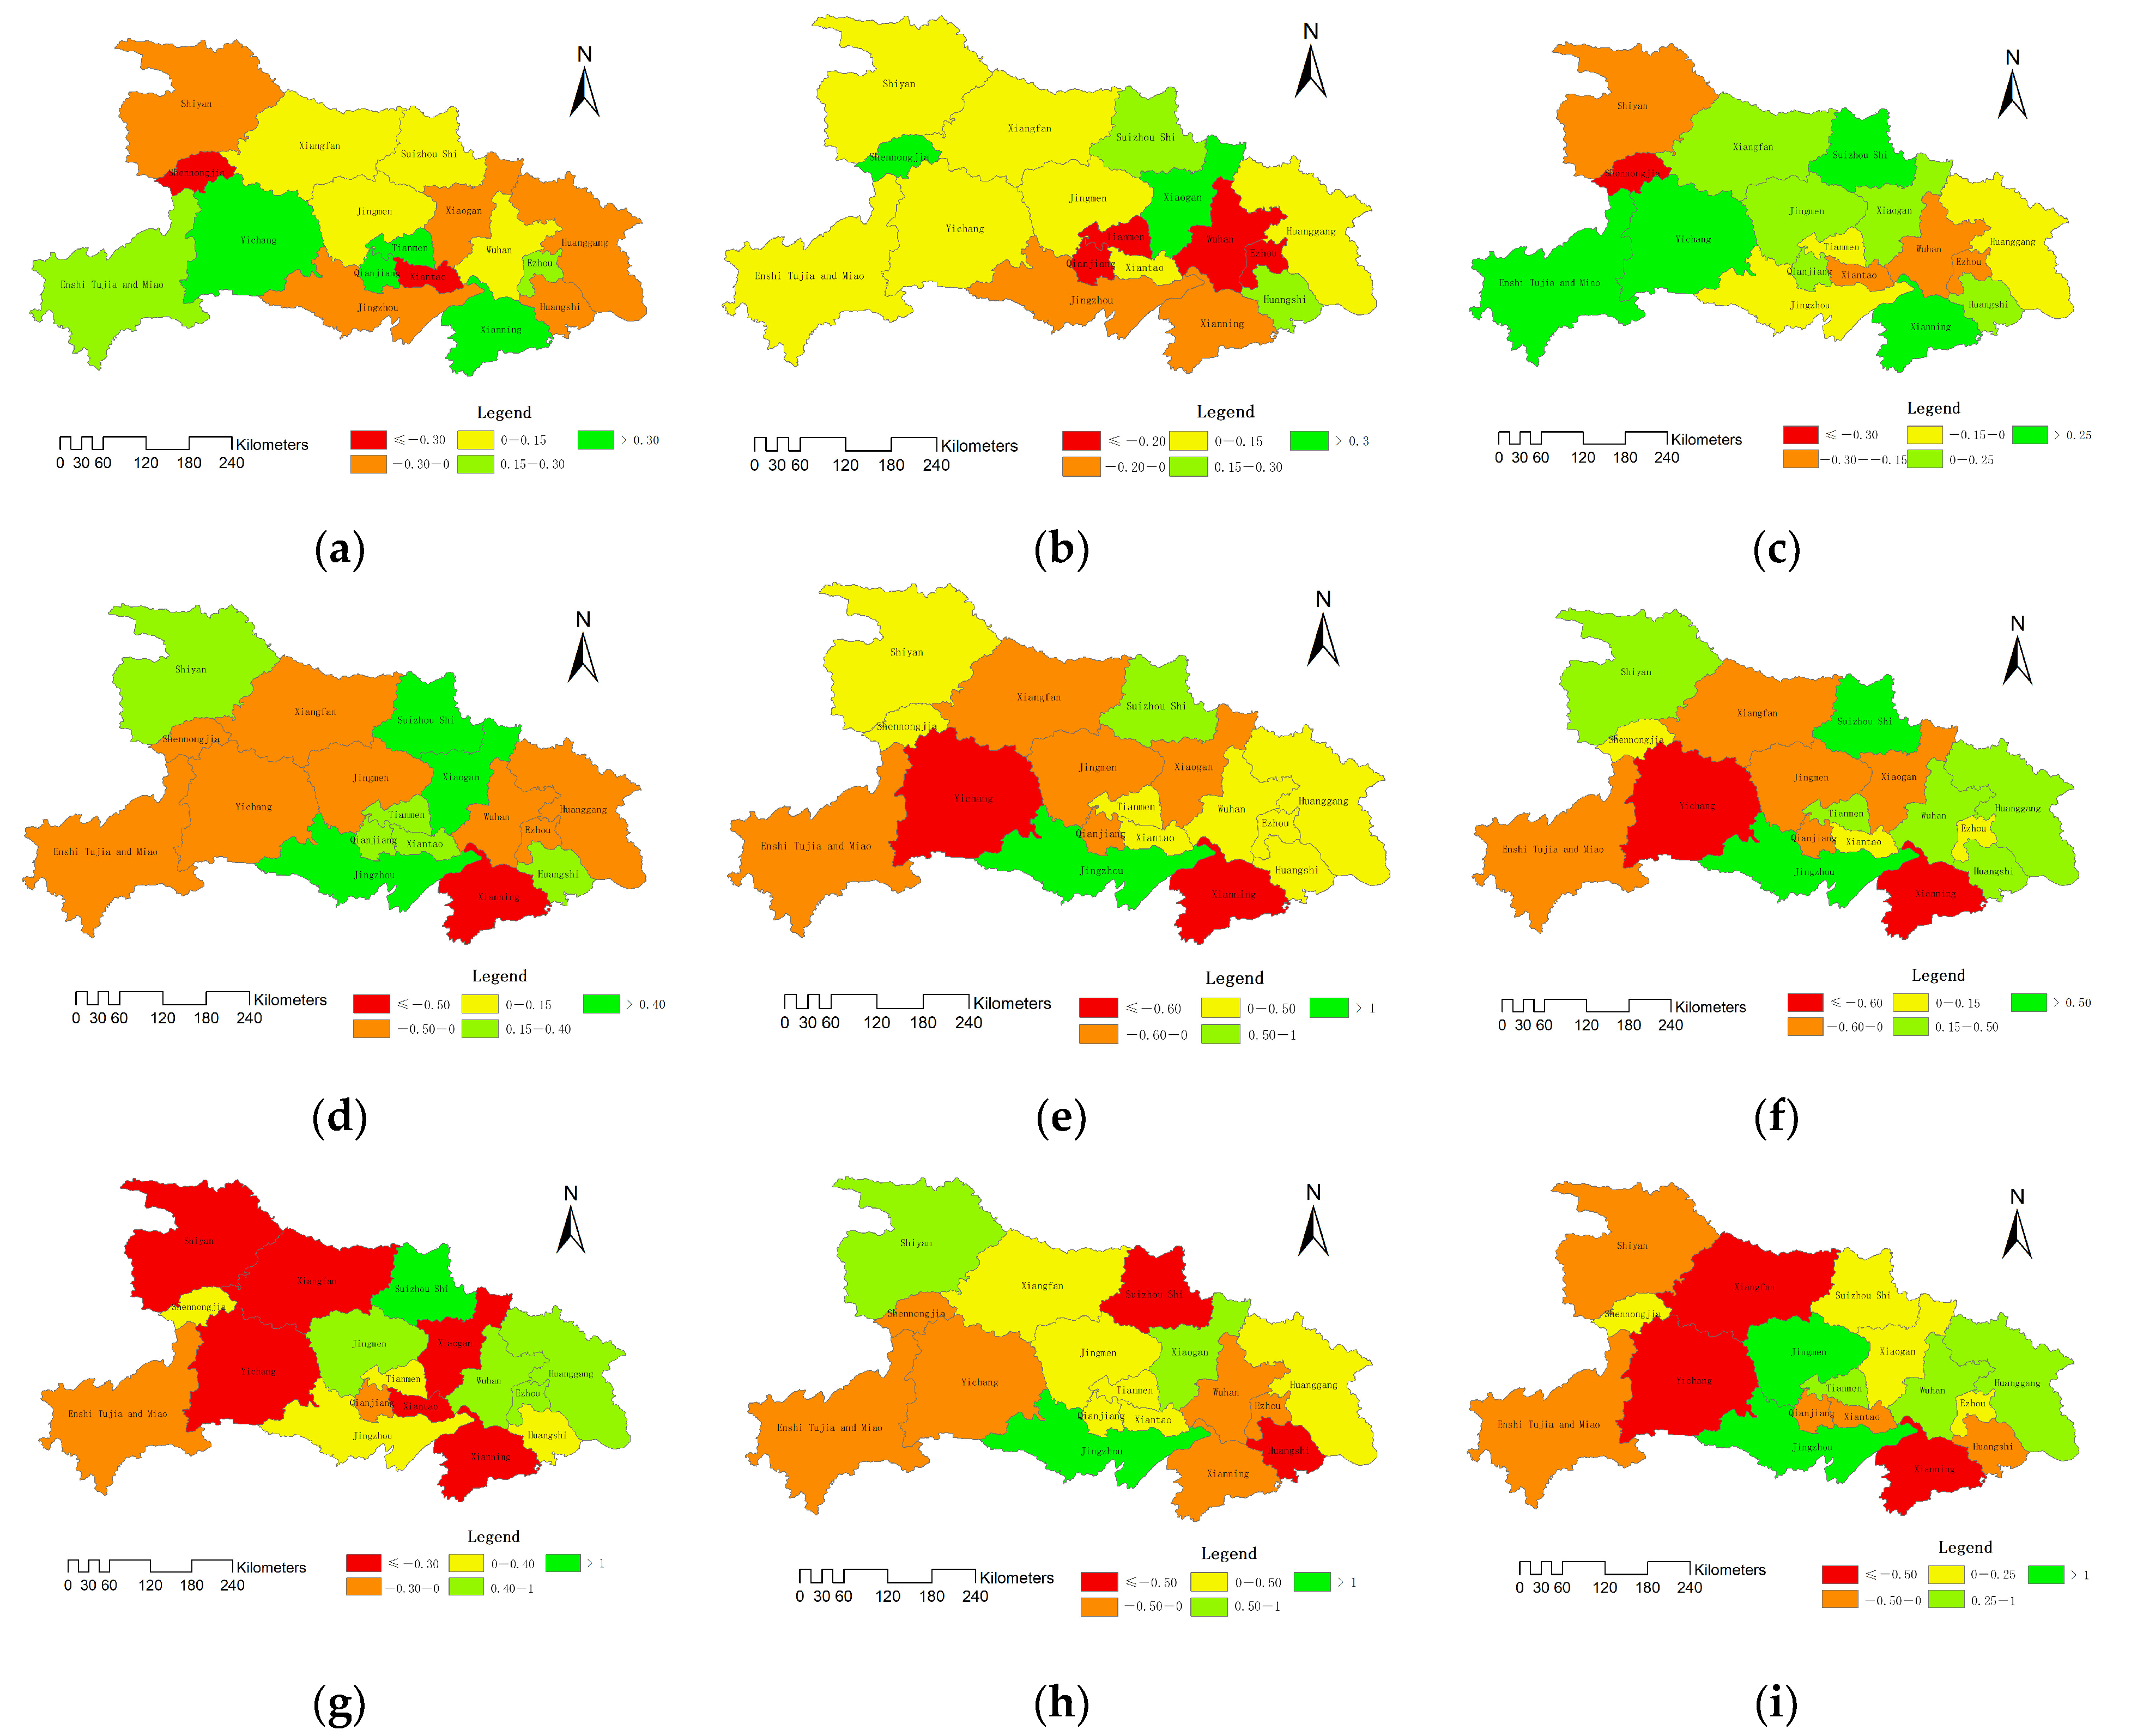
4.1.2. The Spatial Pattern of GTFU Evolution

We used ArcGIS to create a spatial distribution map of the GTFU growth rate spatial transition, functional transition, and model transition in the three phases of 2000–2010, 2010–2019, and 2000–2019.
(1) Spatial transition: The spatial transition shows apparent differences between the east and the west. Figure 3a–c show that the growing area (i.e., the growth rate is positive) is mainly in the west and the central area, and it grows fast. The decreasing region (i.e., the negative growth rate) is mainly in the east and the southeast in the period from 2000 to 2019.
The possible reasons for this are as follows: The spatial transition mainly reflects the quantity, structure, and form of farmland. Because the western and central regions are the prominent precipitation-producing areas in Hubei Province, agricultural mechanization and modern agriculture have made substantial progress in the past 20 years in these areas. The improvement of regional farmland utilization efficiency, farmland planting structure, and large-scale agricultural operation have become the primary drivers for spatial transition growth. On the contrary, rapid urbanization in eastern cities has occupied a great deal of arable rural land, which has further caused the per capita farmland area to decline. The sown area of low-profit food crops has decreased, and farmland fragmentation is more severe than before. Therefore, the spatial transition evaluation has declined slightly and is unstable.
(2) Functional transition: The decreasing regions are mainly in the west and the central parts of the province, while the growing areas are mainly in the east (Figure 3d–f). Since the functional transition mainly reflects farmland changes in the production, ecological, and living functions, this index reflects the continuous increase in farmland function in the eastern part and the continuous decline of farmland function in the western regions. This phenomenon is related to the principal value growth of farmland under urbanization. In the east, the integration of agricultural planting and ecological tourism, the rapid increase in the total output of the planting industry, and the ecological value in the eastern region are the most critical drivers for functional transitions. In the west and central areas, farmland is still dominated by traditional crops, and the functions of tourism, income growth, and ecological protection have not yet been fully utilized.
(3) Model transition: The model transition change rate mainly reflects environmental friendliness, technological level, space utilization, and resource conservation in terms of farmland use. In this regard, there are apparent differences between the eastern and western parts of Hubei Province (Figure 3g–i). The model transition index of the eastern region is in a state of continuous growth, which may be close to Wuhan and the development of Wuhan urban agglomeration. Affected by the radiation of Wuhan’s science and technology, talents, capital, the industrial layout of the eastern cities has been optimized, agricultural tourism has developed rapidly, and the level of agricultural technology and the ecological environment has been improved. The continuous deterioration of the functional transition of farmland in the western region is related to precipitation. This part of the province is mostly mountainous and hilly, making it not suitable for the large-scale promotion of agricultural technology. However, there may be more reasons for the continuing deterioration that need to be further explored.

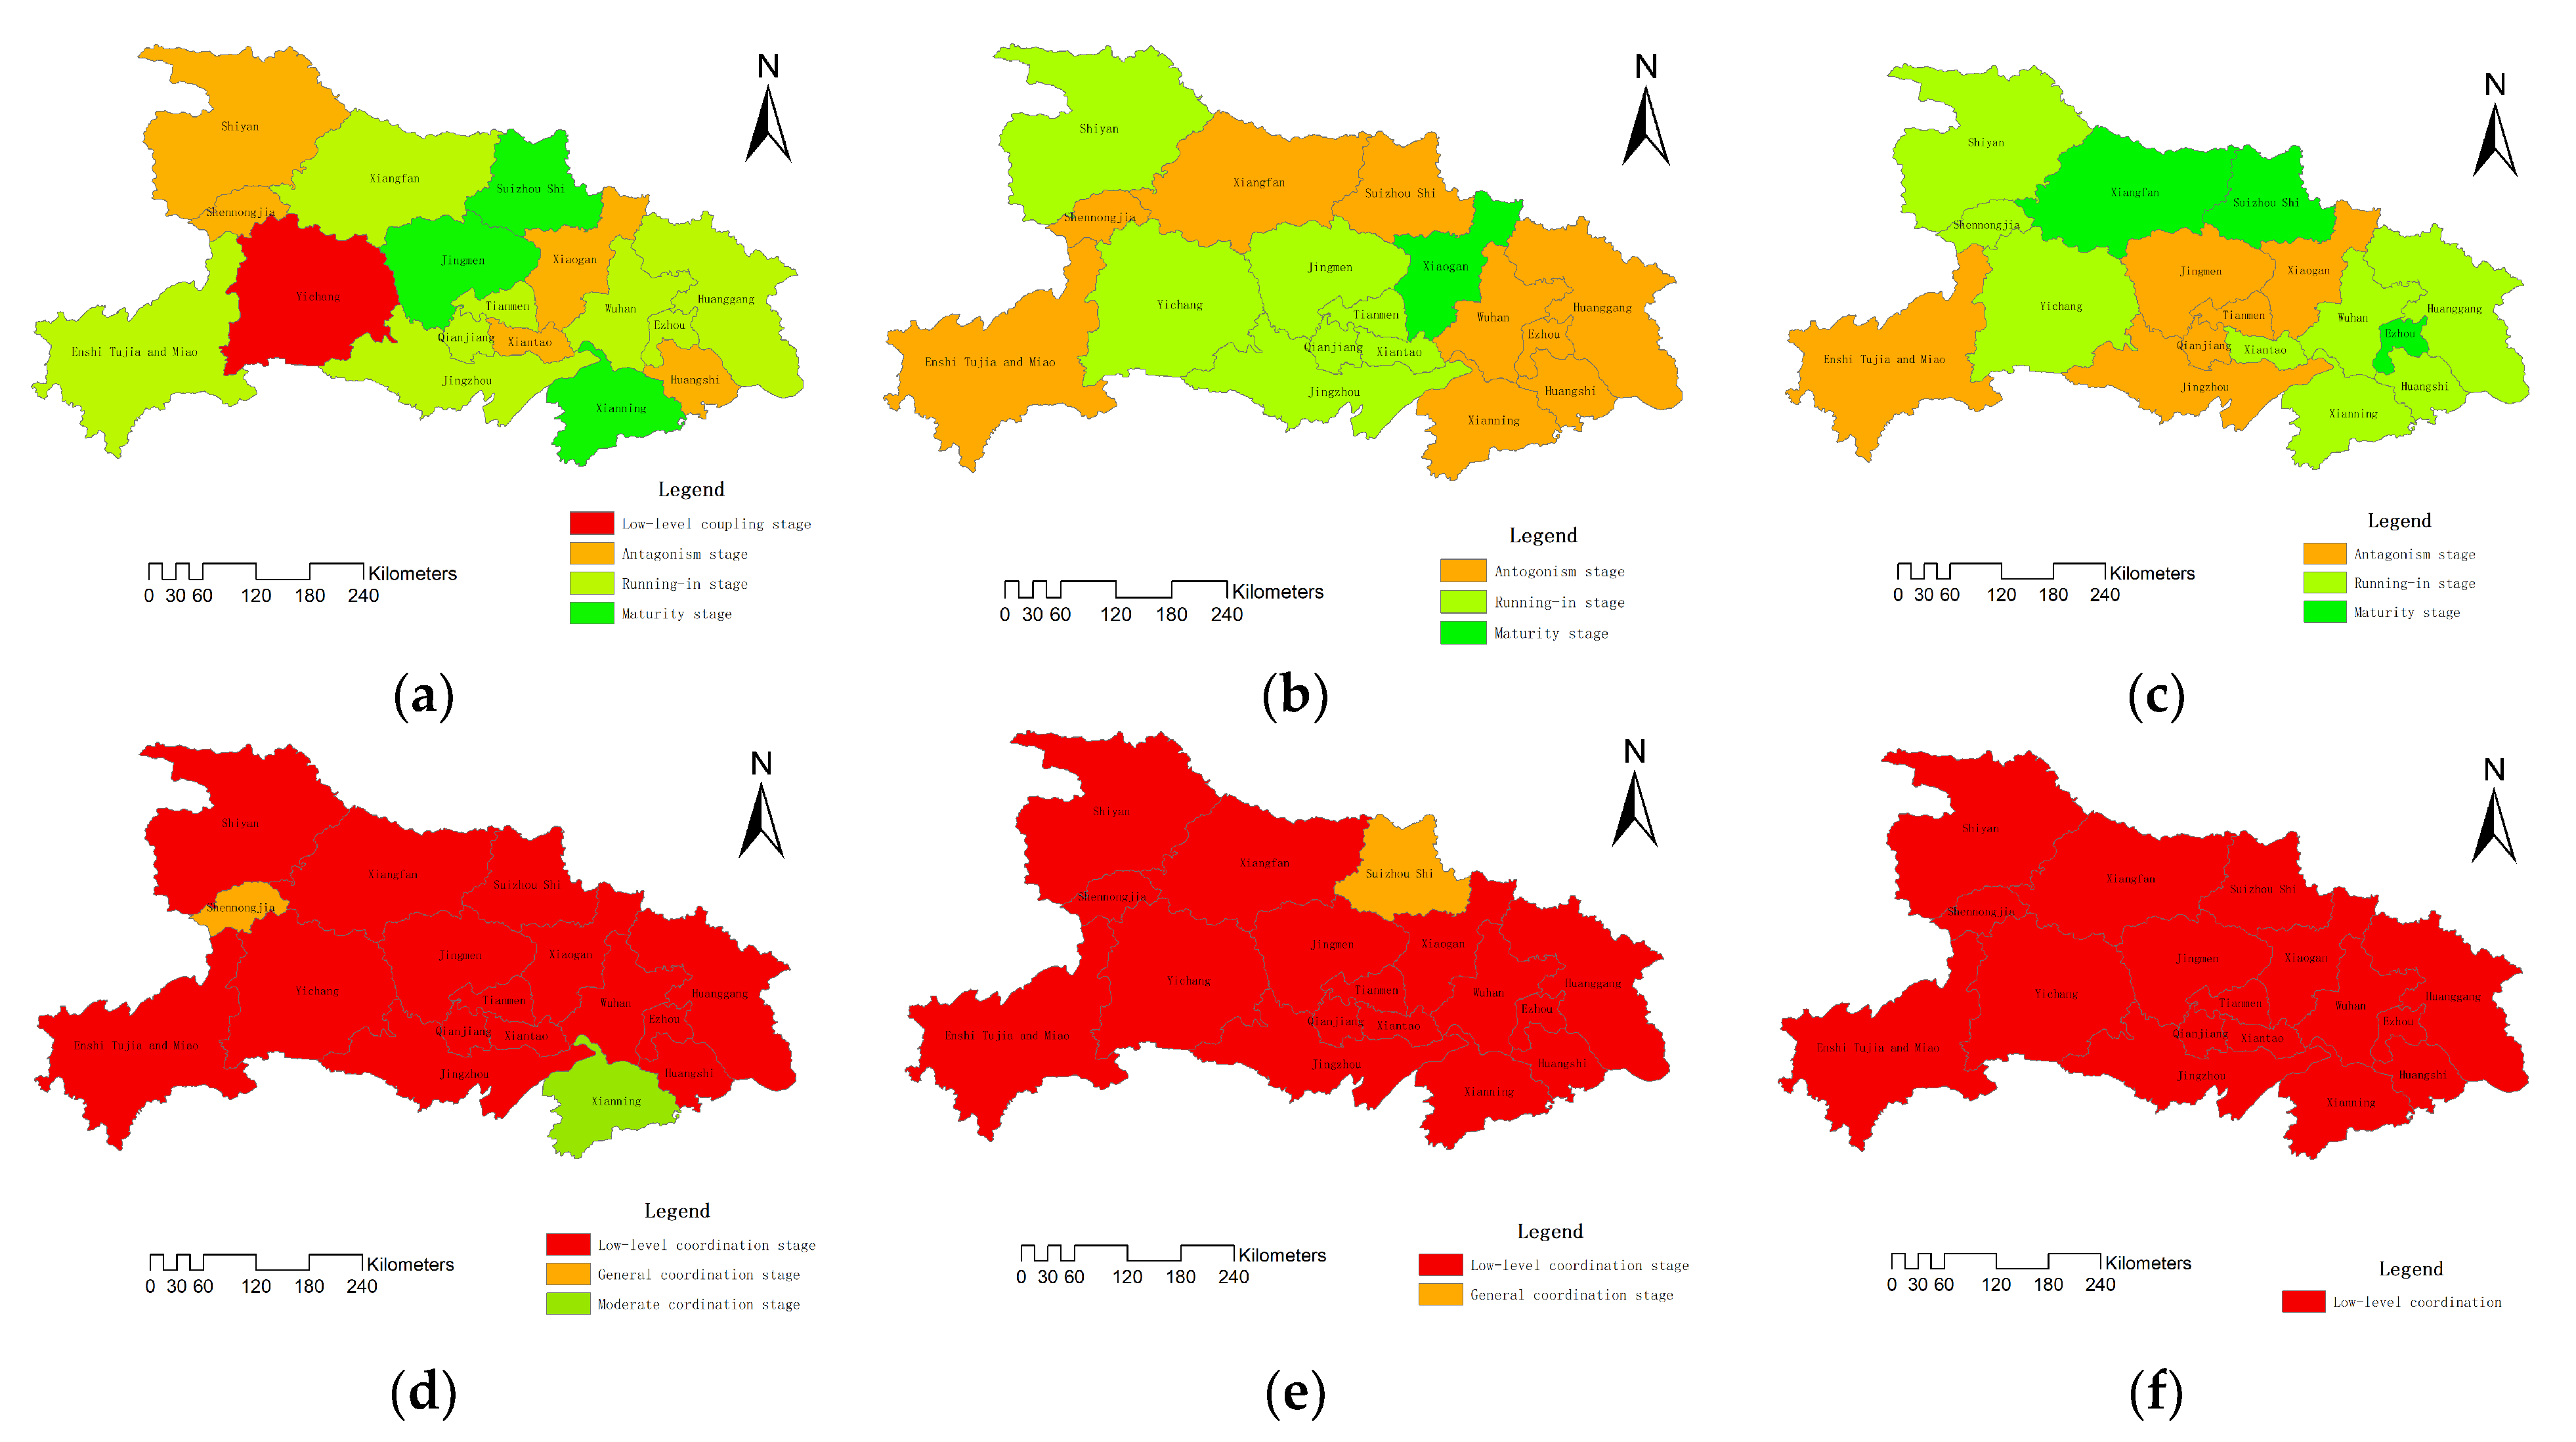
4.2. Coupling Characteristics of Farmland Spatial, Functional, Model Transition

The coupling degree refers to the degree of interaction among the spatial, functional, and model transitions. In contrast, the degree of coordination refers to the degree of benign coupling in the interaction, reflecting the quality of coordination, and can indicate whether each function promotes each other at a high level or if it is a low level of mutual reprecipitation. Adopting the coupling coordination model, we calculated the coordination and coupling values among the spatial, functional, and model transitions and present the data from the years 2000, 2010, and 2019 in Figure 4.
On the whole, the results of the coupling degree (2000, 2010, and 2019) show a higher coupling degree in the spatial transition, functional transition, and model transition in 2000, 2010, and 2019 (Figure 4a–c). The overall interaction is relatively strong, and there is a gradually increasing trend over time. Regarding regional distribution, the regions with a high coupling degree (Running-in stage, Maturity stage) in 2000 were mainly in the central and eastern areas of the province. In 2010, they were mainly in the central part of Hubei. In 2019, there was an eastward- and northward-moving trend.
On the other hand, compared to the coupling degree, the coverage area of the coordination degree of the corresponding value interval has been dramatically reduced, and the low-value area has increased significantly. The coordination index shows that the spatial transition, functional transition, and model transition from 2000 to 2019 were basically in a low-level coordination situation (Figure 4d–f), indicating that the three are restricting each other and that the benign interaction is weak.
The possible reason for this is as follows: Abundant arable land resources and improved agricultural modernization have gradually increased the economic, production, and ecological functions of arable land. More attention has been paid to environmental protection and technological progress in terms of farmland use. The model transition index has also improved. However, a large amount of farmland has been occupied under urbanization. The area of farmland per capita has continued to decrease, farmland fragmentation has become more serious, and the coordination of GTFU has shown a downward trend. The data can also prove the continued deterioration of farmland fragmentation. In 2000, the standardized value of the average farmland landscape fragmentation in Hubei Province was 0.0212. In 2019, the value was 0.0251.

5. Conclusions and Policy Implications

5.1. Conclusions

This research takes 17 prefecture-level cities in Hubei Province, China, as the research area, evaluates the GTFU historical and current development situations from 2000 to 2019, and then explores the temporal and spatial distribution of GTFU and its driving mechanisms. The main conclusions are as follows:
(1) The GTFU in Hubei Province is in its infancy, but it has great potential. The total evaluation value of GTFU is low, but GTFU shows a slow-growth trend over time.
(2) The evolution rate of GTFU has noticeable regional differences: (a) Overall GTFU: Cities with a higher-than-average GTFU assessment are distributed in the mountainous and plain areas of Hubei Province, and they do not show prominent agglomeration characteristics. (b) Space Transition: The decreasing region in terms of GTFU growth rate is gradually shrinking over time, and the western cities have a faster growth rate than the eastern cities do, and the growth rate is relatively stable. The eastern cities have a downward trend in terms of the spatial transition growth rate. (c) Functional transition: The decreasing regions are mainly in the west and in the central parts of the province, while the growing regions are mainly in the east. (d) Model transition: Rapid growth can be observed in the eastern and central regions, and slow growth can be observed in the western regions.
(3) The three dimensions of GTFU have significant spatial differences in terms of coupling and coordination, and the phenomenon of decoupling is becoming increasingly prominent. The three types of transitions have a high degree of coupling but poor coordination. The high-value coupling and coordination areas are primarily in underdeveloped rural areas. Driven by high-speed urbanization and industrialization, the highly developed areas of modern agriculture have gradually shifted from a highly coupled state of coordinated development of space, function, and model to a low degree of coordination over time.
Compared to existing research, the current GTFU research emphasizes the spatial form transition and functional transition of farmland use. There is insufficient research on the transition of farmland use mode, and few scholars have integrated the two from the perspective of GTFU [17,18,19,20,21,22,23,24,27,28,29,30,31,32]. This is the innovation of this research, and it is also a useful discussion. In addition, existing research does not discuss the level of the coupling relationship between the GTFU internal subsystems but rather focuses more on the overall level of GTFU to explore its time and space differences [15,16,17,18,19], which is not conducive to our in-depth understanding of how to coordinate the development of internal GTFU subsystems. This paper has conducted a preliminary discussion on this aspect and found coupling and correlation changes in internal GTFU subsystems under different time and space conditions.

5.2. Policy Implications

(1) The spatial transition, functional transition, and model transition of GTFU in Hubei Province have grown slowly under urbanization and industrialization. However, the demand for the sustainable transition of farmland utilization in economic and social development has continued to increase. Therefore, it is necessary to fully understand the law and driving mechanisms of farmland transition, explore the weakening trend of GTFU, and activate the development momentum of agricultural modernization and industrialization. Thus, this research will help to promote the transition and upgrading of traditional agriculture, enhance the endogenous development momentum, increase agricultural output, and accommodate employment benefits.
(2) The utilization and management of farmland should be guided by the dominant needs of people at different levels of social and economic development. GTFU has shifted from the spatial transition and functional transition during low socio-economic periods to model transition during the rapid development of non-agricultural industries. Various transitions between various cities in Hubei Province have strong coupling but lack coordination. The primary land supply mechanism, planning, and decision-making mechanism should be improved. Landscape design and ecological design should be conducted to strengthen the scientific and technological level of farmland use and intensive use. Arable land should be protected, and sustainable uses for arable land should be realized and determined.
(3) GTFU evolution has prominent regional differentiation characteristics. Differentiated and diversified farmland utilization and management from developed urban areas to underdeveloped traditional agricultural areas have been implemented to optimize the layout of this transition. Developed urban areas have a massive demand for urbanization and industrialization. We must change our knowledge and protect regional ecological security. It is necessary to shift from developing ecological agriculture and organic agriculture to internalize the external cost of farmland loss, strengthening the ecological protection of farmland, and realizing the model transition and function transition of farmland use. For underdeveloped rural areas, it is necessary to advocate for the development of modern agriculture while improving the economic benefits of farmland and increasing its labor absorption capacity to realize the coordinated development of the farmland space, function, and development model.

Author Contributions

Conceptualization, methodology, and writing—original draft and editing, S.K.; funding acquisition, S.K. and K.G.; project administration and supervision, X.L. and K.G.; data curation, resources, software, and visualization, Y.W. and D.C.; writing—review and editing, S.K. and H.C. All authors have read and agreed to the published version of the manuscript.

Funding

This research was funded by the “Ministry of Education of the People’s Republic of China” (grant number: 21YJC790056), the “Jiangxi Provincial Association of Social Sciences” (grant number: 20GL37), and the “Education Department of Jiangxi Province” (grant number: GJJ191710).

Institutional Review Board Statement

Not applicable.

Informed Consent Statement

Not applicable.

Data Availability Statement

The data presented in this study are available upon request from the first author.

Conflicts of Interest

The authors declare no conflict of interest.

References

  1. Liu, Y. New-Type Urbanization should Treat “Rural Diseases”. Available online: http://opinion.people.com.cn/n/2013/0910/c1003-22864768.html (accessed on 24 October 2021).
  2. Niu, S.; Fang, B.; Cui, C.; Huang, S. Analysis of the temporal and spatial pattern and path of cultivated land use transformation from the perspective of rural revitalization: Taking Huaihai Economic Zone as an example. J. Nat. Resour. 2020, 35, 1908–1925. [Google Scholar]
  3. Yu, F. Research on the motivation, core, and countermeasures of green agricultural development in the new era. China Rural. Econ. 2018, 5, 19–34. [Google Scholar]
  4. Kong, X. How to Scientifically Understand the Problem of Cultivated Land Rotation and Fallow. Available online: http://www.360doc.com/content/16/0408/23/30626326_549086084.shtml (accessed on 24 October 2021).
  5. Kong, X. China must protect high-quality arable land. Nature 2014, 506, 7. [Google Scholar] [CrossRef]
  6. Li, H.; Wu, Y.; Huang, X.; Sloan, M.; Skitmore, M. Spatial-temporal evolution and classification of marginalization of farmland in the process of urbanization. Habitat Int. 2017, 61, 1–8. [Google Scholar] [CrossRef] [Green Version]
  7. Long, H.; Tu, S.; Ge, D.; Li, T.; Liu, Y. The allocation and management of critical resources in rural China under restructuring: Problems and prospects. J. Rural. Stud. 2016, 47, 392–412. [Google Scholar] [CrossRef] [Green Version]
  8. Liu, Y. Research on the geography of rural revitalization in the New Era. Geogr. Res. 2019, 38, 461–466. [Google Scholar]
  9. Long, H. Land Use Transition: A New Approach to Comprehensive Research on Land Use/Cover Change. Geogr. Geo-Inf. Sci. 2003, 1, 87–90. [Google Scholar]
  10. Long, H.; Li, X. Farmland transition and land consolidation in China: Research progress and framework. Adv. Geogr. Sci. 2006, 5, 67–76. [Google Scholar]
  11. Long, H. On the transformation of land use and the development of rural transformation. Adv. Geogr. Sci. 2012, 31, 131–138. [Google Scholar]
  12. Song, X.; Li, X. Theoretical explanation and demonstration of the transformation of regional cultivated land use function. Acta Geogr. Sin. 2019, 74, 992–1010. [Google Scholar]
  13. Zhang, W.; Lu, X.; Shi, Y.; Sun, P.; Zhang, Y. Characteristics of land use transition map in the Yellow River Basin. China Land Sci. 2020, 34, 80–88. [Google Scholar]
  14. Lu, X.; Tang, Y.; Yi, J.; Jiang, X. Research on the impact of farmland use transformation on agricultural economic growth based on spatial econometric models. China Land Sci. 2019, 33, 53–61. [Google Scholar]
  15. Zhang, Y.; Long, H.; Ge, D.; Tu, S.; Qu, Y. The temporal and spatial characteristics of the evolution of cultivated land functions in the Huanghuaihai Plain and its driving mechanism. Acta Geogr. Sin. 2018, 73, 518–534. [Google Scholar]
  16. Cai, Y. The Relationship between Agricultural Land Ecology and Agricultural Land Value; Science Press: Beijing, China, 2010. [Google Scholar]
  17. Song, X.; Wu, Z.; Ouyang, Z. China’s farmland function changes since 1949. Acta Geogr. Sin. 2014, 69, 435–447. [Google Scholar]
  18. Foley, J.; DeFries, R.; Asner, G.; Barford, C.; Bonan, G.; Carpenter, S.R.; Chapin, F.S.; Coe, M.T.; Daily, G.C.; Gibbs, H.K.; et al. Global consequences of land use. Science 2005, 309, 570–574. [Google Scholar] [CrossRef] [Green Version]
  19. Xiang, J.; Li, J.; Zeng, J. Spatial differentiation and factors of cultivated land use transition in impoverished counties in western Hubei. Trans. Chin. Soc. Agric. Eng. 2016, 32, 272–279. [Google Scholar]
  20. Li, Q.; Hu, S.; Qu, S. Temporal and spatial characteristics of cultivated land use transition in the middle reach of the Yangtze River from 1990 to 2015. Geogr. Res. 2017, 36, 1489–1502. [Google Scholar]
  21. Zhang, N.; Sun, N.; Jiang, N.; Zhang, N.; Gao, N. Rural land use transition of mountainous areas and policy implications for land consolidation in china. J. Geogr. Sci. 2019, 29, 1713–1730. [Google Scholar] [CrossRef] [Green Version]
  22. Long, H.; Qu, Y. Land use transitions and land management: A mutual feedback perspective. Land Use Policy 2018, 74, 111–120. [Google Scholar] [CrossRef]
  23. Qu, Y.; Jiang, G.H.; Li, Z.; Tian, Y.; Wei, S. Understanding rural land use transition and regional consolidation implications in china. Land Use Policy 2019, 82, 742–753. [Google Scholar] [CrossRef]
  24. Eric, F.; Patrick, M. Land use transitions: Socio-ecological feedback versus socio-economic change. Land Use Policy 2010, 27, 108–118. [Google Scholar]
  25. Shi, Y.; Lv, X.; Huang, X.; Yu, M. Farmland use transition and its ecosystem service value change response in Jiangsu coastal area. J. Nat. Resour. 2017, 32, 961–976. [Google Scholar]
  26. Xu, M.; Zhang, Z. Spatial differentiation characteristics and driving mechanism of rural-industrial Land transition: A case study of Beijing-Tianjin-Hebei region, China. Land Use Policy 2021, 102, 105239. [Google Scholar] [CrossRef]
  27. Tian, J.; Wang, B.; Zhang, C.; Li, W.; Wang, S. Mechanism of regional land use transition in underdeveloped areas of China: A case study of northeast China. Land Use Policy 2020, 94, 104538. [Google Scholar] [CrossRef]
  28. Wang, L.; Pijanowski, B.; Yang, W.; Zhai, R.; Omrani, H.; Li, K. Predicting multiple land use transitions under rapid urbanization and implications for land management and urban planning: The case of Zhanggong district in central China. Habitat Int. 2018, 82, 48–61. [Google Scholar] [CrossRef]
  29. Weng, Y.; Chang, S.; Cai, W.; Wang, C. Exploring the impacts of biofuel expansion on land use change and food security based on a land explicit CGE model: A case study of China. Appl. Energy 2019, 236, 514–525. [Google Scholar] [CrossRef]
  30. Zhu, F.; Zhang, F.; Ke, X. Rural industrial restructuring in China’s metropolitan suburbs: Evidence from the land use transition of rural enterprises in suburban Beijing. Land Use Policy 2018, 74, 121–129. [Google Scholar] [CrossRef]
  31. Sun, Y. Study on the coupling relationship between farmland use transformation and food production in Shaanxi Province. China Agric. Resour. Reg. 2018, 7, 14–20. [Google Scholar]
  32. Amaiti, M.; Shabiti, M.; Zhang, X. Study on the coupling relationship between cultivated land use transformation and grain yield in the Oasis of the Yeerqiang River Plain. China Agric. Resour. Reg. Plan. 2020, 274, 68–74. [Google Scholar]
  33. Chen, W.; Zhao, H.; Li, J.; Zhu, L.; Wang, Z.; Zeng, J. Land use transitions and the associated impacts on ecosystem services in the central Reaches of the Yangtze River Economic Belt in China based on the geo-informatic Tupu method. Sci. Total Environ. 2020, 701, 134690. [Google Scholar] [CrossRef]
  34. Jiang, Y.; Huang, Y. Research on the impact of cultivated land use transition on agricultural carbon emissions. Tianjin Agric. Sci. 2019, 25, 33–39. [Google Scholar]
  35. Cui, H.; Zong, Y.; Zhao, B. Analysis of the evolution of the EU’s agricultural green development support policy system based on the OECD agricultural policy evaluation system. Agric. Econ. Issues 2018, 461, 132–144. [Google Scholar]
  36. Tu, Z.; Wang, Q. Research on the evaluation and dynamics of China’s industrial green development—Based on the evidence from the data threshold regression of cities above the prefecture-level. J. China Univ. Geosci. (Soc. Sci. Ed.) 2018, 99, 52–61. [Google Scholar]
  37. Zou, Y. Theoretical basis and evaluation dimensions of green utilization of farmland. Jiangxi Agric. 2019, 165, 131–133. [Google Scholar]
  38. Li, G. The green productivity revolution in China’s agriculture: 1978–2008. Econ. (Q.) 2014, 13, 537–558. [Google Scholar]
  39. Ge, P.; Huang, X.; Xu, Z. Financial development, innovation heterogeneity, and green total factor productivity improvement: Empirical evidence from the Belt and Road. Financ. Econ. 2018, 1, 1–14. [Google Scholar]
  40. Yu, W.; Luo, X.; Xue, L.; Li, Z. Analysis of the spatial and temporal differences and driving factors of green development in China’s rural areas. J. China Agric. Univ. 2018, 23, 186–195. [Google Scholar]
  41. Chen, W. Institutional constraints and policy recommendations for the green transformation of farmers’ production under the rural revitalization strategy background: Interviews with 47 farmers in conventional production. Exploration 2018, 3, 136–145. [Google Scholar]
  42. Sun, Y.; Fan, W.; Shi, P.; Wang, Z.; Sun, S. The regional difference of the influence of climate change and management factors on cotton yield in Hubei province. Geogr. Res. 2021, 40, 1064–1077. [Google Scholar]
  43. Ji, C.; Ou, M. The relationship between economic development and cultivated land resource change in Hubei Province. Resour. Environ. Yangtze Basin 2009, 8, 3–7. [Google Scholar]
Figure 1. The location and DEM of Hubei Province.
Sustainability 13 11892 g001
Figure 2. The density curve of three dimensions of GTFU. (a) Spatial transition; (b) functional transition; (c) model transition.
Sustainability 13 11892 g002
Figure 3. The growth rate of spatial, functional, and model transition from 2000–2019. (a) Spatial transition 2000–2010; (b) spatial transition 2010–2019; (c) spatial transition 2000–2019; (d) functional transition 2000–2010; (e) functional transition 2010–2019; (f) functional 2000–2019; (g) model transition 2000–2010; (h) model transition 2010–2019; (i) model transition 2000–2019.
Sustainability 13 11892 g003
Figure 4. The coupling, coordination results for 2000, 2010, and 2019. (a) Coupling 2000; (b) coupling 2010; (c) coupling 2019; (d) coordination 2000; (e) coordination 2010; (f) coordination 2019.
Sustainability 13 11892 g004
Table 1. The GTFU evaluation system.
Principal LayerIndicator LayerIndex ExplanationAttr. Weight
Spatial transitionQuantityFarmland area per capitaFarmland area/rural population; reflects changes of farmland area per capita+0.0141
Land reclamation rateFarmland area/total land area; reflects the changes of farmland area+0.0256
StructureMultiple crop indexThe total sown area of crops/total area of farmland=; reflects farmland utilization+0.0353
Input structurePower of agricultural machinery per labor/chemical input per land; reflects the input structure+0.0256
The sown ratio of grain cropsGrain crops planting area/total farmland/crop system; reflects the change of planting type+0.0082
Grain to the cash crop ratioThe sown area of grain crops/planted area of cash crops; reflects changes in planting structure+0.0096
FormLandscape fragmentationNumber of farmland patches/area of farmland-0.0256
Functional transitionProduction functionAverage gross output of planting industry The total output value of planting industry/farmland area; reflects the production +0.0283
Per capita grain productionTotal grain output/sown area of grain crops; reflects the grain production capacity of farmland+0.0456
Labor force per area of farmlandPlanting industry employees/area of farmland; reflects the efficiency of farmland production+0.0244
Living
function
Agricultural income to total income ratioPer capita household agricultural income/per capita net income in rural areas; reflects the economic and livelihood guarantee function+0.0288
Per capita grain processionGrain production/total population of the region reflects the grain security function of farmland+0.4834
Agricultural employment ratioAgricultural employment-population/total labor force; reflects the employment guarantee function +0.0008
Ecological functionNon-point source pollution intensity of fertilizerChemical fertilizer applied /farmland area; reflects the capacity of farmland to environment-0.0386
Variety of cropsThe formula in the note reflects the restoration capacity of the farmland ecosystem +0.0349
Model transitionSave
resources
Water-saving irrigation ratioWater-saving irrigation area/total area of farmland; reflects water conservation in farmland use+0.0495
Energy consumption per area of farmlandTotal agricultural energy consumption/total farmland; reflects energy conservation-0.0495
Total power of agricultural machineryTotal power of agricultural machinery /farmland area; reflects mechanization for labor-saving+0.0238
Environmentally friendlyOrganic fertilizer input intensityGreen manure sown area/farmland area; reflects the degree of organic fertilizer utilization+0.0341
Returning farmland to forest and grassland Area of returning farmland to forest and grassland reflects environment coordination+0.0067
Space
intensive
The proportion of facility agriculture areaFacility farmland area /farmland area; reflects the efficient and intensive use of farmland facilities+0.0028
Advanced technologyAgricultural technicians per capitaNumber of agricultural technicians/agricultural employees; reflects agricultural technology+0.0048
Note: ① Attri. represents attribute. ② The formula for variety of crops represents the ratio of the sown area of various crops to the sown area of crops. For calculation, this study selected the largest planted area of corn, wheat, soybean, rice, potato, peanut, and other crops in Hubei Province.
Table 2. The GTFU evaluation results.
City/Year2000200120022003200420052006200720082009
Wuhan0.080.080.090.090.090.100.100.100.100.10
Huangshi0.080.080.080.090.090.090.090.090.090.09
Shiyan0.110.110.110.110.120.120.130.130.130.14
Yichang0.100.100.100.100.110.110.110.110.110.11
Xiangyang0.090.090.090.090.100.100.100.100.100.11
Ezhou0.070.080.080.080.070.070.070.080.080.09
Jingmen0.090.100.100.090.100.100.110.100.110.11
Xiaogan0.080.080.080.080.080.080.080.080.080.08
Jingzhou0.100.100.100.100.110.110.110.090.090.10
Huanggang0.190.190.210.170.170.180.180.180.180.18
Xianning0.110.110.120.120.130.130.120.090.090.10
Suizhou0.070.070.080.080.080.090.090.080.090.09
Enshi0.100.110.110.110.120.120.120.120.130.13
Qianjiang0.120.120.110.120.120.130.130.120.130.12
Xiantao0.080.080.080.080.080.090.090.090.090.09
Tianmen0.080.080.080.080.090.090.100.090.100.10
Shenlongjia0.070.080.080.080.080.090.090.100.090.09
Average0.100.100.100.100.100.110.110.100.110.11
Year/City2010201120122013201420152016201720182019
Wuhan0.100.110.100.110.110.110.120.110.130.11
Huangshi0.090.100.100.100.120.130.130.110.110.11
Shiyan0.140.140.140.150.150.150.160.160.160.16
Yichang0.120.120.120.120.120.130.130.130.130.14
Xiangyang0.110.120.110.120.120.120.150.130.140.14
Ezhou0.090.100.090.100.100.100.100.100.100.11
Jingmen0.120.120.120.120.130.130.140.140.150.15
Xiaogan0.090.090.080.090.090.100.100.100.100.10
Jingzhou0.100.110.100.110.120.130.130.130.140.15
Huanggang0.190.200.160.190.200.200.200.240.250.25
Xianning0.100.100.090.100.100.110.110.100.110.11
Suizhou0.090.090.090.090.100.100.100.100.110.11
Enshi0.130.130.130.140.140.140.140.140.140.14
Qianjiang0.130.130.130.140.140.140.140.140.140.14
Xiantao0.090.090.100.100.100.100.100.140.140.14
Tianmen0.100.100.100.110.110.110.110.110.110.12
Shenlongjia0.090.090.100.100.100.110.110.110.120.12
Average0.110.120.110.120.120.120.130.130.130.14
Publisher’s Note: MDPI stays neutral with regard to jurisdictional claims in published maps and institutional affiliations.

