
Enhanced Subcontractors Allocation for Apartment Construction Project Applying Conceptual 4D Digital Twin Framework


1
Department of Architectural Engineering, Hanyang University, 222, Wangsimni-ro, Seongdong-gu, Seoul 04763, Korea
2
Department of Digital Architecture and Urban Engineering, Hanyang Cyber University, 220, Wangsimni-ro, Seongdong-gu, Seoul 04763, Korea
*
Author to whom correspondence should be addressed.
Sustainability 2021, 13(21), 11784; https://doi.org/10.3390/su132111784
Submission received: 15 September 2021
/
Revised: 20 October 2021
/
Accepted: 22 October 2021
/
Published: 25 October 2021
(This article belongs to the Special Issue Modeling and Simulation Formalisms, Methods, and Tools for Digital-Twin-Driven Engineering and Sustainability-Led Management of Complex Systems)
Abstract
:The problem of optimal allocation of resources in limited circumstances to handle assigned tasks has been dealt with in a wide variety of research fields. Various research methodologies have been proposed to address uncertainties such as waiting and waste in construction projects, but they do not take into account the complexity of construction production systems. In this study, a research approach was proposed that simplified the construction production system into a work package to be serviced and a work group to provide services. In addition, a conceptual 4D digital twin framework considering the uncertainty of the construction production system was proposed. This framework includes BIM as an information model and a queuing model as a decision-making model. Through case projects, we have presented how this framework can be used for decision making in several statuses. As a result of the analysis using the performance index of the queuing model, it was possible to monitor the status of the system according to the allocation of resources. In addition, it was possible to confirm the improvement of the performance index according to the additional arrangement of the work group and the activity cycle of the work package. The framework presented in this study helps to quantitatively analyze the state of the system according to the input data based on empirical knowledge, but it has a limitation in that it cannot present an optimized resource allocation solution. Therefore, in future research, it is necessary to consider the grafting of machine learning technology that can provide optimal solutions by solving complex decision-making problems.
1. Introduction
Large-scale construction projects always involve uncertainty and risk. Therefore, there is a need to quantitatively analyze the construction production system to minimize uncertainty and risk. Through monitoring of the production process, decisions on the allocation of resources must be made quickly. In particular, the decision making on the allocation of human resources is a very important research issue due to the effects of the COVID-19 pandemic crisis and a decrease in working hours due to changes in the social environment. The input of human resources in a construction project is based on a contract between a general contractor who manages the project and subcontractors who perform various processes. Therefore, the optimal decision making on the allocation of human resources has a great influence on the success or failure of the project [1]. In fact, in previous studies, it has been revealed that the tasks performed by subcontractors, time waiting or waste occurring between tasks, account for 32% of time lost [2]. As such, the issue of the placement of subcontractors deserves to be addressed in the study.
The general contractor needs to quantitatively determine the amount of work to be performed in order to manage the placement of subcontractors. Building Information Modeling (BIM) is defined as supporting the decision making of project participants by providing information related to the entire life cycle of a construction project [3]. As such, BIM, which can support collaboration by physically expressing the process and information required by participants in the construction project, has been used as a major material in many studies over the past decade. Since BIM is a physical representation of the building to be built, studies were able to analyze the loss cost due to design errors through BIM-based design verification and calculate the BIM ROI (Return on Investment) accordingly [4,5,6]. In addition, studies using BIM as a tool for visualizing processes and costs have been found. In the case of 4D simulation research, in many cases, BIM provides a method to visualize the planned schedule and the executed schedule, or to solve a constructability problem that occurs at a specific point in time [7,8]. In addition, 5D simulation research suggests a framework for decision making in the financial part of a construction project [9], and there are studies exploring the functions of 5D CAD in terms of process management [10]. BIM provides valuable information to project managers in a unit process or decision-making situation at a specific point in time, but it does not express the degree of uncertainty and risk such as waiting or waste in the production system.
This study intends to propose a digital twin framework for optimal decision-making support that can minimize subcontractor waiting or waste by the convergence of management science methodologies that can predict probabilistically.
2. Literature Review
2.1. Subcontractors Allocation in Korean Apartment Construction Project
The Korean apartment construction project involves simultaneous input of human resources in several residential buildings. Although the plans and elevation shapes vary between construction companies that supply apartment houses, the sequence of construction is generalized to conventional methods such as formwork installation, rebar installation, and concrete pouring. Therefore, the work package of formwork installation, rebar installation, and concrete pouring for one floor can be managed sequentially by repetitive processes. Since the general contractor cannot arrange subcontractors indefinitely, the subcontractor allocation plan must be established based on the overall construction quantity. However, in most cases, subcontractors’ allocation and management depend on the empirical knowledge of general contractors and subcontractors. The general contractor performs the following decision making and analysis at the micro level. How much work (number of buildings, number of floors) will be allocated to one workgroup in charge of installing formwork, installing rebar, and pouring concrete in frame construction? Conversely, given the number of residential buildings involved in the apartment construction project, how many workgroups is appropriate? How will the performance of the team change if the amount of work to be done per unit time increases or decreases? How much does increasing the number of teams improve performance? Or is increasing the crew economical given the wait and waste? What is the maximum number of people that can be allocated per workgroup? The subcontractor performs the following decision making and analysis to establish a staffing plan at a micro level. What is the minimum amount of work that must be ordered so that the input manpower is not waiting or wasted? How many work packages can be completed per day depending on the hourly productivity of formwork, rebar installation, and concrete pouring? The complexity of resource allocation problems faced by general contractors and subcontractors varies according to the characteristics of the project. In the field, these problems have been solved based on empirical knowledge and information. However, there may be limitations in empirical decision making because there are a lot of variables and uncertainty that exists for each variable.
Various research methodologies have been used to solve the resource allocation problem of the construction project. Cheng and Li [11] proposed a better resource allocation method by setting the priority of information using the analytic hierarchy process (AHP). Zhang and Li [12] proposed the optimization of dynamic resource allocation based on simulation, and Liu et al. [13] conducted a study to optimize resource allocation in construction projects using genetic algorithms. Sack and Harel [14] proposed a game theory model for subcontractor resource allocation. Sharma et al. [15] applied the simulation for resource allocation in the hospital facility management process. In addition, Ibbs and Nguyen [16] performed process analysis according to the effect of resource allocation. Recently, Zhong et al. [17] proposed a quantitative analysis framework for resource allocation in uncertain construction projects that combines a fuzzy mathematics approach. These methodologies focus on micro-resource allocation. In order to manage project level waiting or waste, it is necessary to manage uncertainty about the resource allocation of sub-activities. For this, a modeling methodology that can quantitatively analyze even the uncertainty of the production system is required. In addition, it should be possible to maintain the production system in an optimal state by examining the parameters of the production system to respond to various scenarios.
2.2. Simulation Methodologies Considering Uncertainty
A construction project is a production system, and results are derived according to the input of resources. Therefore, accurate and reliable forecasting of the performance of resource allocation is very important to the success of the project. Such forecasting is very necessary in recognizing and solving potential problems that may arise in a construction project. However, existing project performance prediction models are fragmented by considering the interdependence between performance variables of very different dimensions [18].
To solve this limitation, a system dynamics model was developed to simulate the complexity existing between interdependent variables and predict the role over time. System dynamics can identify the complex and dynamic factors that affect rework and project performance so that direction can be drawn to improve construction quality and reduce rework costs [19]. It is also used to identify causes for avoiding cost overruns and delays [20,21]. In addition, this model can be utilized for the identification of major risk factors in construction projects [22]. Macroscopically, it can be implemented to analyze the impact of new policies and technologies on the industry [23]. Although these methodologies can analyze the production system of a construction project at a macro level, the management of human resources performing production requires a research approach at a microscopic level, such as in manufacturing.
Halpin [24] developed CYCLONE (a Cyclic Operation Network) to model repetitive work processes in construction. CYCLONE was developed to depict real-world projects and is a management tool to measure productivity. Using a deterministic or probabilistic approach, it focuses on resources, time of work, and logical relationships between tasks [25]. Many researchers have developed methodologies and simulation systems based on CYCLONE [26,27,28]. What these methodologies have in common is to derive the optimal resource combination by adjusting the resource input through productivity prediction and sensitivity analysis through simulation [29]. Although this method contributes to process optimization, there is a limit to deriving an optimized decision on the allocation of human resources at a micro level.
In this respect, workflow management (WfM) systems, which have been used since the early 1990s, can improve the performance of business processes related to lead time, wait time, service time, and resource utilization [30]. Among them, a queueing model that can formulate numerical results is commonly used [31]. When the queueing model is applied to research in the field of construction, a microscopic approach is required and several assumptions are required. First, you need to define the units of work that must be completed over a period of time. In addition, it is necessary to define the resources and productivity required to perform unit tasks. For example, it is necessary to define the work to be processed in the production line, such as the production system in the manufacturing industry. Table 1 shows various studies that have applied the queuing model for decision support. There are various application areas, and optimal decision making for resource input was made through the definition of the server that provides the service and the customer who requests the service. In the queuing model, various models can be applied in consideration of the uncertainty of the service capability of the server and the uncertainty of the customer’s service request. As such, the queuing model can be used as a decision-making model through the simplified expression of the production system and the selection of a model considering uncertainty.
Through this approach, research using the queuing model in the construction field has been conducted recently. Lee et al. [41] conducted a study on the optimal personnel input of specialty contractors for the fabrication documents extraction task produced through digital fabrication. Ham et al. [42] conducted a study on the problem of determining the optimal number of BIM staff based on the RFI obtained through BIM-based design validation from an economic point of view. Kim et al. [43] modeled the frame construction process to optimize the construction period of an apartment construction project and evaluated the expected construction period through the queueing model. As such, the queueing model can be used as a tool to support decision making on optimal resource management by quantitatively analyzing the state of the system according to resource allocation. Therefore, this study proposes to present a conceptual 4D digital twin framework that can optimize the allocation of human resources applying the queueing model.
2.3. Next Generation of BIM: Digital Twin
BIM has been recognized as a tool that can provide a wide variety of information [44], and has been widely used to support decision making in limited areas such as design verification, constructability review, and quantity review. According to the level of detail (LOD) of the BIM model, it is possible to calculate very accurate information about the planned work. However, BIM cannot provide all of the detailed information on material cost, labor cost, and expense for all work included in the bill of quantity (BoQ). In particular, it cannot provide information related to the human resources accompanying sub-activity at a micro level. The information required for planning the placement of human resources to perform the planned work often relies on the experience of the general contractor. No matter how valuable BIM is and how much information it contains, it is only a reference information to support good decision making. Therefore, it is necessary to present a new framework by changing the research perspective in order to enhance the value of BIM in the level of project management.
The digital twin of the manufacturing industry was introduced in 2002 as a concept that supports production planning and the control of products [45]. Digital twin frameworks provide a more detailed and widely accepted definition in the field of research [46]. “Digital twin is an integrated multiphysics, multiscale, probabilistic simulation of a complex product and uses the best available physical models, sensor updates, etc., to mirror the life of its corresponding twin [47]”. Digital twin can describe real-world objects beyond providing pure information, and include algorithms that support decision making about operations in production systems based on the processed data [48,49,50]. Kritzinger et al. [51] classified digital twin into three categories according to the level of data integration: digital model, digital shadow, and digital twin. Digital representations are modeled manually, similar to BIM, and may not be linked to real objects that exist (digital models). On the other hand, ideally, not only can the digital representation be able to exchange real-time data with real objects, but it can also be fully integrated (digital twin). These different levels of digital twins are used in production planning and control [50], maintenance [52,53], and layout planning [54] to increase productivity and efficiency in manufacturing and other major fields.
However, the digital twin of the construction industry has not been actively discussed yet. Sack et al. [55] conducted a study called construction using a digital twin information system based on project status and project information and knowledge. The digital twin construction (DTC) workflow utilizing this system focuses on data collection, state analysis of buildings and processes, and prediction, accordingly, through monitoring of the physical twin construction site. Based on this, digital twin analyzes the production system and requires a framework that can make various predictions. Therefore, in this study, a conceptual 4D digital twin framework that can support decision making on the resource allocation for schedule management is presented and verified through case analysis.
3. Research Problem Statement
A large-scale project such as a Korean apartment construction project is complex and difficult to manage because there are many input resources and various tasks are carried out simultaneously. In particular, the frame construction not only takes up a very large proportion of the construction period and construction cost but also directly affects the resource input plan for the finishing construction. Project management for framing works is based on a contract between the general contractor and the subcontractor for the assigned amount of work. At this time, the general contractor should establish a resource allocation plan in consideration of the amount of work to be performed and the productivity of the subcontractor performing the work. Private construction companies usually set the construction period for the repeated framing of the reference floor to a 7-day cycle. Based on the 7-day cycle, the subcontractor simultaneously allocates resources to formwork, rebar installation, and concrete pouring to perform construction on the assigned residential building. Table 2 shows the main activities for the 7-day cycle.
These activities are not carried out in one residential building but are carried out simultaneously in several residential buildings. Optimized production lines in the manufacturing industry minimize waiting and waste through mechanization and automation. However, in an apartment construction project, each activity is a human-centered work. Therefore, the productivity of formwork installation, rebar installation, and concrete pouring activities is inevitably uncertain due to inhomogeneous resources. The shape of the residential building, the composition of household types, the presence or absence of piloti, and the rooftop floor make the productivity of the traditional construction method lower. In addition, non-working days due to external factors can be said to be the uncertainty of a construction project in which all planned work must be completed within a limited construction period. It is very difficult to realistically model and monitor apartment construction projects that contain these uncertainties. Therefore, it is necessary to solve the problems faced by apartment construction projects through a new research approach.
4. Conceptual 4D Digital Twin Framework
4.1. Research Approach
As discussed above, various research methodologies have limitations due to the uncertainty of construction projects. Therefore, it is necessary to consider the fundamental characteristics of the production system of a construction project through a new research approach. The method proposed in this study is not a complex modeling method but a simplified modeling method reflecting uncertainty. In order to solve the resource allocation problem, existing studies have focused on allocating limited resources to locations requiring physical work. In this case, when the size of the project increases and the types of resources to be allocated are diversified, the problem to be solved is rather complicated. In the case of the CYCLONE method reviewed above, it accurately depicts the actual project, but there is a limit in supporting the decision making of resource input to minimize waiting or waste at a micro level. In other words, the model is complex, and data collection and analysis are difficult, so it is not practical.
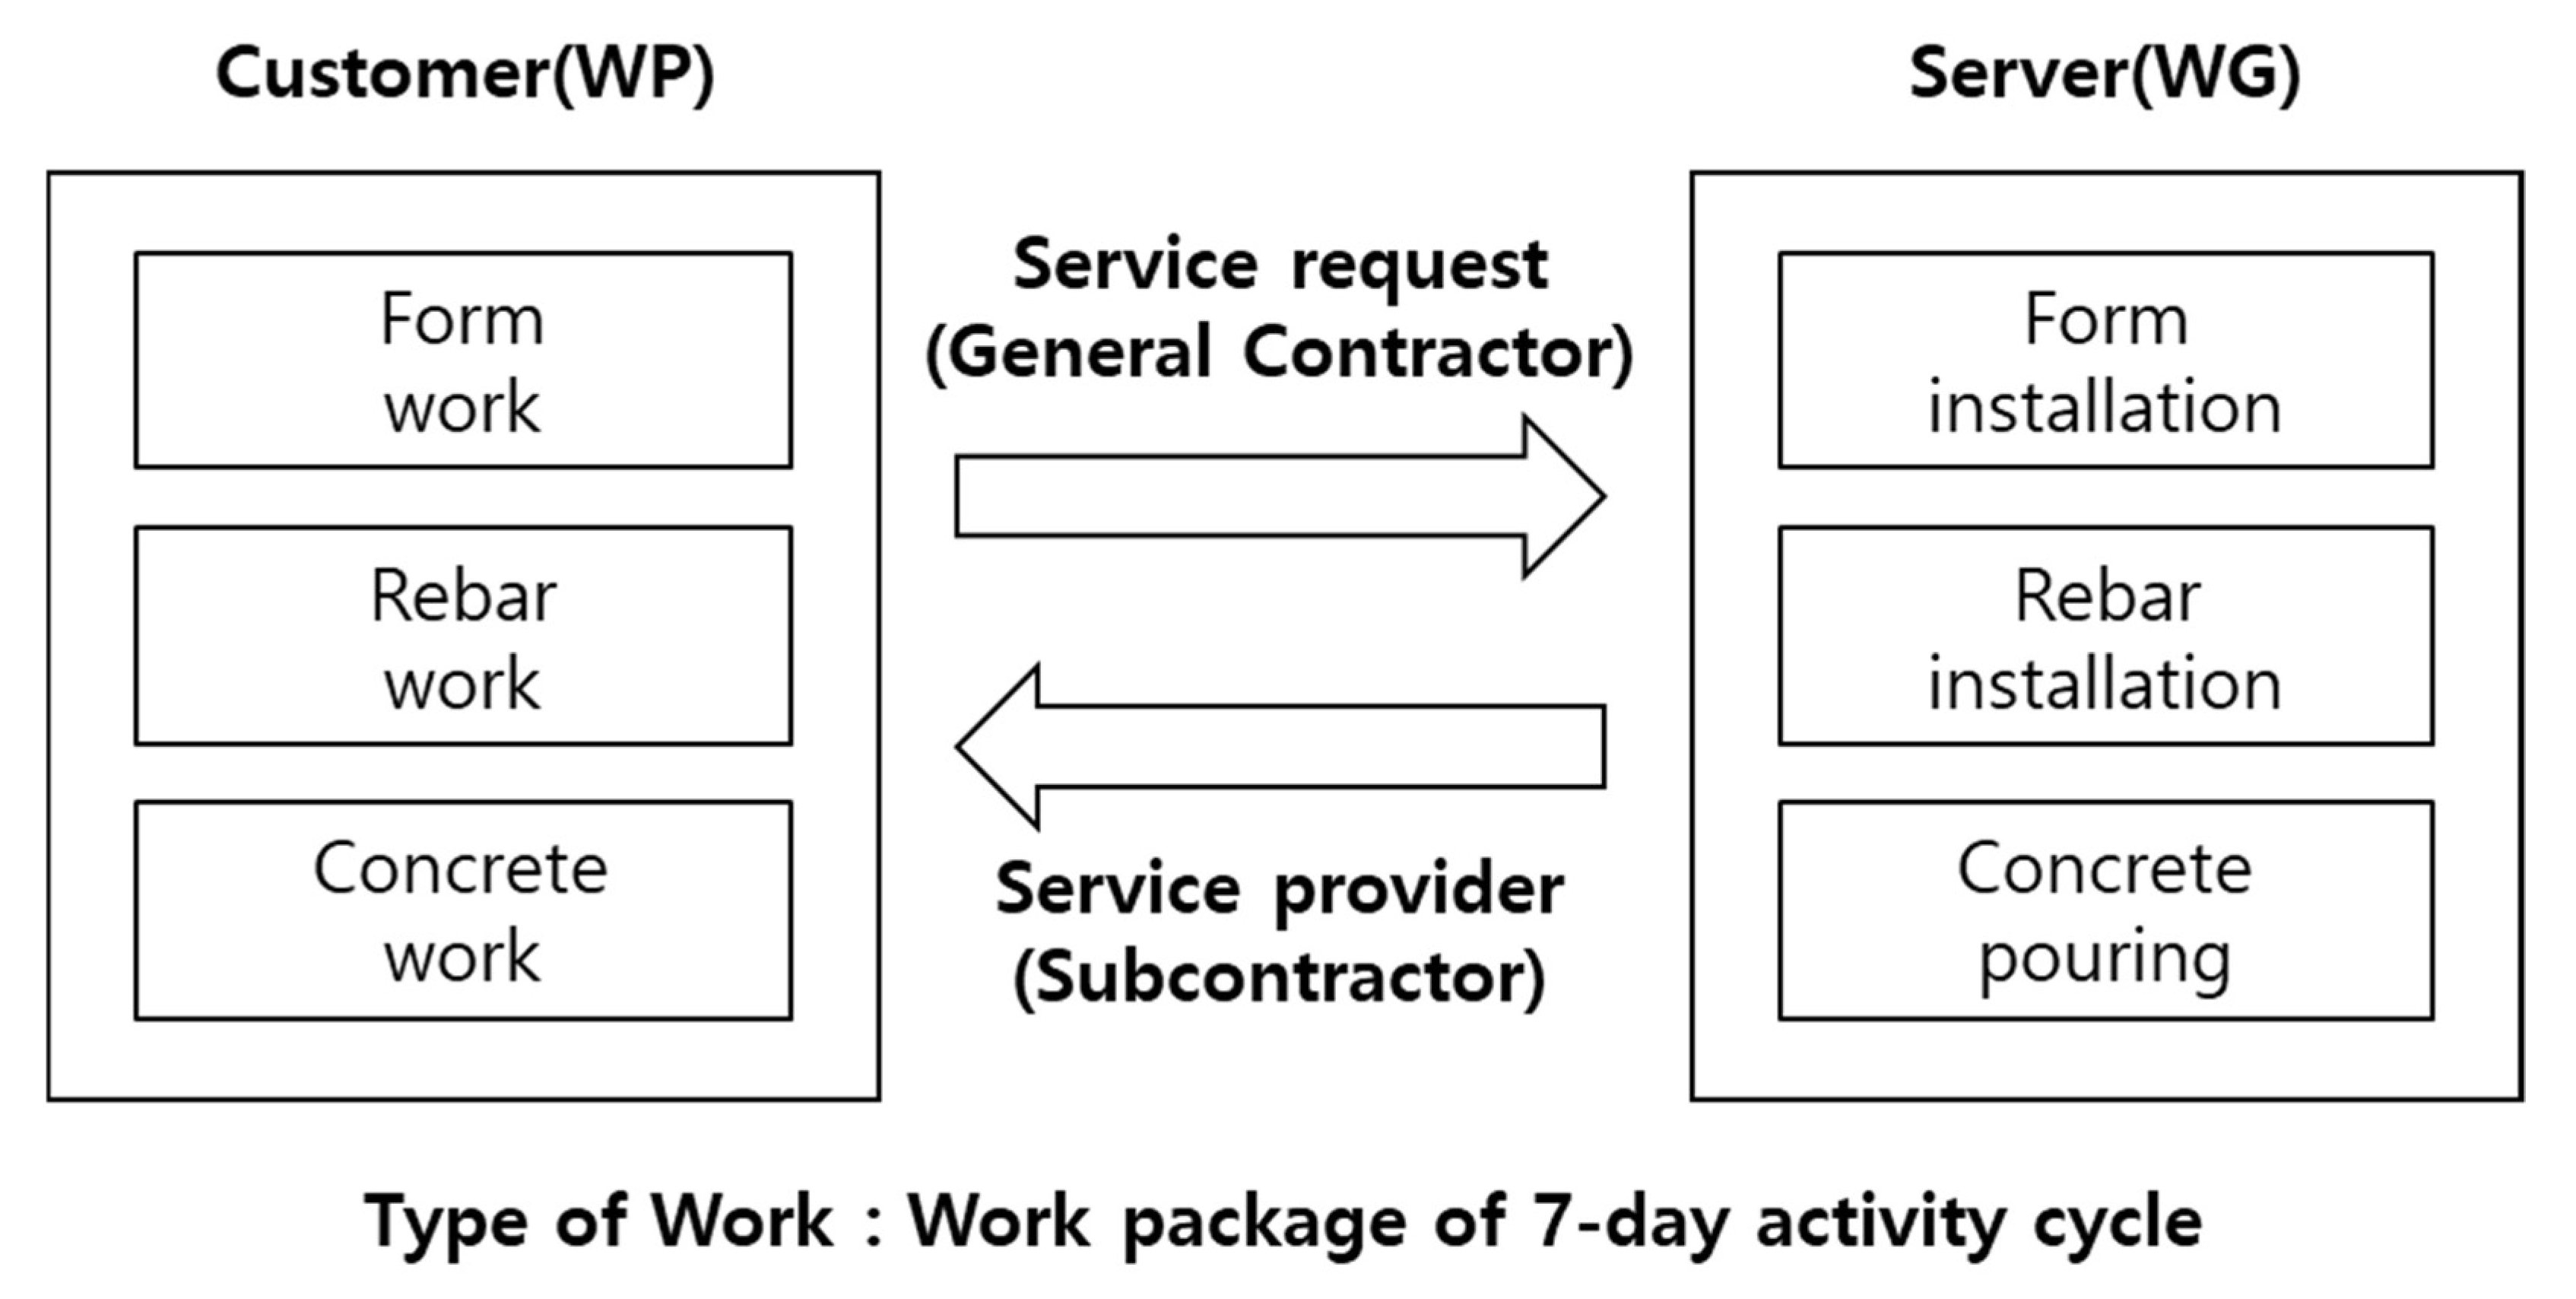
As discussed earlier, the functions of the digital twin include monitoring the construction site, analyzing the condition of the construction process, and supporting decision making, accordingly. To support these functions, we intend to apply a queue model. As confirmed through previous studies, no matter how complex a production system is, it can be expressed and analyzed as a queue model if the definition of the project work, the object requesting the service for the work, and the object performing the service are clear. In this study, as shown in Figure 1, the production system for the queue model is simplified with the customer requesting the service and the server performing the service.
The services requested by the general contractor can be broadly divided into formwork, rebar work, and concrete work, but, as analyzed in Table 2, it includes all the work included in the 7-day activity cycle. These works contain uncertainty due to the external environment. In addition, the total work package to be serviced is processed with an average 7-day activity cycle, but it includes uncertainty that it will not be treated as a 7-day activity cycle due to several factors. In addition, there is uncertainty that waiting or waste may occur depending on the input plan of the subcontractor’s work group that provides the service, the number of manpower input for individual work, and daily productivity. This study intends to present a conceptual 4D digital twin framework to which a queuing model is applied through this research approach. Even if a complex production factor is expressed simply to analyze the state of the production system, the uncertain nature of the construction project does not change. Factors affecting the construction period of apartment frame construction include design, labor, materials and equipment, subcontracts, weather, planning, and execution of work [56]. These factors can cause various types of uncertainty due to the influence of the applied construction method, materials used, human resources, and weather, etc. These uncertainties delay work, delay the start of subsequent tasks, and cause process interference [57]. According to the study results of McTague and Jergeas [2], 35% of the time wasted is due to waiting or work delay, and 28% is due to delays in preparation time such as transporting materials and ordering work. Therefore, it can be seen that the actual working time is less than 50%. Even in the case of formwork, which occupies the most weight in frame construction, the actual work time is about 50% of the total work time, and the remaining 50% consists of time spent looking for materials, idle time, socializing, and moving, etc. [58]. The total work package to be serviced is processed with an average 7-day activity cycle, but it includes uncertainty that it will not be treated as a 7-day activity cycle due to several factors. In addition, there is uncertainty that waiting or waste may occur depending on the input plan of the subcontractor’s work group that provides the service, the number of manpower input for individual work, and daily productivity. Therefore, a modeling method that takes these uncertainties into account should be considered.
The probabilistic method has mainly been used as a modeling method considering the uncertainty factors inherent in the construction project. This methodology has been used to optimize the construction period by using weather information or to optimize the human resources put into the work. Jung [59] developed a model that can predict how long the construction period will be delayed depending on weather conditions such as temperature, wind speed, and precipitation. Lee [60] developed a model that can predict the construction period based on the total number of floors in the frame construction and on the meteorological conditions and expert opinions of the area where the project is being carried out. Leu [61] suggested a way to integrate the existing concepts of time–cost tradeoff and resource allocation. However, this method has limitations in being applied to simultaneous projects such as apartment frame construction. In addition, Petruseva et al. [62] presented a learning algorithm by analyzing contract and price data of 75 projects using a support vector machine (SVM) to improve the accuracy of the planned construction period. Golizadeh et al. [63] presented a model that can estimate the working period using an artificial neural network (ANN) focusing on structural elements of frame construction. However, it is difficult to support the improvement of detailed processes using these methodologies based on machine learning.
From this point of view, construction projects with various uncertainties should consider lead time, wait time, service time, and resource utilization based on workflow management (WfM) systems, as analyzed in previous studies [30]. In order to analyze the time related to the performance of the WfM system, as seen in previous studies, the queue model has been applied in various fields (Table 1). This study intends to present a conceptual 4D digital twin framework through this research approach and the selection of a queuing model.
4.2. Conceptual 4D Digital Twin Framework
As seen through theoretical considerations, the main function of 4D is focused on visualization that links the BIM model and schedule data. In addition, the problem of linking the object breakdown structure (OBS) of the BIM model with the work breakdown structure (WBS) and cost breakdown structure (CBS) of the construction project is obscured by complexity and cannot support decision making.
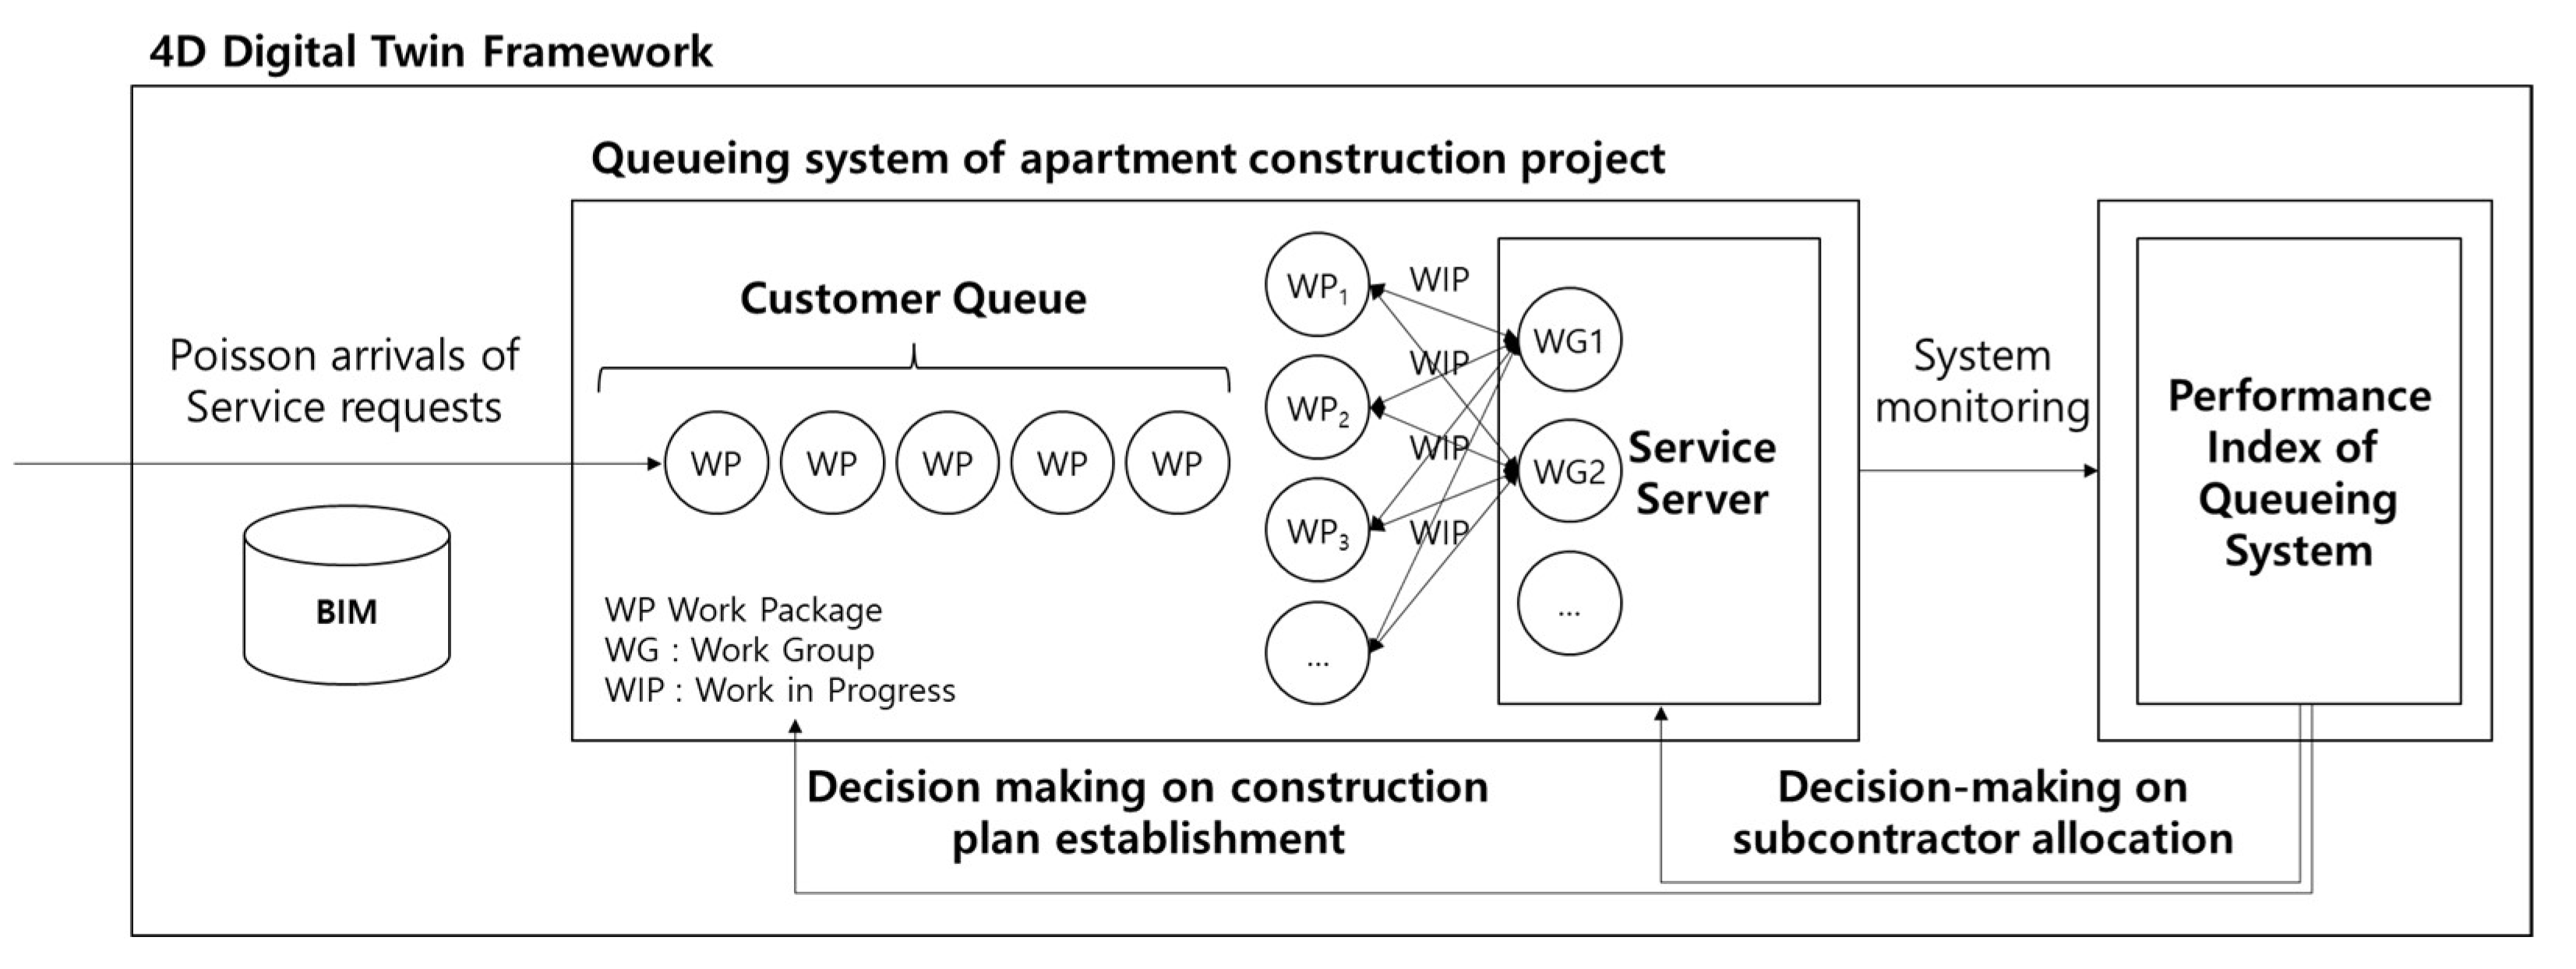
The theoretical 4D digital twin framework proposed in this study conceptually combines the BIM-based bill of quantity (BoQ) as a quantitative information model and a queuing model as a probabilistic decision-making model (Figure 2). As suggested in the previous section, this study divided the complex construction production system into service providers providing services and customers receiving services. In this process, resource allocation is made based on the empirical knowledge of the general contractor and subcontractor. The queuing system of the apartment construction project can be expressed as a work group (WG) that provides a service and a work package (WP) that waits to receive the service, as shown in Figure 2. Depending on how resources are allocated, the service status of the queuing system changes. The general contractor monitors the status of the system through the performance indexes of the queuing system. If the performance is different from the plan, the allocation of subcontractors can be adjusted at the micro level or the construction plan can be changed at the macro level.
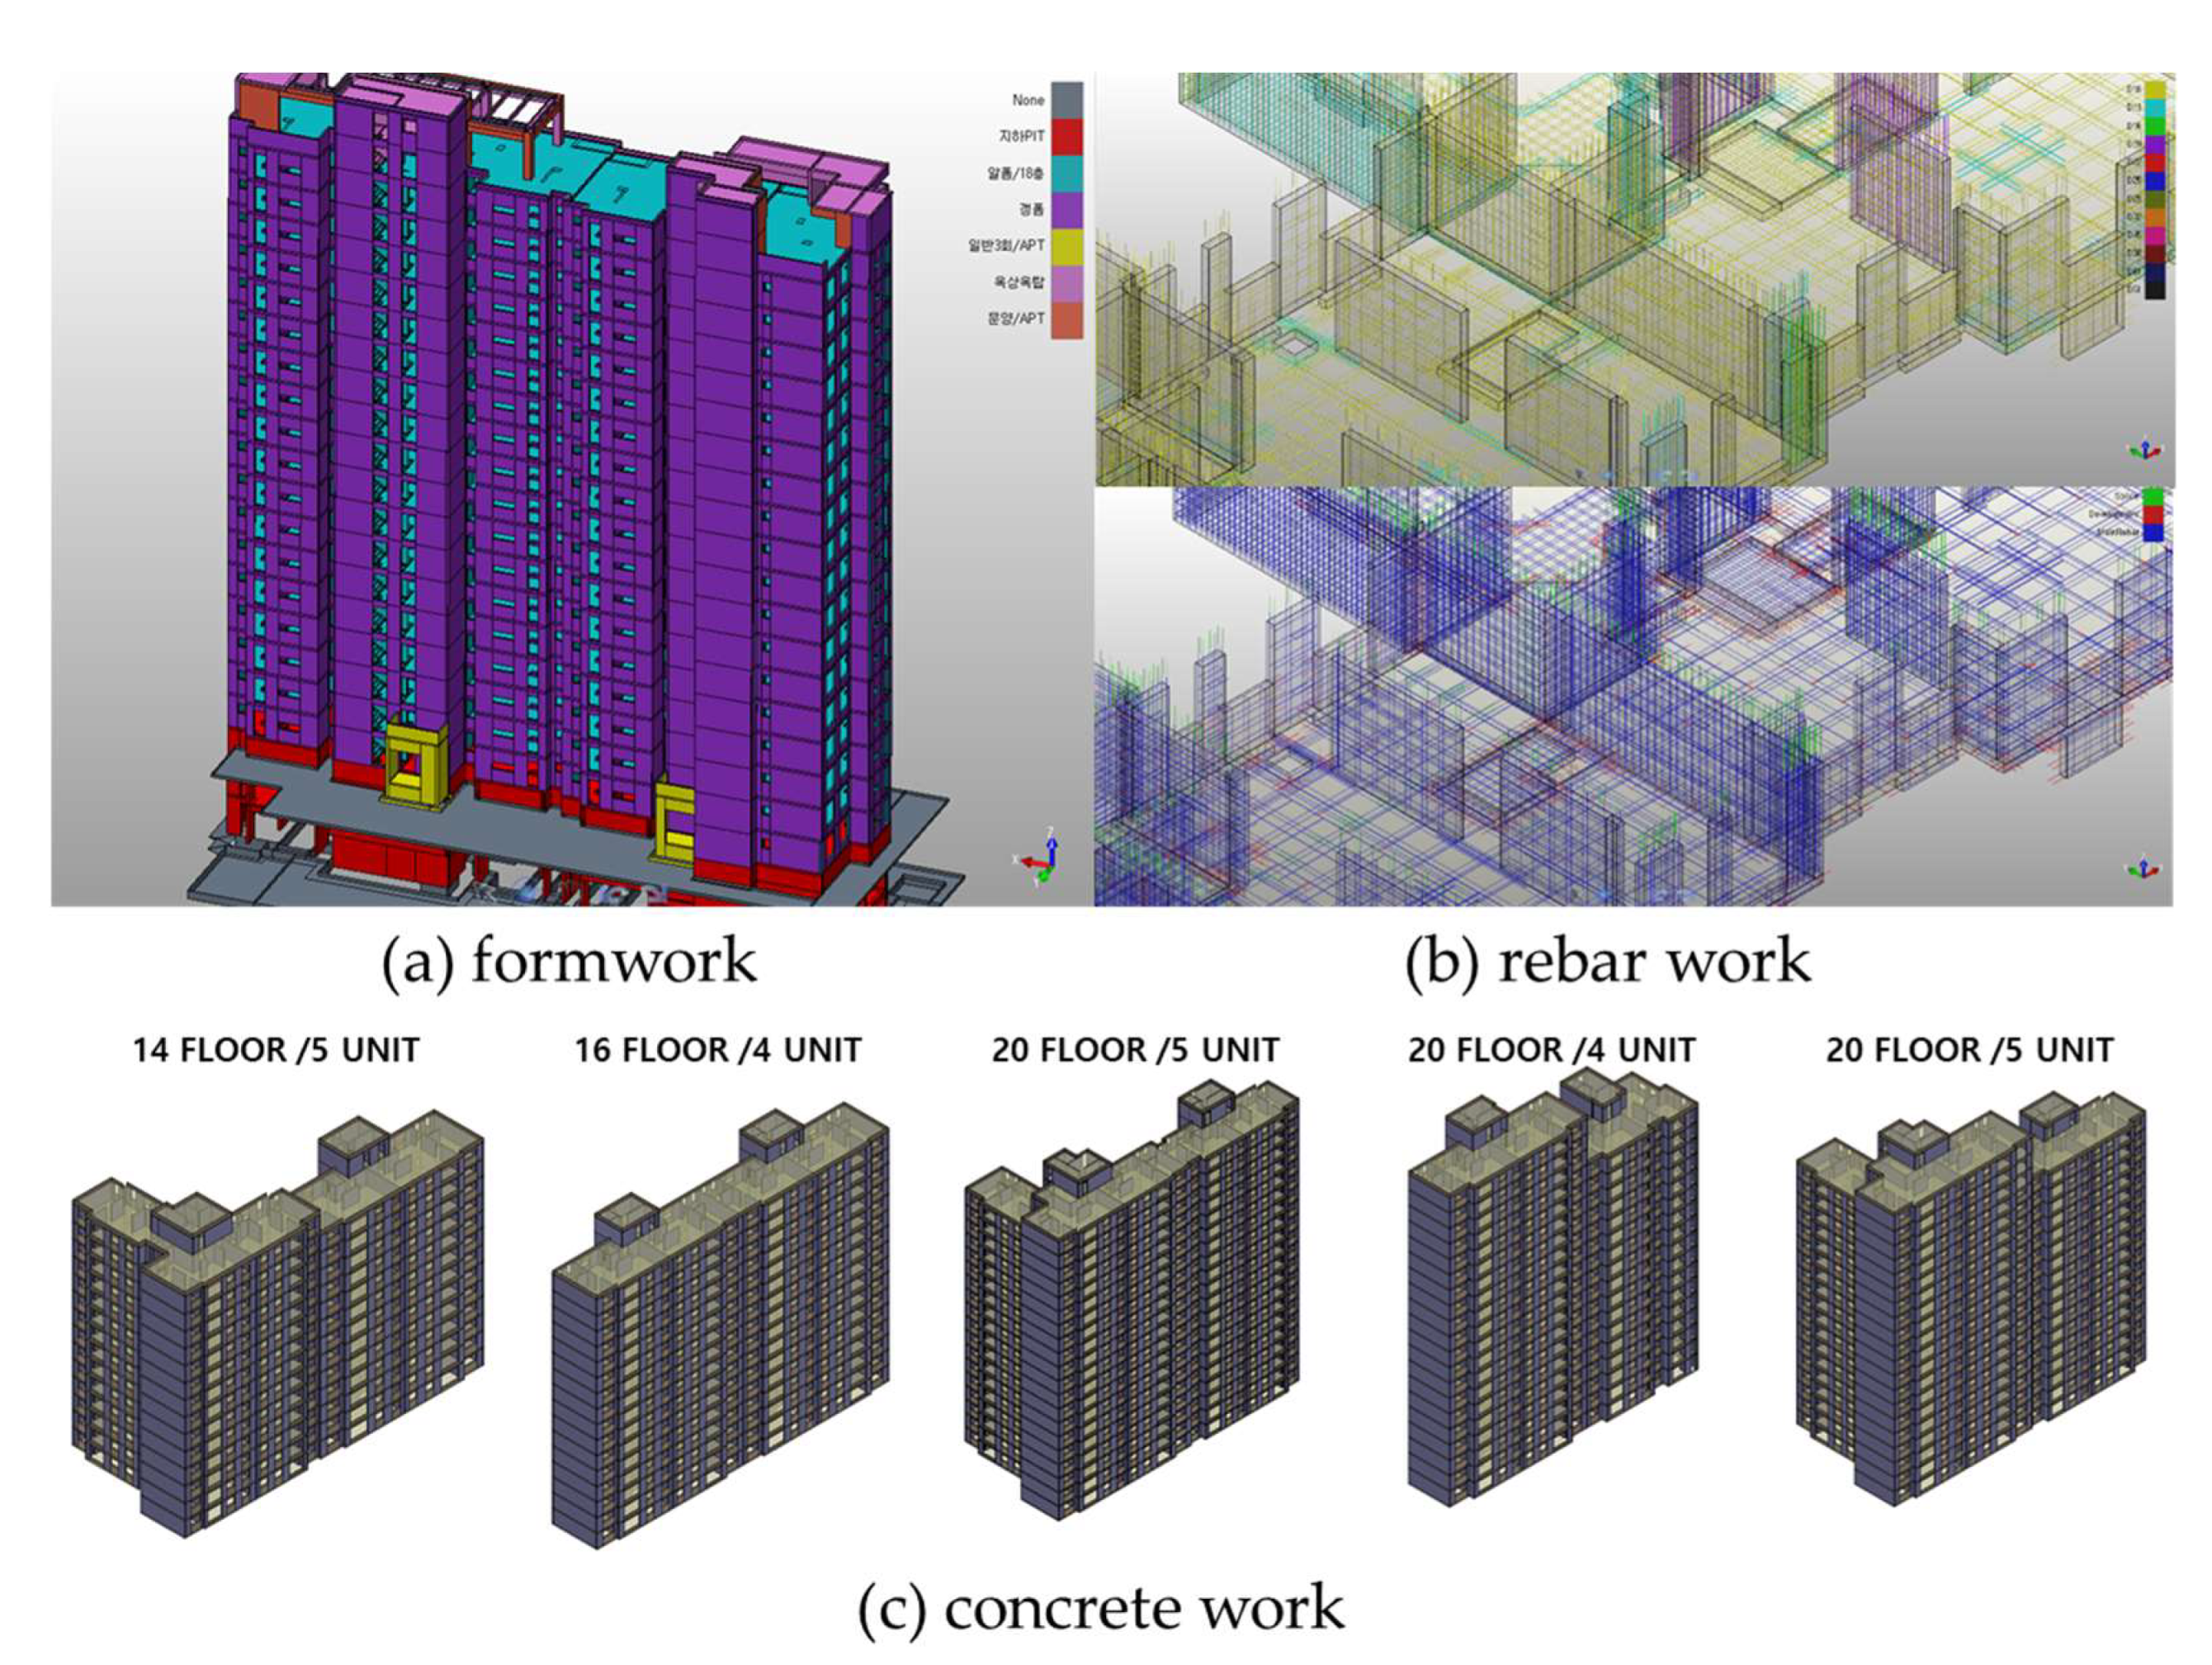
The conceptual 4D digital twin framework proposed in this study has the following advantages in terms of schedule management. First, information on the exact amount of work can be utilized through the BIM model, while the integrity of the design is secured through BIM-based design verification before the establishment of the construction plan. According to the level of detail (LOD) of the BIM model, it is possible to obtain an accurate quantity of work in the microscopic dimension. Figure 3 shows the BIM model for (a) formwork, (b) rebar work, and (c) concrete work. In the conceptual 4D digital twin framework, the BIM model can provide detailed quantitative data for a unit work package [64]. That is, it is possible to accurately analyze the amount of work to be processed rather than simply grasping the speed of the schedule. However, since this study focuses on decision making on resource allocation when waiting or waste occurs in the waiting system of an apartment construction project, data collection and analysis related to BIM were excluded from the scope of the study. Second, the proposed conceptual 4D digital twin framework can be applied in each construction stage. That is, in the preconstruction stage, resource allocation can be established through previous empirical performance data, and the state of the system can be monitored accordingly. In the construction phase, progress can be effectively managed through data of planned and executed works. In other words, it is possible to make decisions about the real-time adjustment of the construction plan and allocation of subcontractors through a state analysis of the system. When the project is completed, it can be used in the decision making of a new project by creating a database of resource allocation adjustment history for planned and executed works. Third, while previous schedule management is centered on buildings corresponding to the critical path, this framework can quantitatively monitor the construction progress of multiple buildings included in one project. This is because the complex construction production system has been simplified into a work package, which is a unit work to be serviced and a work group that provides services.
5. Case Study
5.1. Project Description
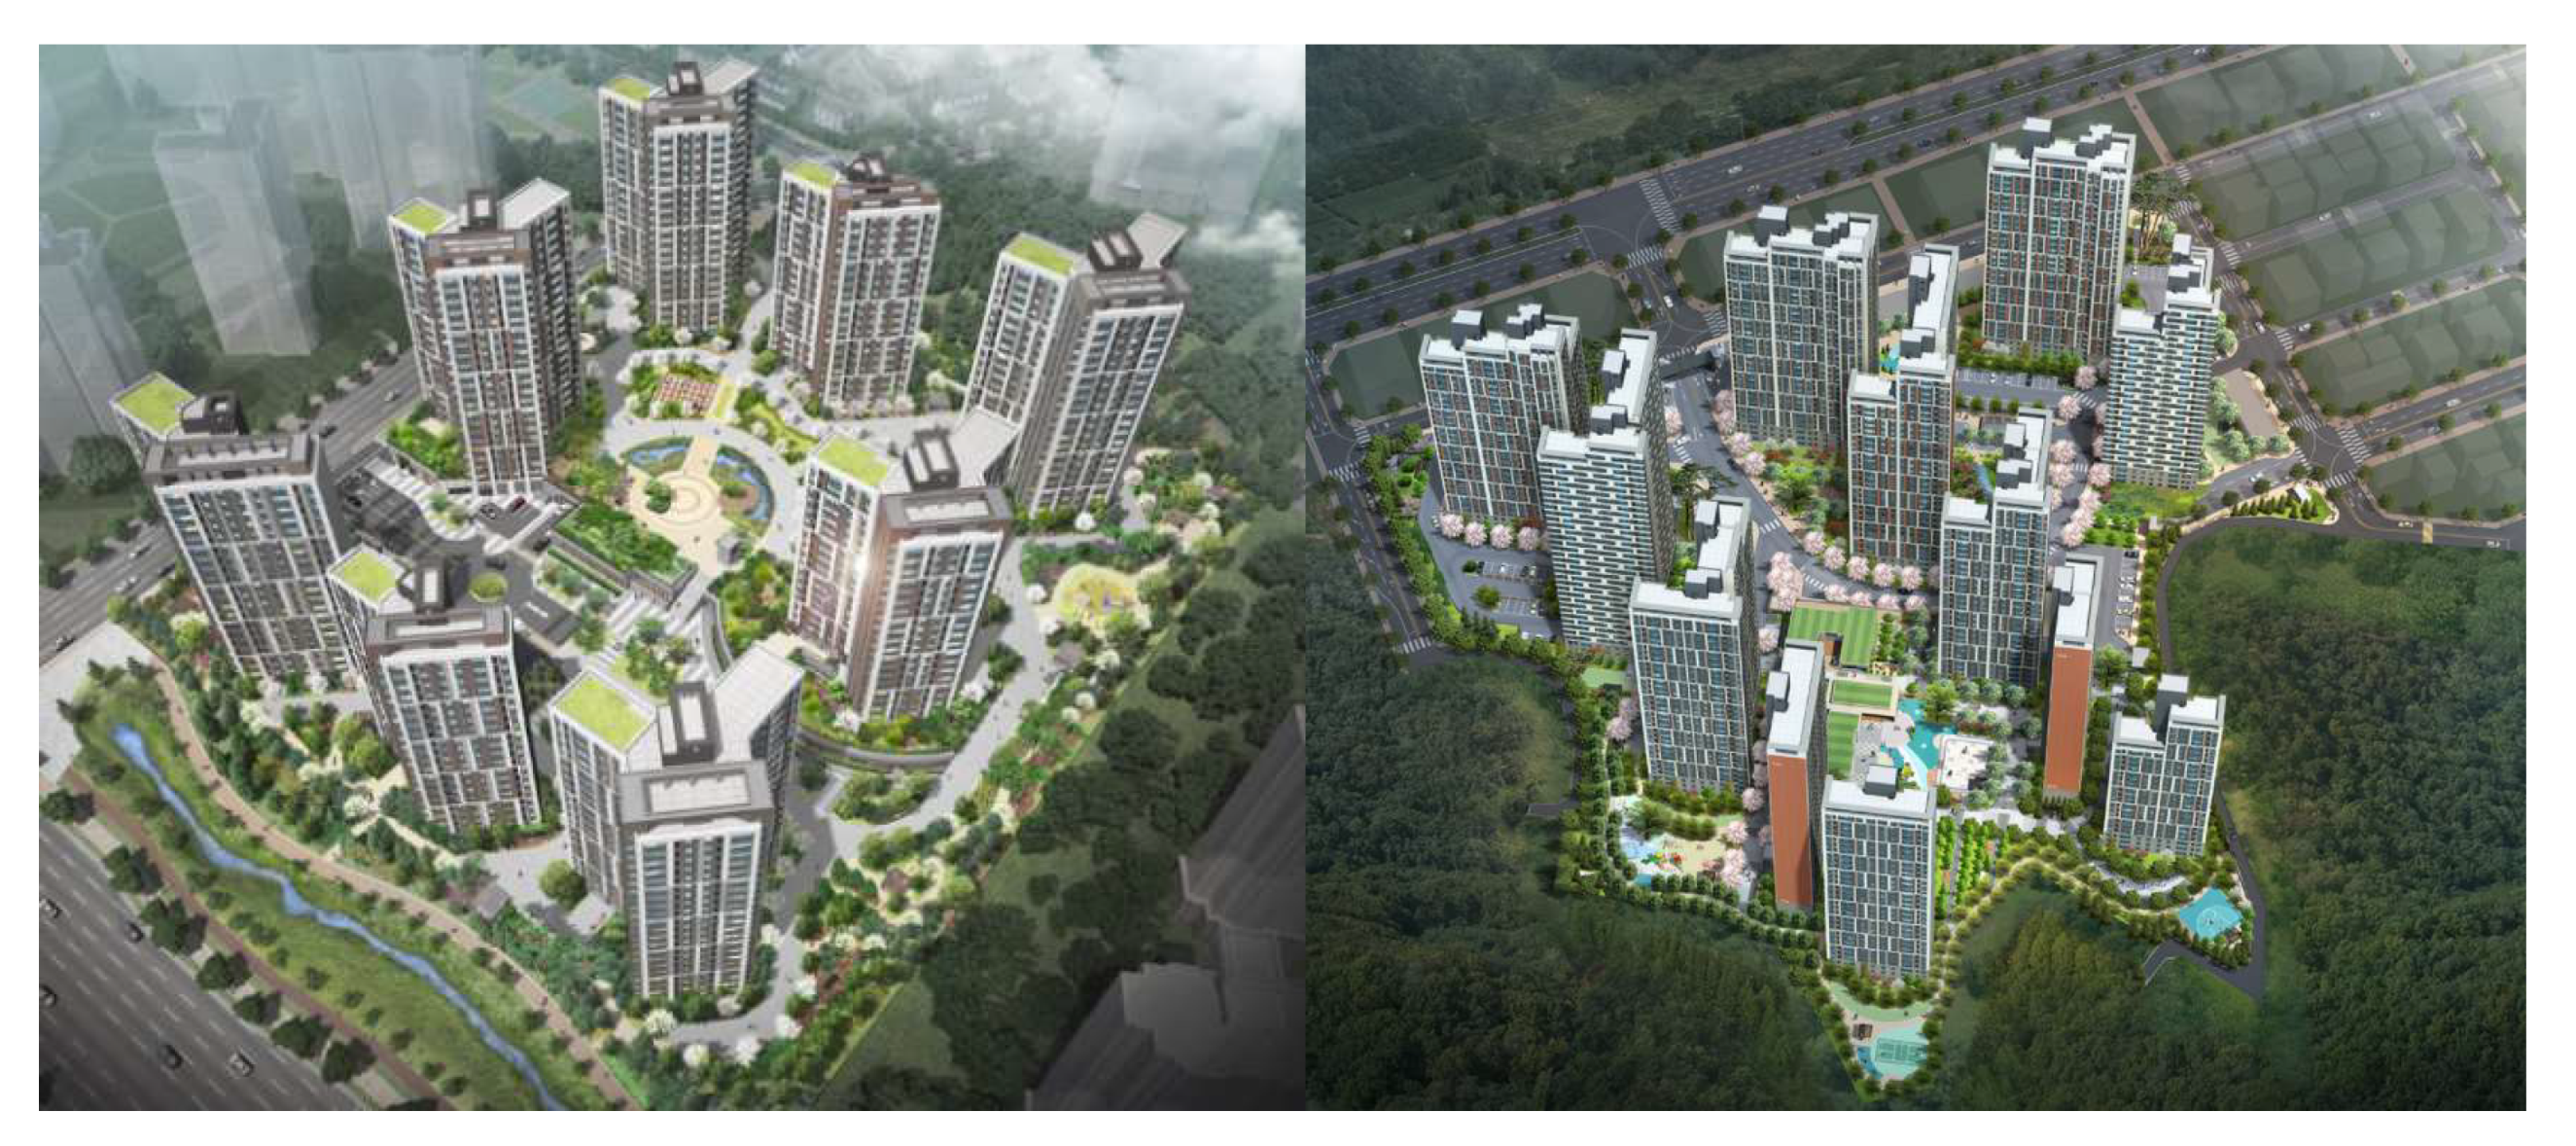
Through the conceptual 4D digital twin framework, two apartment construction projects, as shown in Figure 4, were selected to analyze the research problems raised in the theoretical consideration and problem statement section, and to support decision making.
The differences between project 1 and project 2 as a project carried out by the same construction company are as follows. First of all, the region where the project takes place is different. In this case, the supply and demand conditions for craftsmen who carry out the construction are different. As a result, a difference may occur in the productivity (e.g., mean service rate) of the server that processes the job. However, in general, general contractors use the 7-day activity cycle as the basis for calculating the period of ground floor framing at the project level. When a delay occurs after a project is started, a large number of personnel are temporarily put in based on an empirical judgment to make up for the progress. This management method has the problem of being a temporary measure. Next, the size of the project is different. In the case of Project 1, there are a total of 577 households: 59 m2 (A type), 59 m2 (B type), 59 m2 (C type), 84 m2 (A type), 84 m2 (B type), and 123 m2. Project 2 consists of a total of 1210 households, including 67 m2, 84 m2 (A type), 84 m2 (B type), 84 m2 (C type), and 115 m2. In this case, Table 3 shows the classification of customers to be worked by the service provider according to the work package (WP) criteria presented in this study.
Since the residential building is a physically different space, it is not possible to simultaneously put manpower for the same work. That is, only after the preceding work of one work package is finished, can the manpower performing the work for the next process come in and work. Personnel who have completed the preceding task are assigned to the next task waiting for their turn to perform the task. However, if there are multiple physical spaces that need to be processed simultaneously, one work group can be arranged in multiple physical spaces at the same time.
As discussed above, the time to complete the work for one work package varies greatly depending on the generation composition of the work package and whether the gang form is used repeatedly. This is because the floor containing piloti or the rooftop floor has to use the existing Euroform, which makes the work more manpower-oriented, thus extending the construction period. In particular, in the case of projects with multiple residential buildings, such as the case projects, if the input plan for the work group is wrong, serious waiting or waste may occur. When the uncertainty inherent in the construction project in terms of project management creates synergy with the uncertainty of these individual projects, the general contractor can suffer serious economic losses.
5.2. Data Collection and Classification
The status of the queuing system can be determined by the number of customers in the queuing system. However, when a queuing system has recently started running, the state of the system (the number of customers in the system) is greatly affected by the initial state of the system and the elapsed time. Such a system is said to be in a transient state. However, after sufficient time has elapsed, the state of the system becomes independent of the initial state and the elapsed time. At this point, the system is said to have reached a steady state. The stationary distribution of the state of the system becomes constant regardless of the passage of time. Queue theory has mainly focused on the steady state because it is difficult to analyze the transient state. The following performance evaluation indexes (1)–(5) assume a stable state.
(1)
(2)
(3)
(4)
(5)
Therefore, in order to utilize the conceptual 4D digital twin framework proposed in this study, it is necessary to collect the work package data waiting for the service and the productivity data of the work group that provides the service, as shown in Table 2. System state analysis using the queue model includes several assumptions. When λn is constant for all n customers (work package), simply denote λ. If the service rate of all servers serving one or more customers is a constant, it is expressed as μ. In this case, if the number of customers (n) is equal to or greater than the number of servers (s) and all s servers are in service, μn is sμ. In this state, 1/λ is the interarrival time, and 1/μ is the average service time. Additionally, ρ is calculated as λ/sμ as the server utilization rate. It represents the average percentage of time that individual servers are busy. This is because ρ represents the ratio of service capacity (sμ) available to customers (λ) arriving on average. Table 4 shows the number of residential buildings assigned to one work group and the mean service rate (μ) according to the activity cycle. A person who makes decisions about resource input would want individual servers to be working all the time without waiting or wastage.
As such, there are many situations to consider in the decision-making problem of resource input, even if the system is simply expressed. Even if the amount of work is distributed and the activity cycle is determined, the status of resource input should be continuously monitored in consideration of the overall process progress. In addition, if the number of work groups cannot be increased, there should be guidelines for the maximum number of input personnel that can handle a unit task in order to minimize waiting or waste of work packages being worked on at the same time or in one activity cycle. The case projects included 8 and 12 residential buildings, respectively, and the actual construction progress was operated through two work groups with formwork, rebar work, and concrete work as one work package. However, the site resource input plan is expressed in Table 5. For flexible operation, there is a guide on the number of manpower to be put into each work group. However, since the productivity of the actual inputted manpower is different, the problem of how much manpower must be put in to complete the work for one work package contains a lot of uncertainty. In addition to the one work group in charge of one work package, the stairs team and the gang form team were operated separately. This is an area that depends on the construction contract. That is, formwork, rebar work, and concrete work can be managed through a contract with one company. However, at the actual site, contracts for rebar and formwork, ready-mixed concrete pouring work, rebar shop drawing, tower crane, and aluminum form and gang form work were made individually. In this case, the complexity of project resource allocation increases.
The 4D digital twin framework proposed in this study simplifies such a complex system and can be utilized for decision making considering productivity data and the amount of work to be processed through the queueing model included in the framework.
5.3. Evaluation of Resource Allocation
5.3.1. M/M/s Queueing Model
In the queuing system of the apartment construction project, the customer is the work package. The time between customer arrivals is called the interarrival time in the queuing system. Predicting when a customer work package will arrive in a queuing system is highly uncertain because, as previously analyzed, due to the characteristics of the apartment construction project, the work on the preceding work package may take very long or very short compared to the 7-day activity cycle. However, if sufficient data on customers arriving at the queuing system can be obtained, the average number of arriving customers (e.g., work package) per unit time (e.g., construction period) can be estimated. This is called the mean arrival rate and is denoted by the Greek letter λ. It is also possible to estimate a probability distribution for the interarrival time. The mean of this probability distribution can be obtained from the mean arrival rate (λ). Because λ is the average arrival rate of customers arriving at the queuing system, the average of the probability distribution over the interarrival time is 1/λ. Most queuing models assume an exponential distribution as the probability distribution of interarrival time [65].
In most queue systems, customers arrive randomly. The exponential distribution is the only probability distribution that adequately describes the random arrival property, which is called a Markovian property. In a basic queuing system, each customer is served individually on one server. A system with two or more servers is called a multi-server queuing system. In the case of an apartment construction project, the service provider (work group) may be a single server or may be multiple servers, depending on the number of work packages to be processed. The time from the moment a customer starts receiving a service to the moment the service is completed is called the service time. The service time is generally different for each customer. In the case of the ground floor framing of the apartment construction project, it takes much more time than the 7-day activity cycle in the case of the lower floors where gang forms are installed, the lower floors that require piloti correction, and the rooftop floors. However, the basic queuing model assumes that the service time has a certain probability distribution regardless of the server. The symbol used to represent the average of the probability distribution of service time is 1/μ. μ represents the average number of customers that one server can serve per unit time, assuming that the server runs without interruption. This is called the mean service rate (μ).
There are various models to analyze the queueing system, but in this study, a multiple server queueing model (M/M/s) was used. The first symbol (M) is the probability distribution for the interarrival time, and the second symbol (M) is the probability distribution for the service time. M represents an exponential distribution with Markovian property. In addition, a multiple server queueing model was used because it was necessary to analyze the performance when multiple work groups were input. This model has the following assumptions.
- The server utilization rate ρ is defined as λ/sμ.
- The queueing system is infinite.
- The queueing rule is FCFS (First Come, First Served).
The performance of a multiple server queuing model can be analyzed through two factors. One is to analyze how many customers are usually waiting in a queuing system. The other is to analyze the waiting time and the probability of waiting time for how long a customer usually has to wait to receive a service. These factors are usually expressed as average values. The basic equations for deriving L, Lq, W, and Wq in a multiple server queueing model are shown as Equations (1)–(5).
The most important equation for calculating the basic performance indexes in the queueing model is Little’s formula, which demonstrates the direct relationship between L and W, as shown in Equation (5) [66], and which also holds for Lq and Wq. If any of L, Lq, W, and Wq are analyzed, the remaining performance indexes can be obtained immediately, thus allowing analysis of the queueing system’s basic status. In addition to the basic performance index, a queueing model enables a probability analysis of the queueing system’s states, including the number of customers and the waiting time. If the server utilization rate ρ of the work group is high, the system state could deteriorate, incurring a waiting cost. Pn represents the stable state probability that there are n customers in the system. For example, if the goal is to have no more than three customers in the system for more than 95% of the time, P0 + P1 + P2 + P3 should be greater than or equal to 0.95. Equations (6) and (7) can be used to obtain Pn.
The probability of a customer’s waiting time t can be expressed as follows. Equation (8) represents the probability that a customer’s waiting time in the queueing system is longer than t, and Equation (9) represents the probability that the waiting time in the queue is longer than t.
Through the data analysis of the case projects in this study, a system state analysis as shown in Table 6 was assumed. Projects 1 and 2 simplify the input of actual case projects. Project 2’ is used to analyze the system state when the plan for case project 2 is operated as three work groups instead of two work groups that are the actual data. The total number of work packages to be processed during the construction period was calculated using the sum of the total number of floors of all residential buildings in each project.
The reason for the analysis of Project 2′ is to find out how improving service productivity by allocating additional resources to limited tasks reduces waiting for tasks. In this case, it is possible to improve the limitation of the resource allocation method proposed by Leu [61], which is applied only to a single building project. In the case of this study, it is possible to analyze the state of a more complex system because the number of floors of several buildings constructed in one project is set as the customer. In addition, it can be used for time–cost tradeoff analysis according to resource allocation. Through the queue model, it is possible to quantitatively analyze the number of customers (L, Lq) waiting in the system. These indicators (L, Lq) for the number of waiting customers can be reduced to waiting costs [42]. If the waiting cost is greater than the cost of additional input of the resource, the cost for finding the optimal point of the resource is also required. However, in this study, the analysis to find the optimal point between the waiting cost and the input cost of the server was excluded due to the difficulty of data collection.
5.3.2. Performance Evaluation Index of Queueing System Status
It is possible to quantitatively analyze the status of the queue system according to resource allocation through L, Lq, W, and Wq, which are the basic performance indicators of the queueing model, and the utilization rate of the server. Table 7 shows only some of the analysis results that can be suggested through this study. In project 1, one work group was assigned to work in four residential buildings, and in project 2, one work group was assigned to work in six residential buildings. Through the analysis examples presented in Table 6, the following analysis results can be derived. If the resource allocation of one work group to project 1 and 2 is the same, the index of the work group assigned to the work of six residential buildings will be relatively low. First of all, comparing the indicators when one activity cycle of project 1 and project 2 is analyzed as 7 days, the values of L and Lq are higher in Project 2 than in Project 1. However, it can be found that W and Wq values are lower in Project 2 than in Project 1. This is because Project 2 has a higher server utilization rate (ρ = λ/sμ) than Project 1 at 0.6222. In other words, it means that the input resources are used more than Project 1 for customer service processing.
In addition, the indicator when one activity cycle, which includes waiting and waste, is reduced from 7 days to 6 days can also be analyzed. It can be seen that L (1.6764→1.2757), Lq (0.5406→0.3022), W (3.1789→2.4192), and Wq (1.0252→0.5731) of project 1, the main indicators of the queue system, are improved. For project 2, it can be seen that L (2.0304→1.4906), Lq (0.7860→0.4239), W (2.4045→1.7651), and Wq (0.9308→0.5020) are improved. As such, the queue model provides quantitative analysis results on the current operating state of the system and results for resource input improvement. With these forecasts, the construction project manager can simplify the problem by how many additional people would need to be added to each task to reduce one activity cycle from 7 days to 6 days. This is because, in most projects, the amount of work and the period to be processed are fixed. Therefore, it is possible to monitor the system status according to the improvement of the μ index indicating service productivity rather than the λ variable indicating the arrival of customers in the queueing model. In this dimension, BIM included in the 4D digital twin framework can provide quantitative information about one work package. In other words, in order to determine how much work is delayed, you can utilize the amount of form work, rebar work, and concrete work, etc., per one work package as a unit. In addition, when the quantity for the unit work is calculated, the number of workers may be determined in consideration of the productivity of the unit work. This enables flexible work group arrangement and resource allocation considering the maximum capacity of one work group.
In addition, Project 2’ can be directly compared to project 2. In the case of project 2, one work group was in charge of six residential buildings, whereas in Project 2’, one work group was in charge of four residential buildings, and one work group was added to handle the total amount of work. In this case, Project 2’ shows an improved performance index compared to project 2. However, in Project 2’, an economic problem arises due to the additional input of one work group. This problem requires time–cost tradeoff analysis according to resource allocation. In the conceptual 4D digital twin framework proposed in this study, the number of customers waiting in the system (L, Lq) can be utilized to calculate the waiting cost. Conversely, the cost of adding one work group is a server cost and requires data from the actual project. It is beyond the scope of this study to find the optimal number of work groups that can minimize the total cost of waiting cost and server cost. Ham et al. [42] used the multiple server queue model used in this study for the purpose of determining the optimal number of BIM staff supporting BIM RFI. However, since one work group, the server unit of this study, includes all human resources for each type of work, there is a limit to economic analysis. Therefore, it was excluded from the scope of this study. Economic analysis research needs to be conducted in the future by collecting detailed construction quantity data, and productivity and labor cost data, etc.
In the case of apartment construction, the number of work packages to be processed in one project and the construction period are constants. Therefore, the performance of the project can be determined depending on how the subcontractors are allocated, that is, how the work groups are arranged. In this dimension, the conceptual 4D digital twin framework of this study provides a basis for further systematizing empirical knowledge.
5.3.3. Probability Analysis of the Number of Work Package(WP)s in the Queueing System
In addition to basic performance indicators, the way to determine the status of the queue system is to analyze the probability of how many customers are waiting to be served in the system. Table 8 shows the probability that a customer work package will have to wait more than one day in the queuing system of the proposed framework according to the amount of work allocated to the work group and the duration of one activity cycle. Even in this case, it is possible to confirm the improvement of the system state according to the input of additional resources. When one activity cycle is 6 days, the probability of having to wait for a subsequent work package to receive service is improved. As such, it is possible to check how much system status monitoring and decision making based on empirical knowledge improve the system through the 4D digital twin framework.
6. Practical Implications and Discussion
Based on the results of this study, some practical implications are presented as follows. First, a research approach considering the uncertainty of the construction project was proposed. Through a manufacturing-based research approach, the production system of complex apartment construction was simplified into work packages and work groups that provide services to customers to be serviced. Second, a conceptual 4D digital twin framework that can overcome the limitations of BIM was proposed through a simplified research approach and queue theory in management science. BIM is a physical model that provides quantitative information about the work to be processed, and the queuing model is a decision support model that can monitor the system status according to various statuses based on empirical knowledge.
In addition to framing the ground floor using traditional construction methods, this framework can be utilized for monitoring the progress of constructions with high complexity and uncertainty, such as large-scale earthworks, foundation construction, basement framing construction, and ground floor finishing construction and supporting optimal resource input. In particular, in the case of final finishing construction, the same specification may not be applied, even if the same floor plan is a similar generation, depending on the needs of future owners. In this queuing model, the customer can be defined as a work package that includes various closing specifications for one generation, and, accordingly, the complexity of and uncertainty about the time of service that the service provider must provide may increase.
Lastly, the conceptual 4D digital twin framework proposed by fusion of the schedule and resource allocation-targeted BIM and queuing model can be extended to a 5D digital twin framework considering quantity and cost Although complexity increases when CBS is linked in addition to OBS and WBS, a new cost–schedule integrated management model can be proposed through convergence with traditional project management methods.
7. Conclusions
This study raises research questions about the uncertainties caused by waiting and waste in apartment construction projects through theoretical considerations and actual project investigations. To solve this problem, the queueing model was used as a research approach to simplify the complex construction production system. The queueing model is used for monitoring the condition of production systems in manufacturing and optimizing layout plans. In this study, a conceptual 4D digital twin framework was proposed to manage the apartment construction process using this model. The characteristics of this framework provide the reality of digital twin that can be used for research in the construction field by grafting queueing theory to raise the value of BIM as an information model. In particular, several statuses were analyzed through the conceptual 4D digital twin framework using actual data on the management standards of subcontractors used in apartment construction projects. As a result of the analysis, it was difficult to control the total amount of work during the construction period, so it was necessary to improve the way work was handled. That is, the service provider needs to establish a process plan and optimally allocate resources to handle the assigned tasks. In this regard, this study proposed a framework capable of process planning and management, resource allocation, and system status monitoring.
Despite the practical usefulness derived from this study, the limitations of the study are summarized as follows. This framework does not solve all the empirical decision making in the field, which is the research problem that was initially raised. The queue model that supports decision making in this framework helps to quantitatively analyze the state of the system according to the input data based on empirical knowledge. However, it cannot provide an optimized resource allocation solution because it is learned by accumulated experience. Therefore, in future research, a research methodology that can support optimal decision making is needed by considering quantitative information on the quantity of one work package, productivity data for unit work, and an economic feasibility review for one work group input. In order to solve such complex decision-making problems, the application of machine learning technology, which is emerging recently, should be considered. In addition, in terms of the expansion of the knowledge area, it is also necessary to expand the physical construction site, such as in the finishing work.
Author Contributions
Conceptualization, W.-G.K. and N.H.; methodology, W.-G.K. and N.H.; validation, W.-G.K.; formal analysis, W.-G.K. and N.H.; investigation, W.-G.K.; data curation, W.-G.K.; writing—original draft preparation, W.-G.K.; writing—review and editing, N.H. and J.-J.K.; visualization, W.-G.K.; supervision, J.-J.K. All authors have read and agreed to the published version of the manuscript.
Funding
This work was supported by the National Research Foundation of Korea (NRF) grant funded by the Korea government (MSIT) (No. 2021R1F1A1052050).
Data Availability Statement
The data presented in this study are not publicly available due to the continuation of research. The data are available on request from the corresponding author.
Conflicts of Interest
The authors declare that there are no conflicts of interest regarding the publication of this paper.
References
- Dabirian, S.; Abbaspour, S.; Khanzadi, M.; Ahmadi, M. Dynamic modelling of human resource allocation in construction projects. Int. J. Constr. Manag. 2019, 1–10. [Google Scholar] [CrossRef]
- McTague, B.; Jergeas, G. Productivity Improvements on Alberta Major Construction Projects: Phase I—Back to Basics; Alberta Economic Development: Calgary, AB, USA, 2002. [Google Scholar]
- Sacks, R.; Eastman, C.; Lee, G.; Teicholz, P. BIM Handbook: A Guide to Building Information Modeling for Owners, Designers, Engineers, Contractors, and Facility Managers, 3rd ed.; John Wiley & Sons, Inc.: Hoboken, NJ, USA, 2018. [Google Scholar] [CrossRef]
- Lee, G.; Park, H.K.; Won, J. D3 City project—Economic impact of BIM-assisted design validation. Autom. Constr. 2012, 22, 577–586. [Google Scholar] [CrossRef]
- Kim, S.; Chin, S.; Han, J.; Choi, C.-H. Measurement of Construction BIM Value Based on a Case Study of a Large-Scale Building Project. J. Manag. Eng. 2017, 33, 05017005. [Google Scholar] [CrossRef]
- Ham, N.; Moon, S.; Kim, J.H.; Kim, J.J. Economic analysis of design errors in BIM-based high-rise construction projects: Case study of Haeundae L project. J. Constr. Eng. Manag. 2018, 144, 05018006. [Google Scholar] [CrossRef]
- Lee, J.; Kim, J. BIM-Based 4D Simulation to Improve Module Manufacturing Productivity for Sustainable Building Projects. Sustainability 2017, 9, 426. [Google Scholar] [CrossRef] [Green Version]
- Boton, C. Supporting constructability analysis meetings with Immersive Virtual Reality-based collaborative BIM 4D simulation. Autom. Constr. 2018, 96, 1–15. [Google Scholar] [CrossRef]
- Lu, Q.; Won, J.; Cheng, J.C. A financial decision making framework for construction projects based on 5D Building Information Modeling (BIM). Int. J. Proj. Manag. 2016, 34, 3–21. [Google Scholar] [CrossRef]
- Wang, X.; Yung, P.; Luo, H.; Truijens, M. An innovative method for project control in LNG project through 5D CAD: A case study. Autom. Constr. 2014, 45, 126–135. [Google Scholar] [CrossRef]
- Cheng, E.W.; Li, H. Information priority-setting for better resource allocation using analytic hierarchy process (AHP). Inf. Manag. Comput. Secur. 2001, 9, 61–70. [Google Scholar] [CrossRef]
- Zhang, H.; Li, H. Simulation-based optimization for dynamic resource allocation. Autom. Constr. 2004, 13, 409–420. [Google Scholar] [CrossRef]
- Liu, Y.; Zhao, S.L.; Du, X.K.; Li, S.Q. Optimization of resource allocation in construction using genetic algorithms. In Proceedings of the 2005 International Conference on Machine Learning and Cybernetics, Guangzhou, China, 18–21 August 2005; IEEE: Piscataway, NJ, USA, 2005; Volume 6, pp. 3428–3432. [Google Scholar]
- Sacks, R.; Harel, M. An economic game theory model of subcontractor resource allocation behaviour. Constr. Manag. Econ. 2006, 24, 869–881. [Google Scholar] [CrossRef]
- Sharma, V.; Abel, J.; Al-Hussein, M.; Lennerts, K.; Pfründer, U. Simulation application for resource allocation in facility management processes in hospitals. Facilities 2007, 25, 493–506. [Google Scholar] [CrossRef]
- Ibbs, W.; Nguyen, L.D. Schedule Analysis under the Effect of Resource Allocation. J. Constr. Eng. Manag. 2007, 133, 131–138. [Google Scholar] [CrossRef]
- Zhong, Y.; Chen, Z.; Zhou, Z.; Hu, H. Uncertainty analysis and resource allocation in construction project management. Eng. Manag. J. 2018, 30, 293–305. [Google Scholar] [CrossRef]
- Leon, H.; Osman, H.; Georgy, M.; Elsaid, M. System Dynamics Approach for Forecasting Performance of Construction Projects. J. Manag. Eng. 2018, 34, 04017049. [Google Scholar] [CrossRef]
- Love, P.; Mandal, P.; Li, H. Determining the causal structure of rework influences in construction. Constr. Manag. Econ. 1999, 17, 505–517. [Google Scholar] [CrossRef]
- Han, S.; Lee, S.; Peña-Mora, F. Identification and Quantification of Non-Value-Adding Effort from Errors and Changes in Design and Construction Projects. J. Constr. Eng. Manag. 2012, 138, 98–109. [Google Scholar] [CrossRef]
- Hwang, S.; Park, M.; Lee, H.-S.; Lee, S. Hybrid Simulation Framework for Immediate Facility Restoration Planning after a Catastrophic Disaster. J. Constr. Eng. Manag. 2016, 142, 04016026. [Google Scholar] [CrossRef]
- Mhatre, T.N.; Thakkar, J.J.; Maiti, J. Modelling critical risk factors for Indian construction project using interpretive ranking process (IRP) and system dynamics (SD). Int. J. Qual. Reliab. Manag. 2017, 34, 1451–1473. [Google Scholar] [CrossRef]
- Wu, X.; Yuan, H.; Wang, G.; Li, S.; Wu, G. Impacts of Lean Construction on Safety Systems: A System Dynamics Approach. Int. J. Environ. Res. Public Health 2019, 16, 221. [Google Scholar] [CrossRef] [Green Version]
- Halpin, D.W. CYCLONE-method for modeling job site processes. ASCE J. Constr. Div. 1977, 103, 489–499. Available online: https://trid.trb.org/view/59949 (accessed on 11 September 2021). [CrossRef]
- Halpin, D.W.; Riggs, L.S. Planning and Analysis of Construction Operations; John Wiley & Sons, Inc.: New York, NY, USA, 1992. [Google Scholar]
- Chang, D.M. RESQUE: A Resource Based Simulation System for Construction Process Planning. Network, Allocation. Ph.D. Thesis, University of Michigan, Ann Arbor, MI, USA, 1986. Available online: https://deepblue.lib.umich.edu/handle/2027.42/161221 (accessed on 19 October 2021).
- Liu, L.Y. COOPS: Construction Object-Oriented Simulation System. Ph.D. Thesis, University of Michigan, Ann Arbor, MI, USA, 1991. Available online: https://deepblue.lib.umich.edu/handle/2027.42/128820 (accessed on 19 October 2021).
- Martinez, J.C. Stroboscope: State and Resource Based Simulation of Construction Processes. Ph.D. Thesis, University of Michigan, Ann Arbor, MI, USA, 1996. Available online: https://deepblue.lib.umich.edu/handle/2027.42/104987 (accessed on 19 October 2021).
- Hawng, D.; Kwon, O.; Choi, Y. Lifting Work Process Optimization Method in High-rise Building Construction Through Improvement of CYCLONE Modeling Method. Korean J. Constr. Eng. Manag. 2017, 18, 58–70. [Google Scholar] [CrossRef] [Green Version]
- Lawrence, P. Workflow Handbook; John Wiley & Sons, Inc.: New York, NY, USA, 1997. [Google Scholar]
- Truong, N.K.V.; Choi, Y.; Kim, I.; Shin, S.; Hwang, W.J. A probabilistic approach to workflow time analysis for business process management. World Acad. Sci. Eng. Technol. 2009, 53, 797–801. [Google Scholar]
- Gillard, J.; Knight, V. Using Singular Spectrum Analysis to obtain staffing level requirements in emergency units. J. Oper. Res. Soc. 2014, 65, 735–746. [Google Scholar] [CrossRef] [Green Version]
- Kolesar, P.J.; Rider, K.L.; Crabill, T.B.; Walker, W.E. A Queuing-Linear Programming Approach to Scheduling Police Patrol Cars. Oper. Res. 1975, 23, 1045–1062. [Google Scholar] [CrossRef] [Green Version]
- Ingolfsson, A.; Haque, A.; Umnikov, A. Accounting for time-varying queueing effects in workforce scheduling. Eur. J. Oper. Res. 2002, 139, 585–597. [Google Scholar] [CrossRef]
- Bookbinder, J.; Martell, D. Time-Dependent Queueing Approach to Helicopter Allocation for Forest Fire Initial-Attack. INFOR: Inf. Syst. Oper. Res. 1979, 17, 58–70. [Google Scholar] [CrossRef]
- Jung, W. Recoverable inventory systems with time-varying demand. ProQuest. Prod. Inventory Manag. J. 1993, 34, 77–81. Available online: http://search.proquest.com.ssl.access.hanyang.ac.kr/docview/199876806?accountid=11283 (accessed on 5 October 2021).
- Koopman, B.O. Air-Terminal Queues under Time-Dependent Conditions. Oper. Res. 1972, 20, 1089–1114. [Google Scholar] [CrossRef]
- Bookbinder, J. Multiple Queues of Aircraft Under Time-Dependent Conditions. Inf. Syst. Oper. Res. 1986, 24, 280–288. [Google Scholar] [CrossRef]
- Chakroborty, P.; Gill, R.; Chakraborty, P. Analysing queueing at toll plazas using a coupled, multiple-queue, queueing system model: Application to toll plaza design. Transp. Plan. Technol. 2016, 39, 675–692. [Google Scholar] [CrossRef]
- Zhang, M.; Ji, S.; Zhou, K. Modelling and application on the extension scale of port based on queuing theory. In Proceedings of the 2010 9th International Symposium on Distributed Computing and Applications to Business, Engineering and Science, Hong Kong, China, 10–12 August 2010; pp. 663–666. [Google Scholar] [CrossRef]
- Lee, J.-S.; Kwon, N.; Ham, N.-H.; Kim, J.-J.; Ahn, Y.-H. BIM-Based Digital Fabrication Process for a Free-Form Building Project in South Korea. Adv. Civ. Eng. 2019, 2019, 1–18. [Google Scholar] [CrossRef] [Green Version]
- Ham, N.; Moon, S.; Kim, J.H.; Kim, J.J. Optimal BIM staffing in construction projects using a queueing model. Autom. Constr. 2020, 113, 103123. [Google Scholar] [CrossRef]
- Kim, J.W.; Ham, N.; Kim, J.J. Quantitative Analysis of Waiting Length and Waiting Time for Frame Construction Work Activities Using a Queue Model; Focusing on Korean Apartment Construction. Sustainability 2021, 13, 3778. [Google Scholar] [CrossRef]
- Ding, L.; Zhou, Y.; Akinci, B. Building Information Modeling (BIM) application framework: The process of expanding from 3D to computable nD. Autom. Constr. 2014, 46, 82–93. [Google Scholar] [CrossRef]
- Grieves, M.; Vickers, J. Digital Twin: Mitigating Unpredictable, Undesirable Emergent Behavior in Complex Systems. In Transdisciplinary Perspectives on Complex Systems; Kahlen, F.J., Flumerfelt, S., Alves, A., Eds.; Springer: Cham, Switzerland, 2017. [Google Scholar] [CrossRef]
- Glaessgen, E.; Stargel, D. (2012, April). The digital twin paradigm for future NASA and US Air Force vehicles. In Proceedings of the 53rd AIAA/ASME/ASCE/AHS/ASC Structures, Structural Dynamics and Materials Conference, Honolulu, Hawaii, 23–26 June 2012; p. 1818. [Google Scholar]
- Tao, F.; Cheng, J.; Qi, Q.; Zhang, M.; Zhang, H.; Sui, F. Digital twin-driven product design, manufacturing and service with big data. Int. J. Adv. Manuf. Technol. 2017, 94, 3563–3576. [Google Scholar] [CrossRef]
- Kuhn, T. Digitaler Zwilling. Informatik-Spektrum 2017, 40, 440–444. [Google Scholar] [CrossRef]
- Boschert, S.; Rosen, R. Digital Twin—The Simulation Aspect. In Mechatronic Futures; Springer: Cham, Switzerland, 2016; pp. 59–74. [Google Scholar]
- Rosen, R.; von Wichert, G.; Lo, G.; Bettenhausen, K.D. About the Importance of Autonomy and Digital Twins for the Future of Manufacturing. IFAC-PapersOnLine 2015, 48, 567–572. [Google Scholar] [CrossRef]
- Kritzinger, W.; Karner, M.; Traar, G.; Henjes, J.; Sihn, W. Digital Twin in manufacturing: A categorical literature review and classification. IFAC-PapersOnLine 2018, 51, 1016–1022. [Google Scholar] [CrossRef]
- D’Addona, D.M.; Ullah, A.S.; Matarazzo, D. Tool-wear prediction and pattern-recognition using artificial neural network and DNA-based computing. J. Intell. Manuf. 2017, 28, 1285–1301. [Google Scholar] [CrossRef]
- Susto, G.A.; Schirru, A.; Pampuri, S.; McLoone, S.; Beghi, A. Machine Learning for Predictive Maintenance: A Multiple Classifier Approach. IEEE Trans. Ind. Informatics 2014, 11, 812–820. [Google Scholar] [CrossRef] [Green Version]
- Uhlemann, T.H.-J.; Lehmann, C.; Steinhilper, R. The Digital Twin: Realizing the Cyber-Physical Production System for Industry 4.0. Procedia CIRP 2017, 61, 335–340. [Google Scholar] [CrossRef]
- Sacks, R.; Brilakis, I.; Pikas, E.; Xie, H.S.; Girolami, M. Construction with digital twin information systems. Data-Cent. Eng. 2020, 1, E14. [Google Scholar] [CrossRef]
- González, P.; González, V.; Molenaar, K.; Orozco, F. Analysis of Causes of Delay and Time Performance in Construction Projects. J. Constr. Eng. Manag. 2014, 140, 04013027. [Google Scholar] [CrossRef]
- Castro-Lacouture, D.; Süer, G.A.; Gonzalez-Joaqui, J.; Yates, J.K. Construction Project Scheduling with Time, Cost, and Material Restrictions Using Fuzzy Mathematical Models and Critical Path Method. J. Constr. Eng. Manag. 2009, 135, 1096–1104. [Google Scholar] [CrossRef]
- Hewage, K.N.; Ruwanpura, J.Y. Carpentry workers issues and efficiencies related to construction productivity in commercial construction projects in Alberta. Can. J. Civ. Eng. 2006, 33, 1075–1089. [Google Scholar] [CrossRef]
- Jung, M.-H.; Park, M.-S.; Lee, H.-S.; Kim, H.-S. Weather-delay simulation model based on vertical weather profile for high-rise building construction. J. Constr. Eng. Manag. 2016, 142, 04016007. [Google Scholar] [CrossRef]
- Lee, H.-S.; Shin, J.-W.; Park, M.S.; Ryu, H.-G. Probabilistic Duration Estimation Model for High-Rise Structural Work. J. Constr. Eng. Manag. 2009, 135, 1289–1298. [Google Scholar] [CrossRef] [Green Version]
- Leu, S.-S.; Hwang, S.-T. Optimal Repetitive Scheduling Model with Shareable Resource Constraint. J. Constr. Eng. Manag. 2001, 127, 270–280. [Google Scholar] [CrossRef]
- Petruseva, S.; Zileska-Pancovska, V.; Zujo, V. Predicting construction project duration with support vector machine. Int. J. Res. Eng. Technol. 2013, 2, 12–24. [Google Scholar]
- Golizadeh, H.; Sadeghifam, A.N.; Aadal, H.; Majid, M.Z.A. Automated tool for predicting duration of construction activities in tropical countries. KSCE J. Civ. Eng. 2016, 20, 12–22. [Google Scholar] [CrossRef]
- Zheng, L.; Kim, W.; Ham, N.; Kim, J.J. Apartment house project cost schedule for integrated management BIM-based BoQ application plan. J. KIBIM 2021, 11, 1–16. [Google Scholar]
- Hillier, F.S.; Hillier, M.S. Introduction to Management Science: A Modeling and Case Studies Approach with Spreadsheets, 4th ed.; McGraw-Hill Education: New York, NY, USA, 2010; ISBN 007809660X. [Google Scholar]
- Little, J.D.C. A Proof for the Queuing Formula: L = λW. Oper. Res. 1961, 9, 383–387. [Google Scholar] [CrossRef]
Figure 1.
Research approach.

Figure 2.
Conceptual 4D Digital Twin Framework.

Figure 3.
BIM model for apartment construction project.

Figure 4.
Project Cases of Apartment Construction project.


Table 1.
Different types of servers and customers in the queuing model application study.
| Application Area | Researcher | Server (Service Provider) | Customer (Service Request) |
|---|---|---|---|
| Health care | Gillard and Knight [32] | Administrative and clinical staff | Patients |
| Emergency services | Kolesar et al. [33] | Police patrol cars | Calls for police service |
| Ingolfsson et al. [34] | Police patrol cars | Calls for police service | |
| Bookbinder and Martell [35] | Helicopters (initial attack crews) | Forest fires | |
| Repair facilities | Jung [36] | Serviceable units (safety stock) | Failed units |
| Air traffic | Koopman [37] | Landing service | Stacked aircraft |
| Bookbinder [38] | Landing service | Stacked aircraft | |
| Transportation planning | Partha et al. [39] | Toll plaza | Vehicles |
| Container terminal | Zhang et al. [40] | Port expansion | Containers |
Table 2.
7-day activity cycle description for 1 reference floor in Korean apartment construction project.
Table 2.
7-day activity cycle description for 1 reference floor in Korean apartment construction project.
| D + Day | Activity | Activity Name | Start | Finish | Time (Day) | Supervise |
|---|---|---|---|---|---|---|
| D + 1 |  | N-floor concrete curing | 7:00 | 14:00 | 0.6 | Quality manager |
| N-floor concrete strength check | 14:00 | 15:00 | 0.1 | |||
| Making | 15:00 | 17:00 | 0.2 | Formwork manager | ||
| Inspection | 17:00 | 18:00 | 0.1 | Supervisor | ||
| D + 2 |  | Gang form lifting (From N-floor to N + 1-floor) | 7:00 | 11:00 | 0.4 | Formwork manager |
| N-floor formwork dismantling | 7:00 | 16:00 | 0.8 | |||
| N + 1-floor wall rebar lifting | 11:00 | 12:00 | 0.1 | Rebar work manager | ||
| N + 1-floor wall rebar installation | 13:00 | 18:00 | 0.5 | |||
| D + 3 |  | N + 1-floor wall rebar installation | 7:00 | 12:00 | 0.5 | Rebar work manager |
| N + 1-floor electrical equipment (e.g., sleeve, box) installation at wall | 13:00 | 18:00 | 0.5 | - | ||
| N + 1-floor wall rebar inspection | 17:00 | 18:00 | 0.1 | Supervisor | ||
| D + 4 |  | N + 1-floor form transport | 7:00 | 12:00 | 0.5 | Formwork manager |
| N + 1-floor wall and slab formwork installation | 7:00 | 18:00 | 1.0 | |||
| D + 5 |  | N + 1-floor wall and slab formwork installation | 7:00 | 18:00 | 1.0 | Formwork manager |
| N + 1-floor slab rebar lifting | 16:00 | 18:00 | 0.2 | Rebar work manager | ||
| D + 6 |  | N + 1-floor slab rebar installation | 7:00 | 18:00 | 1.0 | |
| N + 1-floor electrical equipment (e.g., sleeve, box) installation at slab | 13:00 | 18:00 | 0.5 | - | ||
| N + 1-floor inspection before concrete pouring | 16:00 | 18:00 | 0.2 | Supervisor | ||
| D + 7 |  | N + 1-floor concrete pouring | 7:00 | 16:00 | 0.8 | Concrete work manager |
Table 3.
Work package data (arrivals of service requests) for project cases.
| Classification | Project Case 1 | Project Case 2 | |
|---|---|---|---|
| No. of residential building | 8 (19F–21F) | 12 (19F–36F) | |
| Work package (WP) | No. of floors including piloti | 10 | 4 |
| No. of floors that need correction of gang form | 8 | 4 | |
| No. of repeated reference floors | 138 | 360 | |
| No. of rooftop floors | 8 | 12 | |
| Total | 164 | 380 | |
| Frame construction period of ground floor | 311 days | 450 days | |
| Planned first floor average construction period | 24 days | 26 days | |
Table 4.
Mean service rate according to work assignment for one work group and activity cycle.
| Activity Cycle | 4 Residential Buildings/Work Group (WG) | 5 Residential Buildings/Work Group (WG) | 6 Residential Buildings/Work Group (WG) | ||||||
|---|---|---|---|---|---|---|---|---|---|
| Work Package (WP) | Duration (Days) | Mean Service Rate (μ) | Work Package (WP) | Duration (Days) | Mean Service Rate (μ) | Work Package (WP) | Duration (Days) | Mean Service Rate (μ) | |
| 6 day | 13 | 24 | 0.5417 | 16 | 24 | 0.6667 | 19 | 24 | 0.7917 |
| 7 day | 13 | 28 | 0.4643 | 16 | 28 | 0.5714 | 19 | 28 | 0.6786 |
Table 5.
Allocation of work groups at case projects.
| Classification | Formwork | Rebar Work | Concrete Work | Note | ||||
|---|---|---|---|---|---|---|---|---|
| Team Composition | No. of Labor | Team Composition | No. of Labor | Team Composition | No. of Labor | |||
| Ground Floor | A Zone | 1 work group | 15–20 people | 2 work group | Flexible operation according to site conditions | 1 work group | 7 people per work group required for one concrete pouring | Formwork labor (42–56 people) |
| B Zone | 1 work group | 15–20 people | ||||||
| Stair work | 1 work group | 8–10 people | ||||||
| Gang form work | 1 work group | 4–8 people | ||||||
Table 6.
System state analysis using M/M/s queue model.
| Classification | Project 1 | Project 2 | Project 2’ |
|---|---|---|---|
| No. of residential buildings | 8 | 12 | 12 |
| No. of work groups | 2 | 2 | 3 |
| No. of residential buildings/work group | 4 | 6 | 4 |
| Total work package | 164 | 380 | 380 |
| Frame construction period of ground floor | 311 | 450 | 450 |
Table 7.
Performance analysis indices for apartment frame construction periods.
| Classification | Project 1 | Project 2 | Project 2’ | |||
|---|---|---|---|---|---|---|
| Monitoring of System Status | Real | Virtual | Real | Virtual | Virtual | Virtual |
| 1 activity cycle duration of work package | 7 days | 6 days | 7 days | 6 days | 7 days | 6 days |
| Mean arrival rate (λ) | 0.5273 | 0.5273 | 0.8444 | 0.8444 | 0.8444 | 0.8444 |
| Mean service rate (μ) | 0.4643 | 0.5417 | 0.6786 | 0.7917 | 0.6786 | 0.7917 |
| No. of server | 2 | 2 | 2 | 2 | 3 | 3 |
| L (No. of WP in queueing system) | 1.6764 | 1.2757 | 2.0304 | 1.4906 | 1.3534 | 1.1253 |
| Lq (No. of WP in queue) | 0.5406 | 0.3022 | 0.7860 | 0.4239 | 0.1090 | 0.0587 |
| W (Waiting time in queueing system, days) | 3.1789 | 2.4192 | 2.4045 | 1.7651 | 1.6027 | 1.3326 |
| Wq (Waiting time in queue, days) | 1.0252 | 0.5731 | 0.9308 | 0.5020 | 0.1291 | 0.0695 |
| Server utilization rate (ρ = λ/sμ) | 0.5679 | 0.4867 | 0.6222 | 0.5333 | 0.4148 | 0.3555 |
Table 8.
Probability analysis of the number of Work package(WP)s.
| Classification | Project 1 | Project 2 | Project 2’ | |||
|---|---|---|---|---|---|---|
| Monitoring of System Status | Real | Virtual | Real | Virtual | Virtual | Virtual |
| 1 activity cycle duration of work package | 7days | 6days | 7days | 6days | 7days | 6days |
| P(cW > 1), | 0.7525 | 0.6815 | 0.6861 | 0.5897 | 0.5488 | 0.4801 |
| P(cWq > 1), | 0.2754 | 0.1828 | 0.2858 | 0.1772 | 0.0467 | 0.0230 |
Publisher’s Note: MDPI stays neutral with regard to jurisdictional claims in published maps and institutional affiliations. |
© 2021 by the authors. Licensee MDPI, Basel, Switzerland. This article is an open access article distributed under the terms and conditions of the Creative Commons Attribution (CC BY) license (https://creativecommons.org/licenses/by/4.0/).
Share and Cite
MDPI and ACS Style
Kim, W.-G.; Ham, N.; Kim, J.-J. Enhanced Subcontractors Allocation for Apartment Construction Project Applying Conceptual 4D Digital Twin Framework. Sustainability 2021, 13, 11784. https://doi.org/10.3390/su132111784
AMA Style
Kim W-G, Ham N, Kim J-J. Enhanced Subcontractors Allocation for Apartment Construction Project Applying Conceptual 4D Digital Twin Framework. Sustainability. 2021; 13(21):11784. https://doi.org/10.3390/su132111784
Chicago/Turabian StyleKim, Woong-Gi, Namhyuk Ham, and Jae-Jun Kim. 2021. "Enhanced Subcontractors Allocation for Apartment Construction Project Applying Conceptual 4D Digital Twin Framework" Sustainability 13, no. 21: 11784. https://doi.org/10.3390/su132111784
Note that from the first issue of 2016, this journal uses article numbers instead of page numbers. See further details here.