
The Economic Valuation of Ecosystem Services of Biodiversity Components in Protected Areas: A Review for a Framework of Analysis for the Gargano National Park

 , ,
, ,  , and
, and
Abstract
:1. Introduction
ES, Biodiversity Definition and Their Relationship
- -
- Provisioning services: which represent the contribution of the ecosystem to goods extracted or collected from the ecosystem (e.g., genetic resources, food, fresh water, etc.);
- -
- Regulating services: which represent ES ability to regulate biological processes, influencing climatic and hydrological cycles and maintaining the environmental conditions benefited by the society and individuals (e.g., air quality regulation, erosion regulation, climate regulation, etc.);
- -
- Cultural services: which include non-tangible services. They refer to the experiences that human beings could benefit from ecosystems (e.g., cultural, spiritual, recreation, etc.).
- -
- Supporting services: which are the services necessary for the production of other ES (nutrient cycling and primary production).
2. ES Mapping Techniques
- (1)
- WebGIS. With a WebGIS, traditional DesktopGIS applications can be implemented on a web server (also called map server) allowing the interaction between the cartography and the associated data. The data processing offered by web interfaces are nowadays still limited compared to DesktopGIS software, but it is still possible to carry out targeted queries and analyses. The strength of WebGIS is the availability of information regardless of the platform, installation and location. In addition, WebGIS can be consulted through Client-type applications, which can be generic (web browser) or specific (GIS software). Several types of WebGIS applications are available according to the degree of complexity [43], provided by the following services: viewing, associated info (attributes), processing queries/tools, data and mapping download and upload and instructions. The following WebGIS sites are used for biodiversity and ESs mapping: SoilConsWeb (Multifunctional Soil Conservation and Land Management through the Development of a Web-Based Spatial Decision Supporting System) [44], Rewetland (widespread introduction of constructed wetlands for a wastewater treatment of Agro Pontino ) [45], FaceCoast (FACE i.e. the challenge of climate change in the med COASTal zones) [46], HABEaS (Hotspot Areas for Biodiversity and Ecosystem Services) [47] and Lakes ES (Lakes Ecosystem Service) [48].
- (2)
- The assessment of supply and demand of ES in protected areas, applied to potable water and protection from hydrological instability and aesthetic value [42]; crops for farmers, natural fodder for breeders, wood and fibres for processing and fuel use; and mushroom and truffle harvesting [52]. This method allows users to take into account the peculiarity of the territorial context under study.
- (3)
- GIS techniques. It provides attractive valuations through photointerpretation in terms of used surface through digital imaging and vegetation/habitat coverage change. On the other hand, the qualitative aspect is generally retrieved by means of phytosociological surveys (e.g., tree coverage, shrub and herbaceous layer, number of species surveyed and their relative coverage) and forestry data (e.g., presence of dead wood, pathogens) which provide further information on biodiversity, the conservation of the tree components and the sources of disturbance such as overgrazing, tourism, etc. The above queries and surveys should be repeated over time as suggested by the habitat monitoring manual for each habitat. Subsequently, for each recorded data (from forestry, vegetation, fauna and soil surveys) a value (to be defined) is generally attached. This value can be referred to, for example, the plant biodiversity index (ipb) (for phytosociological data), forest biodiversity index (ifod) (for forest data), fauna biodiversity index (ifab) and soil biodiversity index (isb) (on sampling and subsequent laboratory analysis). Other indicators may also apply such as an index of climatic biodiversity (icb) (temperature, precipitation, wind) and an index of insect biodiversity (iib) (detection of insects and small organisms at litter level). Finally, a specific algorithm is specified to provide a full value of biodiversity, useful for evaluating ES. The above multidisciplinary approach generally involves nine professional figures (a botanist, forest expert, fauna expert, soil scientist, climatologist, entomologist, economist, mathematician and GIS expert) leading to reliable data used as an estimated value for ES.
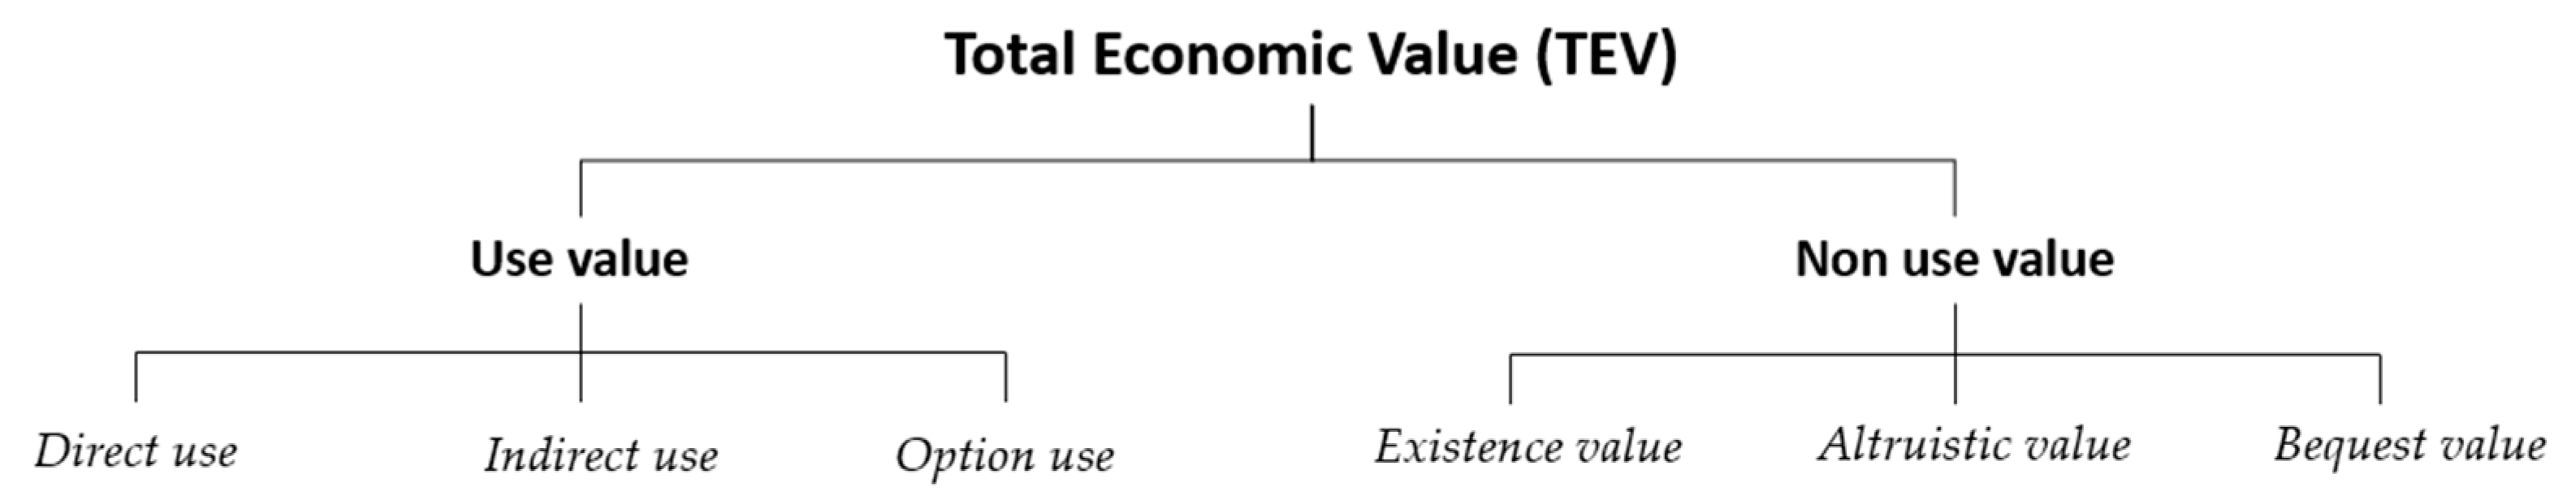
3. Total Economic Value and the Valuation Methods
3.1. Total Economic Value (TEV)
3.2. Valuation Methods
4. Literature Review
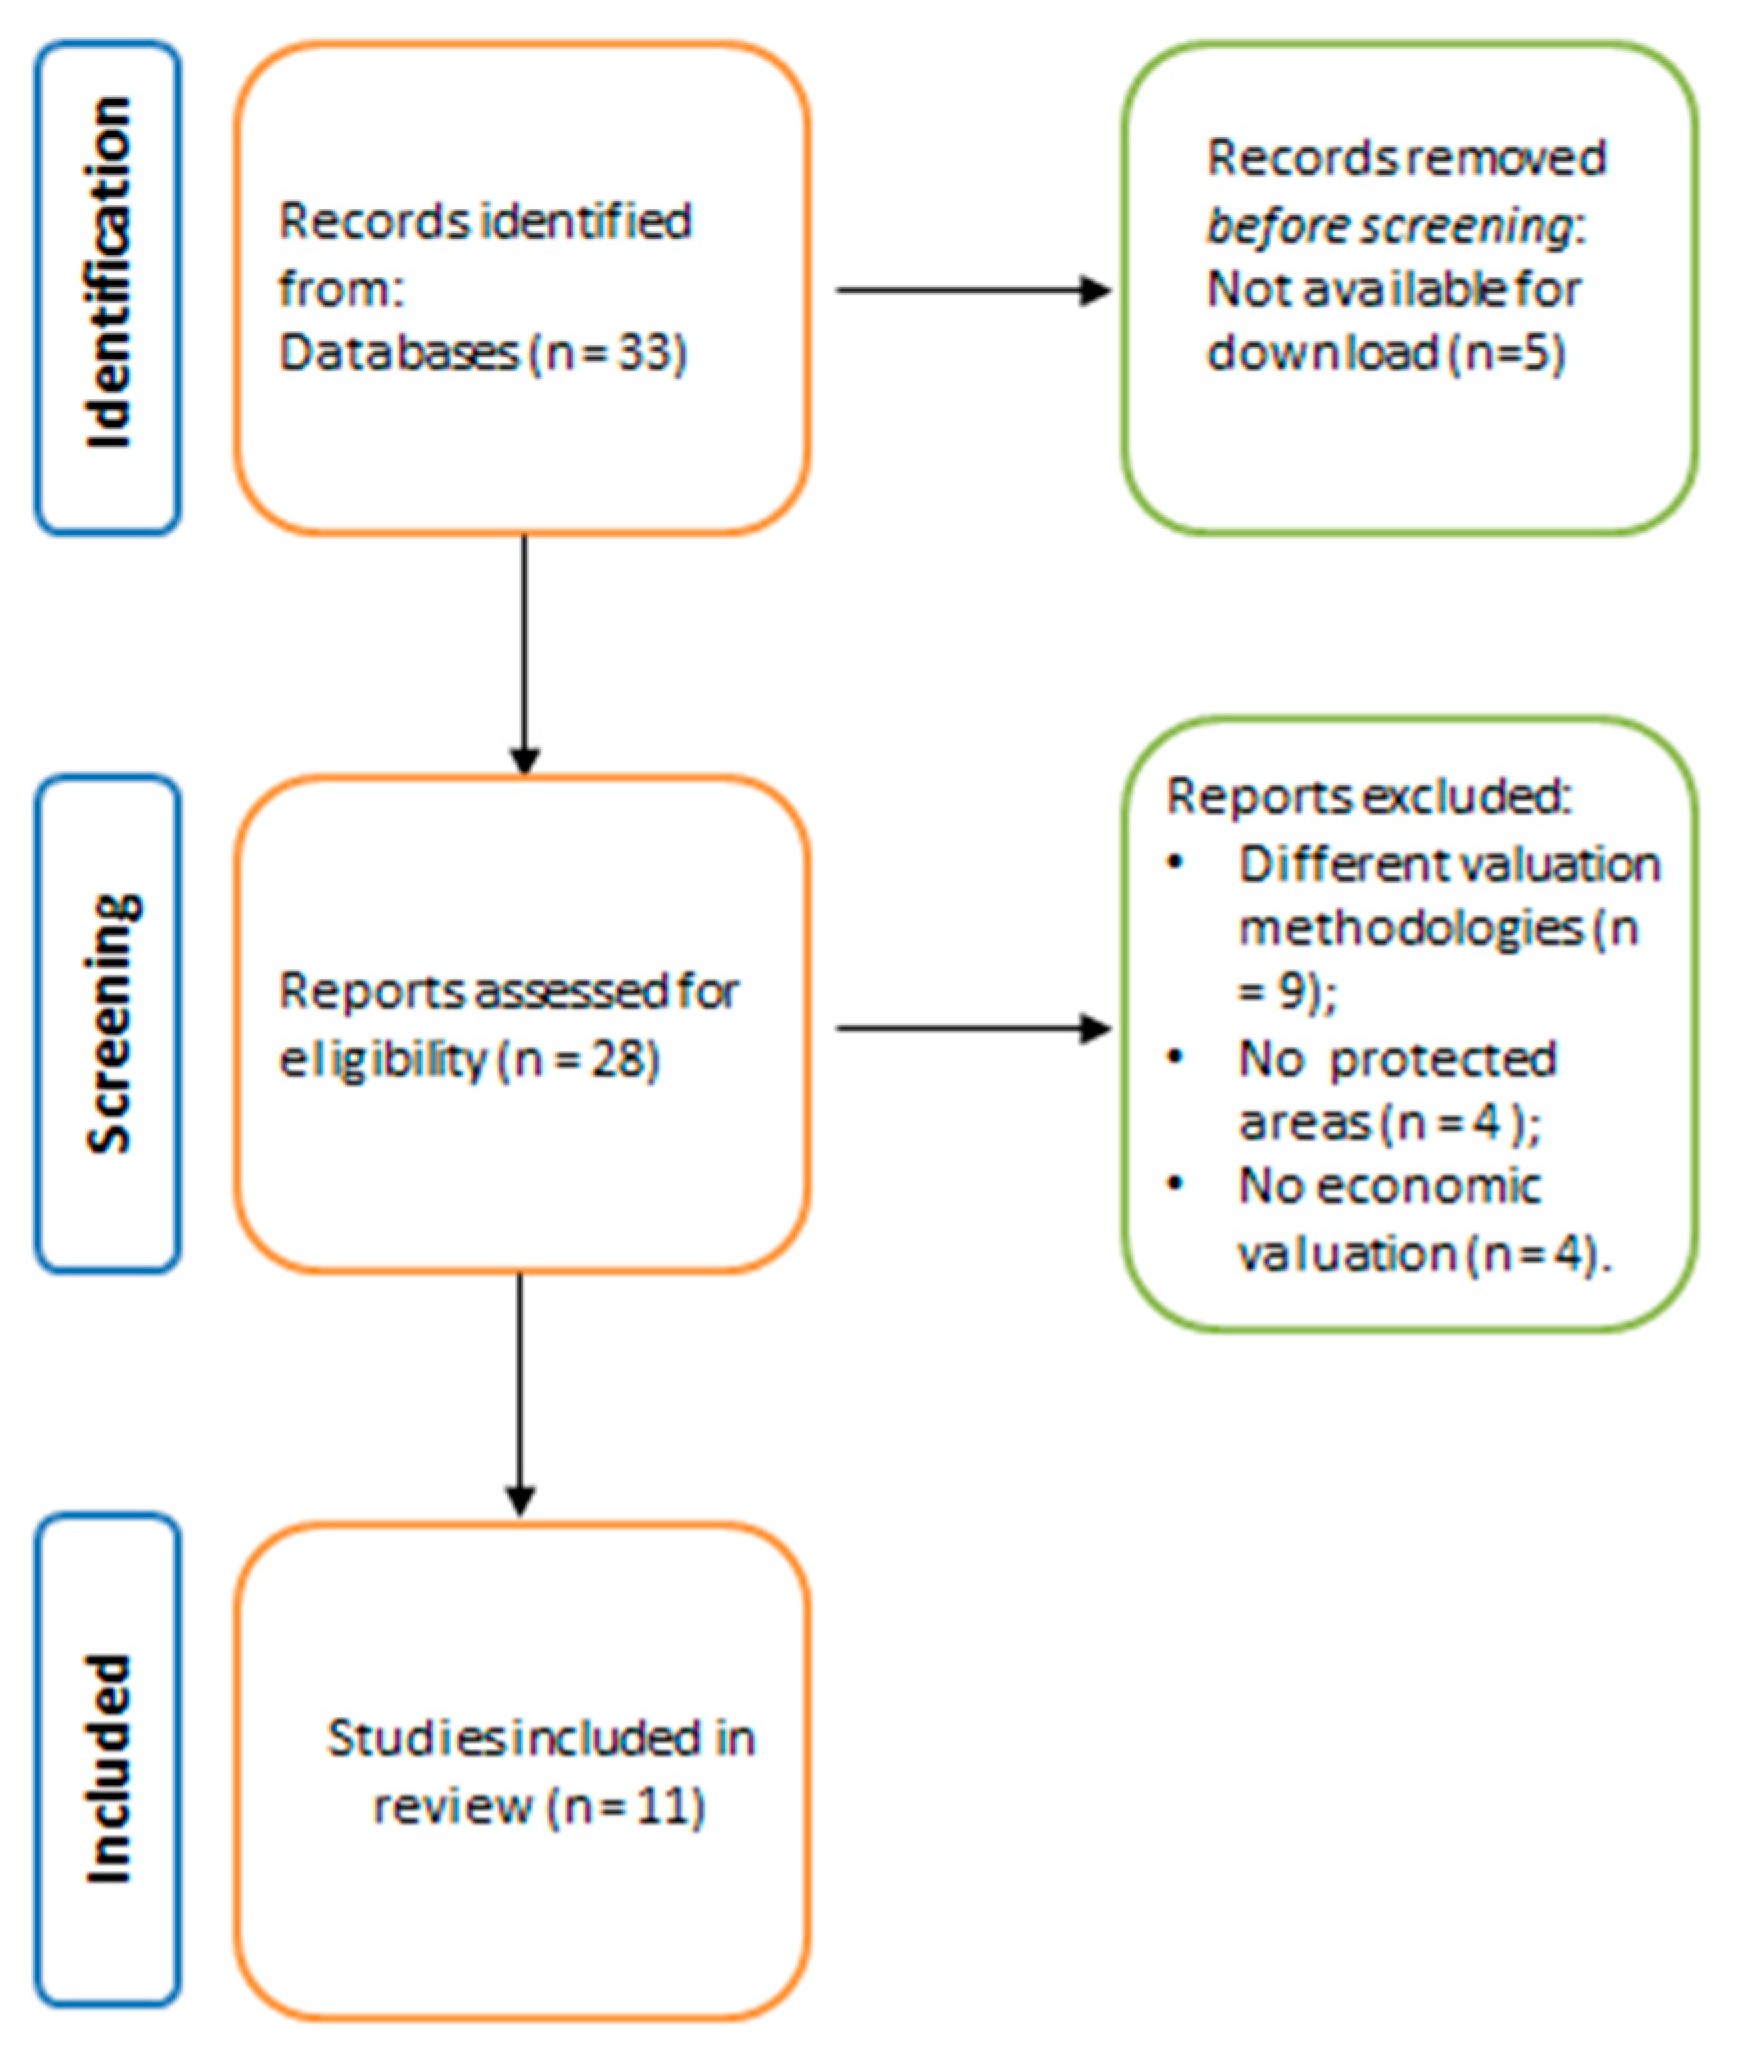
4.1. Methods and Data
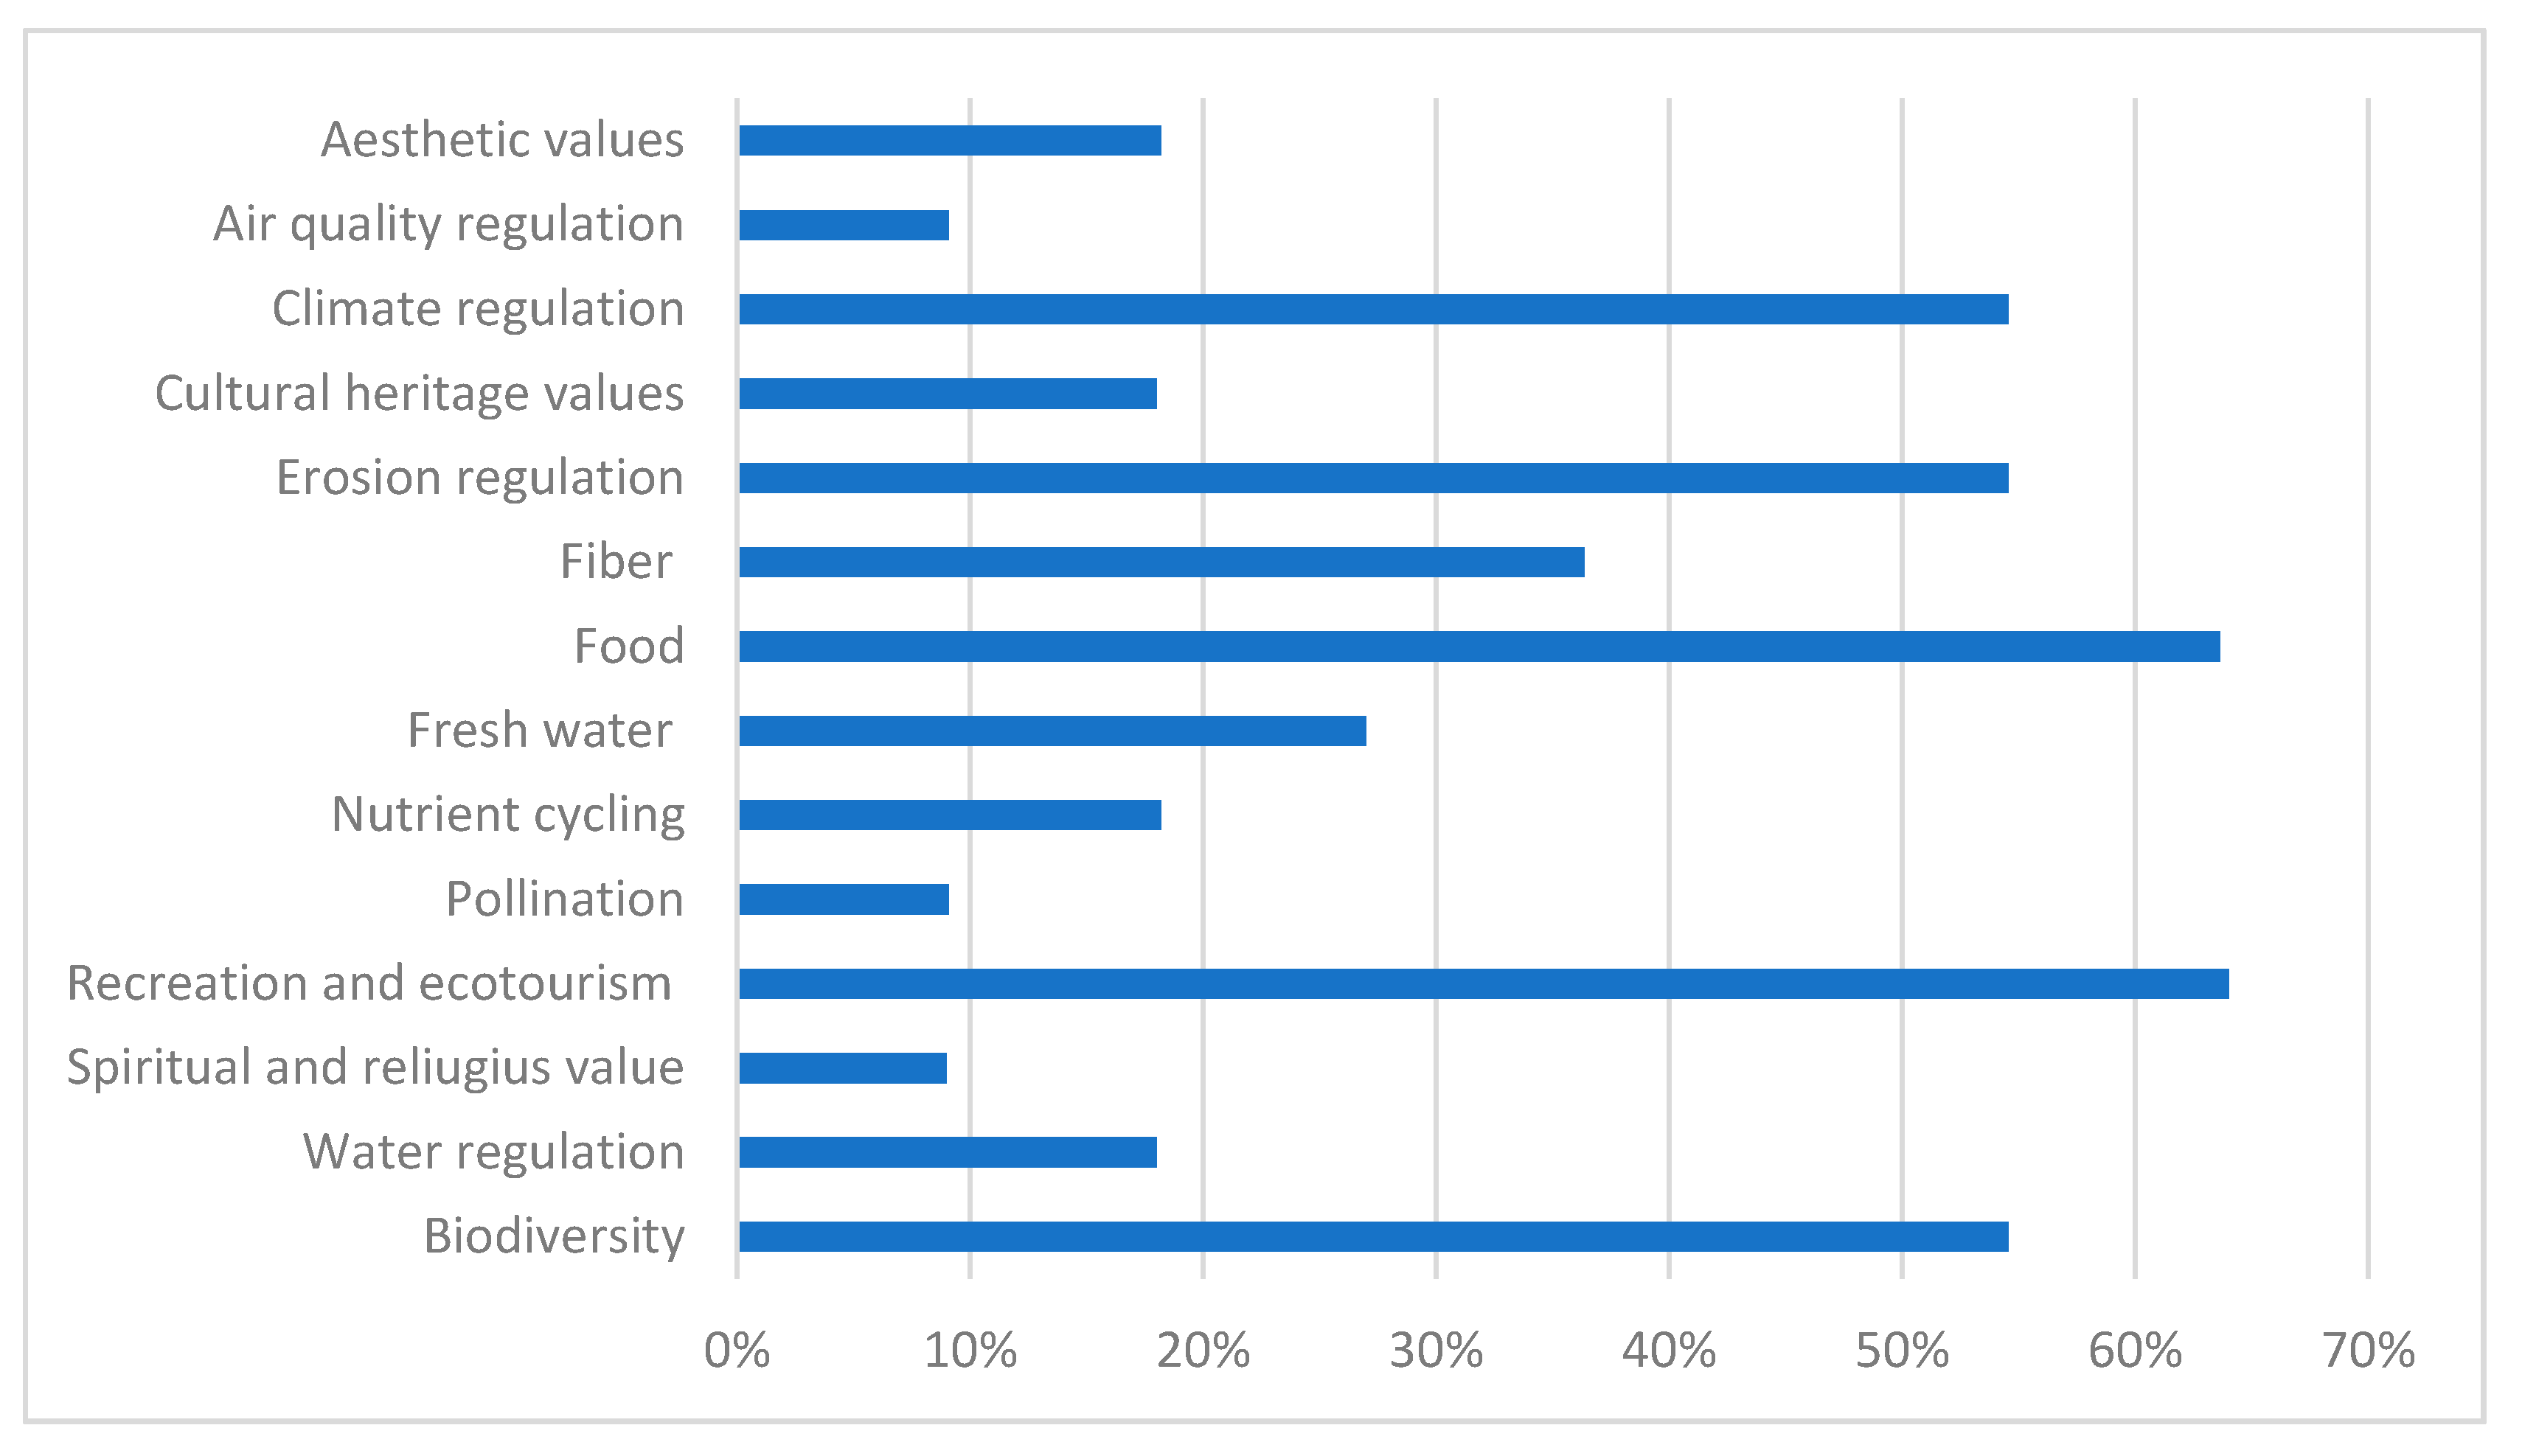
4.2. Results
4.2.1. Provisioning
4.2.2. Regulating
4.2.3. Cultural
4.2.4. Supporting
4.2.5. Biodiversity
5. Mapping of Ecosystem Service and Biodiversity of the Gargano National Park
- -
- Supporting services. Soil-forming and nutrient cycling provide the foundation for all life on Earth. Plants form the critical basis of food chains in nearly all ecosystems. In general, native plants support other native species more effectively than non-native plants.
- -
- Provisioning services. Supply services include food, fresh water, fuel, fibre and medicines collected from natural and managed ecosystems. Many native plants are harvested for food, animal feed and fibre. These are often referred to as wild harvested plants (WHP). In the GNP, many species of wild mushrooms, sweet chestnut (Castanea sativa Mill.), common hazel (Corylus avellana L.), wild strawberry (Fragaria vesca L. subsp. vesca), wild apple (Malus sylvestris (L.) Mill.), blackthorn (Prunus spinosa L. subsp. spinosa), bramble (Rubus canescens DC.), wild blackberry (Rubus ulmifolius Schott) and many edible herbaceous species that could be traded are simply harvested. Some people use native plants as medicines, such as rustyback (Asplenium ceterach L.), deadly nightshade (Atropa bella-donna L.), starflower (Borago officinalis L.), Saint John’s wort (Hypericum perforatum L.), bay laurel (Laurus nobilis L.), common mallow (Malva sylvestris L.), Lemon balm (Melissa officinalis L.), mint (Mentha sp. pl.), dog rose (Rosa canina L.), dog figworts (Scrophularia canina L.) and Marian thistle (Silybum marianum (L.) Gaertn), while they have lost the use as dye plants, such as dyer’s croton (Chrozophora tinctoria (L.) A. Juss.), dyer’s alkanet (Alkanna tinctoria Tausch subsp. tinctoria), woad (Isatis tinctoria L. subsp. tinctoria) and golden marguerite (Cota tinctoria (L.) J. Gay). In addition, native trees and shrubs are mainly used for firewood and the production of wood for building purposes. Other potential wild-grown trees should also be evaluated [122], including prioritised ones [123].
- -
- Regulating services. Native plants contribute to regulate ecosystem functions such as climate, flood, diseases, pests, the purification of water and pollination. For example: (1) The habitat functions are correlated with the diversity of ecosystem environments and processes that contribute to produce this diversity (e.g., the shelter and nursery functions of ecosystems support specific and genetic diversity, forming the basis for most of all other ecosystem functions); (2) several native plant communities along roadsides slow down water and can prevent flooding much more effectively than mowed lawns. Additionally, during photosynthesis, plants absorb carbon dioxide from the atmosphere, release oxygen for breathing and store carbon in their roots and stems, helping to regulate greenhouse gases.
- -
- Cultural services. Native plants are valuable to human cultures for recreational and spiritual uses. Historically, shrub species such as olive (Olea europaea L.), blackthorn (Prunus spinosa L. subsp. spinosa) and rush broom (Spartium junceum L.) are used to make wicker baskets, or fruits of blackthorn or common centaury (Centaurium erythraea Rafn) for liqueur; blackberries (Rubus sp. pl.) and figs (Ficus carica L.) for jams; and wild oregano (Origanum vulgare L. subsp. viridulum (Martrin-Donos) Nyman) and Lesser calamint (Clinopodium nepeta (L.) Kuntze) for spices. As for recreational use, many people nowadays enjoy a wooded park-like setting for camping, picnics and other family gatherings [124]. Some make a special pilgrimage to their favorite woodland each spring to view the wildflowers [125], or they grow particular native plants in their garden to support butterfly larvae or bees [126].
6. Conclusions
Author Contributions
Funding
Institutional Review Board Statement
Informed Consent Statement
Data Availability Statement
Acknowledgments
Conflicts of Interest
References
- International Union for Conservation of Nature and Natural Resources–IUCN. Protected Areas. 2008. Available online: https://www.iucn.org/theme/protected-areas/about (accessed on 15 June 2021).
- United Nations. Resolution Adopted by the General Assembly on 1 March 2019. 2010. Available online: https://undocs.org/A/RES/73/284 (accessed on 15 June 2021).
- Bostrom, N. Existential Risks: Analyzing Human Extinction Scenarios and Related Hazards. J. Evol. Technol. 2002, 9. Available online: http://www.jetpress.org/volume9/risks.html (accessed on 14 June 2021).
- Costanza, R.; D’Arge, R.; De Groot, R.; Farber, S.; Grasso, M.; Hannon, B.; Limburg, K.; Naeem, S.; O’Neill, R.V.; Paruelo, J.M.; et al. The value of the world’s ecosystem services and natural capital. Nature 1997, 387, 253–260. [Google Scholar] [CrossRef]
- Sherwood, J.; Carbajales-Dale, M.; Haney, B.R. Putting the Biophysical (Back) in Economics: A Taxonomic Review of Modeling the Earth-Bound Economy. Biophys. Econ. Sustain. 2020, 5, 1–20. [Google Scholar] [CrossRef]
- Italian National Strategy for Biodiversity. Available online: https://www.mite.gov.it/pagina/strategia-nazionale-la-biodiversita-2020 (accessed on 11 September 2021).
- Benayas, J.M.R.; Newton, A.C.; Diaz, A.; Bullock, J.M. Enhancement of Biodiversity and Ecosystem Services by Ecological Restoration: A Meta-Analysis. Science 2009, 325, 1121–1124. [Google Scholar] [CrossRef] [PubMed]
- Faith, D.P.; Magallon, S.; Hendry, A.P.; Conti, E.; Yahara, T.; Donoghue, M.J. Evosystem services: An evolutionary perspective on the links between biodiversity and human well-being. Curr. Opin. Environ. Sustain. 2010, 2, 66–74. [Google Scholar] [CrossRef]
- Pascual, U.; Muradian, R.; Brander, L.; Gómez-Baggetun, E.; Martín-López, B.; Verman, M.; Armsworth, P.; Christie, M.; Cornelissen, H.; Eppink, F.; et al. The economics of valuing ecosystem services and biodiversity, chapter 5. In The Economics of Ecosystems and Biodiversity (TEEB) Ecological and Economic Foundations; Kumar, P.E., Ed.; Earthscan: London, UK, 2010; pp. 183–256. [Google Scholar]
- Bullock, J.M.; Aronson, J.; Newton, A.C.; Pywell, R.F.; Rey-Benayas, J.M. Restoration of ecosystem services and biodiversity: Conflicts and opportunities. Trends Ecol. Evol. 2011, 26, 541–549. [Google Scholar] [CrossRef]
- Mace, G.M.; Norris, K.; Fitter, A.H. Biodiversity and ecosystem services: A multilayered relationship. Trends Ecol. Evol. 2012, 27, 19–26. [Google Scholar] [CrossRef] [PubMed]
- Cantarello, E.; Newton, A.C.; Martin, P.A.; Evans, P.M.; Gosal, A.; Lucash, M.S. Quantifying resilience of multiple ecosystem services and biodiversity in a temperate forest landscape. Ecol. Evol. 2017, 7, 9661–9675. [Google Scholar] [CrossRef] [Green Version]
- Di Minin, E.; Soutullo, A.; Bartesaghi, L.; Rios, M.; Szephegyi, M.N.; Moilanen, A. Integrating biodiversity, ecosystem services and socio-economic data to identify priority areas and landowners for conservation actions at the national scale. Biol. Conserv. 2017, 206, 56–64. [Google Scholar] [CrossRef]
- Ranius, T.; Hämäläinen, A.; Egnell, G.; Olsson, B.; Eklöf, k.; Stendahl, J.; Rudolphi, J.; Sténs, A.; Felton, A. The effects of logging residue extraction for energy on ecosystem services and biodiversity: A synthesis. J. Environ. Manag. 2018, 209, 409–425. [Google Scholar] [CrossRef]
- Grass, I.; Loos, J.; Baensch, S.; Batáry, P.; Librán-Embid, F.; Ficiciyan, A.; Klaus, F.; Riechers, M.; Rosa, J.; Tiede, J.; et al. Land-sharing/-sparing connectivity landscapes for ecosystem services and biodiversity conservation. People Nat. 2019, 1, 262–272. [Google Scholar] [CrossRef]
- Elmqvist, T.; Fragkias, M.; Goodness, J.; Güneralp, B.; Marcotullio, P.J.; McDonald, R.I.; Parnell, S.; Schewenius, M.; Sendstad, M.; Seto, K.C.; et al. Urbanization, Biodiversity and Ecosystem Services: Challenges and Opportunities; Springer: Dordrecht, The Netherlands; Heidelberg, Germany; New York, NY, USA; London, UK, 2013. [Google Scholar]
- Katsanevakis, S.; Coll, M.; Piroddi, C.; Steenbeek, J.; Lasram, F.B.R.; Zenetos, A.; Cardoso, A.C. Invading the Mediterranean Sea: Biodiversity patterns shaped by human activities. Front. Mar. Sci. 2014, 1, 32. [Google Scholar] [CrossRef] [Green Version]
- Tonin, S. Citizens’ perspectives on marine protected areas as a governance strategy to effectively preserve marine ecosystem services and biodiversity. Ecosystem Services 2018, 34, 189–200. [Google Scholar] [CrossRef]
- Xu, W.; Xiao, Y.; Zhanga, J.; Yang, W.; Zhang, L.; Hull, V.; Wang, Z.; Zheng, H.; Liu, J.; Polasky, S.; et al. Strengthening protected areas for biodiversity and ecosystem services in China. PNAS 2017, 114, 1601–1606. [Google Scholar] [CrossRef] [Green Version]
- He, S.; Su, Y.; Wang, L.; Gallagher, L.; Cheng, H. Taking an ecosystem services approach for a new national park system in China. Resour. Conserv. Recycl. 2018, 137, 136–144. [Google Scholar] [CrossRef]
- Maxwell, S.L.; Cazalis, V.; Dudley, N.; Hoffmann, M.; Rodrigues, A.S.L.; Stolton, S.; Visconti, P.; Woodley, S.; Kingston, N.; Lewis, E.; et al. Area-based conservation in the twenty-first century. Nature 2020, 586, 217–227. [Google Scholar] [CrossRef] [PubMed]
- Yang, R.; Cao, Y.; Hou, S.; Peng, Q.; Wang, X.; Wang, F.; Tseng, T.-H.; Yu, L.; Carver, S.; Convery, I.; et al. Cost-effective priorities for the expansion of global terrestrial protected areas: Setting post-2020 global and national targets. Sci. Adv. 2020, 6, 1–9. [Google Scholar] [CrossRef] [PubMed]
- The Economic Of Ecosystems and Biodiversity (TEEB). The Ecological and Economic Foundations; Kumar, P., Ed.; Earthscan: London, UK; Washington, DC, USA, 2010. [Google Scholar]
- Millennium Ecosystem Assessment (MEA). Ecosystems and Human Well-Being: Biodiversity Synthesis; World Resources Institute: Washington, DC, USA, 2005. [Google Scholar]
- Common International Classification of Ecosystem Services (CICES). Available online: https://cices.eu/ (accessed on 10 June 2021).
- United Nations. Report of the United Nations Conference on Environment and Development. Rio Jan. 1992, 151, 3–14. [Google Scholar]
- Braun-Blanquet, J. Plant Sociology: The Study of Plant Communities; McGraw-Hill: New York, NY, USA, 1932. [Google Scholar]
- Raunkiaer, C. The Life Forms of Plants and Statistical Plant Geography; Oxford University Press: Oxford, UK, 1934. [Google Scholar]
- Gaston, K.J.; Biodiversity, A. A Biology of Numbers and Difference; Blackwell Science: London, UK, 1996. [Google Scholar]
- Purvis, A.; Hector, A. Getting the measure of biodiversity. Nature 2000, 405, 212–219. [Google Scholar] [CrossRef]
- David Cooper, H.; Noonan-Mooney, K. Convention on Biological Diversity. Available online: https://www.sciencedirect.com/science/article/pii/B9780123847195004184?via%3Dihub (accessed on 10 June 2021).
- Tilman, D.; Reich, P.B.; Knops, J.; Wedin, D.; Mielke, T.; Lehman, C. Diversity and productivity in a long-term grassland experiment. Science 2001, 294, 843–845. [Google Scholar] [CrossRef] [PubMed] [Green Version]
- Naeem, S.; Chair, F.S.; Chapin, R.C., III; Ehrlich, P.R.; Golley, F.B.; Hooper, D.U.; Lawton, J.H.; O’Neill, R.V.; Mooney, H.A.; Sala, O.E.; et al. Biodiversity and Ecosystem Functioning: Maintaining Natural Life Support Processes. Ecology 1999, 4, 2–11. [Google Scholar]
- Egoh, B.; Reyers, B.; Rouget, M.; Bode, M.; Richardson, D.M. Spatial congruence between biodiversity and ecosystem services in South Africa. Biol. Conserv. 2009, 142, 553–562. [Google Scholar] [CrossRef]
- Cardinale, B.J. Biodiversity improves water quality through niche partitioning. Nature 2011, 472, 86–91. [Google Scholar] [CrossRef] [PubMed]
- Isbell, F.; Calcagno, V.; Hector, A.; Connolly, J.; Harpole, W.S.; Reich, P.; Scherer-Lorenzen, M.; Schmid, B.; Tilman, D.; Van Ruijven, J.; et al. High plant diversity is needed to maintain ecosystem services. Nature 2011, 477, 199–202. [Google Scholar] [CrossRef] [PubMed]
- Harrison, P.; Berry, P.; Simpson, G.; Haslett, J.; Blicharska, M.; Bucur, M.; Dunford, R.; Egoh, B.; Garcia, M.; Geamănă, N.; et al. Linkages between biodiversity attributes and ecosystem services: A systematic review. Ecosyst. Serv. 2014, 9, 191–203. [Google Scholar] [CrossRef] [Green Version]
- Costanza, R.; De Groot, R.; Sutton, P.; Van Der Ploeg, S.; Anderson, S.; Kubiszewski, I.; Farber, S.; Turner, R.K. Changes in the global value of ecosystem services. Glob. Environ. Chang. 2014, 26, 152–158. [Google Scholar] [CrossRef]
- Geneletti, D. Assessing the impact of alternative land-use zoning policies on future ecosystem services. Environ. Impact. Assess Rev. 2013, 40, 25–35. [Google Scholar] [CrossRef]
- Hodder, K.H.; Newton, A.C.; Cantarello, E.; Perrella, L. Does landscape-scale conservation management enhance the provision of ecosystem services? Int. J. Biodivers. Sci. Ecosyst. Serv. Manag. 2014, 10, 71–83. [Google Scholar] [CrossRef]
- Schägner, J.P.; Brander, L.; Maes, J.; Hartje, V. Mapping ecosystem services’ values: Current practice and future prospects. Ecosyst. Serv. 2013, 4, 33–46. [Google Scholar] [CrossRef] [Green Version]
- Schirpke, U.; De Marco, C.; Scolozzi, R.; Tappeiner, U. Servizi ecosistemici nei siti della Rete Natura 2000. Dendronatura 2016, 37, 45–53. [Google Scholar]
- Zhong-Ren, P.; Ming-Hsiang, T. Internet-GIS: Distribuited Geographic Information Services for the Internet and Wireless Networks; John Wiley & Sons, Inc.: Hoboken, NA, USA, 2003. [Google Scholar]
- Consulting Land-Solutions Source. Available online: http://www.consultingland.com/ (accessed on 15 November 2020).
- Rewetland–Widespread Introduction of Constructed Wetlands for a Wastewater Treatment of Agro Pontino. Available online: http://www.rewetland.eu/life/ (accessed on 12 November 2020).
- Facecoast. Available online: http://www.facecoast.eu/ (accessed on 12 November 2020).
- Habeas Project-Hotspot Areas for Biodiversity and Ecosystem Services. Available online: https://www.habeas-med.org/ (accessed on 14 November 2020).
- U.S. Environmental Protection Agency. Available online: https://www.epa.gov/ (accessed on 11 November 2020).
- Aries for Seaa Explorer. Available online: https://aries.integratedmodelling.org/ (accessed on 11 November 2020).
- Invest. Available online: https://naturalcapitalproject.stanford.edu/software/invest (accessed on 14 November 2020).
- Social Values for Ecosystem Services (SolVES). Available online: https://www.usgs.gov/centers/gecsc/science/ (accessed on 14 November 2020).
- Schirpke, U.; Scolozzi, R.; De Marco, C. Modello Dimostrativo di Valutazione Qualitativa e Quantitativa dei Servizi Ecosistemici Nei Siti Pilota. METODI di Valutazione. Report del Progetto Making Good Natura (LIFE+11 ENV/IT/000168); EURAC Research: Bolzano, Italy, 2014. [Google Scholar]
- Pearce, D.W.; Warford, J. World without End: Economics, Environment, and Sustainable Development; Oxford University Press: Oxford, UK, 1993. [Google Scholar]
- Pearce, D.W. Valuing the Environment: Past Practice, Future Prospect; University College Centre for Social and Economic Research on the Global Environment: London, UK, 1994. [Google Scholar]
- Pearce, D.; Atkinson, G.; Mourato, S. Cost-Benefit Analysis and the Environment: Recent Developments; OECD Publishing: Paris, France, 2006. [Google Scholar]
- Pearce, D.W.; Moran, D. Economic Value of Biodiversity; EarthScan: London, UK, 1994. [Google Scholar]
- Turner, R.; Paavola, J.; Cooper, P.; Farber, S.; Jessamy, V.; Georgiou, S. Valuing nature: Lessons learned and future research directions. Ecol. Econ. 2003, 46, 493–510. [Google Scholar] [CrossRef] [Green Version]
- Bateman, I.J.; Carson, R.T.; Day, B.; Hanemann, W.M.; Hanley, N.; Hett, T.; Jones-Lee, M.; Loomes, G.; Mourato, S.; Özdemiro.glu, E.; et al. Economic Valuation with Stated Preference Techniques: A Manual; Edward Elgar Publishing: Cheltenham, UK, 2002. [Google Scholar]
- Turner, R.K.; Morse-Jones, S.; Fisher, B. Ecosystem valuation: A sequential decision support system and quality assessment issues. Ann. N. Y. Acad. Sci. 2010, 1185, 79–101. [Google Scholar] [CrossRef]
- Luisetti, T.; Turner, R.K.; Bateman, I.J.; Morse-Jones, S.; Adams, C.; Fonseca, L. Coastal and marine ecosystem services valuation for policy and management: Managed realignment case studies in England. Ocean. Coast. Manag. 2011, 54, 212–224. [Google Scholar] [CrossRef]
- Champ, P.A.; Alberini, A.; Correas, I. Using contingent valuation to value a noxious weeds control program: The effects of including an unsure response category. Ecol. Econ. 2005, 55, 47–60. [Google Scholar] [CrossRef]
- Loomis, J.B.; Keske, C.M. Mountain substitutability and peak load pricing of high alpine peaks as a management tool to reduce environmental damage: A contingent valuation study. J. Environ. Manag. 2009, 90, 1751–1760. [Google Scholar] [CrossRef]
- Mitchell, R.C.; Carson, R.T. Using Surveys to Value Public Goods: The Contingent Valuation Method; Resources for the Future Press: New York, NY, USA, 2013. [Google Scholar]
- Damigos, D.; Tentes, G.; Balzarini, M.; Furlanis, F.; Vianello, A. Revealing the economic value of managed aquifer recharge: Evidence from a contingent valuation study in Italy. Water Resour. Res. 2017, 53, 6597–6611. [Google Scholar] [CrossRef]
- Cook, D.; Malinauskaite, L.; Davíðsdóttir, B.; Ögmundardóttir, H. A contingent valuation approach to estimating the recreational value of commercial whale watching–the case study of Faxaflói Bay, Iceland. Tour. Manag. Perspect. 2020, 36, 100754. [Google Scholar] [CrossRef]
- Alberini, A.; Tonin, S.; Turvani, M. Willingness to pay for contaminated site cleanup policies: Evidence from a conjoint choice study in Italy. Rev. Econ. Polit. 2007, 117, 737–749. [Google Scholar] [CrossRef]
- Garrod, G.D.; Scarpa, R.; Willis, K.G. Estimating the benefits of traffic calming on through routes: A choice experiment approach. J. Transp. Econ. Policy 2002, 36, 211–231. [Google Scholar] [CrossRef] [Green Version]
- Scarpa, R.; Campbell, D.; Hutchinson, W.G. Benefit estimates for landscape improvements: Sequential Bayesian design and respondents’ rationality in a choice experiment. Land Econ. 2007, 83, 617–634. [Google Scholar] [CrossRef] [Green Version]
- Louviere, J.J.; Hensher, D.A.; Swait, J.D.; Adamowicz, W. Combining Sources of Preference Data. Stated Choice Methods; The Pitt Building: Cambridge, UK, 2010. [Google Scholar]
- Yao, R.T.; Scarpa, R.; Harrison, D.R.; Burns, R.J. Does the economic benefit of biodiversity enhancement exceed the cost of conservation in planted forests? Ecosyst. Serv. 2019, 38, 100954. [Google Scholar] [CrossRef]
- Andrews, B.; Ferrini, S.; Muench, A.; Brown, A.; Hyder, K. Assessing the impact of management on sea anglers in the UK using choice experiments. J. Environ. Manag. 2021, 293, 112831. [Google Scholar] [CrossRef]
- Rosen, S. Hedonic prices and implicit markets: Product differentiation in pure competition. J. Political. Econ. 1974, 82, 34–55. [Google Scholar] [CrossRef]
- Lansford, N.H.; Jones, L.L. Recreational and aesthetic value of water using hedonic price analysis. J. Agric. Resour. Econ. 1995, 20, 341–555. [Google Scholar]
- Champ, P.A.; Boyle, K.J.; Brown, T.C. A Primer on Nonmarket Valuation; Kluwer Academic Press: Boston, MA, USA, 2003. [Google Scholar]
- Nicholls, S. Impacts of environmental disturbances on housing prices: A review of the hedonic pricing literature. J. Environ. Manag. 2019, 246, 1–10. [Google Scholar] [CrossRef]
- Catma, S. Non-market valuation of beach quality: Using spatial hedonic price modeling in Hilton Head Island. SC. Mar. Policy 2020, 115, 103866. [Google Scholar] [CrossRef]
- Ward, F.A.; Beal, D. Valuing Nature with Travel Cost Models; Edward Elgar Publishing: Camberley, UK, 2000. [Google Scholar]
- Alberini, A.; Longo, A. Combining the travel cost and contingent behavior methods to value cultural heritage sites: Evidence from Armenia. J. Cult. Econ. 2006, 30, 287–304. [Google Scholar] [CrossRef]
- Champ, P.A.; Boyle, K.J.; Brown, T.C. A Primer on Nonmarket Valuation; Springer: Dordrecht, The Netherlands, 2017; Volume 13. [Google Scholar]
- Bertram, C.; Larondelle, N. Going to the Woods Is Going Home: Recreational Benefits of a Larger Urban Forest Site—A Travel Cost Analysis for Berlin, Germany. Ecol. Econ. 2017, 132, 255–263. [Google Scholar] [CrossRef]
- Costanza, R.; Pérez-Maqueo, O.; Martinez, M.L.; Sutton, P.; Anderson, S.J.; Mulder, K. The value of coastal wetlands for hurricane protection. Ambio 2008, 37, 241–248. [Google Scholar] [CrossRef]
- Zhang, J.; Mu, Q. Air pollution and defensive expenditures: Evidence from particulate-filtering facemasks. J. Environ. Econ. Manag. 2018, 92, 517–536. [Google Scholar] [CrossRef]
- Akmal, T.; Jamil, F. Health impact of Solid Waste Management Practices on Household: The case of Metropolitans of Islamabad-Rawalpindi, Pakistan. Heliyon 2021, 7, e07327. [Google Scholar] [CrossRef] [PubMed]
- Loomis, J.B. The evolution of a more rigorous approach to benefit transfer—benefit function transfer. Water Resour. Res. 1992, 28, 701–705. [Google Scholar] [CrossRef]
- Woodward, R.T.; Wui, Y.S. The economic value of wetland services: A meta-analysis. Ecol. Econ. 2001, 37, 257–270. [Google Scholar] [CrossRef]
- Robinson, J.J. Environmental value transfer: An application for the South East Queensland waterways. Water Sci. Technol. 2002, 45, 91–100. [Google Scholar] [CrossRef] [PubMed]
- Považan, R.; Getzner, M.; Švajda, J. On the valuation of ecosystem services in Muránska Planina National Park (Slovakia). Ecomont 2015, 7, 61–69. [Google Scholar] [CrossRef]
- Gandarillas, R.V.; Jiang, Y.; Irvine, K. Assessing the services of high mountain wetlands in tropical Andes: A case study of Caripe wetlands at Bolivian Altiplano. Ecosyst. Serv. 2016, 19, 51–64. [Google Scholar] [CrossRef]
- Ninan, K.N.; Kontoleon, A. Valuing forest ecosystem services and disservices-Case study of a protected area in India. Ecosyst. Serv. 2016, 20, 1–14. [Google Scholar] [CrossRef] [Green Version]
- Torres-Miralles, M.; Grammatikopoulou, I.; Rescia, A.J. Employing contingent and inferred valuation methods to evaluate the conservation of olive groves and associated ecosystem services in Andalusia (Spain). Ecosyst. Serv. 2017, 26, 258–269. [Google Scholar] [CrossRef]
- Schirpke, U.; Scolozzi, R.; Concetti, B.; Comini, B.; Tappeiner, U. Supporting the Management of Ecosystem Services in Protected Areas: Trade-Offs between Effort and Accuracy in Evaluation. J. Environ. Assess. Policy Manag. 2017, 19, 1750007. [Google Scholar] [CrossRef]
- Ferreira, A.M.; Marques, J.C.; Seixas, S. Integrating marine ecosystem conservation and ecosystems services economic valuation: Implications for coastal zones governance. Ecol. Indic. 2017, 77, 114–122. [Google Scholar] [CrossRef] [Green Version]
- Marta-Pedroso, C.; Laporta, L.; Gama, I.; Domingos, T. Economic valuation and mapping of ecosystem services in the context of protected area management (Natural park of Serra de São Mamede, Portugal). One Ecosyst. 2018, 3, e26722. [Google Scholar] [CrossRef] [Green Version]
- Valasiuk, S.; Czajkowski, M.; Giergiczny, M.; Żylicz, T.; Veisten, K.; Mata, I.L.; Halse, A.H.; Elbakidze, M.; Angelstam, P. Is forest landscape restoration socially desirable? A discrete choice experiment applied to the Scandinavian transboundary Fulufjället National Park Area. Restor. Ecol. 2018, 26, 370–380. [Google Scholar] [CrossRef] [Green Version]
- Molina, J.R.; Zamora, R.; Rodríguez y Silva, F. The role of flagship species in the economic valuation of wildfire impacts: An application to two Mediterranean protected areas. Sci. Total Environ. 2019, 675, 520–530. [Google Scholar] [CrossRef]
- Oh, C.O.; Lee, S.; Kim, H.N. Economic valuation of conservation of inholdings in protected areas for the institution of payments for ecosystem services. Forests 2019, 10, 1122. [Google Scholar] [CrossRef] [Green Version]
- Ramel, C. Integrating ecosystem services within spatial biodiversity conservation prioritization in the Alps. Ecosyst. Serv. 2020, 45. [Google Scholar] [CrossRef]
- Intergovernmental Panel on Climate Change (IPCC). Good Practice Guidance for Land Use, Land-Use Change and Forestry; Report, IPCC Technical Support Unit: Kanagawa, Japan, 2003. [Google Scholar]
- Wischmeier, W.H.; Smith, D.D. Predicting Rainfall Erosion Losses: A Guide to Conservation Planning; U.S. Government Printing Office: Washington, DC, USA, 1978.
- Roose, E. Land Husbandry—Components and Strategy, 70 FAO Soils Bulletin; Food & Agriculture Organization of the UN: Rome, Italy, 1996. [Google Scholar]
- Torri, D.; Borselli, L.; Guzzetti, F.; Calzolari, M.C.; Bazzoffi, P.; Ungaro, F.; Bartolini, D. A primer on nonmarket valuation. In Soil Erosion in Europe; Boardman, J., Poesen, J., Eds.; John Wiley & Sons Ltd.: Chichester, UK, 2006; pp. 245–261. [Google Scholar]
- Bosco, C.; de Rigo, D. Land Cover and Soil Erodibility within the e-RUSLE Model. Report No. MRI-11b13, Scientific Topics Focus Series, Notes on Transdisciplinary Modelling for Environment; Maieutike Research Initiative: Italy, 2013; Available online: https://doi.org/10.6084/m9.figshare.856670.v2 (accessed on 14 June 2021). [CrossRef]
- Xue, D.; Tisdell, C. Valuing ecological functions of biodiversity in Changbaishan mountain biosphere reserve in northeast China. Biodivers. Conserv. 2001, 10, 467–481. [Google Scholar] [CrossRef]
- Perrino, E.V.; Tomaselli, V.; Costa, R.; Pavone, P. Conservation status of habitats (Directive 92/43 EEC) of coastal and low hill belts in a Mediterranean biodiversity hot spot (Gargano–Italy). Plant Biosystems. 2013, 147, 1006–1028. [Google Scholar] [CrossRef]
- Pantaleo, F.; La Foce, S. Andrea e i canali adiacenti (Lago di Lesina–Puglia): Studio floristico. Ann. Bot. 1991, 49, 123–135. [Google Scholar]
- Medagli, P.; D’emerico, S.; Del Fuoco, C.; Ruggiero, L.; Bianco, P. Orchidee nuove o riconfermate per la flora del Gargano (Italia). J. Eur. Orch. 1995, 27, 301–310. [Google Scholar]
- Perrino, E.V.; Cavallaro, V.; Chiandetti, L. Floristic notes on a peculiar Acer opalus Mill. ssp. obtusatum (Waldst. et Kit. ex Willd.) community on Gargano (Apulia, Italy). Nat. Croat. 2012, 21, 381–390. [Google Scholar]
- Wagensommer, R.P.; Fröhlich, T.; Fröhlich, M. First record of the southeast European species Cerinthe retorta Sibth. & Sm. (Boraginaceae) in Italy and considerations on its distribution and conservation status. Acta Bot. Gall. 2014, 161, 111–115. [Google Scholar]
- Wagensommer, R.P.; Bartolucci, F.; Fiorentino, M.; Licht, W.; Peccenini, S.; Perrino, E.V.; Venanzoni, R. First record for the flora of Italy and lectotypification of the name Linum elegans (Linaceae). Phytotaxa 2017, 296, 161–170. [Google Scholar] [CrossRef]
- Wagensommer, R.P.; Medagli, P.; Turco, A.; Perrino, E.V. IUCN Red List Evaluation of the Orchidaceae endemic to Apulia Region (Italy) and considerations on the application of the IUCN protocol to rare species. Nat. Conserv. Res. 2020, 5, 90–101. [Google Scholar] [CrossRef]
- Biondi, E. Indagine fitosociologica sulle cenosi riferibili alla classe Quercetea ilicis presenti sul promontorio del Gargano (Adriatico meridionale). Not. Fitosoc. 1985, 22, 59–76. [Google Scholar]
- Biondi, E.; Casavecchia, S.; Biscotti, N. Forest biodiversity of the Gargano Peninsula and a critical revision of the syntaxonomy of the mesophilous woods of southern Italy. Fitosociologia 2008, 45, 93–127. [Google Scholar]
- Di Pietro, R.; Wagensommer, R.P. Analisi fitosociologica su alcune specie rare e/o minacciate del Parco Nazionale del Gargano (Italia centro-meridionale) e considerazioni sintassonomiche sulle comunità casmofitiche della Puglia. Fitosociologia 2008, 45, 177–200. [Google Scholar]
- Tomaselli, V.; Perrino, E.V.; Cimmarusti, G. Paludi Sfinale e Gusmay, due aree umide di rilevante interesse naturalistico nel Parco Nazionale del Gargano. Inform. Bot. Ital. 2008, 40, 183–192. [Google Scholar]
- Di Pietro, R.; Wagensommer, R.P. A new Sesleria juncifolia association from south-eastern Italy and its position in the amphi-Adriatic biogeographical context. Acta Bot. Croat. 2014, 73, 171–207. [Google Scholar]
- Perrino, E.V.; Cavallaro, V.; Chiandetti, L. Flora di alcuni nuclei ad Acer opalus Mill. subsp. obtusatum (Waldstein e kit. Ex Willd.) Gams di Vico del Gargano (FG–Puglia). Inform. Bot. Ital. 2011, 43, 38–39. [Google Scholar]
- Perrino, E.V.; Wagensommer, R.P.; Medagli, P. The genus Aegilops, L. (Poaceae) in Italy: Taxonomy, geographical distribution, ecology, vulnerability and conservation. Syst. Biodivers. 2014, 12, 331–349. [Google Scholar] [CrossRef]
- Perrino, E.V.; Musarella, C.M.; Magazzini, P. Management of grazing Italian river buffalo to preserve habitats defined by Directive 92/43/EEC in a protected wetland area on the Mediterranean coast: Palude Frattarolo, Apulia, Italy. Euro-Mediterr. J. Environ. Integr. 2021, 6, 32. [Google Scholar] [CrossRef]
- Licht, W.; Wagensommer, R.P. Flora Vascolare del Gargano e Delle Isole Tremiti. Chiavi Analitiche per la Determinazione. Biblioteca Verde del Parco Nazionale del Gargano; Grenzi Editore: Foggia, Italy, 2020. [Google Scholar]
- Wagensommer, R.P.; Medagli, P.; Albano, A.; Peruzzi, L.; Bartolucci, F.; Villani, M.; Conti, F.; Passalacqua, N.G.; Alessandrini, A.; Barberis, G.; et al. Loci classici delle piante vascolari endemiche italiane descritte per la Puglia. Inform. Bot. Ital. 2014, 46, 323–369. [Google Scholar]
- Bartolucci, F.; Peruzzi, L.; Galasso, G.; Albano, A.; Alessandrini, A.; Ardenghi, N.M.G.; Astuti, G.; Bacchetta, G.; Ballelli, S.; Banfi, E.; et al. An updated checklist of the vascular flora native to Italy. Plant. Biosyst. 2018, 152, 179–303. [Google Scholar] [CrossRef]
- Perrino, E.V.; Perrino, P. Crop wild relatives: Know how past and present to improve future research, conservation and utilization strategies, especially in Italy: A review. Genet. Resour. Crop. Evol. 2020, 67, 1067–1105. [Google Scholar] [CrossRef]
- Perrino, E.V.; Wagensommer, R.P. Crop Wild Relatives (CWR) Priority in Italy: Distribution, Ecology, In Situ and Ex Situ Conservation and Expected Actions. Sustainability 2021, 13, 1682. [Google Scholar] [CrossRef]
- Lawal, D.U.; Matori, A.N.; Chandio, I.A.; Balogun, A.L. Framework for recreational park suitability sites. Int. J. Civil. Environ. Eng. 2011, 11, 82–93. [Google Scholar]
- Askins, R.A. Chapter 10. Saving the World’s Deciduous Forests. In Blending Conservation Strategies From Three Continents; Yale University Press: New Haven, CT, USA, 2014; pp. 207–238. [Google Scholar]
- Matteson, K.C.; Langellotto, G.A. Determinates of inner-city butterfly and bee species richness. Urban. Ecosyst. 2010, 13, 333–347. [Google Scholar] [CrossRef] [Green Version]
- Perrino, E.V.; Ladisa, G.; Calabrese, G. Flora and plant genetic resources of ancient olive groves of Apulia (southern Italy). Genet. Resour. Crop. Evol. 2014, 61, 23–53. [Google Scholar] [CrossRef]


| Author | Geographical Information | Provisioning | Regulating | Cultural | Supporting | Biodiversity |
|---|---|---|---|---|---|---|
| Považan et al., 2015 [87] | Muránska Planina National Park (Slvakia) | x | x | x | ||
| Gandarillas et al., 2016 [88] | Sajama National Park (Bolivia) | x | x | x | ||
| Ninan et al., 2016 [89] | Nagarhole National Park (India) | x | x | x | x | x |
| Torres-Miralles et al., 2017 [90] | Cazorla, Segura y Las Villa National Park (Spain) | x | x | x | x | |
| Schirpke et al., 2017 [91] | Alto Garda Bresciano Park and Val Grigna Park (Italy) | x | x | x | ||
| Ferreira et al., 2017 [92] | Biophysical Interest Zone of Avencas, ZIBA (Portugal) | x | ||||
| Marta-Pedroso et al., 2018 [93] | Natural Park of Serra de São Mamede (Portugal) | x | x | x | ||
| Valasiuk et al., 2018 [94] | Fulufjället National Park Area (Sweden-Norway) | x | ||||
| Molina et al., 2019 [95] | Cazorla, Segura y Las Villa National Park and Doñana National Park (Spain) | x | ||||
| Chi-Ok Oh et al., 2019 [96] | Jiri Mountains National Park (Korea) | x | ||||
| Ramel C et al., 2020 [97] | Western Swiss Alps (Switzerland) | x | x | x |
| Author | Type of ES | Sub-Category | Estimation Driver | Valuation Method |
|---|---|---|---|---|
| Považan et al., 2015 [87] | Provisioning | Food | Honey | Market price |
| Seed | Market price | |||
| Crop | Market price | |||
| Livestock | Market price | |||
| Fibre | Timber | Market price | ||
| Fresh water | Water supply | Market price | ||
| Gandarillas et al., 2016 [88] | Provisioning | Food | Livestock | Market price |
| Fresh water | Water supply | Replacement cost | ||
| Ninan et al., 2016 [89] | Provisioning | Food | Livestock | Benefit transfer |
| Food | Market price | |||
| Torres-Miralles et al., 2017 [90] | Provisioning | Food | Olive groves | Contingent valuation |
| Schirpke et al., 2017 [91] | Provisioning | Food | Crop | Market price |
| Mushrooms | Market price | |||
| Fibre | Timber | Market price | ||
| Fresh water | Water supply | Market price | ||
| Marta-Pedroso et al., 2018 [93] | Provisioning | Food | Crop | Market price |
| Livestock | Market price | |||
| Fibre | Timber | Market price | ||
| Ramel C et al., 2020 [97] | Provisioning | Food | Milk | Market price |
| Meal | Market price | |||
| Cheese | Market price | |||
| Fibre | Timber | Market price |
| Author | Type of ES | Sub-Category | Estimation Driver | Valuation Method |
|---|---|---|---|---|
| Považan et al., 2015 [87] | Regulating | Climate regulation | Carbon sequestration | Benefit transfer |
| Erosion regulation | Flood control and erosion control | Benefit transfer | ||
| Water purification | Water retention | Benefit transfer | ||
| Ninan et al., 2016 [89] | Regulating | Water purification | Water retention | Alternate cost |
| Climate regulation | Carbon sequestration | Market price and damage cost | ||
| Erosion regulation | Soil erosion control | Hedonic pricing and opportunity cost | ||
| Air quality regulation | Air purification | Alternate cost | ||
| Pollination | Pollination | Benefit transfer | ||
| Torres-Miralles et al., 2017 [90] | Regulating | Air quality regulation Water purification Erosion regulation | WTP for ecosystem conservation | Contingent valuation |
| Schirpke et al., 2017 [91] | Regulating | Climate regulation | Carbon sequestration | Market price |
| Water purification | Water retention | Restoration cost | ||
| Erosion regulation | Soil erosion control | Replacement cost | ||
| Marta-Pedroso et al., 2018 [93] | Regulating | Climate regulation | Carbon sequestration | Benefit transfer |
| Erosion regulation | Soil erosion control | Benefit transfer | ||
| Ramel C et al., 2020 [97] | Regulating | Climate regulation | Carbon sequestration | Market price |
| Erosion regulation | Soil erosion control | Avoided damage cost |
| Author | Type of ES | Sub-Category | Estimation Driver | Valuation Method |
|---|---|---|---|---|
| Považan et al., 2015 [87] | Cultural | Recreation and ecotourism | Hunting | Market price |
| Tourism | Travel cost | |||
| Gandarillas et al., 2016 [88] | Cultural | Recreation and ecotourism | Ecotourism | Market price |
| Cultural heritage values | Heritage value | Contingent valuation | ||
| Ninan et al., 2016 [89] | Cultural | Recreation and ecotourism | Tourism | Travel cost and Benefit transfer |
| Torres-Miralles et al., 2017 [90] | Cultural | Recreation and ecotourism Cultural heritage values Aesthetic value | WTP to ecosystem conservation | Contingent valuation |
| Schirpke et al., 2017 [91] | Cultural | Recreation and ecotourism | Tourism | Travel cost |
| Valasiuk et al., 2018 [94] | Cultural | Recreation and ecotourism | Recreational area | Choice Experiment |
| Chi-Ok Oh et al., 2019 [96] | Cultural | Spiritual and religious value | Heritage value | Contingent valuation |
| Ramel C et al., 2020 [97] | Cultural | Recreation and ecotourism | Hunting | Market price |
| Recreational activity | Benefit transfer |
| Author | Type of ES | Sub-Category | Estimation Driver | Valuation Method |
|---|---|---|---|---|
| Ninan et al., 2016 [89] | Supporting | Nutrient cycling | Accumulating nutrients | Alternate cost and market price |
| Author | Type of ES | Estimation Driver | Valuation Method |
|---|---|---|---|
| Gandarillas et al., 2016 [88] | Biodiversity | - | Benefit transfer |
| Ninan et al., 2016 [89] | Biodiversity | WTP for elephant conservation | Contingent valuation |
| Torres-Miralles et al., 2017 [90] | Biodiversity | WTP for ecosystem conservation | Contingent valuation |
| Ferreira et al., 2017 [92] | Biodiversity | WTP for the ecosystem conservation | Contingent valuation |
| Marta-Pedroso et al., 2018 [93] | Biodiversity | Payment to ecosystem conservation | Contingent valuation |
| Molina et al., 2019 [95] | Biodiversity | WTP for three flagship species | Contingent valuation |
Publisher’s Note: MDPI stays neutral with regard to jurisdictional claims in published maps and institutional affiliations. |
© 2021 by the authors. Licensee MDPI, Basel, Switzerland. This article is an open access article distributed under the terms and conditions of the Creative Commons Attribution (CC BY) license (https://creativecommons.org/licenses/by/4.0/).
Share and Cite
Pisani, D.; Pazienza, P.; Perrino, E.V.; Caporale, D.; De Lucia, C. The Economic Valuation of Ecosystem Services of Biodiversity Components in Protected Areas: A Review for a Framework of Analysis for the Gargano National Park. Sustainability 2021, 13, 11726. https://doi.org/10.3390/su132111726
Pisani D, Pazienza P, Perrino EV, Caporale D, De Lucia C. The Economic Valuation of Ecosystem Services of Biodiversity Components in Protected Areas: A Review for a Framework of Analysis for the Gargano National Park. Sustainability. 2021; 13(21):11726. https://doi.org/10.3390/su132111726
Chicago/Turabian StylePisani, Domenico, Pasquale Pazienza, Enrico Vito Perrino, Diana Caporale, and Caterina De Lucia. 2021. "The Economic Valuation of Ecosystem Services of Biodiversity Components in Protected Areas: A Review for a Framework of Analysis for the Gargano National Park" Sustainability 13, no. 21: 11726. https://doi.org/10.3390/su132111726