
Technology Innovation, Economic Growth and Carbon Emissions in the Context of Carbon Neutrality: Evidence from BRICS

School of Economics, Nanjing Audit University, Nanjing 211815, China
Sustainability 2021, 13(20), 11138; https://doi.org/10.3390/su132011138
Submission received: 12 September 2021
/
Revised: 1 October 2021
/
Accepted: 5 October 2021
/
Published: 9 October 2021
Abstract
:This study selects the panel data of five BRICS nations (Brazil, Russia, India, China, South Africa) from 1990 to 2019 to empirically explore the impact of technological innovation and economic growth on carbon emissions under the context of carbon neutrality. Granger causality test results signify that there exists a one-way causality from technology patent to carbon emission and from economic growth to carbon emission. We also constructed an improved Stochastic Impacts by Regression on Population, Affluence, and Technology (STIRPAT) model. The regression results manifest that technology patents contribute to the realization of carbon emission reduction and carbon neutralization, while the economic growth of emerging economies represented by BRICS countries significantly improves carbon emissions, but every single BRICS country shows differentiated carbon emissions conditions with their economic development stages. The impact of the interaction term on carbon emissions for the five BRICS countries also presents country-specific heterogeneity. Moreover, the Environmental Kuznets Curve (EKC) test results show that only Russia and South Africa have an inverted U-shaped curve relationship between economic growth and carbon emissions, whereas Brazil, India and China have a U-shaped curve relationship. There exists no EKC relationship when considering BRICS nations as a whole. Further robustness tests also verify that the conclusions obtained in this paper are consistent and stable. Finally, the paper puts forward relevant policy suggestions based on the research findings.
1. Introduction
The BRICS countries have actively participated in global governance activities for a long time and gradually formed a representative cooperation mechanism for emerging economies. The BRICS countries are characterized by rapid economic development. In 2019, the GDP had accounted for 23.5% of the world’s total. On the other hand, although the technology level of BRICS countries has been greatly improved in high-speed economic growth, the problem of insufficient innovation ability, especially in the high-tech field, has begun to appear. In terms of the number of resident patent applications, China alone has maintained a rapid growth rate with an increase of 164.9% in 2019 compared with 2008, whereas a significant decline in Brazil, Russia and South Africa. Only China has been in the top 50 ranking among the BRICS countries in the global innovation index. However, compared with developed countries, there is still a lot of room for improvement in the number and scale of patents in China. From 2009 to 2019, China’s ranking in the global innovation index rose from 37th to 14th, an increase of 23 places. Russia rose steadily from 68th in 2009 to 46th in 2019. Except for China and Russia, the ranking of the innovation index for other BRICS countries has decreased significantly. India dropped from 42nd to 52nd. South Africa dropped from 43rd to 63rd, of which 20 places decline is the largest among the five countries. Brazil descended from 50th to 66th, which is the second-largest drop apart from South Africa.
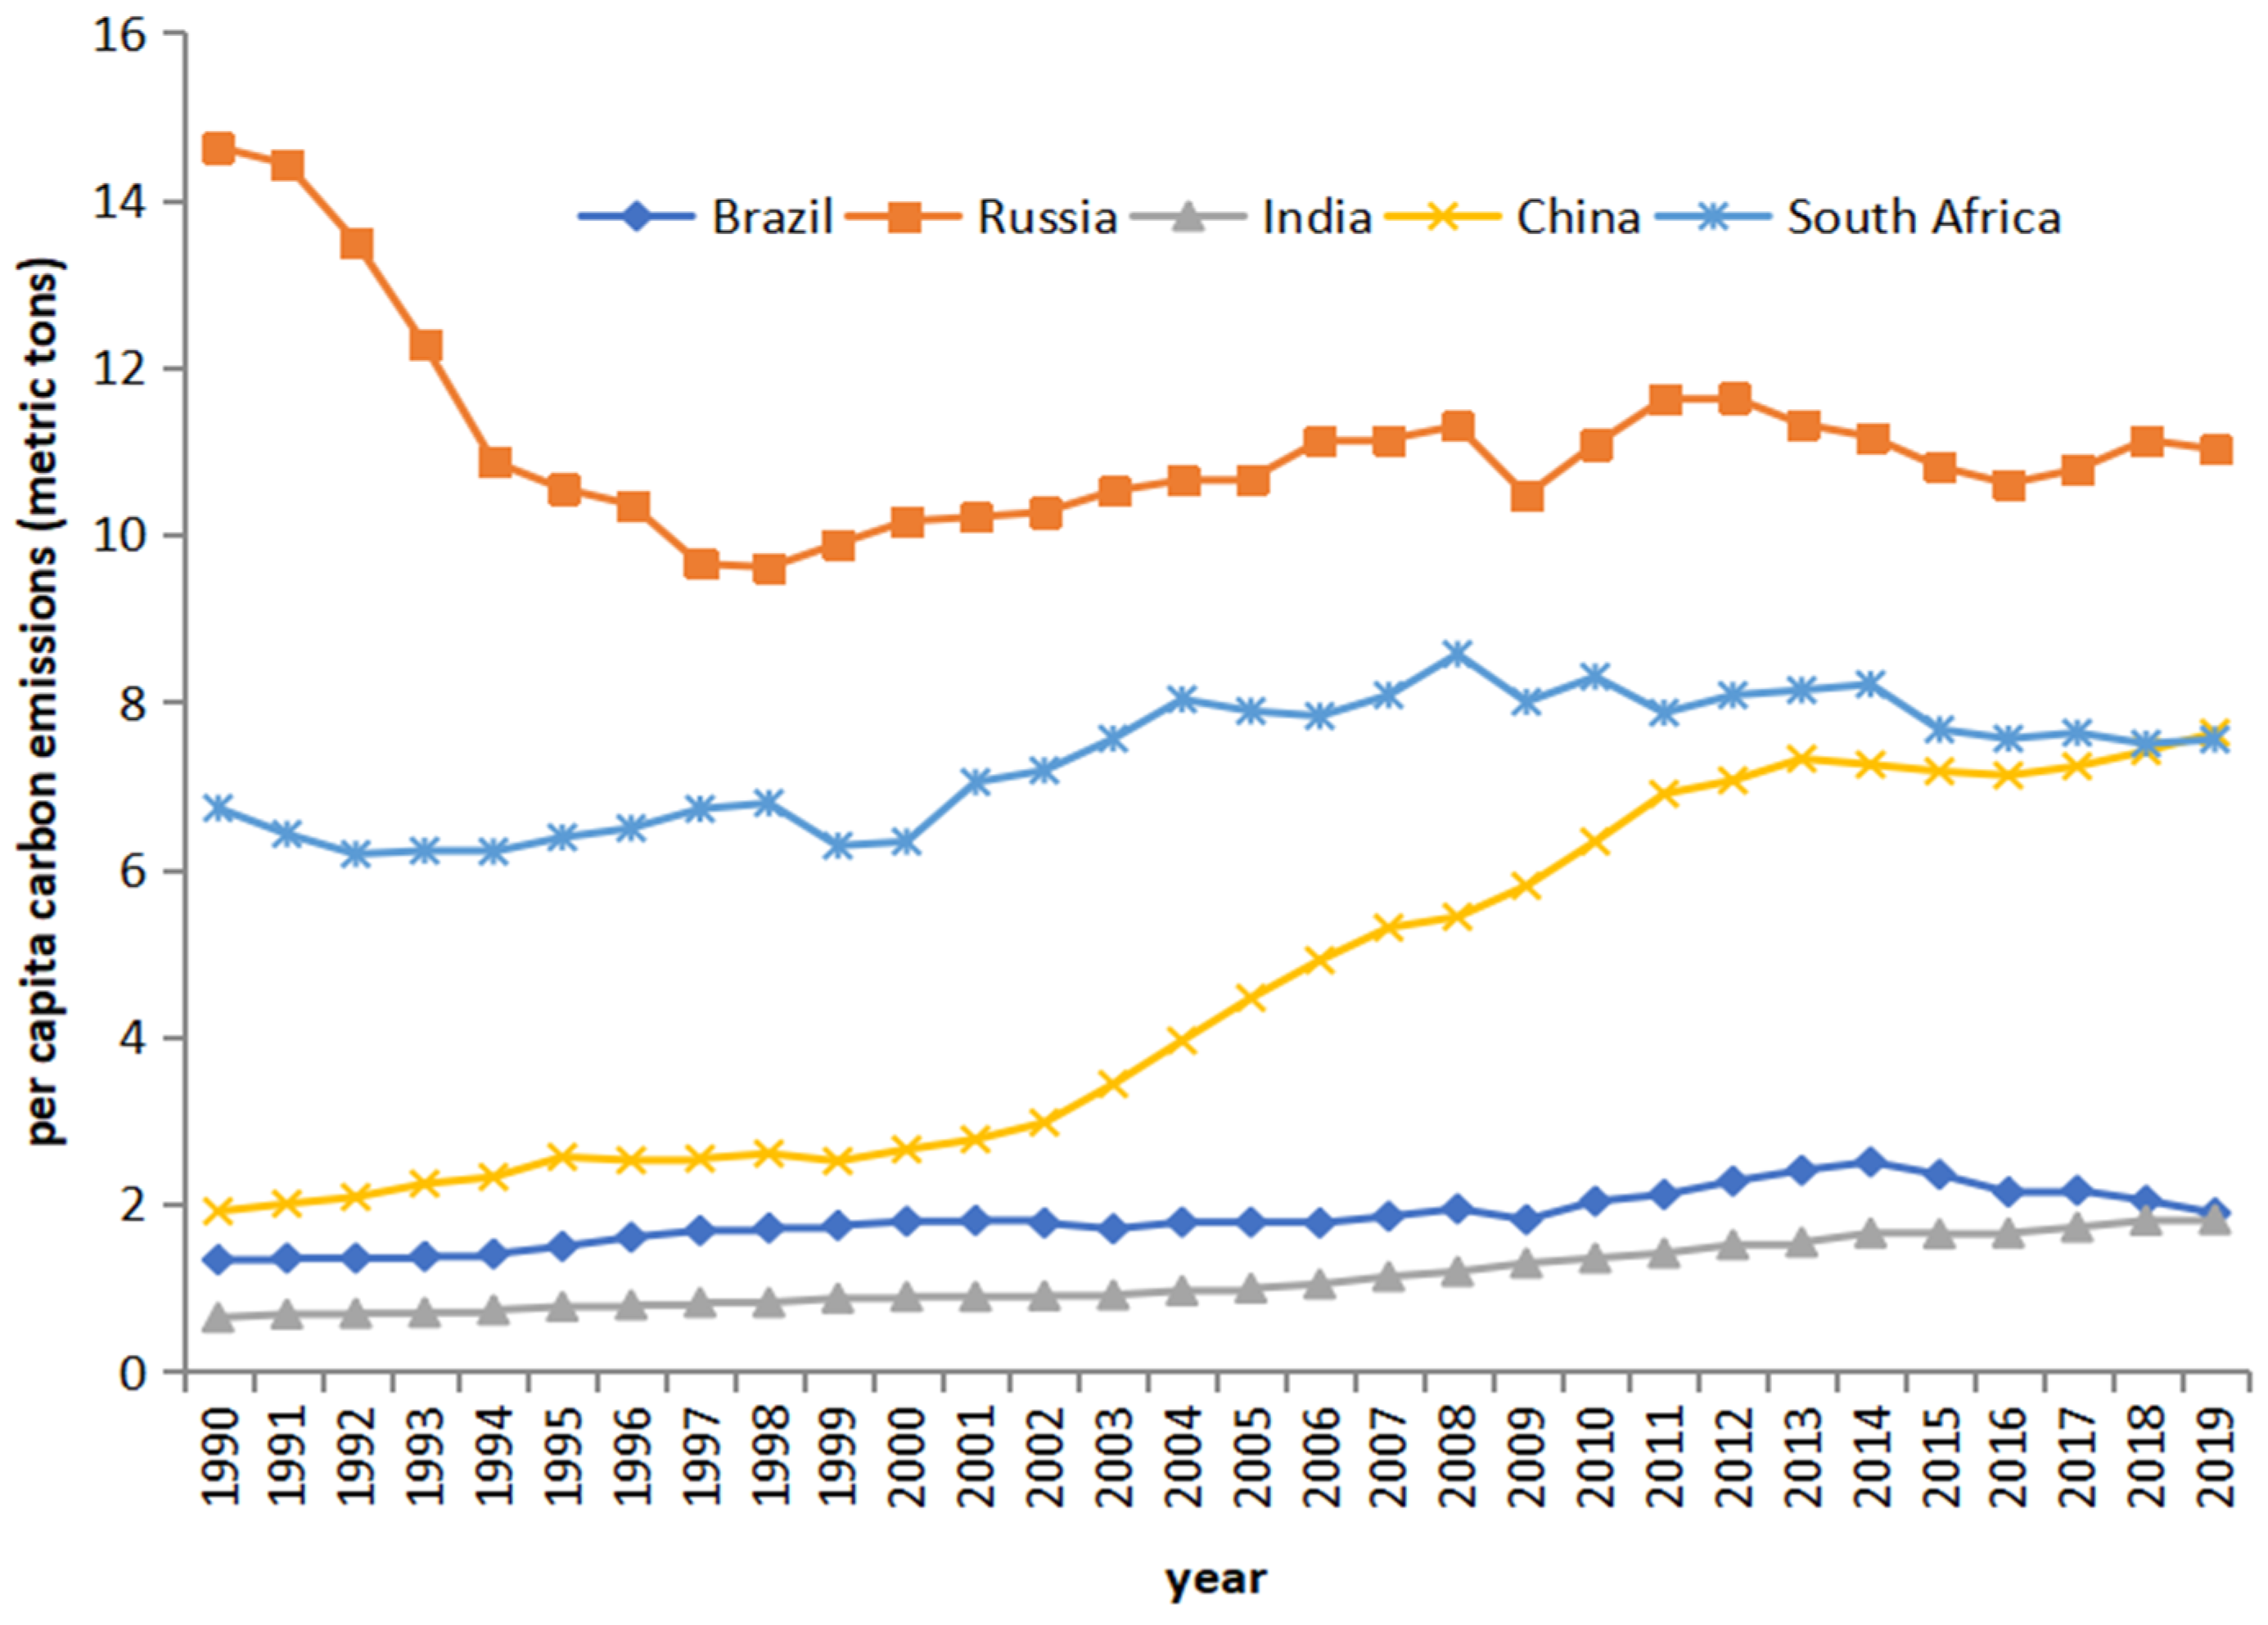
As a latecomer in the process of global industrialization, BRICS countries have grown into economies with enormous economic potential. Nonetheless, it should also be noted that as the BRICS countries are in the stage of structural transformation, their economic growth path depends heavily on energy consumption. This growth mode will not only lead to the depletion of energy use but also increase the emission of greenhouse gases and deteriorate the ecological environment (Figure 1). Climate change is an important issue undertaken by the community of mankind all over the world. Greenhouse gas emission reduction is the key to solve this problem. At present, achieving carbon peak and carbon neutralization as soon as possible has become the consensus and action of the international community. About 130 countries around the world plan to achieve their carbon neutralization goal in the mid-21st century, accounting for about 61% of the total global carbon emissions [1]. Carbon neutralization can be simply understood as zero net carbon emission, indicating the common development of “carbon emission” and “carbon absorption”. Achieving the goals of carbon peak and carbon neutralization is not only a unique way for BRICS countries to achieve green development but also a great challenge to the economic development of member countries. The path of balancing the goals of carbon peak, carbon neutralization and economic development has become an important scientific issue.
BRICS countries are actively strengthening the top-level design of the realization path of carbon peak and carbon neutrality goals, encouraging green and low-carbon technological innovation, accelerating economic and energy structure adjustment, strictly controlling the construction of new high emission and high energy consumption projects, as well as steadily promoting the adjustment and withdrawal of stock in high pollution and high energy consumption projects. It is necessary and of great practical significance to investigate the impact of innovation and GDP growth on carbon emissions, thereby putting forward countermeasures and suggestions in line with the actual situation of BRICS countries. Most of the existing studies deem that technology innovation, economic growth and carbon emissions are related, but their views are not exactly the same. This paper’s research objective is the effect of innovation and GDP growth on carbon emissions in BRICS countries. The contribution of this paper lies in that we deeply explore the reciprocal impact of technical progress and economic development on CO2 emissions under the background of carbon neutrality and put forward countermeasures and suggestions in line with the reality of BRICS countries. The research hypotheses to be verified in the upcoming sections are listed below.
Hypothesis 1 (H1).
Technology innovation is conducive to decreasing carbon emissions.
Technical progress and institutional innovation are the fundamental ways to improve carbon productivity. Technology innovation has a strong spatial spillover effect, which is likely to promote the spatial agglomeration of economic activities. Technology spillover has a negative impact on carbon emission efficiency. Endogenous innovation efforts are the key to improve regional carbon emission efficiency.
Hypothesis 2 (H2).
Economic growth will increase carbon emissions, but the impact varies during different stages of economic development.
Typical facts from the national, regional and industry-wide perspectives imply that the extensive growth mode of emerging economies boosts greenhouse gas emission and carbon intensity. EKC (Environmental Kuznets Curve) theory expounds on the inverted-U relationship between economic growth and environmental pollution. Ecological quality tends to deteriorate first and then improve along with the accumulation of GDP rise.
Hypothesis 3 (H3).
The proper combination of technology innovation and economic growth helps achieve carbon emission reduction.
The reason for this statement is a unanimous consensus has been reached that technology advancement facilitates the economy and simultaneously helps build a green production environment if low-carbon innovation patents are exploited. Thus, the appropriate combination of the two could maximize the abating effect of CO2 emissions.
2. Literature Review
2.1. Study on the Impact of Economic Growth on Carbon Emissions
Balsalobre-Lorente et al. [2] studied the association between renewable energy use, GDP growth, innovation and environmental pollution based on the sample data of 17 OECD countries from 1990 to 2012. They found that renewable energy use, GDP growth and innovation are conducive to environmental quality. Heidari et al. [3] explored the relationship between power use, economic development and carbon dioxide emission in five ASEAN economies, such as Thailand, Singapore, the Philippines, Malaysia and Indonesia, by using panel smoothing threshold regression (PSTR) model and fixed effect technology. Their empirical results show that the carbon emissions of ASEAN countries are positively affected by their power use. Albiman et al. [4] examined the empirical correlation between electricity use, carbon emissions and economic growth in Tanzania from 1975 to 2013. They used different time series techniques, including variance decomposition, impulse response and causality test. Their research results show that the use of power resources has a positive impact on carbon emissions. This also confirms the existence of EKC hypothesis. The study of Pablo-Romero and De Jesús [5] suggested an inverted-U shape relationship between income and energy consumption for Latin American and Caribbean countries. Aruga [6] found that the energy-environmental Kuznets curve (EEKC) hypothesis occurring only in the developed countries of the Asia-Pacific region. Shahbaz et al. [7] detected that EEKC exists in 20 out of 30 Chinese provinces. Similar results were found in some other studies [8,9]. Zaman and Abdel Moemen [10] adopted three different income groups in the world to investigate the influence of their power usage and GDP growth on carbon emissions. Their empirical results confirm EKC and Pollution Haven Hypothesis (PHH). Alvarez-Herranz et al. [11] selected data from 17 OECD countries to explore the impact of economic growth on environmental pollution. The conclusion indicates that economic growth has a significant positive impact on environmental pollution. There is an N-shaped EKC curve relationship between them. Chen [12] tested the relationship between carbon emissions, clean energy use and economic development of 24 economies in Asia using a variety of panel measurement technologies. The study found that carbon emissions have a positive impact on the use of clean energy, and there is bidirectional causality between them. On the contrary, Magazzino [13] concluded that from 1960 to 2013, economic growth had no significant impact on the carbon emissions of 19 APEC member countries.
Some research has paid attention to the correlation between carbon emissions and economic growth, energy consumption and other factors in BRICS countries. Some studies argued that globalization increases pollution indicators [14,15]. Wu et al. [16] found that for BRICS countries, the carbon emissions of Brazil and Russia descended with economic growth. The carbon emissions of India, China and South Africa are positively related to economic growth; that is, they rise with economic growth. Urban population and energy consumption have a positive impact on carbon emissions for all BRICS countries. Other scholars suggested that BRICS countries have experienced varied kinds of structural changes in the growth–emission nexus [17,18]. There are also some studies that focus solely on one BRICS country. Ghosh and Kanjilal [19] used the autoregressive distribution lag model to study the relationship between urbanization and energy consumption in India from 1971 to 2008. They believed that urbanization, as one of the main characteristics of economic growth, the rise in the urbanization rate significantly increased energy consumption. Therefore, it is suggested that the government should consider energy planning in the development of urbanization.
2.2. Eco-Innovation and Carbon Neutrality
Most scholars examined the impact of technical progress on carbon emissions from an industrial perspective. Richmond et al. [20] and He et al. [21] pointed out that technical progress and patent innovation are conducive to improving the environment. Borghesi [22] also believed that in the context of technology innovation, emission reduction technologies will generate learning benefits, resulting in lower carbon emission reduction costs. Acemoglu et al. [23] found that technological progress may increase or mitigate carbon dioxide emissions. Balsalobre-Lorente et al. [24] pointed out that renewable energy consumption has a positive impact on carbon dioxide emissions, which means that the usage of renewable energy consumption can significantly abate greenhouse gas emissions. Dong et al. [25] discovered that renewable energy consumption negatively affects carbon dioxide emissions in a sample of 120 countries, which means that the use of renewable energy consumption could improve the ecological environment and achieve carbon emission reduction. Bjerregaard [26] argued that R&D collaboration is conducive to the integration and utilization of external knowledge and technology, promotes scientific research cooperation and information sharing and realizes regional collaborative innovation and development. Apergis et al. [27] claimed that technological innovation can encourage enterprises to eliminate backward processes, use energy-saving technologies, form a green industrial chain and lessen carbon emission intensity. Wang and Zhang [28] affirmed that increasing research and development investment has a positive impact on decoupling economic growth from environmental pressure. In the research of Ibrahim and Ajide [29], energy innovation was found to be carbon emission abating.
Carbon emissions mainly result in environmental degradation and global warming. However, the carbon neutrality target was introduced in 2002, which seeks to lighten fossil fuel production by 6% per year by 2030 to achieve a carbon-free environment [30,31]. In particular, the cessation of fossil fuel production in 2030 will diminish emissions by approximately 45% in relation to 2010 and 60% compared with 1990. Therefore, in order to realize the goal of carbon neutrality, some people asserted that carbon prices must be set, subsidies for fossil fuel production must be stopped, new coal-fired power plants should be limited or controlled [32]. As carbon emissions reduction helps result in carbon neutralization, Robalino-Lopez et al. [33] believe that the goal of carbon neutralization can be realized by combining GDP growth and clean energy innovation at the same time. Although both renewable and non-renewable energy use have promoted economic growth, non-renewable energy depletion also increases carbon emissions, which is an obstacle to carbon neutrality. Oppositely, clean energy innovation reduces carbon emissions, which is conducive to achieve carbon neutrality goals only for developed countries [34]. Razzaq et al. [35] drew the inter-linkages between green technology innovation and carbon neutrality in BRICS countries using monthly data. Ganda [36] produced important findings that innovation exerts a considerable non-linear influence on environmental quality. For Australia’s carbon neutrality goal of reducing carbon dioxide and greenhouse gas (GHG) emissions by 80% in 2050 [37], a scenario-based hybrid life cycle assessment is employed to examine the carbon footprint of the whole economy through seven power generation technologies, rather than renewable power penetration. They discovered that renewable energy and renewable electricity are important factors in achieving carbon neutrality. For countries with distinct income levels, Jebli et al. [38] studied 102 countries from 1990 to 2015 by adopting the systematic generalized method of moments and Granger causality techniques. The findings confirm that clean energy innovation has a positive contribution to the carbon neutralization goal. It is by no means easy for developing economies to achieve an overall carbon-free environment. Most studies show that eco-innovation plays a vital role in reducing carbon emissions [39,40,41,42,43]. The transition to renewable energy is needed to achieve carbon neutrality; however, the high transition costs do hinder the economy to some extent [44]. Furthermore, the complete transformation to renewable energy will result in a dilemma in developing countries, and the whole technological revolution will lead to the contraction and bankruptcy of some sectors [45].
The existing research works lay a solid foundation for this study. To sum up, the influencing factors on carbon emission tend to be various and diverse, which is also one of the key topics of researchers. The empirical methods for the influencing factors of carbon emission are more using environmental pressure control model (IPAT, STIRPAT model), Kaya equation, EKC curve, panel model and the like. However, in terms of research objects, there are few studies on the influencing factors of carbon emissions in BRICS countries. Most of the literature related to carbon emissions focuses on one BRICS nation. With the continuous improvement of BRICS countries’ own economic development strength, the role of “stabilizer” in the current world economic system is becoming more and more prominent. With the rapid development, it is also accompanied by the problems of high energy consumption and high carbon emission. It is necessary to conduct in-depth research on the carbon emission of BRICS countries. With economic development, the problem of carbon emission is becoming increasingly serious. The existing research on the impact relationship between economy, science and technology and carbon emission is uncertain. Therefore, choosing technology innovation and economic growth as the main research variables has important theoretical and policy significance. In light of these aforesaid drawbacks and limitations, this paper aims to fill in the research gap and distinguishes from the extant study in terms of three aspects. Firstly, in terms of the research object, this paper investigates the phased characteristics of the impact of economic growth on carbon emission based on the EKC hypothesis. Additionally, adding the factor of technology patent and generating an interactive term to observe the effect of carbon emission reduction. Secondly, in terms of the research framework, innovation and environmental factors are incorporated into the economic growth analysis framework. The output equation, including environment and innovation departments, is constructed. Thirdly, in terms of research content, this paper systematically demonstrates the interaction of the three variables by considering their two-way feedback. From the perspective of the production process, an endogenous growth model considering innovation and environmental pollution is constructed and analyzed combined with the pollution equation.
3. Model Construction
3.1. Social Welfare Utility Function
People have gradually realized the importance of reducing greenhouse gas emissions, and their vigilance towards the net increase in carbon emissions is becoming stronger and stronger. This awareness of vigilance has begun to affect people’s consumption and lifestyle. In light of Romer’s [46] Ramsey model representing the maximization of individual intertemporal utility, this paper adopts the representative form of per capita elastic utility function. On account of consumption, the vigilance of representative workers to climate change is expressed by the cumulative carbon emission stock in the atmosphere, and the utility function is introduced, that is:
Considering the above constraints, in order to maximize cross-period welfare, the undermentioned conditions need to be realized:
where is consumption, and is the historical accumulated net carbon emissions of human production and living activities in the atmosphere. is the time discount rate, and indicates the preference of consumers for current consumption. The smaller the value, the stronger the representative consumers’ awareness of sustainable development. is the relative risk aversion coefficient (reciprocal of intertemporal substitution elasticity), and . is the behavioral awareness parameter of coping with climate change and the degree of preference for preventing climate change, and .
3.2. Solution of Steady-State Growth Path
R&D capital is invested in the technology development department to accumulate technology capital. Here, we assume that the proportion invested in the final product production department is , and , , indicate the output elasticity of production factors.
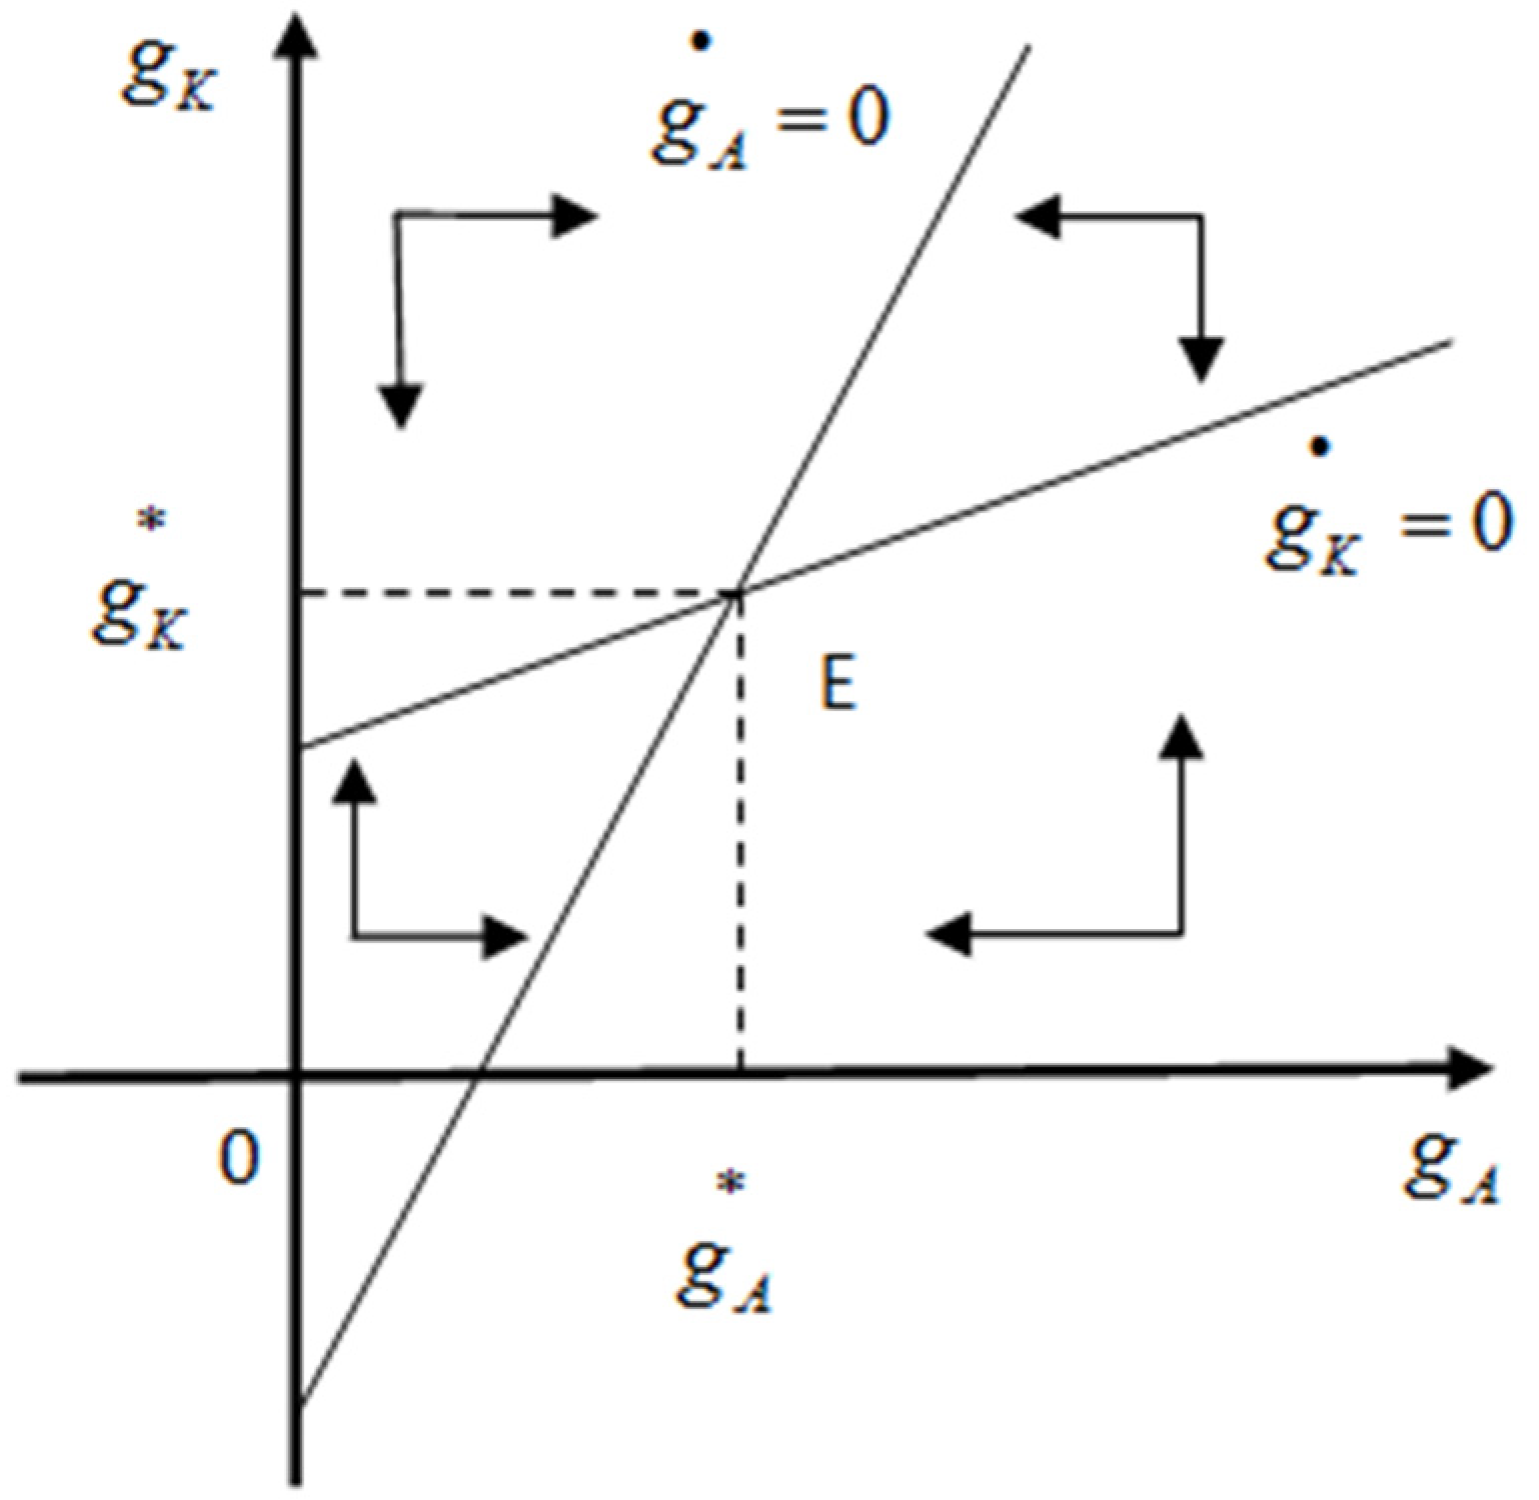
When the economic growth rate is greater than zero () and the carbon dioxide growth rate is less than zero (), it needs to meet , and . In the steady state, the long-term economic growth rate is greater than zero, and the growth rate of carbon dioxide is less than zero. At this time, the marginal utility of residents’ consumption is required to be greater than 1, and the output efficiency of human capital is required to be greater than the time discount rate. The economic significance of is that the marginal utility of consumer consumption is declined, people pay more attention to current consumption rather than saving, and there are fewer investment opportunities in the future. Without excessive saving and investment, energy consumption will be reduced. Despite sacrificing a certain potential economic growth rate in the steady state, but reducing carbon dioxide emissions and damage to the environment. Therefore, after considering the negative effects of carbon dioxide emissions, consumers give up the potential high economic growth rate in exchange for the continuous improvement of the atmospheric environment. The growth rate of technology and capital are shown in Figure 2. When the speed of technological innovation accelerates, it will affect the balanced growth path. That is, the growth rate of total output and per capita GDP will both increase.
3.3. Relevance between Innovation, Growth and Carbon Emissions
In light of the maximum principle, the Hamiltonian function is constructed. The optimal mode of economic growth under the dual constraints of energy consumption and carbon emission is:
where is household consumption; is carbon emission; is stock scale of energy consumption; is economic output; is marginal substitution rate of traditional energy; is energy consumption intensity; is coefficient of restraining variable of technology innovation on carbon emission; is carbon emission coefficient of traditional energy; , and are, respectively, the shadow prices of energy consumption, capital scale and carbon emission per unit time. Based on the calculation formula of the “Hamiltonian present value”, the first-order constraint conditions of the adjusting variables and can be obtained:
Thus, the calculation formula of the relationship between technology innovation, carbon emission and energy consumption under the constraints of , and is obtained:
Based on this, the Euler equation of technology innovation, economic growth and carbon emission under the constraints of , and can be obtained:
Through Equation (8) and the above Euler equation, the correlation measurement formula of technological innovation, carbon emission and economic growth can be generated:
For the path of sustainable economic growth, the growth rates of technological innovation, capital and energy consumption converge. Therefore, from Equation (13), the constraints when the regional economic growth rate shows a positive growth trend are indicated as below:
Supposing economic growth meets the objective constraints, we can deeply analyze the relationship between the key variables represented by carbon emission and economic growth. There is a positive correlation between economic growth and the coefficient of technology advancement inhibiting carbon emission. Therefore, reasonably enhancing green innovation and energy conservation can not only significantly promote economic growth but also effectively curb the scale of carbon emissions.
4. Methodology and Data
4.1. Econometric Model Specification
IPAT (Human Impact, Population, Affluence, Technology) model and STIRPAT (Stochastic Impacts by Regression on Population, Affluence and Technology) extended model are usually used to study the influencing factors of carbon emissions. In the 1970s, Ehrlich and Holdren [47] established the famous formula IPAT for evaluating environmental pressure, which has been widely used. As a derivative form of the IPAT model, STIRPAT can overcome the deficiency of the assumption that “various factors affect carbon emissions in the same proportion” of the IPAT model. It is a modification and extension of the IPAT model. The specific expression of the equation is:
where I represents environmental pressure; P denotes population; A signifies per capita GDP; T stands for the environmental load per unit of GDP. The IPAT model regards environmental impact as a function of population, technology and affluence.
In this study, we select the improved nonlinear random regression STIRPAT model proposed by Dietz and Rosa [48]. The STIRPAT model abandons the assumption of unit elasticity and adds randomness to facilitate empirical analysis and can evaluate the impact of various types of driving factors, such as urbanization and industrial structure, on environmental pressure through the decomposition of technical items. The STIRPAT model can overcome the deficiency of the assumption that “all influencing factors affect environmental pressure in the same proportion” of the IPAT model and is a modification and expansion of the IPAT model. The specific formula is expressed as:
If carbon dioxide emission is used to represent environmental impact, the model expression is:
The STIRPAT model can not only estimate the coefficient value of each variable but also allows adding, modifying or decomposing relevant influencing factors based on the research object. The STIRPAT model can be adjusted to meet various analytical needs. We use the urbanization rate (URB) to represent the population variable, the capital formation (CAP) to signify the affluence variable, and the proportion of industrial added value (IND) to denote the technology variable. At the same time, we bring into the interaction term of technology patent and economic growth and the quadratic term of economic growth to investigate their impact on carbon emissions, respectively. They are combined into the above equation, and then the natural logarithm form of the data is adopted. Therefore, the formula of the improved STIRPAT model can be further transformed into the following form.
Then, we take the first-order derivative of time t on both sides of these formulas and obtain Equation (21), which manifests the impact mechanism:
After the incorporation of a constant term that meets the standard assumption, as well as the interaction term and quadratic term, Formula (20) is further extended to:
The influencing direction of technology innovation and economic growth on carbon emissions is mainly decided by the value of and . If , the impact is negative or zero, which means technology innovation and economic growth abate carbon emissions; if , then the impact is positive, which means technology innovation and economic growth raise carbon emissions.
4.2. Variables Selection
4.2.1. Explained Variable
Carbon emissions (CEs).
The commonly used indicators to measure the degree of carbon emission include total carbon emissions volume, per capita carbon emissions and carbon emissions intensity. Per capita, carbon emissions refer to the proportion of total carbon emissions to the corresponding population of a country or region. This indicator can measure individual carbon emissions, which reflects that individuals have equal rights in achieving development goals and using natural resources in the development of human society [49,50]. Therefore, in terms of the existing mode of production and consumption, this indicator can reflect the residents’ living standards and interpersonal fairness of carbon emission in the whole society well. The unit of CEs is in metric tons.
4.2.2. Core Explanatory Variables
- (1).
- Technological innovation (PAT).
The reduction in carbon emission intensity or the improvement of energy efficiency stems from continuous technical progress and technology innovation [51]. It is needed to increase investments in science and technology, encourage and promote the application and promotion of high-efficiency technologies in energy development, processing, conversion and use in BRICS countries, vigorously develop low-carbon technologies and embark on the road of developing a low-carbon economy as soon as possible. It is an effective way for BRICS countries to achieve the set emission reduction targets as planned. This paper selects the number of patent applications authorized to characterize the level of technology innovation.
- (2).
- Economic growth (EG).
With the advancement of economic and social modernization, people’s demand for resources is increasing day by day. The massive consumption of resources not only directly leads to the lack and depletion of natural resources but also is likely to cause the excessive discharge of a large number of environmental pollutants, which increases the pressure on the self-recovery of the natural environmental ecosystem and seriously destroys the balance of nature. According to the Environmental Kuznets Curve (EKC) theory and based on the research of scholars [52,53], it is considered that with economic growth, carbon emission intensity is an endogenous process of “first increasing and then decreasing”. Therefore, this paper selects per capita GDP (in 2010 USD constant price) and its quadratic term to verify the EKC hypothesis.
4.2.3. Control Variables
- (1)
- Urbanization (URB).
The impact of population transfer of urbanization on energy and carbon emission is obvious. The growth characteristic of high energy consumption in the process of urbanization is an important factor affecting BRICS nations’ energy demand and carbon emission. The change of urbanization rate will cause the change of energy consumption structure, and the modernization of life mode will increase energy consumption in the process of urbanization. Therefore, an increase in the urbanization rate is expected to lead to an increase in carbon dioxide emissions.
- (2)
- Fixed capital formation (CAP).
There is a bidirectional linkage between capital formation and energy consumption, and investment is an important driving force of energy consumption [54]. Therefore, it is necessary to attract investment in green energy production. Energy consumption generated by fixed capital investment often has a positive impact on carbon dioxide emissions. While improving the total capital formation to promote economic growth, policymakers need to be aware of the negative externalities of capital formation to the environment.
- (3)
- Industry development (IND).
The increase in carbon emissions in BRICS countries is mainly due to the accelerated growth of industrial added value, resulting in a significant increase in terminal energy consumption. For developing countries, the development of the secondary industry has an especially decisive impact on carbon emissions. This paper uses the ratio of industrial added value to regional GDP to reflect the impact of industrial structure on carbon emission.
4.3. Data Source and Feature
On account of the availability and limitations of data collection and to maintain a certain consistency with other explanatory variables, this paper constructs transnational panel data of 5 BRICS countries from 1990 to 2019. All the data stem from the World Bank WDI (World Development Indicators) database.
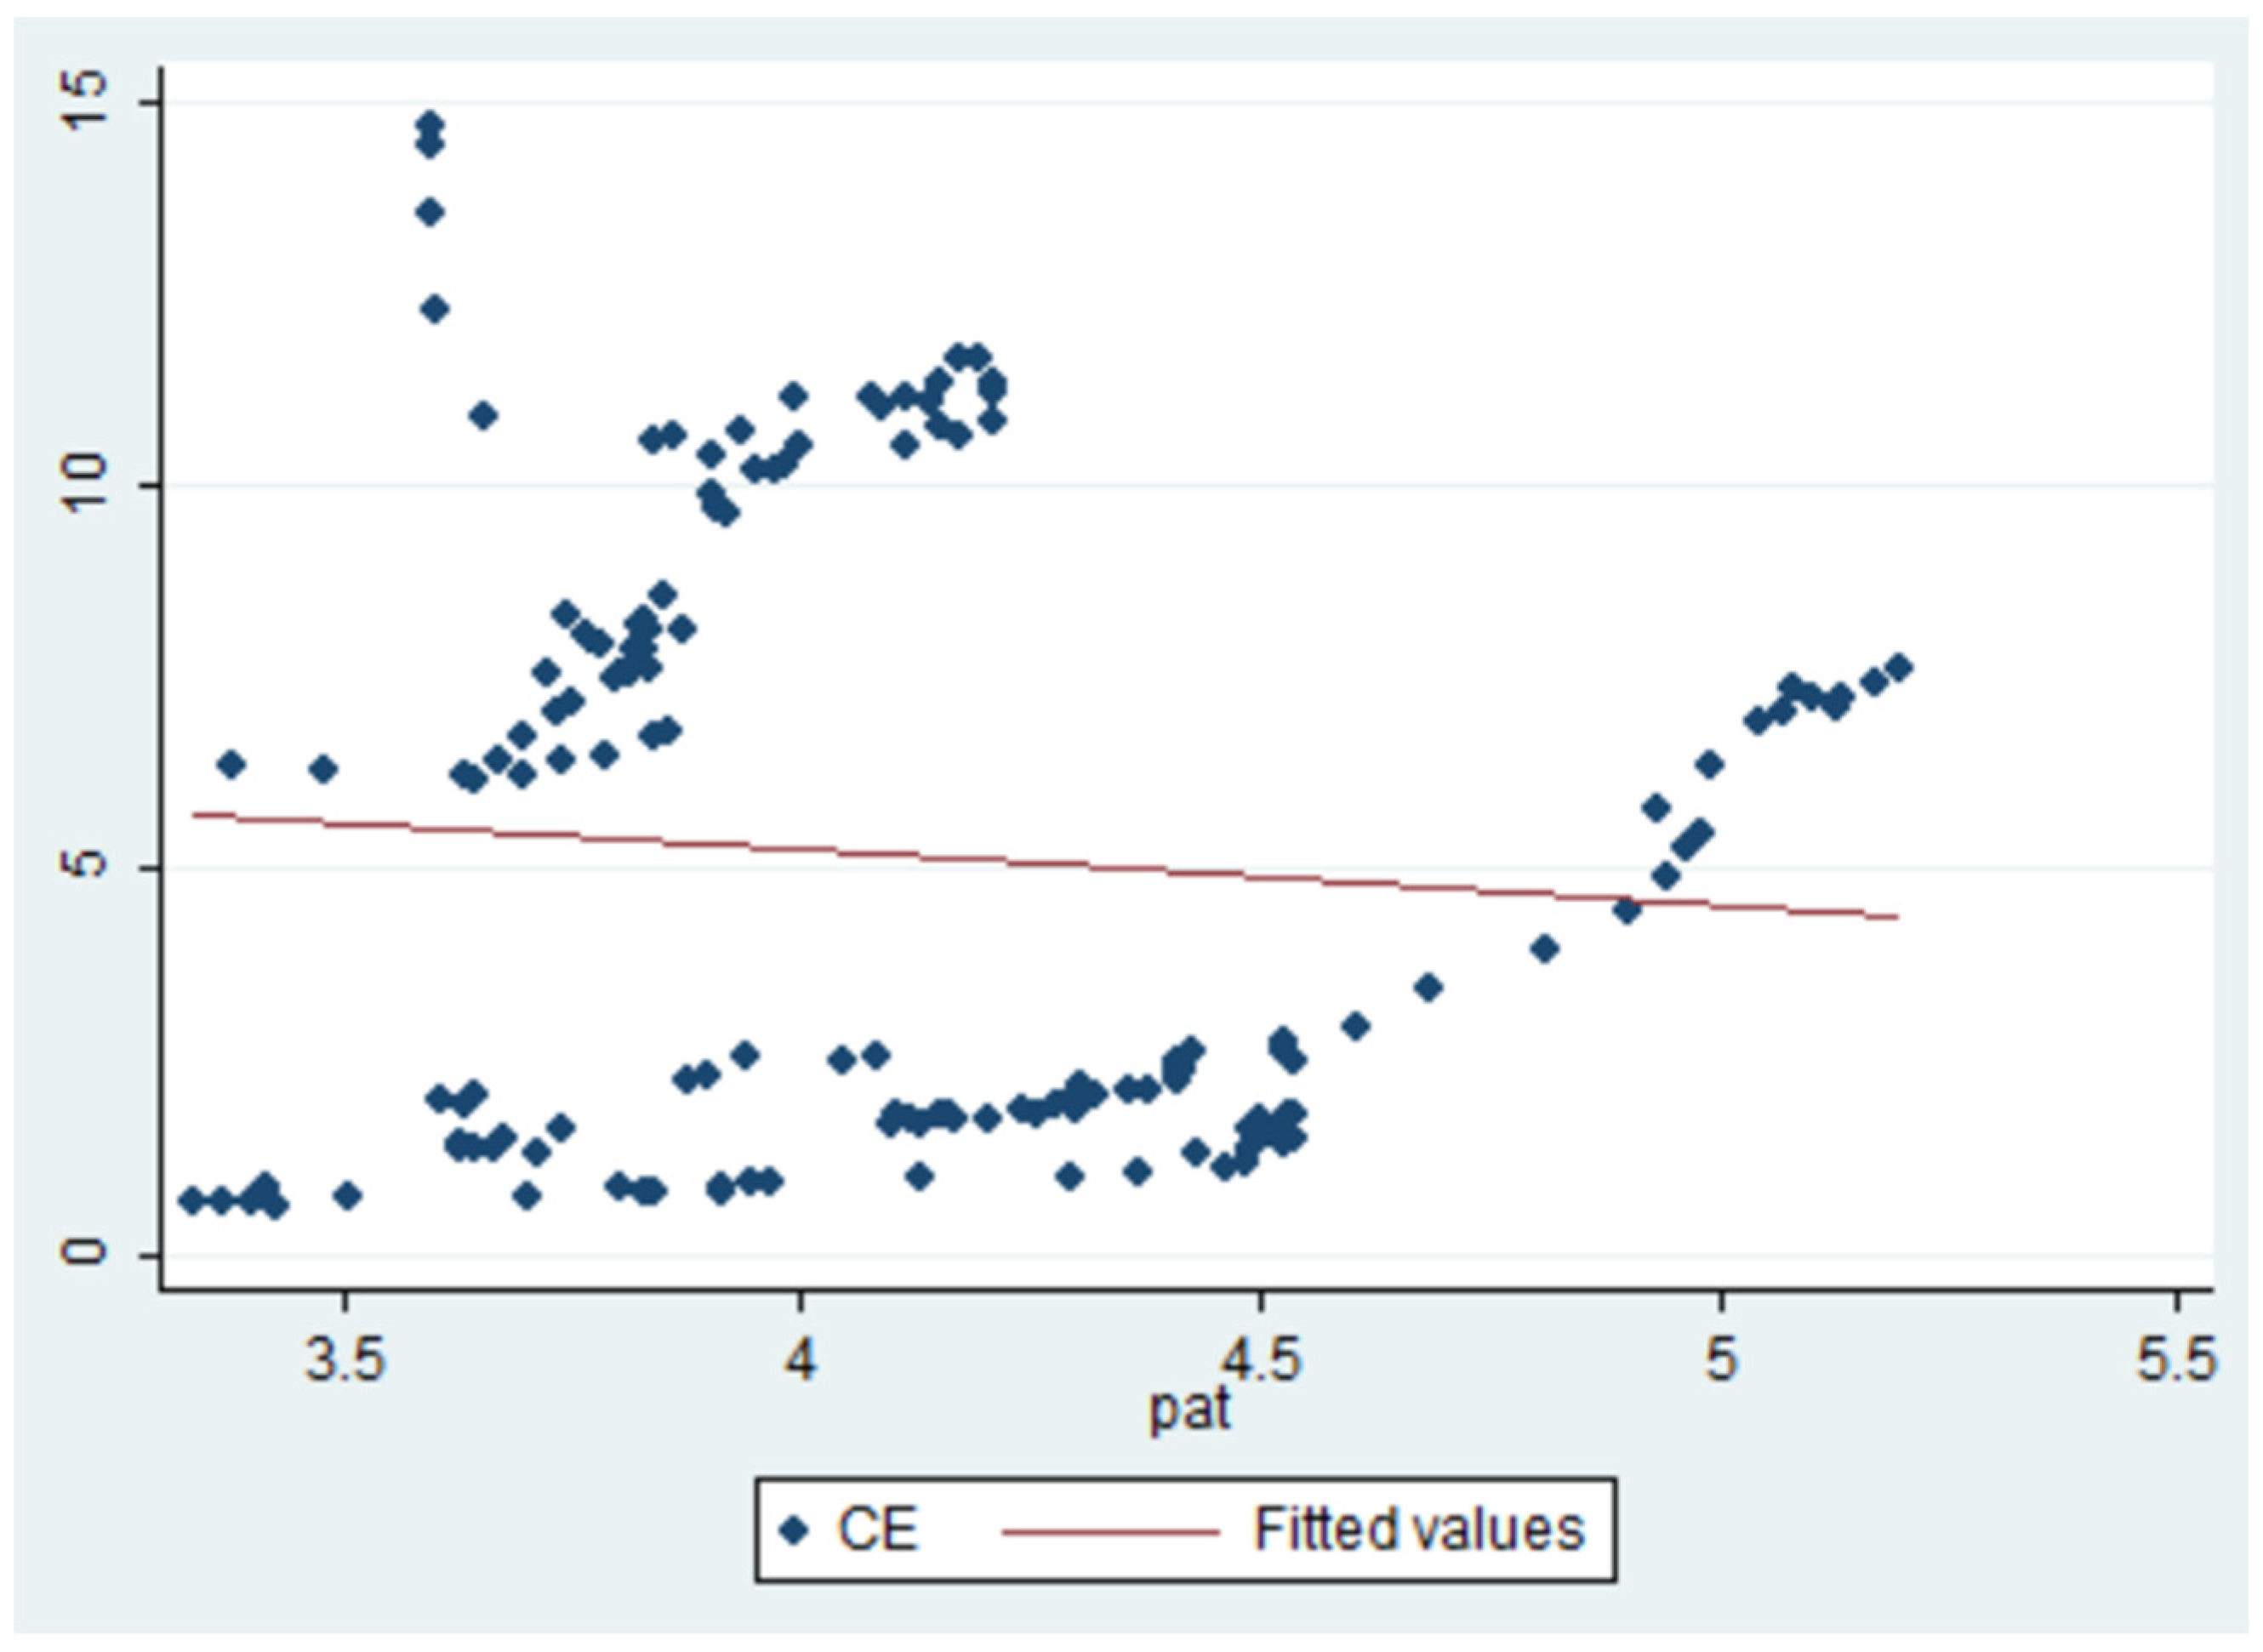
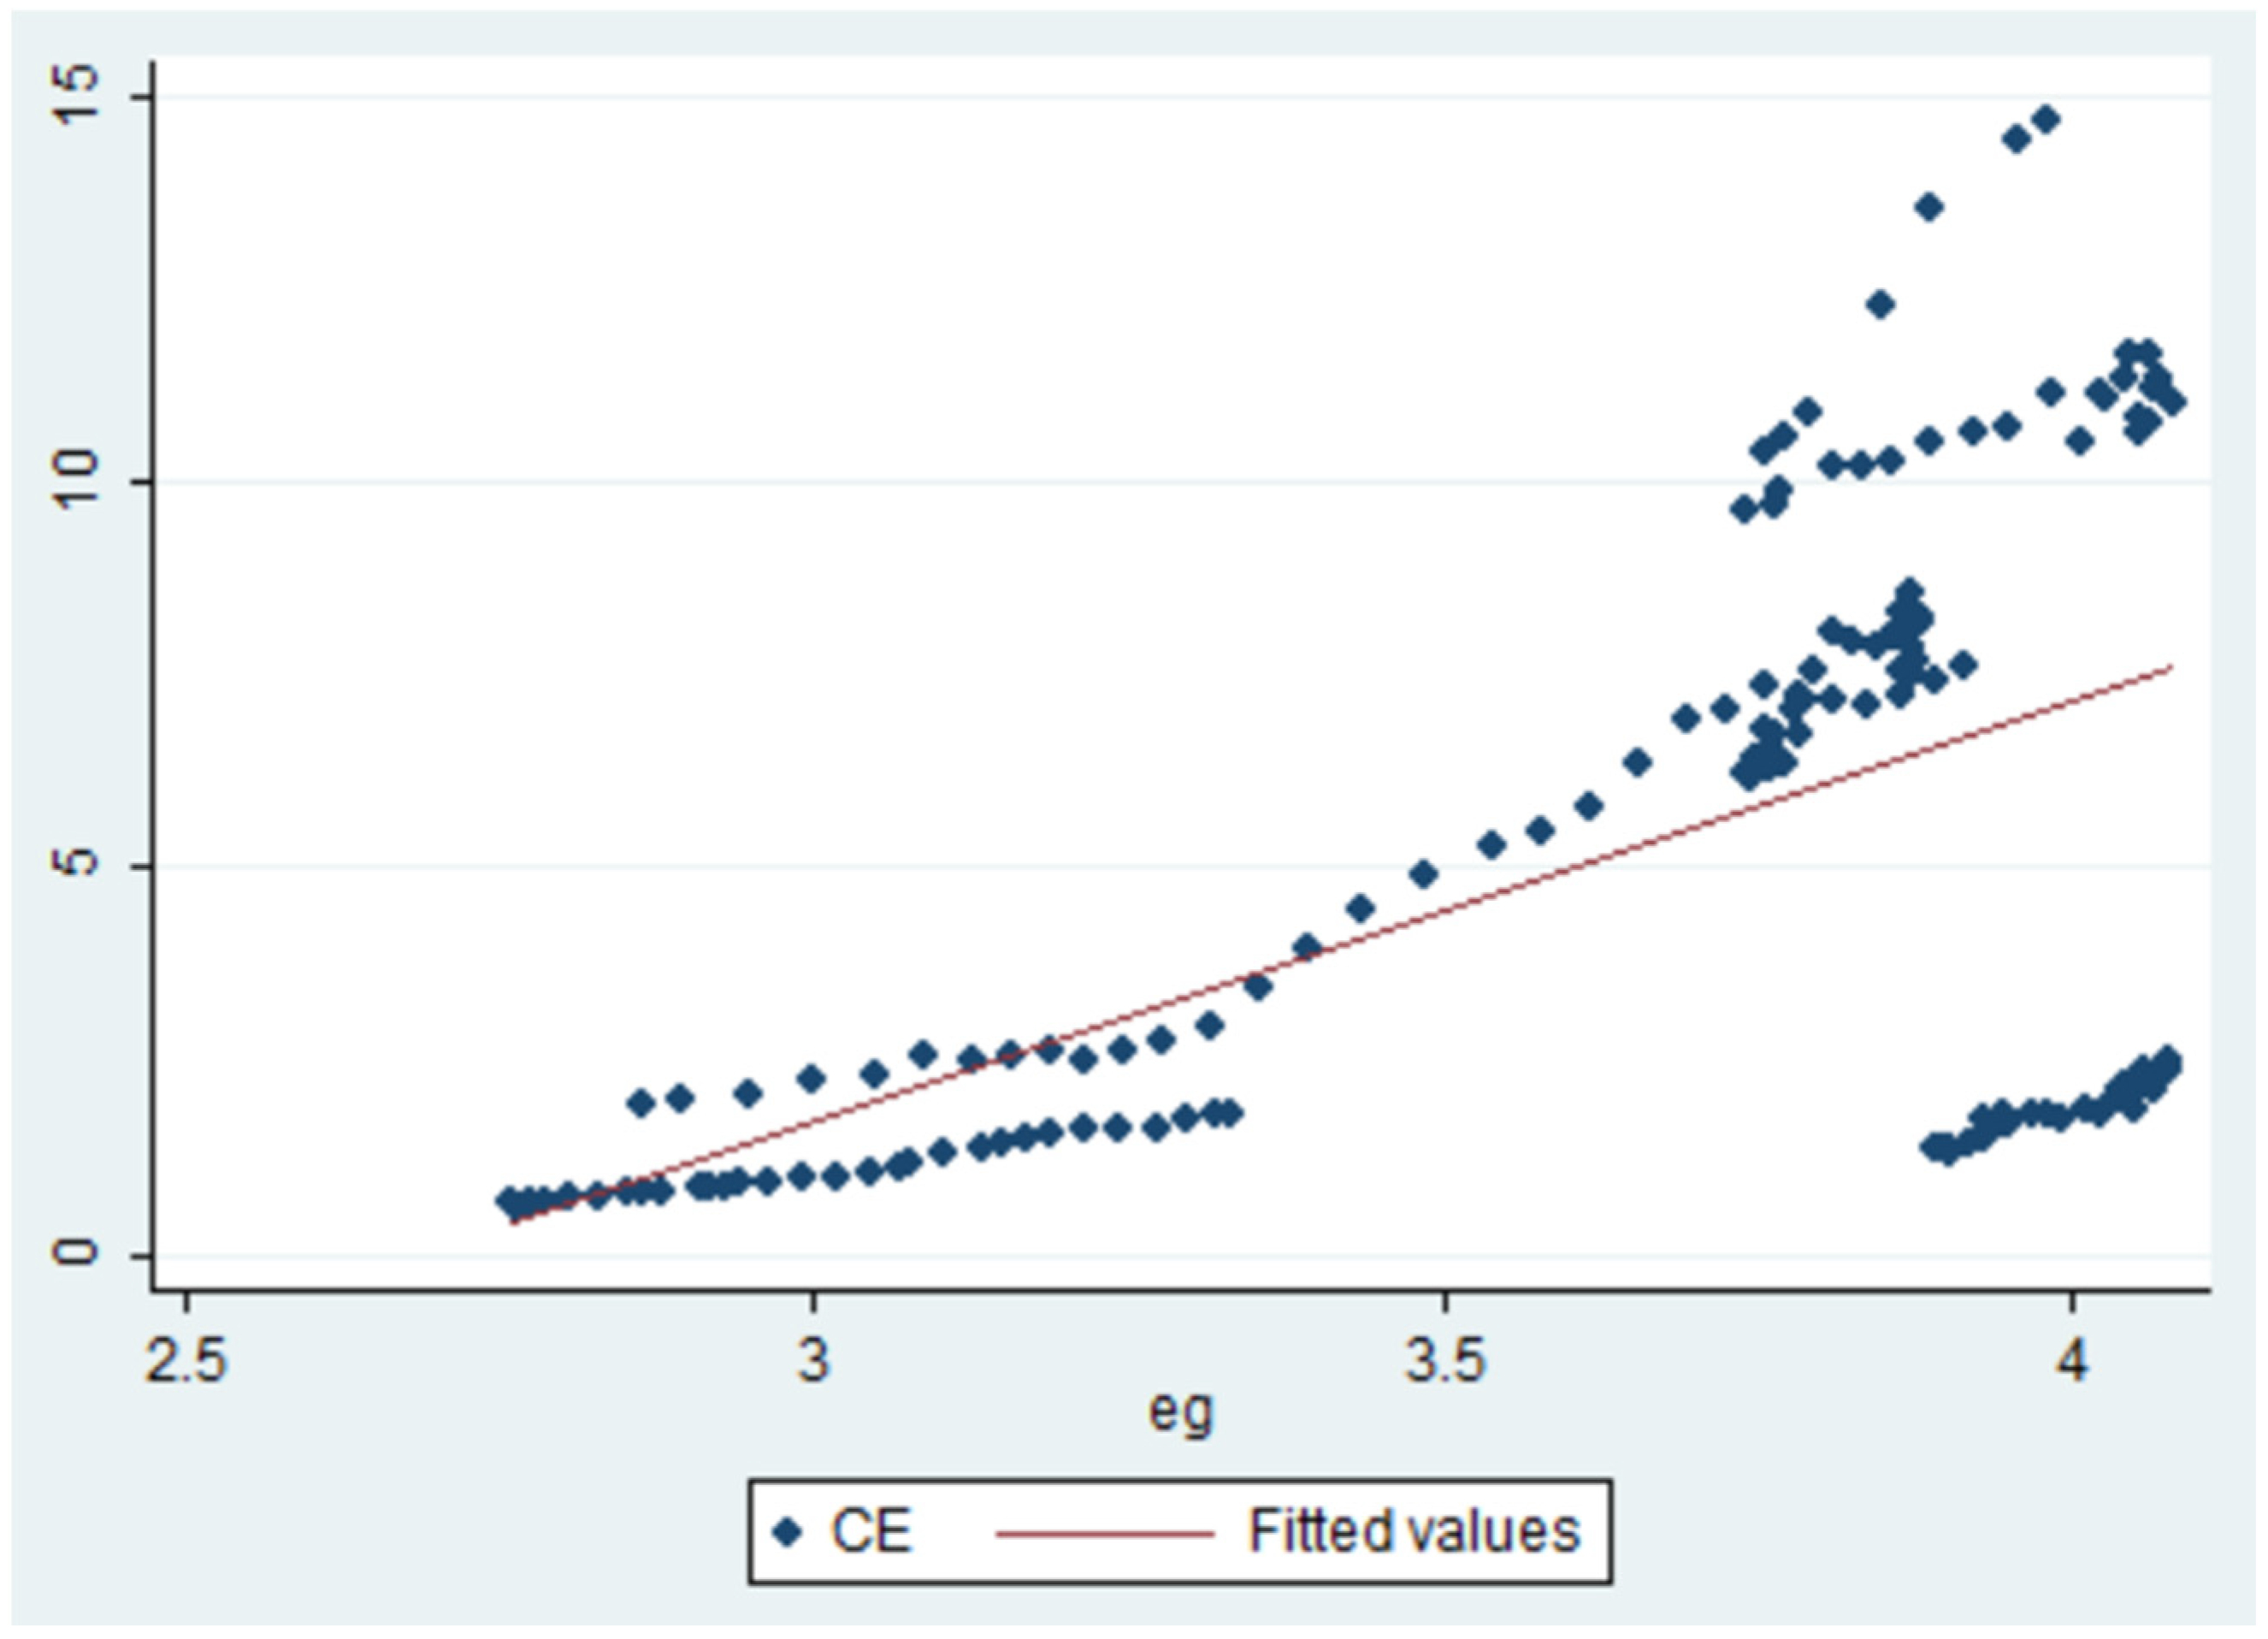
In order to ensure a stable long-term equilibrium relationship between BRICS variables and obtain more robust estimation results, the variables need to be transformed into integrated of the same order. Therefore, the natural logarithms of the variables are taken. In addition, based upon the EKC theory, the quadratic term of EG is added as one of the core variables. The descriptive statistical values of the processed BRICS variables are presented in Table 1. The correlation coefficients of the variables are displayed in Table 2. Scatter plots of the relationship between core explanatory and explained variables are revealed in Figure 3 and Figure 4.
5. Empirical Research
Based on the extended STIRPAT model, this paper selects the Population factor (percentage of urban population to total population), Affluence factor (annual growth rate of per capita gross national income) and Technology factor (value-added percentage industry to GDP) and introduces the quadratic term of per capita GDP to verify whether the EKC curve exists in BRICS countries. EKC curve indicates that there is an “inverted U-shaped” relationship between environmental pollution and economic growth. In the initial stage of rapid economic development, in order to maintain its rapid growth demand, it is likely to temporarily shelve the importance of environmental protection, thereby paying some economic costs, such as the loss and sacrifice of ecological resources. When the economy reaches a certain level, the importance of environmental protection is highlighted, and measures are taken to mitigate environmental pollution.
5.1. Panel Unit Root Test
In order to avoid the occurrence of pseudo regression, this paper first analyzes the stationarity of relevant data. The theoretical basis of this method is that the stability of time series is affected by the stability of its influencing factors; that is, when the values of factors such as mean, variance and covariance do not change with time, we can determine that the series is stable. LLC (Levin–Lin–Chu) and IPS (Im–Pesaran–Shin) tests are used in this paper, and the results are listed in Table 3. The results show that all variables have unit roots and are stationary in the first-order difference, and the sequence is integrated of I (1). Notably, the IPS test indicates PAT’s stationarity for intercept at level but instability for intercept and time trend. The results of the first difference suggest better stationarity and significance. According to the requirements, the investigated variables have the conditions for the cointegration test.
5.2. Panel Cointegration Test
After passing the unit root test, it is also necessary to test whether there is a long-term equilibrium relationship between variables. This relationship is mainly manifested as: there are two or more non-stationary variables, and there is a stationary linear combination relationship between them. In this paper, the cointegration test for each variable can certify whether the above relationship exists. The prerequisite for establishing the regression equation between variables is that the cointegration relationship can be satisfied, and there is no pseudo regression phenomenon. This study needs to test the cointegration relationship between the two variables; thus, the Pedroni cointegration test is employed. This method mainly examines the existence of the cointegration relationship between the two variables by inspecting whether the residual term of the cointegration equation is stationary. The results in Table 4 show that five out of seven test statistics verify the existence of cointegration among the selected variables. There is persuasive evidence supporting that carbon emission, technology innovation and economic growth series share a long-run equilibrium relationship.
5.3. Panel Causality Test
The Granger causality test has significant advantages in judging whether there is causality between variables and has been widely used in the empirical field. It can justify whether the change of one quantity will cause the change of another quantity. If the research shows whether the two variables containing past information have a better prediction effect on variable Y than only studying the past information of a single variable Y, it proves that the prediction effect of preferentially selecting the two variables containing past information is more accurate than simply using single variable Y. At this time, variable X can be considered as the Granger causality of variable Y. We also use the Dumitrescu–Hurlin causality test to verify the reliability of the results. The outcomes in Table 5 show that there is a unidirectional causal relationship from technology patents to carbon emissions and from economic growth to carbon emissions.
5.4. Estimation of Full Sample
Before we conduct the regression, it is necessary to ensure that there is no multicollinearity between variables. Through the Variance Inflation Factor (VIF) test, the results in column (6) of Table 6 show that the VIF value is between 1.40–1.70, which is less than the critical value of 10. Therefore, we determine that there is no multicollinearity between the selected variables. The F-statistical value shows that the fixed effect model is better than the OLS estimation model. The Hausman test indicates that columns (3), (4) and (5) should use the fixed effect estimation model, while columns (1) and (2) should use the random effect estimation model. For almost all the models, the coefficients of technology patents are significantly negative, implying that technological innovation can improve energy efficiency and reduce pollutant and carbon dioxide emissions (H1 confirmed). The coefficients of economic growth are significantly positive in almost all the models, indicating that for emerging economies represented by BRICS countries, the relationship between economy and environment has not been balanced, and excessive economic development has brought massive energy consumption and greenhouse gas emissions. Next, we generate the interactive term PAT*EG to examine how the interaction between technology patents and economic growth affects carbon emissions. The results show that although the result is significantly positive, the coefficient value becomes smaller compared with that of economic growth, manifesting that the level of technological innovation at this stage has not yet aided in decoupling economic growth from carbon emissions but helps to abate the scale of carbon emissions. For other control variables, the improvement of urbanization and industrialization has caused a significant increase in carbon emissions, while capital formation has an inhibitory effect on carbon emissions to a certain extent, although the effect is not obvious.
5.5. Estimation of Subgroups
The empirical results in Table 7 demonstrate that the impact of interaction items on the five BRICS countries have country-specific heterogeneity. Technology patents and economic growth in Brazil, India and China can inhibit carbon emissions, but the interaction term is significantly positive, indicating that the existing technology level cannot ensure the promotion of economic growth and carbon emission reduction at the same time. On the contrary, South Africa’s technology patents and GDP growth significantly improve carbon emissions, but their interaction contributes to the realization of carbon emission reduction and carbon neutrality (H3 confirmed). Technology patents and economic growth have no significant impact on Russia’s carbon emissions. The control variables have a significant positive or negative impact on carbon emissions in different countries.
Except for India, the urbanization level of the BRICS countries has reached more than 50%. Referring to the current urbanization process of rapid development of international cities, when the urbanization rate reaches the stage of 50–70%, the driving factor of urban expansion will gradually change to the development driven by various innovation factors such as the progress of industrial technology level and knowledge spillover. After the national or regional urbanization level reaches a certain level, the society will gradually progress to a new stage of healthy and sustainable development, and major environmental problems such as carbon emissions will be gradually alleviated in social development. The impact of capital formation is not significant in most countries because the capital scale of BRICS countries still needs to be improved. The industrial structure facilitates Brazil and South Africa to achieve carbon emission reduction, whereas an increase in carbon emissions in Russia and China. The economic development of Brazil and South Africa shows a trend of “deindustrialization”, and the proportion of service industry in the economic structure has increased year by year. The proportion of cleaner production and renewable energy consumption in Russia and China is relatively not high.
5.6. EKC Test for Each BRICS Country
The outcomes in the previous table imply that the effect of economic growth on carbon emissions is heterogeneous. Therefore, it is necessary to test the existence of the EKC curve in each BRICS country to sort out the direction of carbon emission reduction and carbon neutralization of these countries. We add the quadratic term of economic growth to the regression model. From the perspective of individual countries, the nonlinear fitting relationship between urbanization rate and carbon emission in BRICS countries is varied. The regression results in Table 8 manifest that there exists an EKC curve in Russia and South Africa, that is, the inverted U-shaped curve relationship between economic growth and carbon emission. Nevertheless, the relationship between economic growth and carbon emissions in Brazil, India and China presents a U-shaped curve (H2 confirmed). The reason for the disparity within the BRICS countries may be that various countries are with distinct economic development levels. The BRICS countries cover lower-middle-income countries, higher-middle-income countries and high-income countries. Moreover, countries pay varied attention to environmental protection and pollution control, which also leads to the differentiation of the dynamic deduction process of carbon emission.
Although the curve relationship between urbanization and carbon emission is distinct in various countries, the U-shaped curve for China and India determines the U-shaped relationship for BRICS countries as a whole, which is related to the large population scale and high total carbon emission of China and India. However, according to the current sample data, the BRICS countries are basically still in the stage of carbon emissions climbing with the rise of economic aggregate, that is, the “inverted U” inflection point of the impact of China’s and India’s economic development on carbon emissions has not yet appeared. At the same time, Brazil, India and China are in the right rising stage corresponding to their “positive U” relationship. It can be seen that the BRICS countries will face greater pressure on emission reduction in the future.
5.7. Test of Robustness
Next, we need to perform the robustness test to appraise the consistency of the results. This article divides the sample data into two sections according to the time span, 1990–2004 and 2005–2019, to avoid the disturbance of time trend on the estimation results. The results in Table 9 still demonstrate that technology patents play a positive role in carbon emission reduction and carbon neutralization, and the impact of economic growth on carbon emission is first reducing and then increasing, reflecting that BRICS countries as a whole still have great efforts to make before achieving the goal of carbon peak. In addition, we replace the explanatory variable with carbon intensity (carbon emissions amount divided by GDP in 2010 constant US dollar). The results show that if technology patents can be well combined with economic development, it will help to achieve carbon neutrality. In column (6), we replace the model estimation method with a two-stage least square method (2SLS). The interactive term still denotes that for the whole BRICS nations, the relationship between economic growth and carbon emission presents a U-shaped curve. China and India are the two most populous countries in the world, and their total economic volume also ranks in the top two of the BRICS countries; thus, they have a great impact on the BRICS.
5.8. Discussion
The research findings uncover that the relationship between carbon emissions and economic growth in BRICS countries is heterogeneous based on varied national conditions. The economic intensity effect is the main driving force to increase carbon emissions, whereas scientific and technological progress factors inhibit the increase in carbon emissions and have been the main driving force to restrain the total amount of carbon emissions. This is consistent with the research conclusions of previous scholars [55,56,57]. In a certain stage of economic development, with the rise of economic volume, the level of social-economic development is high, the development and utilization of resources are accelerating, and the pressure of carbon emission is increasing. Nonetheless, the environmental quality will gradually improve after a certain stage of economic development [58,59,60,61]. Russia and South Africa have been the top two emitters of per capita carbon dioxide among the BRICS nations. In the 1990s, Russia’s per capita carbon emissions continued to decline and gradually increased from 2000. The per capita carbon emissions of South Africa increased in fluctuation. Russia’s chaotic domestic political and economic environment in the 1990s lead to economic recession and descend of the level of heavy industry. Benefiting from the soaring international crude oil prices and stability of the domestic environment, the economy began to recover and grow gradually in the new century. South Africa’s economy has been growing steadily since the end of international sanctions in the early 1990s and the establishment of New South Africa in 1994. It fluctuates owing to the impact of the international economic situation, which is correlated with the overall increasing trend of per capita carbon emissions.
The carbon emissions of China, India and Brazil were relatively low in the 1990s, but China’s per capita carbon emissions have increased rapidly since the 21st century. Per capita, carbon emissions in India and Brazil are growing slowly, but the growth rate is much lower than that in China. Brazil was deeply affected by the debt crisis in Latin America in the 1980s. It did not gradually get out of the impact of the debt crisis until the late 1990s and the early 21st century. During the famous “stagnant decade” in Latin American countries, Brazil’s economic development was greatly hit. As one of the major emerging economies, India and Brazil have been growing gradually in the 21st century. Although the per capita carbon emissions of India and Brazil are relatively low, due to the large population and rapid growth, the total carbon emissions are huge, and the damage to the environment remains serious. Since China acceded to the World Trade Organization (WTO) at the beginning of the 21st century, the economy has maintained rapid growth. In the meantime, the energy consumption is huge, and the carbon emission increases sharply. All these facts reflect that the carbon emission trend of BRICS countries is highly correlated with the economic development trend, and the two are inseparable. The reason why each BRICS nation presents varied curve shape in the preceding literature might attribute to the different selection of influencing variables, time periods and estimation techniques [16,17,18,19].
6. Conclusions and Policy Implications
By selecting the transnational panel data of the five BRICS countries during the time period 1990 to 2019, this paper constructs an improved STIRPAT model to empirically testify the impact of technology innovation and economic growth on carbon emissions. The results imply that technology innovation and GDP growth have a unidirectional causal relationship for CO2 emissions. Overall, technology innovation is conducive to the realization of the goals of emission reduction and carbon neutrality. The effect of economic growth on CO2 emissions depends on the economic development level in different BRICS nations. EKC exists within Russia and South Africa, while economic growth and carbon emissions in Brazil, India and China reflect a U-shaped curve relationship. The research on carbon emissions of BRICS countries in this study has drawn some empirical results and research findings, but there are still research limitations in terms of theoretical analysis and empirical research. In the future, further investigation should focus on the factor that different countries have varied contributions to global carbon emissions due to their distinct economic volumes. We should consider the splitting of large economies and build a comprehensive multi-dimensional and multinational input-output evaluation model including detailed regional characteristics according to the emission intensity of economic activities. Based on the research findings, we raise the corresponding countermeasures and suggestions.
- The secondary industry with high energy consumption in BRICS countries needs to be reduced through the adjustment of the industrial structure. By continuously dwindling the use of traditional fossil energy and increasing investments in scientific and technological research and development to improve energy efficiency and diminish carbon emission intensity, thereby a country can enhance the inhibitory effect on carbon emission. The government should accelerate the development of the tertiary industry, give full play to the driving force of high-tech industries on economic development, diminish the dependence of economic growth on high-carbon industries, formulate and take various measures to achieve the goal of decoupling carbon emissions based on varied national emission reduction conditions. BRICS countries should improve the coordination mechanism of emission reduction, simultaneously build a fair and open cooperation platform, actively promote the flow of emission reduction funds and technology sharing and accelerate the integrated process of carbon emission management.
- For countries with higher income levels, including Russia, Brazil and South Africa, should strive to alleviate the pressure of carbon emissions faced by urbanization at a higher level through energy-saving and low-carbon technology innovation and the cultivation of carbon trading market mechanisms. Specifically, Russia and South Africa have to pay particular the attention to adjustment and optimization of the energy structure, as well as a reduction in the proportion of fossil energy consumption in the development of the economy. Russia should also seek to lessen its high energy intensity. Brazil’s future economic development ought to focus on overcoming the greater pressure of carbon emission reduction due to its high-income level through technology innovation and the establishment of a carbon trading system.
- Accelerate the establishment of multi-effect environmental schemes and tool systems. The government should improve the green development supervision scheme, particularly the green manufacturing and environmental protection standard system. Moreover, decision makers should improve the access restrictions of enterprises in terms of energy consumption and environmental pollution and strengthen the supervision of environmental protection laws and regulations. Designing and implementing the green legal supervision mechanism and strengthening the supervision of environmental accidents through the environmental risk assessment mechanism. Establishing a supervision mechanism led by the government and participated in by enterprises, social organizations and the public in order to continuously expand the ways of green supervision to ensure the smooth progress of green development.
Promoting carbon peaking and carbon neutralization is an extensive and profound social, economic and energy system revolution. Some policy initiatives can start from these aspects for the BRICS nations: First, attention should be paid to maintaining the balance between economic development and emission reduction. Second, resolutely curb the disorderly and blind development of high emission and high pollution projects. Third, an increased R&D investment in green and low-carbon technology innovation. Fourth, accelerate the development and large-scale application of low-carbon and zero-carbon technologies.
Funding
The author received financial support from the Priority Academic Program Development (PAPD) of Jiangsu Higher Education Institutions; Teaching Reform Project of Higher Education Institute of Nanjing Audit University in 2021 (Grant No. 2021JG021); Youth Project of Social Science Foundation of Jiangsu Province (Grant No. 19EYC003). All individuals included in this section have consented to the acknowledgement.
Institutional Review Board Statement
Not applicable.
Informed Consent Statement
Not applicable.
Data Availability Statement
World Bank WDI database. https://databank.worldbank.org/source/world-development-indicators (accessed on 8 October 2021).
Conflicts of Interest
The author declares no conflict of interest.
References
- Liu, J.; Liu, L.; Qian, Y.; Song, S. The effect of artificial intelligence on carbon intensity: Evidence from China’s industrial sector. Socio-Econ. Plan. Sci. 2021, 101002. [Google Scholar] [CrossRef]
- Balsalobre-Lorente, D.; Álvarez-Herranz, A.; Shahbaz, M. The long-term effect of economic growth, energy innovation, energy use on environmental quality. In Energy and Environmental Strategies in the Era of Globalization; Springer: Berlin/Heidelberg, Germany, 2019; pp. 1–34. [Google Scholar]
- Heidari, H.; Katircioğlu, S.T.; Saeidpour, L. Economic growth, CO2 emissions, and energy consumption in the five ASEAN countries. Int. J. Electr. Power Energy Syst. 2015, 64, 785–791. [Google Scholar] [CrossRef]
- Albiman, M.M.; Suleiman, N.N.; Baka, H.O. The relationship between energy consumption, CO2 emissions and economic growth in Tanzania. Int. J. Energy Sect. Manag. 2015, 9, 361–375. [Google Scholar] [CrossRef]
- Pablo-Romero, M.d.P.; De Jesús, J. Economic growth and energy consumption: The energy-environmental Kuznets curve for Latin America and the Caribbean. Renew. Sustain. Energy Rev. 2016, 60, 1343–1350. [Google Scholar] [CrossRef]
- Aruga, K. Investigating the energy-environmental Kuznets Curve hypothesis for the Asia-Pacific region. Sustainability 2019, 11, 2395. [Google Scholar] [CrossRef] [Green Version]
- Shahbaz, M.; Shafiullah, M.; Khalid, U.; Song, M. A nonparametric analysis of energy environmental Kuznets Curve in Chinese Provinces. Energy Econ. 2020, 89, 104814. [Google Scholar] [CrossRef]
- Leitão, N.C.; Balsalobre-Lorente, D.; Cantos-Cantos, J.M. The Impact of Renewable Energy and Economic Complexity on Carbon Emissions in BRICS Countries under the EKC Scheme. Energies 2021, 14, 4908. [Google Scholar] [CrossRef]
- Haseeb, A.; Xia, E.; Baloch, M.A.; Abbas, K. Financial development, globalization, and CO2 emission in the presence of EKC: Evidence from BRICS countries. Environ. Sci. Pollut. Res. 2018, 25, 31283–31296. [Google Scholar] [CrossRef] [PubMed]
- Zaman, K.; Abd-el Moemen, M. Energy consumption, carbon dioxide emissions and economic development: Evaluating alternative and plausible environmental hypothesis for sustainable growth. Renew. Sustain. Energy Rev. 2017, 74, 1119–1130. [Google Scholar] [CrossRef]
- Alvarez-Herranz, A.; Balsalobre-Lorente, D.; Shahbaz, M.; Cantos, J.M. Energy innovation and renewable energy consumption in the correction of air pollution levels. Energy Policy 2017, 105, 386–397. [Google Scholar] [CrossRef]
- Chen, W.; Lei, Y. The impacts of renewable energy and technological innovation on environment-energy-growth nexus: New evidence from a panel quantile regression. Renew. Energy 2018, 123, 1–14. [Google Scholar] [CrossRef]
- Magazzino, C. The relationship among economic growth, CO2 emissions, and energy use in the APEC countries: A panel VAR approach. Environ. Syst. Decis. 2017, 37, 353–366. [Google Scholar] [CrossRef]
- Pata, U.K. Linking renewable energy, globalization, agriculture, CO2 emissions and ecological footprint in BRIC countries: A sustainability perspective. Renew. Energy 2021, 173, 197–208. [Google Scholar] [CrossRef]
- Rahman, H.U.; Zaman, U.; Górecki, J. The Role of Energy Consumption, Economic Growth and Globalization in Environmental Degradation: Empirical Evidence from the BRICS Region. Sustainability 2021, 13, 1924. [Google Scholar] [CrossRef]
- Wu, L.; Liu, S.; Liu, D.; Fang, Z.; Xu, H. Modelling and forecasting CO2 emissions in the BRICS (Brazil, Russia, India, China, and South Africa) countries using a novel multi-variable grey model. Energy 2015, 79, 489–495. [Google Scholar] [CrossRef]
- Xiang, L.; Chen, X.; Su, S.; Yin, Z. Time-Varying Impact of Economic Growth on Carbon Emission in BRICS Countries: New Evidence From Wavelet Analysis. Front. Environ. Sci. 2021, 280. [Google Scholar] [CrossRef]
- Nawaz, M.A.; Hussain, M.S.; Kamran, H.W.; Ehsanullah, S.; Maheen, R.; Shair, F. Trilemma association of energy consumption, carbon emission, and economic growth of BRICS and OECD regions: Quantile regression estimation. Environ. Sci. Pollut. Res. 2021, 28, 16014–16028. [Google Scholar] [CrossRef]
- Ghosh, S.; Kanjilal, K. Long-term equilibrium relationship between urbanization, energy consumption and economic activity: Empirical evidence from India. Energy 2014, 66, 324–331. [Google Scholar] [CrossRef]
- Richmond, A.K.; Kaufmann, R.K. Is there a turning point in the relationship between income and energy use and/or carbon emissions? Ecol. Econ. 2006, 56, 176–189. [Google Scholar] [CrossRef]
- He, J.; Richard, P. Environmental Kuznets curve for CO2 in Canada. Ecol. Econ. 2010, 69, 1083–1093. [Google Scholar] [CrossRef] [Green Version]
- Borghesi, S.; Cainelli, G.; Mazzanti, M. Linking emission trading to environmental innovation: Evidence from the Italian manufacturing industry. Res. Policy 2015, 44, 669–683. [Google Scholar] [CrossRef]
- Acemoglu, D.; Aghion, P.; Bursztyn, L.; Hemous, D. The environment and directed technical change. Am. Econ. Rev. 2012, 102, 131–166. [Google Scholar] [CrossRef] [Green Version]
- Balsalobre-Lorente, D.; Leitão, N.C.; Bekun, F.V. Fresh validation of the low carbon development hypothesis under the EKC Scheme in Portugal, Italy, Greece and Spain. Energies 2021, 14, 250. [Google Scholar] [CrossRef]
- Dong, K.; Dong, X.; Jiang, Q. How renewable energy consumption lower global CO2 emissions? Evidence from countries with different income levels. World Econ. 2020, 43, 1665–1698. [Google Scholar] [CrossRef]
- Bjerregaard, T. Industry and academia in convergence: Micro-institutional dimensions of R&D collaboration. Technovation 2010, 30, 100–108. [Google Scholar]
- Apergis, N.; Eleftheriou, S.; Payne, J.E. The relationship between international financial reporting standards, carbon emissions, and R&D expenditures: Evidence from European manufacturing firms. Ecol. Econ. 2013, 88, 57–66. [Google Scholar]
- Wang, Q.; Zhang, F. Does increasing investment in research and development promote economic growth decoupling from carbon emission growth? An empirical analysis of BRICS countries. J. Clean. Prod. 2020, 252, 119853. [Google Scholar] [CrossRef]
- Ibrahim, R.L.; Ajide, K.B. The dynamic heterogeneous impacts of nonrenewable energy, trade openness, total natural resource rents, financial development and regulatory quality on environmental quality: Evidence from BRICS economies. Resour. Policy 2021, 74, 102251. [Google Scholar] [CrossRef]
- Erdogan, S. Dynamic nexus between technological innovation and buildings Sector’s carbon emission in BRICS countries. J. Environ. Manag. 2021, 293, 112780. [Google Scholar] [CrossRef]
- Ji, X.; Zhang, Y.; Mirza, N.; Umar, M.; Rizvi, S.K.A. The impact of carbon neutrality on the investment performance: Evidence from the equity mutual funds in BRICS. J. Environ. Manag. 2021, 297, 113228. [Google Scholar] [CrossRef] [PubMed]
- Turken, N.; Carrillo, J.; Verter, V. Strategic supply chain decisions under environmental regulations: When to invest in end-of-pipe and green technology. Eur. J. Oper. Res. 2020, 283, 601–613. [Google Scholar] [CrossRef]
- Robalino-López, A.; Mena-Nieto, A.; García-Ramos, J.E. System dynamics modeling for renewable energy and CO2 emissions: A case study of Ecuador. Energy Sustain. Dev. 2014, 20, 11–20. [Google Scholar] [CrossRef] [Green Version]
- Le, T.-H.; Chang, Y.; Park, D. Renewable and nonrenewable energy consumption, economic growth, and emissions: International evidence. Energy J. 2020, 41, 73–92. [Google Scholar] [CrossRef]
- Razzaq, A.; Wang, Y.; Chupradit, S.; Suksatan, W.; Shahzad, F. Asymmetric inter-linkages between green technology innovation and consumption-based carbon emissions in BRICS countries using quantile-on-quantile framework. Technol. Soc. 2021, 66, 101656. [Google Scholar] [CrossRef]
- Ganda, F. The non-linear influence of trade, foreign direct investment, financial development, energy supply and human capital on carbon emissions in the BRICS. Environ. Sci. Pollut. Res. 2021. [Google Scholar] [CrossRef] [PubMed]
- Wolfram, P.; Wiedmann, T.; Diesendorf, M. Carbon footprint scenarios for renewable electricity in Australia. J. Clean. Prod. 2016, 124, 236–245. [Google Scholar] [CrossRef] [Green Version]
- Jebli, M.B.; Farhani, S.; Guesmi, K. Renewable energy, CO2 emissions and value added: Empirical evidence from countries with different income levels. Struct. Chang. Econ. Dyn. 2020, 53, 402–410. [Google Scholar] [CrossRef]
- Bibi, A.; Zhang, X.; Umar, M. The imperativeness of biomass energy consumption to the environmental sustainability of the United States revisited. Environ. Ecol. Stat. 2021. [Google Scholar] [CrossRef]
- Fabrizi, A.; Guarini, G.; Meliciani, V. Green patents, regulatory policies and research network policies. Res. Policy 2018, 47, 1018–1031. [Google Scholar] [CrossRef]
- Bastida, L.; Cohen, J.J.; Kollmann, A.; Moya, A.; Reichl, J. Exploring the role of ICT on household behavioural energy efficiency to mitigate global warming. Renew. Sustain. Energy Rev. 2019, 103, 455–462. [Google Scholar] [CrossRef] [Green Version]
- Saidi, K.; Omri, A. The impact of renewable energy on carbon emissions and economic growth in 15 major renewable energy-consuming countries. Environ. Res. 2020, 186, 109567. [Google Scholar] [CrossRef] [PubMed]
- Zhang, J.; Dai, Y.; Su, C.-W.; Kirikkaleli, D.; Umar, M. Intertemporal change in the effect of economic growth on carbon emission in China. Energy Environ. 2021. [Google Scholar] [CrossRef]
- Erdoğan, S.; Yıldırım, S.; Yıldırım, D.Ç.; Gedikli, A. The effects of innovation on sectoral carbon emissions: Evidence from G20 countries. J. Environ. Manag. 2020, 267, 110637. [Google Scholar] [CrossRef]
- Semieniuk, G.; Campiglio, E.; Mercure, J.F.; Volz, U.; Edwards, N.R. Low-carbon transition risks for finance. Wiley Interdiscip. Rev. Clim. Chang. 2021, 12, e678. [Google Scholar] [CrossRef]
- Romer, P.M. Endogenous technological change. J. Political Econ. 1990, 98 Pt 2, S71–S102. [Google Scholar] [CrossRef] [Green Version]
- Ehrlich, P.R.; Holdren, J.P. Impact of population growth. Science 1971, 171, 1212–1217. [Google Scholar] [CrossRef] [PubMed]
- Dietz, T.; Rosa, E.A. Rethinking the environmental impacts of population, affluence and technology. Hum. Ecol. Rev. 1994, 1, 277–300. [Google Scholar]
- Shafiei, S.; Salim, R.A. Non-renewable and renewable energy consumption and CO2 emissions in OECD countries: A comparative analysis. Energy Policy 2014, 66, 547–556. [Google Scholar] [CrossRef] [Green Version]
- Wang, M.; Li, Y.; Liao, G. Research on the Impact of Green Technology Innovation on Energy Total Factor Productivity, Based on Provincial Data of China. Front. Environ. Sci. 2021, 9, 219. [Google Scholar] [CrossRef]
- Raghutla, C.; Chittedi, K.R. Financial development, energy consumption, technology, urbanization, economic output and carbon emissions nexus in BRICS countries: An empirical analysis. Manag. Environ. Qual. Int. J. 2020, 32, 290–307. [Google Scholar] [CrossRef]
- Haseeb, M.; Hassan, S.; Azam, M. Rural–urban transformation, energy consumption, economic growth, and CO2 emissions using STRIPAT model for BRICS countries. Environ. Prog. Sustain. Energy 2017, 36, 523–531. [Google Scholar] [CrossRef]
- Liu, H.; Liang, S.; Cui, Q. The Nexus between Economic Complexity and Energy Consumption under the Context of Sustainable Environment: Evidence from the LMC Countries. Int. J. Environ. Res. Public Health 2021, 18, 124. [Google Scholar] [CrossRef]
- Satrovic, E.; Muslija, A.; Abul, S.J. The relationship between CO2 emissions and gross capital formation in Turkey and Kuwait. South East Eur. J. Econ. Bus. 2020, 15, 28–42. [Google Scholar] [CrossRef]
- Ramanathan, R.; He, Q.; Black, A.; Ghobadian, A.; Gallear, D. Environmental regulations, innovation and firm performance: A revisit of the Porter hypothesis. J. Clean. Prod. 2017, 155, 79–92. [Google Scholar] [CrossRef] [Green Version]
- Plank, J.; Doblinger, C. The firm-level innovation impact of public R&D funding: Evidence from the German renewable energy sector. Energy Policy 2018, 113, 430–438. [Google Scholar]
- Asongu, S.A.; Nwachukwu, J.C.; Pyke, C. The comparative economics of ICT, environmental degradation and inclusive human development in Sub-Saharan Africa. Soc. Indic. Res. 2019, 143, 1271–1297. [Google Scholar] [CrossRef]
- Rubashkina, Y.; Galeotti, M.; Verdolini, E. Environmental regulation and competitiveness: Empirical evidence on the Porter Hypothesis from European manufacturing sectors. Energy Policy 2015, 83, 288–300. [Google Scholar] [CrossRef] [Green Version]
- Grant, D.; Jorgenson, A.K.; Longhofer, W. How organizational and global factors condition the effects of energy efficiency on CO2 emission rebounds among the world’s power plants. Energy Policy 2016, 94, 89–93. [Google Scholar] [CrossRef] [Green Version]
- Kemp, R.; Never, B. Green transition, industrial policy, and economic development. Oxf. Rev. Econ. Policy 2017, 33, 66–84. [Google Scholar] [CrossRef]
- Sharma, S.S. Determinants of carbon dioxide emissions: Empirical evidence from 69 countries. Appl. Energy 2011, 88, 376–382. [Google Scholar] [CrossRef]
Figure 1.
Per capita carbon emissions for BRICS countries over 1990–2019.

Figure 2.
Dynamic phase diagram of technology and capital growth rate. : growth rate of technology of actual state; : growth rate of capital of actual state; : growth rate of technology of equilibrium; : growth rate of capital of equilibrium.
Figure 2.
Dynamic phase diagram of technology and capital growth rate. : growth rate of technology of actual state; : growth rate of capital of actual state; : growth rate of technology of equilibrium; : growth rate of capital of equilibrium.

Figure 3.
Relationship between technology innovation and carbon emissions.

Figure 4.
Relationship between economic growth and carbon emissions.


Table 1.
Descriptive statistics of the variables.
| Type of Variables | Variable Name | Symbol | Mean | Standard Deviation | Min | Max | Variance | Skewness | Kurtosis |
|---|---|---|---|---|---|---|---|---|---|
| Dependent variable | Carbon emission | CE | 5.1862 | 3.8714 | 0.6421 | 14.6332 | 14.9884 | 0.4693 | 1.8892 |
| Core independent variable | Technology innovation | PAT | 4.1101 | 0.4451 | 3.3376 | 5.1961 | 0.1981 | 0.6843 | 2.8357 |
| Economic growth | EG | 3.6375 | 0.4082 | 2.7601 | 4.0835 | 0.1666 | −0.8296 | 2.2135 | |
| Quadratic term | EG2 | 13.3971 | 2.8347 | 7.6178 | 16.6757 | 8.0359 | −0.7376 | 2.0665 | |
| Control variable | Urbanization | URB | 1.7264 | 0.1748 | 1.4073 | 1.9386 | 0.0305 | −0.5573 | 1.7959 |
| Fixed capital formation | CAP | 1.3714 | 0.1058 | 1.2597 | 1.6485 | 0.0181 | 0.5478 | 2.1434 | |
| Industry development | IND | 1.4881 | 0.1058 | 1.2597 | 1.6772 | 0.0112 | 0.2223 | 2.3649 |
Note: 2 is square.
Table 2.
Correlation matrix of the variables.
| CE | PAT | EG | URB | CAP | IND | |
|---|---|---|---|---|---|---|
| CE | 1.0000 | |||||
| PAT | −0.0826 | 1.0000 | ||||
| EG | 0.5698 | 0.0689 | 1.0000 | |||
| URB | 0.4323 | −0.0559 | 0.9421 | 1.0000 | ||
| CAP | −0.1812 | 0.7093 | −0.4635 | −0.5877 | 1.0000 | |
| IND | 0.2266 | 0.3054 | −0.2551 | −0.3787 | 0.6729 | 1.0000 |
Table 3.
Panel unit root test results.
| Levin–Lin–Chu (LLC) Test | ||||
|---|---|---|---|---|
| Level | First Difference | |||
| Intercept | Intercept and Trend | Intercept | Intercept and Trend | |
| CE | −1.0227 | 0.1056 | −2.0369 ** | −0.9861 * |
| PAT | 0.1214 | 9.8125 | −16.3105 *** | −2.7071 *** |
| EG | 0.1577 | 2.1410 | −2.8355 *** | −2.1696 ** |
| Im–Pesaran–Shin (IPS) Test | ||||
| Level | First difference | |||
| Intercept | Intercept and trend | Intercept | Intercept and trend | |
| CE | −0.0269 | −2.0724 ** | −3.9153 *** | −1.0071 * |
| PAT | −3.8448 *** | −0.9165 | −11.1120 *** | −8.3796 *** |
| EG | 0.7329 | −0.5856 | −4.9789 *** | −3.0150 *** |
Note: * p < 0.1. ** p < 0.05. *** p < 0.01.
Table 4.
Panel cointegration test results.
| PEDRONI TEST | ||
|---|---|---|
| INTERCEPT | INTERCEPT AND TREND | |
| PANEL V | 1.6013 ** | 0.1343 |
| PANEL RHO | −0.9847 | 2.0311 |
| PANEL PP | −8.9912 *** | −6.0393 *** |
| PANEL ADF | −9.4826 *** | −6.1206 *** |
| GROUP RHO | 3.1676 | 5.1711 |
| GROUP PP | −5.8689 *** | −7.6701 *** |
| GROUP ADF | −12.8016 *** | −4.3523 *** |
Note: * p < 0.1. ** p < 0.05. *** p < 0.01.
Table 5.
Panel causality test results.
| (a) PAT→CE | Lag Length | Granger F-Statistics | Dumitrescu–Hurlin Z-Statistics |
|---|---|---|---|
| 1 | 9.6848 *** | 3.5678 *** | |
| 2 | 2.1573 * | 2.4862 ** | |
| 3 | 1.1334 | 2.1261 ** | |
| (b) CE→PAT | Lag length | Granger F-statistics | Dumitrescu–Hurlin Z-statistics |
| 1 | 2.5641 * | −0.0025 | |
| 2 | 1.5424 | 0.3123 | |
| 3 | 1.9251 * | −0.7277 | |
| (c) EG→CE | Lag length | Granger F-statistics | Dumitrescu–Hurlin Z-statistics |
| 1 | 0.0088 | 3.1742 *** | |
| 2 | 6.5597 *** | 3.1058 *** | |
| 3 | 3.4836 ** | 2.2509 ** | |
| (d) CE→EG | Lag length | Granger F-statistics | Dumitrescu–Hurlin Z-statistics |
| 1 | 1.4741 | 10.0118 *** | |
| 2 | 0.3833 | 5.1367 *** | |
| 3 | 0.7758 | 3.7646 *** |
Note: * p < 0.1. ** p < 0.05. *** p < 0.01.
Table 6.
Estimation results of the full sample.
| Independent Variable | (1) CE | (2) CE | (3) CE | (4) CE | (5) CE | (6) VIF Test |
|---|---|---|---|---|---|---|
| PAT | −1.8516 *** | −3.7762 *** | −0.2832 | −3.5746 *** | −4.2857 *** | 1.39 |
| (−6.18) | (−3.22) | (−0.24) | (−3.15) | (−3.53) | ||
| EG | 8.3895 *** | 5.7155 *** | 7.4116 *** | 5.4191 *** | 0.7562 | 1.36 |
| (14.54) | (3.40) | (4.89) | (3.32) | (0.45) | ||
| PAT*EG | 0.5912 ** | −0.5181 | 0.5924 ** | 0.8618 *** | ||
| (1.69) | (−1.47) | (1.76) | (2.28) | |||
| URB | 0.1277 *** | 0.1309 *** | 1.45 | |||
| (6.50) | (7.45) | |||||
| CAP | −0.0504 *** | −0.0170 * | 1.70 | |||
| (−3.63) | (−3.62) | |||||
| IND | 0.0915 *** | 1.30 | ||||
| (5.94) | ||||||
| _cons | −17.7204 *** | −8.9294 * | −20.1773 *** | −8.5413 ** | −3.2009 | |
| (−7.23) | (−1.55) | (−4.02) | (−1.66) | (−0.62) | ||
| R squared | 0.7278 | 0.7331 | 0.7947 | 0.7559 | 0.8456 | |
| F-statistic or Wald | −8.5413 ** | 395.49 | 136.41 | 109.15 | 126.89 | |
| (−1.66) | [0.00] | [0.00] | [0.00] | [0.00] | ||
| Hausman Test | 0.37 | 1.19 | 139.85 | 140.21 | 137.95 | |
| [0.94] | [0.87] | [0.00] | [0.00] | [0.00] | ||
| Model | RE | RE | FE | FE | FE |
Note: * p < 0.1. ** p < 0.05. *** p < 0.01.
Table 7.
Estimation results of subgroups categorized by country.
| Independent Variable | (1) Brazil | (2) Russia | (3) India | (4) China | (5) South Africa |
|---|---|---|---|---|---|
| PAT | −51.8151 *** | 19.5943 | −2.7361 *** | −23.9217 *** | 158.6698 *** |
| (−3.68) | (0.64) | (−3.11) | (−11.58) | (2.46) | |
| EG | −56.3271 *** | 30.9502 | −2.4377 ** | −23.2230 *** | 177.3566 *** |
| (−3.49) | (1.02) | (−1.92) | (−9.35) | (2.72) | |
| PAT × EG | 13.3019 *** | −5.2125 | 0.9385 *** | 7.5996 *** | −41.7387 *** |
| (3.72) | (−0.68) | (2.94) | (10.81) | (−2.44) | |
| URB | 0.0131 | −1.2922 *** | 0.0337 | −0.2221 ** | −0.1529 *** |
| (0.70) | (−3.39) | (0.35) | (−1.97) | (−3.28) | |
| CAP | 0.0129 * | −0.0196 | −0.0012 | −0.0163 | 0.0209 |
| (1.53) | (−1.04) | (−0.20) | (−1.10) | (0.66) | |
| IND | −0.0247 *** | 0.1670 *** | −0.0050 | 0.1468 *** | −0.1135 *** |
| (−3.01) | (3.35) | (−0.44) | (4.27) | (−2.08) | |
| _cons | 220.7013 *** | −17.3955 | 7.1731 ** | 76.1756 *** | −654.766 *** |
| (3.51) | (−0.13) | (2.05) | (11.39) | (−2.66) | |
| R squared | 0.9287 | 0.9113 | 0.9880 | 0.9968 | 0.9257 |
| F-statistic | 63.93 | 39.40 | 315.31 | 1177.62 | 47.77 |
| [0.00] | [0.00] | [0.00] | [0.00] | [0.00] |
Note: * p < 0.1. ** p < 0.05. *** p < 0.01.
Table 8.
EKC test results for each BRICS country.
| Independent Variable | (1) Brazil | (2) Russia | (3) India | (4) China | (5) South Africa |
|---|---|---|---|---|---|
| PAT | 0.5196 *** | −0.0942 | 0.6592 | 1.3194 *** | |
| (2.78) | (−0.80) | (0.96) | (2.67) | ||
| EG | −269.4311 *** | 209.9918 *** | −6.9591 ** | −63.6825 *** | 615.1604 *** |
| (−2.83) | (2.63) | (−1.93) | (−4.96) | (2.33) | |
| EG2 | 33.9405 *** | −25.9371 *** | 1.2705 ** | 9.5498 *** | −78.4235 *** |
| (2.87) | (−2.54) | (1.82) | (4.13) | (−2.26) | |
| URB | 0.0116 | 0.1036 | 0.1437 | −0.1238 *** | |
| (0.56) | (1.03) | (0.74) | (−2.57) | ||
| CAP | 0.0034 | −0.0086 | −0.0037 | −0.0013 | 0.0057 |
| (0.43) | (−0.49) | (−0.58) | (−0.05) | (0.18) | |
| IND | −0.0151 ** | 0.2035 *** | 0.0120 | 0.2751 *** | −0.1001 ** |
| (−1.94) | (7.89) | (1.04) | (4.70) | (−1.80) | |
| _cons | 533.6725 *** | −420.0236 *** | 7.5325 ** | 88.2741 *** | −1192.684 *** |
| (2.80) | (−2.69) | (1.34) | (4.68) | (−2.37) | |
| R squared | 0.9334 | 0.8688 | 0.9856 | 0.9887 | 0.9235 |
| F-statistic | 53.70 | 41.40 | 261.57 | 334.67 | 46.25 |
| [0.00] | [0.00] | [0.00] | [0.00] | [0.00] |
Note: 2 is square. * p < 0.1. ** p < 0.05. *** p < 0.01.
Table 9.
Robustness check.
| Independent Variable | (1) CE 1990–2004 | (2) CE 1990–2004 | (3) CE 2005–2019 | (4) CE 2005–2019 | (5) CI Carbon Intensity | (6) CE 2SLS |
|---|---|---|---|---|---|---|
| PAT | −7.5737 *** | −0.4047 | −16.0689 *** | 0.1777 | 0.6821 ** | −2.5269 *** |
| (−2.58) | (−1.20) | (−4.50) | (−5.62) | (2.00) | (−4.66) | |
| EG | 1.9736 | −50.9822 *** | −15.0272 *** | −14.3567 *** | −1.0961 *** | −26.2435 ** |
| (0.64) | (−7.93) | (−3.73) | (−2.34) | (2.30) | (−1.88) | |
| PAT × EG | 1.6361 ** | 4.5781 ** | −0.1757 * | |||
| (1.89) | (4.99) | (−1.65) | ||||
| EG2 | 8.4509 *** | 2.9627 *** | 6.0723 *** | |||
| (9.15) | (3.12) | (2.87) | ||||
| URB | 0.0743 | 0.1017 *** | −0.0231 | −0.0213 | 0.0205 *** | −0.2045 *** |
| (1.40) | (2.97) | (−0.87) | (−0.67) | (4.15) | (−5.63) | |
| CAP | −0.0537 *** | −0.0464 *** | 0.0195 * | 0.0225 * | −0.0038 | −0.0808 * |
| (−3.01) | (−3.84) | (1.51) | (1.59) | (−1.14) | (−1.50) | |
| IND | 0.0399 * | 0.0726 *** | 0.0604 *** | 0.0336 | 0.0085 ** | 0.2275 *** |
| (1.45) | (3.96) | (2.49) | (1.24) | (1.96) | (7.48) | |
| _cons | −0.4504 | 71.6407 *** | 56.9988 *** | 16.9511 | 3.4205 *** | 34.4473 * |
| (−0.05) | (7.16) | (3.58) | (1.34) | (2.37) | (1.51) | |
| R squared | 0.6399 | 0.8353 | 0.8047 | 0.7644 | 0.7454 | 0.6257 |
| F-statistic or Wald | 18.95 | 54.10 | 43.95 | 34.62 | 67.84 | 520.79 |
| [0.00] | [0.00] | [0.00] | [0.00] | [0.00] | [0.00] | |
| Model | FE | FE | FE | FE | FE | 2SLS |
Note: 2 is square. * p < 0.1. ** p < 0.05. *** p < 0.01.
Publisher’s Note: MDPI stays neutral with regard to jurisdictional claims in published maps and institutional affiliations. |
© 2021 by the author. Licensee MDPI, Basel, Switzerland. This article is an open access article distributed under the terms and conditions of the Creative Commons Attribution (CC BY) license (https://creativecommons.org/licenses/by/4.0/).
Share and Cite
MDPI and ACS Style
Zhang, H. Technology Innovation, Economic Growth and Carbon Emissions in the Context of Carbon Neutrality: Evidence from BRICS. Sustainability 2021, 13, 11138. https://doi.org/10.3390/su132011138
AMA Style
Zhang H. Technology Innovation, Economic Growth and Carbon Emissions in the Context of Carbon Neutrality: Evidence from BRICS. Sustainability. 2021; 13(20):11138. https://doi.org/10.3390/su132011138
Chicago/Turabian StyleZhang, Huan. 2021. "Technology Innovation, Economic Growth and Carbon Emissions in the Context of Carbon Neutrality: Evidence from BRICS" Sustainability 13, no. 20: 11138. https://doi.org/10.3390/su132011138
Note that from the first issue of 2016, this journal uses article numbers instead of page numbers. See further details here.