
Influence of Cities-Based Entertainment on Tourist Satisfaction: Mediating Roles of Destination Image and Experience Quality


1
Management Department, College of Business Administration, King Faisal University, Al-Hassa 31982, Saudi Arabia
2
Hotel Management Department, Faculty of Tourism and Hotel Management, Helwan University, Cairo 12612, Egypt
3
Hotel Management Department, Faculty of Tourism and Hotels, Suez Canal University, Ismailia 41522, Egypt
*
Author to whom correspondence should be addressed.
Sustainability 2021, 13(19), 11086; https://doi.org/10.3390/su131911086
Submission received: 18 August 2021
/
Revised: 2 October 2021
/
Accepted: 5 October 2021
/
Published: 7 October 2021
(This article belongs to the Special Issue Online Retailing and Sustainable Marketing)
Abstract
:In response to the Saudi Vision 2030, the Kingdom has developed mega entertainment events in different cities, referred to as cities-based entertainment, to diversify the long prevalent oil-dependent economy and change the traditional image of the Kingdom as a sole religious tourism destination. This research develops and tests a conceptual model on the relationship between the quality cities-based entertainment recently provided at the kingdom, and destination image, quality of tourist experience, and tourist satisfaction. More specifically, the research examines the direct influence of quality cities-based entertainment on tourist satisfaction and the indirect influence through destination image and quality of tourist experience. A structural equation modeling (SEM) was used to test structural relationships between the research variables. The results showed a positive and significant influence of event (cities-based entertainment) quality on destination image and on tourist experience quality. However, the results revealed that event—i.e., cities-based entertainment—quality failed to have a direct influence on tourist satisfaction. Hence, destination image and tourist experience quality were found to fully mediate the influence of event quality on tourist satisfaction. Theoretical and practical implications of the results are discussed and elaborated.
1. Introduction
Saudi Arabia’s national transformation programs based on the Saudi Vision 2030 aim to bring radical changes in the way the economy functions and operates [1]. One of the most fundamental objectives of these national transformation programs is to empower the non-oil sectors of the economy to diversify the long prevalent oil-dependent economic model in the Kingdom [1]. Among such major non-oil sectors, the tourism industry has a potential contribution to economic growth and development. The Kingdom of Saudi Arabia’s (KSA) tourism industry has a long-sustained image as a religious tourism destination due to the presence of major Islamic holy sites within the Kingdom attracting religious tourists from all over the world [2]. Recently, the KSA tourism industry has focused on developing other tourism niches as a means to empower the overall tourism sector, e.g., cultural, sports, recreational and shopping festivals. Among these new tourism niches are the mega festivals or entertainment events, which were launched recently as a response to the Saudi Vision 2030. These mega entertainment events, which were called the Saudi Seasons or cities-based entertainment, contribute to changing the traditional image of the Kingdom as a sole religious tourism destination and open the door for new tourism niches.
Establishing a proper destination image is crucial for competitiveness [3]. This is because destination image plays a key role in tourist experience and satisfaction [4], shaping the intention of tourists to visit and revisit the destination [5,6]. Destination image is defined as the total impressions perceived by tourists regarding a specific destination [7]. The quality of tourist experience, which involves the interaction with destination, is also important due to its direct link with perceived value as well as tourist satisfaction [8]. Tourist satisfaction is crucial for business survival as tourists hold the key for tourism development and growth [9].
Earlier studies [4,6,8] on the relationship between event quality, destination image, and quality of experience and tourist satisfaction showed a positive relationship between these variables. For instance, a recent study [4] showed that event quality positively influences destination image, perceived value, tourist satisfaction, and loyalty towards a destination. However, such studies often conducted in western and/or eastern countries, context with limited studies on developing country context, especially where tourism development is at early stages and event tourism is totally a new experience in these countries like the case of KSA. Proper understanding of factors that affect tourist satisfaction in relation to these cities-based entertainments will help policymakers better plan and organize these events to achieve tourist satisfaction. This will definitely influence tourism development in the country and on its contribution to the overall economy. Additionally, it is also crucial to understand whether the results obtained from developed countries can be adapted to developing countries, i.e., KSA where tourism is a new experience for policymakers.
This study develops and tests a conceptual model on the relationship between the quality cities-based entertainment in KSA (these are mega events undertaken at different regions or cities in the country), destination image, quality of tourist experience, and tourist satisfaction. The study examines the direct impact of cities-based entertainment quality on forming a proper destination image, quality of tourist experience, and ultimately on tourist satisfaction. The study also addresses the curial role of destination image and quality of tourist experience in the relationship between cites-based entertainment quality and tourist satisfaction.
2. The Saudi Context
In April 2016, the Crown Prince Mohammed bin Salman launched the Saudi Vision 2030 which aims to diversify the economy and decrease the Kingdom’s over dependence on oil. KSA has launched various plans for achieving this vision by developing non-oil sectors, e.g., tourism and entertainment. Tourism and entertainment have become growth drivers for the economic rise in KSA. This includes an increase in inbound tourism and reduction of outbound tourism. The Saudi Commission for Tourism and Heritage (SCTH) was established to promote religious as well as other niches of tourism, e.g., entertainment. Given the Saudi Vision 2030, the government aims to become one of the biggest key players in the global tourism sector and number one in the Middle East.
According to the study conducted by the Travel and Tourism Council (WTTC), the travel and tourism sector in the year 2018 contributed SAR 244.6 billion (US $65 billion) to the economy of Saudi Arabia. The travel and tourism sector represents 9% of the total economy of the country, which means one in every eleven Riyals is being generated by the travel and tourism sector. The study by WTTC, showed that the travel and tourism sector in KSA supports a total number of 1.1 million jobs, or 8.5% of the total employment. The study also confirmed that the travel and tourism sector contributed strongly to the kingdom’s economy and has long been recognized as the driver of economic growth, job creation, as well as the development of remote rural areas [10].
Several tourism projects have been initiated for enhancing the number of tourists within Saudi Arabia. Hence, in September 2019, KSA introduced a new tourist visa for foreign visitors to attract them to the kingdom. Before this time, the Saudi Arabia’s foreign tourism market depended almost exclusively on millions of pilgrims who enter the Kingdom each year to visit the Holy Mosques and perform Omrah and Hajj [2]. The government hopes that the launch of the tourist visas for the foreigners will open the door to new markets to explore the kingdom. However, the novel Coronavirus disease (COVID-19), which became a worldwide pandemic a few months after the launch of the tourism visa interrupted this hope.
In response to the Saudi Vision 2030, KSA has organized mega events called the Saudi Seasons Events. The Saudi Seasons is a cities-based entertainment initiative inaugurated by the SCTH. This includes eleven seasons or mega events, which take place at different Saudi regions or cities to cover most of the KSA. The idea of ‘Saudi Season 2019’ was first discussed in mid-2018 and it was a collaboration between different Saudi government departments under the supervision of the Prime Minister. The Saudi Seasons or cities-based entertainment aimed at transforming the kingdom into a unique event tourism destination for the world. These mega events, which include recreational, cultural, shopping, sports, and business activities, were designed to provide tourists with unique tourism experience. The head of the General Entertainment Authority (GEA) said that the Saudi Seasons were very successful events, which contributed successfully to the economy as well as the image of the country as a unique tourism destination [11]. For instance, the head of GEA argued that Riyadh Season had more than 11 million tourists and over SAR 4 billion revenues (US $1.1 billion). These events were interrupted in the 2020 COVID-19 outbreak, but they are expected to resume in September 2021 [11].
3. Literature Review
3.1. The Influence of Quality Events (Cities-Based Entertainment) on Destination Image and Quality of Tourist Experience
As highlighted earlier, different government departments in KSA have cooperated to provide, for the first time, quality Saudi events based on different regions or cities in the kingdom, hence, they are referred to as “cities-based entertainment”. The government co-operated with international companies to provide quality service for their tourists since tourism is new experience in the country. This service quality of events is critical for tourists as it shapes their perceptions and their intention towards the destination [6,12]. This means that if tourists perceived the quality of events, they are more likely to spend a long time at these events and recommend them to family and friends [13].
Research (e.g., [5]) has shown that image plays a significant role in promoting tourism destinations and is a key for differentiation between destinations. Destination image is defined as the total impressions perceived by tourists regarding a specific destination [7]. It has two major components: the cognitive and affective. Cognitive image refers to tourists’ beliefs and knowledge regarding a place, whereas affective image is related to their feelings and/or emotional responses towards it [14,15,16,17]. However, image is a combination of these two components together [18]. Both components are crucial for shaping the overall tourism destination images [17], albeit research (e.g., [7]) has confirmed that cognitive image affects affective image.
The quality of tourist experience is critical since it has a strong association with perceptions of value and satisfaction, which ultimately affect a tourist’s loyalty [8]. Tourist experience quality is the perceived quality based on their evaluation of overall experience at a destination for a specific time [19]. This includes experiencing both the tangible or physical and intangible or social environment of a destination, which can lead to four feelings of experience: escapism, relaxation, enjoyment, and involvement [8].
A review of research to date on events (e.g., [4,20,21,22]) notes several studies examined the relationship between event quality and destination image. A study [21] examined the relationship between sports’ events quality and destination image and found that event quality has contributed successfully to creating positive destination image. Additionally, another study [20] found association between event quality and destination image, perceived value, as well as behavioral intention. Moreover, further research [22] found a positive effect of destination service quality on affective image. In the same context, a recent research study [4] examined the association between destination image, perceived value, tourist satisfaction and loyalty, and event quality. The study showed a significant and powerful impact of event quality on destination image, perceived value, tourist satisfaction, and loyalty. The relationships between tourist experience quality, perceived value, tourist satisfaction, and loyalty were examined [8]. The study showed that tourists experience quality positively influences perceived value, tourist satisfaction, and ultimately their loyalty to the destination. Based upon the above arguments, it could be hypothesized that:
Hypothesis 1 (H1):
Event (cities-based entertainment) quality positively influences destination image.
Hypothesis 2 (H2):
Event (cities-based entertainment) quality positively influences tourist experience quality.
3.2. The Influence of Quality Events (Cities-Based Entertainment) on Tourist Satisfaction
Tourist satisfaction is often defined in the marketing literature using “disconfirmation theory” which involves the discrepancy between tourist expectation and actual performance or perceptions [23]. In other words, tourists are expected to be satisfied if they perceive performance higher than his/her expectations [24]. In the context of event management, research has associated event quality with tourist satisfaction (see for example, [4,25]). A recent study [25] examined the association between event quality, tourist satisfaction, and behavioral intentions and found that tourist satisfaction is positively associated with event quality. Similarly, another recent study [4] confirmed a significant and powerful impact of event quality on tourist satisfaction and loyalty. Based upon this argument, it could be hypothesized:
Hypothesis 3 (H3):
Event (cities-based entertainment) quality positively influences tourist satisfaction.
3.3. The Influence of Destination Image on Tourist Satisfaction
A review of research (e.g., [6,26,27,28]) has shown destination image is considered as a direct predicator of tourist satisfaction. This previous research often supports a positive relationship between destination image and tourist satisfaction. A study by Wang & Hsu [6] has developed an integrated model that confirms an association between destination image, tourist satisfaction, and behavioral intention. Another study showed a positive relationship between destination image and tourist satisfaction [29]. The study conducted by Chiu et al. [27] on Chinese tourists in Korea showed that destination image directly and positively influences their satisfaction and loyalty. Furthermore, the study [27] found that tourist emotional experiences affect destination image and this in turn impacts tourist satisfaction. A recent study conducted by Jeong & Kim [4] showed a significant positive impact of destination image on tourist satisfaction, and loyalty. Based on these statements, it could be argued that:
Hypothesis 4 (H4):
Destination image positively influences tourist satisfaction.
3.4. The Influence of Tourist Experience Quality on Tourist Satisfaction
Supportive evidence has emerged to confirm the positive relationship between tourists’ experience and their satisfaction [25]. According to Kotler et al. [30] destination image leads to quality experience, which in turn leads to satisfaction. It is well established in marketing literature that perceived quality determines customer satisfaction [31]. A study on sports events in Korea [4] showed that perceived value positively influences tourist satisfaction. On the same line, the study of Jeong & Kim [25] confirmed that tourist involvement with tours is the core of perceived value and increases tourist satisfaction. The same authors also argued that the experience quality of tourists is critical for their satisfaction a well as behavioral intention [4]. Based on these arguments, it could be hypothesized that:
Hypothesis 5 (H5):
Tourist experience quality positively influences tourist satisfaction.
3.5. The Mediating Roles of Destination Image and Quality of Tourist’s Experience in the Relationship between Quality Events (Cities-Based Entertainment) and Tourist Satisfaction
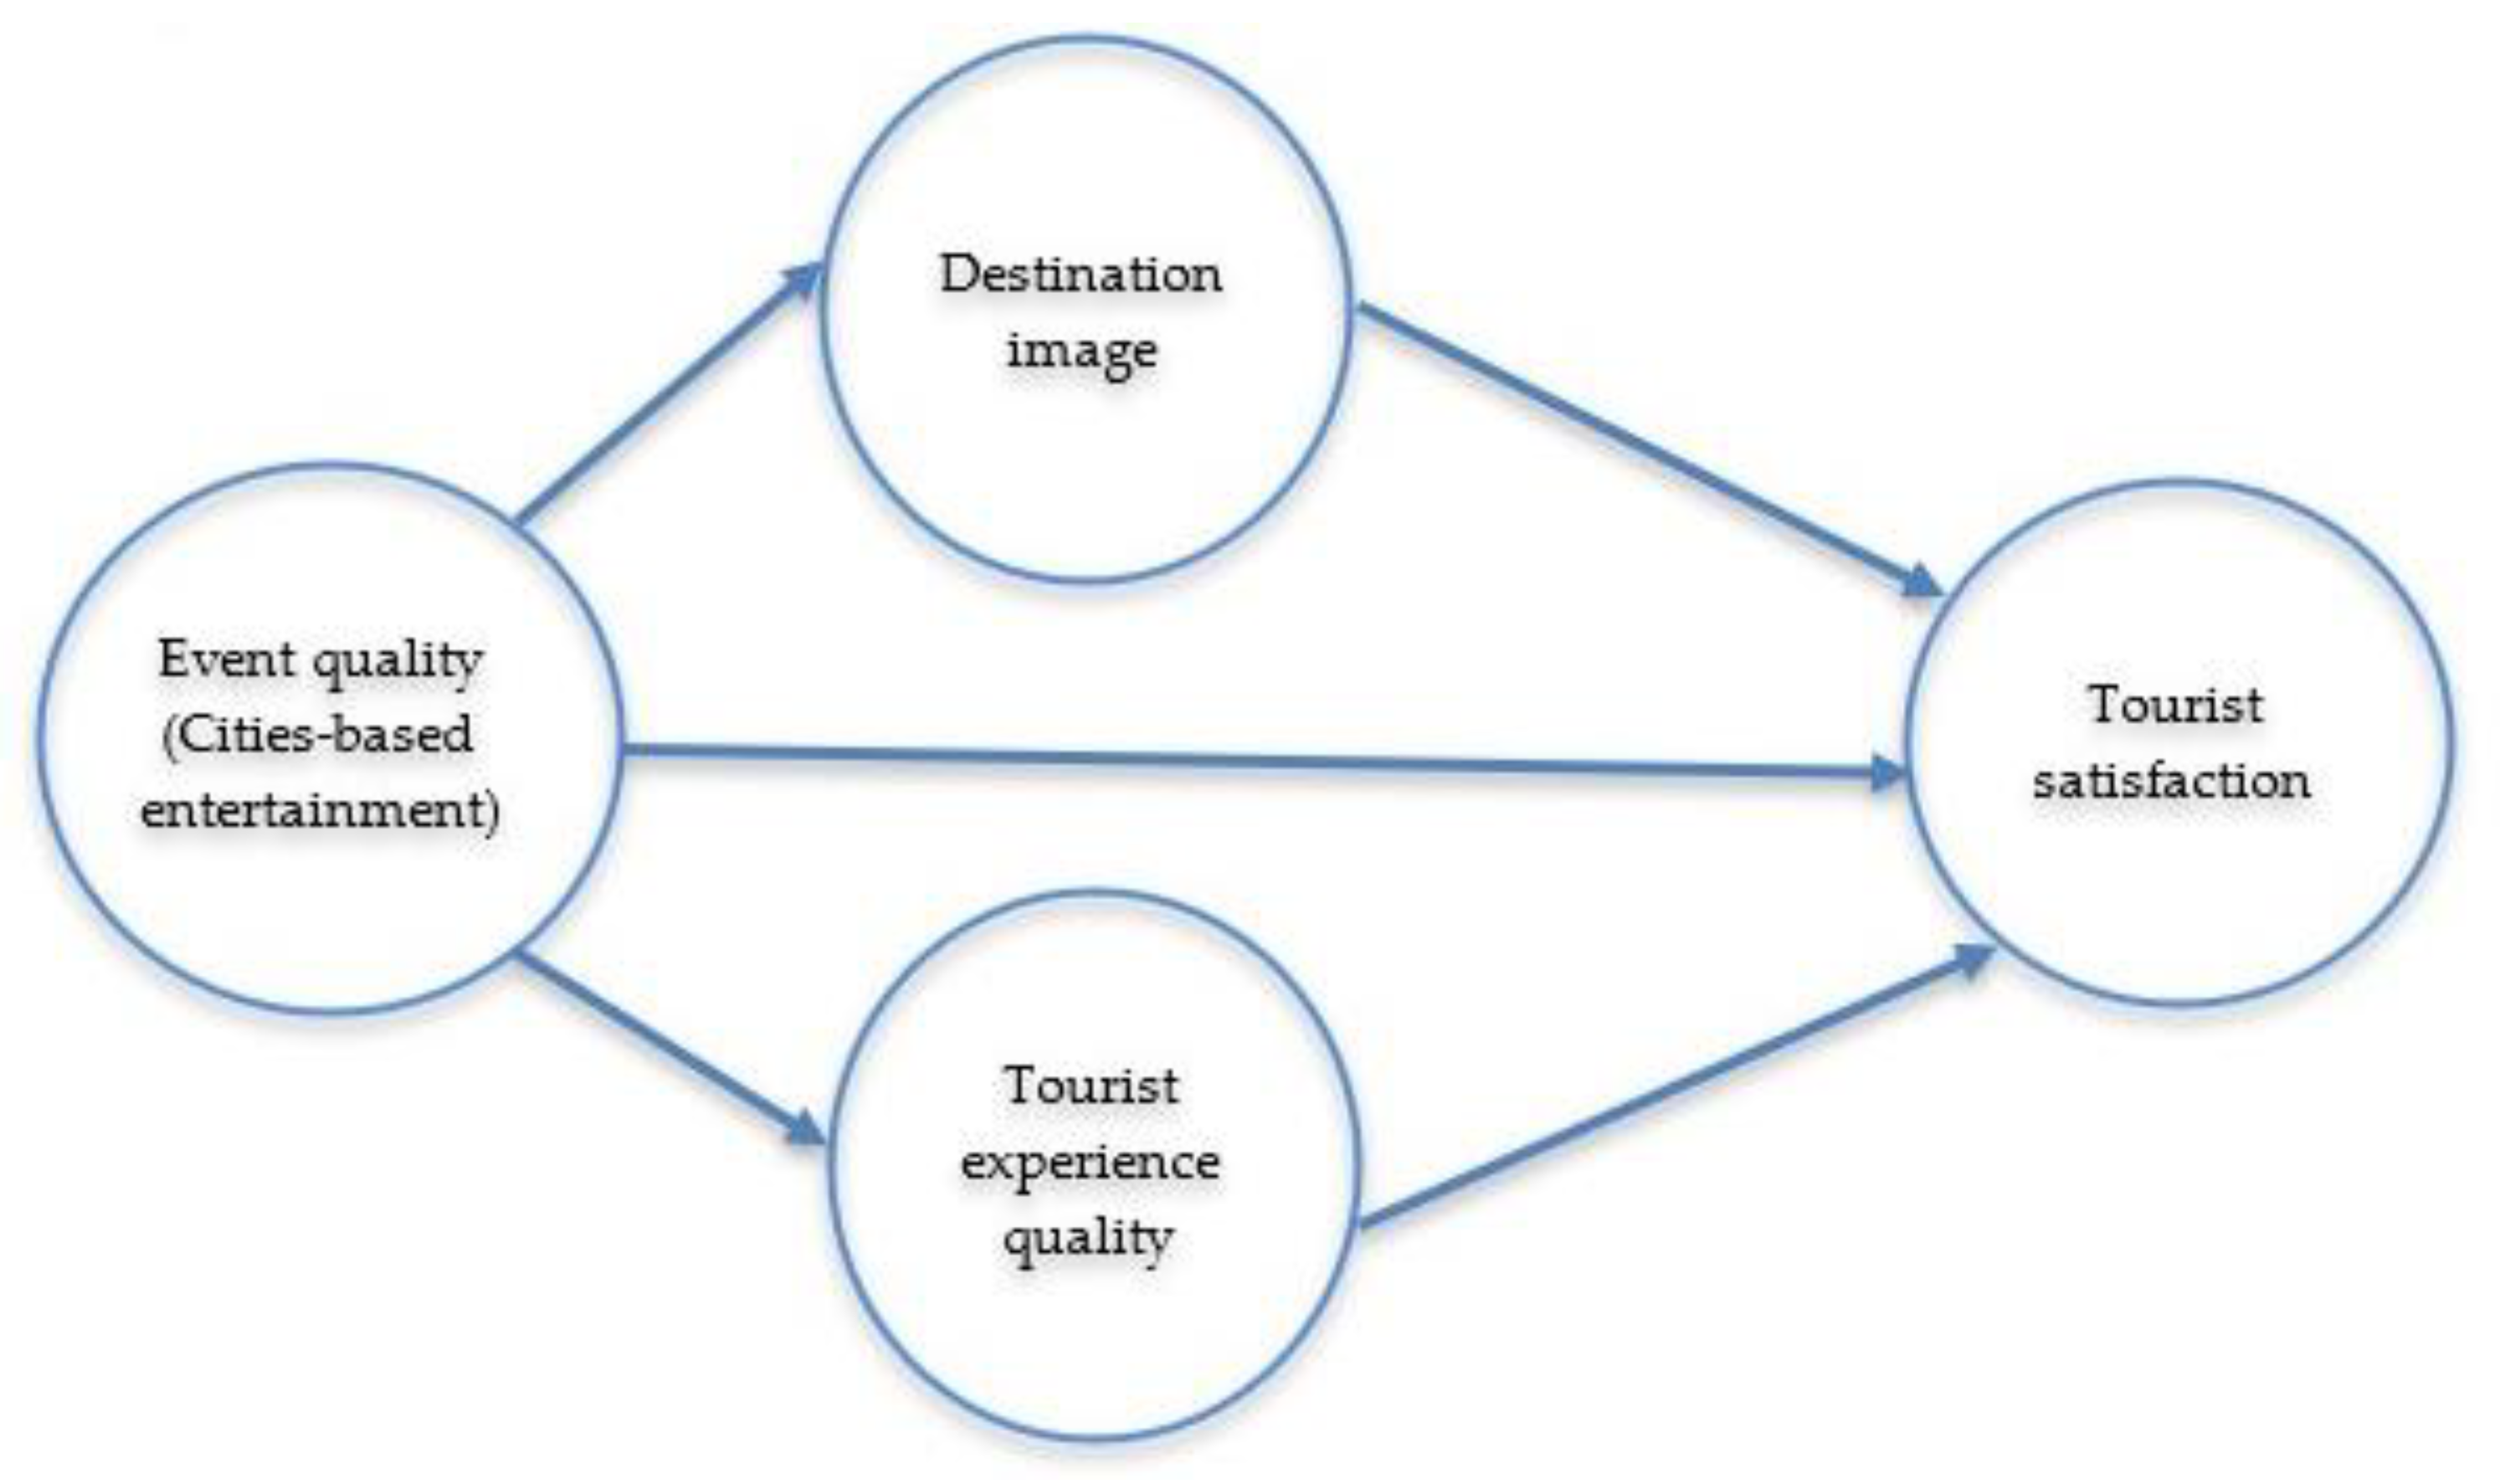
As previously discussed in Section 3.1, the relationship between event quality, destination image, and tourist satisfaction is well established (e.g., [4,20,21,22]). It was confirmed that event quality significantly influences destination image and in turn destination image influences tourist satisfaction, and loyalty. Despite this, the mediating effect of destination image between event quality and tourist satisfaction was not fully examined. There is evidence that destination images could play a mediating role in this relationship [4] as shown in Figure 1.
Research also confirmed that event quality influences perceived quality, experience and value on one side [4,8] and tourist experience quality influences tourist satisfaction and loyalty on the other side [8]. The proposed mediating effect of tourist experience quality in the relationship between event quality and tourist satisfaction could be explained by the sequential relationship in the marketing literature (e.g., [30,31]) that the provision of quality service leads to perceived quality experience by the customer and in turn to customer satisfaction. Based on these arguments, it could be hypothesized that
Hypothesis 6 (H6):
Destination image mediates the relationship between event quality and tourist satisfaction.
Hypothesis 7 (H7):
Tourist experience quality mediates the relationship between event quality and tourist satisfaction.
4. Methods
4.1. Measures and Instrument Development
The main data collection method in this study was a self-administered questionnaire, which was employed in a quantitative research methodology. All of the variables in this study were operationalized using a multi-dimensional scale derived from a thorough literature review to identify valid and frequently used measures. The standard seven-point Likert scale was used to measure all variables.
Event perceived quality was operationalized by employing the service performance (SERVPERF) scale as proposed by Cronin & Taylor [32] to examine the perceived quality of cities-based entertainment. The scale employed in this paper was a second order factor representing tangibility, reliability, responsiveness, assurance, and empathy. Similarly, tourist experience quality was measured by a second order factor scale derived from ref. [8]. The scale has four dimensions. The first dimension describes variables related to escapism (i.e., “escapism from everyday life, and problems”). The second dimension measures indicators related to relaxation (i.e., “physically comfortable and relaxed”). The third dimension focuses on variables related to enjoyment (i.e., “doing something memorable and having fun”). The fourth dimension describes items related to involvement (i.e., “involvement in the process and having some control over the outcome”). In the same way, destination image was operationalized by a second order factor scale derived from ref. [33]. The scale has two dimensions describing the affective and cognitive attributes of the destination. The affective dimension focus on items that describe visitors’ feelings or emotional responses toward destination, while the cognitive dimension has items representing visitors’ knowledge of and beliefs regarding the destination. Finally, tourist satisfaction was measured by three variables as suggested by Moon & Han [8] (see Table 1).
The questionnaire was structured to cover 5 main parts, the first part concerns enquires about the demographic characteristics of the event visitors, the second one covers tourist satisfaction items, the third part enquires about the destination image, the fourth section asks visitors about their experience quality, and the final section investigates event perceived quality. To validate the questionnaire, it was translated from its original English to tourist native Arabic language and then back translated by an English-Arabic specialist. Seven academics and eight professionals in event industry pre-tested the instrument. Everyone was asked to assess the content validity of the instrument items and provide any feedback. The observations of the respondents were then used to purify the instrument.
4.2. Sampling and Collecting Data
This paper was directed to visitors (internal tourists) of events in the Kingdom of Saudi Arabia (KSA). The research teams contacted the organizers of these events and asked them for their support to access participants of these events. The questionnaires were distributed and collected by the research team, which gave the opportunity to explain the purpose of the research and ensure a high response rate. A total of 600 self-administered questionnaires were dropped to tourists before being collected utilizing a simple random sample method [34]. A total of 555 tourists completed the questionnaires, with no missing data and 80 percent response rate.
To test if the mean scores of early-respondents and late-respondents were different, a T-test was employed. There were no statistically significant discrepancies in the data, suggesting that non-response bias was not an issue [35]. Tourists were kindly requested to complete the self-administrated questionnaire in all the predesigned six sections, therefore, common method variance (CMV) may be a potential problem in this study [36].
To deal with CMV, several approaches were used, as recommended by Podsakoff et al. [36]. Tourists were told that their responses would remain anonymous and discreet. Second, the instrument was designed in such a way that dependent questions came before independent questions [37]. Finally, Harman’s single factor technique was used to assess CMV, in SPSS version 26, all measurements were subjected to EFA, and the factors to extract were set to 1 using an unrotated factor solution. As a result, one component was found to account only for 31% of the variance. These tests, when taken together, suggest that CMV is not a concern.
There were 300 females (54%) and 255 males (46%) among the 555 valid responses. The majority (75%) were between the ages of 26 and 39, with a bachelor’s degree (70%). Most visitors (66%) were single, and more than half (55%) had previously attended an event in Saudi Arabia. Variable mean scores range from 5.63 to 5.85 on a scale of one to seven. The standard deviation (S.D.) scores range from 1.08 to 1.137 (see Table 1), indicating that the data is more widely distributed and less crowded around the mean value [38].
5. Data Analysis and Findings
Structural Equation Modeling (SEM) was employed as the main data analysis method in this study, using Amos v.21 graphics and Maximum Likelihood Estimation technique. Following Anderson & Gerbing [39] recommendations, a two-step approach was used. First-order confirmatory factor analysis (CFA) was used in the first phase to assess the measurement model’s reliability, convergent, and discriminant properties. In the second phase, the hypothesized structural model was evaluated. Several fit indices to determine the level of model fit to data were recorded [40,41], as indicated in Table 1.
5.1. Measurement Model
The purpose of employing CFA was to examine the validity and reliability of the latent unobserved dimensions. The CFA model’s output reveals an excellent model fit, as seen in Table 1: χ2 < 0.001, normed χ2 = 2.997, RMSEA = 0.026, SRMR = 0.024, CFI = 0.966, TLI = 0.969, NFI = 0.967, PCFI = 0.785, and PNFI = 0.776 (see Table 1). The Cronbach’s alpha (α) values and composite reliability (CR) scores for all latent unobserved variables (as shown in Table 1) are acceptable and exceed the recommended threshold of 0.80 [40], indicating strong internal reliability. The loadings of the standardized factor regression weights ranged from 0.910 to 0.984, exceeding the preferred score of 0.7 with t-values greater than 29.918 [42]. These findings show that the variables that were theoretically constructed to operationalize the research dimensions have a positive and substantial association. As a result, convergent validity was obtained. The Average Variance Extracted (AVE) values for all dimensions were above the acceptable 0.50 value [43], further confirming the study constructs’ convergent validity. The Maximum Shared Variance (MSV) values did not exceed the corresponding AVE values, indicating that the study constructs are clearly distinct [40]. Therefore, discriminant validity was achieved (see Table 1).
5.2. Structural Model Results
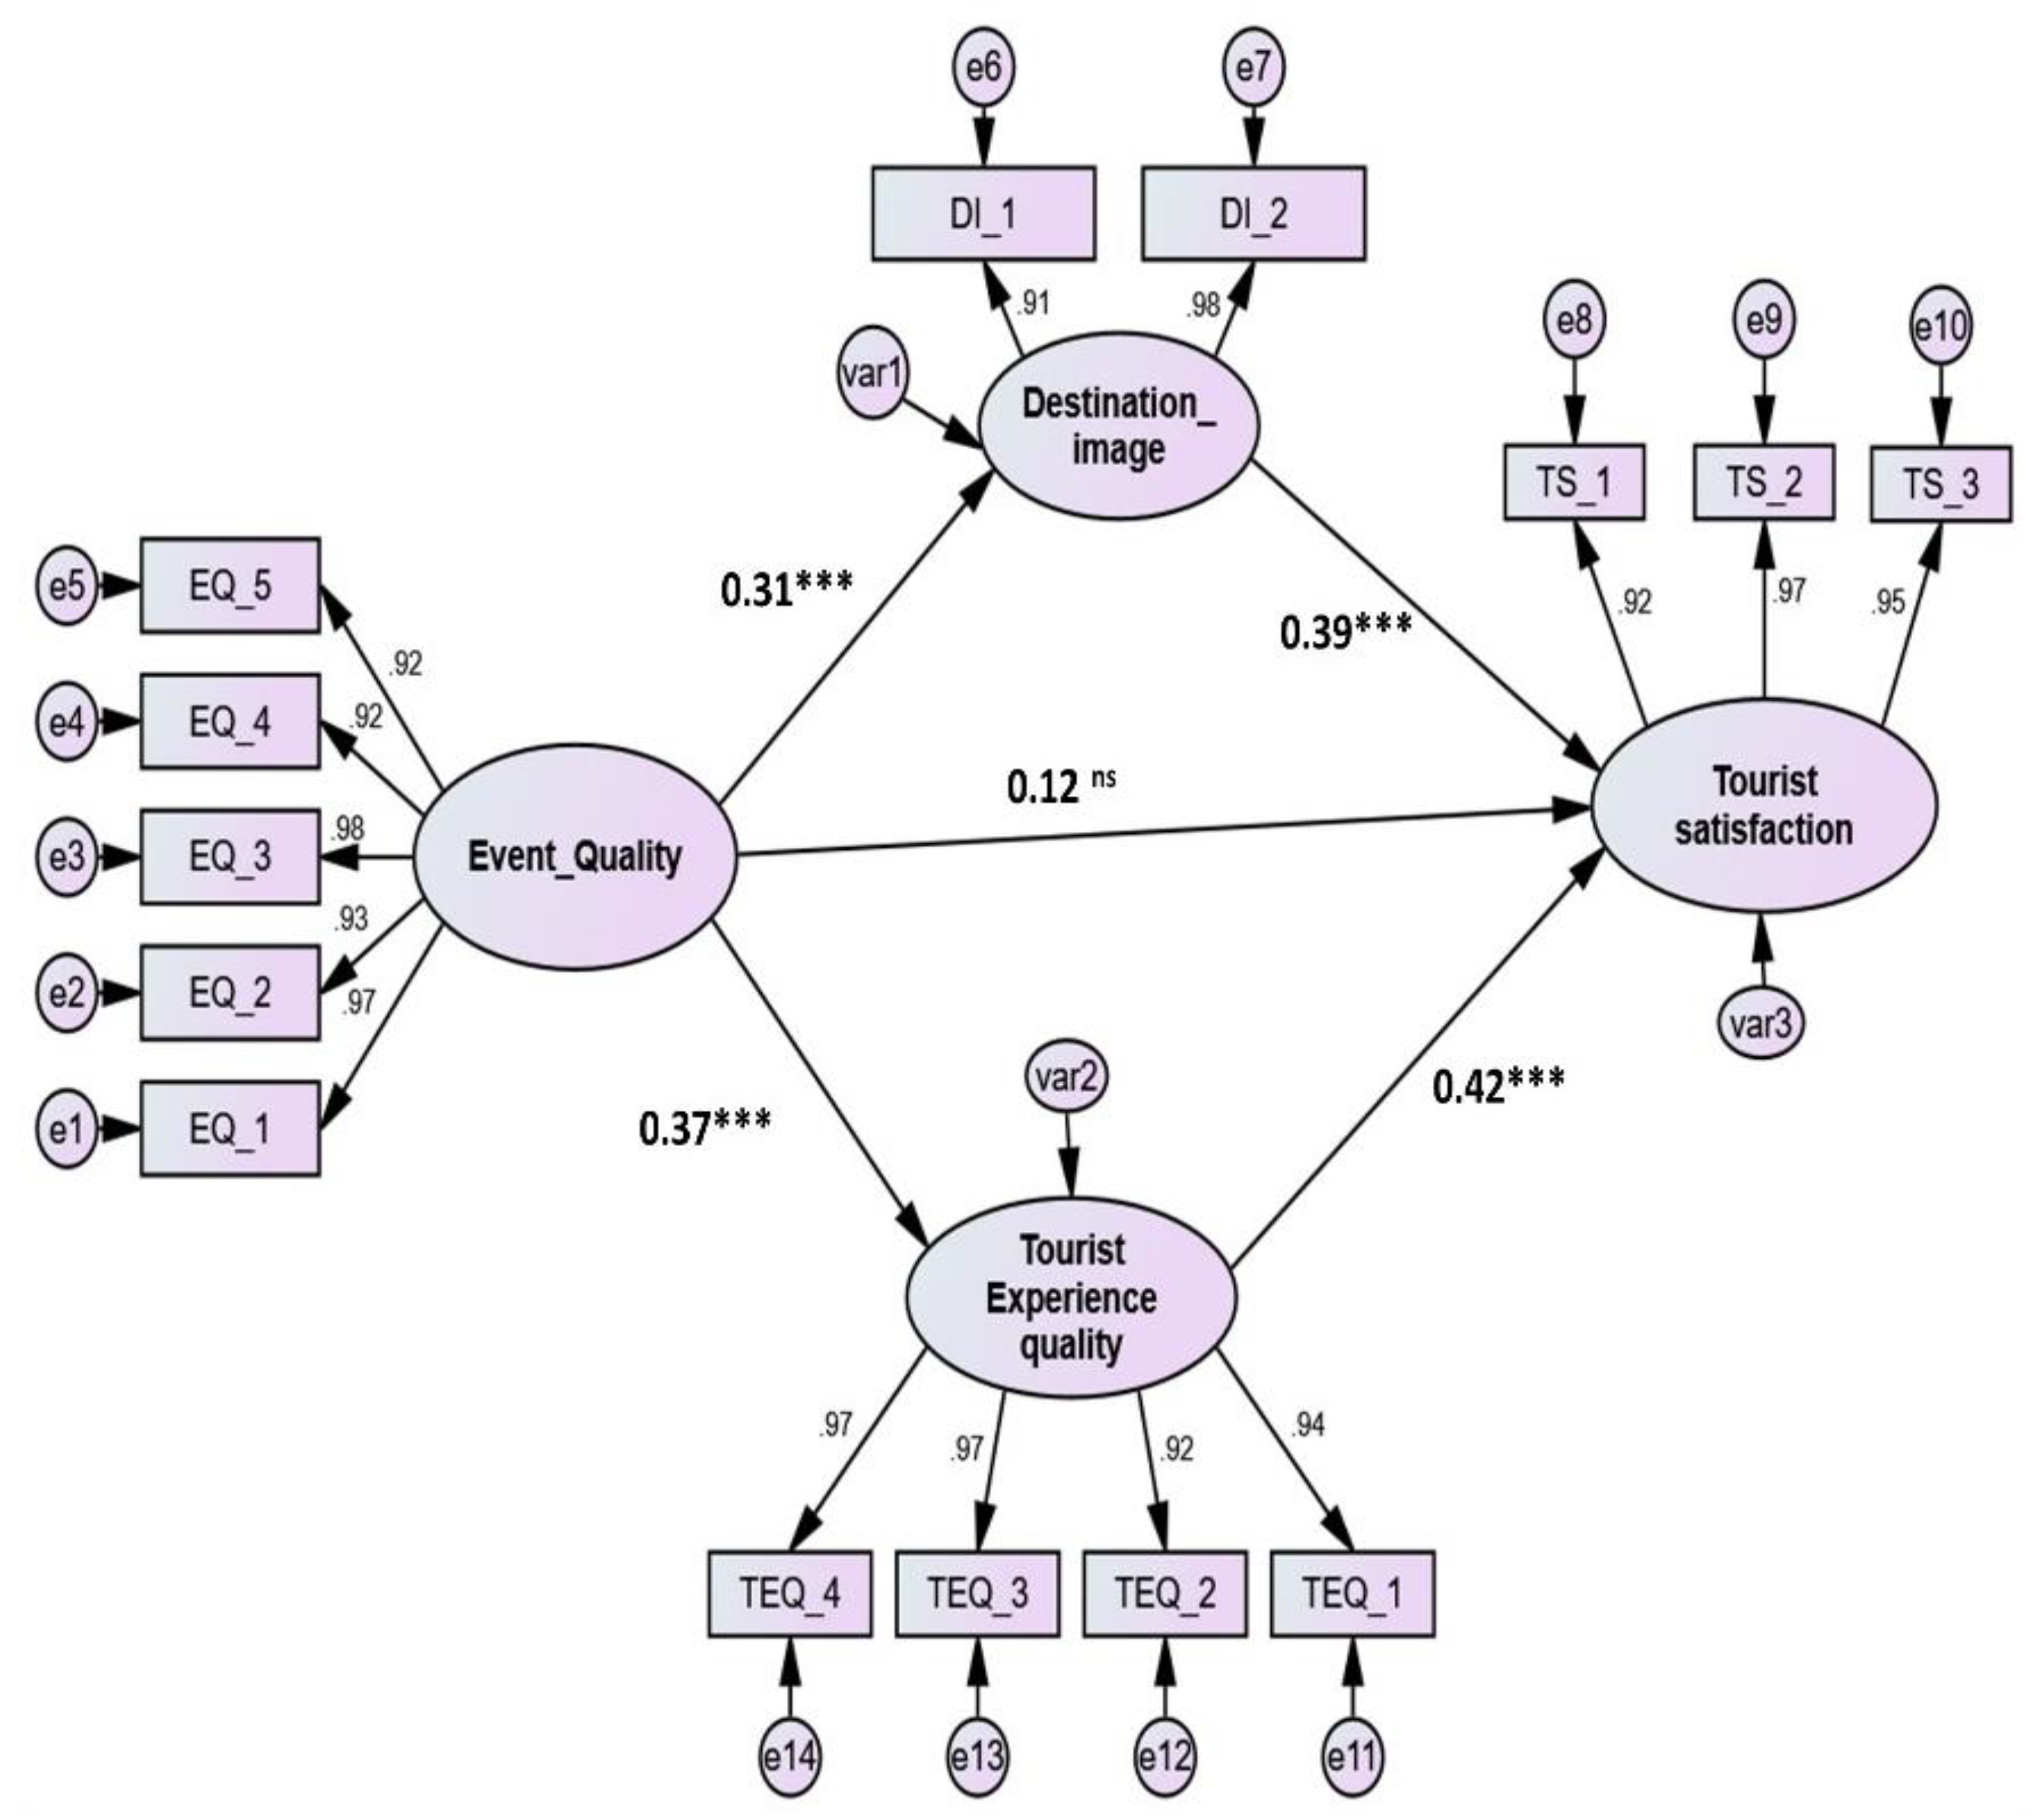
The proposed structural model in Figure 2 was then analyzed in the second phase (after running CFA) using SEM and Amos v.21 graphics to determine the direction and type of the interactions between the study hypotheses. Overall, the Goodness-of-Fit (GoF) indices suggested that the hypothesized model well-fit the data: χ2 (72, N = 555) = 285.480, p < 0.001, normed χ2 = 3.965, RMSEA = 0.049, SRMR = 0.045, CFI = 0.958, TLI = 0.959, NFI = 0.957, PCFI = 0.855 and PNFI = 0.856. (see Table 2). Furthermore, the structural model showed a strong correlation of exogenous variables (event quality, destination image, and tourist experience quality) and the endogenous variables (tourist satisfaction), the squared multiple correlations (SMCs) value being 0.35.
Table 2 and Figure 2 show the direct influences of perceived event quality on destination image, tourist experience quality, and tourist satisfaction, and the indirect impacts of event quality on tourist satisfaction through the mediating role of destination image and tourist experience quality. The standardized regression weights of the SEM results show that event quality positively and significantly impacts destination image (β = 0.31, t-value = 7.455, p < 0.001), tourist experience quality (β = 0.37, t-value = 8.411, p < 0.001), thus supporting hypotheses H1 and H2, however the finding reveals that event quality failed to significantly impact tourist satisfaction (β = 0.12, t-value = 1.767, p = 0.061), thus hypothesis H3 was not supported. Additionally, the results shows that destination image positively and significantly (β = 0.39, t-value = 10.123, p < 0.001), impacts tourist satisfaction and tourist experience quality has a positive and significant impact (β = 0.41, t-value = 11.432, p < 0.001), on tourist satisfaction, thus, supporting hypotheses H4, and H5.
The results also showed that destination image and tourist experience quality fully mediated the impact of event quality on tourist satisfaction, as the direct path was insignificant while the indirect paths were positive and significant as argued by Zhao et al. [44], thus hypotheses H6, and H7 were supported.
6. Discussion
The study tested a conceptual model on the relationship between event (cities-based entertainment) quality, destination image, quality of tourist experience, and tourist satisfaction. Cities-based entertainments are mega events undertaken by the KSA government as a new niche of tourism to encourage inbound tourism and reduce outbound tourism as a part of the Saudi Vision 2030. The study examined the direct impact of cities-based entertainment quality on destination image, quality of tourist experience, and ultimately on tourist satisfaction. The results supported the first two hypotheses that event “cities-based entertainment” quality positively and significantly influences destination image and tourist experience quality. Additionally, the results supported another two hypotheses (four and five) that the positive and significant influence of both tourist experience quality and destination image was confirmed on tourist satisfaction. These results coincide with previous studies (e.g., [4,20,21,25]), which confirmed a positive link of event quality, tourist experience, destination image, and customer satisfaction. However, the results failed to show a direct influence of event quality on tourist satisfaction which contradicts the work of Jeong & Kim. [4]. Hence, the influence of cities-based entertainment on tourist satisfaction is fully mediated by destination image and quality of tourist experience. This finding highlights the crucial role of destination image and quality of tourist experience in the event (cities-based entertainment) quality-tourist satisfaction model. These results have several implications for scholars and industry practitioners, as is discussed in the following two sections.
6.1. Theoretical Implications
The study adds to existing literature examining the relationship between event quality, tourist satisfaction, destination image, and quality of experience. This research showed that cities-based entertainment quality is composed of five latent dimensions: tangibility, reliability, responsiveness, assurance, and empathy. These dimensions are crucial for understanding and achieving event quality. Unlike previous research, a fundamental contribution made by this study is manifested in its ability to fractionate the entertainment elements that affect tourist satisfaction into specific attributes. Research (e.g., [45]) often studies the overall satisfaction of tourists without identifying the direct predicators and mediating variables that could lead to this. The present study, however, identified destination image and quality of experience as two prominent mediating factors in the event quality-tourist satisfaction link. This research showed that tourist satisfaction is an outcome of destination image and quality of tourist experience; hence, paying sufficient attention to these variables is crucial for ensuring proper satisfaction. Another implication of this study pertains to its adoption of emic research style in approaching the perspectives of tourists. This style provided us with a vital opportunity to delve into the origin of the tourist’s perspective and where it is coined from, as it is able to understand the functionality of internal elements related to investigated people from a common culture, as is the case of this study’s sample, taking into account the fact that they are all residents of Saudi Arabia. Although the use of the emic style is not prevalent enough in entertainment and tourism studies, few studies (like [46,47,48]) have been advocates of such use with an obvious focus on the Chinese context. From a theoretical standpoint, this study also capitalizes on the differentiation between country image and destination image of developing countries made by previous studies (like [49,50]) to attach the tourist’s experience in developing countries more to the destination rather than the country. This enables a developing country to have positive views on its specific destinations when it comes to the quality of the tourists’ experience regardless of what experience these tourists might possess on the entire country itself.
6.2. Practical Implications
The findings of the current study provide destination marketing organizations (DMOs), especially in countries with new tourism experience such as KSA, with three strategic insights on how to reinforce their offerings and how to convey a tourist’s experience into an affection-based experience. In the context of Saudi Arabia, these DMOs can be identified as Ministry of Tourism, General Entertainment Authority, and the development authorities of cities, like the Sharqia Development Authority, the Royal Commission for Riyadh City, and the Royal Commission for AlUla. A first insight is that cities in Saudi Arabia need to distinguish themselves not only from each other, but it is more imperative to make such distinguishment against their country though personal competency. Although adopting personal competency for differentiation purposes has been suggested by Prentice [51], the adoption was limited to the city-level. This means that DMOs should intensify their endeavors to attach their city’s image and tourist experience to specific personal competencies. Another important implication for DMOs is that they are urged to explore new approaches with the aim of equipping their potential tourists with complete knowledge about their destinations and their related events [52]. The DMOs used to concentrate their generation capability of knowledge on destinations. However, a healthier balance is needed to concentrate this capability on destinations in addition to events attached to these destinations. This will increase the amount of content created on these events and will ultimately impact their quality even prior to experiencing them in the actual circumstances. To do so, innovative educational methods have to be adopted by DMOs, specifically in digital forms in order to create the desired impact, especially among the young generation of tourists. Third, DMOs are encouraged to rely on a market-oriented approach that facilitates the segmentation of destinations into different distinct segments with the sake of initiating impactful marketing strategies for each target segment [53]. This seems to be pivotal as it can fractionate the events associated with these destinations into smaller but more prominent categories with the likes of science-based events, sports events, culture and arts events, family events, and so on. Eventually, this may lead to better distinguishment of events, so that their quality can be enhanced, which will then influence the tourist’s satisfaction in many aspects.
As discussed in theoretical implications, cities-based entertainment quality is composed of five latent dimensions: tangibility, reliability, responsiveness, assurance, and empathy as undertaken in this research. Accordingly, DMOs need to consider these dimensions to ensure the appropriate event quality. The current study confirmed the mediating roles of destination image and tourist quality experience in the event quality-tourist link. Accordingly, event organizations should pay more attention to creating proper destination image and quality experience for their tourists.
7. Limitations and Future Research
This research paper has some limitations. First, the research targeted visitors (internal tourists) of events in the Kingdom of Saudi Arabia (KSA). Future research can investigate other types of visitors (external tourists) to assess the research hypotheses. Second, socio-demographic attributes of visitors could be further examined to detect the variations based on gender, age, and education. Third, the cross-sectional sample technique employed in this paper is a further limitation. In any research paper in which causality is inferred, the longitudinal research method reinforces deeper inferences [54]. Finally, this paper tested only two mediations (destination image, and quality of tourist experience) on the relation between event quality and tourist satisfaction. In future studies, some mediations such as staying cost, tourist attractions, accessibility, and infrastructure can be further tested and compared with the results of the current study.
Author Contributions
Conceptualization, M.M.A., A.E.E.S. and I.A.E.; data curation, A.E.E.S. and I.A.E.; formal analysis, I.A.E.; funding acquisition, M.M.A.; investigation, A.E.E.S.; methodology, M.M.A., A.E.E.S. and I.A.E.; project administration, A.E.E.S.; resources, M.M.A. and I.A.E.; software, I.A.E.; supervision, A.E.E.S.; validation, M.M.A., A.E.E.S. and I.A.E.; visualization, M.M.A., A.E.E.S. and I.A.E.; writing—original draft preparation, M.M.A., A.E.E.S. and I.A.E.; writing—review and editing, M.M.A., A.E.E.S. and I.A.E. All authors have read and agreed to the published version of the manuscript.
Funding
The authors acknowledge the Deanship of Scientific Research at King Faisal University for the financial support under Nasher Track (Grant No. 2060008).
Institutional Review Board Statement
Not applicable.
Informed Consent Statement
Not applicable.
Data Availability Statement
Data available on request due to privacy/ethical restrictions.
Conflicts of Interest
The authors declare no conflict of interest.
References
- Saudi Vision 2030. Vision Realization Programs. Available online: https://www.vision2030.gov.sa/v2030/vrps/ (accessed on 27 June 2021).
- Sadi, M.A.; Henderson, J.C. Tourism in Saudi Arabia and Its Future Development. 2005. Available online: https://qspace.qu.edu.qa/bitstream/handle/10576/8105/120511-0005-fulltext.pdf?sequence=8&isAllowed=y (accessed on 27 June 2021).
- Qu, H.; Kim, L.H.; Im, H.H. A model of destination branding: Integrating the concepts of the branding and destination image. Tour. Manag. 2011, 32, 465–476. [Google Scholar] [CrossRef]
- Jeong, Y.; Kim, S. A study of event quality, destination image, perceived value, tourist satisfaction, and destination loyalty among sport tourists. Asia Pac. J. Mark. Logist. 2020, 32, 940–960. [Google Scholar] [CrossRef]
- Carballo, M.M.; Arana, J.E.; Leon, C.J.; Moreno-Gil, S. Economic valuation of tourism destination image. Tour. Econ. 2015, 21, 741–759. [Google Scholar] [CrossRef]
- Wang, C.Y.; Hsu, M.K. The relationships of destination image, satisfaction, and behavioral intentions: An integrated model. J. Travel Tour. Mark. 2020, 27, 829–843. [Google Scholar] [CrossRef]
- Beerli, A.; Martin, J.D. Tourists’ characteristics and the perceived image of tourist destinations: A quantitative analysis—A case study of Lanzarote, Spain. Tour. Manag. 2004, 25, 623–636. [Google Scholar] [CrossRef]
- Moon, H.; Han, H. Tourist experience quality and loyalty to an island destination: The moderating impact of destination image. J. Travel Tour. Mark. 2019, 36, 43–59. [Google Scholar] [CrossRef]
- Chi, C.G.Q.; Qu, H. Examining the structural relationships of destination image, tourist satisfaction and destination loyalty: An integrated approach. Tour. Manag. 2008, 29, 624–636. [Google Scholar] [CrossRef]
- WTTC: World Travel and Tourism Council, Global Economic Impact and Trends 2019. Available online: https://www.wttc.org/economic-impact/country-analysis/ (accessed on 1 June 2021).
- General Entertainment Authority. GEA’s Entertainment Portal Augments the Entertainment Investment Roadmap in Saudi Arabia. 2021. Available online: https://www.gea.gov.sa/en/news/entertainment-portal (accessed on 1 June 2021).
- Kim, T.H.; Ko, Y.J.; Park, C.M. The influence of event quality on revisit intention: Gender difference and segmentation strategy. Manag. Serv. Qual. 2013, 23, 205–224. [Google Scholar] [CrossRef]
- Ko, Y.J.; Kim, Y.K.; Kim, M.K.; Lee, J.H. The role of involvement and identification on event quality perceptions and satisfaction: A case of US Taekwondo Open. Asia Pac. J. Mark. Logist. 2010, 22, 25–39. [Google Scholar]
- Royo-Vela, M. Rural-cultural excursion conceptualization: A local tourism marketing management model based on tourist destination image measurement. Tour. Manag. 2009, 30, 419–428. [Google Scholar] [CrossRef]
- Martin, H.S.; Bosque, I.R. Exploring the cognitive–affective nature of destination image and the role of psychological factors in its formation. Tour. Manag. 2008, 29, 263–277. [Google Scholar] [CrossRef]
- Smith, W.W.; Li, X.R.; Pan, B.; Witte, M.; Doherty, S.T. Tracking destination image across the trip experience with smartphone technology. Tour. Manag. 2015, 48, 113–122. [Google Scholar] [CrossRef]
- Zhang, H.; Fu, X.; Cai, L.A.; Lu, L. Destination image and tourist loyalty: A meta-analysis. Tour. Manag. 2014, 40, 213–223. [Google Scholar] [CrossRef]
- Frías, D.M.; Rodriguez, M.A.; Castaneda, J.A. Internet vs. travel agencies on pre-visit destination image formation: An information processing view. Tour. Manag. 2008, 29, 163–179. [Google Scholar] [CrossRef]
- Lemke, F.; Clark, M.; Wilson, H. Customer experience quality: An exploration in business and consumer contexts using repertory grid technique. J. Acad. Mark. Sci. 2011, 39, 846–869. [Google Scholar] [CrossRef] [Green Version]
- Moon, K.S.; Ko, Y.J.; Connaughton, D.P.; Lee, J.H. A mediating role of destination image in the relationship between event quality, perceived value, and behavioral intention. J. Sport Tour. 2013, 18, 49–66. [Google Scholar] [CrossRef]
- Moon, S.K.; Kim, M.; Ko, J.Y.; Connaughton, D.P.; Lee, H.J. The influence of consumer’s event quality perception on destination image. Manag. Serv. Qual. 2011, 21, 287–303. [Google Scholar] [CrossRef]
- Tosun, C.; Dedeoğlu, B.B.; Fyall, A. Destination service quality, affective image and revisit intention: The moderating role of past experience. J. Dest. Mark. Manage. 2015, 4, 222–234. [Google Scholar] [CrossRef]
- Oliver, R.L. A cognitive model of the antecedents and consequences of satisfaction decisions. J. Mark. Res. 1980, 17, 46–49. [Google Scholar] [CrossRef]
- Zeithaml, V.A.; Parasuraman, A.; Berry, L.L. Problems and strategies in services marketing. J. Mark. 1985, 49, 33–47. [Google Scholar] [CrossRef]
- Jeong, Y.; Kim, S. Exploring a suitable model of destination image: The case of a small-scale recurring sporting event. Asia Pac. J. Mark. Logist. 2019, 31, 1287–1307. [Google Scholar] [CrossRef]
- Assaker, G.; Vinzi, V.E.; O’Connor, P. Examining the effect of novelty seeking, satisfaction, and destination image on tourists’ return pattern: A two factor, non-linear latent growth model. Tour. Manag. 2011, 32, 890–901. [Google Scholar] [CrossRef]
- Chiu, W.; Zeng, S.; Cheng, P.S.T. The influence of destination image and tourist satisfaction on tourist loyalty: A case study of Chinese tourists in Korea. Int. J. Cult. Tour. Hosp. Res. 2016, 10, 223–234. [Google Scholar] [CrossRef]
- Prayag, G.; Hosany, S.; Muskat, B.; Del Chiappa, G. Understanding the relationships between tourists’ emotional experiences, perceived overall image, satisfaction, and intention to recommend. J. Travel Res. 2017, 56, 41–54. [Google Scholar] [CrossRef] [Green Version]
- Prayag, G.; Ryan, C. Antecedents of tourists’ loyalty to mauritius: The role and influence of destination image, place attachment, personal involvement, and satisfaction. J. Travel Res. 2012, 51, 342–356. [Google Scholar] [CrossRef]
- Kotler, P.; Bowen, J.; Makens, J. Marketing for Hospitality and Tourism; Prentice-Hall: Hoboken, NJ, USA, 1996. [Google Scholar]
- Kozak, M.; Rimmington, M. Tourist Satisfaction with Mallorca, Spain, as an Off-Season Holiday Destination. J. Travel Res. 2000, 38, 260–269. [Google Scholar] [CrossRef]
- Cronin, J.J.; Taylor, S.A. SERVPERF versus SERVQUAL. Reconciling performance-based and perceptions-minus-expectations measurement of service quality. J. Mark. 1994, 58, 125–131. [Google Scholar] [CrossRef]
- Huete-Alcocer, N.; López-Ruiz, V.R.; Grigorescu, A. Measurement of satisfaction in sustainable tourism: A cultural heritage site in Spain. Sustainability 2019, 11, 6774. [Google Scholar] [CrossRef] [Green Version]
- Ibeh, K.; Brock, J.K.U.; Zhou, Y.J. The drop and collect survey among industrial populations: Theory and empirical evidence. Ind. Mark. Manag. 2004, 33, 155–165. [Google Scholar] [CrossRef]
- Armstrong, J.S.; Overton, T.S. Estimating nonresponse bias in mail surveys. J. Mark. Res. 1977, 14, 396–402. [Google Scholar] [CrossRef] [Green Version]
- Podsakoff, P.M.; MacKenzie, S.B.; Podsakoff, N.P. Sources of method bias in social science research and recommendations on how to control it. Annu. Rev. Psychol. 2012, 63, 539–569. [Google Scholar] [CrossRef] [Green Version]
- Salancik, G.R.; Pfeffer, J. An Examination of Need-Satisfaction Models of Job Attitudes. Adm. Sci. Q. 1977, 22, 427. [Google Scholar] [CrossRef]
- Bryman, A.; Cramer, D. Quantitative Data Analysis with IBM SPSS 17, 18 & 19: A Guide for Social Scientists; Routledge: Oxfordshire, UK, 2012. [Google Scholar]
- Anderson, J.C.; Gerbing, D.W. Structural equation modeling in practice: A review and recommended two-step approach. Psychol. Bull. 1988, 103, 411. [Google Scholar] [CrossRef]
- Hair, J.F.; Ringle, C.M.; Sarstedt, M. Partial least squares structural equation modeling: Rigorous applications, better results and higher acceptance. Long Range Plan. 2013, 46, 1–12. [Google Scholar] [CrossRef]
- Kline, R.B. Convergence of Structural Equation Modeling and Multilevel Modeling; SAGE Publications: Thousand Oaks, CA, USA, 2011. [Google Scholar]
- Johnson, K.W. Structural equation modeling in practice: Testing a theory for research use. J. Soc. Serv. Res. 2018, 24, 131–171. [Google Scholar] [CrossRef]
- Fornell, C.; Larcker, D.F. Structural equation models with unobservable variables and measurement error: Algebra and statistics. J. Mark. Res. 1981, 18, 1–22. [Google Scholar] [CrossRef]
- Zhao, X.; Lynch, J.G., Jr.; Chen, Q. Reconsidering Baron and Kenny: Myths and truths about mediation analysis. J. Consum. Res. 2010, 37, 197–206. [Google Scholar] [CrossRef]
- Baiomy, A.E.; Jones, E.; Goode, M.M. The influence of menu design, menu item descriptions and menu variety on customer satisfaction. A case study of Egypt. Tour. Hosp. Res. 2019, 19, 213–224. [Google Scholar] [CrossRef]
- Zhang, G.; Pine, R.; Zhang, H.Q. China’s international tourism development: Present and future. Int. J. Contemp. Hosp. Manag. 2000, 12, 282–290. [Google Scholar] [CrossRef]
- Song, H.; Cheung, C. What makes theatrical performances successful in China’s tourism industry? J. China Tour. Res. 2012, 8, 159–173. [Google Scholar] [CrossRef]
- Pearce, P.; Wu, M. Entertaining International Tourists: An Empirical Study of an Iconic Site in China. J. Hosp. Tour. Res. 2018, 42, 772–792. [Google Scholar] [CrossRef]
- Campo, S.; Alvarez, M.D. Can tourism promotions influence a country’s negative image? An experimental study on Israel’s image. Curr. Issues Tour. 2014, 17, 201–219. [Google Scholar] [CrossRef]
- Heslop, L.A.; Nadeau, J.; O’Reilly, N. China and the olympics: Views of insiders and outsiders. Int. Mark. Rev. 2010, 27, 404–433. [Google Scholar] [CrossRef]
- Prentice, C. Leveraging employee emotional intelligence in casino profitability. J. Retail. Consum. Serv. 2016, 33, 127–134. [Google Scholar] [CrossRef]
- Hahm, J.; Tasci, A. Country image and destination image of Brazil in relation to information sources. J. Hosp. Tour. Manag. 2019, 3, 95–114. [Google Scholar]
- Line, N.D.; Wang, Y. Market-oriented destination marketing: An operationalization. J. Travel Res. 2017, 56, 122–135. [Google Scholar] [CrossRef]
- Morgan, R.M.; Hunt, S.D. The commitment-trust theory of relationship marketing. J. Mark. 1994, 58, 20–38. [Google Scholar] [CrossRef]
Figure 1.
The research conceptual model.

Figure 2.
The structural model.


Table 1.
Loadings, t-values, M, S.D, and Factor properties.
| Factors and Items | Loading | t-Value | M 1 | S.D. 2 | Properties |
|---|---|---|---|---|---|
| Event (cities-based entertainment) quality [32], (a = 0.978) | CR 3 = 0.977; AVE 4 = 0.894; MSV 5 = 0.454 | ||||
| EQ_1: Tangibility “refers to physical facilities, equipment, personnel, and communication materials” | 0.969 | F | 5.73 | 1.186 | |
| EQ_2: Reliability: “refers to the dependability and accuracy of the service provider” | 0.934 | 50.628 | 5.63 | 1.379 | |
| EQ_3: Responsiveness “refers to the ability to know and willingness to respond to visitors’ needs” | 0.979 | 69.654 | 5.70 | 1.220 | |
| EQ_4: Assurance “refers to the ability of employees to instill confidence and trust in the event” | 0.923 | 47.584 | 5.63 | 1.281 | |
| EQ_5: Empathy “refers to the ability of the employees in providing a caring service to visitors” | 0.925 | 48.020 | 5.65 | 1.213 | |
| Tourist (visitor) experience quality [8], (a = 0.972) | CR = 0.972; AVE = 0.897; MSV = 0.843 | ||||
| TEQ_1: Escapism: “represents escapism from everyday life, and problems” | 0.942 | F | 5.81 | 1.080 | |
| TEQ_2: Relaxation “represents physically comfortable and relaxed” | 0.922 | 42.035 | 5.75 | 1.143 | |
| TEQ_3: Enjoyment “represents doing something memorable and having fun” | 0.967 | 51.939 | 5.85 | 1.118 | |
| TEQ_4: Involvement “represents being involved in the process and having some control over the outcome” | 0.966 | 51.752 | 5.85 | 1.133 | |
| Destination image [33], (a = 0.944) | CR = 0.946; AVE = 0.898; MSV = 0.581 | ||||
| DI_1: Affective “refers to visitors’ feelings or emotional responses toward destination” | 0.910 | F | 5.67 | 1.234 | |
| DI_2: Cognitive “represents visitors’ knowledge of and beliefs regarding the destination” | 0.984 | 29.918 | 5.83 | 1.170 | |
| Tourist satisfaction [8], (a = 0.964) | CR = 0.965; AVE = 0.903; MSV = 0.843 | ||||
| TS_1: “My overall evaluation of this destination is positive.” | 0.917 | F | 5.77 | 1.241 | |
| TS_2: “My overall assessment of this tour experience is favorable.” | 0.974 | 46.324 | 5.77 | 1.170 | |
| TS_3: “I am satisfied with this tourism experience.” | 0.952 | 42.661 | 5.77 | 1.169 | |
1 = Mean (M), 2 = standard deviation (S.D.), 3 = composite reliability (CR), 4 = Average Variance Extracted (AVE), 5 = common method variance (CMV). Model fit: (χ2 (71, N = 555) = 212.787, p < 0.001, normed χ2 = 2.997, RMSEA = 0.0267, SRMR = 0.0245, CFI = 0.966, TLI = 0.969, NFI = 0.967, PCFI = 0.785 and PNFI = 0.776).
Table 2.
Result of the structural model.
| Hypotheses | Beta (β) | C-R (t-Value) | SMC | Hypotheses Results | |
|---|---|---|---|---|---|
| H1 | Event (cities-based entertainment) quality ⟶ Destination image | 0.31 *** | 7.455 | - | Supported |
| H2 | Event (cities-based entertainment) quality ⟶ Tourist experience quality | 0.37 *** | 8.411 | - | Supported |
| H3 | Event (cities-based entertainment) quality ⟶ Tourist satisfaction | 0.12 ** | 1.767 | - | Not Supported |
| H4 | Destination image ⟶ Tourist satisfaction | 0.39 *** | 10.123 | - | Supported |
| H5 | Tourist experience quality ⟶ Tourist satisfaction | 0.41 *** | 11.432 | - | Supported |
| H6 | Event quality ⟶ Destination image ⟶ Tourist satisfaction | Path 1 β = 0.31 *** Path 2: β = 0.39 *** | Path 1 t-value = 7.455 Path 2: t-value = 10.123 | - | Supported |
| H7 | Event quality ⟶ Tourist experience quality ⟶Tourist satisfaction | Path 1 β = 0.37 *** Path 2: β = 0.41 *** | Path 1 t-value = 8.411 Path 2: t-value = 11.423 | - | Supported |
| Tourist satisfaction | - | - | 0.35 | - | |
Model fit: (χ2 (72, N = 555) = 285.480, p < 0.001, normed χ2 = 3.965, RMSEA = 0.049, SRMR = 0.045, CFI = 0.958, TLI = 0.959, NFI = 0.957, PCFI = 0.855 and PNFI = 0.856). Beta (β): effect size; C-R (t-value): critical ratio; SMC: squared multiple correlation; **: p > 0.01, ***: p > 0.001.
Publisher’s Note: MDPI stays neutral with regard to jurisdictional claims in published maps and institutional affiliations. |
© 2021 by the authors. Licensee MDPI, Basel, Switzerland. This article is an open access article distributed under the terms and conditions of the Creative Commons Attribution (CC BY) license (https://creativecommons.org/licenses/by/4.0/).
Share and Cite
MDPI and ACS Style
Aliedan, M.M.; Sobaih, A.E.E.; Elshaer, I.A. Influence of Cities-Based Entertainment on Tourist Satisfaction: Mediating Roles of Destination Image and Experience Quality. Sustainability 2021, 13, 11086. https://doi.org/10.3390/su131911086
AMA Style
Aliedan MM, Sobaih AEE, Elshaer IA. Influence of Cities-Based Entertainment on Tourist Satisfaction: Mediating Roles of Destination Image and Experience Quality. Sustainability. 2021; 13(19):11086. https://doi.org/10.3390/su131911086
Chicago/Turabian StyleAliedan, Meqbel M., Abu Elnasr E. Sobaih, and Ibrahim A. Elshaer. 2021. "Influence of Cities-Based Entertainment on Tourist Satisfaction: Mediating Roles of Destination Image and Experience Quality" Sustainability 13, no. 19: 11086. https://doi.org/10.3390/su131911086
Note that from the first issue of 2016, this journal uses article numbers instead of page numbers. See further details here.