Article

KOH-Based Modified Solvay Process for Removing Na Ions from High Salinity Reject Brine at High Temperatures

by
Aya A-H. I. Mourad
1,2,
Ameera F. Mohammad
1,3,
Ali H. Al-Marzouqi
1,*,
Muftah H. El-Naas
4,*,
Mohamed H. Al-Marzouqi
1 and
Mohammednoor Altarawneh
1
1
College of Engineering, UAE University, Al Ain 15551, United Arab Emirates
2
Academic Support Department, Abu Dhabi Polytechnic, Institute of Applied Technology, Abu Dhabi 111499, United Arab Emirates
3
Chemical Engineering Department, KU Leuven, 3001 Leuven, Belgium
4
Gas Processing Center, College of Engineering, Qatar University, Doha 2713, Qatar
*
Authors to whom correspondence should be addressed.
Sustainability 2021, 13(18), 10200; https://doi.org/10.3390/su131810200
Submission received: 19 July 2021 / Revised: 27 August 2021 / Accepted: 7 September 2021 / Published: 13 September 2021

Abstract

:
The traditional Solvay process and other modifications that are based on different types of alkaline material and waste promise to be effective in the reduction of reject brine salinity and the capture of CO2. These processes, however, require low temperatures (10–20 °C) to increase the solubility of CO2 and enhance the precipitation of metallic salts, while reject brine is usually discharged from desalination plants at relatively high temperatures (40–55 °C). A modified Solvay process based on potassium hydroxide (KOH) has emerged as a promising technique for simultaneously capturing carbon dioxide (CO2) and reducing ions from reject brine in a combined reaction. In this study, the ability of the KOH-based Solvay process to reduce brine salinity at relatively high temperatures was investigated. The impact of different operating conditions, including pressure, KOH concentration, temperature, and CO2 gas flowrate, on CO2 uptake and ion removal was investigated and optimized. The optimization was performed using the response surface methodology based on a central composite design. A CO2 uptake of 0.50 g CO2/g KOH and maximum removal rates of sodium (Na+), chloride (Cl), calcium (Ca2+), and magnesium (Mg2+) of 45.6%, 29.8%, 100%, and 91.2%, respectively, were obtained at a gauge pressure, gas flowrate, and KOH concentration of 2 bar, 776 mL/min, and 30 g/L, respectively, and at high temperature of 50 °C. These results confirm the effectiveness of the process in salinity reduction at a relatively high temperature that is near the actual reject brine temperature without prior cooling. The structural and chemical characteristics of the produced solids were investigated, confirming the presence of valuable products such as sodium bicarbonate (NaHCO3), potassium bicarbonate (KHCO3) and potassium chloride (KCl).

1. Introduction

The Solvay process is an effective approach for treating carbon dioxide (CO2) produced from fossil fuel power plants and brine rejected from desalination industries in a single reaction [1]. Many factors affect the performance of the combined process, such as the reaction temperature, alkaline type, and solution pH. Among these variables, temperature has the greatest impact on the process because it controls the solubility of CO2 and metal ions in the brine [1]. Generally, high temperatures have a negative effect on the solubility of CO2 and decrease the precipitation of metal ions such as sodium (Na+) ions, which are present in the brine at high concentrations compared with other ions such as calcium (Ca2+), magnesium (Mg2+), and chloride (Cl). The main objective of the traditional Solvay process is to produce insoluble sodium bicarbonate (NaHCO3) via the reaction of the sodium chloride with CO2 in the presence of ammonia (NH3), according to Equation (1) [2].
NaCl + NH 3 + CO 2 + H 2 O   NaHCO 3 + NH 4 Cl   Δ G 20 °C = 59.7   kJ/kmol
Mohammad et al. [2] investigated the parametric sensitivity of the traditional Solvay process to optimize the conditions of the entire process. The response surface methodology (RSM) using Minitab 19.0 software was employed to optimize the responses under different ranges of temperature (13.2–46.8 °C), CO2 gas flowrate (0.659–2.341 L/min), and NH3-to-sodium chloride (NaCl) molar ratio (1.7–3.3). All experiments were performed at atmospheric pressure. A maximum CO2 capture efficiency of 86% and Na+ removal efficiency of 33% were achieved at a temperature, gas flowrate and NH3:NaCl molar ratio of 19 °C, 1.54 L/min, and 3.3, respectively. Moreover, increasing the temperature from 13.2 °C to 46.8 °C caused a remarkable decrease in the CO2 and Na+ removal efficiency. Palitsakun et al. [3] investigated the impact of temperature and CO2 flowrate on the performance of the traditional Solvay process based on NH3, obtaining the maximum NaHCO3 amount of 20.67 wt. % at a temperature, CO2 flowrate, and NaCl concentration of 20 °C, 0.1 L/min, and 3 M, respectively, using a 43 wt. % NH3 solution. Moreover, a significant reduction in the CO2 capture efficiency from ~93% to 80% was observed when the temperature was increased from 20 °C to 38 °C.
Although NH3 was used as a catalyst to enhance the reaction rate by increasing the pH, NH3 is environmentally hazardous and its recovery is costly [2]. In this context, a calcium oxide (CaO)-based modified Solvay process (Equation (2)) was studied as an alternative by El-Naas et al. [4,5]. This process not only avoids the harmful impacts of the conventional Solvay process, but also achieves better performance in terms of CO2 capture, Na+ removal, and energy consumption. Furthermore, CaO could maintain a high pH value of 11.8.
2 NaCl + 2 CO 2 + Ca ( OH ) 2   2 NaHCO 3 + CaCl 2   Δ G 20 °C = 56.0   kJ/kmol
These authors employed RSM to optimize the entire process, achieving a maximum CO2 uptake of 0.92 g CO2/g CaO and Na+ removal of 35% under optimum conditions of 20 °C temperature, atmospheric pressure, 1 L/min CO2 flowrate, and 20 g/L CaO (more than the solubility limit). Increasing the temperature from 20 °C to 50 °C led to a significant reduction in Na+ removal from 35% to nearly 5%, resulting in less precipitation of NaHCO3 [4].
Dindi et al. [6] examined the effectiveness of mixed metal oxides on CO2 capture and reject brine management in a combined process. A CO2 uptake of 0.082 g CO2/g carbonated solution and a Na+ reduction of 20% in reject brine were achieved at 25 °C and 1 bar. Shim et al. [7] investigated the CO2 capture efficiency at ambient temperature by reacting it with a sodium hydroxide (NaOH) solution produced from NaCl electrolysis. Up to 95% of CO2 capture and 97% NaHCO3 production were obtained. The entire process was conducted at ambient temperature and pressure. Recently, Ibrahim et al. [8] examined the use of steel-making bag house dust (BHD) as a potential source of CaO in the modified Solvay process. A maximum CO2 uptake of (1 ± 0.04) g CO2/g BHD was achieved at ambient temperature and a pressure of 5 bar. Moreover, the precipitation of NaHCO3 occurred at a low temperature of 15 °C.
Recently, Mourad et al. [9] investigated the effectiveness of potassium hydroxide (KOH) in the Solvay process. KOH was selected owing to its potential in directly capturing CO2 from ambient air [10,11,12,13,14,15]. The overall reaction of the modified Solvay process based on KOH as the alkaline material can be described using Equation (3) [9].
NaCl + CO 2 + KOH     NaHCO 3 + KCl   ( Δ G 20 °C = 130.6   kJ/kmol )
This process was studied under the same optimized conditions of temperature, pressure, and gas flowrate previously reported by El-Naas et al. [4], where CaO was used as the alkaline material instead of NH3. The initial results revealed that KOH is a promising alkaline material, which can significantly accelerate CO2 capture efficiency owing to its high solubility in treated brine and its ability to maintain a high pH value ( ~ 13.6). The CO2 uptake and Na+ removal reached up to 0.31 g CO2/g KOH and 29%, respectively, at a temperature, pressure, gas flowrate, and KOH concentration of 20 °C, 1 atm, 1 L/min, and 70.57 g/L, respectively. Moreover, the main products formed in this reaction, such as NaHCO3 and potassium chloride (KCl), have various industrial applications [9].
Based on the above literature review, temperature has been found to be a vital parameter that significantly affects the combined process in terms of metal solubility and CO2 uptake. Notably, low temperature conditions are generally preferred to achieve high CO2 capture and ion removal from reject brine. However, brine is commonly discharged from desalination plants at relatively high temperatures of 40–55 °C [16]. To the best of the authors’ knowledge, no previous works have achieved the optimization of the KOH-based Solvay process to achieve high CO2 capture and ion removal at high temperatures. Therefore, in this study, the optimal operating conditions (gas flowrate, pressure, and KOH concentration) were experimentally investigated to achieve the maximum ion removal and CO2 uptake at relatively high temperatures (40–60 °C). Moreover, the structural and chemical characteristics of the precipitated solids were examined using X-ray diffraction (XRD), scanning electron microscopy (SEM), and Fourier transform infrared (FTIR) spectroscopy.

2. Materials and Methods

2.1. Materials

A gas mixture comprising 10% CO2 and 90% air was obtained from Abu Dhabi Oxygen Company, UAE. KOH with a particle size of 5–7 mm and a purity of 85–100% was acquired from Scientific Progress Medical and Scientific Equipment Company, UAE. The real samples of reject brine were supplied by a multistage flash desalination unit at Abu Dhabi, UAE. The concentrations of Ca2+, Na+, potassium (K+), Mg2+, and Cl were 933.1 ± 3.3, 23,063.1 ± 7.4, 877.1 ± 4.1, 2675.8 ± 6.1, and 48,330 ± 4.2 ppm, respectively. The pH of the reject brine was 8.02 ± 0.01. The ion concentration in the reject brine was measured using inductively coupled plasma (ICP) spectrometry (Varian 710-ES ICP optical emission spectrometer). Cl was analyzed using a HACH HQ40D portable multimeter equipped with a Cl ion-selective electrode (HACH Intellical™ ISECL181). Additionally, the pH was measured using a HACH portable pH meter (Model HQ11D53000000). All measurements were determined by considering the average value of three collected reject brine samples.

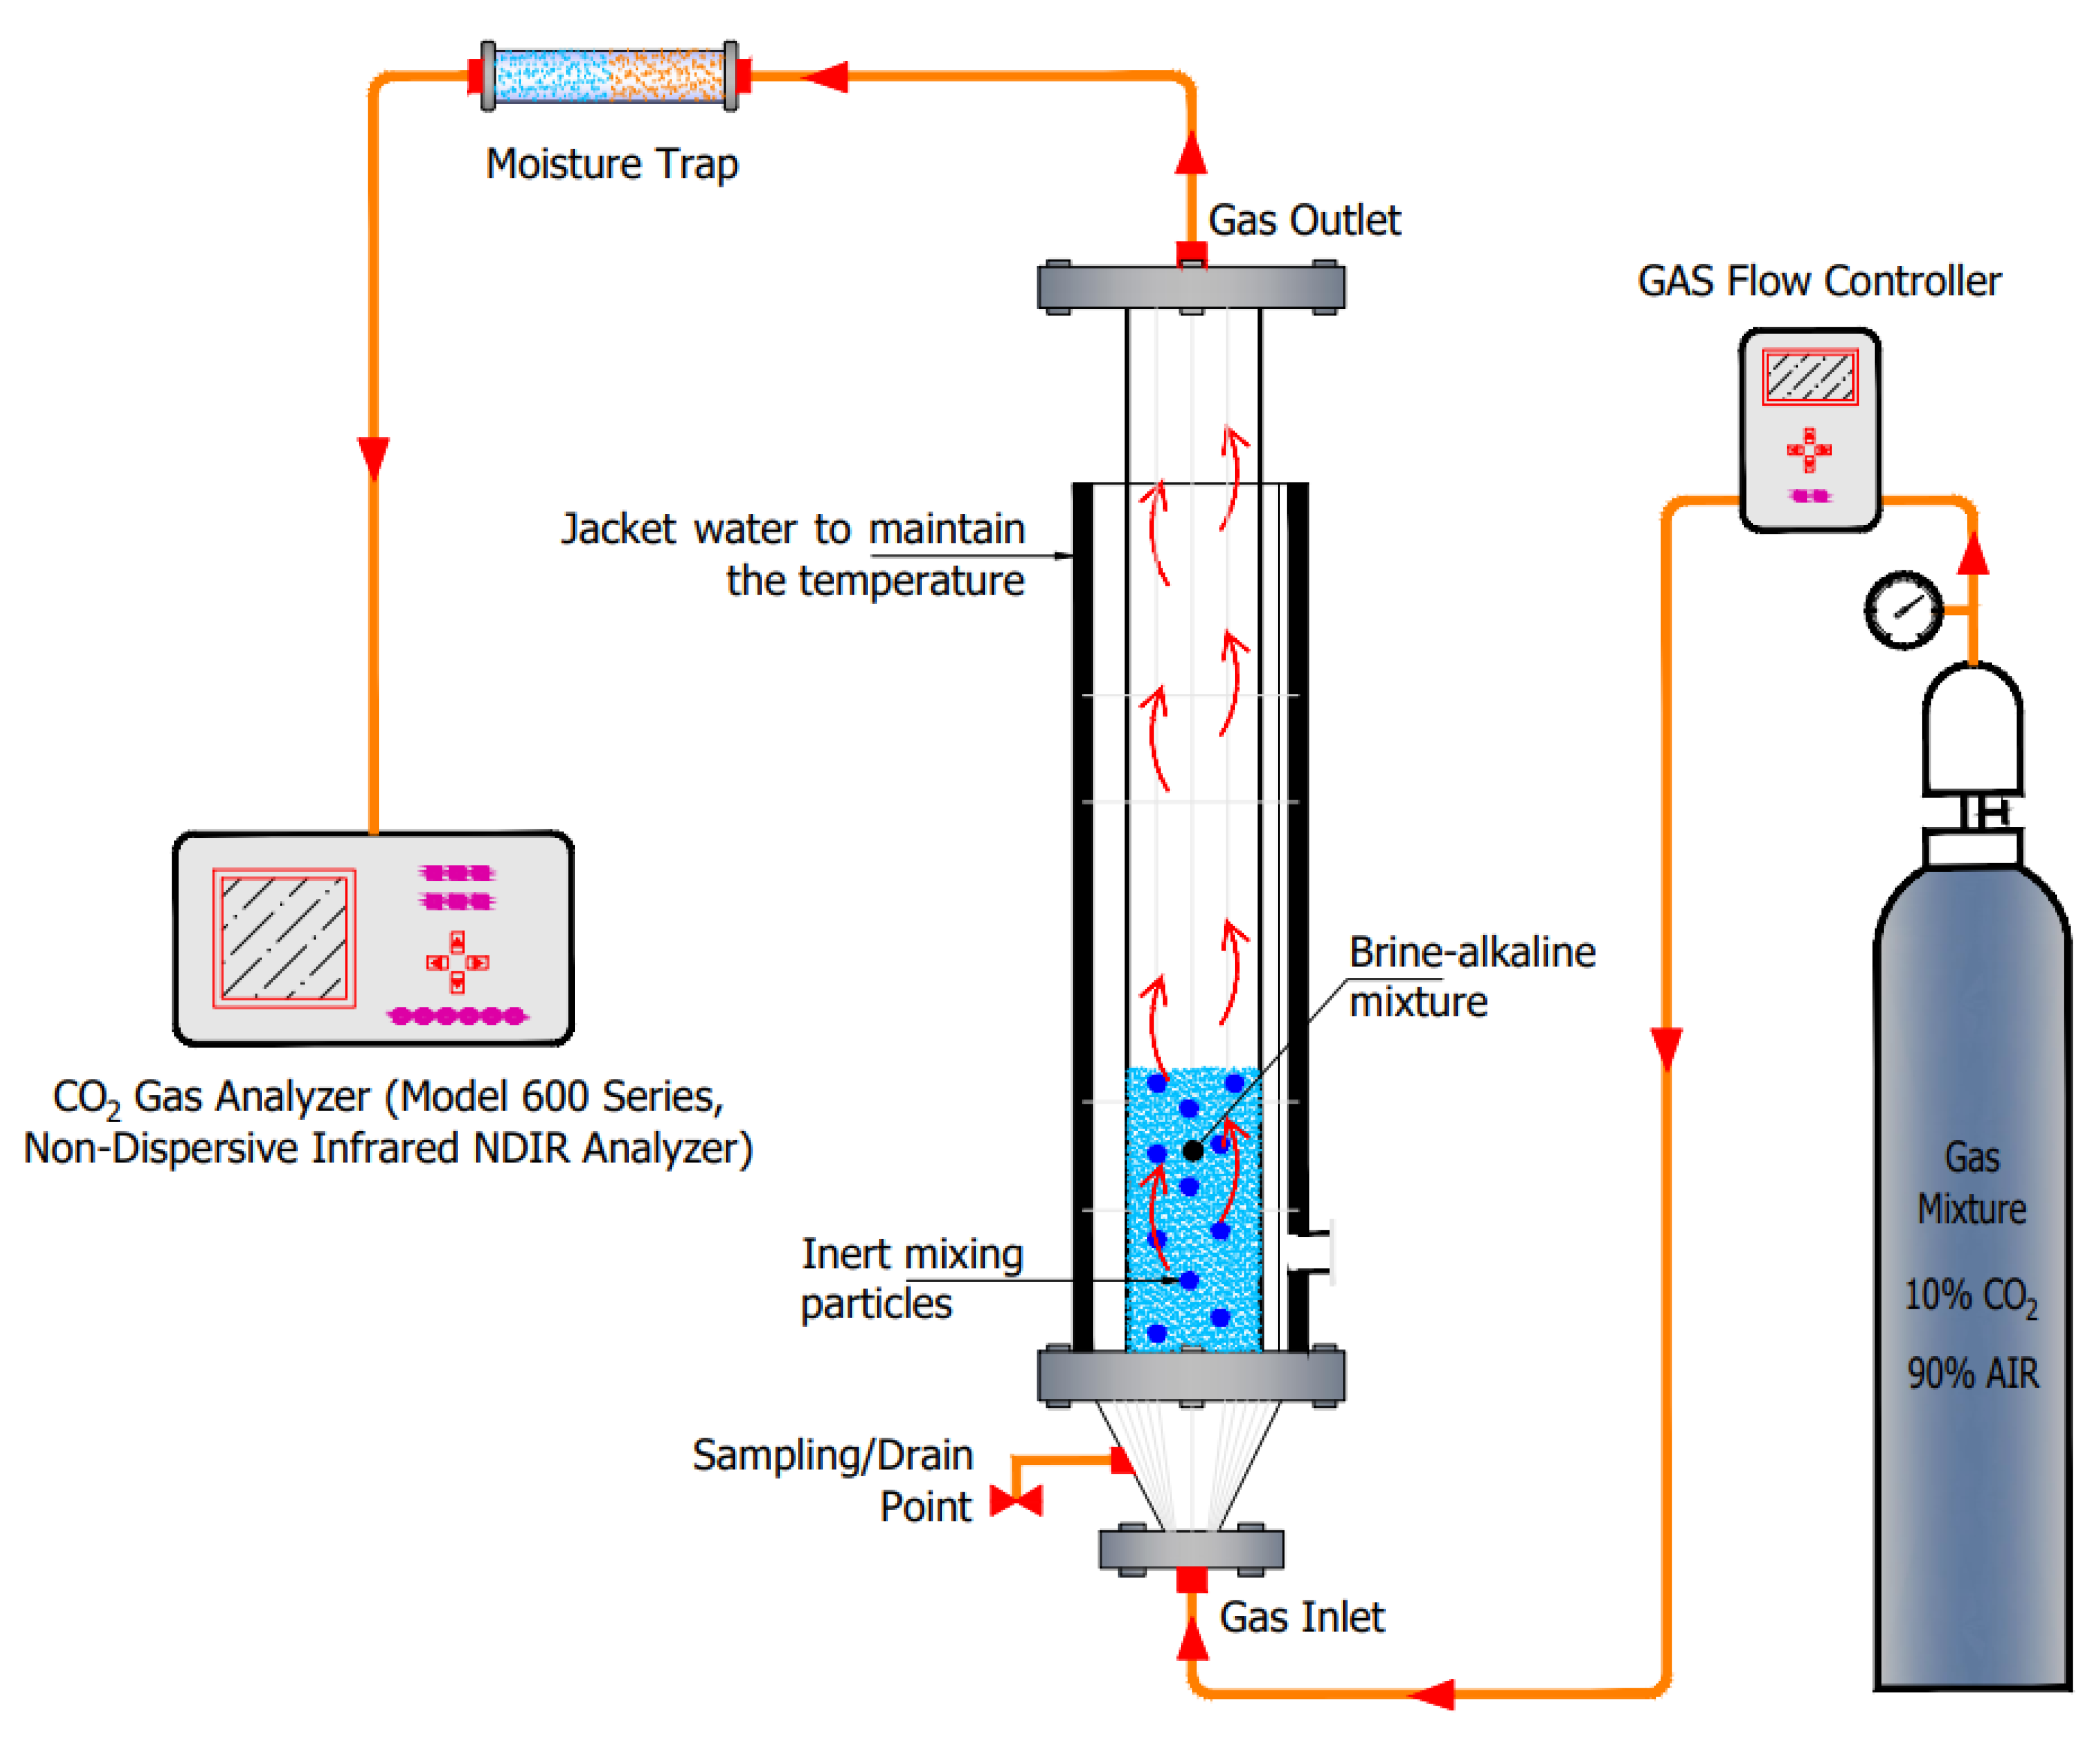
2.2. Experimental Procedure

In this research, all experiments were conducted in a novel inert-particle spouted bed reactor (IPSBR) developed by El-Nass et al. [17,18]. Figure 1 shows a schematic diagram of the reactor [9]. The inert particles were composed of poly(methyl methacrylate) with an average density and diameter of 1020 kg/m3 and 0.013 m, respectively. Particles with a volume fraction (volume of particles/volume of reject brine) of ~ 6% were used. The internal diameter, height, and total working volume of the reactor were 0.078 m, 0.850 m, and 3000 mL [18,19,20,21]. In each experiment, a magnetic stirrer was used to mix a certain amount of KOH with 1 L of reject brine. Initially, the IPSBR was filled with the prepared solution and then exposed to a continuous flow of a CO2–air gas mixture via an orifice diameter of 2 mm from the bottom of the reactor [18]. The gas flowrate was controlled using a mass flow controller. To determine the amount of captured CO2, the outlet gas stream was continuously passed through a CO2 gas analyzer. The pressure was controlled using a backpressure regulator valve at the outlet of the reactor. Each experiment was considered complete when the saturation point was reached, i.e., when the CO2 concentration at the outlet was equal to the inlet value (10 vol. %). The pH of the mixture was measured before and after the reaction with CO2 gas. At the end of each experiment, the collected mixture was filtered to separate the liquid from the produced solids using a Büchner setup. The ion concentration of the treated brine was measured using ICP spectrometry. The percentage of ion reduction and CO2 uptake was calculated using Equations (4) and (5), respectively [4]. The characteristics of the solids were investigated using different analytical techniques, which is discussed in more detail in Section 4.
Ion   reduction   ( % ) = X i X f X i × 100 ,
where X i   is the initial ion concentration in the feed brine (mg/L) and Xf is the final ion concentration in the treated brine (mg/L).
CO 2   uptake   value   ( g   CO 2 / g   KOH ) = mass   of   CO 2   reacted   g mass   of   KOH   used   g

2.3. Experimental Design

To explore the effects of independent variables on the CO2 uptake and ion removal efficiency, a central composite design (CCD) was employed as an optimization tool for RSM using Minitab 19.0 software [20,22]. To determine the optimum conditions, four process-independent variables were considered, namely, temperature, gauge pressure, KOH concentration, and CO2 flowrate, and their influence on CO2 uptake and ion removal percentage (Ca2+, Na+, K+, Mg2+, and Cl) was investigated. Table 1 presents the levels established for the operating parameters. A total of 31 experimental runs was generated in a specific sequence using RSM based on the levels of each factor. After conducting all the experiments, all responses were inserted in the RSM for optimization and predicting the ability of the entire process to achieve a good level of CO2 capture and ion removal at a relatively high temperature of 50 °C.

3. Results and Discussion

In the following sections, the investigation of the impact of the operating parameters and their interactions on CO2 uptake and ion removal is described. The relation between the independent variables, i.e., temperature, pressure, flowrate, and KOH concentration, and responses can be represented using three-dimensional (3D) plots (Figure 2, Figure 3, Figure 4 and Figure 5).

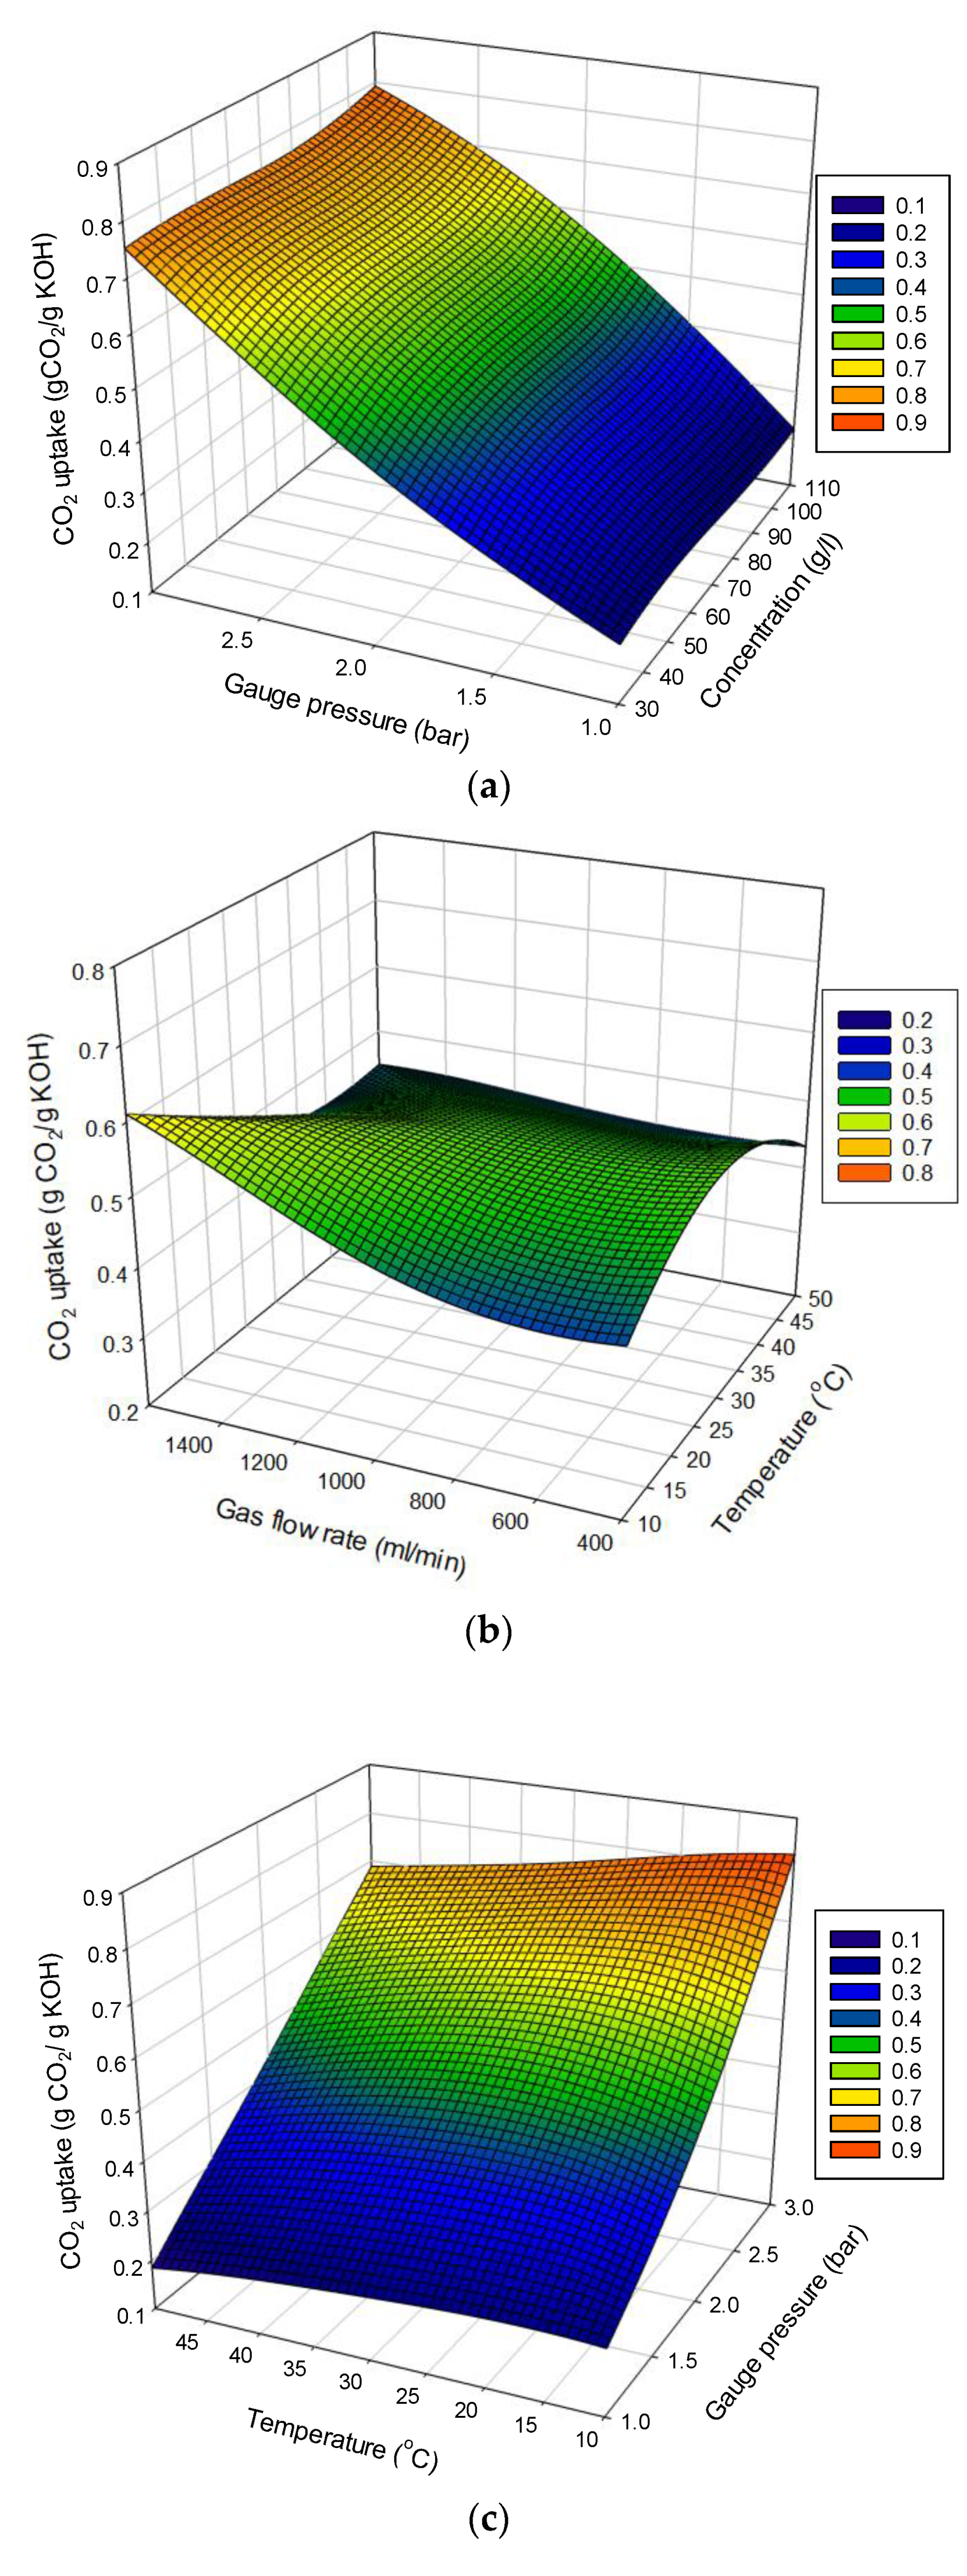
3.1. Impact of Independent Factors on CO2 Uptake

Figure 2a reveals a significant linear relation between pressure and CO2 uptake. The CO2 uptake of nearly 0.76 g CO2/g KOH was achieved at a maximum gauge pressure of 3 bar, followed by a decrease to almost half the maximum value, around 0.38 g CO2/g KOH, at a gauge pressure value of 1.5 bar over the whole range of concentration. These experiments were performed at a constant temperature and gas flowrate of 30 °C and 1000 mL/min, respectively. This considerable effect of the pressure on CO2 uptake was expected; as the pressure increased, more CO2 was solubilized, shifting the reaction (Equation (3)) toward the product side. The 3D plot shown in Figure 2b reveals that the maximum CO2 uptake was obtained at a maximum gas flowrate of 1600 mL/min and a low temperature of 10 °C, owing to the high solubility of CO2 gas at low temperatures [1,4,8]. Furthermore, CO2 uptake still reached a value of up to 0.53 g CO2/g KOH at a temperature of 30 °C and a low gas flowrate of nearly 400 mL/min. This observation confirms the effect of gas flowrate on CO2 uptake, where a low gas flowrate resulted in a high residence time and hence high CO2 capture [4,8]. This result reflects the novelty of the IPSBR [18,19,20], which can still operate under high feed-gas flowrate and achieve high CO2 uptake under certain conditions. Figure 2c demonstrates the impact of the interaction between temperature and pressure on the CO2 uptake. As a general conclusion, the uptake increases with the pressure at a constant temperature. This is for the studied ranges of temperature (10–50 °C) and gauge pressure (1–3 bar). These results were achieved under a constant gas flowrate of 1000 mL/min and a KOH concentration of 70 g/L.

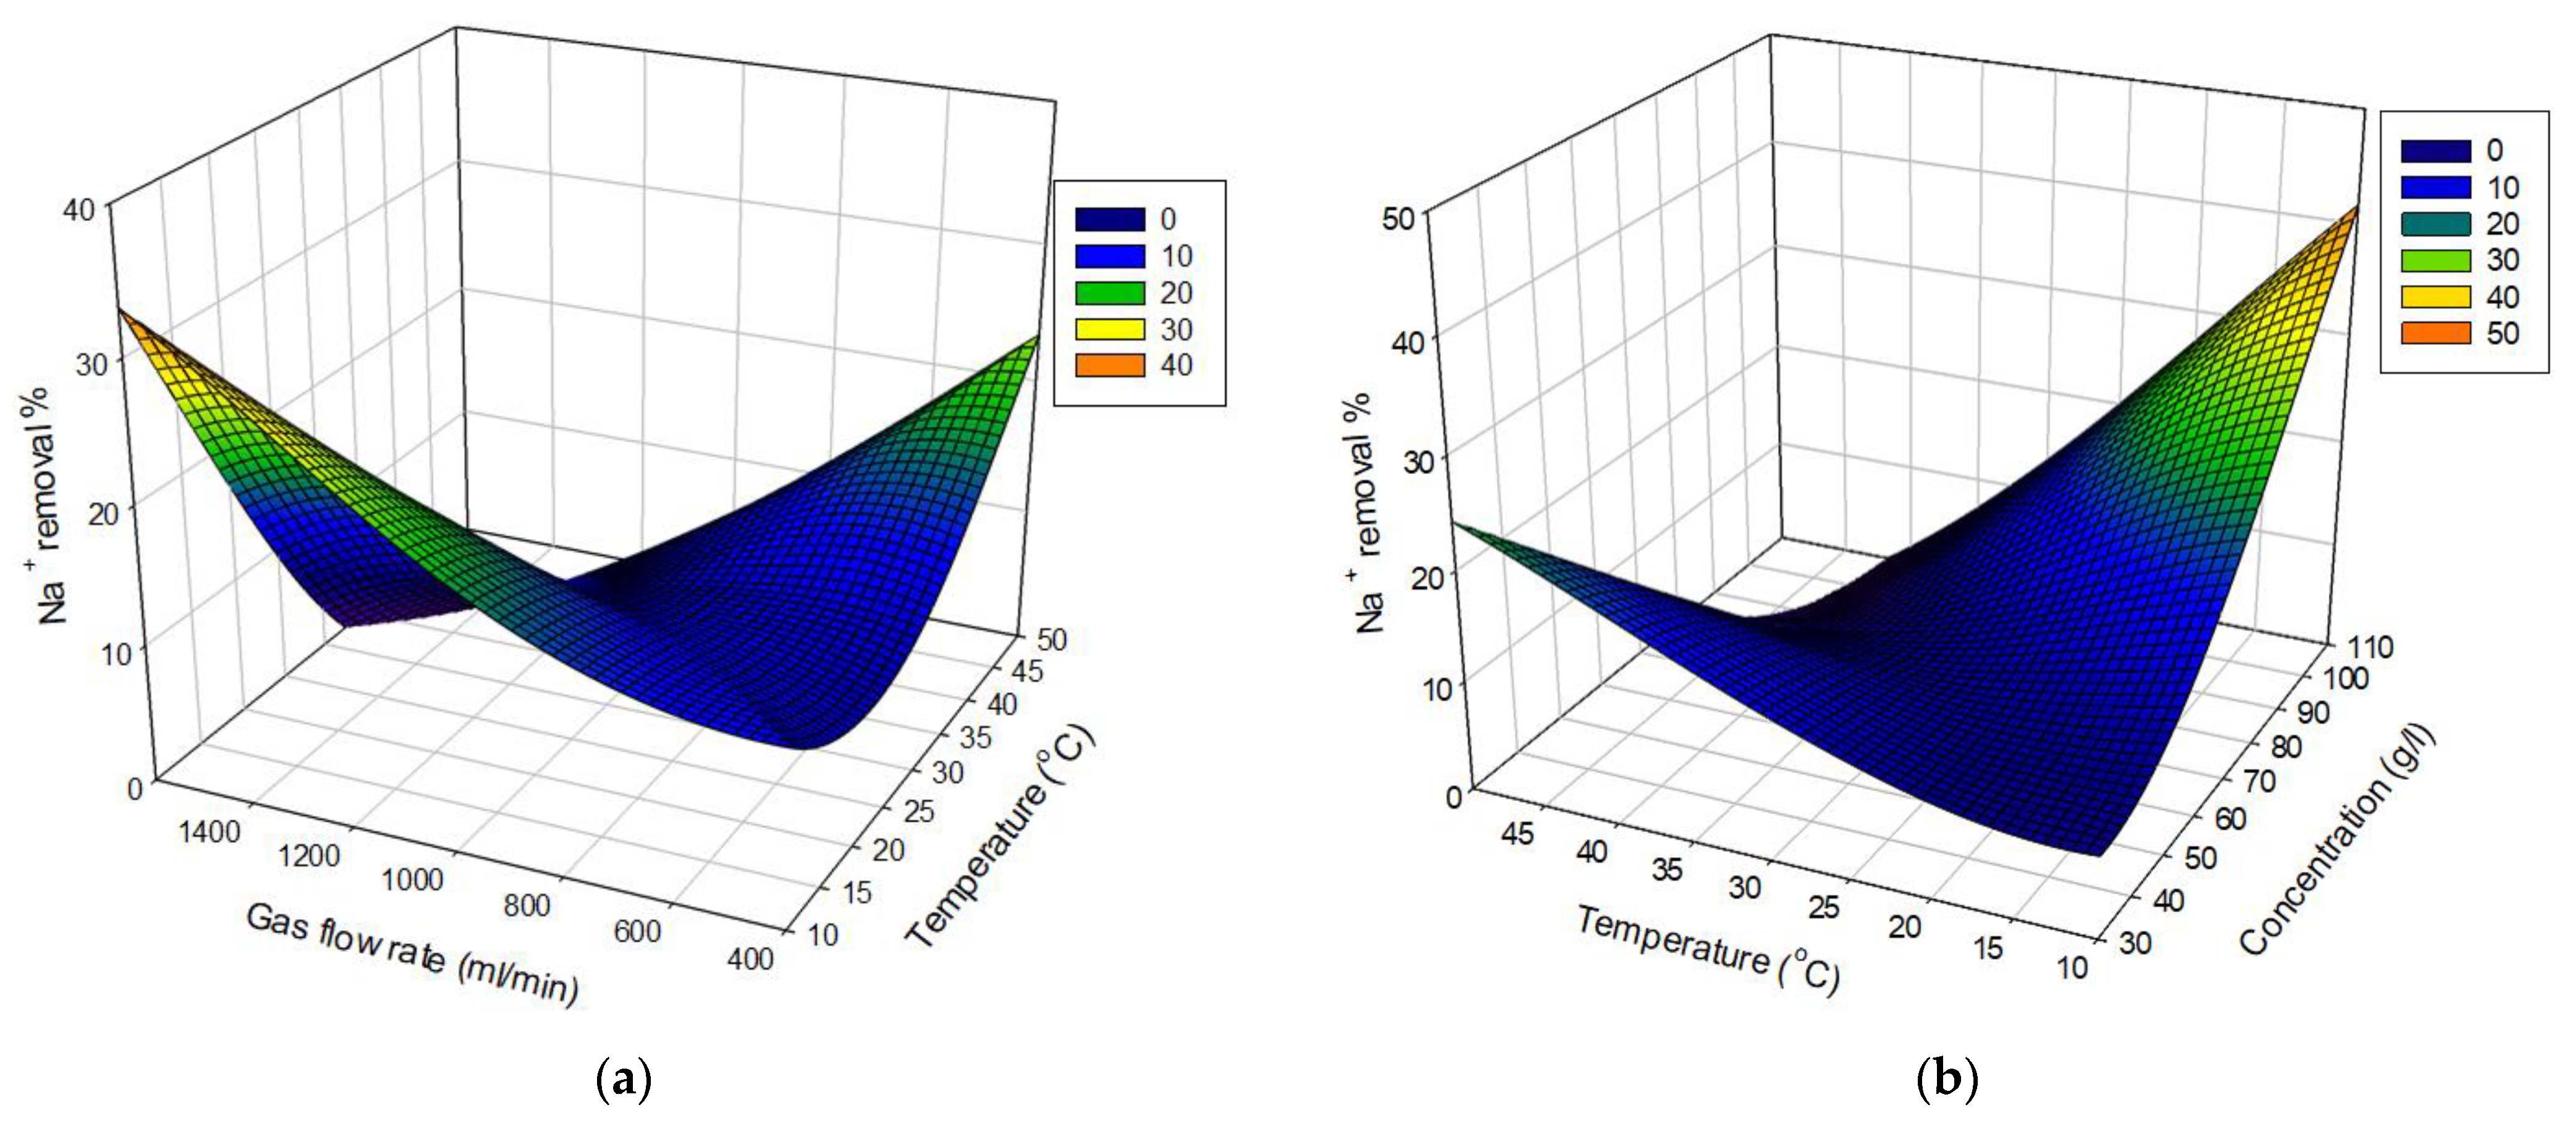
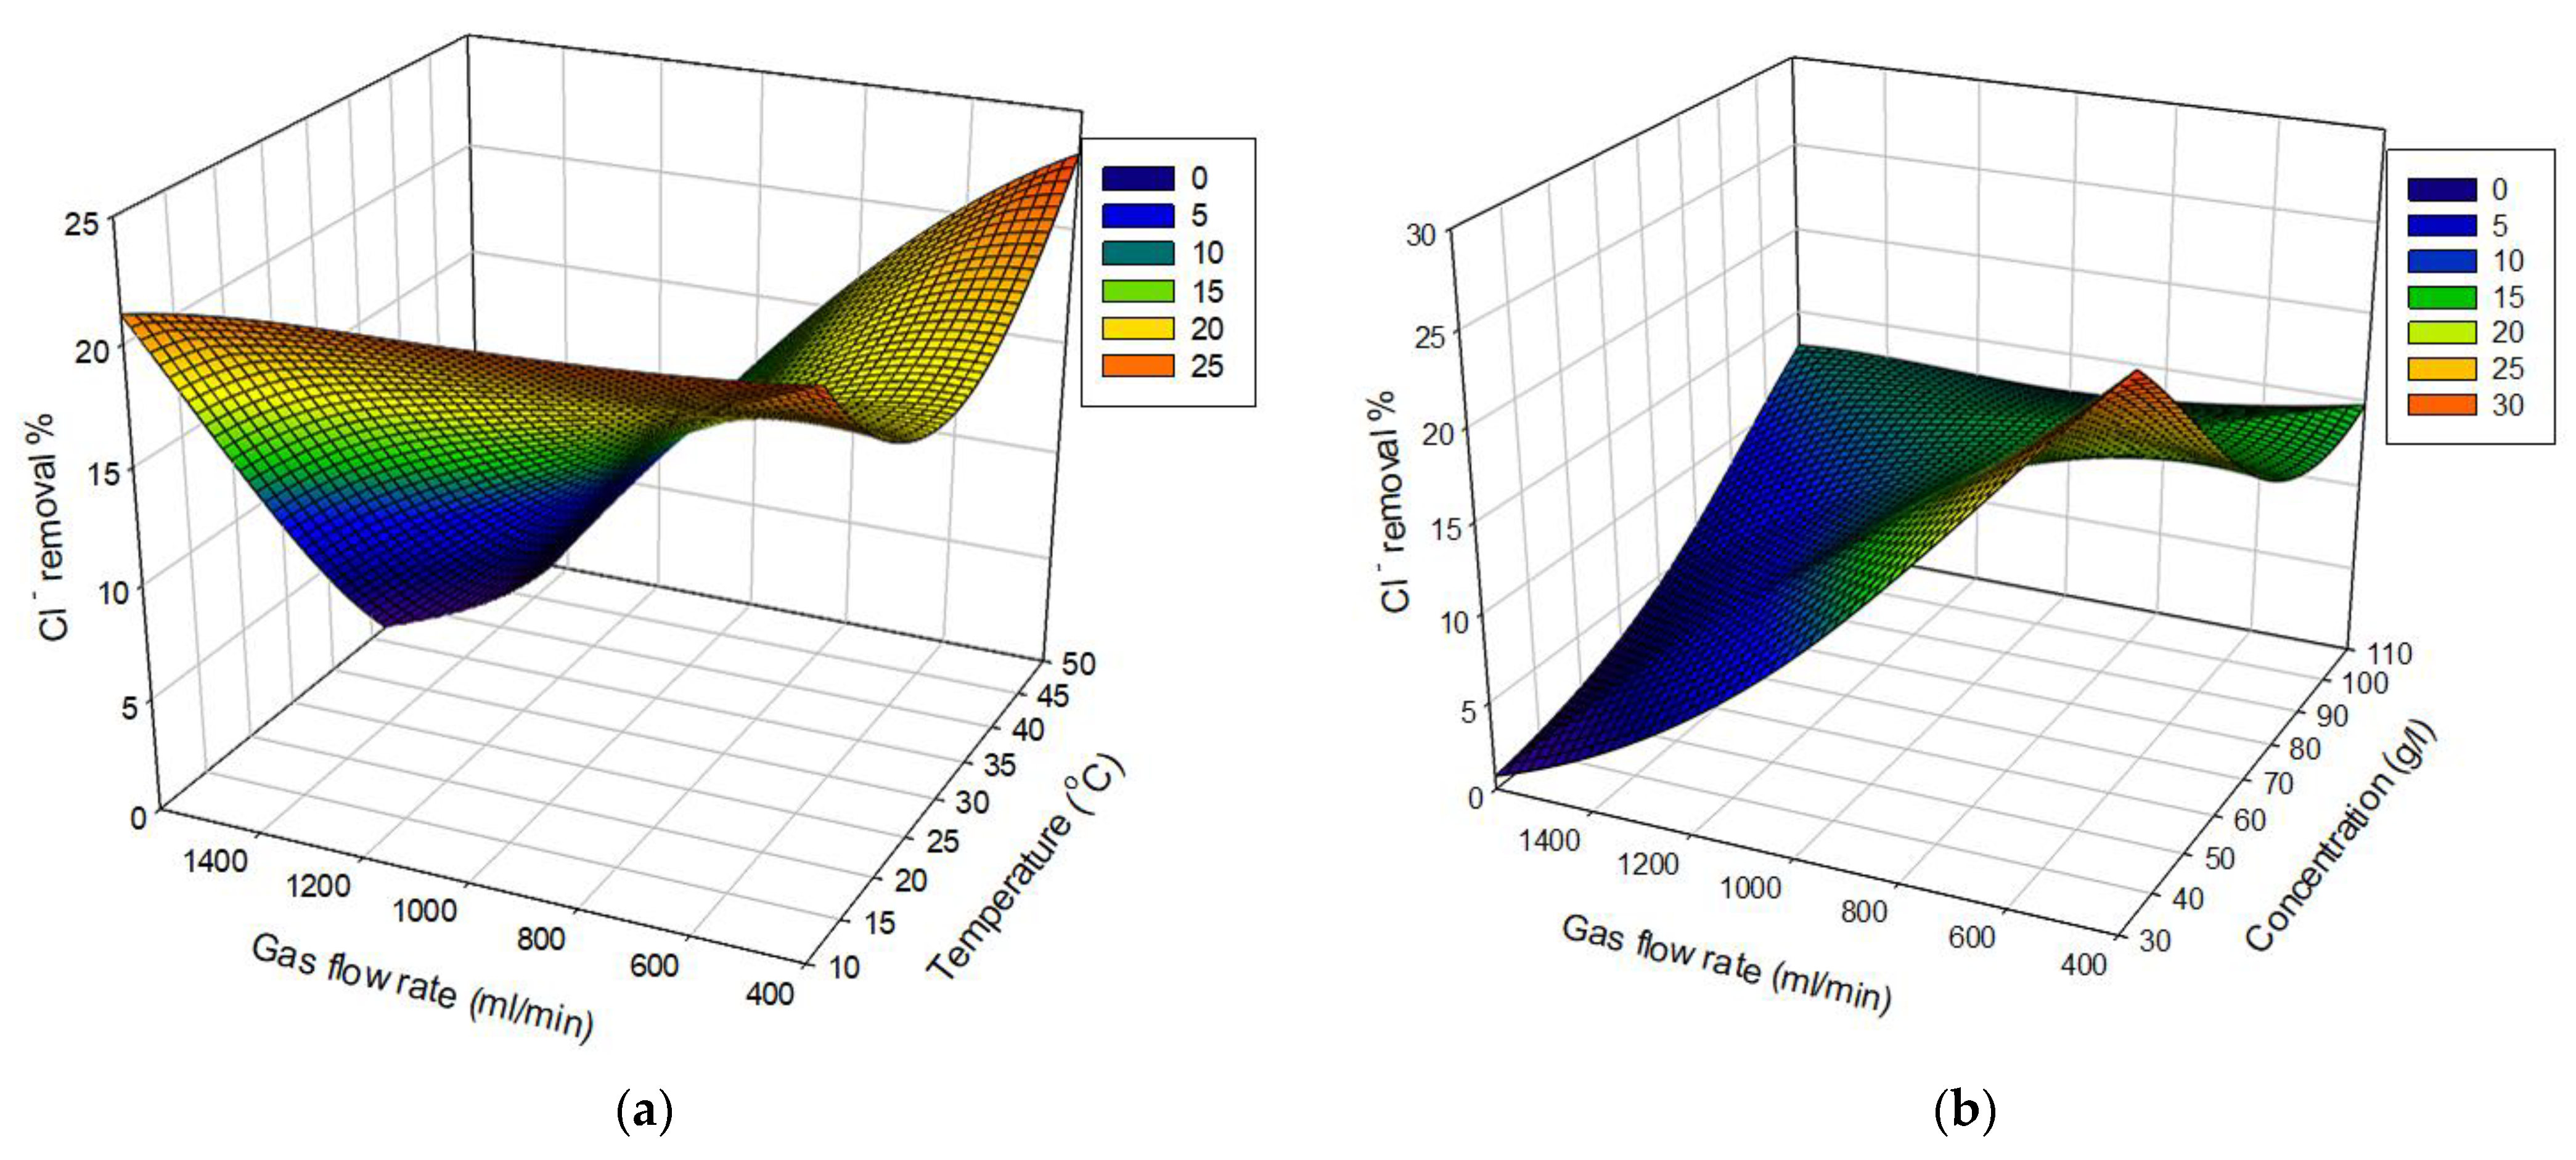
3.2. Impact of Independent Factors on Na+ and Cl Removal from Reject Brine

Figure 3a,b present the impact of independent parameters on Na+ reduction. Figure 3a shows good Na+ removal over the range of temperatures. These data were measured under a constant gauge pressure of 2 bar and a KOH concentration of 70 g/L. Further, Figure 3b depicts the effect of the interaction between temperature and KOH concentration on the response, which was evaluated under a constant gauge pressure of 2 bar and a gas flowrate of 1000 mL/min. The maximum Na+ removal efficiency was achieved at a low temperature and a high concentration of 110 g/L, which was beyond the stoichiometric value (70.57 g/L). Moreover, a good Na+ removal efficiency can still be achieved at high temperatures and low KOH concentrations (30 g/L).
Figure 4a illustrates the influence of gas flowrate and temperature on Cl reduction at a constant gauge pressure of 2 bar and a KOH concentration of 70 g/L. The figure depicts that the maximum Cl removal is obtained under a maximum temperature of 50 °C and low gas flowrate of 400 mL/min. At a low gas flowrate, the gas residence time increased, enhancing the reaction rate and enabling a high removal under relatively high temperature conditions. Notably, owing to the significant effect of the residence time on the overall process performance and reaction rate, the maximum Cl removal efficiency was obtained at a relatively low KOH concentration of 50 g/L and a low feed-gas flowrate of 400 mL/min, as illustrated in Figure 4b. These data were obtained at a temperature of 30 °C and a gauge pressure of 2 bar.

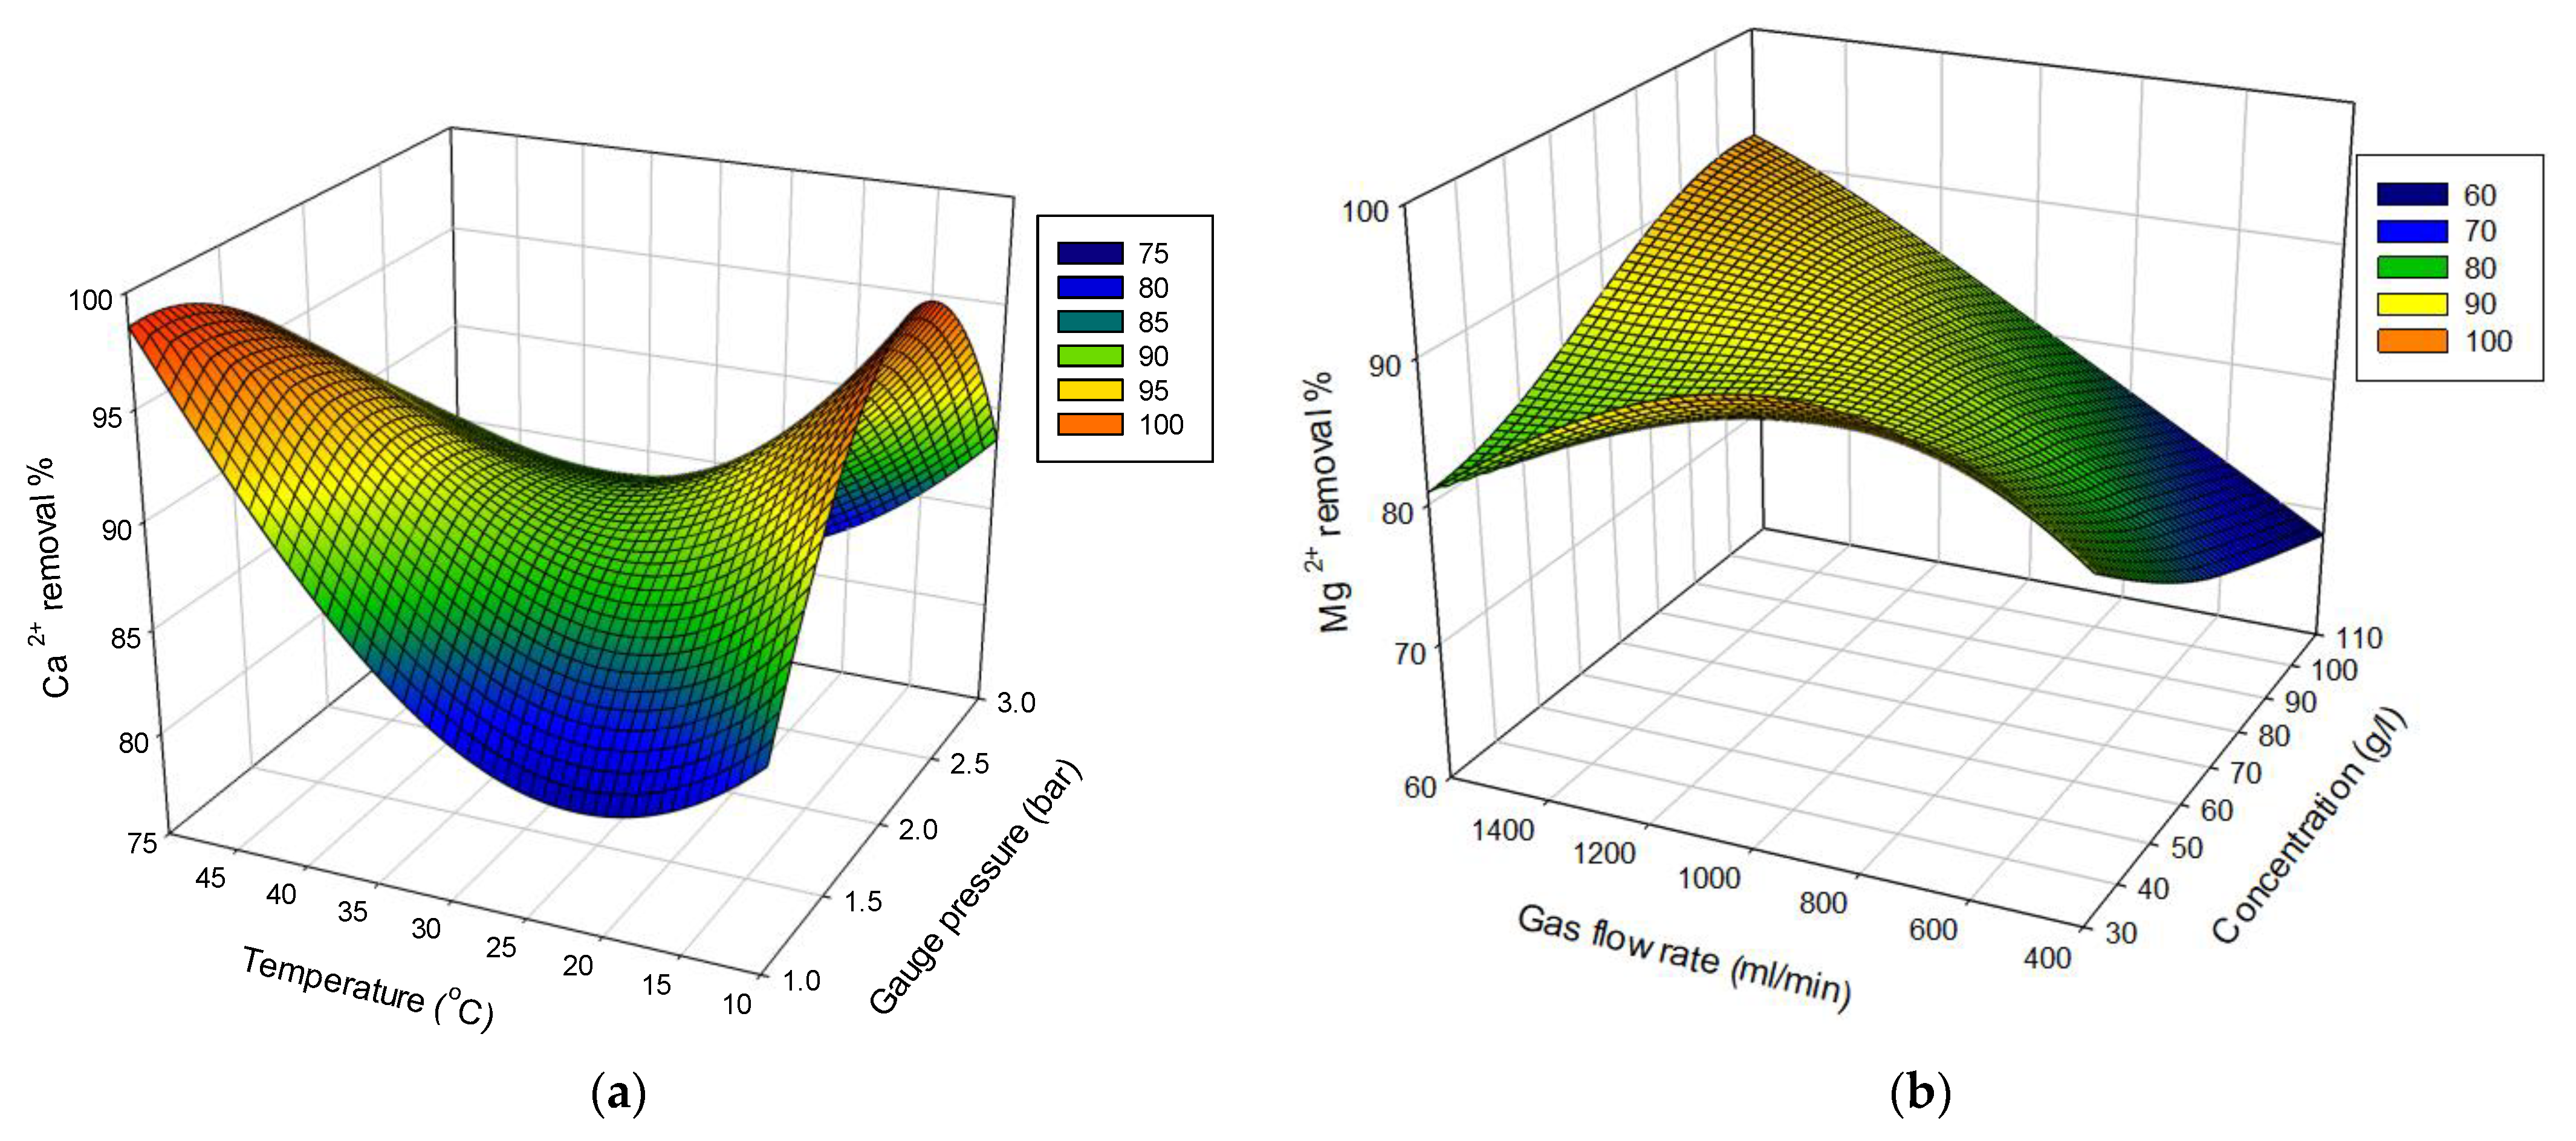
3.3. Impact of Independent Factors on Ca2+ and Mg2+ Removal from Reject Brine

The 3D plots of the impact of temperature and pressure on the Ca2+ reduction efficiency are shown in Figure 5a. The figure reveals that high Ca2+ removal values ( ~ 98 %) were obtained at a high temperature value of 50 °C and a gauge pressure of 1 bar. These results, which were obtained at a constant feed-gas flowrate of 1000 mL/min and a KOH concentration of 70 g/L, can be explained by the high reactivity of Ca2+ with CO2 gas in high-pH media [23]. The interaction effect of gas flowrate and KOH concentration on Mg2+ reduction is clearly shown in Figure 5b. These experimental runs were operated at a temperature of 30 °C and gauge pressure of 2 bar. The maximum Mg2+ reduction efficiency of approximately 95% was achieved at a high KOH concentration and high feed-gas flowrate of 110 g/L and 1600 mL/min, respectively. Upon decreasing the gas flowrate to 400 mL/min at the same KOH concentration of 110 g/L, the Mg2+ removal efficiency was reduced to almost 68%. Thus, a high gas flowrate and high KOH concentration are essential for enhancing Mg2+ reduction, owing to an improvement in the reaction rate.

3.4. Process Optimization and Validation

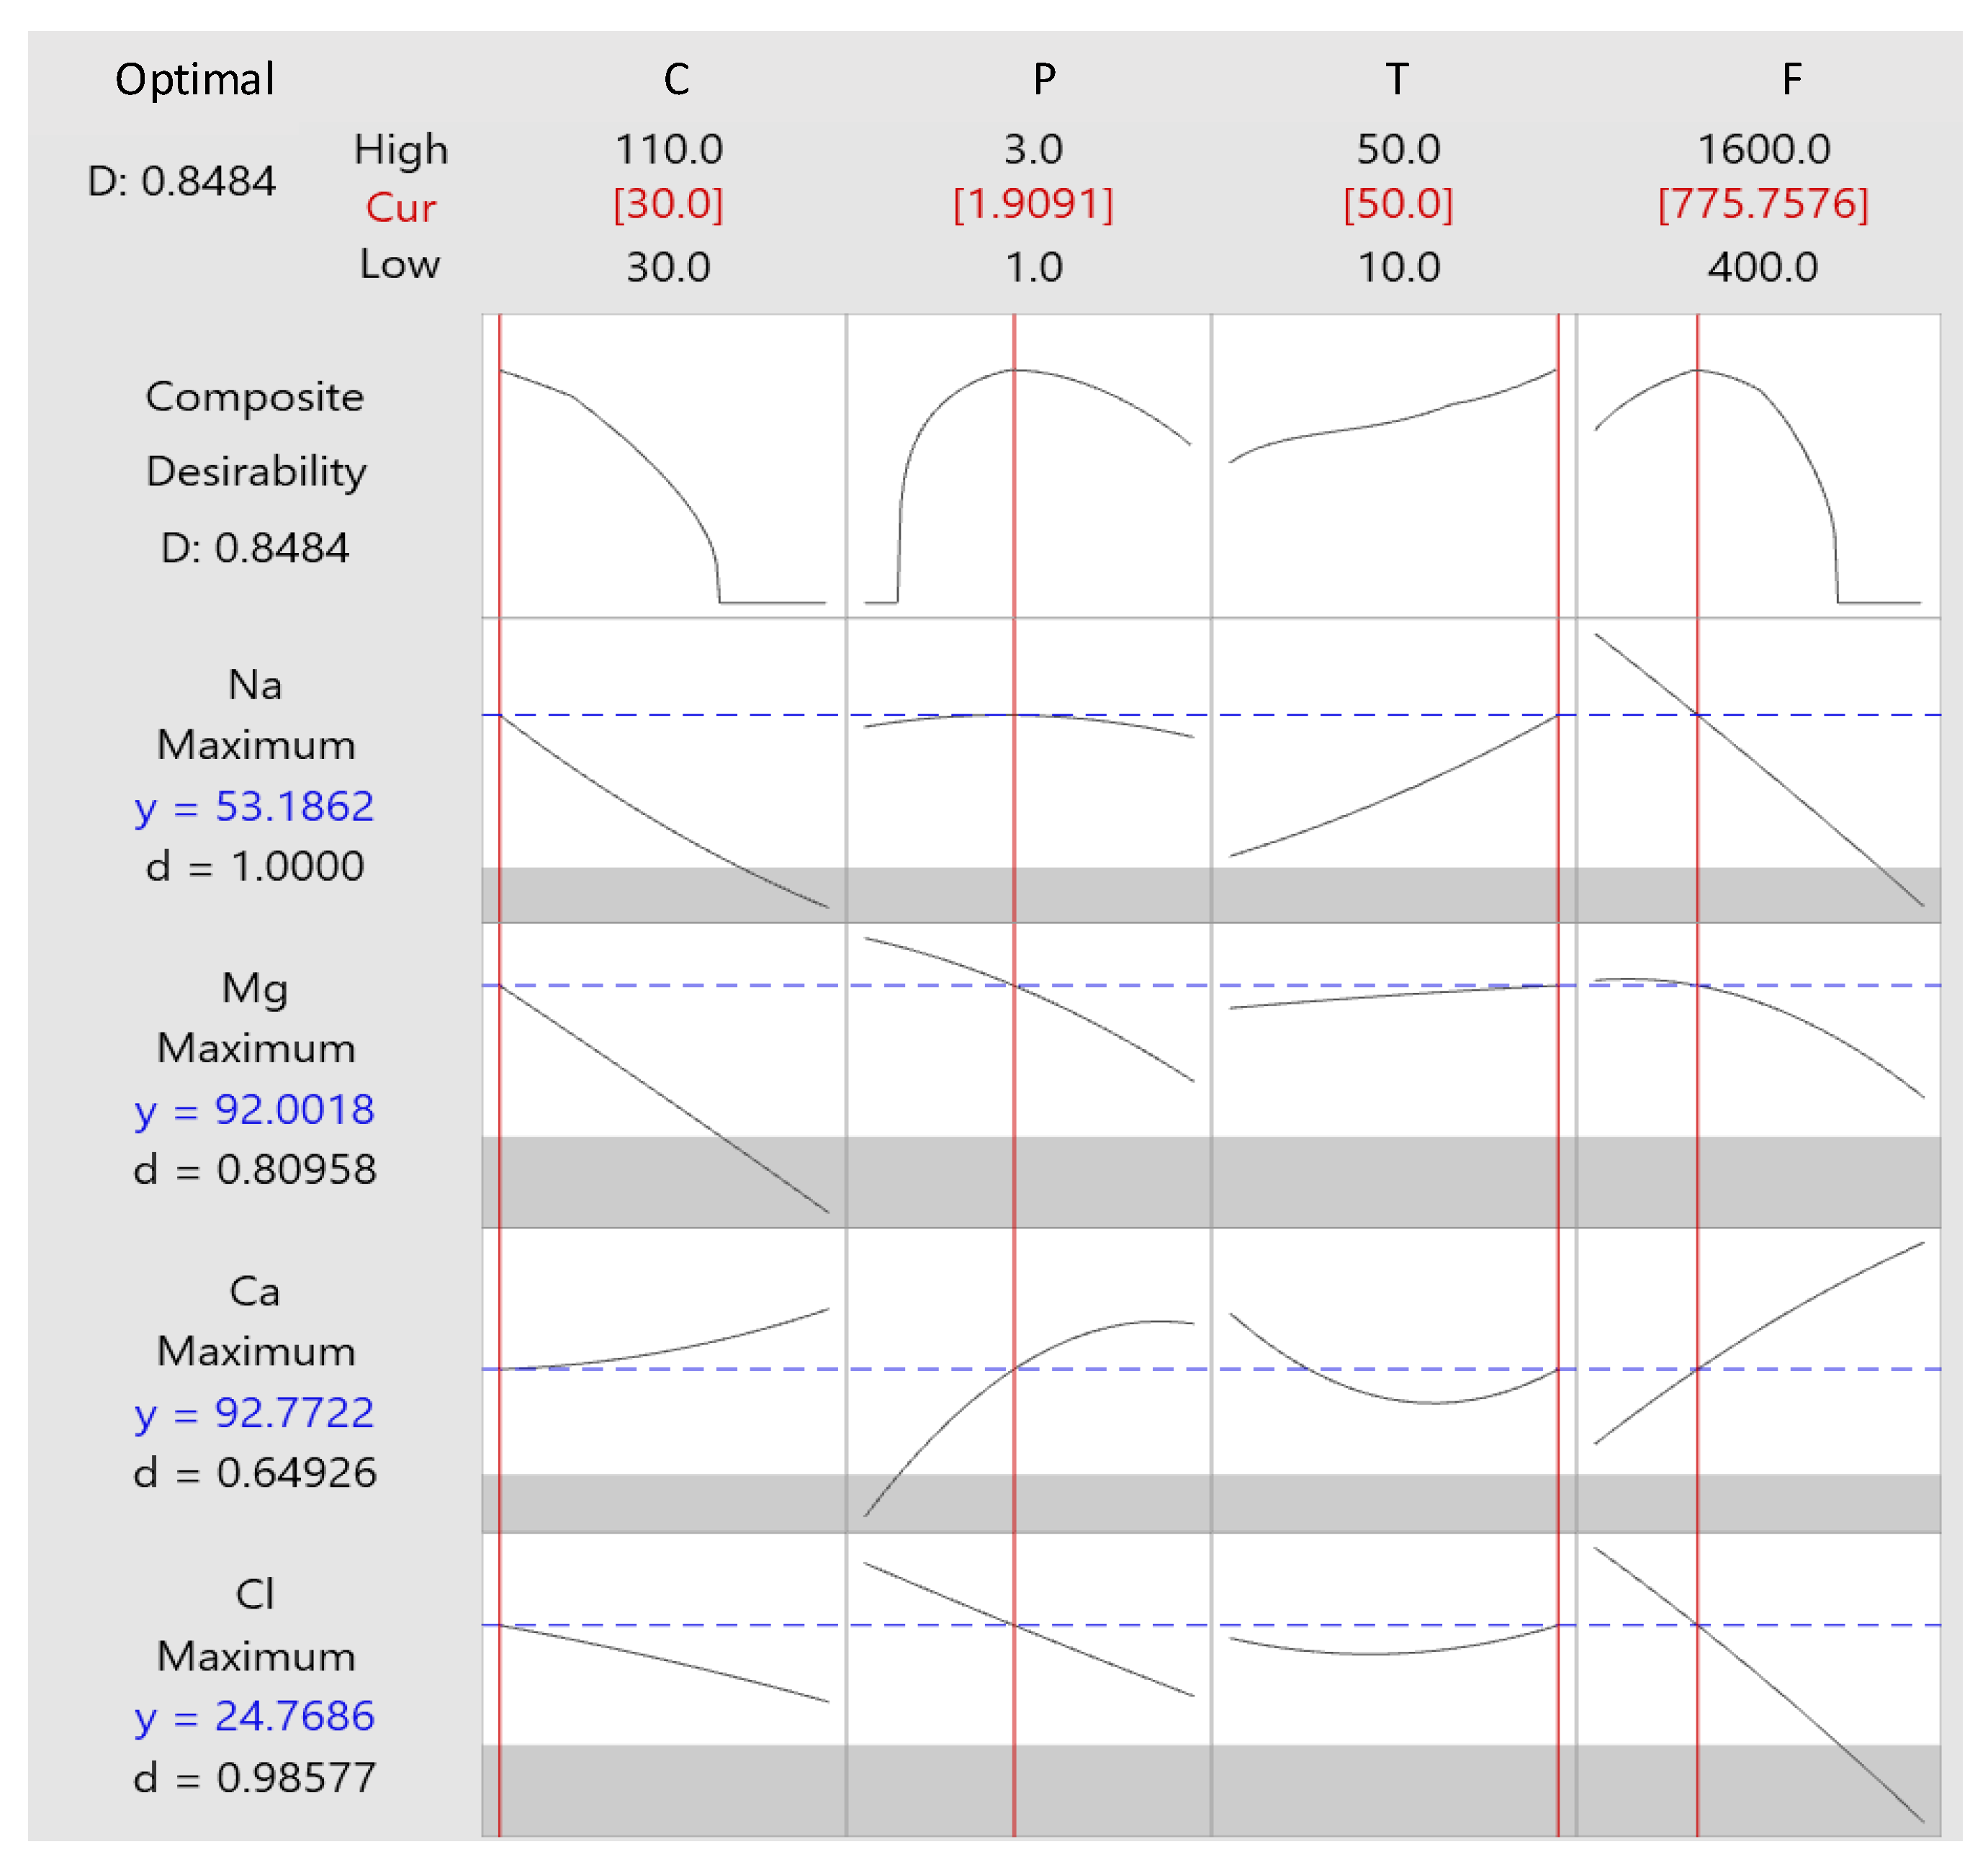
3.4.1. Optimization of Responses under Relatively High Temperature Conditions

Brine is commonly rejected from desalination plants at relatively high temperatures of 40 °C to 55 °C [16]. Therefore, the maximum ion reduction that could be reached at 50 °C was predicted using the response optimizer in Minitab software. Based on the responses of 31 experimental runs, the developed RSM model predicted that the maximum ion reduction can be achieved at a KOH concentration, gauge pressure, and gas flowrate of 30 g/L, 2.0 bar, and ~776 mL/min, respectively, under a constant temperature of 50 °C. Table 2 summarizes the predicted optimum conditions, confidence interval (CI), fitted responses, and desirability function. Additionally, a high desirability value of almost 0.85 confirms the optimal performance of the studied parameters [20]. In addition, Figure 6 demonstrates the response optimization plot obtained via Minitab software. It is noticed that a high KOH concentration has a negative effect on the Na+, Cl, and Mg2+ reduction. However, it can positively affect the reduction in Ca2+ ions. The figure also shows a negligible influence of pressure on the Na+ removal percentage. It is worth noting that the optimum reduction for all ions can be achieved at a high temperature (50 °C). Moreover, the figure reveals that a low gas flowrate has a good impact on ions removal, except for Ca2+ ions, on which it has a negative impact. Therefore, the optimum reduction for all ions can be achieved at an intermediate gas flowrate value of 776 mL/min.

3.4.2. Experimental Validation of the Predicted Optimal Responses

The predicted operating conditions and corresponding responses provided in Table 2 were experimentally verified. Na+, Cl, Mg2+, and Ca2+ show a reduction efficiency of up to 45.6%, 29.8%, 91.2%, and 100%, respectively. All the obtained results were within the 95% CI range (Table 2), confirming the ability of the model to predict the performance of the process at several operating parameters. Notably, under the same operating conditions, CO2 uptake reached up to 0.5 g CO2/g KOH, which still constitutes a good level of CO2 capture. The CO2 uptake was expected to decrease when the temperature was increased from 10 °C to 50 °C. However, owing to the effect of the linear relation between pressure and temperature on CO2 uptake (Figure 2c), the effect of pressure was a good CO2 uptake.
The results illustrated in Figure 6 show that a high Na+ removal efficiency can be achieved at a relatively high temperature of 50 °C, and under certain operating conditions of gas flowrate, KOH concentration, and pressure. This finding was also confirmed by the validated results. This result can be explained by the so-called hot potassium carbonate (K2CO3) process (hot pot process), according to which K2CO3 is mainly used to remove large amounts of CO2 from ammonia plants [24,25,26] via the reaction described in Equation (6) [25]. In this process, the entire system is operated at high temperatures (110–116 °C) to increase the solubility of K2CO3. Additionally, a relatively high CO2 pressure (2–6 bar gauge) is required to keep CO2 soluble under such high temperature conditions [25]. HSC Chemistry 6.1 software [27] was used to perform a thermodynamic analysis via Equation (6). Table 3 illustrates the calculated thermodynamic properties. The analysis indicates that the reaction is spontaneous for the whole temperature range (0 to 100 °C), as indicated by the negative ΔG.
K 2 CO 3 + CO 2 + H 2 O   2 KHCO 3
Note that the KOH concentration affects the absorption of CO2. An excessive amount of KOH yields K2CO3, which competes against the formation of KHCO3 [28]. As shown using Equation (7), the addition of KOH at amounts equal to or less than the stoichiometric KOH amount (70.57 g/L) would produce bicarbonate ions (HCO3). Alternatively, according to Equation (8), an excess amount of KOH would yield carbonate ions ( CO 3 2 ), which are less soluble than HCO3. Therefore, at low KOH concentrations (30 g/L), the formation reaction of NaHCO3 and KHCO3 is more favorable, resulting in a greater ion reduction.
CO 2 + OH HCO 3
HCO 3   + OH   CO 3 2   +   H 2 O
In summary, the hot pot process and its associated reactions can explain the realization of good CO2 capture and Na+ reduction at a relatively high temperature, gauge pressure, gas flowrate, and KOH concentration of 50 °C, 2 bar, 776 mL/min, and 30 g/L, respectively. A high temperature ensures a high solubility of the produced K2CO3, and simultaneously, a high pressure maintains CO2 gas solubility in the solution, facilitating the reaction described in Equation (6) to proceed. Further, a moderate gas flowrate enhances ion removal because it increases the residence time. Moreover, a low KOH concentration favors the formation of HCO3, resulting in the formation of KHCO3 and NaHCO3. At 50 °C, both KHCO3 and NaHCO3 are soluble. However, owing to its high lattice energy, KHCO3 has higher solubility than NaHCO3 [29]. This causes the treated solution to be oversaturated with HCO3; therefore, KHCO3 starts to compete against NaHCO3, resulting in a high precipitation of NaHCO3. This observation was also confirmed by the high precipitation rate of solids when the mixture was collected from the reactor at 50 °C before the cooling step. The collected mixture was then cooled to allow the precipitation of the rest of the solids, whose characterization confirmed the presence of KHCO3 and NaHCO3. More details about the characterization of the solids are described in Section 4.

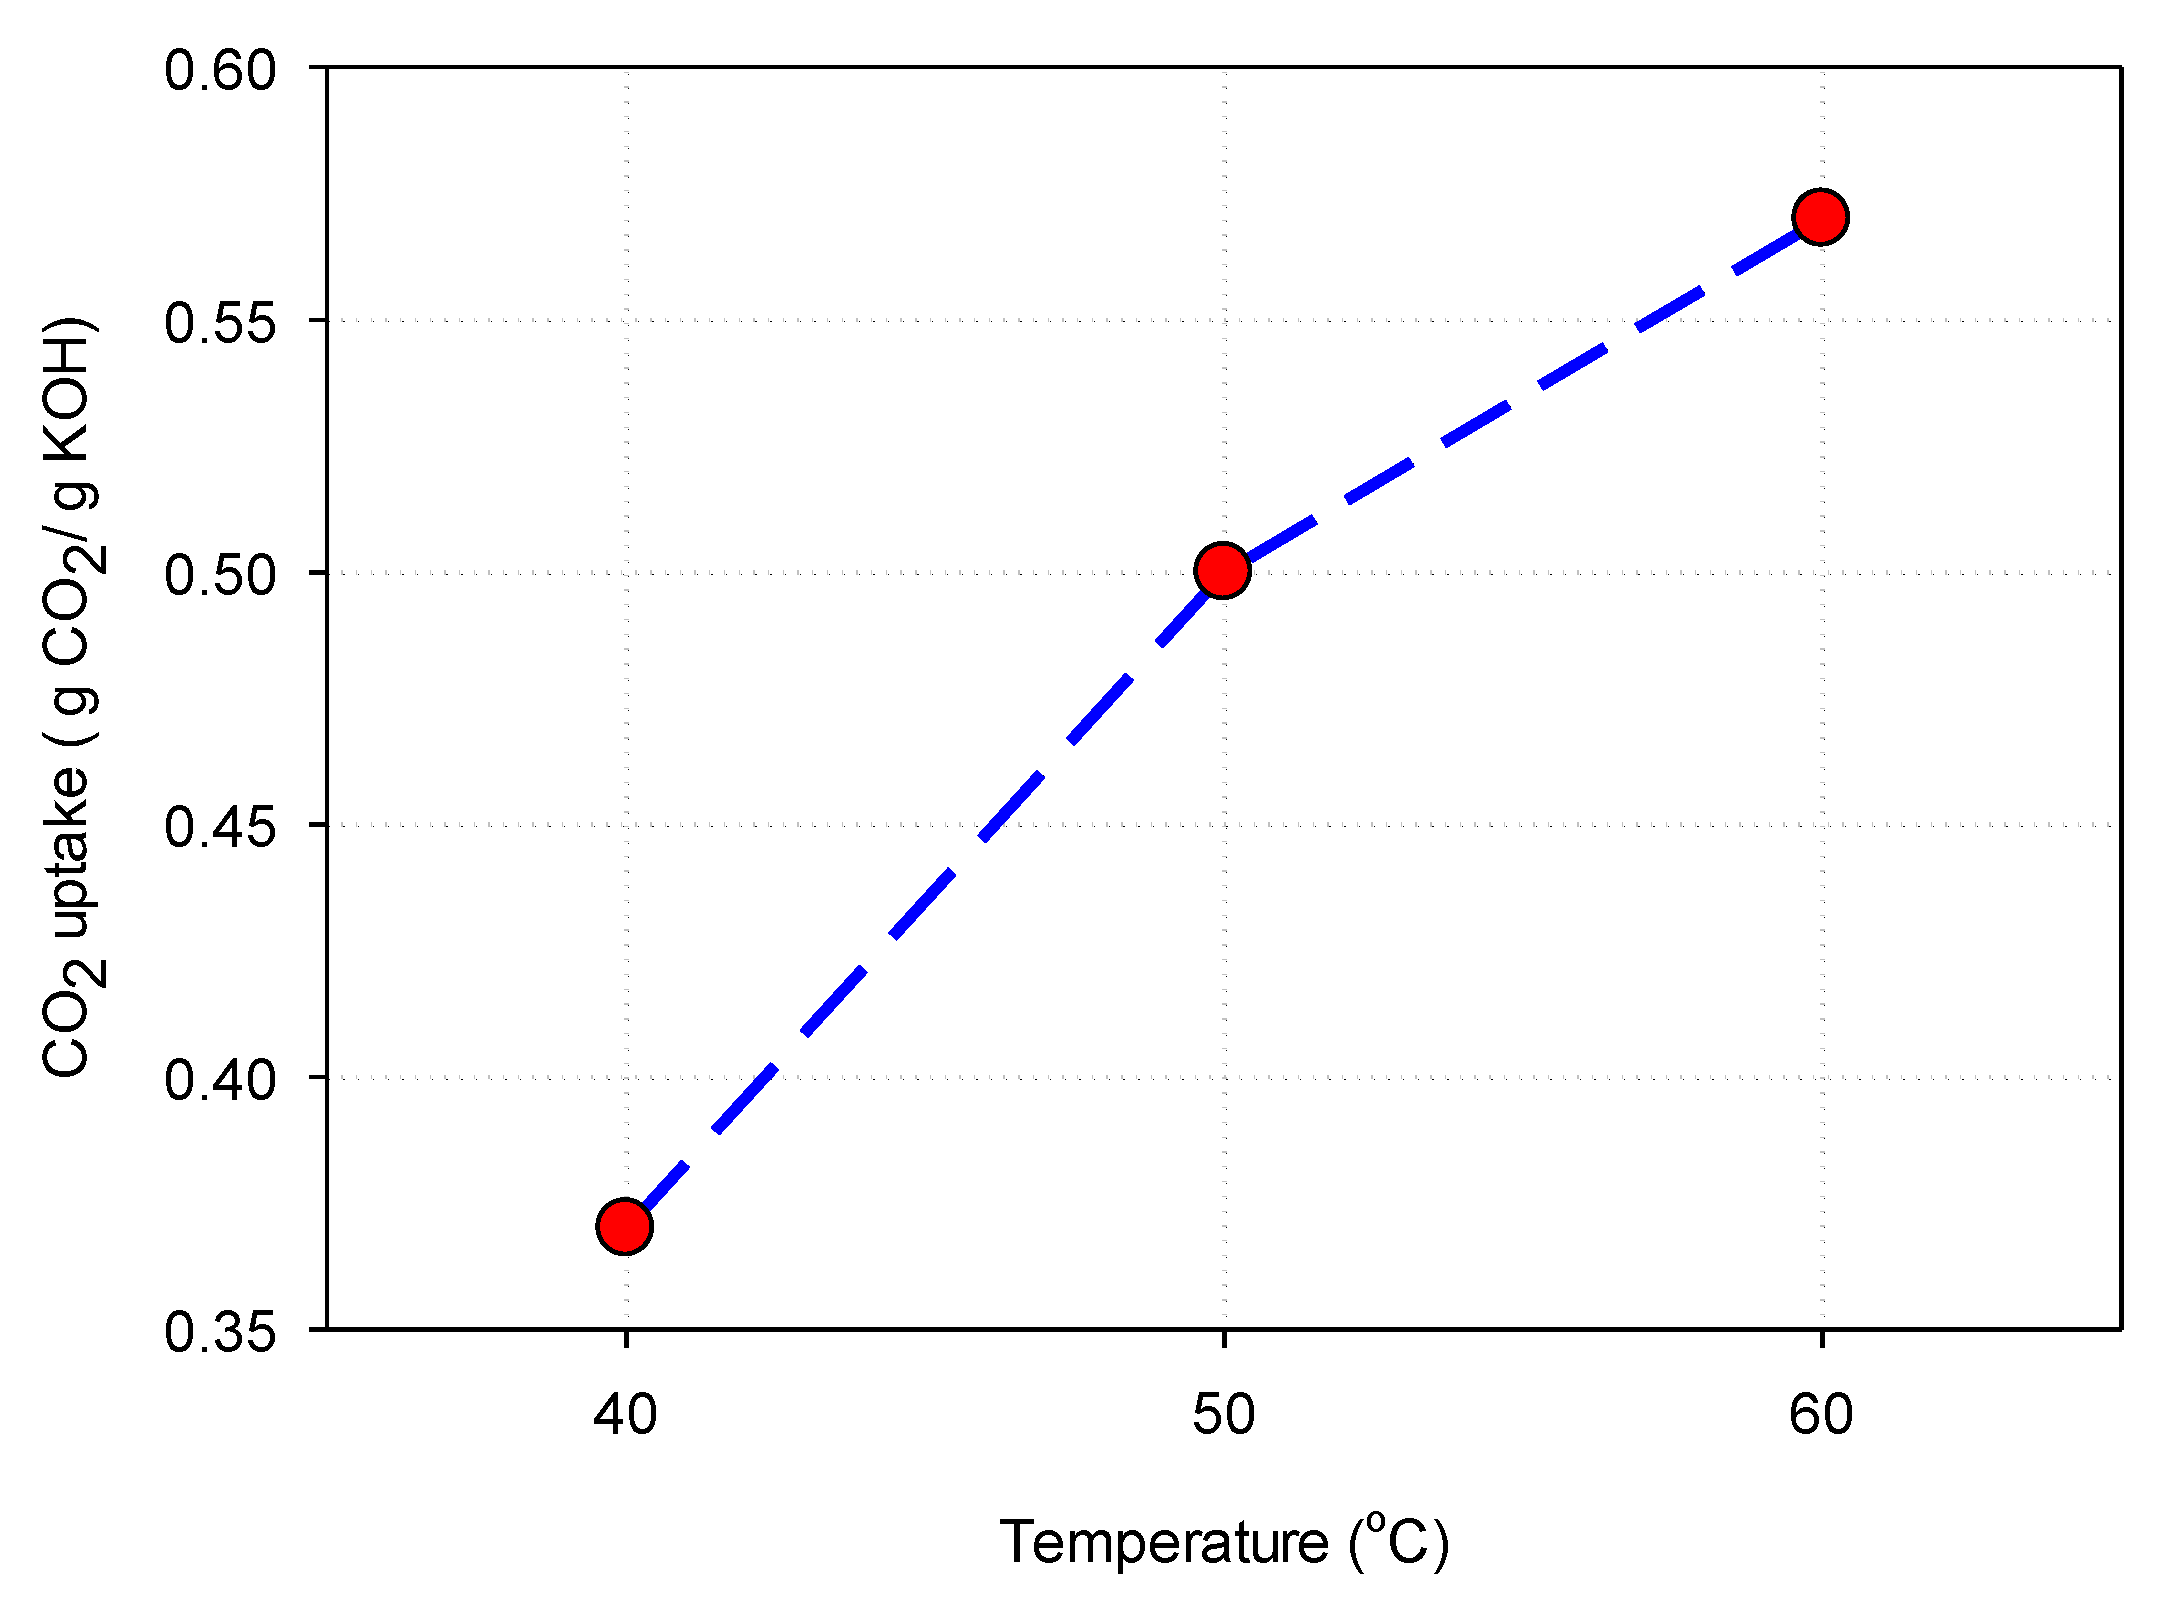
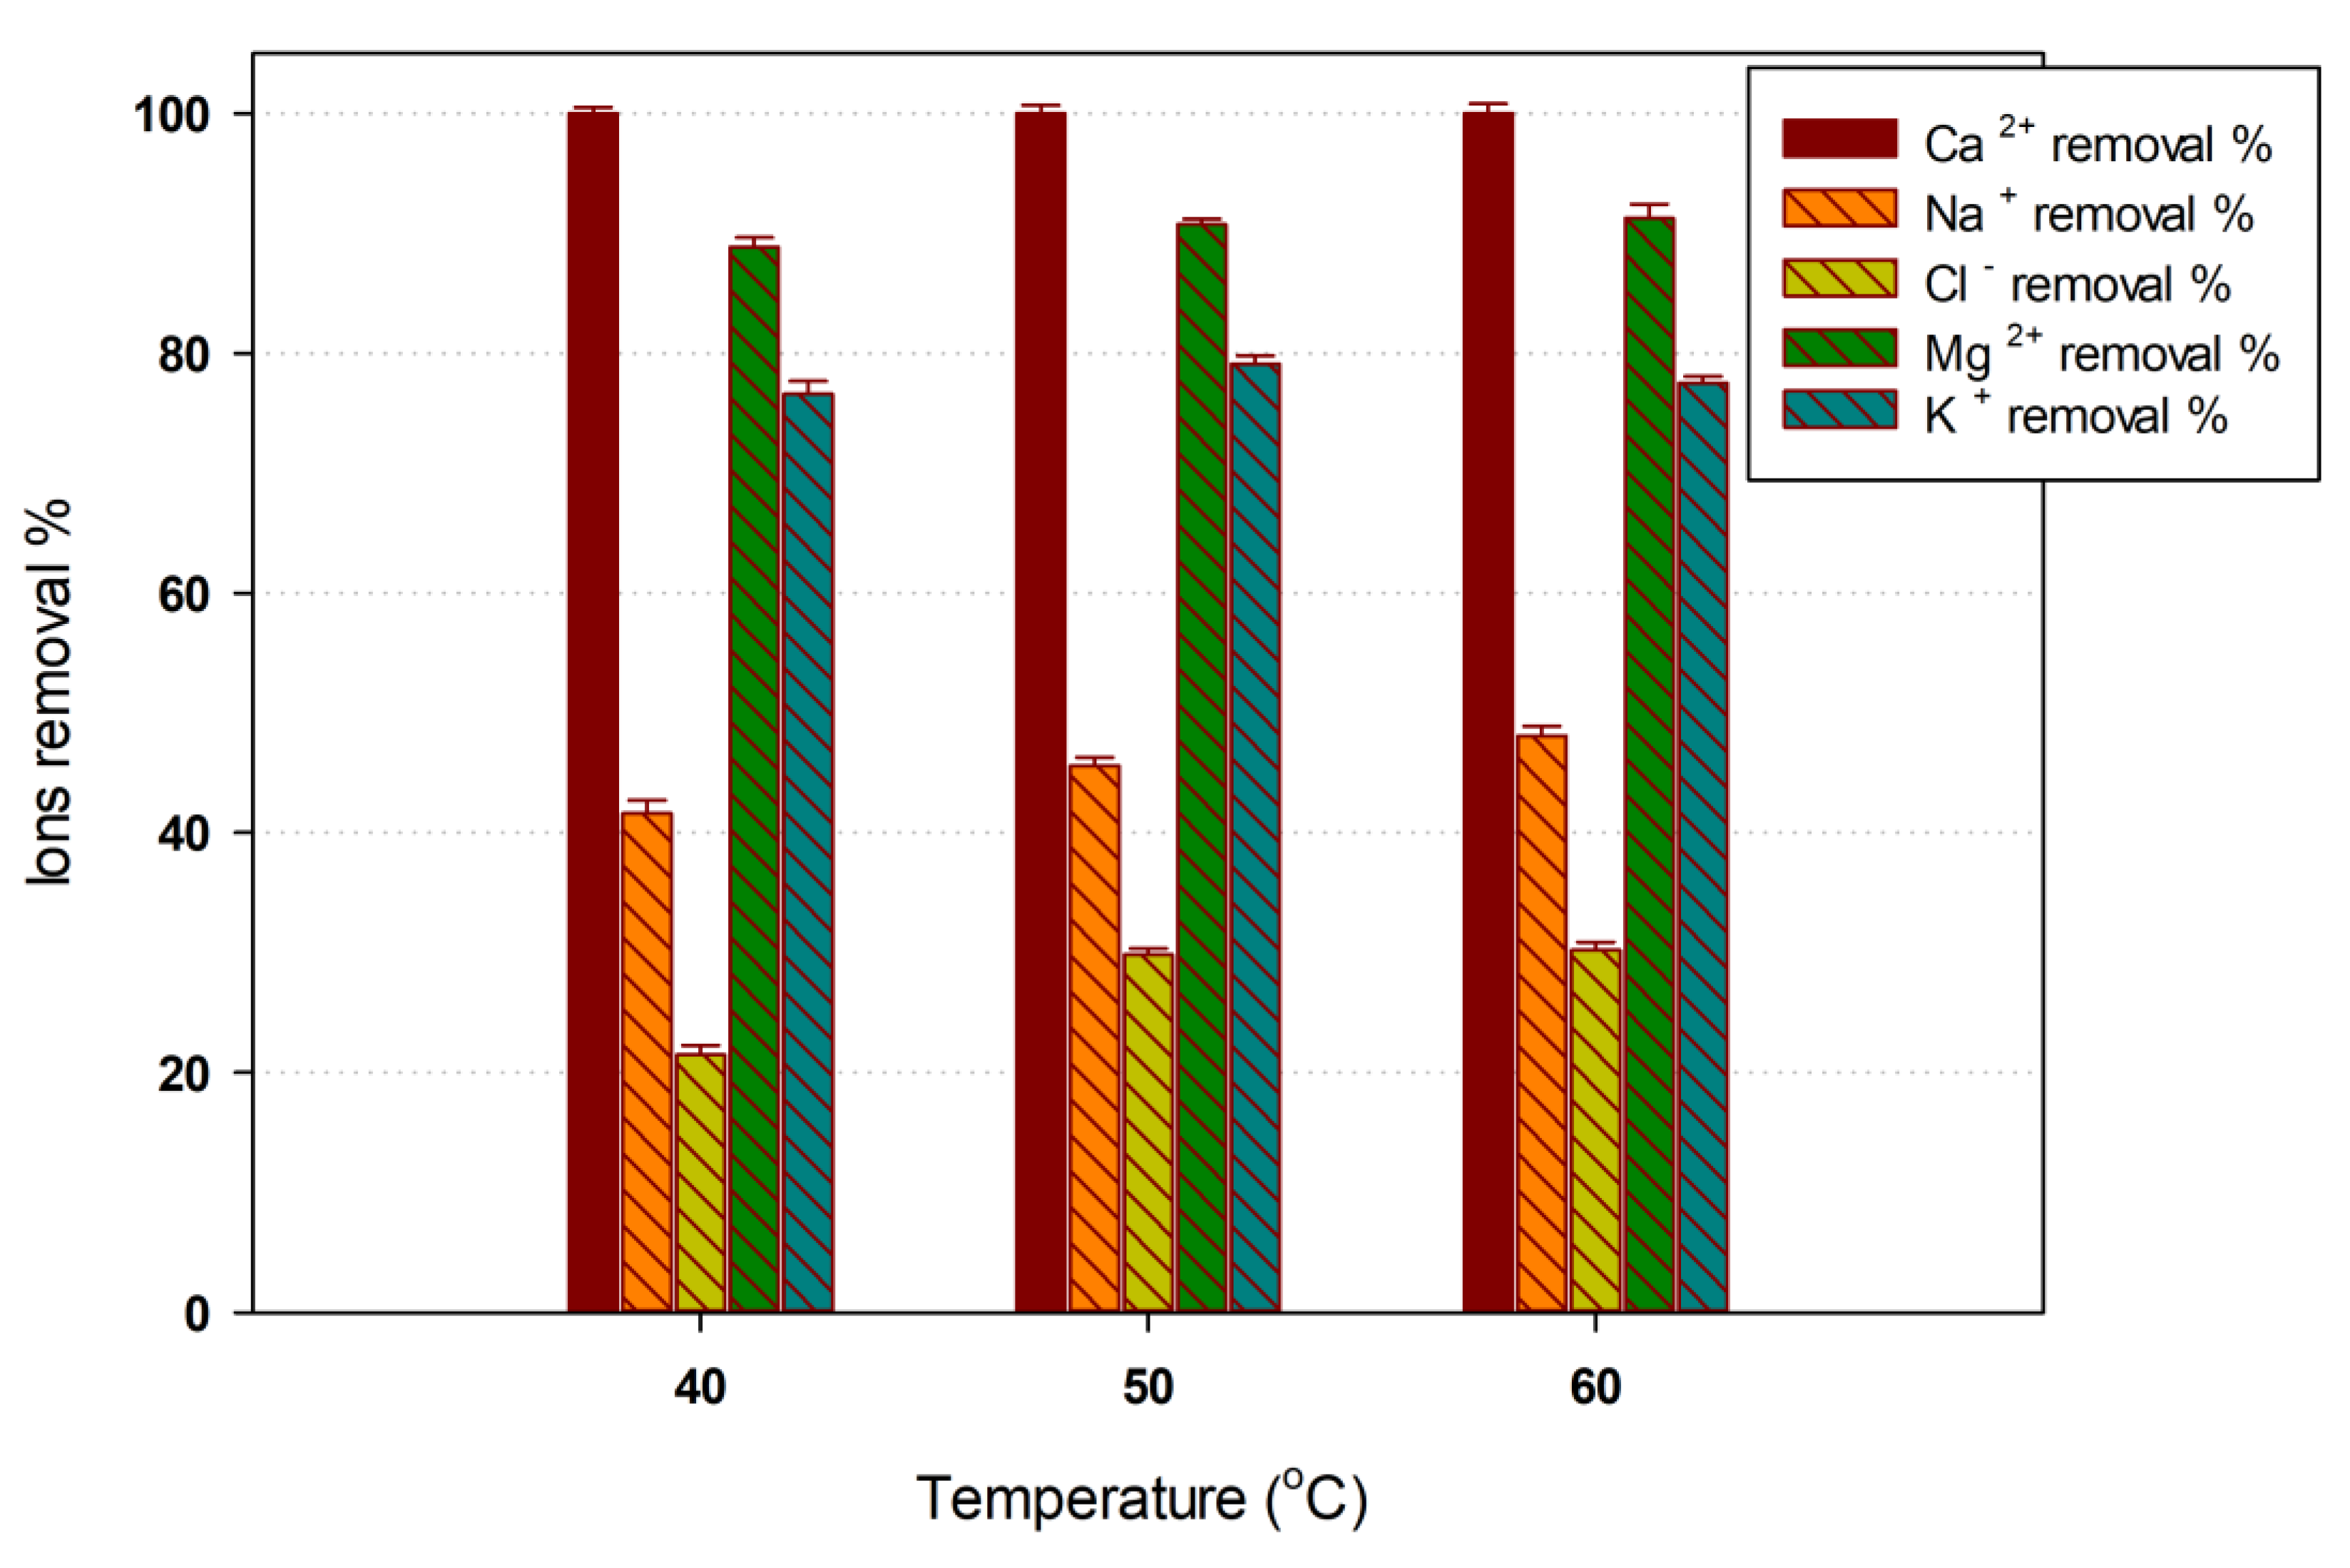
3.4.3. Evaluation of the Optimum Responses at 40 °C and 60 °C

Additional experimental runs were conducted at 40 °C and 60 °C, and the results were compared with those obtained at 50 °C. As shown in Figure 7, CO2 uptake reached 0.37 g CO2/g KOH at 40 °C, 0.50 g CO2/g KOH at 50 °C, and 0.57 g CO2/g KOH at 60 °C. These findings indicate an improvement in CO2 absorption owing to the same reasons given in Section 3.4.2, Equation (6). Figure 8 shows the average ion removal efficiency at different temperatures for three different experimental replicates. Almost the same reduction efficiencies of 91.2% and 100% for Mg2+ and Ca2+, respectively, were observed in the entire temperature range. At 40 °C, the Na+ and Cl reduction efficiencies were 40.8% and 21.47%, respectively. The removal of Na+ and Cl increased to nearly 45.6% and 29.84%, respectively, at 50 °C, and to 48.1% and 30.2%, respectively, at 60 °C. Notably, the K+ reduction efficiency reached up to 79% in the entire temperature range. Although KOH was used as the main alkaline material at high concentrations, a high reduction efficiency was still achieved in the treated brine, confirming the high efficiency of the reaction under the optimized conditions. Table 4 summarizes the main findings from the current research and compares them with recent literature studies for the combined process. It can be noticed that the temperature variation significantly affects the combined process in terms of metal solubility and CO2 capture efficiency. Table 4 also shows that a low temperature is preferred to achieve high CO2 capture and ion removal from reject brine. However, brine is usually discharged at a relatively high temperature range from 40°C to 50 °C. The findings of the current work reveal that CO2 and reject brine can be treated under high temperature, as presented in Table 2. This demonstrates the novelty of the KOH-based modified Solvay process.

4. Characterization of Solid Products Obtained under Optimized Conditions

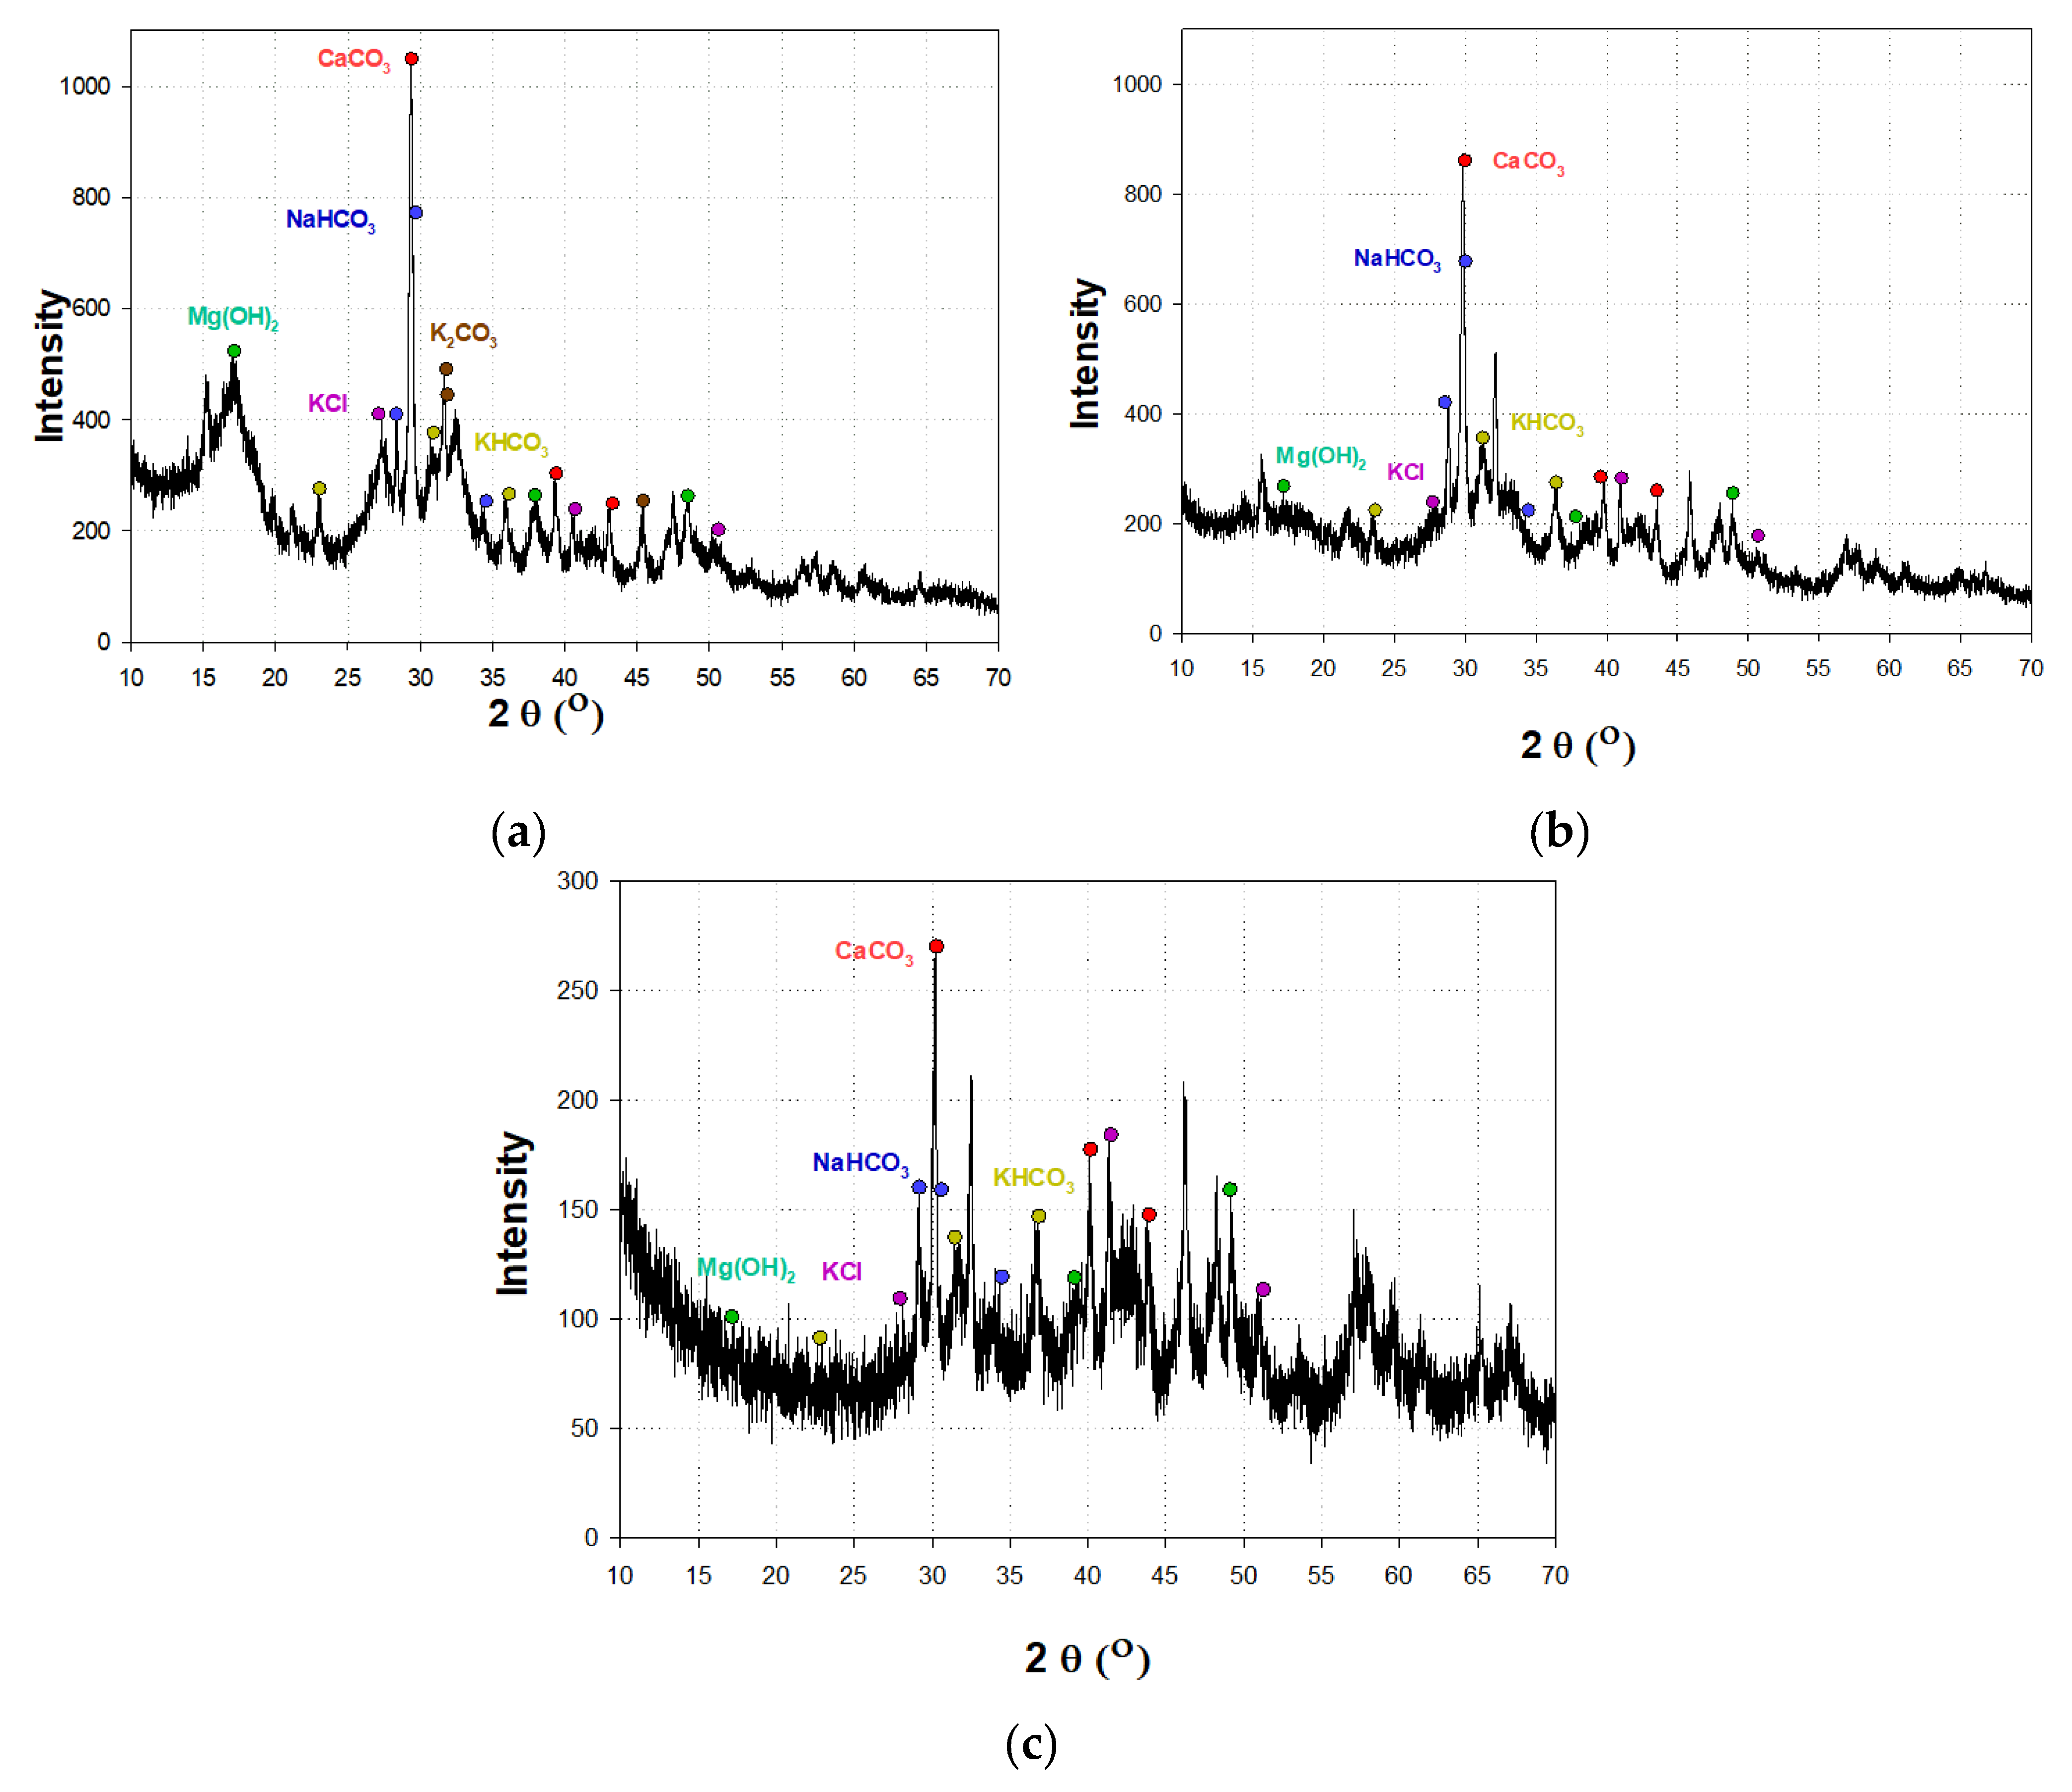
4.1. XRD Analysis of Solids Obtained at 40 °C, 50 °C, and 60 °C

The structural properties of the collected samples were examined using an X-ray diffractometer with Cu Kα radiation (λ = 1.54 Å). All measurements were performed using a tube current of 30 mA and a target voltage of 40 kV. The scanning range was set at 2θ values of 5–70° to cover all significant diffraction peaks at a scan speed of 2°/min. The XRD spectra of the three samples are shown in Figure 9. The XRD diffraction peaks of the collected solids were identified according to the theoretical intensity of the three most intense peaks for the mineral in a pure state [30,31]. The characterization of the collected solids confirmed the recovery of brine salts in the form of CaCO3, KCl, KHCO3, K2CO3, Mg(OH)2, and NaHCO3. A clear change in the structural properties was observed when the reaction temperature was increased. The reaction conditions significantly change the intensity of the XRD peaks of the collected solids. The produced solids have many applications in various industrial fields. NaHCO3 can be used as a pH buffering agent [4,32]. KCl is used in the production of crop fertilizers (95% of the fertilizers in the USA are supplied in the form of KCl [33]) and has medical applications [34]. KCl can also be reused in the production of KOH through the electrolysis process [35], according to Equation (9), which confirms the sustainability of this promising alkaline (KOH) in the modified Solvay process. K2CO3 and/or bicarbonate KHCO3 are largely used as cleaning and emulsifying agents [36].
2 KCl + 2 H2O → 2 KOH + Cl2 + H2

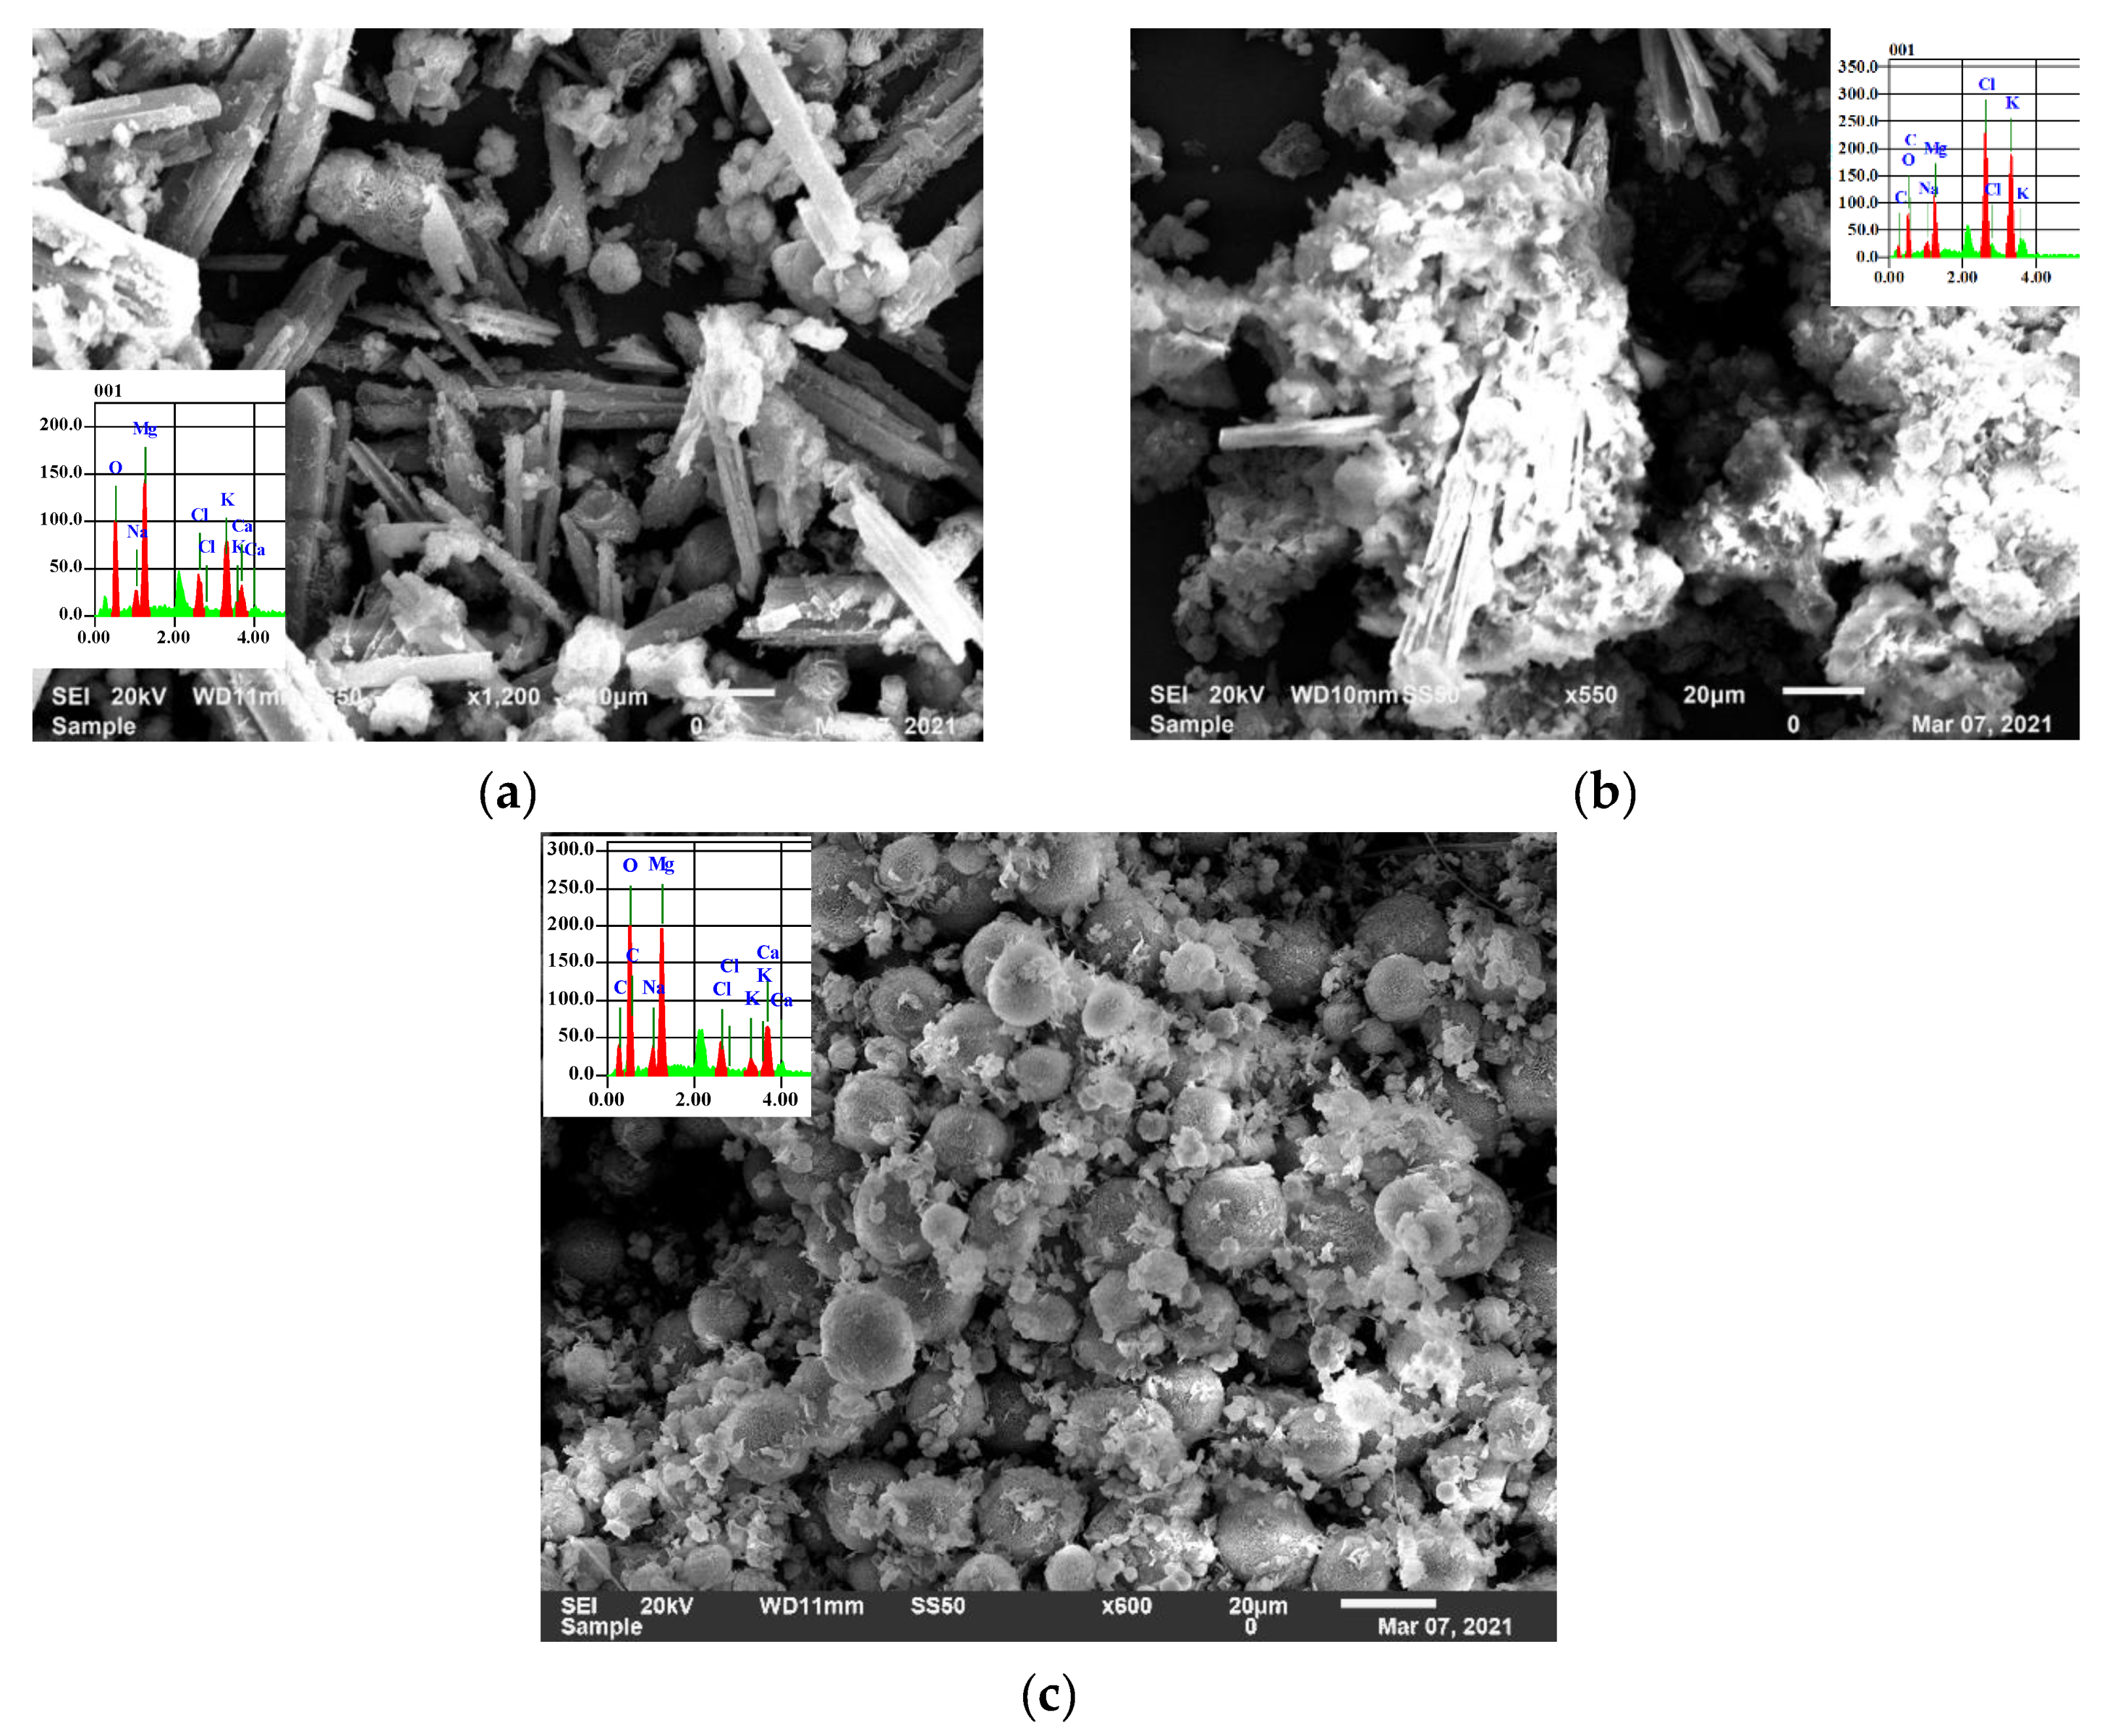
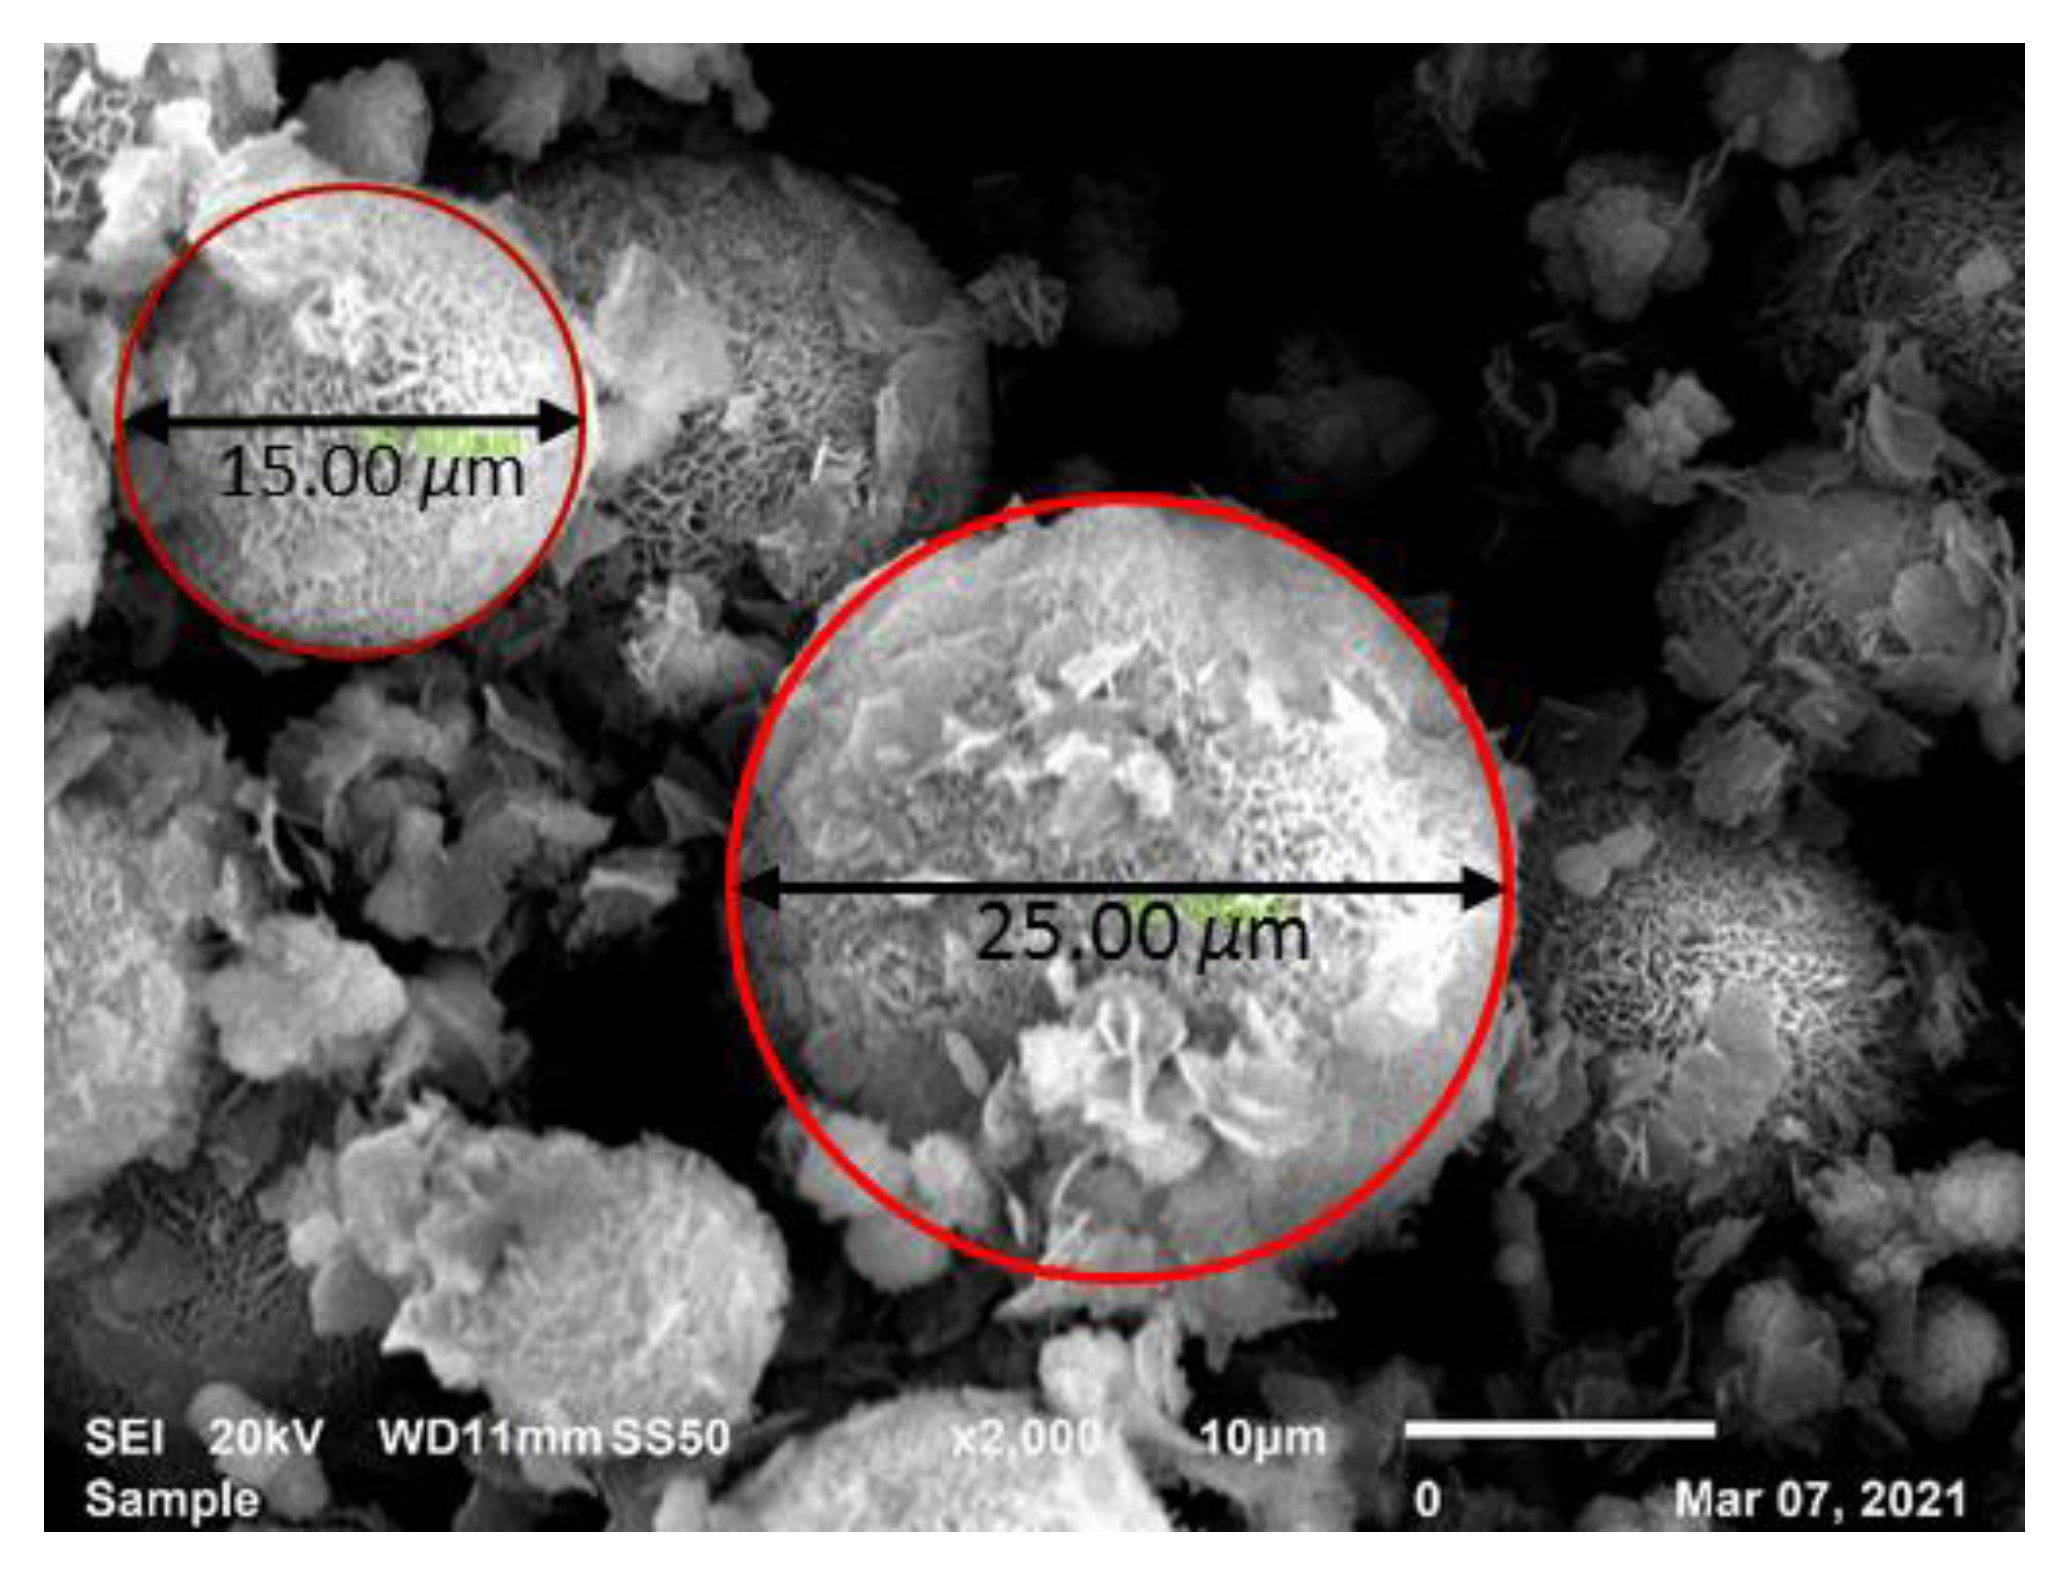
4.2. SEM Analysis of Solids Obtained at 40 °C, 50 °C, and 60 °C

The surface morphology, texture, and shape of the collected solid samples were characterized using SEM in three different areas. Before the SEM analysis, the samples were coated with a thin gold film, and then average energy dispersive X-ray spectroscopy (EDS) analysis was performed to detect the main elements in the sample. The SEM micrographs of the cross-sections of the samples obtained under the optimum conditions exhibited clear morphological structures (Figure 10). A specific morphological structure was observed at each temperature; for example, under the optimum conditions (KOH concentration = 30 g/L, gauge pressure = 2 bar, and gas flowrate = 776 mL/min) and 40 °C, elongated rod agglomerates with spheroidal particles were visible (Figure 10a). The elongated rods correspond to NaHCO3 crystals [37]. When the reaction temperature was increased up to 50 °C (Figure 10b), a higher number of spheroidal particles and a lower concentration of elongated rods were detected in the general structure. Figure 10c shows the morphology of the samples at 60 °C. In this figure, the elongated rods completely disappeared; instead, uniform spheroidal particles and smaller shell-shaped crystals were detected. The production of more KHCO3 and NaHCO3 can explain the change in the morphology of the samples from elongated rods to spheroidal particles [38,39]. These findings were also confirmed by the average particle size, which reached a minimum value of 15–25 µm at a high temperature of 60 °C (Figure 11). EDS analysis was also conducted, which confirmed the results obtained using XRD analysis and showed that the main elements in the collected solids were Na, Ca, Mg, C, O, K, and Cl (Figure 10a–c).

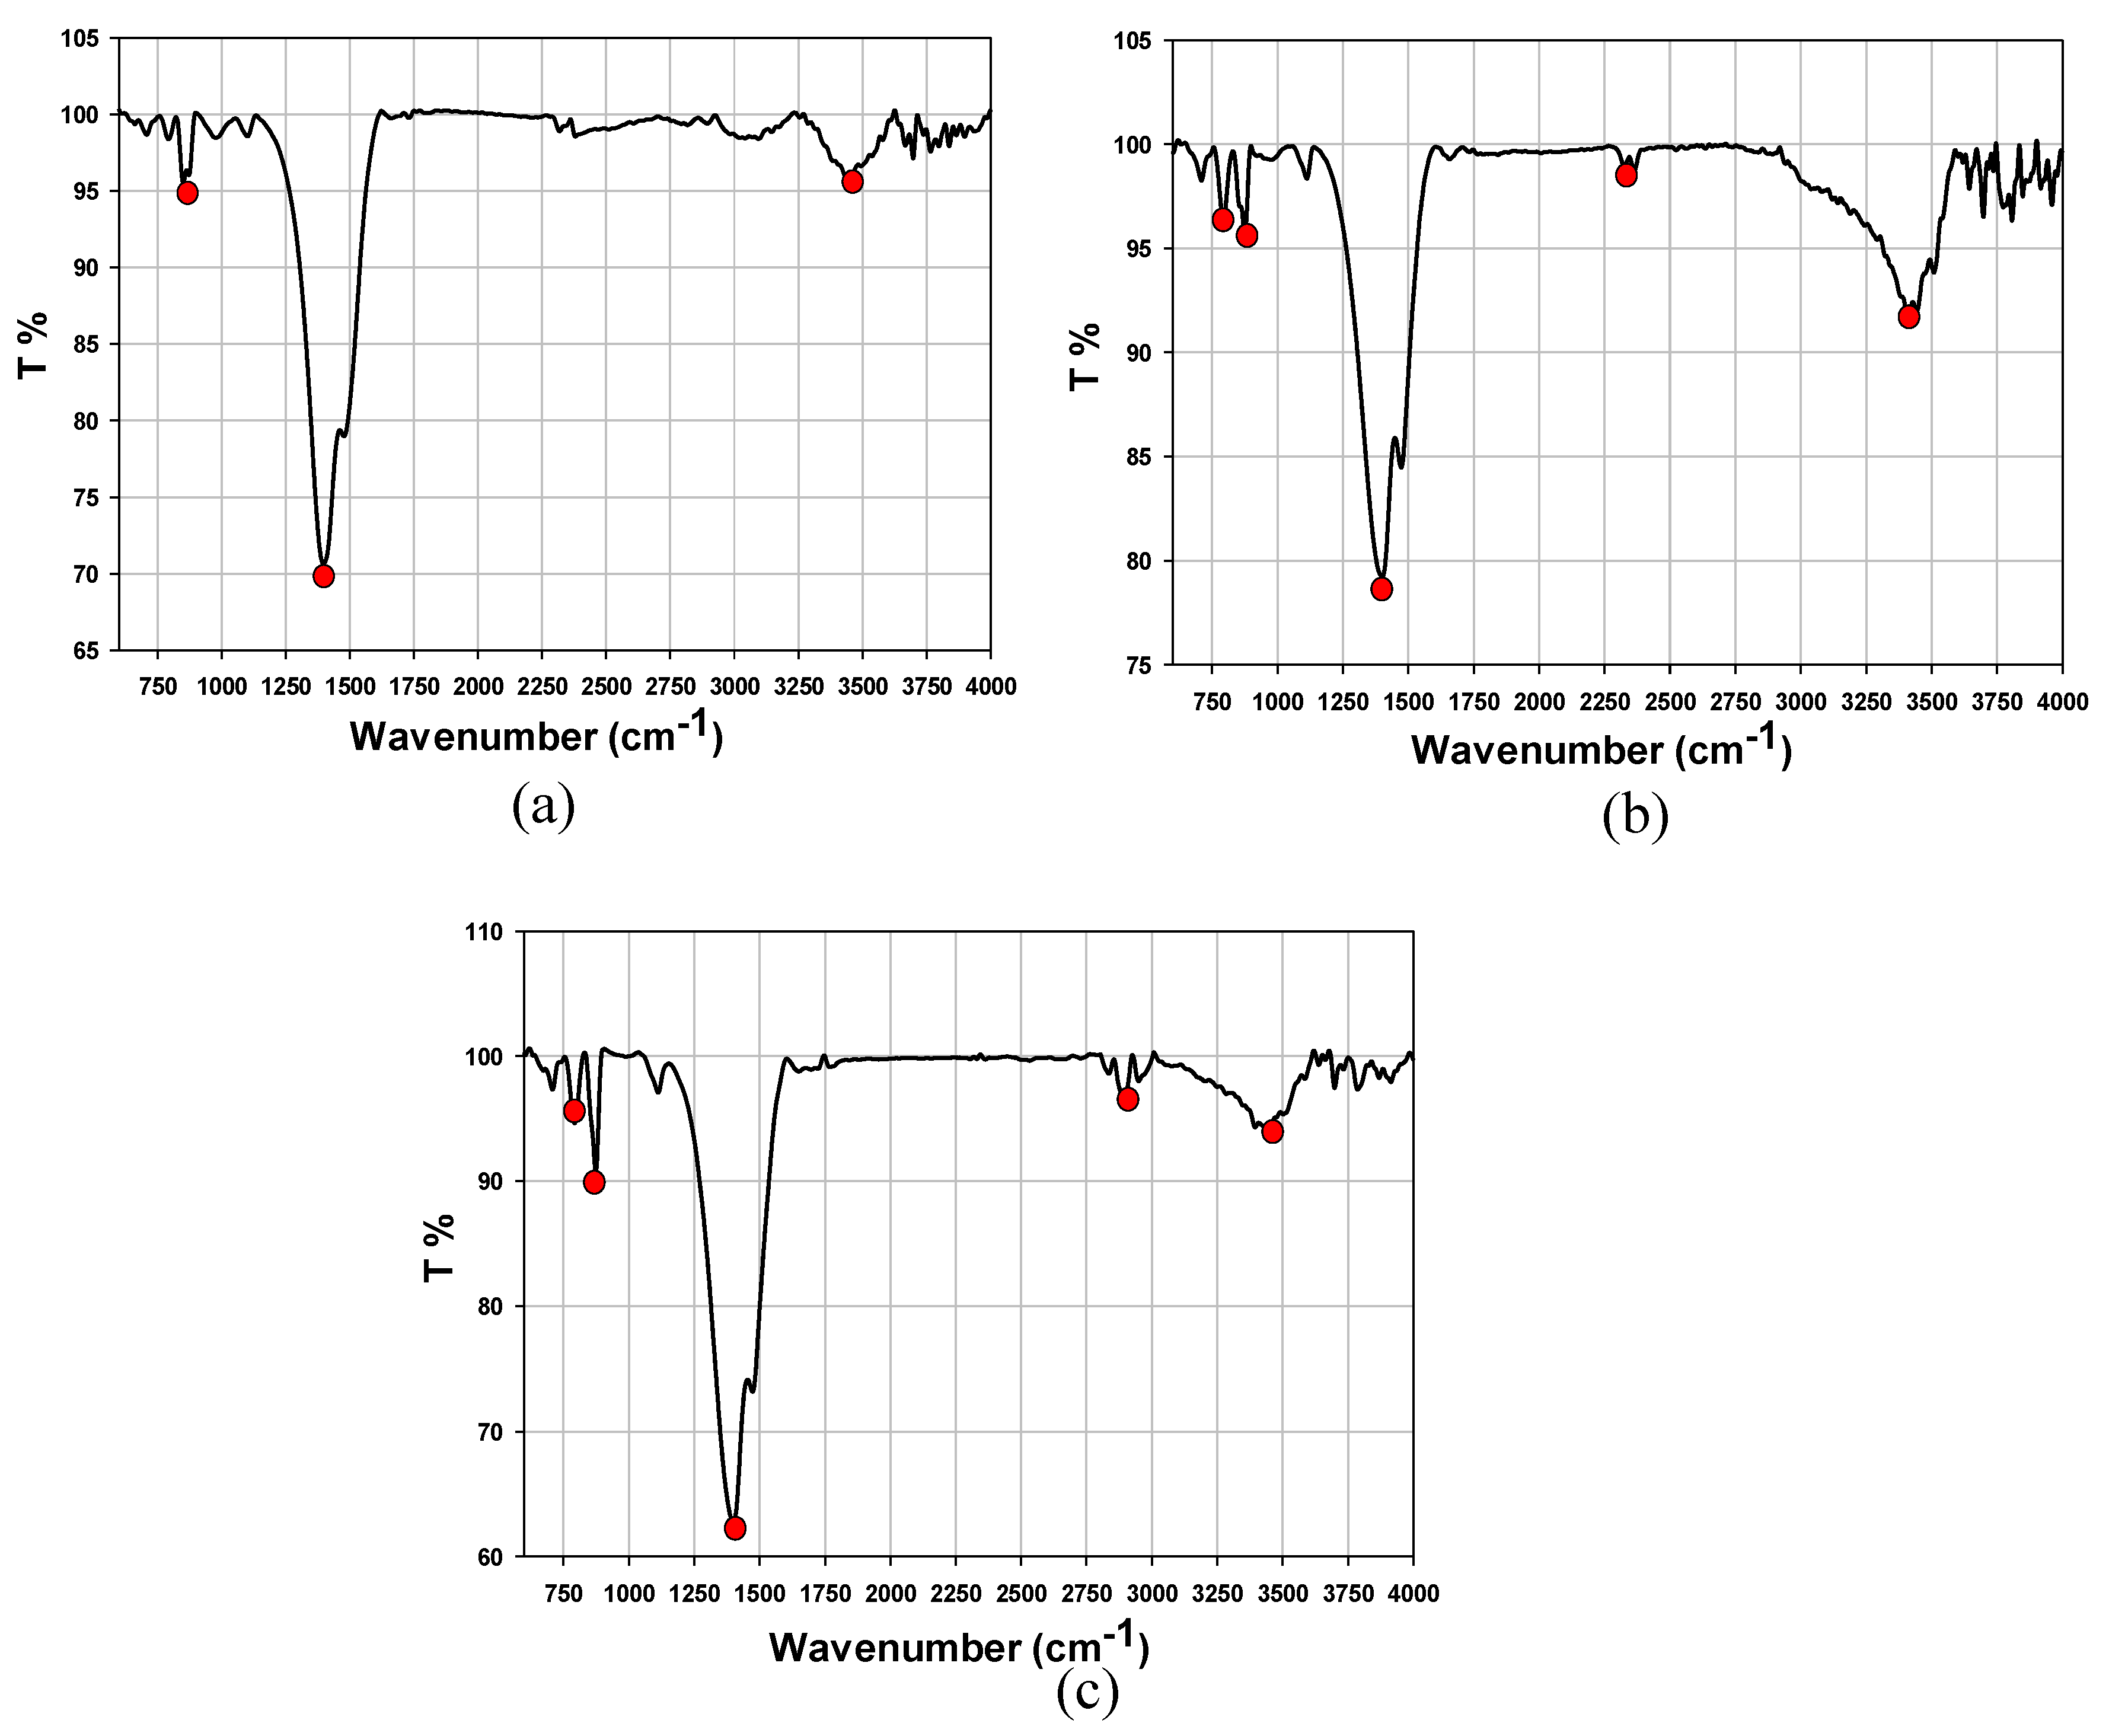
4.3. FTIR Spectroscopy Analysis of Solids Obtained at 40 °C, 50 °C, and 60 °C

The collected solid samples were examined using FTIR analysis by employing an IRTrace-100 FTIR spectrophotometer (Shimadzu, Kyoto, Japan) to investigate the presence of functional groups. The spectra were recorded in a wavenumber range of 500–4000 cm−1 using a spectral resolution of 4 cm−1 and 34 scans. Figure 12 shows the spectra of the solids obtained at 40 °C, 50 °C, and 60 °C. Many absorption bands with a clear difference were observed between the samples. In all the spectra, a band appearing at 3250–3750 cm−1 can be attributed to the OH groups and a peak at 2750–3000 cm−1 corresponded to the C–H stretching. An absorption band attributed to CO 3 2 was clearly detected at 1250–1750 cm1.

5. Conclusions

The optimization of the KOH-based modified Solvay process was performed under different operating conditions to obtain the maximum CO2 capture and ion recovery from reject brine at a relatively high temperature of 50 °C. An RSM-based CCD approach using Minitab 19.0 was implemented to predict and optimize the effects of four important factors on the responses, namely, KOH concentration (30–110 g/L), gauge pressure (1–3 bar), temperature (10 °C–50 °C), and CO2 gas flowrate (400–1600 mL/min). The responses of 31 experimental runs were properly represented using 3D surface response plots. A response optimizer was used to predict the optimum conditions to achieve the maximum responses by holding the temperature at 50 °C. The predicted optimum conditions were obtained at a gauge pressure, gas flowrate, and KOH concentration of 2 bar, 776 mL/min, and 30 g/L, respectively. The predicted responses under these conditions were experimentally validated, and the results showed a good agreement with the predicted values. The experimental results showed that under the optimized conditions and at 50 °C, a maximum CO2 uptake of ~ 0.50 g CO2/g KOH and maximum reduction efficiencies of Na+, Cl, Ca2+, and Mg2+ of 45.6%, 29.8%, 100%, and 91.2%, respectively, were achieved. Under these operating conditions, the reaction rate was relatively high, and a new reaction occurred. This can be explained by the hot pot process of K2CO3, during which the pressurized CO2 reacts with soluble K2CO3 at high temperatures to form KHCO3. The solid products were characterized using SEM, XRD, and FTIR analysis. All the results confirmed the production of valuable products with diverse industrial applications, such as NaHCO3, KHCO3, K2CO3, and KCl.

Author Contributions

Conceptualization, M.H.E.-N. and A.H.A.-M.; methodology, A.A-H.I.M. and A.F.M.; software, M.A.; validation, M.H.E.-N., A.F.M. and A.A-H.I.M.; formal analysis, A.A-H.I.M.; investigation, A.F.M.; resources, A.H.A.-M.; writing—original draft preparation, A.A-H.I.M.; writing—review and editing, M.H.E.-N. and A.F.M.; visualization, M.H.A.-M.; supervision, A.H.A.-M. All authors have read and agreed to the published version of the manuscript.

Funding

This research received no external funding.

Conflicts of Interest

The authors declare no conflict of interest.

References

  1. Mustafa, J.; Mourad, A.A-H.I.; Al-Marzouqi, A.H.; El-Naas, M.H. Simultaneous treatment of reject brine and capture of carbon dioxide: A comprehensive review. Desalination 2020, 483, 114386. [Google Scholar] [CrossRef]
  2. Mohammad, A.F.; El-Naas, M.H.; Suleiman, M.I.; Al Musharfy, M. Optimization of a Solvay-Based Approach for CO2 Capture. Int. J. Chem. Eng. Appl. 2016, 7, 230–234. [Google Scholar] [CrossRef] [Green Version]
  3. Palitsakun, S.; Seubsai, A.; Sudsakorn, K. CO2 capture in the form of thermally stable solid compounds using ammoniated brine. Songklanakarin J. Sci. Technol. 2019, 41, 984–991. [Google Scholar]
  4. El-Naas, M.H.; Mohammad, A.F.; Suleiman, M.I.; Al Musharfy, M.; Al-Marzouqi, A.H. A new process for the capture of CO2 and reduction of water salinity. Desalination 2017, 411, 69–75. [Google Scholar] [CrossRef]
  5. El-Naas, M.H. Process for Capture of Carbon Dioxide and Desalination. U.S. Patent 10,118,843, 6 November 2018. [Google Scholar]
  6. Dindi, A.; Quang, D.V.; AlNashef, I.; Abu-Zahra, M.R.M. A process for combined CO2 utilization and treatment of desalination reject brine. Desalination 2018, 442, 62–74. [Google Scholar] [CrossRef]
  7. Shim, J.-G.; Lee, D.W.; Lee, J.H.; Kwak, N.-S. Experimental study on capture of carbon dioxide and production of sodium bicarbonate from sodium hydroxide. Environ. Eng. Res. 2016, 21, 297–303. [Google Scholar] [CrossRef]
  8. Ibrahim, M.H.; El-Naas, M.H.; Zevenhoven, R.; Al-Sobhi, S.A. Enhanced CO2 capture through reaction with steel-making dust in high salinity water. Int. J. Greenh. Gas Control 2019, 91, 102819. [Google Scholar] [CrossRef]
  9. Mourad, A.A-H.I.; Mohammad, A.F.; Altarawneh, M.; Al-Marzouqi, A.H.; El-Naas, M.H.; Al-Marzouqi, M.H. Effects of potassium hydroxide and aluminum oxide on the performance of a modified solvay process for CO2 capture: A comparative study. Int. J. Energy Res. 2021, 45, 13952–13964. [Google Scholar] [CrossRef]
  10. Gambhir, A.; Tavoni, M. Direct air carbon capture and sequestration: How it works and how it could contribute to climate-change mitigation. One Earth 2019, 1, 405–409. [Google Scholar] [CrossRef]
  11. Bandi, A.; Specht, M.; Weimer, T.; Schaber, K. CO2 recycling for hydrogen storage and transportation—Electrochemical CO2 removal and fixation. Energy Convers. Manag. 1995, 36, 899–902. [Google Scholar] [CrossRef]
  12. Lendzion-Bieluń, Z.; Czekajło, Ł.; Sibera, D.; Moszyński, D.; Sreńscek-Nazzal, J.; Morawski, A.W.; Wrobel, R.J.; Michalkiewicz, B.; Arabczyk, W.; Narkiewicz, U. Surface characteristics of KOH-treated commercial carbons applied for CO2 adsorption. Adsorpt. Sci. Technol. 2018, 36, 478–492. [Google Scholar] [CrossRef] [Green Version]
  13. Keith, D.W.; Holmes, G.; Angelo, D.S.; Heidel, K. A process for capturing CO2 from the atmosphere. Joule 2018, 2, 1573–1594. [Google Scholar] [CrossRef] [Green Version]
  14. Lombardia, L.; Corti, A.; Carnevale, E.; Baciocchi, R.; Zingaretti, D. Carbon dioxide removal and capture for landfill gas up-grading. Energy Procedia 2011, 4, 465–472. [Google Scholar] [CrossRef] [Green Version]
  15. Mohammad, N.K.; Ghaemi, A.; Tahvildari, K. Hydroxide modified activated alumina as an adsorbent for CO2 adsorption: Experimental and modeling. Int. J. Greenh. Gas Control 2019, 88, 24–37. [Google Scholar] [CrossRef]
  16. Liu, Q.; Maroto-Valer, M.M. Studies of pH buffer systems to promote carbonate formation for CO2 sequestration in brines. Fuel Process. Technol. 2012, 98, 6–13. [Google Scholar] [CrossRef]
  17. El-Naas, M.H. System for contacting gases and liquids. U.S. Patent 9724639B2, 8 August 2017. [Google Scholar]
  18. El-Naas, M.H.; Mohammad, A.F.; Suleiman, M.I.; Al Musharfy, M.; Al-Marzouqi, A.H. Evaluation of a novel gas-liquid contactor/reactor system for natural gas applications. J. Nat. Gas Sci. Eng. 2017, 39, 133–142. [Google Scholar] [CrossRef]
  19. Mohammad, A.F.; Mourad, A.A-H.I.; Mustafa, J.; Al-Marzouqi, A.H.; El-Naas, M.H.; Al-Marzouqi, M.H.; Alnaimat, F.; Suleiman, M.I.; Al Musharfy, M.; Firmansyah, T. Computational fluid dynamics simulation of an Inert Particles Spouted Bed Reactor (IPSBR) system. Int. J. Chem. React. Eng. 2020, 1. [Google Scholar] [CrossRef]
  20. Mohammad, A.; Mourad, A.A-H.I.; Al-Marzouqi, A.H.; El-Naas, M.H.; Van der Bruggen, B.; Al-Marzouqi, M.; Alnaimat, F.; Suleiman, M.; Al Musharfy, M. CFD and statistical approach to optimize the average air velocity and air volume fraction in an inert-particles spouted-bed reactor (IPSBR) system. Heliyon 2021, 7, e06369. [Google Scholar] [CrossRef]
  21. Mohammad, A.F.; Mourad, A.A-H.I.; Mustafa, J.; Al-Marzouqi, A.H.; El-Naas, M.H.; Al-Marzouqi, M.H.; Van der Bruggen, B.; Suleiman, M.I.; Al Musharfy, M. A CFD Investigation on the Effect of IPSBR Operational Conditions on Liquid Phase Hydrodynamics. In Proceedings of the 2021 6th International Conference on Renewable Energy: Generation and Applications (ICREGA), Al Ain, United Arab Emirates, 2–4 February 2021; pp. 153–157. [Google Scholar]
  22. Mourad, A.A-H.I.; Ghasem, N.M.; Alraeesi, A.Y. Modelling and simulation of hydrogen production via water gas shift membrane reactor. Int. J. Chem. Eng. Appl. 2018, 9, 112–118. [Google Scholar] [CrossRef]
  23. Kodama, S.; Nishimoto, T.; Yamamoto, N.; Yogo, K.; Yamada, K. Development of a new pH-swing CO2 mineralization process with a recyclable reaction solution. Energy 2008, 33, 776–784. [Google Scholar] [CrossRef]
  24. Fahim, M.A.; Alsahhaf, T.A.; Elkilani, A. (Eds.) Chapter 17—Environmental Aspects in Refining. In Fundamentals of Petroleum Refining; Elsevier: Amsterdam, The Netherlands, 2010; pp. 423–455. [Google Scholar]
  25. Feron, P. Absorption-Based Post-Combustion Capture of Carbon Dioxide; Woodhead Publishing: Oxford, UK, 2016. [Google Scholar]
  26. Ayittey, F.K.; Obek, C.A.; Saptoro, A.; Perumal, K.; Wong, M.K. Process modifications for a hot potassium carbonate-based CO2 capture system: A comparative study. Greenh. Gases Sci. Technol. 2020, 10, 130–146. [Google Scholar] [CrossRef]
  27. Roine, A. HSC—Software Ver. 3.0 for Thermodynamic Calculations. In Proceedings of the International Symposium on Computer Software in Chemical and Extractive Metallurgy, Montreal, QC, Canada, 28–31 August 1989; Thompson, W.T., Ajersch, F., Eriksson, G., Eds.; Pergamon: Oxford, UK, 1989; pp. 15–29. [Google Scholar]
  28. Salmón, I.R.; Cambier, N.; Luis, P. CO2 capture by alkaline solution for carbonate production: A Comparison between a packed column and a membrane contactor. Appl. Sci. 2018, 8, 996. [Google Scholar] [CrossRef] [Green Version]
  29. Engel, D.C.; Versteeg, G.F.; van Swaaij, W.P.M. Solubility of hydrogen in aqueous solutions of sodium and potassium bicarbonate from 293 to 333 K. J. Chem. Eng. Data 1996, 41, 546–550. [Google Scholar] [CrossRef] [Green Version]
  30. Mineralogy Database. Available online: http://www.webmineral.com/ (accessed on 2 October 2017).
  31. Hluchy, M.M. The value of teaching X-ray techniques and clay mineralogy to undergraduates. J. Geosci. Educ. 1999, 47, 236–240. [Google Scholar] [CrossRef]
  32. Lee, Y.-H.; Kim, D.-W.; Shin, S.-I.; Oh, S.-G. Preparation of Au colloids by polyol process using NaHCO3 as a buffering agent. Mater. Chem. Phys. 2006, 100, 85–91. [Google Scholar] [CrossRef]
  33. Stewart, J.A. Potassium sources, use, and potential. In Potassium in Agriculture; American Society of Agronomy (USA): Atlanta, GA, USA, 1985; pp. 83–98. [Google Scholar]
  34. Smith, S.R.; Klotman, P.E.; Svetkey, L.P. Potassium chloride lowers blood pressure and causes natriuresis in older patients with hypertension. J. Am. Soc. Nephrol. 1992, 2, 1302–1309. [Google Scholar] [CrossRef] [PubMed]
  35. Curlin, L.C.; Bommaraju, T.V.; Hansson, C.B. Alkali and chlorine products, chlorine and sodium hydroxide. Kirk-Othmer Encycl. Chem. Technol. 2000. [Google Scholar] [CrossRef]
  36. Mahmoudkhani, M.; Keith, D.W. Low-energy sodium hydroxide recovery for CO2 capture from atmospheric air—Thermodynamic analysis. Int. J. Greenh. Gas Control 2009, 3, 376–384. [Google Scholar] [CrossRef]
  37. McVeigh, P.; Sottocornola, M.; Foley, N.; Leahy, P.; Kiely, G. Meteorological and functional response partitioning to explain interannual variability of CO2 exchange at an Irish Atlantic blanket bog. Agric. For. Meteorol. 2014, 194, 8–19. [Google Scholar] [CrossRef]
  38. Tao, L.; Tanzer, J.M.; MacAlister, T.J. Bicarbonate and potassium regulation of the shape of Streptococcus mutans NCTC 10449S. J. Bacteriol. 1987, 169, 2543–2547. [Google Scholar] [CrossRef] [Green Version]
  39. Gómez, D.A.; Coello, J.; Maspoch, S. The influence of particle size on the intensity and reproducibility of Raman spectra of compacted samples. Vib. Spectrosc. 2019, 100, 48–56. [Google Scholar] [CrossRef]
Figure 1. A schematic diagram of the inert-particle spouted bed reactor system (IPSBR) [9].
Sustainability 13 10200 g001
Figure 2. Response surface plots of the effect of (a) pressure and KOH concentration, (b) gas flowrate and temperature, and (c) temperature and pressure on CO2 uptake.
Sustainability 13 10200 g002
Figure 3. Surface response plots of the effect of (a) gas flowrate and temperature, and (b) temperature and KOH concentration, on Na+ reduction in reject brine.
Sustainability 13 10200 g003
Figure 4. Surface response plots of the effect of (a) gas flowrate and temperature, and (b) gas flowrate and KOH concentration, on Cl reduction in reject brine.
Sustainability 13 10200 g004
Figure 5. Surface response plots for the impact of (a) temperature and pressure on Ca2+ reduction, and (b) gas flowrate and KOH concentration, on Mg2+ reduction in reject brine.
Sustainability 13 10200 g005
Figure 6. Response optimization plot.
Sustainability 13 10200 g006
Figure 7. Effect of high temperature on the CO2 uptake at a gauge pressure, KOH concentration, and gas flowrate of 2 bar, 30 g/L, and 776 mL/min, respectively.
Sustainability 13 10200 g007
Figure 8. Average ion removal at a gauge pressure, KOH concentration, and gas flowrate of 2 bar, 30 g/L, and 776 mL/min, respectively.
Sustainability 13 10200 g008
Figure 9. X-ray diffraction patterns of dried and collected solids under optimized conditions (KOH concentration = 30 g/L, gauge pressure = 2 bar, gas flowrate = 776 mL/min) and temperatures of (a) 40 °C, (b) 50 °C, and (c) 60 °C.
Sustainability 13 10200 g009
Figure 10. Cross-section scanning electron microscopy images of the solids obtained under optimized conditions (KOH concentration = 30 g/L, gauge pressure = 2 bar, gas flowrate = 776 mL/min) and temperatures of (a) 40 °C, (b) 50 °C, and (c) 60 °C.
Sustainability 13 10200 g010
Figure 11. Cross-section scanning electron microscopy images of the solids obtained under optimized conditions (KOH concentration = 30 g/L, gauge pressure = 2 bar, gas flowrate = 776 mL/min) and 60 °C, showing the average particle size distribution.
Sustainability 13 10200 g011
Figure 12. Fourier transform infrared spectra of the solids obtained under optimized conditions (KOH concentration = 30 g/L, gauge pressure = 2 bar, gas flowrate = 776 mL/min) and temperatures of (a) 40 °C, (b) 50 °C, and (c) 60 °C.
Sustainability 13 10200 g012
Table 1. Levels of independent factors.
Independent VariablesUnitTagLevel
−α−10+1
Temperature°CT1020304050
Gauge PressurebarP11.522.53
KOH concentrationg/LC30507090110
CO2 flowratemL/minF400700100013001600
Table 2. Optimum conditions and fitted responses for ion removal at a high temperature of 50 °C.
SolutionResponseFits95% CIComposite Desirability
C (g/L)30Na+ % reduction53.2(45.20, 61.17)0.85
P (bar gauge)2.0Cl % reduction24.8(19.87, 30.4)
F (mL/min)776Mg2+ % reduction92.0(82.95, 100)
Ca2+ % reduction92.8(80.65, 100)
Table 3. Thermodynamics data of reaction (6).
Temperature (°C)ΔH (kJ/mol)ΔG (kJ/mol)
0−91.662−41.917
10−98.143−39.867
20−98.611−37.801
30−99.072−35.718
40−99.525−33.621
50−99.971−31.51
60−100.409−29.384
70−100.839−27.246
80−101.261−25.095
90−101.676−22.933
100−102.083−20.759
Table 4. Summary of combined process studies under different operating conditions.
ReferenceReactantsReaction
Temperature
Reaction
Pressure
pHNa+ Removal
Efficiency
CO2
Capture Efficiency
Main Products
Mohammad et al. [2]Ammoniated brine is used to capture CO2, according to Equation (1)19 °C1 bar11.233%86%NaHCO3
NH4Cl
Palitsakun et al.,
2019 [3]
Carbonation of
ammoniated brine
20 to 38 °CN/AN/AN/A~93 at 20 °C 80% at 38 °CNaHCO3
Na2CO3
NH4HCO3
(NH4)2CO3
CaCO3
El-Naas et al. [4,5]Reject brine is reacted with CaO to capture CO2, according to Equation (2)20 to 50 °C1 bar11.835 at 20 °C
5% at 50 °C
98% at 20 °C
~45% at 50 °C
NaHCO3
CaCO3
CaCl2
Dindi et al.,
2018 [6]
Mixed magnesium/aluminum oxides25 °C1 bar1020%0.082 g CO2/g carbonated solutionNaHCO3
Shim et al.,
2016 [7]
NaOH
reacted
with CO2
Ambient temperature1 bar9.0–12.5N/A>95%97% of NaHCO3
Ibrahim et al. [8]Reject brine is reacted with BHD to capture CO2Ambient temperature5 bar11N/A(1 ± 0.04) g CO2/g BHDNaHCO3
CaCO3
CaCl2
Current StudyReject brine is reacted with KOH to capture CO2 according to Equation (2)50 °C2 bar gauge13.645.6%0.50 g CO2/g KOHNaHCO3
KCl
Publisher’s Note: MDPI stays neutral with regard to jurisdictional claims in published maps and institutional affiliations.

