Article

A Holistic Analysis of Train-Vehicle Accidents at Highway-Rail Grade Crossings in Florida

by
Prashant Singh
1,
Junayed Pasha
1,
Amir Khorram-Manesh
2,
Krzysztof Goniewicz
3,
Abdolreza Roshani
4 and
Maxim A. Dulebenets
1,*
1
Department of Civil & Environmental Engineering, Florida A&M University-Florida State University (FAMU-FSU) College of Engineering, 2525 Pottsdamer Street, Building A, Suite A124, Tallahassee, FL 32310-6046, USA
2
Department of Surgery, Institute of Clinical Sciences, Sahlgrenska Academy, Gothenburg University, Sahlgrenska University Hospital, Blå Stråket 5B, 413 45 Gothenburg, Sweden
3
Department of Aviation Security, Military University of Aviation, Dywizjonu 303 Street, no 35, 08-521 Deblin, Poland
4
Department of Industrial Engineering, Kermanshah University of Technology, Kermanshah 6715685420, Iran
*
Author to whom correspondence should be addressed.
Sustainability 2021, 13(16), 8842; https://doi.org/10.3390/su13168842
Submission received: 30 June 2021 / Revised: 4 August 2021 / Accepted: 5 August 2021 / Published: 7 August 2021
(This article belongs to the Special Issue Sustainable Operation and Maintenance of Railway Systems)

Abstract

:
Highway-rail grade crossing (HRGC) accidents pose a serious risk of safety to highway users, including pedestrians trying to cross HRGCs. A significant increase in the number of HRGC accidents globally calls for greater research efforts, which are not limited to the analysis of accidents at HRGCs but also understanding user perception, driver behavior, potential conflicting areas at crossings, effectiveness of countermeasures and user perception towards them. HRGC safety is one of the priority areas in the State of Florida, since the state HRGCs experienced a total of 429 injuries and 146 fatalities between 2010 and 2019 with a significant increase in HRGC accidents over the last years. The present study aims to conduct a comprehensive analysis of the HRGCs that experienced accidents in Florida over the last years. The databases maintained by the Federal Rail Administration (FRA) are used to gather the relevant information for a total of 578 crossings that experienced at least one accident from 2010 to 2019. In contrast with many of the previous efforts, this study investigates a wide range of various factors, including physical and operational characteristics of crossings, vehicle and train characteristics, spatial characteristics, temporal and environmental characteristics, driver actions and related characteristics, and other relevant information. The outcomes of this research will help better understanding the major causes behind accidents at the HRGCs in the State of Florida in a holistic way by considering a variety of relevant factors, which will assist the appropriate stakeholders with implementation of safety improvement projects across the state.

1. Background

1.1. Highway-Rail Grade Crossing Safety in the European Union

Collisions between vehicles and trains at highway-rail grade crossings (HRGCs), also known as “level crossings”, are a challenge faced globally. Figure 1 illustrates the number of fatal and serious injuries from 2006 to 2016 at the HRGCs in 28 countries of the European Union (E.U.) based on the data provided by the United Nations Economic Commission for Europe (UNECE) [1]. The data show that except for a sudden increase in the number of accidents in the year of 2012 (575 accidents), the number of accidents reduced by approximately 33.59% between 2009 (640 accidents) and 2016 (425 accidents). A similar trend can be seen for the HRGC fatalities and serious injuries. In particular, fatalities at HRGCs reduced by 37.47% (from 411 to 257 fatalities) between 2009 and 2016, whereas serious injuries reduced by 31.63% (from 332 to 227 serious injuries) [1]. Despite the decreasing trend in the HRGC accidents in the E.U., the actual numbers along with the economic impact still remain fairly high. The UNECE outlined four major issues with the HRGC safety, such as [1]: (1) presence of many passive and poorly protected active HRGCs, where it is too expensive to suggest any technical solution; (2) lack of evidence concerning the problem, causes and associated costs at HRGCs due to the absence of proper collision investigation and availability of statistical data; (3) lack of effective evaluation of risk and management due to the absence of knowhow, capacity and appropriate methods; and (4) poor safety environment due to the absence of understanding regarding the main collision causes, road user responsibility and inadequate collision investigation.

1.2. Highway-Rail Grade Crossing Safety in the United States

As for the United States (U.S.), the number of fatal and non-fatal injuries at HRGCs fluctuated over the last years. Figure 2 presents the number of fatal and non-fatal injuries at HRGCs from 2007 and 2019 [2]. The data exhibit that the number of non-fatal injuries at HRGCs reduced by approximately 23.04% between 2007 (1059 non-fatal injuries) and 2019 (815 non-fatal injuries). However, sudden rises in non-fatal injuries were recorded for 2011 (1048 non-fatal injuries) and 2015 (1048 non-fatal injuries). Furthermore, the number of fatal injuries at HRGCs in the U.S. showed an increasing trend between 2012 and 2019. In particular, the number of fatal injuries increased by approximately 28.57% from 2012 (231 fatal injuries) to 2019 (297 fatal injuries). The HRGC safety issues are viewed as a major concern not only in the E.U. and in the U.S. but in other countries as well [3,4,5,6].
Both E.U and U.S. have specific initiatives in place dedicated to HRGC safety improvements. In particular, the European directive 2014/88/EU is dedicated to common safety indicators of railway infrastructure [7]. This directive puts a specific emphasis on HRGC accidents, provides relevant definitions and presents an outline of the methods that can be used to quantify the economic impact of accidents at HRGCs. On the other hand, the U.S. has a national program, called “Railway-Highway Crossings (Section 130) Program” [8]. As a part of the Section 130 Program, each state receives a certain amount of funding for HRGC safety improvement projects every year. Each state is mandated to prioritize its HRGC locations for safety improvement projects. The program was originally introduced in 1987 and was found to be effective in safety improvements. In particular, the number of fatalities at the U.S. HRGCs decreased by more than 50% since the inception of the Section 130 Program.

1.3. Primary Focus of This Study

This study primarily focuses on the HRGC safety in the State of Florida (U.S.), which has a well-developed rail network [8]. Based on the statistical information provided by the Federal Rail Administration (FRA), the State of Florida had a total of 838 accidents between 2010 and 2019, including 146 fatal injuries and 429 non-fatal injuries [9]. In the year of 2019 alone, Florida’s HRGCs had a total 135 accidents with 26 fatal injuries and 53 non-fatal injuries. High accident rates in Florida can be explained by the following reasons [8]: (1) Florida is ranked as one of the most populous states in the U.S., which increases the exposure of HGRCs to highway traffic; (2) automobile is the primary mode of travel for the majority of population; (3) Florida has many urbanized areas; and (4) a significant level of freight and passenger traffic activities is recorded in metropolitan areas. The available accident statistics shows that significant efforts are needed to reduce the risk of those accidents leading to severe fatalities and collateral damage to the infrastructure in Florida and other states as well.
The present study aims to conduct a comprehensive analysis of the HRGCs that experienced accidents in Florida over the last years. The databases maintained by the Federal Rail Administration (FRA) are used to gather the relevant information for a total of 578 crossings that experienced at least one accident from 2010 to 2019. In contrast with many of the previous efforts, this study investigates a wide range of various factors. These factors include physical and operational characteristics of crossings, vehicle and train characteristics, spatial characteristics, temporal and environmental characteristics, driver actions and related characteristics, and other relevant information. The outcomes of this research will help better understanding the major causes behind the accidents at HRGCs in the State of Florida in a holistic way by considering a variety of relevant factors. The identified accident trends and contributing factors will assist the appropriate stakeholders with implementation of safety improvement projects across the state. The remainder of this paper is structured as follows. In Section 2, the relevant literature is reviewed. Section 3 of the paper discusses the main data sources used for the analysis of HRGC accidents. The results from the analysis of accidents at HRGCs are described in Section 4. A holistic overview of the findings and major challenges encountered during the conducted analysis is given in Section 5. Conclusions and possible future research extensions are underlined in Section 6.

2. Review of the Relevant Studies

User safety at HRGCs is critical, since each HRGC provides an authorized space where two modes of transportation (i.e., rail and motor vehicles) directly interact. Such interaction can cause high safety risk and severe damage to property as well as compromise the safety of people living in the vicinity of the crossing. Several research efforts have been conducted to date, aiming to understand and analyze various causes of accidents at HRGCs. The research efforts evaluated as a part of the literature review were categorized into the following groups: (1) risk contributing factors at HRGCs; (2) human factors at HRGCs; (3) geometric design of HRGCs and its impacts on safety; and (4) general issues related to HRGC safety. The following sections provide more information regarding each one of the aforementioned study categories.

2.1. Risk Contributing Factors at HRGCs

Hao [10] developed three driver injury severity models: (1) overall model; (2) driver injury severity model capturing warning devices; and (3) driver injury severity model capturing age and gender. The results, which were obtained for the U.S. HRGCs, indicated that female drivers and older drivers were likely to experience increased injury severity at HRGCs. Haleem and Gan [11] studied crash contributing factors and injury severity at public HRGCs in the U.S. using the FRA accident database for a total of 5528 public HRGCs and the 2009–2013 time period. The study outcomes demonstrated that various characteristics, such as high speed of trains, age of drivers, road surface, presence of warning bells, could substantially influence the injury levels. Haleem [12] investigated the accidents at private HRGCs using the U.S. data from 2009 to 2014. It was found that more accidents occurred at the private HRGCs that did not have any warning devices. Fewer fatalities were recorded for males and young adults compared to their older counterparts.
Hao et al. [13] studied injury severity at HRGCs by time of day. The FRA data for 25,945 accidents at HRGCs in the U.S. were analyzed for the time period between 2002 and 2011. The results of the study showed that the injury severity at HRGCs for the accidents during AM peak, PM peak and PM off-peak was significantly higher compared to other time periods throughout a day. Zhao and Khattak [14] studied the self-reported inattentive driving at HRGCs. The data were collected by means of a questionnaire distributed among randomly selected households with licensed motor vehicle drivers in Nebraska (U.S.). The results showed that female drivers, younger drivers, drivers from the households with higher income and more frequent use of HRGCs were some of the factors directly associated with inattentive driving at HRGCs. Keramati et al. [15] proposed a competing risk method to evaluate the accident frequency and severity at HRGCs for a period of 30 years in North Dakota (U.S.). The study demonstrated that the train detection system, train services, type of roadway surface, railroad and highway traffic, truck percentage and number of highway lanes could influence the accident occurrence likelihood at HRGCs.

2.2. Human Factors at HRGCs

U.S. DOT [16] identified human factors as one of the major causes of accidents at HRGCs. The need for effective action plans was highlighted to address safety issues at HRGCs. A series of initiatives in the areas related to education, engineering and enforcement could help in prevention of accidents at HRGCs. Tey et al. [17] analyzed the behavior of drivers at HRGCs with different types of warning devices. The research outcomes indicated poor driver responses at the HRGCs with passive warning devices compared to the HRGCs with active warning devices. Silla and Luoma [18] studied the recurrence of fatalities, accident timing and attributes of people died in pedestrian-train accidents during the 2005–2009 time period on the Finnish railways. It was found that a total of 311 pedestrians were killed as a result of pedestrian-train accidents. Moreover, a total of 264 accidents were suicides. Naweed [19] investigated psychological factors that could cause driver distraction and inattention for the Australian and New Zealand rail industry. Growing anxiety, disengagement and multi-tasking were found to be some of the significant factors that could intensify the experience of distraction and increase the driver risk.
Read et al. [20] analyzed the HRGC literature to find out the degree to which the systems approach was used to evaluate safety issues at HRGCs. The results of the study illustrated that none of the previously conducted studies relied on the systems approach for understanding driver behavior at HRGCs. It was highlighted that the systems approach could assist with the selection of efficient design enhancements at HRGCs. Salmon et al. [21] studied human factors leading to unintentional non-compliance at HRGCs. A case study of the HRGC accident in Northern Victoria (Australia) was considered, when a truck collided with a passenger train killing 11 train passengers. The primary cause of the accident was identified to be the looked-but-failed-to-see error leading the truck driver to assume that there was no train in the HRGC vicinity. Kyriakidis et al. [22] proposed a framework to recognize the most important human performance attributes, which could substantially influence railroad operations and cause safety issues. The framework was developed based on the 479 railroad operational incidents occurred worldwide over the last 15 years and could be used to identify the appropriate solutions for enhancing the safety level.
Liu et al. [23] evaluated pre-crash driver behaviors at HRGCs with different types of warning devices. A total of 15,639 accidents occurred at the U.S. HRGCs between 2004 and 2013 were analyzed. The analysis outcomes showed that drivers were likely to stop at HRCGs with gates. Flashing lights and audible warning devices at gated HRGCs were found to be effective means of improving safety. Stefanova et al. [24] studied pedestrian behavior at HRGCs and outlined significant gaps in the existing knowledge. A new framework was proposed to arrange the contributing factors of crossing behavior in a hierarchical manner. The conducted case study demonstrated that many different factors affect pedestrian crossing behavior (e.g., station design, location of the overpass, presence of a convenient path). Madigan et al. [25] conducted the human factor analysis for the rail safety incidents in the United Kingdom. A total of 78 reports were reviewed as a part of that study. The reports were mostly concentrated on active failures associated with work-related distraction and environmental factors. Memory failures and attention failures were underlined as well. Larue et al. [26] evaluated risks and errors for highway users at fully protected HRGCs. A significant number of violations of vehicle drivers and pedestrians were noticed for the considered HRGC. It was indicated that the design issues may increase the number of violations at fully active HRGCs. Additional countermeasures could be helpful in reducing the risk level at HRGCs.

2.3. Geometric Design of HRGCs and Its Impacts on Safety

Lin et al. [27] highlighted that the existing guiding signs, traffic control devices and pavement markings may confuse highway users and result in incorrect turns at HRGCs (i.e., a driver is turning onto the railroad tracks instead of at the nearby intersection). The study suggested a set of countermeasures that can be used to address the issue of incorrect turns at HRGCs. In particular, striping and advanced directional signage was proposed for the upstream side of HRGCs. Supplementary treatments were discussed as well (e.g., side, and median barriers, striping/dynamic envelop pavement markings, illumination). Keramati et al. [28] indicated that limited research efforts focused on the effects of HRGC geometric parameters on their safety performance. A total of 3194 public HRGCs in North Dakota were investigated. The following geometric attributes of HRGCs were considered: (a) acute crossing angle; (b) HRGC width (proportional to the number of tracks); (c) distance between the HRGC and the nearest intersection; and (d) number of highway lanes. The outcomes from the conducted research showed that all the considered geometric attributes could substantially influence the accident severity level. Furthermore, all the considered geometric attributes, except the distance between the HRGC and the nearest intersection, could substantially influence the accident occurrence.

2.4. General Issues Related to HRGC Safety

Silla and Kallberg [29] studied railway safety in Finland between the years of 1959 and 2008. The results showed a significant enhancement in safety during that period. A significant decrease in the number of fatalities at HRGCs has been attributed to the application of barriers, construction of underpasses/overpasses at HRGCs in high traffic volume areas, elimination of crossings and enhancement in visibility at crossings. Chadwick et al. [30] presented the operational challenges at the U.S. HRGCs with shared operations, where both passenger and heavy freight rail services are available. It was concluded that the introduction of high-speed passenger rail services on the existing freight railroads could increase safety concerns. Phillips and Sagberg [31] conducted the analysis of hazardous events on the approaches to rail signals. The study evaluated responses from 115 train drivers. It was found that inattention, inappropriate schema and lack of signal salience were the main reasons behind missing signals by train drivers. Inattention could be caused by routine exposure to invariant signals.
Khattak and Tung [32] studied pedestrian accidents at HRGCs. Three levels of accident severity were considered, including “no injury”, “injury” and “fatality”. The analysis results showed that fatalities were generally observed at HRGCs with higher train speeds and among female pedestrians. Metaxatos and Sriraj [33] studied the effectiveness of various engineering solutions and educational programs for reducing pedestrian and bicycle fatalities at HRGCs. The research objective was accomplished by means of literature review and consultation with professionals. Major areas requiring attention were highlighted. Abioye et al. [34] studied the prevailing accident and hazard prediction formulae that were used by various state Departments of Transportation in the U.S. A number of challenges in implementation of the models in different states were identified. Kavoosi et al. [35] developed two optimization models to minimize the overall hazard and the overall hazard severity focusing on public HRGCs in the State of Florida. Several customized heuristic algorithms were developed to solve the models.
Khattak et al. [36] aimed to update the existing accident prediction model used in the State of Nebraska (U.S.) and propose a set of guidelines for enhancing safety at HRGCs with gates in urban areas. After evaluation of various candidate models, a Poisson regression model with scaled parameters was recommended for implementation at HRGCs. Pasha et al. [37] analyzed the accidents and hazard prediction models for 589 HRGCs in the State of Florida using different performance measures. The study outcomes demonstrated the superiority of the Florida Priority Index Formula in terms of ranking HRGCs based on their potential hazard. Das et al. [38] conducted a taxicab correspondence analysis for fatal accidents at the U.S. HRGCs between 2010 and 2018 using the fatality analysis reporting system. It was found that fatal accidents occurring during daytime are likely to result in more than one fatality. Moreover, the vehicle type and speed substantially affected the occurrence of fatal accidents at HRGCs.

2.5. Literature Summary and Contributions of This Work

A detailed review of the HRGC literature identified a significant number of efforts conducted to understand and analyze various causes of accidents at HRGCs. However, many of the reviewed studies put a specific emphasis on a particular group of factors when analyzing HRGC accidents [13,17,19,21,24]. For example, Hao et al. [13] primarily focused on the effects of time of day on the injury severity at HRGCs. Several studies mostly concentrate on human factors that may cause HRGC accidents [17,19,21,24]. Lin et al. [27] and Keramati et al. [28] investigated the effects of HRGC geometric characteristics on their vulnerability to accidents. A recent study conducted by Das et al. [38] analyzed quite a wide array of factors when investigating HRGC accidents but focused only on fatal accidents without considering injury and property damage only accidents. Due to an increase in HRGC accidents in Florida, this study aims to conduct a comprehensive analysis of HRGCs that experienced accidents over the last years. In contrast with many of the previous research efforts, the present study evaluates a wide range of various factors, which include physical and operational characteristics of crossings, vehicle and train characteristics, spatial characteristics, temporal and environmental characteristics, driver actions and related characteristics, and other relevant information. The outcomes of this research are expected to assist the appropriate stakeholders (e.g., state Departments of Transportation) with implementation of safety improvement projects across the state.

3. Data Sources

As a part of this study, two major data sources were used for collection of the relevant information, including the following: (1) the FRA crossing inventory database; and (2) the FRA crossing accident database. Both databases are open sources and can be downloaded from the FRA website [39]. The FRA crossing inventory database includes the information regarding the following crossing attributes [40]: (i) the HRGC location and classification (e.g., latitude, longitude, crossing position, type of land use); (ii) operating railroad (e.g., railroad line name, total daylight through trains, total nighttime through trains, number of main tracks, maximum timetable speed); (iii) HRGC physical characteristics (e.g., number of traffic lanes crossing railroad, illumination, smallest crossing angle, crossing surface); (iv) intersecting highway characteristics (e.g., AADT, highway speed limit, estimated percentage of trucks, average number of school buses per day); and (v) highway traffic control devices (e.g., presence of warning signs, presence of gates, gate configuration, type of pavement markings).
The FRA crossing accident database includes the information regarding the following attributes of HRGC accidents [9]: (i) general accident information (e.g., year of accident, month of accident, day of accident); (ii) HRGC location (e.g., state, county, city); (iii) railroad information (e.g., railroad code, railroad assigned identification number, HRGC ID number, type of track); (iv) highway and highway user information (e.g., highway name, highway user type, highway user position); (v) environmental conditions (e.g., temperature, visibility, weather); (vi) train information (e.g., train type, train speed, number of locomotive units); (vii) accident outcomes (e.g., number of HRGC user fatalities/injuries, number of railroad employee fatalities/injuries); and other relevant information.
Some of the information provided in the FRA crossing inventory database can be found in the FRA crossing accident database as well for a given HRGC (e.g., train speed, type of warning devices used, crossing illumination). However, certain important physical and operational characteristics of HRGCs are reported in the FRA crossing inventory database only (e.g., number of trains per day, number of tracks, AADT, highway speed limit, smallest crossing angle, crossing surface). On the other hand, the FRA crossing accident database has certain pertinent information regarding the accidents occurred at a given HRGC, which is not available in the FRA crossing inventory database (e.g., weather conditions at the moment of accident, temperature at the moment of accident, visibility at the moment of accident, action of a highway user at the moment of accident). Therefore, this study will use both databases in order to conduct a comprehensive analysis of HRGCs that experienced accidents in Florida over the last years and better understand the major causes behind the accidents. Note that the FRA crossing inventory database and the FRA crossing accident database have been widely used in the HRGC safety literature for a detailed analysis of accidents [10,11,13,41].

4. Detailed Analysis of Accidents at HRGCs

After review and analysis of the FRA crossing inventory database [40], a total of 9607 crossings were identified in the State of Florida. Figure 3 shows the locations of the crossings based on the latitude/longitude information available in the FRA crossing inventory database. The majority of crossings in the State of Florida are at-grade crossings (i.e., HRGCs). More specifically, a total of 9090 crossings (or 94.62%) are at-grade. Along with at-grade crossings, there are 447 underpasses (i.e., railroad under) and 70 overpasses (railroad over). This study primarily focuses on investigating the features of HRGCs that experienced accidents between 2010 and 2019. A total of 838 accidents were recorded for this time period at 578 unique HRGCs. The distribution of HRGC accidents in the State of Florida by year between 2010 and 2019 is presented in Figure 4. It can be observed that the number of HRGC accidents generally increased over the last years. The year of 2019 alone had a total of 135 accidents with 53 non-fatal injuries and 26 fatal injuries. The following sections of the manuscript provide a detailed analysis of the HRGC accidents in Florida focusing on the following aspects: (i) crossing physical characteristics; (ii) crossing operational characteristics; (iii) vehicle characteristics; (iv) train characteristics; (v) spatial characteristics; (vi) temporal characteristics; (vii) environmental characteristics; (viii) driver actions and related characteristics; and (ix) other pertinent information.

4.1. Crossing Physical Characteristics

Figure 5 shows the distribution of Florida’s HRGCs that experienced accidents between 2010 and 2019 by crossing type, presence of illumination, type of warning devices installed and installation date of current active warning devices. It was found that a total of 484 HRGCs (or 83.74%) were public, whereas 93 HRGCs (or 16.09%) were private. A total of 237 HRGCs (or 41.00%) of the most hazardous crossings in Florida were not illuminated. Most of the HGRCs that experienced accidents between 2010 and 2019 were equipped with gates (i.e., a total of 426 HRCGs or 73.70% were gated crossings). A passive type of protection (i.e., crossbucks or stop signs) was recorded for 39 HRGCs (or 6.75%). Moreover, 8 HRCGs did not have any type of protection, which could be the main or one of the reasons causing the accidents. Throughout the analysis, it was found that the current active warning devices were installed between 2011 and 2020 for a total of 64 HRGCs (or 11.07%). However, for the majority of HGRCs (i.e., 465 HRGCs or 80.45%), the installation date of current active warning devices was not reported.
Figure 6 shows the distribution of Florida’s HRGCs that experienced accidents between 2010 and 2019 by presence of quiet zones in the HRGC vicinity, crossing angle and crossing surface type. It was found that a total of 453 HRGCs (or 78.37%) did not have any quiet zones. The analysis results indicate that the crossing angle varied between 60° and 90° for 185 HRGCs (or 32.01%), whereas 24 HRGCs (or 4.15%) had a crossing angle between 30° and 59°. Regarding the crossing surface, most of HGRCs that experienced accidents between 2010 and 2019 had the surface made of concrete or asphalt and timber or asphalt (313 HRCGs or 54.15%, 105 HRCGs or 18.17%, 88 HRCGs or 15.22%, respectively). Figure 7 shows the distribution of Florida’s HRGCs that experienced accidents between 2010 and 2019 by classification of road, condition of roadway at the crossing, highway monitoring devices installed, type of pavement markings and number of traffic lanes crossing the railroad. It was found that a total of 436 HRGCs (or 75.43%) were urban crossings, whereas 62 HRGCs (or 10.73%) were rural crossings. Moreover, 484 HRGCs (or 83.74%) were paved crossings, and only 17 (or 2.94%) were unpaved crossings. The conducted analysis shows that 345 HRGCs (or 59.69%) did not have any type of highway monitoring devices. Furthermore, it was found that 421 HRGCs (or 72.84%) had a stop line and RR crossing symbol pavement marking. No pavement marking was reported at 55 HRGCs (or 9.52%). It was also found that the majority of Florida’s HRGCs that experienced accidents between 2010 and 2019 had 2 highway lanes crossing the railroad (273 HRGCs or 47.23%).
Figure 8 shows the distribution of Florida’s HRGCs that experienced accidents between 2010 and 2019 by intersecting roadway near the crossing, presence of traffic signals at the intersection and type of land use. It was found that 321 HRGCs (or 55.54%) had an intersecting roadway within 500 feet in their vicinity. Moreover, 202 HRGCs (or 34.95%) had an adjacent highway intersection with traffic signals, which could potentially create congestion in the vicinity of HRGCs and cause queue spillbacks. Another important finding consists in the fact that 317 HRGCs (or 54.84%) had commercial land use in their vicinity, whereas 109 HRGCs (or 18.86%) had industrial land use. Commercial land use and industrial land use can increase exposure of the most hazardous HRGCs to additional traffic.

4.2. Crossing Operational Characteristics

Figure 9 shows the distribution of Florida’s HRGCs that experienced accidents between 2010 and 2019 by total number of daytime through rains, number of nighttime through trains, number of switching trains and maximum timetable speed of trains. It was found that a total of 361 HRGCs (or 62.46%) had at least 4 daytime through trains per day. Moreover, a total of 328 HRGCs (or 56.75%) had at least 4 nighttime through trains per day. As for switching trains, a total of 470 HRGCs (or 81.31%) had less than 4 switching trains per day. Another important finding consists in the fact that the trains at the most hazardous HRGCs were mostly traveling at high speeds. Specifically, 355 HRGCs (or 61.42%) had the maximum timetable train speed of 45 mph at least. Figure 10 shows a distribution of Florida’s HRGCs that experienced accidents between 2010 and 2019 by number of main tracks, number of other tracks and type of train service. It was found that a total of 374 HRGCs (or 64.71%) had 1 main track, and 145 HRGCs (or 25.69%) had 2 main tracks. Furthermore, a total of 128 HRGCs (or 22.15%) had at least one other track, whereas 425 HRGCs (or 73.53%) had no other tracks. As for the train service type, the majority of trains passing through the most hazardous HRGCs in Florida were freight trains (280 HRGCs or 48.44%). A total of 118 HRGCs (or 20.42%) had trains providing freight/intercity passenger service.
Figure 11 shows the distribution of Florida’s HRGCs that experienced accidents between 2010 and 2019 by AADT, estimated percentage of trucks, average number of school buses per day and highway speed limit at crossings. It was found that a total of 315 HRGCs (or 54.50%) had the AADT of up to 10,000, 96 HRGCs (or 16.61%) had the AADT between 10,001 and 20,000, and 47 HRGCs (or 8.13%) had the AADT between 20,001 and 30,000. Furthermore, a total of 266 HRCGs (or 46.02%) had up to 10% of trucks passing HRGCs every day on average, which can be viewed as significant. Trucks and other large vehicles generally take more time to pass through HRGCs and may create potential safety hazards for other vehicles in the HRGC vicinity. Similarly, quite a substantial amount of school buses was recorded at the most hazardous HRGCs in Florida. A total of 152 HRGCs (or 26.30%) had up 10 school buses per day, and 194 HRGCs (or 33.56%) had at least 11 school buses per day. As for the highway speed limit at HRGCs, a total of 246 HRGCs (or 42.56%) had a highway speed limit of at least 35 mph.

4.3. Vehicle Characteristics

Figure 12 shows the distribution of Florida’s HRGC accidents between 2010 and 2019 by highway user type, number of vehicle occupants and position of a highway user at the crossing. It was found that a total of 425 accidents (or 50.72%) involved automobiles, 97 accidents (or 11.58%) involved truck-trailers and 87 accidents (or 10.38%) involved pedestrians. Most of the vehicles that experienced accidents had only 1 occupant (533 accidents or 63.60%). As for the position of a highway user at the moment of accident, the highway user was moving over the HRGC in 459 accidents (or 54.77%). Moreover, the highway user was stopped at the HRGC in 280 accidents (or 33.41%), whereas the user was stalled or stuck at the HRGC in 74 accidents (or 8.83%). Figure 13 shows the distribution of Florida’s HRGC accidents between 2010 and 2019 by estimated speed of a vehicle and highway vehicle property damage. It was found that a total of 354 accidents (or 42.24%) occurred when the vehicle was either stalled or stuck at the HRGCs; therefore, the estimated speed of a vehicle at the moment of accident was 0 mph. The estimated speed of a vehicle was between 1 mph and 10 mph for 227 accidents (or 27.09%). As for the highway vehicle property damage, most of the HRGC accidents in Florida caused a property damage of up to $5000 (275 accidents or 32.82%). A total of 187 accidents (or 22.32%) resulted in a property damage varying between $5001 and $10,000.

4.4. Train Characteristics

Figure 14 shows the distribution of Florida’s HRGC accidents between 2010 and 2019 by number of people on the train, number of cars and number of locomotive units. It was found that a total of 660 accidents (or 78.76%) involved trains with up to 100 people onboard. Furthermore, 110 accidents (or 13.33%) had trains with the number of people onboard varying between 101 and 200. As for the number of cars, no more than 50 cars were involved in most of the accidents (586 accidents or 69.93%). Moreover, the analysis results indicate that trains with no more than 2 locomotive units were involved in the majority of accidents (745 accidents or 88.90%). Figure 15 shows the distribution of Florida’s HRGC accidents between 2010 and 2019 by number of train passengers injured, number of railroad employees injured and train speed. It was found that no more than 10 train passengers were injured in the majority of accidents (39 accidents or 4.65%). Only two accidents had 23 and 30 train passengers injured. As a result of HRGC accidents occurred in Florida between 2010 and 2019, a total of 31 railroad employees were injured with no more than 6 railroad employees injured per accident. The conducted analysis indicates that the train speed in 344 accidents (or 41.05%) was higher than 40 mph.

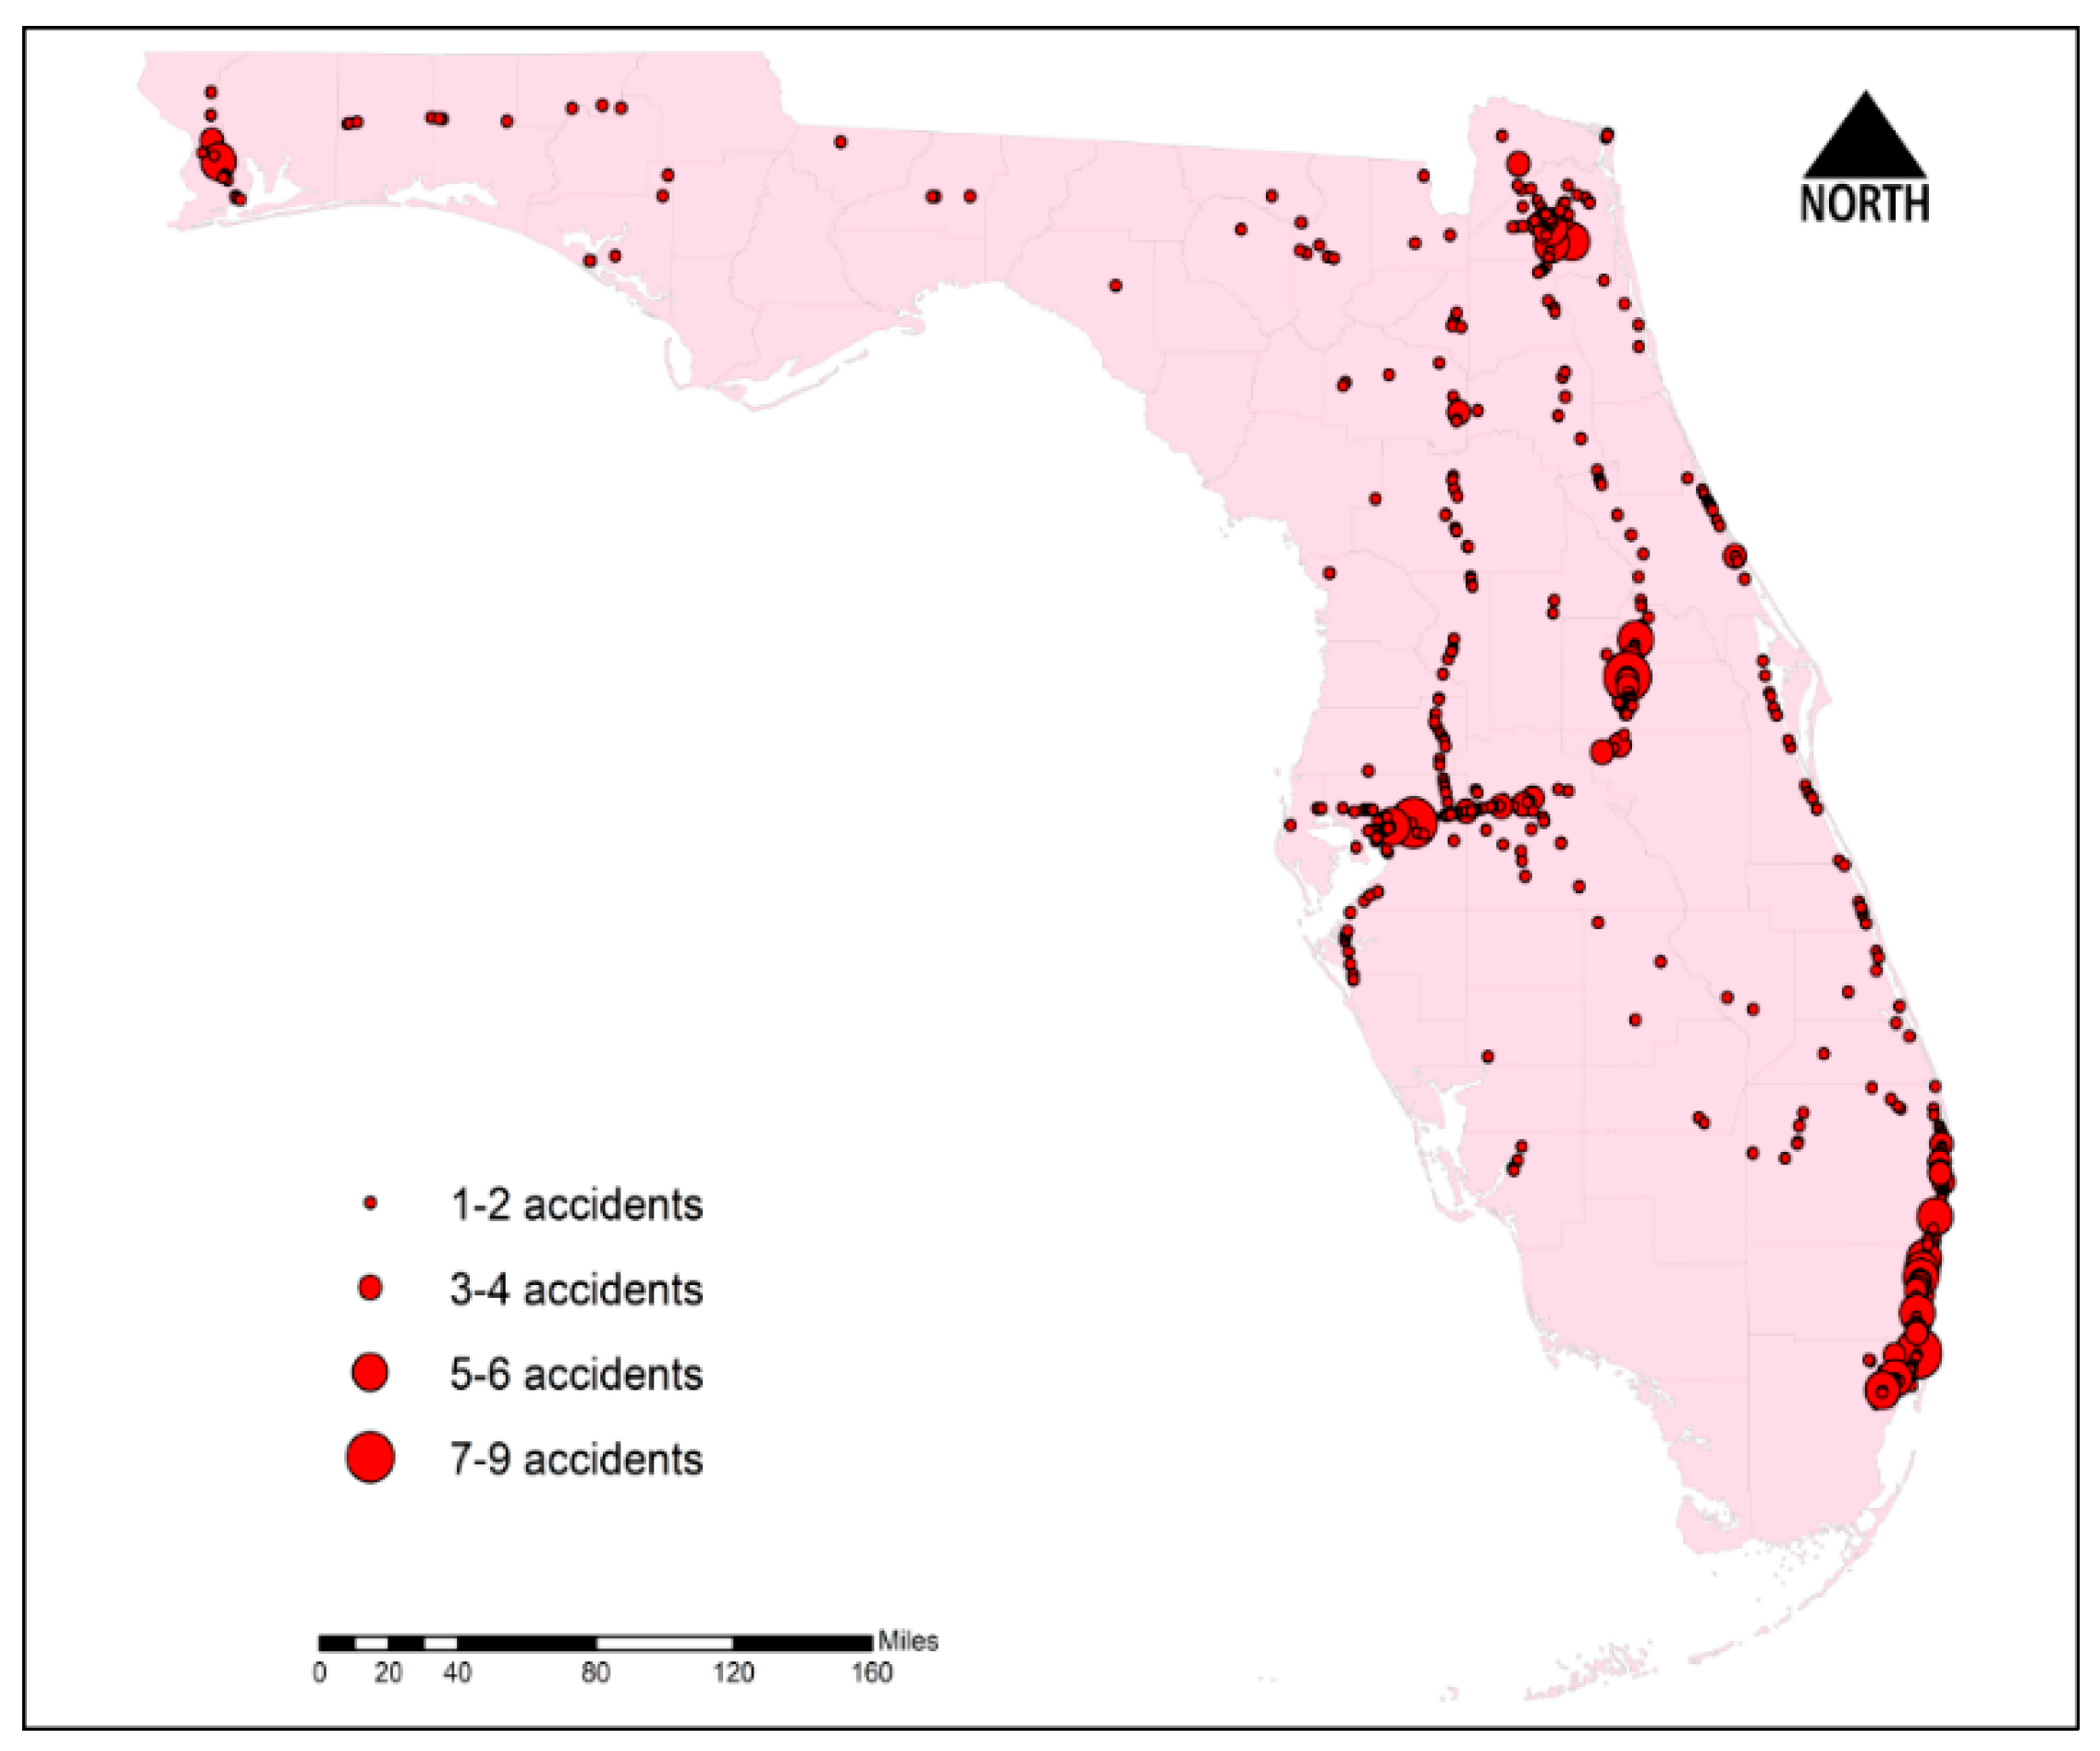
4.5. Spatial Characteristics

The analysis of spatial characteristics of HRGC accidents across the State of Florida can assist with identification of the reasons behind these accidents. Figure 16 exhibits the distribution of Florida’s HRGC accidents between 2010 and 2019 by county. It was found that Broward and Palm Beach counties have the highest number of accidents (i.e., a total of 123 accidents or 14.68% and 106 accidents or 12.65%, respectively). Furthermore, Duval, Hillsborough, Miami-Dade, Orange, Polk and Volusia counties recorded 363 accidents (or 43.32%) of the total accidents in the State of Florida. All the other counties individually contributed less than 3% of total accidents in the State of Florida. The counties with a higher number of accidents were mostly urban areas with big cities that have high population density and travel activities. Fewer accidents were reported in rural areas with lower travel activities.

4.6. Temporal Characteristics

Figure 17 shows the distribution of Florida’s HRGC accidents between 2010 and 2019 by hour of accident, month and weekday. It was found that most of the accidents occurred between 8 AM and 8 PM (a total of 558 accidents or 66.59%), which can be explained by higher exposure of HRGCs to railroad and highway traffic during that time period. As for the distribution of HRGC accidents by month, it can be observed that a significant number of accidents occurred in November, December, January, March, May and September. The latter finding can be justified by changing traffic patterns (e.g., increasing travel activities during holidays or other activities). Furthermore, the analysis results indicate that the majority of accidents occurred during weekdays compared to weekends, which can be explained by higher exposure of HRGCs to railroad and highway traffic during weekdays.

4.7. Environmental Characteristics

Figure 18 shows the distribution of Florida’s HRGC accidents between 2010 and 2019 by visibility, weather condition, temperature and road condition. It was found that most of the accidents occurred during daytime (444 accidents or 52.98%). Moreover, a significant number of accidents occurred under dark visibility (304 accidents or 36.28%). Dark visibility could be one of the reasons causing the accidents. The weather was clear in case of 645 accidents (or 76.97), and cloudy weather condition was reported for a total of 127 accidents (or 15.16%). The analysis results indicate that the majority of HRGC accidents occurred when the temperature varied between 61 °F and 80 °F (454 accidents or 54.18%). A total of 283 accidents (or 33.77%) occurred when the temperature was higher than 81 °F. As for the roadway conditions, most of the accidents occurred on dry roadways crossing the HRGCs (667 or 79.59%). Wet roadway condition was recorded for 80 accidents (or 9.55%) only.

4.8. Driver Actions and Characteristics

Figure 19 shows the distribution of Florida’s HRGC accidents between 2010 and 2019 by action of highway users and obstruction of track view. It was found that 291 accidents (or 34.73%) occurred when the driver stopped at the crossing, and 193 accidents (or 23.03%) occurred when the driver went around the gates. The main reason of 20 accidents (or 2.39%) was reported to be a suicide or an attempted suicide. In the majority of accidents (814 accidents or 97.14%), the drivers did not have any obstruction of track view. Some obstructions were reported only in 24 accidents (or 2.86%), including highway vehicles, vegetation, topography, passing trains, railroad equipment and permanent structures. Figure 20 shows the distribution of Florida’s HRGC accidents between 2010 and 2019 by driver age, gender and condition. It was found that drivers in the age group of (26–50) years were involved in 315 accidents (or 37.59%). A total of 245 accidents (or 29.24%) involved drivers in the age group of (51–75) years. Furthermore, male drivers were involved in 586 accidents (or 69.93%), and female drivers were reported for 202 accidents (or 24.11%) only. Therefore, young and middle-aged male drivers were mostly involved in HRGC accidents in Florida, which can be explained by their susceptibility of making risky driving maneuvers. The analysis results indicate that drivers were uninjured in 503 accidents (or 60.02%) and injured in 167 accidents (or 19.33%). A total of 80 accidents (or 9.55%) resulted in driver fatalities.

4.9. Other Pertinent Information

Figure 21 shows the distribution of Florida’s HRGC accidents between 2010 and 2019 by accident type, railway equipment involvement, accident video taken and accident video used. It was found that the rail equipment struck a highway user in 702 accidents (or 83.77%), whereas the rail equipment was struck by a highway user in 136 accidents (or 16.23%). In terms of railway equipment involvement, train units pulling, train units pushing and light loco(s) moving were mostly involved in HRGC accidents (681 accidents or 81.26%, 89 accidents or 10.62% and 37 accidents or 4.42%, respectively). Furthermore, the analysis results indicate that the accident video was taken in 359 cases (or 42.84%), and the recorded accident video was used in 196 cases (or 23.39%) only. A fairly low utilization rate of recorded videos can be explained by the fact that the accident causes were clear in the majority of cases, and no additional investigations using the available video recordings were needed.

5. Analysis Summary and Discussion

A detailed review of the FRA databases allowed gathering some important information for the HRGCs that experienced accidents in the State of Florida from 2010 to 2019. This section of the manuscript summarizes the main accident tendencies that were revealed after the data analysis and discusses some challenges and limitations of the available data. Along with a descriptive statistical analysis of different factors discussed in Section 4.1, Section 4.2, Section 4.3, Section 4.4, Section 4.5, Section 4.6, Section 4.7 and Section 4.8 of the manuscript, a set of Chi-square (χ2) statistical tests were conducted to identify whether these factors have a statistically significant correlation with the number of accidents. The FRA crossing inventory and accident databases were used throughout the Chi-square (χ2) statistical tests for the HRCGs that experienced accidents in the 10-year time period. Note that the Chi-square (χ2) statistical test has been widely used in the HRGC safety literature to analyze different factors [6,17,18]. It was found that the majority of factors considered in this study had a statistically significant correlation with the number of accidents (assuming the significance level of α = 0.01). Section 5.1 summarizes the results from the Chi-square (χ2) statistical tests and includes the degree of freedom (df), calculated value of χ2 and critical value of χ22-crit) for the considered factors. More details regarding the conducted Chi-square (χ2) statistical tests can be found in the Appendix A that accompanies this manuscript.
Furthermore, in addition to the Chi-square (χ2) statistical tests, a generalized linear regression model with binary logistic structure was developed to further investigate the effects of different factors at the HRGCs in the State of Florida for the considered time period. The generalized linear regression model with binary logistic structure that was designed in this study can be characterized with the following equation [10,42]:
l n P Y = 1 P Y = 0 = β 0 + β 1 · X 1 + β 2 · X 2 + + β n · X n + ε
where: P Y = 1 —probability of an HRGC to experience at least one accident in the 10-year time period; P Y = 0 —probability of an HRGC to experience no accidents in the 10-year time period; β 0 —the model’s intercept estimate; X —set of predictor variables; β —set of coefficients for predictor variables; and ε —random error term.
Throughout the conducted analysis, all 9090 HRGCs located in the State of Florida were evaluated, including the ones that did not experience any accidents in the considered time period. Note that the set of predictor variables was assembled using the FRA crossing inventory database only, as the data available in the FRA crossing accident database are not reported for the HRGCs that did not experience any accidents in the considered time period (i.e., a total of 8512 HRCGs with no accidents reported). Similar to the Chi-square (χ2) statistical tests, the installation date of current active warning devices and the crossing angle were not included as predictors due to a large number of unreported values. The generalized linear regression model was built within the MATLAB 2016a environment. The results from the conducted statistical analysis are summarized in Table 1 that includes the following information for each predictor (along with the model’s intercept): (1) estimate; (2) standard error (S.E.); (3) t-statistic (t-stat); and (4) p-value.
Based on the results from the conducted statistical analysis, the majority of the considered predictor variables were found to be statistically significant with the p-values less than 0.05 (see Table 1). Moreover, the entire model was found to be statistically significant with the p-value of 2.79e-230. However, some of the considered predictor variables had fairly high p-values, which can be explained by the commonality of certain attributes for the HRGCs that experienced at least one accident in the 10-year time period and the HRGCs that did not experience any accidents in the 10-year time period. As an example, a fairly high p-value for the warning device type (p-value = 0.65827) can be explained by the fact that the majority of the HRGCs in the State of Florida, including the ones that experienced accidents in the considered time period and the ones that did not experience any accidents in the considered time period, have active warning devices installed (e.g., two-quad gates or four-quad gates). Similarly, a fairly high p-value for the AADT (p-value = 0.18644) can be explained by the commonalities in terms of the highway traffic distribution for the HRGCs in the State of Florida.

5.1. Accident Tendencies

As a result of the conducted analysis, the following major tendencies have been identified in the accident occurrence at the HRGCs in the State of Florida.

5.1.1. Crossing Physical and Operational Characteristics

  • The majority of accidents occurred at public HRGCs (484 HRGCs or 83.74% that experienced accidents were public) (df = 2; χ2 = 682.76; χ2-crit = 9.21), which can be explained by the fact that the number of private HRGCs is significantly lower than the number of public HRGCs in the State of Florida. Additional monetary resources should be allocated for safety improvement projects at public HRGCs;
  • The majority of accidents occurred at active HRGCs that have either two-quad or four-quad gates (426 HRCGs or 73.70% that experienced accidents were gated) (df = 7; χ2 = 1494.91; χ2-crit = 18.48). Additional countermeasures should be installed at gated crossings to prevent accidents (e.g., channelization devices at two-quad gates);
  • Many HRGCs that experienced accidents were not illuminated (237 HRGCs or 41.00%), which was found to be a statistically significant factor for the accident occurrence (df = 2; χ2 = 181.42; χ2-crit = 9.21). Adding illumination to HRGCs could be an effective countermeasure for preventing accidents at those HRGCs;
  • Most of HGRCs that experienced accidents between 2010 and 2019 had the surface made of concrete or asphalt and timber or asphalt (313 HRCGs or 54.15%, 105 HRCGs or 18.17%, 88 HRCGs or 15.22%, respectively) (df = 9; χ2 = 1490.96; χ2-crit = 21.67);
  • A total of 436 HRGCs (or 75.43%) that experienced accidents between 2010 and 2019 were urban crossings (df = 2; χ2 = 461.83; χ2-crit = 9.21). The roadways for the majority of HRGCs were paved (484 HRGCs or 83.74%) (df = 2; χ2 = 670.13; χ2-crit = 9.21). A total of 317 HRGCs (or 54.84%) had commercial land use in their vicinity (df = 8; χ2 = 1288.05; χ2-crit = 20.09). Furthermore, 321 HRGCs (or 55.54%) had an intersecting roadway within 500 feet (df = 2; χ2 = 155.75; χ2-crit = 9.21);
  • The majority of accidents occurred at HRGCs with 2 highway lanes crossing the railroad (273 HRGCs or 47.23%). The number of lanes crossing the railroad was found to be a statistically significant factor influencing the number of accidents (df = 9; χ2 = 1028.40; χ2-crit = 21.67);
  • The majority of HRGCs had high exposure (i.e., a total of 361 HRGCs or 62.46% had at least 4 daytime through trains per day; a total of 315 HRGCs or 54.50% had the AADT of up to 10,000). High exposure of HRGCs to railroad and highway traffic is most likely one of the main reasons for a substantial number of accidents in the State of Florida (df = 3; χ2 = 324.74; χ2-crit = 11.34 for the daily number of through trains; df = 7; χ2 = 1039.11; χ2-crit = 18.48 for the AADT);
  • The trains at the most hazardous HRGCs were mostly traveling at high speeds (i.e., 355 HRGCs or 61.42% had the maximum timetable train speed of 45 mph at least). A total of 246 HRGCs (or 42.56%) had a highway speed limit of at least 35 mph. High speeds of trains and vehicles is one of the reasons for the accident occurrence at HRGCs and increased severity levels in case of an accident (df = 3; χ2 = 39.90; χ2-crit = 11.34 for the train speed; df = 4; χ2 = 849.48; χ2-crit = 13.28 for the highway speed limit);
  • A total of 374 HRGCs (or 64.71%) that experienced accidents had 1 main track, 145 HRGCs (or 25.69%) had 2 main tracks and 50 HRGCs (or 8.65%) had no main tracks. The number of main tracks was found to be a statistically significant factor influencing the number of accidents (df = 4; χ2 = 835.86; χ2-crit = 13.28);
  • Many hazardous HRGCs had a significant percentage of trucks and buses passing through those crossings on a daily basis (i.e., a total of 266 HRCGs or 46.02% had up to 10% of trucks passing; 194 HRGCs or 33.56% had at least 11 school buses per day). Trucks and other large vehicles generally take more time to pass through HRGCs and may create potential safety hazards for other vehicles in the HRGC vicinity (df = 5; χ2 = 486.41; χ2-crit = 15.09 for the percentage of trucks; df = 5; χ2 = 747.29; χ2-crit = 15.09 for the number of school buses).

5.1.2. Vehicle and Train Characteristics

  • The majority of accidents involved automobiles (425 accidents or 50.72%). A significant number of accidents involved truck-trailers and pedestrians (97 accidents or 11.58% and 87 accidents or 10.38%, respectively). The highway user type was found to have a statistically significant correlation with the number of accidents (df = 9; χ2 = 1665.89; χ2-crit = 21.67);
  • In many cases, the highway user was stopped, stalled or stuck at the HRGC (354 accidents or 42.24%). The position of a highway user was found to have a statistically significant correlation with the number of accidents (df = 5; χ2 = 1273.21; χ2-crit = 15.09);
  • Most of the HRGC accidents in Florida caused a highway vehicle property damage of up to $5000 (275 accidents or 32.82%) (df = 4; χ2 = 287.31; χ2-crit = 13.28). A total of 187 accidents (or 22.32%) resulted in a property damage varying between $5001 and $10,000;
  • A total of 660 accidents (or 78.76%) involved trains with up to 100 people onboard (df = 5; χ2 = 2385.89; χ2-crit = 15.09). However, no more than 10 train passengers were injured in the majority of accidents (39 accidents or 4.65%). Furthermore, a total of 31 railroad employees were injured with no more than 6 railroad employees injured per accident;
  • No more than 50 cars were involved in most of the accidents (586 accidents or 69.93%) (df = 4; χ2 = 1370.53; χ2-crit = 13.28). Moreover, no more than 2 locomotive units were involved in the majority of accidents (745 accidents or 88.90%) (df = 4; χ2 = 907.75; χ2-crit = 13.28).

5.1.3. Spatial, Temporal and Environmental Characteristics

  • The counties with a higher number of accidents were mostly urban areas with big cities that have high population density and travel activities (e.g., Broward and Palm Beach counties have the highest number of accidents with a total of 123 accidents or 14.68% and 106 accidents or 12.65%, respectively);
  • Most of the accidents occurred between 8 AM and 8 PM (a total of 558 accidents or 66.59%), which can be explained by higher exposure of HRGCs to railroad and highway traffic during that time period (df = 23; χ2 = 79.04; χ2-crit = 41.64);
  • A significant number of accidents occurred in November, December, January, March, May and September, which can be justified by changing traffic patterns (e.g., increasing travel activities during holidays or other activities). Additional educational activities can be administered among highway users that often cross HRGCs during holiday seasons and other time periods with higher traffic volumes to make sure that they understand potential safety hazards and do not take risky maneuvers. Even though the month of accident was not showing a statistically significant correlation with the number of accidents at the significance level of α = 0.01 (df = 11; χ2 = 23.45; χ2-crit = 24.72), it becomes a statistically significant factor when increasing the significance level to α = 0.05 (χ2-crit = 19.68);
  • The majority of accidents occurred during weekdays compared to weekends, which can be explained by higher exposure of HRGCs to railroad and highway traffic during weekdays (df = 6; χ2 = 35.18; χ2-crit = 16.81);
  • Many accidents occurred under dark visibility (304 accidents or 36.28%), which was found to be one of the statistically significant reasons causing the accidents (df = 3; χ2 = 563.68; χ2-crit = 11.34);
  • Most of the accidents occurred on dry roadways crossing the HRGCs (667 or 79.59%). Wet roadway condition was recorded for 80 accidents (or 9.55%) only. The roadway condition was still found to have a statistically significant correlation with the number of accidents (df = 3; χ2 = 1351.55; χ2-crit = 11.34).

5.1.4. Driver Actions and Characteristics

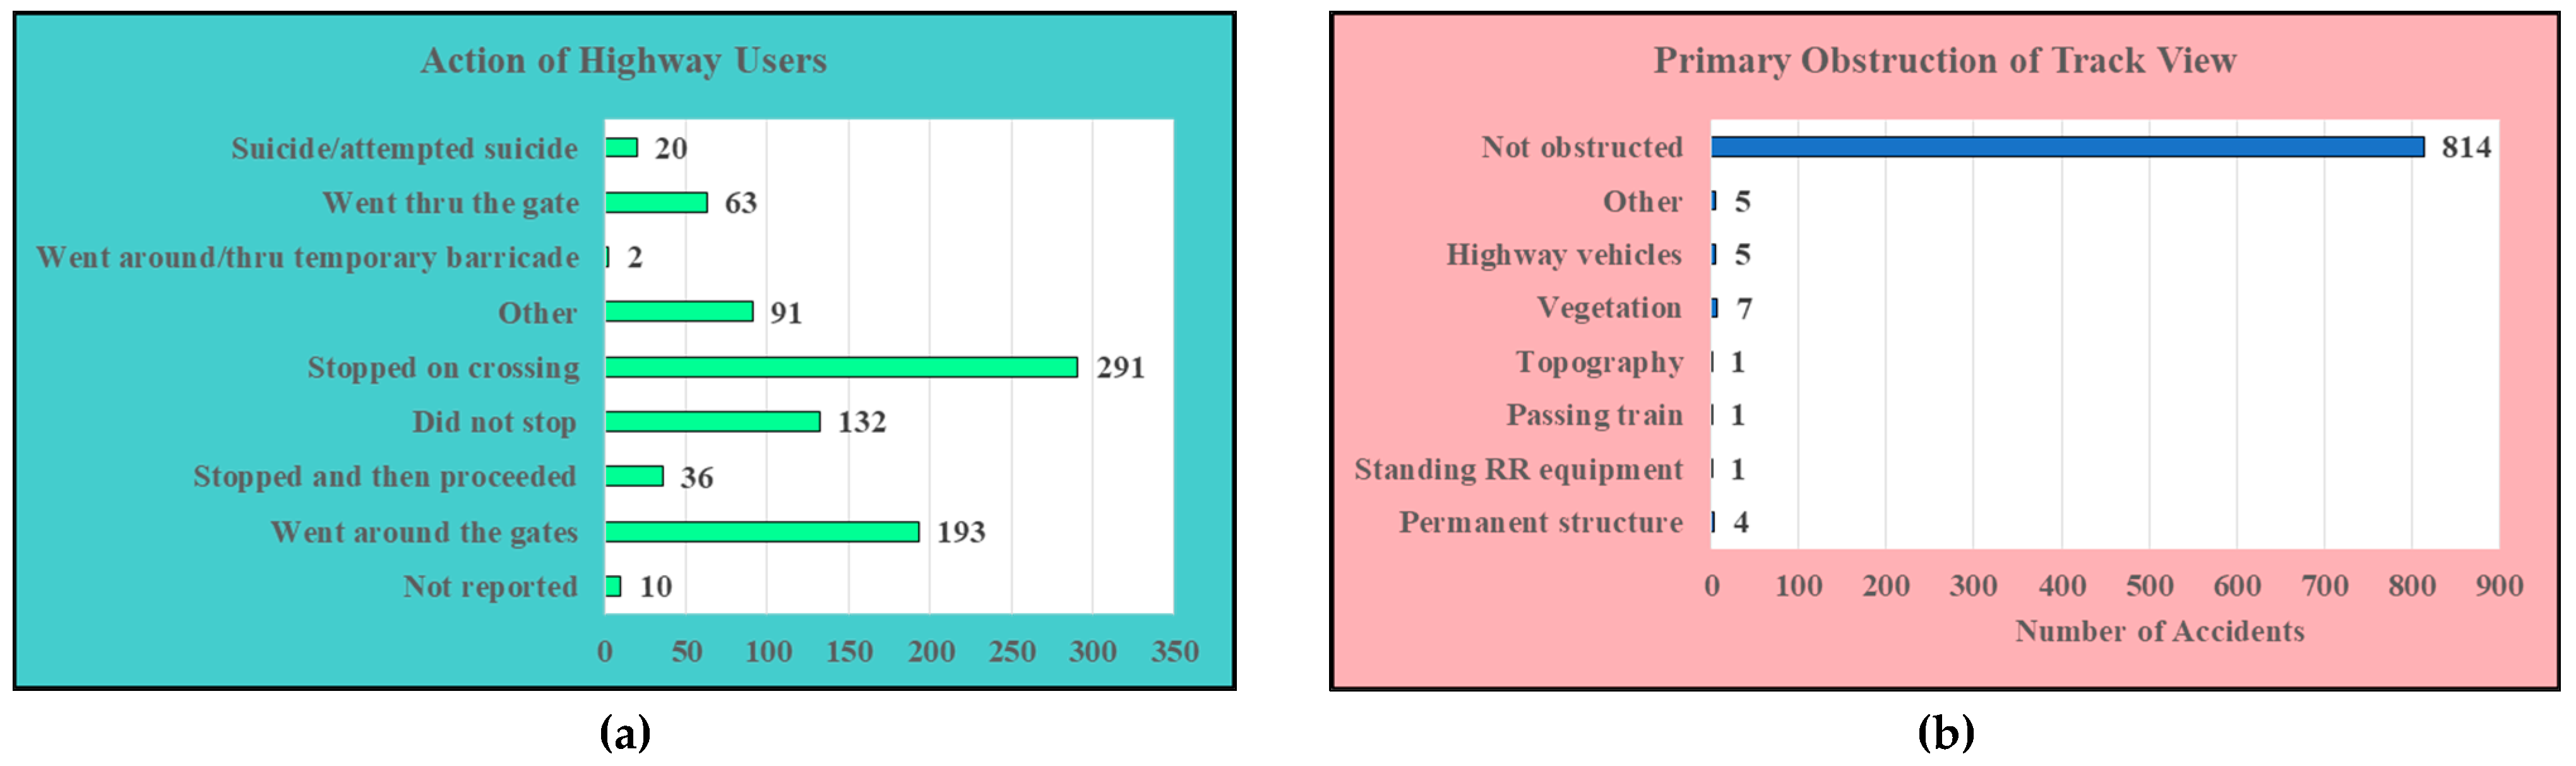
  • It was found that many HRGC accidents occurred when a highway user was trying to drive around the gates (193 accidents or 23.03%) (df = 8; χ2 = 809.54; χ2-crit = 20.09). Therefore, additional countermeasures are needed to prevent highway users driving around the gates (e.g., converting two-quad gates into four-quad gates, installation of channelization devices);
  • The main reason of 20 accidents (or 2.39%) was reported to be a suicide or an attempted suicide;
  • Some obstructions of track view were reported in 24 accidents, including highway vehicles, vegetation, topography, passing trains, railroad equipment and permanent structures. Specific activities should be administered to provide a clear track view for highway users (e.g., vegetation removal);
  • Drivers in the age group of (26-50) years were involved in 315 accidents (or 37.59%) (df = 4; χ2 = 297.66; χ2-crit = 13.28). Furthermore, male drivers were involved in 586 accidents (or 69.93%), and female drivers were reported for 202 accidents (or 24.11%) only (df = 2; χ2 = 546.37; χ2-crit = 9.21). Therefore, young and middle-aged male drivers were mostly involved in HRGC accidents. Additional educational activities can be administered among highway users that often cross HRGCs to make sure that they understand potential safety hazards and do not take risky maneuvers;
  • A total of 80 accidents (or 9.55%) resulted in driver fatalities, and 167 accidents (or 19.33%) resulted in driver injuries;
  • A total 345 HRGCs (or 59.69%) did not have any type of highway monitoring devices that could monitor actions of highway users. Presence of monitoring devices was still found to have a statistically significant correlation with the number of accidents (df = 3; χ2 = 570.17; χ2-crit = 11.34). Installation of highway monitoring devices could be an effective measure of increasing compliance rates with warning devices at HRGCs.

5.2. Challenges and Limitations

  • One of the main limitations of the available FRA databases in a lack of reported data. Many entries in the FRA databases are blank for a significant number of fields (e.g., type of warning devices installed, installation date of current active warning devices, crossing angle, presence of highway monitoring devices, road condition at the moment of accident, age of driver). The issue of insufficient data should be addressed by the appropriate stakeholders, so the analysis of HRGC accidents could be more thorough;
  • The FRA crossing accident database includes very limited information regarding socio-demographic characteristics of drivers involved in HRGC accidents (i.e., age of driver and gender of driver). Additional socio-demographic information (e.g., racial group, marital status, education, occupational status, number of years of driving experience, self-reported driving ability) could provide better insights into the major causes behind accidents;
  • One of the main limitations of the FRA crossing inventory database is unavailability of certain important data. In particular, the FRA crossing inventory database does not include certain important HRGC characteristics that are used by the state authorities and the relevant stakeholders in selection of HRGCs for future safety improvement projects (e.g., average daily number of passengers on school buses, speed of trains by train type, average daily number of train movements by train type) [43,44,45,46]. Additional field reviews must be performed to collect the pertinent HRGC information, which would be critical for accurate selection of HRGCs for future safety improvement projects;
  • Another critical issue that was underlined by some of the previous efforts that used the FRA crossing inventory database is inconsistencies and outdated information [43,46,47]. Some of the information may not be updated for an extended period of time (e.g., AADT, number of daytime through rains, maximum timetable speed of trains, type of train service). Outdated information may result in misleading selection of HRGCs for future safety improvement projects. The issue of data inconsistency and outdated information can be resolved by periodic reviews and evaluations of HRGC databases. An appropriate frequency for the information updates should be established by the state authorities and the relevant stakeholders.

6. Concluding Remarks

Highway-rail grade crossing (HRGC) accidents pose a serious risk of safety to highway users. A significant increase in the number of HRGC accidents globally calls for greater research efforts, including not only the analysis of accidents at HRGCs but also understanding user perception, driver behavior, potential conflicting areas at crossings, effectiveness of countermeasures and user perception towards them. HRGC safety is one of the critical issues in the State of Florida since the state HRGCs experienced a total of 146 fatal injuries and 429 non-fatal injuries between 2010 and 2019. The present study aimed to conduct a detailed analysis of the HRGCs that experienced accidents in Florida over the last years. The databases maintained by the Federal Rail Administration (FRA) were utilized in order to collect the relevant information for a total of 578 crossings that experienced at least one accident from 2010 to 2019. In contrast with many of the previous efforts, the present study investigated a wide range of various factors, including physical and operational characteristics of crossings, vehicle and train characteristics, spatial characteristics, temporal and environmental characteristics, driver actions and related characteristics, and other relevant information.
Based on the conducted analysis, it was found that the majority of accidents occurred at public HRGCs that have either two-quad or four-quad gates. Many HRGCs that experienced accidents were not illuminated (237 HRGCs or 41.00%), which could be the main or one of the reasons causing the accidents. Most of hazardous HRGCs were urban crossings with paved roadways and commercial land use in their vicinity. The majority of HRGCs had high exposure with at least 4 daytime through trains per day and the AADT of up to 10,000. The trains and highway vehicles at the most hazardous HRGCs were mostly traveling at high speeds. Many hazardous HRGCs had a significant percentage of trucks and buses passing through those crossings on a daily basis. A significant percentage of accidents occurred as a result of a highway user being stopped, stalled or stuck at the HRGC. Most of the accidents occurred between 8 AM and 8 PM during weekdays, which can be explained by higher exposure of HRGCs to railroad and highway traffic. Furthermore, it was found that young and middle-aged male drivers were mostly involved in HRGC accidents. Driving around the gates was found to be common among highway users that experienced accidents at HRCGs.
The outcomes of this research will help better understanding the major causes behind accidents at the HRGCs in the State of Florida in a holistic way by considering a variety of relevant factors, which will assist the appropriate stakeholders with implementation of safety improvement projects across the state. A number of challenges were encountered throughout the analysis in this study, and some limitations in the available data were identified. The latter issues can be further investigated and addressed by future studies with the involvement of the relevant stakeholders where appropriate. In particular, the future research should explore potential strategies that can be implemented to address the issue of missing data (e.g., a reporting agency leaves certain fields blank in the FRA databases). Second, additional socio-demographic information of the drivers involved in HRGC accidents should be collected and reported, as such information could provide better insights into the major causes behind accidents. Third, additional field reviews must be performed to collect the pertinent HRGC information, which would be critical for accurate selection of HRGCs for future safety improvement projects. Fourth, the issue of data inconsistency and outdated information should be resolved in future by periodic reviews and evaluations of HRGC databases.

Author Contributions

Conceptualization, P.S., J.P. and M.A.D.; methodology, P.S. and M.A.D.; validation, P.S., J.P. and M.A.D.; formal analysis, P.S., J.P. and M.A.D.; investigation, A.K.-M., K.G., A.R. and M.A.D.; writing—original draft preparation, P.S., A.K.-M., K.G., A.R. and M.A.D.; writing—review and editing, P.S., A.K.-M., K.G., A.R. and M.A.D.; supervision, M.A.D.; project administration, M.A.D. All authors have read and agreed to the published version of the manuscript.

Funding

This study was partially supported by the Florida Department of Transportation (grants BDV30-977-26 and BDV30-977-33). The opinions, findings and conclusions expressed in this publication are those of the authors and not necessarily those of the Florida Department of Transportation or the U.S. Department of Transportation.

Institutional Review Board Statement

Not applicable for this study, as no human subjects or animals were involved.

Informed Consent Statement

Not applicable.

Data Availability Statement

The crossing inventory data and the crossing accident data are open sources and available on the websites maintained by the Federal Railroad Administration (FRA). The FRA crossing inventory data can be downloaded from https://safetydata.fra.dot.gov/OfficeofSafety/publicsite/DownloadCrossingInventoryData.aspx (accessed on 10 May 2021). The FRA crossing accident can be downloaded from (https://safetydata.fra.dot.gov/OfficeofSafety/publicsite/on_the_fly_download.aspx) (accessed on 10 May 2021). Alternatively, the data used in this research can be requested by contacting the corresponding author.

Conflicts of Interest

The authors declare no conflict of interest.

Appendix A

This appendix contains the details regarding the Chi-square (χ2) statistical tests that were conducted to identify whether the factors discussed in Section 4.1, Section 4.2, Section 4.3, Section 4.4, Section 4.5, Section 4.6, Section 4.7 and Section 4.8 of the manuscript have a statistically significant correlation with the number of accidents at the HRGCs in the State of Florida for the considered time period. The Chi-square (χ2) statistical test has been widely used for the statistical analysis of different factors that may potentially impact HRGC safety [6,17,18]. The level of significance was assumed to be α = 0.01. The results from the conducted statistical tests are summarized in Table A1 that includes the following information for each factor: (1) Null Hypothesis (H0); (2) degree of freedom (df); (3) calculated value of χ2; (4) critical value of χ22-crit); and (5) outcome of the conducted statistical test (i.e., either accept or reject H0). Note that H0 could not be evaluated for statistical tests 4, 6, 35 and 36 due to either large number of unreported or zero values. Based on the outcomes presented in Table A1, H0 has been accepted only in two statistical tests (test 14 with H0 “Traffic signals at the intersection near the crossing do not influence the number of accidents” and test 39 with H0 “Month of accident does not correlate with the number of accidents”). Therefore, the majority of factors considered in this study have a statistically significant correlation with the number of accidents at the HRGCs in the State of Florida.
Table A1. Analysis results for the conducted Chi-square (χ2) statistical tests.
a/aNull Hypothesis (H0)dfχ2χ2-critOutcome
Crossing Physical Characteristics
1Type of crossing does not influence the number of accidents2682.769.21Reject
2Illumination does not influence the number of accidents2181.429.21Reject
3Type of warning devices does not influence the number of accidents71494.9118.48Reject
4Installation date of current active warning devices does not influence the number of accidentsNot evaluated due to a large number of unreported values
5Presence of quiet zones does not influence the number of accidents2555.189.21Reject
6Crossing angle does not influence the number of accidentsNot evaluated due to a large number of unreported values
7Crossing surface type does not influence the number of accidents91490.9621.67Reject
8Road classification does not influence the number of accidents2461.839.21Reject
9Road condition does not influence the number of accidents2670.139.21Reject
10Highway monitoring devices do not influence the number of accidents3570.1711.34Reject
11Type of pavement markings does not influence the number of accidents41029.3713.28Reject
12Number of traffic lane does not influence the number of accidents91028.4021.67Reject
13Intersecting roadway near the crossing does not influence the number of accidents2155.759.21Reject
14Traffic signals at the intersection near the crossing do not influence the number of accidents23.689.21Accept
15Type of land use does not influence the number of accidents81288.0520.09Reject
Crossing Operational Characteristics
16Number of daytime through rains does not influence the number of accidents N13324.7411.34Reject
17Number of nighttime through trains does not influence the number of accidents N13329.4711.34Reject
18Number of switching trains does not influence the number of accidents N131254.2411.34Reject
19Maximum timetable speed of trains does not influence the number of accidents N2339.9011.34Reject
20Number of main tracks does not influence the number of accidents4835.8613.28Reject
21Number of other tracks does not influence the number of accidents51408.8315.09Reject
22Type of train service does not influence the number of accidents81127.9520.09Reject
23AADT does not influence the number of accidents71039.1118.48Reject
24Percentage of trucks does not influence the number of accidents5486.4115.09Reject
25Number of school buses per day does not influence the number of accidents N35747.2915.09Reject
26Highway speed limit does not influence the number of accidents N24849.4813.28Reject
Vehicle Characteristics
27Highway user type does not correlate with the number of accidents91665.8921.67Reject
28Number of vehicle occupants does not correlate with the number of accidents82678.3220.09Reject
29Position of a highway user at the crossing does not correlate with the number of accidents51273.2115.09Reject
30Estimated speed of a vehicle does not correlate with the number of accidents N241548.5513.28Reject
31Highway vehicle property damage does not correlate with the number of accidents N44287.3113.28Reject
Train Characteristics
32Number of people on the train does not correlate with the number of accidents52385.8915.09Reject
33Number of train cars does not correlate with the number of accidents41370.5313.28Reject
34Number of locomotive units does not correlate with the number of accidents N54907.7513.28Reject
35Number of train passengers injured does not correlate with the number of accidentsNot evaluated due to a large number of zero values (more than 95%)
36Number of railroad employees injured does not correlate with the number of accidentsNot evaluated due to a large number of zero values (more than 95%)
37Train speed does not correlate with the number of accidents N24271.6513.28Reject
Temporal Characteristics
38Hour of accident does not correlate with the number of accidents2379.0441.64Reject
39Month of accident does not correlate with the number of accidents1123.4524.72Accept
40Weekday does not correlate with the number of accidents635.1816.81Reject
Environmental Characteristics
41Visibility does not correlate with the number of accidents3563.6811.34Reject
42Weather condition does not correlate with the number of accidents41761.4713.28Reject
43Temperature does not correlate with the number of accidents51269.8015.09Reject
44Road condition does not correlate with the number of accidents31351.5511.34Reject
Driver Actions and Characteristics
45Action of highway users does not correlate with the number of accidents8809.5420.09Reject
46Obstruction of track view does not correlate with the number of accidents75488.6318.48Reject
47Driver age does not correlate with the number of accidents4297.6613.28Reject
48Driver gender does not correlate with the number of accidents2546.379.21Reject
49Driver condition after the accident does not correlate with the number of accidents3570.3211.34Reject
Other Pertinent Information
50Accident type does not correlate with the number of accidents1382.296.63Reject
51Railway equipment involvement does not correlate with the number of accidents63116.2116.81Reject
52Accident video taken does not correlate with the number of accidents2202.799.21Reject
53Accident video used does not correlate with the number of accidents2432.709.21Reject
Notes: N1—the following bins were used for the number of trains throughout the χ2 statistical tests: (1) “<5”; (2) “5–15”; (3) “16–25”; and (4) “>25”. N2—the following bins were used for the speed values (mph) throughout the χ2 statistical tests: (1) “<20”; (2) “20–40”; (3) “41–60”; and (4) “>60”. N3—the following bins were used for the number of school buses per day throughout the χ2 statistical tests: (1) “0–20”; (2) “21–40”; (3) “41–60”; (4) “61–80”; (5) “>81”; and (6) “Not reported”. N4—the following bins were used for the highway vehicle property damage (USD) throughout the χ2 statistical tests: (1) “0”; (2) “1–5000”; (3) “5001–10000”; (4) “>10000”; and (5) “Not reported”. N5—the following bins were used for the number of locomotive units throughout the χ2 statistical tests: (1) “0”; (2) “1”; (3) “2”; (4) “3”; and (5) “>3”.

References

  1. UNECE. Statistical Data on Level Crossings and on Their Safety in EU Countries. 2018. Available online: https://unece.org/DAM/trans/doc/2018/wp6/4d_EUAR_LC_safety_stats_June_2018.pdf (accessed on 10 May 2021).
  2. NSC. Railroad Deaths and Injuries. 2021. Available online: https://injuryfacts.nsc.org/home-and-community/safety-topics/railroad-deaths-and-injuries/ (accessed on 10 May 2021).
  3. Beanland, V.; Salmon, P.M.; Filtness, A.J.; Lenné, M.G.; Stanton, N.A. To stop or not to stop: Contrasting compliant and non-compliant driver behavior at rural rail level crossings. Accid. Anal. Prev. 2017, 108, 209–219. [Google Scholar] [CrossRef] [Green Version]
  4. Saccomanno, F.F.; Park, P.Y.-J.; Fu, L. Estimating countermeasure effects for reducing collisions at highway–railway grade crossings. Accid. Anal. Prev. 2007, 39, 406–416. [Google Scholar] [CrossRef]
  5. Evans, A.W. Fatal accidents at railway level crossings in Great Britain 1946–2009. Accid. Anal. Prev. 2011, 43, 1837–1845. [Google Scholar] [CrossRef] [PubMed] [Green Version]
  6. Laapotti, S. Comparison of fatal motor vehicle accidents at passive and active railway level crossings in Finland. IATSS Res. 2016, 40, 1–6. [Google Scholar] [CrossRef] [Green Version]
  7. EUR-Lex. Commission Directive 2014/88/EU. 2021. Available online: https://eur-lex.europa.eu/legal-content/ (accessed on 16 July 2021).
  8. Dulebenets, M.A.; Moses, R.; Sobanjo, J.; Ozguven, E.E.; Abioye, O.F.; Kavoosi, M.; Pasha, J. Development of the Optimization Model for Improving Safety at Rail Crossings in Florida; A Technical Report; Florida Department of Transportation: Tallahassee, FL, USA, 2020. [Google Scholar]
  9. FRA. Accident/Incident Data. 2020. Available online: https://safetydata.fra.dot.gov/OfficeofSafety/publicsite/on_the_fly_download.aspx (accessed on 27 May 2020).
  10. Hao, W. Driver Injury Severity at U.S. Highway-Rail Crossings. Ph.D. Thesis, Department of Civil and Environmental Engineering, NJIT, Newark, NJ, USA, 2013. [Google Scholar]
  11. Haleem, K.; Gan, A. Contributing factors of crash injury severity at public highway-railroad grade crossings in the U.S. J. Saf. Res. 2015, 53, 23–29. [Google Scholar] [CrossRef] [PubMed]
  12. Haleem, K. Investigating risk factors of traffic casualties at private highway-railroad grade crossings in the United States. Accid. Anal. Prev. 2016, 95, 274–283. [Google Scholar] [CrossRef]
  13. Hao, W.; Kamga, C.; Wan, D. The effect of time of day on driver’s injury severity at highway-rail grade crossings in the United States. J. Traffic Transp. Eng. English Ed. 2016, 3, 37–50. [Google Scholar] [CrossRef] [Green Version]
  14. Zhao, S.; Khattak, A.J. Factors associated with self-reported inattentive driving at highway-rail grade crossings. Accid. Anal. Prev. 2017, 109, 113–122. [Google Scholar] [CrossRef]
  15. Keramati, A.; Lu, P.; Zhou, X.; Tolliver, D. A Simultaneous safety analysis of crash frequency and severity for highway-rail grade crossings: The competing risks method. J. Adv. Transp. 2020, 2020, 1–13. [Google Scholar] [CrossRef]
  16. U.S. DOT. Role of Human Factors in Rail Accidents. 2007. Available online: https://www.transportation.gov/testimony/role-human-factors-rail-accidents (accessed on 5 May 2021).
  17. Tey, L.-S.; Ferreira, L.; Wallace, A. Measuring driver responses at railway level crossings. Accid. Anal. Prev. 2011, 43, 2134–2141. [Google Scholar] [CrossRef] [Green Version]
  18. Silla, A.; Luoma, J. Main characteristics of train–pedestrian fatalities on finnish railroads. Accid. Anal. Prev. 2012, 45, 61–66. [Google Scholar] [CrossRef] [PubMed]
  19. Naweed, A. Psychological factors for driver distraction and inattention in the Australian and New Zealand rail industry. Accid. Anal. Prev. 2013, 60, 193–204. [Google Scholar] [CrossRef]
  20. Read, G.J.; Salmon, P.M.; Lenné, M.G. Sounding the warning bells: The need for a systems approach to understanding behavior at rail level crossings. Appl. Ergon. 2013, 44, 764–774. [Google Scholar] [CrossRef] [PubMed]
  21. Salmon, P.M.; Read, G.; Stanton, N.; Lenné, M.G. The crash at Kerang: Investigating systemic and psychological factors leading to unintentional non-compliance at rail level crossings. Accid. Anal. Prev. 2013, 50, 1278–1288. [Google Scholar] [CrossRef] [PubMed]
  22. Kyriakidis, M.; Majumdar, A.; Ochieng, W.Y. Data based framework to identify the most significant performance shaping factors in railway operations. Saf. Sci. 2015, 78, 60–76. [Google Scholar] [CrossRef]
  23. Liu, J.; Khattak, A.J.; Richards, S.H.; Nambisan, S. What are the differences in driver injury outcomes at highway-rail grade crossings? Untangling the role of pre-crash behaviors. Accid. Anal. Prev. 2015, 85, 157–169. [Google Scholar] [CrossRef]
  24. Stefanova, T.; Burkhardt, J.M.; Filtness, A.; Wullems, C.; Rakotonirainy, A.; Delhomme, P. Systems-based approach to investigate unsafe pedestrian behavior at level crossings. Accid. Anal. Prev. 2015, 81, 167–186. [Google Scholar] [CrossRef] [Green Version]
  25. Madigan, R.; Golightly, D.; Madders, R. Application of human factors analysis and classification system (HFACS) to UK rail safety of the line incidents. Accid. Anal. Prev. 2016, 97, 122–131. [Google Scholar] [CrossRef] [Green Version]
  26. Larue, G.S.; Naweed, A.; Rodwell, D. The road user, the pedestrian, and me: Investigating the interactions, errors and escalating risks of users of fully protected level crossings. Saf. Sci. 2018, 110, 80–88. [Google Scholar] [CrossRef]
  27. Lin, P.-S.; Fabregas, A.; Kourtellis, A.; Bryant, E.; Lall, S. Planning and design for prevention of incorrect turns onto highway-rail grade crossings. Chall. Adv. Sustain. Transp. Syst. 2014, 358–365. [Google Scholar] [CrossRef]
  28. Keramati, A.; Lu, P.; Tolliver, D.; Wang, X. Geometric effect analysis of highway-rail grade crossing safety performance. Accid. Anal. Prev. 2020, 138, 105470. [Google Scholar] [CrossRef]
  29. Silla, A.; Kallberg, V.-P. The development of railway safety in Finland. Accid. Anal. Prev. 2012, 45, 737–744. [Google Scholar] [CrossRef]
  30. Chadwick, S.G.; Zhou, N.; Saat, M.R. Highway-rail grade crossing safety challenges for shared operations of high-speed passenger and heavy freight rail in the U.S. Saf. Sci. 2014, 68, 128–137. [Google Scholar] [CrossRef]
  31. Phillips, R.O.; Sagberg, F. What did you expect? CREAM analysis of hazardous incidents occurring on approach to rail signals. Saf. Sci. 2014, 66, 92–100. [Google Scholar] [CrossRef]
  32. Khattak, A.; Tung, L.-W. Severity of Pedestrian Crashes at Highway-Rail Grade Crossings. J. Transp. Res. Forum 2015, 54, 91–100. [Google Scholar] [CrossRef]
  33. Metaxatos, P.; Sriraj, P.S. Pedestrian safety at rail grade crossings: Focus areas for research and intervention. Urban Rail Transit 2015, 1, 238–248. [Google Scholar] [CrossRef] [Green Version]
  34. Abioye, O.F.; Dulebenets, M.A.; Pasha, J.; Kavoosi, M.; Moses, R.; Sobanjo, J.; Ozguven, E.E. Accident and hazard prediction models for highway–rail grade crossings: A state-of-the-practice review for the USA. Railw. Eng. Sci. 2020, 28, 251–274. [Google Scholar] [CrossRef]
  35. Kavoosi, M.; Dulebenets, M.A.; Pasha, J.; Abioye, O.F.; Moses, R.; Sobanjo, J.; Ozguven, E.E. Development of algorithms for effective resource allocation among highway–rail grade crossings: A case study for the state of Florida. Energies 2020, 13, 1419. [Google Scholar] [CrossRef] [Green Version]
  36. Khattak, A.; Kang, Y.; Liu, H. Nebraska Rail Crossing Safety Research. 2020. Available online: https://dot.nebraska.gov/media/114447/nebraska-rail-crossing-safety-research.pdf (accessed on 10 May 2021).
  37. Pasha, J.; Dulebenets, M.A.; Abioye, O.F.; Kavoosi, M.; Moses, R.; Sobanjo, J.; Ozguven, E.E. A comprehensive assessment of the existing accident and hazard prediction models for the highway-rail grade crossings in the state of Florida. Sustainability 2020, 12, 4291. [Google Scholar] [CrossRef]
  38. Das, S.; Kong, X.; Lavrenz, S.M.; Wu, L.; Jalayer, M. Fatal crashes at highway rail grade crossings: A U.S. based study. Int. J. Transp. Sci. Technol. 2021. [Google Scholar] [CrossRef]
  39. FRA. FRA Office of Safety Analysis. 2021. Available online: https://safetydata.fra.dot.gov/OfficeofSafety/default.aspx (accessed on 19 June 2021).
  40. FRA. Highway-Rail Crossing Inventory Data. 2020. Available online: https://safetydata.fra.dot.gov/officeofsafety/publicsite/downloaddbf.aspx (accessed on 27 May 2020).
  41. Dulebenets, M.A. Highway-Rail Grade Crossing Identification and Prioritizing Model. Development. Master’s Thesis, Department of Civil Engineering, The University of Memphis, Memphis, TN, USA, 2012. [Google Scholar]
  42. Fan, W.; Kane, M.R.; Haile, E. Analyzing severity of vehicle crashes at highway-rail grade crossings: Multinomial logit modeling. J. Transp. Res. Forum 2015, 54, 39–56. [Google Scholar] [CrossRef] [Green Version]
  43. Bowman, B.L. Assessment of the State of Alabama Rail-Highway Safety Program. A Technical Report Prepared for Alabama Department of Transportation. 1994. Available online: http://www.eng.auburn.edu/files/centers/hrc/Multimodal%20Transportation.pdf (accessed on 10 May 2021).
  44. Elzohairy, Y.; Benekohal, R. Evaluation of Expected Accident Frequency Formulas for Rail-Highway Highway-Rail Grade Crossings. A Technical Report Prepared for Illinois Department of Transportation. 2000. Available online: http://www.idot.illinois.gov/Assets/uploads/files/Transportation-System/Research/Illinois-Transportation-Research-Center/2000.09.01%20-%20Evaluation%20of%20Expected%20Accident%20Frequency%20Formulas%20for%20Rail-Highway%20Crossings%20-%20VC-HR1%20FY98.pdf (accessed on 10 May 2021).
  45. Qureshi, M.; Virkler, M.; Bernhardt, K.; Spring, G.; Avalokita, S.; Yathapu, N.; Chilukuri, V.; King, T.; Gibbons, K. Highway Rail Highway-Rail Grade Crossing Project Selection. A Technical Report Prepared for Missouri Department of Transportation. 2003. Available online: https://library.modot.mo.gov/RDT/reports/Ri01010/RDT03017.pdf (accessed on 10 May 2021).
  46. Sperry, B.; Naik, B.; Warner, J. Evaluation of Grade Crossing Hazard. Ranking Models. Ohio Transportation Engineering Conference. 2017. Available online: http://www.dot.state.oh.us/engineering/OTEC/2017Presentations/75/Sperry_75.pdf (accessed on 10 May 2021).
  47. Hans, Z.; Albrecht, C.; Johnson, P.; Nlenanya, I. Development of Railroad Highway Grade Highway-Rail Grade Crossing Consolidation Rating Formula. A Technical Report Prepared for Iowa Department of Transportation. 2015. Available online: https://lib.dr.iastate.edu/cgi/viewcontent.cgi?referer=&httpsredir=1&article=1061&context=intrans_techtransfer (accessed on 10 May 2021).
Figure 1. Number of fatal and serious injuries at HRGCs in the E.U. for 2006–2016.
Sustainability 13 08842 g001
Figure 2. Number of fatal and non-fatal injuries at HRGCs in the U.S. for 2007–2019.
Sustainability 13 08842 g002
Figure 3. Distribution of different crossing types across the State of Florida.
Sustainability 13 08842 g003
Figure 4. Distribution of HRGC accidents in the State of Florida by year between 2010 and 2019.
Sustainability 13 08842 g004
Figure 5. Distribution of HRGCs by (a) Crossing type; (b) Presence of illumination; (c) Type of warning devices installed and (d) Installation date of current active warning devices.
Sustainability 13 08842 g005
Figure 6. Distribution of HRGCs by (a) Presence of quiet zones; (b) Crossing angle and (c) Crossing surface type.
Sustainability 13 08842 g006
Figure 7. Distribution of HRGCs by (a) Classification of road; (b) Condition of roadway at the crossing; (c) Highway monitoring devices installed; (d) Type of pavement markings and (e) Number of traffic lanes crossing the railroad.
Sustainability 13 08842 g007
Figure 8. Distribution of HRGCs by (a) Intersecting roadway near the crossing; (b) Presence of traffic signals at the intersection and (c) Type of land use.
Sustainability 13 08842 g008
Figure 9. Distribution of HRGCs by (a) Total number of daytime through rains; (b) Number of nighttime through trains; (c) Number of switching trains and (d) Maximum timetable speed of trains.
Sustainability 13 08842 g009
Figure 10. Distribution of HRGCs by (a) Number of main tracks; (b) Number of other tracks and (c) Type of train service.
Sustainability 13 08842 g010
Figure 11. Distribution of HRGCs by (a) AADT; (b) Estimated percentage of trucks; (c) Average number of school buses per day and (d) Highway speed limit at crossings.
Sustainability 13 08842 g011
Figure 12. Distribution of HRGC accidents by (a) Highway user type; (b) Number of vehicle occupants and (c) Position of a highway user at the crossing.
Sustainability 13 08842 g012
Figure 13. Distribution of HRGC accidents by (a) Estimated speed of a vehicle and (b) Highway vehicle property damage.
Sustainability 13 08842 g013
Figure 14. Distribution of HRGC accidents by (a) Number of people on the train; (b) Number of cars and (c) Number of locomotive units.
Sustainability 13 08842 g014
Figure 15. Distribution of HRGC accidents by (a) Number of train passengers injured; (b) Number of railroad employees injured and (c) Train speed.
Sustainability 13 08842 g015
Figure 16. Locations of HRGCs that experienced train-vehicle accidents across the State of Florida.
Sustainability 13 08842 g016
Figure 17. Distribution of HRGC accidents by (a) Hour of accident; (b) Month and (c) Weekday.
Sustainability 13 08842 g017
Figure 18. Distribution of HRGC accidents by (a) Visibility; (b) Weather condition; (c) Temperature and (d) Road condition.
Sustainability 13 08842 g018
Figure 19. Distribution of HRGC accidents by (a) Action of highway users and (b) Obstruction of track view.
Sustainability 13 08842 g019
Figure 20. Distribution of HRGC accidents by (a) Driver age; (b) Gender and (c) Condition after the accident.
Sustainability 13 08842 g020
Figure 21. Distribution of HRGC accidents by (a) Accident type; (b) Railway equipment involvement; (c) Accident video taken and (d) Accident video used.
Sustainability 13 08842 g021
Table 1. Statistical analysis results obtained from the generalized linear regression model.
EstimateS.E.t-Statp-Value
Intercept−6.466701.51050−4.281160.00002 ***
Crossing type (“TypeXing”)−1.145720.32797−3.493370.00048 ***
Presence of illumination (“Illumina”)0.341990.081554.193580.00003 ***
Warning device type (“WdCode”)0.018280.041330.442300.65827
Presence of quiet zones (“Whistban”)0.431370.124383.468190.00052 ***
Crossing surface type (“XSurfaceIDs”)0.043010.046490.925140.35490
Road classification (“HwyClassCD”)0.689740.158304.357180.00001 ***
Condition of roadway at the crossing (“HwyPved”)−0.420400.25400−1.655130.09790
Presence of highway monitoring devices (“MonitorDev”)−0.086810.04075−2.130090.03316 *
Type of pavement markings (“PaveMrkIDs”)0.038520.085920.448340.65391
Number of traffic lanes crossing the railroad (“TraficLn”)0.167450.060832.752840.00591 **
Presence of intersecting roadway near the crossing (“HwyNear”)−0.321020.11427−2.809440.00496 **
Presence of traffic signals at the nearby intersection (“HwynrSig”)−0.077680.07206−1.078050.28101
Type of land use (“DevelTypID”)0.020600.034540.596420.55090
Number of daytime through rains (“DayThru”)0.030460.009053.364500.00077 ***
Number of nighttime through trains (“NghtThru”)0.015100.015021.004920.31493
Number of switching trains (“TotalSwt”)0.031690.013302.382460.01720 *
Maximum timetable speed of trains (“MaxTtSpd”)0.018850.002547.43356<0.00001 ***
Number of main tracks (“MainTrk”)0.350150.090623.863860.00011 ***
Number of other tracks (“OthrTrk”)0.016080.081010.198430.84271
Type of train service (“TypeTrnSrvcIDs”)0.342450.091273.752030.00018 ***
AADT (“Aadt”)0.000010.000011.321200.18644
Estimated percentage of trucks (“PctTruk”)0.007880.006121.288780.19747
Average number of school buses per day (“SchlBsCnt”)0.004940.002382.071890.03828 *
Highway speed limit at crossings (“HwySpeed”)0.030180.005825.18882<0.00001 ***
Analysis summary: number of observations = 9090; Chi^2-statistic vs. constant model: 1.16e+03; p-value of the model = 2.79e-230. Notes: * p-value ≤ 0.05; ** p-value ≤ 0.01; *** p-value ≤ 0.001.
Publisher’s Note: MDPI stays neutral with regard to jurisdictional claims in published maps and institutional affiliations.

