
A Data-Driven Approach to Evaluation of Sustainability Reporting Practices in Extractive Industries


1
Mining Engineering Department, Colorado School of Mines, Golden, CO 80401, USA
2
Civil and Environmental Engineering Department, Colorado School of Mines, Golden, CO 80401, USA
*
Authors to whom correspondence should be addressed.
Sustainability 2021, 13(16), 8716; https://doi.org/10.3390/su13168716
Submission received: 8 July 2021
/
Revised: 26 July 2021
/
Accepted: 31 July 2021
/
Published: 4 August 2021
(This article belongs to the Special Issue Design for Sustainability in the Minerals Sector)
Abstract
:Sustainability reporting is one of the tools that contribute to incorporating sustainable development in the design of extractive operations (i.e., “Design for Sustainability”), and the demand for sustainability reports is increasing due to the increased focus on sustainable development and sustainable financing efforts. The extractive industries are believed to have unique strengths to contribute to achieving the Sustainable Development Goals. Nonetheless, companies are expected to be transparent and accountable not only to investors but to all stakeholders, including communities, suppliers, clients, employees, and governments. Therefore, extractive industries require effective sustainability accounting and reporting to transition and contribute to sustainable development. Through a data-driven approach, this paper examines the scope and consistency of sustainability indicators used in the sustainability reports of eight oil and gas and eight mining companies from 2012 to 2018. Through content analysis and relevant statistical methods, we analyze the ways in which companies reported on their contributions to sustainable development, with a focus on indicators used and trends over time both within each industry and between industries. We demonstrate that extractive industries’ sustainability reporting practices are not consistent over time and that internal issues are better represented than external issues, in particular transportation and supply chain issues. Furthermore, while there are similar trends across the industries in terms of social and environmental indicator reporting, there are significant differences in economic reporting. We conclude that although both industries have established sustainability reporting practices, there are trends that demonstrate what companies are focusing on more, as well as areas for improvement. We see this as an initial step for conceptualizing how these industries can more objectively, consistently, and effectively assess and contribute to sustainable development.
1. Introduction
Many environmental disasters and human rights incidents that have attracted public concern over the last five decades have taken place in the mining and oil and gas industries [1]. Hence, both industries have been a focus of debates about environmental sustainability and social responsibility [2], and companies belonging to the extractive industries generally have been subjected to more stakeholder pressure than others [3,4]. As a result many companies publish yearly sustainability reports to publicly broadcast their economic, environmental, and social impacts and their contributions to sustainable development [5,6].
Corporate sustainability reporting frameworks and guidelines include sets of indicators to guide corporations in assessing and communicating their sustainable development performance [7]. The need for indicators to evaluate sustainability and guide the sustainable development process was initially raised by Agenda 21 at the Rio Conference in 1992. After this, indicators started to be developed and widely used in sustainability assessments [8,9,10]. Companies often use the indicators provided in various guidelines/frameworks (i.e., Global Reporting Initiative (GRI), International Petroleum Industry Environmental Conservation Association (IPIECA), CDP-formerly known as “Carbon Disclosure Project”) to measure, monitor, and report their sustainable development performance. Oil and gas and mining companies constantly evolve their sustainability reporting schemes [11,12], and these reports vary in terms of which indicators are used, the methodologies used to assess the indicators, the reporting styles, and the content [2,13]. The individual choices companies make about their approaches to sustainability reporting and which sustainability issues to disclose creates subjectivity [14,15,16] and temporal variability in sustainability reporting practices.
Previous analyses of the use of indicators in sustainability reporting suffer from being limited to one industry, one year, assessing only GRI indicators, one dimension of sustainability, or companies based in one country. This study adds to our understanding of sustainability reporting in the extractive industries by providing an analysis of the indicators that appeared in eight oil and gas and eight mining companies’ corporate sustainability reports from 2012 to 2018. Through a comparison of the indicators that appeared in these reports with a comprehensive set of sustainable development indicators compiled from the literature, we reveal the scope and consistency of indicators used in these reports. Through a data-driven approach, we extracted data from the sustainability reports using a content analysis and provided a temporal analysis of the appearance of indicators to identify and compare the reporting trends within and between each industry. We then conducted hypothesis testing with relevant statistical methods to assess whether or not the temporal variabilities observed in reporting were statistically significant. This analysis demonstrates that extractive industries’ sustainability reporting practices are not consistent over time and that internal issues (i.e., issues associated with a companies’ internal operating procedures or employees) are better represented than external issues (i.e., issues associated with companies’ relations with communities and other stakeholders.), in particular transportation and supply chain issues. Similarly, direct environmental issues (i.e., issues that are directly related to the company and its operations and that do not involve any third parties) are reported on more than indirect environmental issues (i.e., issues involving third parties such as suppliers, contractors, and communities). Furthermore, while there are similar trends across the industries in terms of social and environmental indicator reporting, there are significant differences in economic reporting, in particular on technology. We conclude that although both industries have established sustainability reporting practices, there are trends that show what companies are focusing on more, as well as areas for improvement. We see this as an initial step for conceptualizing how these industries can more objectively, consistently, and effectively assess and contribute to sustainable development.
1.1. Sustainability Reporting in the Extractive Industries
Oil and gas companies’ first efforts at sustainability reporting occurred in the 1980s, and mining companies followed suit in the 1990s [2]. Although the primary focus was on producing stand-alone environmental reports [12,17,18], both industries have since expanded their scope and become more invested in sustainability reporting than most other industries [3,7,19]. In the last decade, research on indicators used in sustainability reports of oil and gas and mining companies has primarily focused on a single industry (either oil and gas or mining); however, the research has varied in terms of scope. For example, some studies have focused on the indicators companies used in a single year [7,17,18,20,21,22,23], and others have examined the trends in reporting practices over time [2,3,19,24,25,26,27,28,29,30], but hypothesis testing to assess the statistical significance of the temporal trends in reporting has not been conducted. Likewise, some studies have focused on a single dimension of sustainability (e.g., only environmental indicators) [17,20,22,25], while others investigated more than one dimension [2,3,7,18,21,24,26,27,28,29]. However, none of these studies simultaneously addressed both the oil and gas and mining industries and the three dimensions of sustainability.
Sustainability reporting provides several potential benefits for companies. It can increase companies’ understandings of risks and opportunities, and it can provide them with the opportunity to increase transparency and therefore enhance their credibility and brand value in the eyes of customers, suppliers, and broader society [31]. It has also been viewed as a response to increased environmental and societal pressures and as a component of obtaining and maintaining a “social license to operate” [12,17,18]. It may increase competitiveness by allowing companies to benchmark and assess their sustainability performance with regard to legislation, standards, and voluntary initiatives, and it may motivate employees to learn more about and implement measures to contribute to companies’ sustainability performance. “Development of sustainable development indicators and reporting and ongoing improvement against these indicators” is key for what has been referred to as “Design for Sustainability” in both the production and mineral processing stages of a mining operation [32]. Recording and reporting of sustainability risks and opportunities are also essential for better management of extractive operations, as they can be integrated into the project management system [33]. Finally, it can encourage companies to streamline their processes and reduce costs by increasing efficiency [28,34,35,36,37].
Despite the benefits, criticisms have been lodged at the transparency, reliability, thoroughness, and utility of sustainability reports and the data presented within [38]. On its own, sustainability reporting has been criticized for its mostly voluntary nature, and companies have not appeared to prioritize sustainability reporting [38]. Companies have also been accused of “greenwashing”, or presenting a favorable rather than a realistic view of their performance [13,38], and exerting a significant level of higher management control over the reporting process without implementing any accountability or auditing mechanisms [38]. No less, sustainability reports are still the most institutionalized resource that discloses companies’ activities related to sustainable development, and the demand for sustainability reports is increasing [24]. Because large-scale extractive companies often operate multi-nationally, and in some cases are required to report on aspects of sustainability, while in other cases reporting is voluntary [39], there is a certain degree of subjectivity in sustainability reporting [40,41,42]. This has potential political and managerial implications [41,42] and may contribute to the variation that occurs in these reports. However, among multinational corporations, traditional reporting topics and employment data have become more standardized as companies gain more experience reporting on these topics and their measurement is relatively more straightforward than other issues [37].
1.2. Oil and Gas and Sustainability Reporting
Research on sustainability reporting practices of oil and gas companies has mostly focused on the ways in which companies are using the GRI indicators and the trends in reporting over time. Alazzani and Wan-Hussin (2013) evaluated the environmental reporting in 2009 of eight oil and gas companies against the GRI 2006 Sustainability Reporting Guidelines and revealed the least and most disclosed environmental indicators [20]. They concluded that companies made reasonable efforts to report their environmental performance in accordance with the GRI guidelines, that the voluntary adoption of GRI guidelines increased transparency, credibility, and comparability in sustainability reporting, and that the GRI guidelines should be adopted more widely among the industry [20]. Another study on environmental reporting by Khan et al. (2019) investigated the reporting of 30 environmental GRI indicators by 12 oil and gas companies in Pakistan for the years 2010–2014. They showed that overall, there was an increase in the presence of the indicators; however, the majority of the companies had relatively low coverage of these indicators, and the indicators were not consistently disclosed over the years [25]. Orazalin and Mahmood (2018) evaluated the trends in sustainability reporting practices of the Russian oil and gas industry by manually collecting data from sustainability reports, annual reports, and audited financial statements of fifty companies from 2012 to 2016. The authors used the GRI-based environmental, social, and economic indicators for evaluation and analyzed the extent of disclosure in each pillar. They found a steady increase in the quantity of environmental and economic indicators disclosed across the survey years and detected an increasing trend in triple bottom line sustainability reporting, which measures a corporation’s performance across the three main pillars of sustainability: economy, society, and the environment [13]. They suggested that triple bottom line reporting resulted in more extensive sustainability disclosures [28].
Some studies have examined the relationship between the reporting practices of oil and gas companies and other parameters. Summerhays and De Villiers (2012) reported that the six largest oil and gas companies increased their environmental disclosures in response to the 2010 Gulf of Mexico oil spill, and Hourneaux et al. (2017) examined the association between companies’ corporate strategies and their reporting on sustainability indicators. Through a comparative study of two large oil and gas companies using the GRI-G4 indicators, they identified the indicator categories that were and were not connected to each company’s corporate strategy. Their results showed that the indicator categories that were strongly connected to strategy elements included labor practices and decent work, environmental compliance, and indirect economic impacts, while transportation had a very limited connection to company strategies. The authors also detected an imbalance in triple bottom line reporting, with a dominance of social aspects [24]. In another study, Mahmood and Orazalin (2017) examined the relationships between corporate board characteristics and sustainability reporting practices of 30 Kazakhstan oil and gas companies between 2010 and 2013 by using GRI indicators and found that the board’s gender diversity and size had a positive impact on the scope and quality of environmental reporting [26].
1.3. Mining and Sustainability Reporting
Research on sustainability reporting in the mining industry has primarily focused on understanding the trends and evolution of reporting practices in all sustainability pillars (social, environmental, and economic) and has emphasized the importance of integrated sustainability reporting. Yongvanich and Guthrie (2005) argued that reporting both financial and nonfinancial performance is essential. Their content analysis, based on 73 indicators that appeared in annual reports of 17 Australian mining companies for the financial year 2002, revealed the disclosure frequency of each indicator. They showed that although companies reported an average of 48% of all indicators, they disclosed only a small portion of environmental and social indicators [21].
A number of studies have investigated the trends in reporting practices in the mining industry over the years. Jenkins and Yakovleva (2006) performed a temporal analysis of reporting of ten mining companies between 1999 and 2003. Although they found substantial variability in the reporting practices among these companies, there were increasing trends in social and environmental reporting, as well as in the incorporation of economic disclosures in the stand-alone Social and Environmental Reports. There was also a trend toward covering more complex issues related to sustainable development and corporate social responsibility (CSR). Similarly, Perez and Sanchez (2009) assessed the evolution of sustainability reporting in the mining sector between the years 2001 and 2006 by performing a content analysis of the sustainability reports of four mining companies. They compared these companies’ reporting performance and adherence to best practices and scored them according to the most and least addressed topics. The social performance reporting score was the highest for all companies, and the economic performance score was the lowest. The environmental performance had the most variability in the reports. Furthermore, all of the companies showed an improvement in their sustainability reports in terms of structure and comprehensiveness. Lee (2017) investigated the relationship between the quality and quantity of environmental disclosures of 55 Australian mining companies based on their 2013 reports and the indicators in the GRI’s Mining and Metals Sector Supplement. They found that the number of environmental disclosures of these companies was positively and significantly correlated with market capitalization and disclosure quality (i.e., the usefulness of information in understandability, relevance, reliability, and comparability) [22]. Analyzing the literature on sustainability accounting and reporting practices in the mining industry from 2004 to 2013, Lodhia and Hess (2014) concluded that these practices were evolving slowly in the mining industry, and they identified the need for future studies that analyze the social, environmental, and economic aspects disclosed by companies and the extent to which they are integrated [29]. Yaylaci and Duzgun (2016) compiled 347 sustainability indicators specific to the mining sector in their study that proposes an indicator-based sustainability assessment framework for the mining sector [43].
1.4. Comparing Industries
Few studies have examined the sustainability reporting practices of both the oil and gas and mining industries. Raufflet et al. (2014) assessed the CSR practices in both industries through interviews with experts and practitioners in the extractive industries and through a content analysis of “regulatory scripts” in company reports in 2011, defined as shared practices among the sector in response to international frameworks and standards. They found that environmental topics (excluding transportation) and social, health, and safety issues were particularly well covered [18]. Guenther et al. (2007) assessed the reporting practices of the two industries but limited the analysis to GRI environmental indicators over a one-year period. Their results revealed the three most commonly and comprehensively reported indicators as total water use, compliance, and air emissions and showed that only one-third of the GRI environmental indicators were reported. They also showed significant differences in environmental reporting between the two industries. Suska (2021) assessed the annual reports of the two industries for 2014–2019 and focused on the environmental and climate responsibility initiatives of three Polish companies. They showed that both industries were working toward reducing their environmental impact caused by wastewater discharge but that there were areas for improvement in reporting on carbon emissions and waste management [30]. Dilling (2016) examined the financial and sustainability reports of the two industries and found that in 2012, Canadian companies’ minimally disclosed information related to long-term value creation [23].
Building on the research outlined above, we investigated oil and gas and mining companies’ approaches to sustainability reporting using a data-driven approach. Considering the individual choices companies make in their reporting in terms of the indicators, reporting methodologies, styles, and content [2,13], we hypothesized (i) that the reporting practices of extractive industries show temporal variability and (ii) that there are differences between the reporting practices of oil and gas and mining companies. Although our hypotheses concur with the literature, testing these hypotheses with a data-driven approach that includes statistical tests has not been conducted. Therefore, our analysis of both industries’ sustainability reporting practices addresses this gap by revealing the statistical significance of these temporal trends. Here, we provide an analysis of eight oil and gas companies’ and eight mining companies’ reports over seven years to identify and compare the reporting trends both within and between industries. Using the triple bottom line approach to sustainable development and including environmental, social, and economic indicators in our analysis, we respond to a call from Lodhia and Hess (2014) to examine the integration of social, environmental, and economic aspects disclosed by companies [29]. Our study also shows that external issues, in particular those related to supply chains, are relatively overlooked in the sustainability reports of extractive industries and that there is more thorough reporting on internal issues. Likewise, indirect environmental issues minimally appear in sustainability reports, while direct environmental issues are reported on more. Although the two industries share similar trends in terms of social and environmental reporting, there are significant differences in economic reporting, in particular reporting on technology. Identifying the strengths and areas for improvement in sustainability reporting indicates how sustainability reporting may be more representative of the different pillars of sustainable development and may align better with common goals and efforts toward sustainable development.
We also contend that improvements in reporting based on particular optimization points can contribute to companies’ ability to incorporate sustainable development concepts more effectively into the design of their operations and achieve more sustainable business models. Although design is a practical aspect of engineering, its main theoretical basis is optimization, which does not only include consideration of technical aspects but also includes the triple bottom line aspects of sustainable development (i.e., economics, society, and the environment). This also relates to the concept of a sustainable business model that builds on the triple bottom line approach [44,45] and is defined by Lüdeke-Freund (2010) as “a business model that creates competitive advantage through superior customer value and contributes to a sustainable development of the company and society” [46]. Organizational design for sustainable business models is another emerging concept that investigates the design considerations for creating new business models or changing the existing ones based on the triple bottom line approach [45]. This paper contributes to these theoretical foundations of engineering design by demonstrating how the design of extractive operations could be improved by considering explicit optimization points derived from sustainability indicators.
2. Methodology
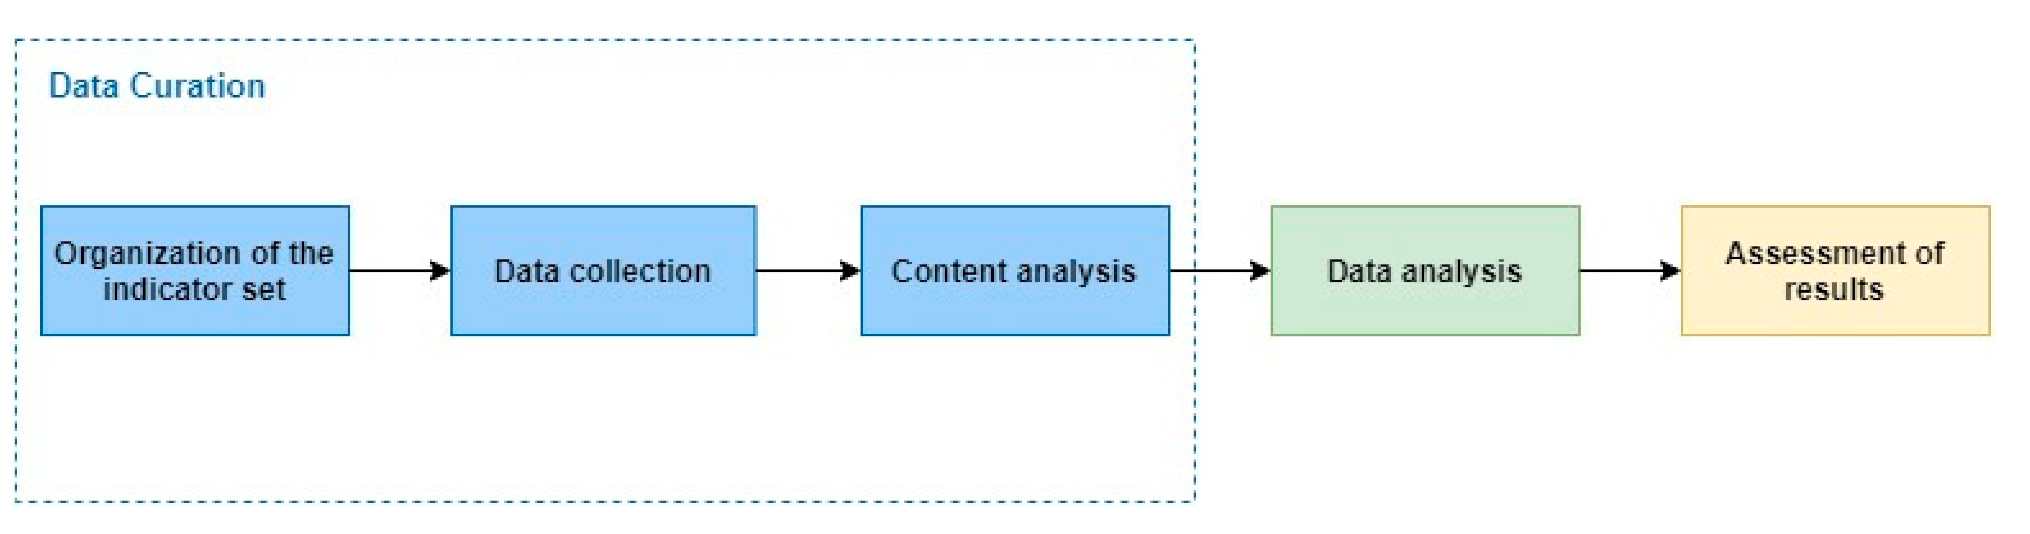
A data-driven approach is an exploratory approach that derives scientifically interesting insights based on evidence coming from analysis and interpretation of data [47], and it is widely adopted in sustainability research [48,49,50,51]. In this study, we began with a comprehensive set of sustainability indicators (referred to hereafter as the “indicator set”) and then collected data from the sustainability reports of selected oil and gas and mining companies from 2012 to 2018 to compare the indicators used in these reports with the indicator set (Figure 1). Through content analysis and relevant statistical methods, we analyzed the ways in which companies reported on their contributions to sustainable development, with a focus on indicators used and trends over time both within each industry and between industries.
2.1. Organization of the Indicator Set
This study used an indicator set that was established as part of a larger study on sustainability assessment frameworks as decision support tools for the mining sector [43,52,53,54]. This indicator set was compiled by reviewing mining-related sustainability literature in scientific journals, guideline documents produced by international organizations, including the GRI, the United Nations (UN), the World Bank (WB), the Organization for Economic Cooperation and Development (OECD), and the International Institute for Environment and Development (IIED), as well as publications by sectoral organizations such as the Mining Association of Canada and the International Council on Mining and Metals (ICMM). This indicator set was then divided into “strategic-level” indicators and “project-level” indicators [43,52]. Strategic-level indicators were those used by decision-makers to understand the impacts of proposed plans or programs at the macro scale (i.e., regional, national, or global), and project-level indicators included the social, environmental, and economic impacts of specific projects or companies at the micro-scale (i.e., company- or local-level) [52]. We used the project-level indicator set since our focus was on the impacts of specific companies.
A comparison of our indicator set with the indicators used in oil and gas companies’ sustainability reports revealed that only 4% of the total indicators that appeared in the oil and gas reports were not covered by our indicator set. Therefore, for consistency, we used our original indicator set to analyze the sustainability reports of both industries. The indicator set included 225 indicators, which were classified as either social (105 indicators), environmental (87 indicators), or economic (33 indicators) [52]. Although there is a recent turn to Economic, Social, and Governance (ESG) reporting, we did not classify indicators according to “governance”, since the triple bottom line classification is still prevalent in the literature, and governance became a distinctive fourth pillar only recently [55]. Even so, we did not ignore governance-related indicators, as they are mostly classified under “social” and “economic” indicators that cover business ethics, shareholders, employee relations, board diversity, audit mechanisms, transparency, and internal controls and policies against bribery and corruption. We then further grouped the indicators into categories based on how they were classified in the literature (e.g., human rights, emissions, economic performance) (see Appendix A). We classified social indicators as “internal” or “external”. Internal indicators (e.g., business ethics or labor/management relations) signaled those that were related to the companies’ internal operating processes or business principles. External indicators (e.g., community engagement/impacts or human rights) included those mostly associated with companies’ external relations with communities, customers, suppliers, and other stakeholders outside of the companies’ employees. We also classified environmental indicators in the indicator set as “direct” and “indirect”. The majority of the environmental indicators were directly related to the company and its operations and did not involve any third parties. However, some of the indicators were “indirect”, as they involved third parties such as suppliers, contractors, and communities. The indirect indicators included all of the indicators under the material use, transport and logistics, and nuisance categories; indicators related to indirect energy consumption in the energy category; indirect greenhouse gas emissions in the emissions category; and assessment of suppliers and contractors’ quality and environmental performance in the environmental management category.
2.2. Data Collection
We selected the top ten largest oil and gas companies in 2018 based on their composite score of revenue, profits, assets, and market value [56] and then checked the online availability of their sustainability reports for the period between 2012 and 2018. Three of the top ten oil and gas companies lacked sustainability reports for the full period under study; therefore, we added the eleventh-ranking company, for a total of eight oil and gas companies. For the selection of mining companies, we focused on the top 13 companies based on their market value as of 2017 [57]. We eliminated companies that had no formal sustainability reports in English for the period between 2012 and 2018. Five companies were eliminated, and eight mining companies were included in the sample, which represented the primary metal industries (gold, copper, and iron). The final sample included eight oil and gas and eight mining companies, for a total of 112 sustainability reports. We limited our sample to this number because we felt that this would provide us with a relatively thorough snapshot of reporting before and after the SDGs were announced in 2015 and to keep the dataset manageable without the use of machine learning tools. The report titles varied by company and year and included “Corporate Sustainability Report”, “Corporate Social Responsibility Report”, “Responsibility Report”, “Corporate Responsibility Report”, “Corporate Citizenship Report”, “Working toward Sustainable Development Report”, “Social and Environmental Performance Report”, “Sustainable Development Report”, “Sustainability Review”, and “Registration Document”. Some companies disclosed their economic performance in annual or financial reports instead of in sustainability reports, and such reports were rarely cross-referenced in the sustainability reports. The economic indicators that were accessible through the cross-references provided in sustainability reports were also considered “addressed”.
2.3. Content Analysis
We compared our indicator set to the indicators used in companies’ sustainability reports to examine the current approaches oil and gas and mining companies are using to measure their contributions to sustainable development.
We used the content analysis method, which is a favored technique in sustainability reporting research [21,24,27,29,58,59]. Content analysis systematically converts qualitative data into quantitative data by analyzing and quantifying the presence of certain words, concepts, or themes within textual material (e.g., reports and graphics) [60,61,62]. This method is useful as a data-driven approach for providing objective assessments and revealing trends in reporting [21]. Following Papoutsi and Sodhi (2020), we employed the manual content analysis method, rather than using computer-aided text analysis tools, for two reasons: (i) companies do not always present data in text form but rather provide information via tables or figures, which would not be processed by computer-aided tools; and (ii) since the reporting styles and guidelines vary significantly among companies and industries, information specific to particular indicators could be included that may be missed when adhering to a set of pre-defined keywords [58].
We identified and noted the presence or absence of indicators in texts covering corporate disclosures by searching for certain words and concepts that mapped onto the definitions of indicators in our indicator set. Accordingly, the presence of an indicator was given a score of “1”, while the absence of an indicator was given a “0”. In some cases, companies cross-referenced their indicators to the GRI index, which allowed us to directly link these to the indicator set.
It should be noted that the 2017 sustainability report of one of the mining companies was a summary report rather than a full report and included only about half of the indicators the company included in their other reports. Therefore, this company was omitted from the 2017 calculations so as not to distort the statistical results.
2.4. Data Analysis
We analyzed the data in terms of the extent to which the sustainability reports of oil and gas and mining companies included the indicators in the indicator set and the temporal variabilities in reporting. This analysis revealed the gaps and overlaps between the indicator set and company reporting on these indicators, the most and least emphasized indicator categories, and the differences in oil and gas and mining companies’ sustainability reporting from 2012 to 2018. We used metrics of coverage ratio and reporting rate of indicators for the comparison and adopted statistical tests to assess the significance of the temporal variabilities observed in reporting.
2.4.1. Coverage Ratio
We determined the coverage ratio, or the ratio of the number of addressed indicators within an indicator subset to the total number of indicators in the corresponding indicator subset, for each year and each company. Equation (1) provides the calculation for the coverage ratio.
where, disclosure n = total number of disclosed indicators by a company in nth year within the seven-year period (2012–2018).
We calculated the coverage ratio for the entire indicator set and for the environmental, social, and economic indicator subsets to understand the extent to which the indicators in the literature were covered in companies’ sustainability reports. We also examined the trends in coverage ratio over time to understand the trends in sustainability reporting from 2012 to 2018.
2.4.2. Reporting Rate of Indicators
We examined the average reporting rate of each indicator in a given number of years (i.e., the proportion of reports that disclose a particular indicator in n years). Equation (2) provides the method for calculating the average reporting rate.
where, disclosure n = total number of reports that disclosed the indicator in nth year within the seven-year period (2012–2018).
The average reporting rate of each individual indicator category revealed the most and least emphasized indicator categories in the reports.
2.4.3. Statistical Tests
We conducted statistical tests to assess whether or not the temporal variabilities observed in reporting were statistically significant. To do this, we used repeated measures ANOVA and supported it with the Friedman’s test, which is a nonparametric alternative to repeated measures ANOVA that does not require the data to meet the normality assumption. We used the Friedman’s test as a backup against a potential violation of ANOVA’s normality assumption since not all of our tested datasets were normally distributed. After the Friedman’s test, we also conducted a post hoc pairwise test (namely, a pairwise signed-rank test) that compared each year in pairs to determine where exactly the differences lay. All statistical tests and post hoc tests were conducted at 95% confidence level using the Real Statistics Resource Pack software (Release 7.6; Copyright 2013–2021) [63]. The set p-value for this confidence level was p = 0.05, with all of the p-values below this threshold value providing statistically significant results. These tests allowed for a more in-depth analysis of temporal variations and signaled the areas that were most and least consistently reported. Statistical test results are provided in Appendix B.
2.4.4. Study Limitation
We recognize that this study is limited by our analysis of the sustainability reports only, and it was not triangulated with more information from the companies. Future studies might consider internally and externally validating the analysis of results by also investigating industry papers, reports, or other documents that could enrich the analysis, as well as by conducting interviews with experts, employees, and managers of these companies.
3. Results
3.1. Coverage of the Indicator Subsets
Over the seven-year period, mining companies included a larger proportion (52%) of the total indicator set in their reports than oil and gas companies (45%) (Table 1). Both industries reported a higher proportion of social indicators than the other indicator subsets, but mining companies reported more social and environmental indicators than oil and gas companies, which reported on environmental indicators at a relatively low rate (37%). Both industries reported on the economic indicators to the same extent (45%).
3.2. Reporting Rates by Indicator Categories
To understand the extent to which company sustainability reports disclosed specific indicators over time, we analyzed the reporting rates of indicators grouped into thematic categories within each subset for each year, as well as over the study period (Tables 2–7). In Tables 2–7, the means represent the proportion of reports that disclosed an indicator category in a given year, or over the seven years, and the standard deviations (SD) represent how spread-out the data values were around the mean. For both industries, yearly reporting rates were calculated for eight reports, and the seven-year average reporting rates represented 56 reports in total for each industry.
3.2.1. Temporal Variabilities in Reporting of Social Indicators
Overall, the two industries showed similar trends in disclosing social indicators in their reports (Table 2 and Table 3). However, mining showed higher temporal variability than oil and gas in reporting most social indicator categories. There were also some overlaps in the reporting of both industries’ most and least reported topics over the study period (Table 2 and Table 3). Social performance management and business ethics appeared in the top five most frequently disclosed indicator categories for both industries, and customer health and safety, product/materials stewardship, suppliers and contractors, and child labor appeared in the five least reported categories for both industries.
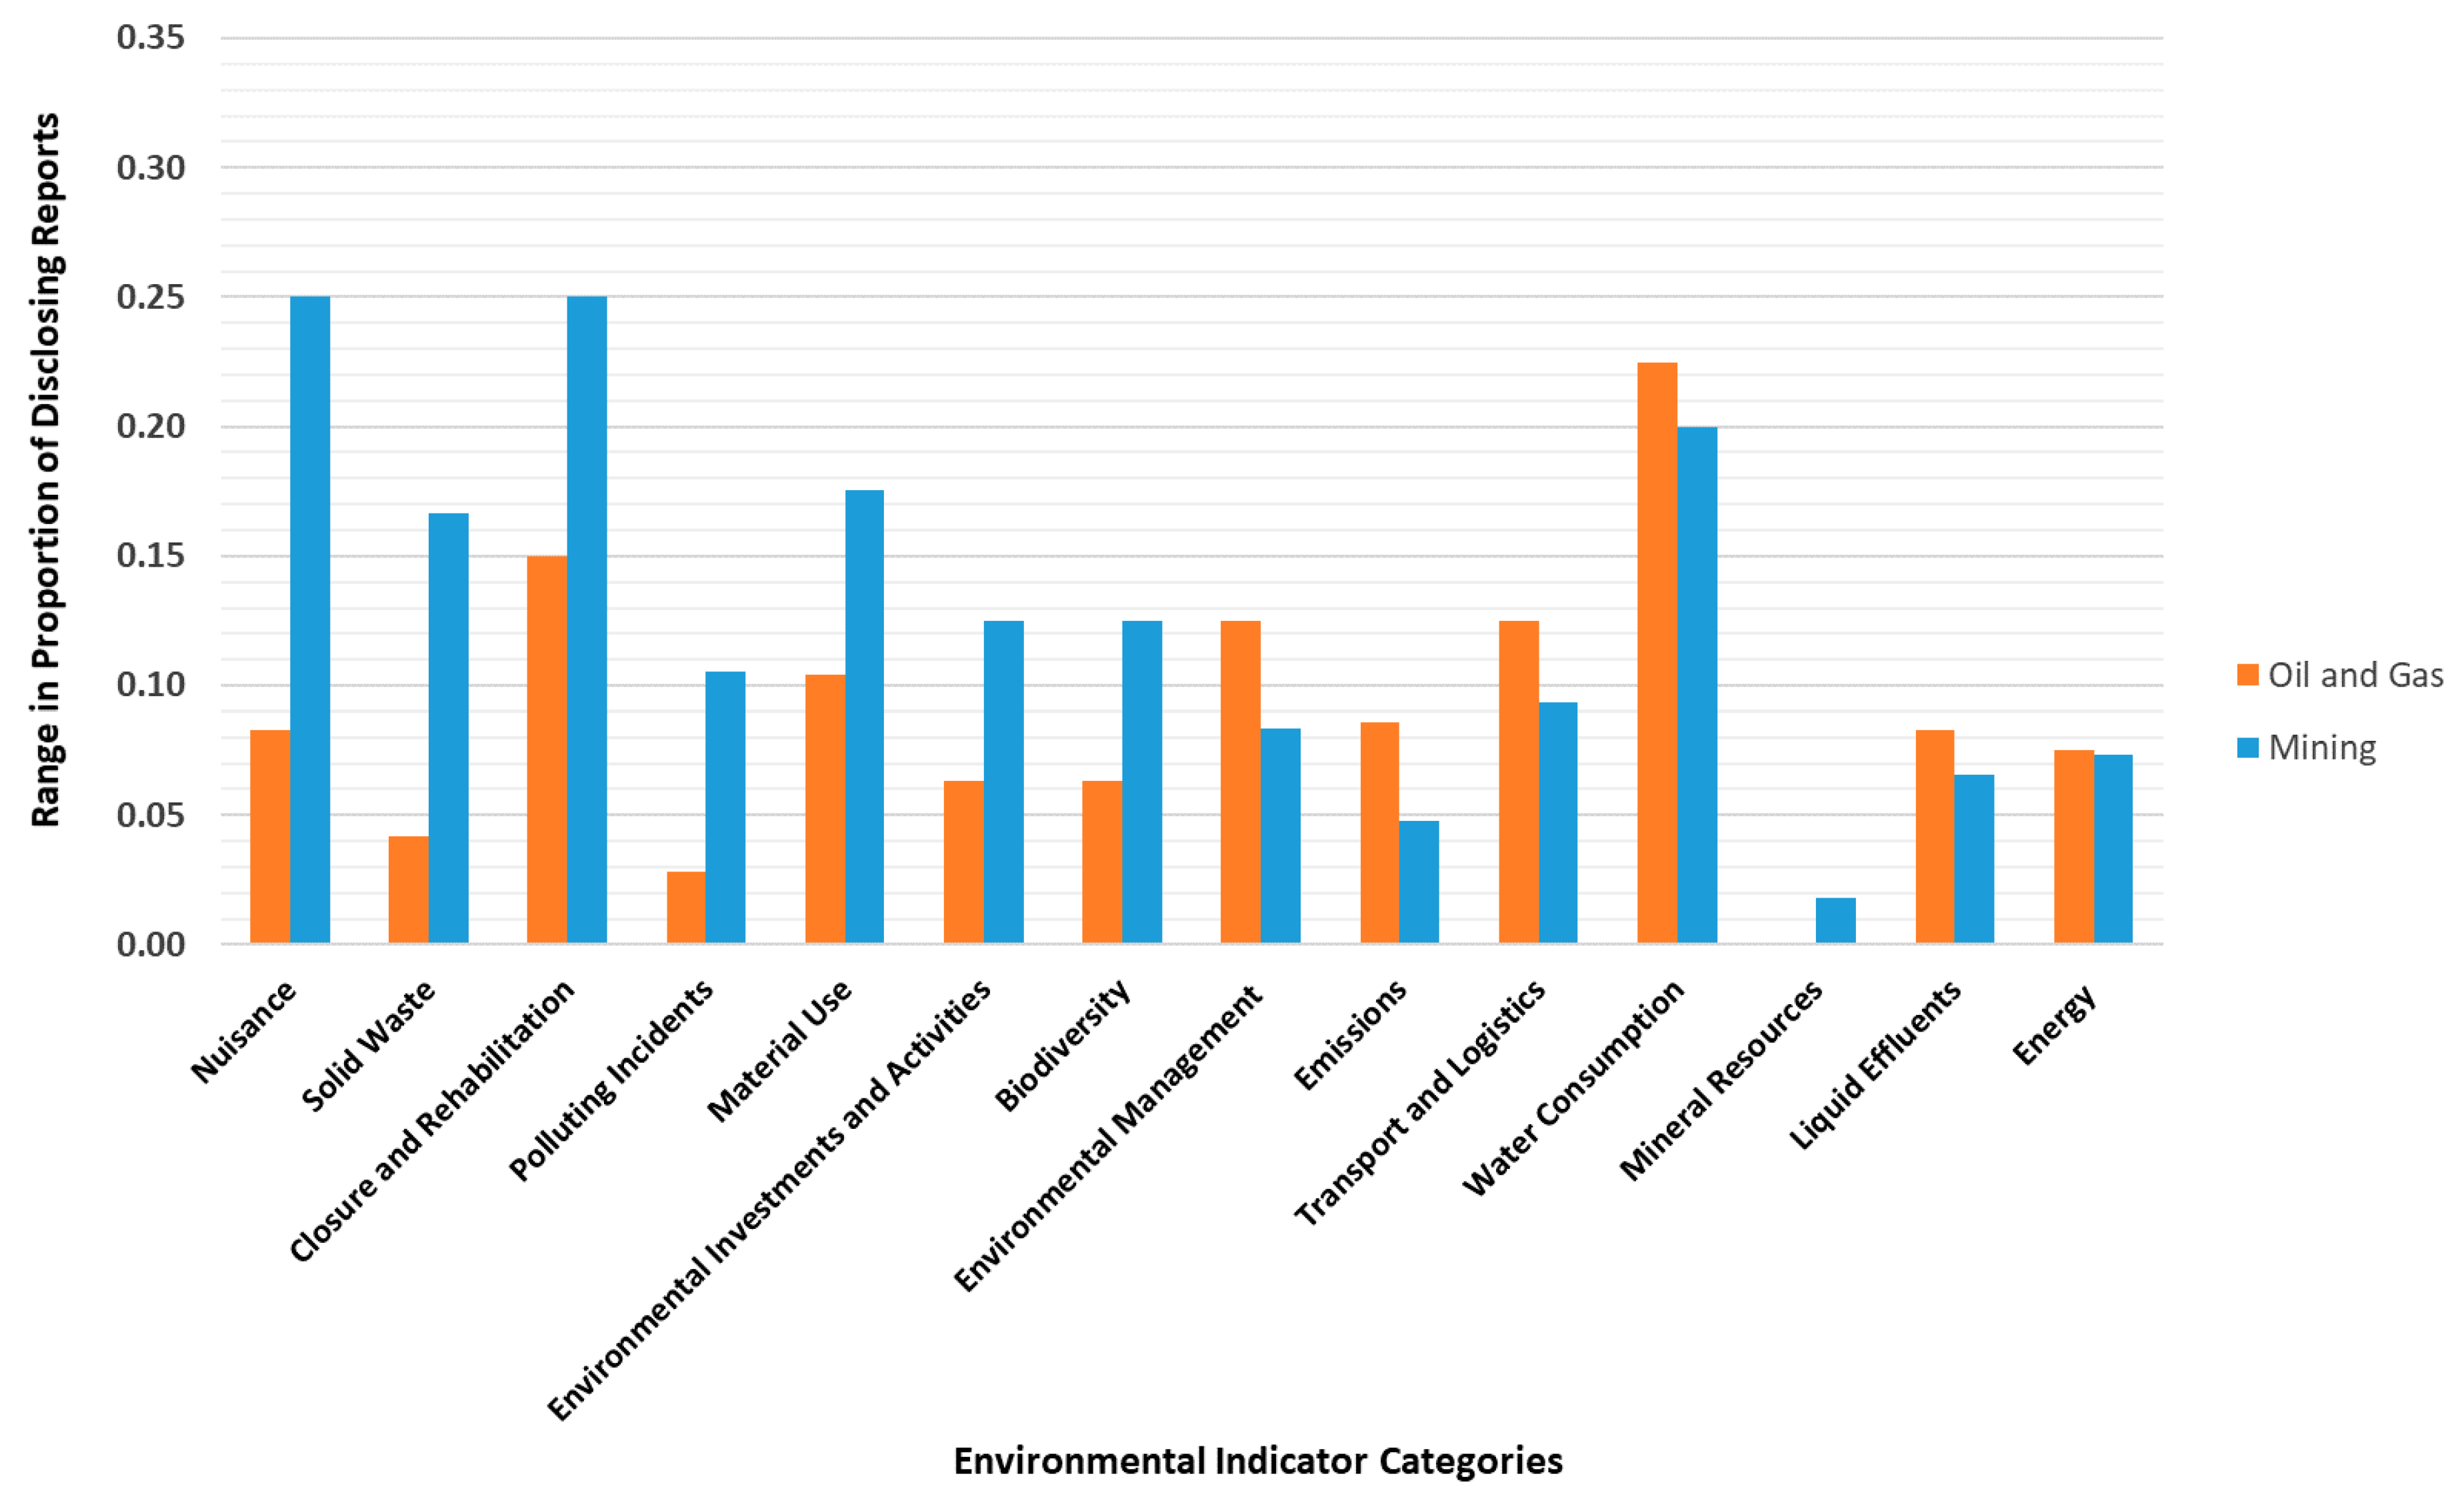
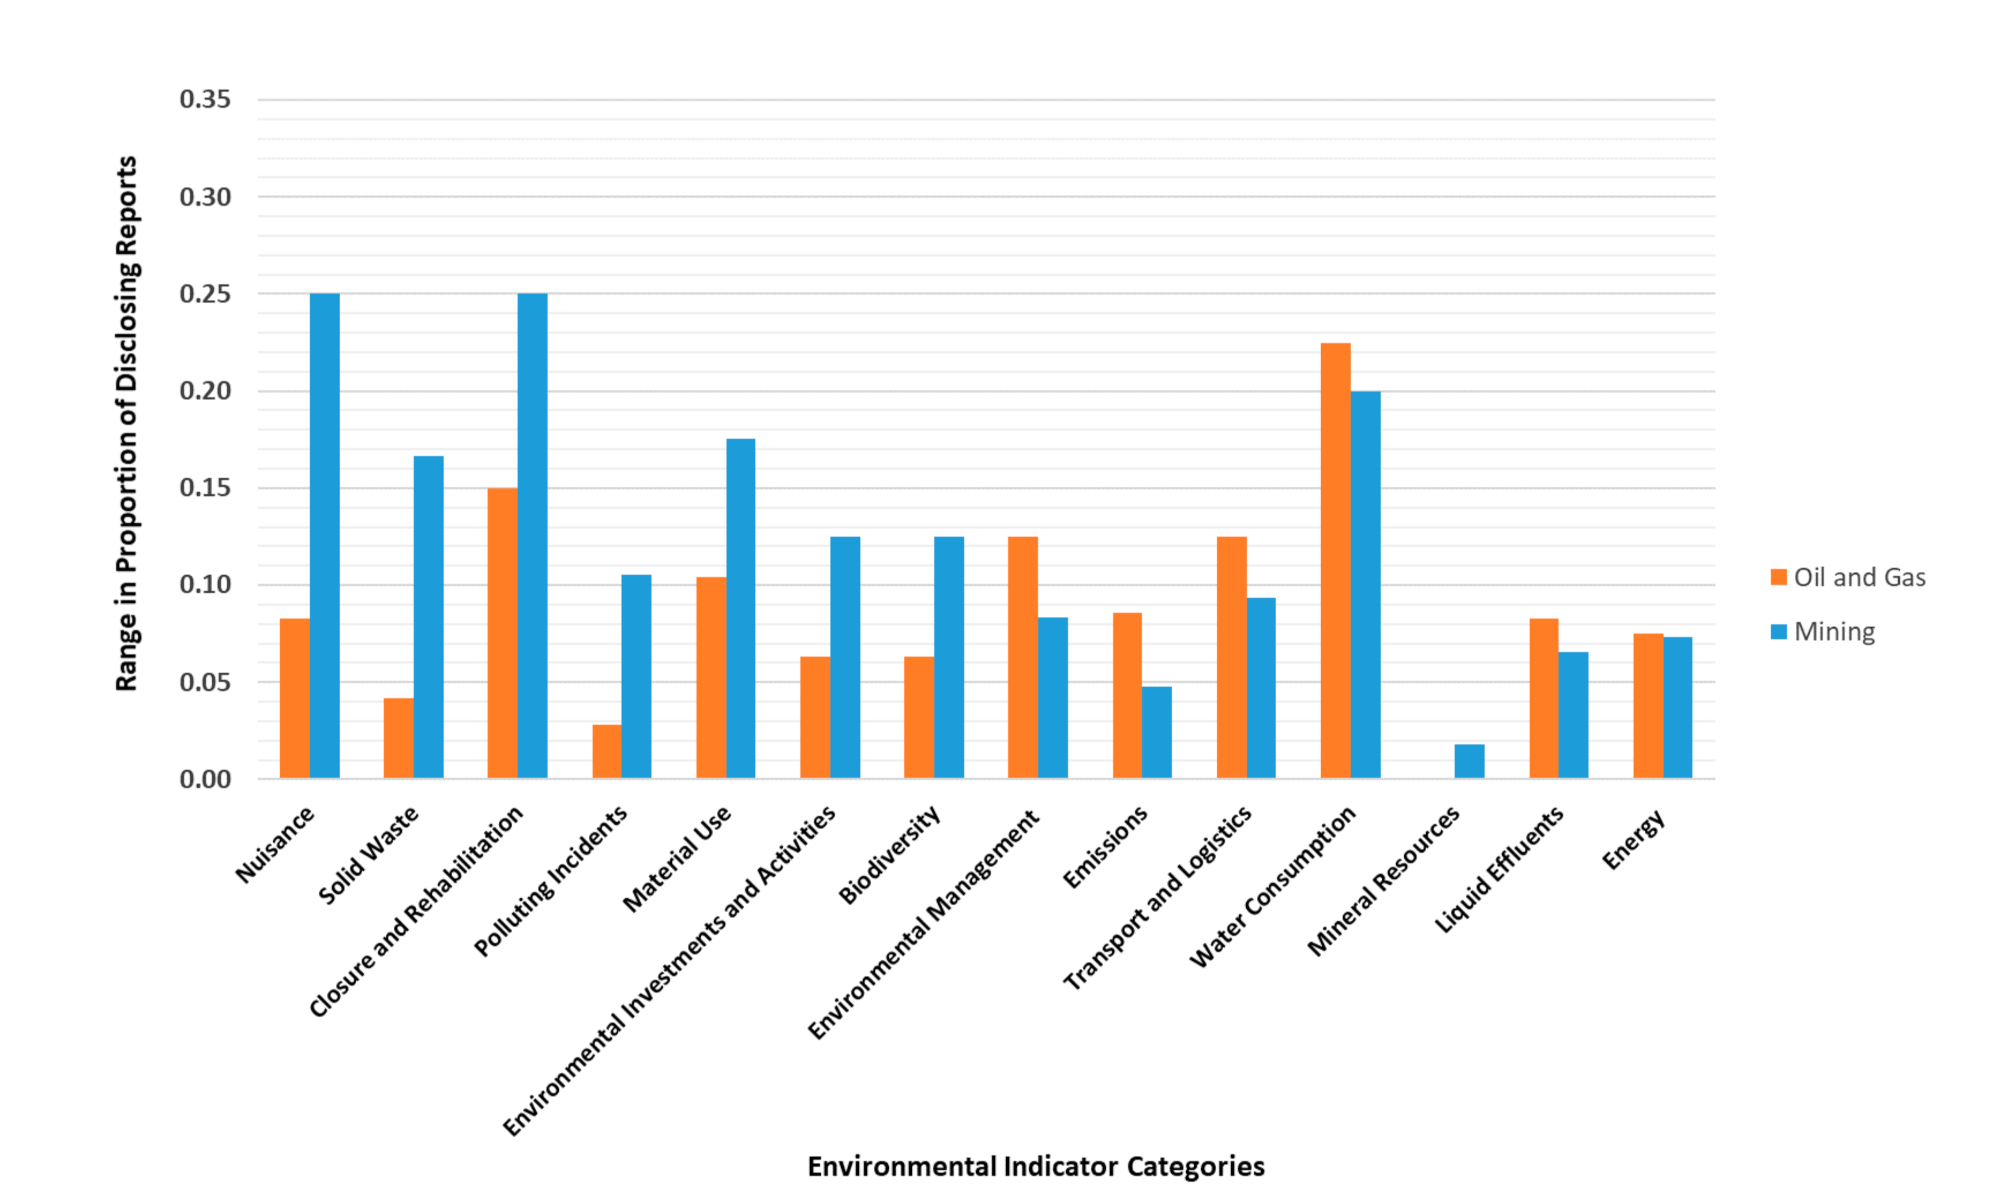
The ranges in reporting rates (i.e., the difference between the maximum and the minimum proportion of disclosing reports over the seven-year period) (Figure 2) and the results of statistical tests applied at 95% confidence level (Appendix B Table A2 and Table A3) revealed the most significant temporal variabilities. Oil and gas companies reported on customer health and safety, suppliers and contractors, and forced or compulsory labor with the highest ranges, meaning that there was significant variability in the presence (or absence) of these indicators in the reports over the study period. There was also significant variability in the reporting of customer health and safety (p = 0.036), diversity and equal opportunity (p = 0.037), and occupational health and safety (p = 0.019) (Table A2).
For mining companies, product/materials stewardship, child labor, and customer health and safety showed the highest ranges in reporting over the study period, with a general decrease in reporting over time (Table 3). The reporting of product/materials stewardship (p = 2.2 × 10⁻¹⁸), customer health and safety (p = 0.002), and business ethics (p = 0.006) showed significant variation over time (Table A3). However, mining’s reporting on product/materials stewardship and customer health and safety seems to have stabilized in recent years, as the reporting rates between 2015 and 2018 do not show significant variation, despite their difference from earlier years (2012–2014) (Table A3). The reporting rate of business ethics did not change much over the years, except dropping to its lowest in 2017 (Table 3), which was significantly different compared with all other years (Table A3).
There were some categories where the results of neither ANOVA nor Friedman’s test showed statistically significant difference over the years for the lump dataset, but the post hoc test detected differences between some years. For one category in mining (social performance management), the opposite was observed, where the result of Friedman’s test showed a statistical difference for the lump dataset, but the post hoc test did not detect any difference between years (Table A2 and Table A3).
3.2.2. Reporting on Internal vs. External Indicators
A deeper dive into the reporting of indicators themselves revealed trends that potentially demonstrate places where companies were focusing more or less. In both industries, internal indicators (i.e., business principles or employee management) were generally reported on more and showed lower temporal variability than external indicators (i.e., relations with communities, customers, suppliers, and other stakeholders).
In most categories, indicators that can be narratively disclosed (e.g., indicators directly related to company policies or programs) appeared in more reports, while indicators requiring quantitative data or demonstrable proof (e.g., information regarding the number of incidents, complaints, fines, and legal actions for noncompliance with laws) were reported in a limited number of reports. Similarly, reporting was limited on indicators that were related to actual incidents of violation or the identification of risks regarding external issues, such as child labor, forced labor, and indigenous peoples.
In addition, social indicators were reported on less, as the required level of detail increased. For example, in the employment practices category, both industries reported on the number of direct employees on their payroll in almost every report, but reporting decreased for indicators that required more detailed employment information and statistics, such as the number of indirect employees, employee turnover, and benefits provided to full-time employees. Similarly, in the diversity and equal opportunity category, quantitative indicators related to gender diversity were reported at higher rates, while the reporting on the percentage of ethnic minorities in executive and management ranks was limited. Additionally, in the occupational health and safety category, fatalities and lost-time accidents were quantitatively disclosed by both industries in almost every report; however, the number of compensated occupational diseases were among the least reported indicators.
3.2.3. Reporting on Direct vs. Indirect Environmental Issues
Both industries reported more on their direct environmental impacts, especially water consumption (Table 4 and Table 5). Environmental investments and activities, water consumption, environmental management, and polluting incidents were among the most reported categories by both industries. Although indirect environmental indicators appeared more in mining reports than oil and gas reports, both industries minimally reported on the environmental impacts resulting from their interactions with third parties. Furthermore, the environmental impacts of activities conducted at the lower ends of the supply chain, such as material use and transport and logistics, were among the least disclosed categories by both industries (Table 4 and Table 5).
An important difference between the environmental reporting of the two industries was discovered for the energy category. In mining reports, the water–energy nexus was well-covered, as energy and water consumption were the top two disclosed categories. However, in oil and gas reports, energy was reported much less than water consumption.
3.2.4. Temporal Variabilities in Reporting of Environmental Indicators
The yearly reporting rates in Table 4 and Table 5 show the variation in reporting of environmental issues from year to year. Oil and gas reported on water consumption, closure and rehabilitation, environmental management, and transport and logistics with the highest ranges (Figure 3). Statistical tests revealed a significant difference in the reporting of all of these categories over the years, except transport and logistics (Table A4). The temporal variability observed in the reporting of emissions was also significant (p < 0.0001) (Table A4). For oil and gas’ reporting on energy, neither ANOVA nor Friedman’s test showed significant difference over the years for the lump dataset, but the post hoc test detected differences between some years (Table A4). Oil and gas’ reporting on water consumption fluctuated over the years by peaking in 2014 and significantly decreasing in 2016 (Table 4), as demonstrated by the significant difference when comparing 2012 and 2014, 2013 and 2014, 2014 and 2016, and 2015 and 2016 (Table A4). Oil and gas reported on closure and rehabilitation with a general decreasing trend after 2013, significantly decreasing in 2017 to its minimum, and remaining the same in 2018, as demonstrated by the statistically significant difference when comparing 2013 and 2017 as well as 2013 and 2018 (Table A4). The reporting of environmental management made its peak in 2017 (Table 4) and significantly decreased in 2018 (Table A4). There was a significant increase in the reporting of emissions when comparing the earlier years (2012 and 2013) with more recent years (after 2014) (Table A4).
For mining companies, the highest ranges occurred in the reporting rates of closure and rehabilitation, nuisance, and water consumption categories. Statistical tests revealed a significant difference in the reporting of all of these categories over the years, except for nuisance (Table A5). The ranges that occurred in the reporting rates of closure and rehabilitation could be due to a lack of relevant data (i.e., no sites reached closure that year). Reporting on water consumption had an increasing trend after 2013 and peaked in 2018 (Table 5). Mining’s reporting on water consumption seems to have stabilized after 2015 since no significant difference was observed when comparing the more recent years with each other, but the reporting in recent years significantly differed from earlier years (2012–2014) (Table A5). The temporal variability in reporting of polluting incidents (p = 0.032), material use (p = 0.0001), and solid waste (p = 0.0048) was also significant. Mining’s reporting on polluting incidents was almost stable between 2012 and 2015 but fluctuated significantly after 2015 (Table 5 and Table A5). Reporting on material use decreased after 2013 and stabilized after 2014, and the reporting in more recent years (2014 to 2018) significantly differed from that in earlier years (2012 and 2013) (Table A5). Mining’s reporting on solid waste fluctuated over the years, dropping to its minimum in 2017 and peaking in 2018 (Table 5 and Table A5).
3.2.5. Differences Emerging in the Reporting of Economic Indicators of the Two Industries
Overall, the coverage of the economic indicator subset was the same for both industries (Table 1). However, the economic indicator categories were generally disclosed at a higher rate in mining than in oil and gas (Table 6 and Table 7). There were some overlaps in both industries’ most and least reported topics. Indirect economic impacts and products were the two most frequently disclosed categories, while customers and resource intensity were reported the least by both industries. Despite these commonalities, the details of reporting revealed significant differences between the two industries.
Both industries reported the most on the same two categories, both of which had only one indicator. The indicator under indirect economic impacts is “understanding and describing significant indirect economic impacts, including the extent of impacts”, and it was disclosed as a broad range of contributions by the companies, including the number of jobs supported in the supply or distribution chain, enhanced skills and knowledge in a community or in a geographic location, stimulating foreign direct investment, and other contributions such as wages and tax revenues. Most companies disclosed it both narratively and quantitatively in their reports, under “broader socio-economic contributions” or “local development” titles and mentioned the distributed economic benefits, as well as training and grants provided to local communities. The products category included a “breakdown by product type” indicator, which was disclosed either as the types and diversity of products, or the total amount of individual products sold. Oil and gas companies, in general, quantitatively disclosed this indicator through their production amounts. Some mining companies did the same, but some also provided descriptions and locations of their assets or product groups instead of providing quantitative information.
Customers was among the least reported categories by both industries. This category had two quantitative indicators disclosing the geographic breakdown of markets to which the companies sell, with (i) their national market shares and (ii) contribution to GDP. These indicators assess the significance of market presence and the contribution to the economies (and wealth) of the countries in which the companies have their markets [9]. Although customers were reported the least by both industries, oil and gas had a much higher reporting rate (0.24) than mining (0.02). Similarly, resource intensity was another category that was least reported by both industries, but oil and gas had a much higher reporting rate (0.29) than mining (0.13). This category included indicators looking at the amount of produced goods or services per material, land, and energy inputs, as well as another indicator related to transport intensity. Mining companies disclosed “produced goods or services per material input” the most in this category, but in a limited number of reports (0.28), while oil and gas companies disclosed “produced good per energy input” the most (0.57). “Produced goods per land input” was the least disclosed indicator in this category by both industries (0.02 of mining reports and none of oil and gas reports).
Procurement practices included indicators related to the supply chain (i.e., percentage of local suppliers, cost of goods and materials purchased, and “equity”, as in equitable contracting and procurement practices). Both industries reported the most on “cost of goods, materials, and services purchased”. Mining reported more than oil and gas on “percentage of purchasing from local suppliers to out of region”, which is in line with the findings of the social reporting results, where oil and gas reported less than mining on the percentage of their local suppliers to total suppliers. The indicator that was least reported by both industries in this category was “equitable contracting and procurement practices”.
The most significant difference between the economic reporting of the two industries was in technology. This category had two indicators, one specific to innovation and R&D investment and the other specific to wastewater treatment efficiency. Both industries reported on their technology investments considerably more than their wastewater treatment efficiency. Oil and gas companies reported (0.49 reporting rate) and potentially invested more in technology, which has the potential for great contributions to sustainable development, while mining companies’ reporting on this topic was quite minimal (0.13).
3.2.6. Temporal Variabilities in Reporting of Economic Indicators
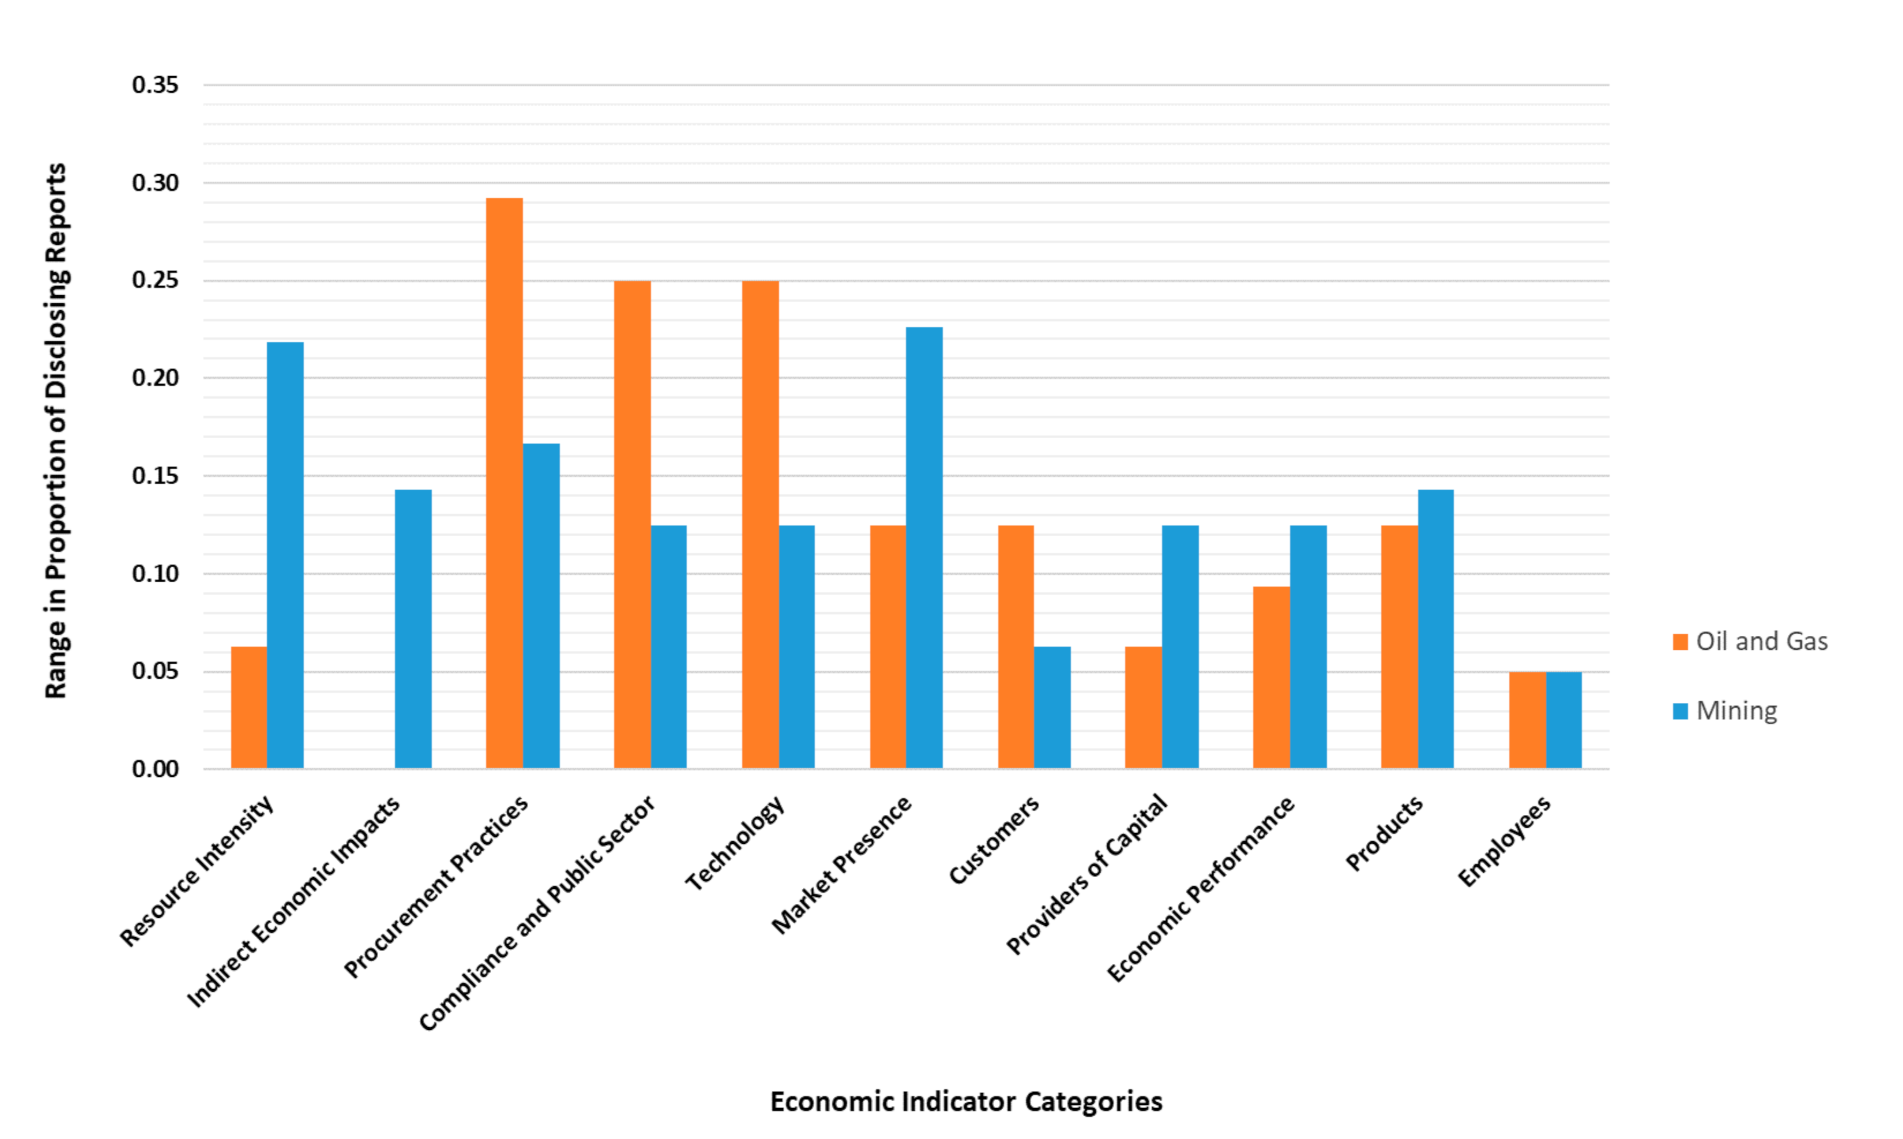
Oil and gas reported on procurement practices, compliance and public sector, and technology with the highest ranges (Figure 4). Statistical tests revealed a significant difference in the reporting of all of these categories over the years, except for technology (Table A6).
For mining companies, the highest ranges were observed in the reporting rates of market presence, resource intensity, and procurement practices categories. The reporting of resource intensity showed a significant variation (p = 0.020) (Table A7). For mining’s reporting on market presence, neither ANOVA nor Friedman’s test showed significant difference for the lump dataset, but the post hoc test detected differences between some years. For providers of capital, the opposite was observed, where the result of Friedman’s test showed a difference for the lump dataset, but the post hoc test did not detect any difference between years (Table A6 and Table A7).
The economic topics that were reported with the highest ranges showed an overall increasing trend in both industries’ reports. Compliance and public sector and technology categories had fluctuating reporting rates over the years but an overall increasing trend in oil and gas reports (Table 6). Mining’s reporting of resource intensity had an overall increasing trend over the years (Table 7), with a significant increase from 2012 and 2013 to 2018 (Table A7). Market presence had a steady increase in mining reports from 2012 to 2017 (Table 7), although this steady increase was broken in 2018. The reporting of procurement practices had a steady increase in both oil and gas and mining reports (Table 6 and Table 7). These results suggest that the focus of both industries on these issues increased over the years.
In general, mining’s reporting showed a higher temporal variability than oil and gas for most of the economic indicator categories (Figure 4). This was confirmed by the results of post hoc pairwise tests (Table A6 and Table A7). Oil and gas showed no variability at all in reporting indicators related to their indirect economic impacts (Figure 4).
4. Discussion
The analysis of the indicator subsets used in oil and gas and mining companies’ sustainability reports revealed that both industries reported a higher proportion of social indicators than the other indicator subsets (Table 1), which might be expected given the close association between CSR and sustainability reporting in the industries [2,64]. Notably, mining reported more social and environmental indicators than oil and gas companies. Although we do not know the exact reasons behind this difference, it may be indicative of the larger spatial and temporal scales at which mining developments take place or the varied resources and commodities represented by the mining industry. These factors result in relatively unique designs for each mine, with particular social and environmental constraints. Hence, reporting more of these indicators may be inherent to the nature of mining operations. It is also important to note that both industries primarily report social and environmental data at the corporate rather than site level. For example, one oil and gas company stated that they manage and report on water-related issues at the local level to comply with local environmental regulations and do not include this information in their corporate level sustainability reports. This aggregation may contribute to a lack of transparency in reporting, where site specific issues are masked. Both industries might consider expanding their reporting on social and environmental indicators to include both corporate and site-level data or by providing links to site-level reporting.
Both industries reported on less than half of the economic indicators. This could reflect a general pattern of reporting only baseline economic data in sustainability reports and disclosing more specific economic data in annual or financial reports. For both industries, it might be beneficial to report on more economic indicators in their sustainability reports or to at least provide cross-references to their annual or financial reports. This could align more with triple bottom line reporting and allow companies to gain a better understanding of the interdependence of their social, economic, and environmental performance [31].
Our results prove our two overarching hypotheses. We demonstrated that the reporting practices of extractive industries show temporal variabilities (i.e., inconsistencies) and revealed the statistical significance of these inconsistencies. We also revealed the significant differences between the two industries, specifically in economic reporting. In addition to proving our hypotheses with the discrepancies we identified, we revealed more nuanced findings that we believe are equally as important. We discuss these findings in more detail in the remainder of this section.
4.1. The Need for Greater Attention to External Issues
Diving deeper into the topics covered within the indicator subsets, in both industries, internal indicators (related to the companies’ internal operating processes, business principles, or employee management) were generally reported on more and showed lower temporal variability than external indicators (related to a companies’ relations with communities, customers, suppliers, and other stakeholders). Although both industries covered a relatively higher proportion of indicators in the social pillar (Table 1), both industries placed more emphasis on their internal operations by reporting on social performance management, business ethics, and other internal indicators more than the external indicators (Table 2 and Table 3). The high reporting rate of internal indicators by both industries may reflect the straightforward nature of reporting on corporate policies and management structures rather than more complex issues “outside of the fence”.
As previous research suggests, the indicators reported in sustainability reports should address external sustainability issues as well as internal ones to provide information that is more “representative” of the impacts on sustainable development [9]. This is also critical in terms of designing more sustainable business models and corporate strategies, as it requires the consideration of all stakeholders, including customers, suppliers, and shareholders [45]. Furthermore, reporting external indicators can encourage companies to take a systems engineering perspective, wherein their design and planning incorporates both downstream and upstream processes and actors. Therefore, there is still room for improvement in terms of addressing externally focused contributions to sustainable development [65]. We recommend that both industries adopt a systems engineering approach while identifying external indicators, and we report on these least emphasized external indicators more explicitly.
Social indicators that are directly related to company policies or programs and that can be narratively disclosed were reported more, while reporting of indicators requiring quantitative data or demonstrable proof was limited. Similarly, reporting was limited on actual incidents of violation or the identification of risks regarding external issues, such as child labor, forced labor, and indigenous peoples. In addition, social indicators were reported on less as the required level of detail increased. These results might suggest that there is room for improvement in terms of transparency and accountability. There is a need for continuous monitoring and evaluation and greater attention to such external issues. If extractive industries pay more attention to this, they might also avoid the risk of being critiqued for “greenwashing”. These might point out the need for more detailed and robust data collection in both industries.
Supply Chain Traceability
In both industries, customer health and safety, product/materials stewardship, suppliers and contractors, and child labor appeared in the five least reported categories. At formal oil and gas and mining operations, child labor is highly unlikely, explaining its low levels of reporting. However, the low reporting on the other indicators suggests that the further down the supply chain from the company to which an indicator refers, or the more “external” the issue is to the company, the less it is reported. This may be due to the difficulties in collecting and monitoring data at the corporate level related to downstream suppliers and contractors, as most extractive companies work with a large number of these providers across their global operations. Nonetheless, this contributes to the critique that both sectors lack supply chain traceability [66,67,68]. Incorporating sustainable development in the design of extractive operations requires a holistic approach based on life cycle thinking and a systems engineering perspective, and sustainability reporting should involve all activities in the supply chain [9,45]. For this reason, supply chain aspects of the design should be taken into account as a set of design constraints. Researchers in the field of organizational design for sustainable business models also suggest that linkages to external partners such as distributors and outsourcers should be established [69] to enrich the final output of a value chain [45,70]. Other researchers have suggested that sustainable value chains are not be possible unless issues concerning a company’s relationship with suppliers are addressed [71]. Furthermore, given the increased global attention to supply chain issues among investors, consumers, and governments, companies are under pressure to have more responsible and sustainable supply chains [72,73,74]. Therefore, we suggest that these lesser reported aspects of the supply chain need to be more represented in sustainability reports.
4.2. The Need for Greater Attention to Environmental Issues Involving Third Parties
The environmental indicators that were among the most reported by both industries included environmental investments and activities, water consumption, environmental management, and polluting incidents. This reflects other studies that found that environmental topics were generally well covered in extractive industries’ sustainability reporting [2,18,28] and suggests that reporting of such environmental topics is an “older” and “more institutionalized” issue [18]. Furthermore, we found that oil and gas companies reported on their environmental investments and activities at a relatively high rate, which might be related to efforts to shift the public perception of the oil and gas industry after incidents such as the 2010 Gulf of Mexico oil spill.
The most reported environmental categories by both industries reflected their direct environmental impacts. Both industries minimally reported on the environmental impacts resulting from their interactions with third parties and on activities conducted at the upper and lower ends of the supply chain, such as material use and transport and logistics (Table 4 and Table 5). However, material use and transportation are among the topics that investors look for in companies’ sustainability disclosures [75,76,77,78,79,80,81]. This relates to the traceability issue in the supply chain, and similar to social reporting, we suggest an increased focus on these more external issues.
An important difference between the environmental reporting of the two industries was discovered for the energy category. In mining reports, the water–energy nexus was well covered, as they were the top two disclosed categories. However, in oil and gas reports, energy was reported much less than water consumption. The global demand for water and energy is increasing as a result of the growing population, urbanization, and economic growth, while the resources are becoming scarce. Hence, the water–energy nexus is central to sustainable development, and governmental and non-governmental organizations are keeping track of the consumption of these resources [82]. Furthermore, energy consumption is frequently listed among the topics that investors would like to see in companies’ sustainability disclosures [75,76,77,78,79,80,83,84,85,86,87,88,89,90]. Hence, it would serve oil and gas better to report more on energy issues to deliver a more integrated and representative reporting on issues related to sustainable development and investment.
4.3. Inconsistency in Reporting over Time
Both industries demonstrated similar temporal variabilities in their reporting over time, although overall, mining companies showed more inconsistency than oil and gas companies in reporting most of the environmental, social, and economic indicator categories. Hypothesis testing with statistical tests showed that most of the temporal variabilities observed in reporting were statistically significant.
These temporal variabilities reflect companies’ divergent approaches to sustainability reporting and introduce a level of subjectivity that obscures a robust assessment of the extractive industries’ collective contributions to sustainable development. Although variability in reporting is to a certain extent inevitable, in the long run, it would be beneficial for companies in the oil and gas and mining industries to learn from each other and attempt to coalesce around similar reporting structures. This will allow professionals in the extractive industries to gauge the progress and challenges of companies and the industry in general in contributing to the Sustainable Development Goals.
In both industries, the reporting of external indicators (e.g., customer health and safety, product/materials stewardship) showed higher temporal variability than internal indicators. In addition, water consumption and closure and rehabilitation were among the categories that were reported with the highest variability by both industries over time. However, these are important topics that affect large number of stakeholders; hence, we suggest more consistent reporting on such issues.
4.4. Differences Observed in Economic Reporting
The details of economic reporting revealed significant differences between the two industries. Although customers were reported the least by both industries, oil and gas had a much higher reporting rate (0.24) than mining (0.02) (Table 6 and Table 7). This may make sense given the oil and gas’ direct access to their customers, unlike mining. Since mining produces raw materials instead of final products, mining companies usually do not have direct access to their customers. However, it might be more beneficial for mining companies to better address customer-related indicators in their reports since more customers are placing more importance on sustainability reports and companies’ contributions to sustainable development.
Similarly, resource intensity was less reported by both industries, but oil and gas had a much higher reporting rate (0.29) than mining (0.13). Topics related to resource intensity may appear less in the reporting of both industries because these topics are generally part of production data and may be more explicitly reported in financial reports. Indicators referring to the amount of produced goods or services per material, land, and energy inputs should be reported more by both industries, considering the importance of resource efficiency for international financial institutions [91]. The indicator that was least reported by both industries was “equitable contracting and procurement practices” in the procurement practices category. This indicator can indicate to what extent underrepresented entrepreneurs have access to business opportunities and can also reflect aspects of diversity and inclusion.
The most significant difference between the economic reporting of the two industries was in technology. Oil and gas reported more on technology (0.49), while mining’s reporting on this topic was quite minimal (0.13). Roca and Searcy (2012) similarly found in their study that indicators related to technology were reported by oil and gas and not reported at all by mining [7]. This might suggest that mining companies’ investments in technology are limited. In fact, mining’s lower investment in innovation and R&D relative to other industries has been emphasized in the literature [92,93,94,95]. According to Ernst & Young, innovation is among the top 10 business risks and opportunities facing mining, and significant productivity gains can be achieved by fostering innovation [96]. Although oil and gas companies reported more on technology, their reporting in this category did not appear to be well-established due to its high reporting range and fluctuations over the years (Table 6 and Figure 4). With the current efforts to transition to a low carbon economy, companies may benefit from communicating their investments in innovation and R&D more proactively and consistently to attract investors [97].
5. Conclusions
We analyzed the current use of sustainable development indicators by the two major extractive industries with a data-driven approach and identified the strengths in sustainability reporting practices of the two industries, while also providing insights into areas for improvement. The supply chain traceability issue is a particular area that can improve in reporting, and we may anticipate seeing an uptick in this because of the growing attention being given to more responsible and ethical supply chains. The concept of design for sustainability encompasses the life cycle of projects and products and requires seeking ways to reduce impacts of operations along and between production and recycling chains [32]. Therefore, we propose that the extractive industries focus on resolving the supply chain traceability issue to better incorporate sustainable development considerations into the design and management of their operations. This is also a part of responsible investment efforts, as investors pay increasing attention to companies’ disclosures on topics related to their suppliers, supply chain, responsibility to customers, product stewardship, and child labor [75,76,77,78,80,81,86,87,88,89,90,98]. From the investors’ perspective, these topics are “material investment risks”, and lack of their accurate and meaningful disclosure might make it more challenging for companies to assess their own risks and create value and to impede investors’ interpretation and incorporation of such information into their decision making [99].
Ernst & Young recently cited “social license to operate” as the number one risk for the mining industry for the second year in a row, as social responsibility, stakeholder demands, and scrutiny from end consumers increase [96]. We see this risk reflected in the less frequent reporting of external indicators in sustainability reporting of the extractive industries. We believe that improving the sustainability reporting of both oil and gas and mining in terms of the representativeness of external sustainable development issues would have a significant impact on addressing some of these risks, as it would allow companies to identify blind spots and areas for improvement. In addition, the United Nations’ most recent policy brief provides recommendations to “transform the extractives sector into an engine for sustainable development” by including civil society, vulnerable groups, local communities, and other stakeholders in the design, implementation, and monitoring of extractive operations [100]. Thus, increasing the focus on reporting external issues would help extractive industries better incorporate sustainable development considerations into the design and management of their operations. This is also critical for capturing the interactions and synergies between different institutions that play important roles in achieving common Sustainable Development Goals, including industry, communities, governments, academia, and the media, or the “Penta-Helix” [101,102,103]. Additionally, reporting practices with reduced temporal uncertainty would aid extractive industries in more successfully monitoring their own performance and contribute to more transparent, ethical supply chains and a lower carbon footprint [96].
A recent report produced by the Responsible Mining Initiative (RMI 2020) cautioned about “SDG-washing” [104]. Accordingly, although mining companies are increasingly aligning their sustainability reporting with the SDGs, their reporting is selective, and they generally omit the negative impacts potentially hindering the achievement of the SDGs. This points to the need for an honest picture of the challenges the mining sector faces in its support of the SDGs [104], which is also valid for the oil and gas industry. We believe that sustainability reporting practices with increased temporal stability and representativeness could aid both extractive industries in addressing the critique of “SDG-washing” and may provide a profound method for mapping the contributions of extractive industries’ practices to SDGs. For example, if the external issues that are currently being overlooked, such as indicators related to product stewardship and supply chain, are included more in sustainability reports, it would help the extractive industries demonstrate their contributions to particular SDGs (i.e., SDG 8—decent work and economic growth and SDG 12—responsible consumption and production), as well as areas where they can improve. Similarly, if the mining industry reports more on technology and innovation, it would serve them better in demonstrating their contributions to SDG 9 (industry, innovation, and infrastructure). Therefore, we suggest that more representativeness of sustainable development issues would be beneficial for the extractive industries.
Although the two industries have been reporting for several years and they cover a large number of indicators in their reports, there are still areas for improvement in terms of the representativeness of the issues and goals related to sustainable development that appear in their reports. This suggests that the number of reported indicators does not really matter in sustainability reporting of extractive industries; what matters is the reported indicators’ content and their connections to sustainable development. Future research could investigate the real reasons behind the trends and temporal variabilities in companies’ reporting practices through primary data (e.g., interviews with companies). Moreover, research might be conducted on more companies over a longer time to obtain more precise statistical results and to better identify potential correlations of the reporting trends with other parameters. Finally, we advocate for a framework or a decision-making tool that allows for more objective sustainability assessments, yet attends to the temporal and spatial variability that occurs across extractive industries’ operations.
Author Contributions
Conceptualization, N.M.S. and H.S.D.; methodology, C.P.D., N.M.S. and H.S.D.; formal analysis, C.P.D. and A.W.; investigation, C.P.D.; writing—original draft preparation, C.P.D.; writing—review and editing, N.M.S. and H.S.D.; visualization, C.P.D.; supervision, N.M.S. and H.S.D. All authors have read and agreed to the published version of the manuscript.
Funding
This research received no external funding.
Data Availability Statement
The data presented in this study are available on request from the corresponding author.
Acknowledgments
Authors acknowledge the support of Evren Deniz Yaylaci in the compilation of the indicator set used in this study.
Conflicts of Interest
The authors declare no conflict of interest.
Appendix A

Table A1.
List of the indicators in the literature indicators set broken down by indicator category.
Table A1.
List of the indicators in the literature indicators set broken down by indicator category.
| Indicator Category (Number of Indicators) | ECONOMIC |
|---|---|
| Compliance and Public Sector (4) | Amount of money paid to political parties and institutions whose prime function is to fund political parties or their candidates |
| Fines paid for non-compliance (economic, environmental, and social) | |
| Total fund for mine closure and rehabilitation, including mitigating the post-closure environmental unit and social impacts | |
| Total investment for pollution prevention and control (air, water, and solid waste) | |
| Customers (2) | Geographic breakdown of markets, disclosing contribution to GDP greater than 5% |
| Geographic breakdown of markets, disclosing national market share greater than 25% | |
| Economic Performance (4) | Coverage of the organization’s defined benefit plan obligations |
| Financial implications and other risks and opportunities for the organization’s activities due to climate change | |
| Net sales | |
| Significant financial assistance received from government | |
| Employees (5) | Health, pension, and other benefits and redundancy packages provided to employees as percentage of total employment costs |
| Investment in employee training and education as percentage of net sales | |
| Percentage of employees that are shareholders in the company | |
| Total cost of employment as percentage of net sales | |
| Total payroll costs and benefits (including pension and redundancy payments) broken down by region or country | |
| Indirect Economic Impacts (1) | Understanding and describing significant indirect economic impacts, including the extent of impacts |
| Market Presence (3) | Policy, practices, and proportion of spending on locally based suppliers at significant locations of operation |
| Procedures for local hiring and proportion of senior management and workforce hired from the local community at location of significant operation | |
| Range of ratios of standard entry level wage compared with local minimum wage at significant locations of operation | |
| Procurement Practices (3) | Cost of goods, materials, and services purchased |
| Equity | |
| Percentage of purchasing from local supplier to our of region | |
| Products (1) | Breakdown by product type |
| Providers of capital (4) | Average capital employed |
| Distributions to providers of capital broken down by monetary interest on debt and borrowings and dividends on all classes of shares | |
| Percentage of ethical investments relative to total investments | |
| Return on average capital employed (ROACE) | |
| Resource Intensity (4) | Produced goods or services per land input |
| Produced goods or services per energy input | |
| Produced goods or services per material input | |
| Transport intensity | |
| Technology (2) | Innovation and R&D Investment |
| Wastewater treatment (% efficiency) | |
| ENVIRONMENTAL | |
| Biodiversity (4) | Description of the major impacts on biodiversity associated with company activities and/or products and services in terrestrial, freshwater, and marine environments |
| Identity, size, protected status, and biodiversity value of water bodies and related habitats significantly affected by the reporting organization’s discharges of water and runoff | |
| Loss of wildlife habitat due to noise emissions | |
| Significant impacts of activities, products, and services on biodiversity in protected areas; description of high biodiversity value outside protected areas | |
| Closure and Rehabilitation (5) | Number of awards for rehabilitation and a summary, if applicable |
| Number of mines closed | |
| Number of sites officially designated for biological, recreational, or other interest as a result of rehabilitation | |
| Number of sites rehabilitated | |
| Summary of the policy for closure and rehabilitation | |
| Emissions (19) | CH4 |
| CO2 | |
| Emissions of acid gases (NOx, SO2, and other), breakdown by substance | |
| Emissions of ozone depleting substances, breakdown by substance | |
| Emissions of particles | |
| Equivalent number of fully grown trees that would be required for sequestration of the total CO2 emissions | |
| HFCs | |
| Initiatives to reduce greenhouse gas emissions and reductions achieved | |
| Loss of wildlife habitat (due to emissions) | |
| N20 | |
| Net emissions of CO2 (total CO2 emissions minus CO2 emissions potentially sequestered by trees) | |
| O3 | |
| Other emissions; breakdown by substance | |
| Other relevant indirect greenhouse gas emissions by weight | |
| PFCs | |
| SF6 | |
| The amount of CO2 emissions that can (theoretically) be sequestered by the trees planted by the company | |
| Toxic emissions (including heavy metals, dioxins, 40 crystalline silica, and others), breakdown by substance | |
| VOCs | |
| Energy (10) | Breakdown by type of the amount of the primary energy used (including natural gas, diesel, LPG, petrol, and other fuels) (Direct energy consumption by primary energy source) |
| Breakdown by type of the amount of the secondary energy used (electricity and heat) used and exported (if applicable) | |
| Energy from renewable sources used and exported (if applicable) | |
| Energy saved due to conservation and efficiency improvements | |
| Indirect energy consumption by primary source | |
| Initiatives to provide energy efficient or renewable energy-based products and services and reductions in energy requirements as a result of these initiatives | |
| Initiatives to reduce indirect energy consumption and reductions achieved | |
| Percentage of renewable energy used relative to total energy consumption | |
| Summary of energy policy | |
| Total primary and secondary energy used | |
| Environmental Investments and Activities (2) | Summary of any other environmental voluntary activities |
| Total environmental protection expenditures and investments by type | |
| Environmental Management (6) | Initiatives to mitigate environmental impacts of products and services, and extent of impact mitigation |
| Monetary value of significant fines and total number of non-monetary sanctions for noncompliance with environmental laws and regulations | |
| Percentage of planning permissions refused on environmental and social grounds relative to the number applications for permissions | |
| Percentage of sites certified to an EMS (e.g., ISO % 14001/EMAS) | |
| Summary of any assessments of suppliers and contractors quality and environmental performance | |
| Total number of prosecutions for environmental non-compliance and a summary for each region and country if applicable | |
| Liquid Effluents (6) | Breakdown of substances discharged with liquid effluents |
| Describe any measures put in place to prevent acid main drainage, if applicable | |
| Percentage of permitted sites causing downstream and/or underground water quality problems relative to the total number of permitted sites | |
| Total volume of tailings and disposal methods | |
| Total volume of water discharge into waterways | |
| Total water discharge by quality and destination | |
| Material Use (6) | Breakdown by type and the total amount of packaging used |
| Breakdown by type and the total amount of chemicals used | |
| Materials used by weight or volume | |
| Percentage of materials used that are recycled input materials | |
| Percentage of recycled or re-used packaging relative to the total amount of packaging | |
| Percentage of waste chemicals (processed or unprocessed) used from both internal and external sources | |
| Mineral Resources (2) | Breakdown of the amount of each saleable primary resource extracted |
| Total products’ yield as percentage of the amount of saleable products relative to the total amount of material extracted | |
| Nuisance (3) | Discomfort and possible diseases due to noise emissions |
| Loss of wildlife habitat due to infrastructure problems caused by operations | |
| Total number of external complaints related to noise, road dirt and dust, visual impact, and other nuisance | |
| Polluting Incidents (9) | Amount of hazardous materials that may affect human health or ecosystems |
| Area possibly affected due to accidents/incidences polluting air, water, soil | |
| Describe any measures put in place to prevent tailings dam(s) failure | |
| Effect of accidents/incidents polluting air, water, soil | |
| Frequency of accidents/incidences polluting air, water, soil | |
| Number of environmental accidents and a summary for each region or country, as applicable | |
| Possible effect of hazardous materials in case of accidents/incidences | |
| Recovery period in case of damage | |
| Total number and volume of significant spills | |
| Solid Waste (6) | Percentage of permitted sites that have a problem of land contamination relative to the total number of permitted sites |
| Percentage of products sold and their packaging materials, reclaimed by category | |
| Total hazardous solid waste and breakdown by type and description of disposal methods | |
| Total non-hazardous solid waste and breakdown by type and description of disposal methods | |
| Total weight of waste by type and disposal method | |
| Weight of transported, imported, exported, or treated waste | |
| Transport and Logistics (4) | Percentage of distance for transport of products to customers covered by road, rail, and water transport, breakdown by type |
| Significant environmental impacts of transporting products, goods and materials used for the organization’s operations and transporting members of the workforce | |
| Total distance for all transport per ton of products | |
| Total transport distance, including in the mine/quarry, transport of products to customers, business travel, and commuting for “fly-in, fly-out” operations | |
| Water Consumption (5) | Percentage and total volume of water recycled and reused |
| Percentage of water recycled and reused (e.g., cooling, waste, rainwater) relative to the total water withdrawn from source | |
| Proportion of total water resources affected | |
| Total water use for production of mineral resources | |
| Water use intensity by activity | |
| SOCIAL | |
| Business Ethics (17) | Actions taken in response to incidents of corruption |
| Commitment to strategy of corporate citizenship irrespective of laws in place and government approach to enforcement | |
| Corporate compliance and accountability with respect to international, national, and regional regulations, restrictive measures, and laws | |
| Group policies with reference to internal, external CSR benchmarks, and human rights issues | |
| Investigate more equitable “rent-sharing” agreements | |
| Monetary value of significant fines and total number of non-monetary sanctions for noncompliance with laws and regulations | |
| Number and percentage of operations with closure plans | |
| Percentage and total number of business units analyzed for risks related to corruption | |
| Percentage of employees trained in organization’s anti-corruption policies and procedures | |
| Proven commitment to CSI as a mechanism for contributing to local and regional development plans in countries of operation | |
| Proven commitment to government stakeholder dialogue and engagement as a systematic principle of corporate policy from the outset to the end of a project/investment | |
| Public policy positions and participation in public policy development and lobbying | |
| Summary of the policy for managing political contributions and lobbying | |
| Summary of the policy on addressing bribery and corruption that meets (and goes beyond) the requirements of the OECD Convention on Combating Bribery | |
| Sustained commitment to corporate social investment | |
| Total number of legal actions for anticompetitive behavior, anti-trust, and monopoly practices and their outcomes | |
| Total value of financial and in-kind contributions to political parties, politicians, and related institutions by country | |
| Child Labor (3) | Operations identified as having significant risk for incidents of child labor and measures taken to contribute to the elimination of child labor |
| Specify any verified incidences of non-compliance with child labor national and international laws | |
| Summary of the policy on excluding child labor as defined by the ILO Convention 138 | |
| Community Engagement/ Impacts (13) | Alcoholism due to the company’s operations |
| Awards received for social and ethical behavior in relation to local communities | |
| Cultural disruption due to the company’s operations | |
| Nature, scope, and effectiveness of any programs and practices that assess and manage the impacts of operations on communities | |
| Number and description of significant disputes relating to land use, customary rights of local communities, and Indigenous Peoples | |
| Percentage of sites with “fly-in, fly-out” operations relative to the total number of sites | |
| Prostitution due to the company’s operations | |
| Specify any community projects in which the company has been involved | |
| Summary of Community Sustainable Development Plan to manage impacts on communities in areas affected by its activities during the mine operation and post-closure | |
| Summary of the policy for liaison with local communities | |
| Summary of the policy on stakeholder involvement, including the mechanisms by which stakeholders can participated in decision-making on the issues that concern them | |
| The extent to which grievance mechanisms were used to resolve disputes relating to land use, customary rights of local communities, and Indigenous Peoples and the outcomes | |
| Total number of health and safety complaints from local communities, with a summary, if applicable | |
| Customer Health and Safety (5) | Life cycle stages in which health and safety impacts of products and services are assessed for improvement |
| Number and type of instances of non-compliance with regulations concerning customer health and safety, including the penalties and fines assessed for these breaches | |
| Percentage of significant products and services categories subject to health and safety impacts of products and services are assessed | |
| Summary of the policy for preserving customer health and safety during use of products | |
| Total number of incidents of non-compliance with regulations and voluntary codes concerning health and safety impacts of products and services during their life cycle, by type of outcomes | |
| Diversity and Equal Opportunity (8) | Composition of governance bodies and breakdown of employees per category according to gender, age group, minority group membership, and other description diversity indicators |
| Ratio of basic salary of men to women by employee category | |
| Total number of incidents of discrimination and actions taken | |
| Percentage of ethnic minorities employed relative to the total number of employees, with an explain of how representative that is of the regional or national population makeup | |
| Percentage of ethnic minorities in senior executive and senior and middle management ranks | |
| Percentage of women employed relative to the total number of employees | |
| Percentage of women in senior executive and senior and middle management ranks | |
| Summary of the equal opportunity policy | |
| Employment Practices (6) | Benefits provided to full-time employees that are not provided to temporary or part-time employees, by major operation |
| Breakdown by region or country of the number of direct employees (on company payroll) | |
| Employee turnover expressed as percentage of employees leaving company relative to the total number of new employees | |
| Number of indirect employees (e.g., contractors, consultants) expressed as full-time equivalents | |
| Total number and rate of employee turnover by age group, gender, and region | |
| Total workforce by employment type, employment contract, and region | |
| Forced or Compulsory Labor (2) | Operations identified as having significant risk for incidents of forced or compulsory labor and measures to contribute to the elimination of forced or compulsory labor |
| Summary of the policy to prevent forced and compulsory labor as specified in ILO Convention No. Description 29, Article 2 | |
| Human Rights (7) | Identification of human rights issues and commitment to their protection |
| Percentage and total number of significant investment agreements that include human rights clauses or that have undergone human rights screening | |
| Percentage of security personnel trained in the organization’s policies or procedures concerning aspects of human rights that are relevant to operations | |
| Percentage of significant suppliers and contractors that have undergone screening on human rights and actions taken | |
| Statement on whether the company conforms with the ILO Conventions on the Right to Organize (no. 87 and 98) | |
| Summary of the policy concerning human rights relevant to company’s activities | |
| Total hours of employee training on policies and procedures concerning aspects of human rights that are relevant to operations, including the percentage of employees trained | |
| Indigenous Peoples (3) | Percentage of quarries/mines on sites sacred for indigenous people relative to the total number of quarries/mines |
| Summary of the policy to address the needs and particularly the land rights of indigenous people | |
| Total number of incidents of violations involving rights of indigenous people and actions taken | |
| Labor/ Management Relations (6) | Freedom of association and collective bargaining |
| Minimum notice period(s) regarding operational changes, including whether it is specified in collective agreements (Description) | |
| Number of strikes and lock-outs exceeding one week’s duration, by country | |
| Percentage of employees covered by collective bargaining agreements | |
| Policy procedures involving consultation and negotiation with employees over changes in the company (e.g., restructuring, redundancies, etc.) | |
| Ranking of the company as an employer in the internal ranking and surveys | |
| Occupational Health and Safety (11) | Education, training, counselling, prevention, and risk-control programs in place to assist employees, their families, or community members regarding serious diseases |
| Health and safety topics covered in formal agreements with trade unions | |
| Lost-time accidents | |
| Lost-time accidents relative to the total hours worked | |
| Number of compensated occupational diseases | |
| Number of fatalities at work | |
| Percentage of hours of training regarding health and safety relative to the total number of hours worked | |
| Percentage of total absence hours on health and safety grounds relative to the total hours worked | |
| Percentage of total workforce represented in formal joint management–worker health and safety committees that help monitor and advise on occupational health and safety programs | |
| Rates of injury, occupational diseases, lost days, and absenteeism and number of work-related fatalities by region | |
| Summary of the policy on HIV/AIDS | |
| Product/Materials Stewardship (10) | Monetary value of significant fines for noncompliance with laws and regulations concerning the provision and use of products and services |
| Practices related to customer satisfaction, including results of surveys measuring customer satisfaction | |
| Programs and progress relating to materials stewardship | |
| Programs for adherence to laws, standards, and voluntary codes related to marketing communications, including advertising, promotion, and sponsorship | |
| Summary of consumer satisfaction and complaints | |
| Summary of the policy related to product information and labelling | |
| Total number of incidents of non-compliance with regulations and voluntary codes concerning marketing communications, including advertising, promotion, and sponsorship by type of outcomes | |
| Total number of incidents of non-compliance with regulations and voluntary codes concerning product and service information and labelling, by type of outcomes | |
| Total number of substantiated complaints regarding breaches of customer privacy and losses of customer data | |
| Type of product and service information required by procedures and percentage of significant products and services subject to such information requirements | |
| Social Performance Management (7) | Demonstrable use of Social Impact Assessment (SIA) tools throughout project life, including closure |
| Ongoing group social audit and verification processes conforming to AA 1000 | |
| Socially responsible approach to personal development | |
| Socially responsible communication strategy and employee involvement | |
| Socially responsible employment and working conditions | |
| Socially responsible management policies and system | |
| Sustained commitment to social performance evaluation, reporting at local and corporate level | |
| Suppliers and Contractors (2) | Percentage of contracts that are paid in accordance with agreed terms |
| Percentage of local suppliers, relative to the total number of suppliers | |
| Training and Education (5) | Average hours of training per year per employee by employee category |
| Number of employees that are financially sponsored by the company for further education | |
| Percentage of employees receiving regular performance and career development reviews | |
| Percentage of hours training (excluding Health and Safety) relative to the total hours worked (e.g., management, production, technical, administrative, cultural, etc.) | |
| Programs for skills management and lifelong learning that support the continued employability of employees and assist them in managing career endings | |
Appendix B
Table A2.
Statistical test results showing change over the study period for social reporting of oil and gas companies. (Tests were conducted at 95% confidence level.)
Table A2.
Statistical test results showing change over the study period for social reporting of oil and gas companies. (Tests were conducted at 95% confidence level.)
| Social Indicator Category | ANOVA Result | Friedman’s Test Result | Different Year Pairs Based on Post Hoc Pairwise Test | |
|---|---|---|---|---|
| Suppliers and Contractors | Not significant (p = 0.190) | Not significant (p = 0.151) | - | |
| Forced or Compulsory Labor | Not significant (p = 0.750) | Not significant (p = 0.799) | - | |
| Training and Education | Not significant (p = 0.500) | Not significant (p = 0.581) | - | |
| Indigenous Peoples | Not significant (p = 0.379) | Not significant (p = 0.449) | - | |
| Child Labor | Not significant (p = 0.843) | Not significant (p = 0.936) | - | |
| Community Engagement/Impacts | Not significant (p = 0.483) | Not significant (p = 0.531) | - | |
| Labor/Management Relations | Not significant (p = 0.429) | Not significant (p = 0.461) | - | |
| Human Rights | Not significant (p = 0.436) | Not significant (p = 0.486) | - | |
| Social Performance Management | Not significant (p = 0.525) | Not significant (p = 0.579) | - | |
| Product/Materials Stewardship | Not significant (p = 0.141) | Not significant (p = 0.092) |
| |
| Employment Practices | Not significant (p = 0.278) | Not significant (p = 0.258) |
| |
| Business Ethics | Not significant (p = 0.123) | Not significant (p = 0.071) |
|
|
| Customer Health and Safety | Not significant (p = 0.070) | Significant (p = 0.036) |
| |
| Diversity and Equal Opportunity | Not significant (p = 0.084) | Significant (p = 0.037) |
| |
| Occupational Health and Safety | Significant (p = 0.049) | Significant (p = 0.019) |
| |
Table A3.
Statistical test results showing change over the study period for social reporting of mining companies. (Tests were conducted at 95% confidence level.)
Table A3.
Statistical test results showing change over the study period for social reporting of mining companies. (Tests were conducted at 95% confidence level.)
| Social Indicator Category | ANOVA Result | Friedman’s Test Result | Different Year Pairs Based on Post Hoc Pairwise Test | |
|---|---|---|---|---|
| Suppliers and Contractors | Not significant (p = 0.350) | Not significant (p = 0.353) | - | |
| Forced or Compulsory Labor | Not significant (p = 0.577) | Not significant (p = 0.666) | - | |
| Training and Education | Not significant (p = 0.384) | Not significant (p = 0.398) | - | |
| Indigenous Peoples | Not significant (p = 0.345) | Not significant (p = 0.343) | - | |
| Employment Practices | Not significant (p = 0.490) | Not significant (p = 0.609) | - | |
| Child Labor | Not significant (p = 0.155) | Not significant (p = 0.119) |
| |
| Occupational Health and Safety | Not significant (p = 0.313) | Not significant (p = 0.308) |
| |
| Human Rights | Not significant (p = 0.329) | Not significant (p = 0.327) |
| |
| Community Engagement/Impacts | Not significant (p = 0.148) | Not significant (p = 0.134) |
| |
| Diversity and Equal Opportunity | Not significant (p = 0.326) | Not significant (p = 0.328) |
| |
| Labor/Management Relations | Not significant (p = 0.492) | Not significant (p = 0.549) |
| |
| Social Performance Management | Not significant (p = 0.072) | Significant (p = 0.012) | - | |
| Customer Health and Safety | Significant (p = 0.027) | Significant (p = 0.002) |
|
|
| Product/Materials Stewardship | Significant (p = 2.73 × 10⁻¹¹) | Significant (p = 2.2 × 10⁻¹⁸) |
|
|
| Business ethics | Significant (p = 0.019) | Significant (p = 0.006) |
|
|
Table A4.
Statistical test results showing change over the study period for environmental reporting of oil and gas companies. (Tests were conducted at 95% confidence level.)
Table A4.
Statistical test results showing change over the study period for environmental reporting of oil and gas companies. (Tests were conducted at 95% confidence level.)
| Environmental Indicator Category | ANOVA Result | Friedman’s Test Result | Different Year Pairs Based on Post Hoc Pairwise Test | |
|---|---|---|---|---|
| Nuisance | Not significant (p = 0.529) | Not significant (p = 0.777) | - | |
| Environmental Investments | Not significant (p = 0.333) | Not significant (p = 0.423) | - | |
| Biodiversity | Not significant (p = 0.924) | Not significant (p = 0.975) | - | |
| Transport and Logistics | Not significant (p = 0.404) | Not significant (p = 0.441) | - | |
| Mineral resources | Not significant (same data over the years) | Not significant (same data over the years) | - | |
| Liquid Effluents | Not significant (p = 0.225) | Not significant (p = 0.181) | - | |
| Solid Waste | Not significant (p = 0.799) | Not significant (p = 0.926) | - | |
| Polluting Incidents | Not significant (p = 0.770) | Not significant (p = 0.889) | - | |
| Material Use | Not significant (p = 0.190) | Not significant (p = 0.134) | - | |
| Energy | Not significant (p = 0.091) | Not significant (p = 0.057) |
|
|
| Environmental Management | Significant (p = 0.247) | Not significant (p = 0.225) |
| |
| Closure and Rehabilitation | Significant (p = 0.029) | Significant (p = 0.014) |
| |
| Emissions | Significant (p = 8.52 × 10⁻⁵) | Significant (p = 1.195 × 10⁻⁶) |
|
|
| Water Consumption | Significant (p = 0.036) | Significant (p = 0.009) |
|
|
Table A5.
Statistical test results showing change over the study period for environmental reporting of mining companies. (Tests were conducted at 95% confidence level.)
Table A5.
Statistical test results showing change over the study period for environmental reporting of mining companies. (Tests were conducted at 95% confidence level.)
| Environmental Indicator Category | ANOVA Result | Friedman’s Test Result | Different Year Pairs Based on Post Hoc Pairwise Test | |
|---|---|---|---|---|
| Nuisance | Not significant (p = 0.177) | Not significant (p = 0.135) | - | |
| Environmental Investments | Not significant (p = 0.457) | Not significant (p = 0.526) | - | |
| Biodiversity | Not significant (p = 0.213) | Not significant (p = 0.169) | - | |
| Transport and Logistics | Not significant (p = 0.275) | Not significant (p = 0.253) | - | |
| Mineral Resources | Not significant (same data over the years) | Not significant (same data over the years) | - | |
| Liquid Effluents | Not significant (p = 0.439) | Not significant (p = 0.470) | - | |
| Environmental Management | Not significant (p = 0.461) | Not significant (p = 0.514) | - | |
| Emissions | Not significant (p = 0.186) | Not significant (p = 0.157) |
| |
| Energy | Not significant (p = 0.277) | Not significant (p = 0.267) |
| |
| Polluting Incidents | Not significant (p = 0.056) | Significant (p = 0.032) |
|
|
| Material Use | Significant (p = 0.0063) | Significant (p = 0.0001) |
|
|
| Solid Waste | Significant (p = 0.0208) | Significant (p = 0.0048) |
|
|
| Closure and Rehabilitation | Significant (p = 0.0060) | Significant (p = 0.0028) |
|
|
| Water Consumption | Significant (p = 0.0011) | Significant (p = 9.67 × 10⁻⁶) |
|
|
Table A6.
Statistical test results showing change over the study period for economic reporting of oil and gas companies. (Tests were conducted at 95% confidence level.)
Table A6.
Statistical test results showing change over the study period for economic reporting of oil and gas companies. (Tests were conducted at 95% confidence level.)
| Economic Indicator Category | ANOVA Result | Friedman’s Test Result | Different Year Pairs Based on Post Hoc Pairwise Test |
|---|---|---|---|
| Customers | Not significant (p = 0.294) | Not significant (p = 0.277) | - |
| Employees | Not significant (p = 0.689) | Not significant (p = 0.827) | - |
| Technology | Not significant (p = 0.269) | Not significant (p = 0.238) | - |
| Economic Performance | Not significant (p = 0.647) | Not significant (p = 0.877) | - |
| Products | Not significant (p = 0.351) | Not significant (p = 0.423) | - |
| Indirect Economic Impacts | Not significant (same data over the years) | Not significant (same data over the years) | - |
| Resource Intensity | Not significant (p = 0.817) | Not significant (p = 0.953) | - |
| Market Presence | Not significant (p = 0.483) | Not significant (p = 0.677) | - |
| Providers of Capital | Not significant (p = 0.526) | Not significant (p = 0.632) | - |
| Procurement Practices | Not significant (p = 0.079) | Significant (p = 0.036) |
|
| Compliance and Public Sector | Not significant (p = 0.073) | Significant (p = 0.023) |
|
Table A7.
Statistical test results showing change over the study period for economic reporting of mining companies. (Tests were conducted at 95% confidence level.)
Table A7.
Statistical test results showing change over the study period for economic reporting of mining companies. (Tests were conducted at 95% confidence level.)
| Economic Indicator Category | ANOVA Result | Friedman’s Test Result | Different Year Pairs Based on Post Hoc Pairwise Test |
|---|---|---|---|
| Customers | Not significant (p = 0.443) | Not significant (p = 0.544) | - |
| Employees | Not significant (p = 0.405) | Not significant (p = 0.469) | - |
| Technology | Not significant (p = 0.526) | Not significant (p = 0.587) | - |
| Economic Performance | Not significant (p = 0.711) | Not significant (p = 0.809) | - |
| Products | Not significant (p = 0.508) | Not significant (p = 0.677) | - |
| Indirect Economic Impacts | Not significant (p = 0.170) | Not significant (p = 0.062) | - |
| Procurement Practices | Not significant (p = 0.129) | Not significant (p = 0.076) | - |
| Compliance and Public Sector | Not significant (p = 0.608) | Not significant (p = 0.647) | - |
| Market Presence | Not significant (p = 0.116) | Not significant (p = 0.055) |
|
| Resource Intensity | Not significant (p = 0.054) | Significant (p = 0.020) |
|
| Providers of Capital | Not significant (p = 0.086) | Significant (p = 0.021) | - |
References
- Warhurst, A. Corporate citizenship and corporate social investment drivers of tri-sector partnerships. J. Corp. Citizsh. 2001, 1, 57–73. [Google Scholar]
- Jenkins, H.; Yakovleva, N. Corporate social responsibility in the mining industry: Exploring trends in social and environmental disclosure. J. Clean. Prod. 2006, 14, 271–284. [Google Scholar] [CrossRef]
- Aggarwal, P.; Singh, A.K. CSR and sustainability reporting practices in india: An in-depth content analysis of top-listed companies. Soc. Responsib. J. 2019, 15, 1033–1053. [Google Scholar] [CrossRef]
- Szczepankiewicz, E.I.; Mućko, P. CSR reporting practices of Polish energy and mining companies. Sustainability 2016, 8, 126. [Google Scholar] [CrossRef] [Green Version]
- GRI. Consolidated Set of GRI Sustainability Reporting Standards. Available online: https://edisciplinas.usp.br/pluginfile.php/4982561/mod_resource/content/1/gri-standards-consolidated-2018.pdf (accessed on 20 May 2019).
- WBCSD. Sustainable Development Reporting: Striking the Balance. Available online: http://docs.wbcsd.org/2002/12/SustainableDevReporting-StrikingTheBalance.pdf (accessed on 24 September 2019).
- Roca, L.C.; Searcy, C. An analysis of indicators disclosed in corporate sustainability reports. J. Clean. Prod. 2012, 20, 103–118. [Google Scholar] [CrossRef]
- Boulanger, P.-M. Sustainable development indicators: A scientific challenge, a democratic issue. Surv. Perspect. Integr. Environ. Soc. 2008, 1, 59–73. [Google Scholar] [CrossRef]
- Azapagic, A. Developing a framework for sustainable development indicators for the mining and minerals industry. J. Clean. Prod. 2004, 12, 639–662. [Google Scholar] [CrossRef]
- Azapagic, A.; Perdan, S. Indicators of sustainable development for industry: A general framework. Process Saf. Environ. Prot. 2000. [Google Scholar] [CrossRef]
- Janus, B.; Murphy, H. Sustainability Reporting and the Oil and Gas Industry-Challenges and Emerging Trends. In Proceedings of the European HSE Conference and Exhibition, London, UK, 16 April 2013. [Google Scholar] [CrossRef]
- Böhling, K.; Murguía, D.I. Sustainability reporting in the mining sector: Why institutional dynamics of reporting disappoi nt beliefs in its potentials for increased corporate accountability. In Proceedings of the Regulatory Governance between Global and Local ECPR Standing Group on Regulatory Governance, Barcelona, Spain, 25–27 June 2014. [Google Scholar]
- Siew, R.Y.J. A review of corporate sustainability reporting tools (SRTs). J. Environ. Manag. 2015, 164, 180–195. [Google Scholar] [CrossRef]
- More than Values: The Value-Based Sustainability Reporting That Investors Want. Available online: https://www.mckinsey.de/~/media/McKinsey/Business%20Functions/Sustainability/Our%20Insights/More%20than%20values%20The%20value%20based%20sustainability%20reporting%20that%20investors%20want/More%20than%20values-VF.pdf (accessed on 2 July 2021).
- Büyüközkan, G.; Karabulut, Y. Sustainability performance evaluation: Literature review and future directions. J. Environ. Manag. 2018, 217, 253–267. [Google Scholar] [CrossRef] [PubMed]
- Calabrese, A.; Costa, R.; Levialdi, N.; Menichini, T. A fuzzy analytic hierarchy process method to support materiality assessment in sustainability reporting. J. Clean. Prod. 2016, 121, 248–264. [Google Scholar] [CrossRef]
- Guenther, E.; Hoppe, H.; Poser, C. Environmental Corporate Social Responsibility of Firms in the Mining and Oil and Gas Industries: Current Status QUO of Reporting Following GRI Guidelines. Greener Manag. Int. 2006, 53, 7–25. [Google Scholar]
- Raufflet, E.; Cruz, L.B.; Bres, L. An assessment of corporate social responsibility practices in the mining and oil and gas industries. J. Clean. Prod. 2014, 84, 256–270. [Google Scholar] [CrossRef]
- Bhatia, A.; Tuli, S. Sustainability reporting practices in US and UK: An empirical comparison. Int. J. Law Manag. 2018, 60, 1034–1056. [Google Scholar] [CrossRef]
- Alazzani, A.; Wan-Hussin, W.N. Global reporting initiative’s environmental reporting: A study of oil and gas companies. Ecol. Indic. 2013, 32, 19–24. [Google Scholar] [CrossRef]
- Yongvanich, K.; Guthrie, J. Extended performance reporting: An examination of the australian mining industry. Account. Forum 2005, 29, 103–119. [Google Scholar] [CrossRef]
- Lee, K.H. Does size matter? Evaluating corporate environmental disclosure in the australian mining and metal industry: A combined approach of quantity and quality measurement. Bus. Strateg. Environ. 2017, 26. [Google Scholar] [CrossRef]
- Dilling, P.F.A. Reporting on long-term value creation-the example of public canadian energy and mining companies. Sustainability 2016, 8, 938. [Google Scholar] [CrossRef] [Green Version]
- Hourneaux Junior, F.; Galleli, B.; Gallardo-Vázquez, D.; Sánchez-Hernández, M.I. strategic aspects in sustainability reporting in oil & gas industry: The comparative case-study of brazilian petrobras and spanish repsol. Ecol. Indic. 2017, 72, 203–214. [Google Scholar] [CrossRef]
- Khan, M.; Chinnasamy, J.; Dakhan, S.; Pongiannan, K. An investigation of environmental reporting in the oil and gas sector of pakistan using global reporting initiative’s guidelines. J. High. Educ. Serv. Sci. Manag. 2019, 2, 5. [Google Scholar]
- Mahmood, M.; Orazalin, N. green governance and sustainability reporting in kazakhstan’s oil, gas, and mining sector: Evidence from a former ussr emerging economy. J. Clean. Prod. 2017, 164, 389–397. [Google Scholar] [CrossRef]
- Perez, F.; Sanchez, L.E. Assessing the evolution of sustainability reporting in the mining sector. Environ. Manag. 2009, 43, 949–961. [Google Scholar] [CrossRef] [PubMed]
- Orazalin, N.; Mahmood, M. Economic, environmental, and social performance indicators of sustainability reporting: Evidence from the russian oil and gas industry. Energy Policy 2018, 121, 70–79. [Google Scholar] [CrossRef]
- Lodhia, S.; Hess, N. Sustainability Accounting and reporting in the mining industry: Current literature and directions for future research. J. Clean. Prod. 2014, 84, 43–50. [Google Scholar] [CrossRef]
- Suska, M. Environmental Corporate Social Responsibility (ECSR) on the Example of Polish Champion Oil, Gas and Mining Companies. Sustainability 2021, 13, 6179. [Google Scholar] [CrossRef]
- Heenetigala, K.; Armstrong, A. The Impact of Sustainability Reporting Determined from the Response of Mining Corporations to Environmental Risk; Springer: Cham, Switzerland, 2019; pp. 211–225. [Google Scholar] [CrossRef]
- McLellan, B.C.; Corder, G.D.; Giurco, D.; Green, S. Incorporating sustainable development in the design of mineral processing operations-review and analysis of current approaches. J. Clean. Prod. 2009, 17, 1414–1425. [Google Scholar] [CrossRef] [Green Version]
- Corder, G.D.; McLellan, B.C.; Bangerter, P.J.; van Beers, D.; Green, S.R. Engineering-in sustainability through the application of susop®. Chem. Eng. Res. Des. 2012, 90, 98–109. [Google Scholar] [CrossRef] [Green Version]
- GRI. Benefits of Reporting. Available online: https://www.globalreporting.org/information/sustainability-reporting/Pages/reporting-benefits.aspx (accessed on 20 May 2019).
- Hahn, R.; Kühnen, M. Determinants of sustainability reporting: A review of results, trends, theory, and opportunities in an expanding field of research. J. Clean. Prod. 2013, 59, 5–21. [Google Scholar] [CrossRef]
- IPIECA.; API.; IOGP. Oil and Gas Industry Guidance on Voluntary Sustainability Reporting. In Proceedings of the SPE International Health, Safety & Environment Conference, Abu Dhabi, United Arab Emirates, 2 April 2006. [Google Scholar] [CrossRef]
- Fortanier, F.; Kolk, A.; Pinkse, J. Harmonization in CSR reporting: MNES and global CSR standards. Manag. Int. Rev. 2011, 51, 665–696. [Google Scholar] [CrossRef] [Green Version]
- Pennington, L.K.; More, E. Sustainability Reporting: Rhetoric versus reality? Employ. Relations Rec. 2010, 10, 24–39. [Google Scholar]
- Sustainability Reporting Policy: Global Trends in Disclosure as the ESG Agenda Goes Mainstream. Available online: https://www.usb.ac.za/wp-content/uploads/2020/08/Carrots-Sticks-2020-Report-FIN-21.07.2020.pdf (accessed on 18 July 2021).
- Industry Today. Mandatory Sustainability Reporting. Available online: https://industrytoday.com/mandatory-sustainability-reporting/ (accessed on 18 July 2021).
- Ioannou, I.; Serafeim, G. The Consequences of Mandatory Corporate Sustainability Reporting. Available online: https://www.albertoandreu.com/uploads/2011/05/The-consequences-of-mandatory-corporate-sustainability-reporting1.pdf (accessed on 18 July 2021).
- Ioannou, I.; Serafeim, G. The consequences of mandatory corporate sustainability reporting. SSRN Electron. J. 2017, 1–49. [Google Scholar] [CrossRef] [Green Version]
- Yaylacı, E.D.; Düzgün, H.Ş. Indicator-based sustainability assessment for the mining sector plans: Case of afşin-elbistan coal basin. Int. J. Coal Geol. 2016, 165, 190–200. [Google Scholar] [CrossRef]
- Bocken, N.M.P.; Short, S.W.; Rana, P.; Evans, S. A Literature and practice review to develop sustainable business model archetypes. J. Clean. Prod. 2014, 65, 42–56. [Google Scholar] [CrossRef] [Green Version]
- Lemus-Aguilar, I.; Morales-Alonso, G.; Ramirez-Portilla, A.; Hidalgo, A. Sustainable business models through the lens of organizational design: A systematic literature review. Sustainability 2019, 11, 5379. [Google Scholar] [CrossRef] [Green Version]
- Towards a Conceptual Framework of Business Models for Sustainability. Available online: https://repository.tudelft.nl/islandora/object/uuid%3A98d90ab2-a675-42de-9e48-8afe78c62ed6 (accessed on 10 February 2019).
- Maass, W.; Parsons, J.; Purao, S.; Storey, V.C.; Woo, C. Data-driven meets theory-driven research in the era of big data: Opportunities and challenges for information systems research. J. Assoc. Inf. Syst. 2018, 12, 1253–1273. [Google Scholar] [CrossRef] [Green Version]
- Lindgren, C.; Huq, A.M.; Carling, K. Who are the intended users of csr reports? Insights from a data-driven approach. Sustainability 2021, 13, 1070. [Google Scholar] [CrossRef]
- Lyu, P.H.; Ngai, E.W.T.; Wu, P.Y. Scientific data-driven evaluation on academic articles of low-carbon economy. Energy Policy 2019, 125, 358–367. [Google Scholar] [CrossRef]
- Wu, K.J.; Tseng, M.L.; Ali, M.H.; Xue, B.; Chiu, A.S.F.; Fujii, M.; Xu, M.; Lan, S.; Ren, M.; Bin, Y. Opportunity or threat in balancing social, economic and environmental impacts: The appearance of the polar silk road. Environ. Impact Assess. Rev. 2021, 88, 106570. [Google Scholar] [CrossRef]
- Halkos, G.; Nomikos, S.; Tsilika, K. Evidence for Novel Structures Relating CSR Reporting and Economic Welfare: Environmental Sustainability—A Continent-Level Analysis. Available online: https://link.springer.com/article/10.1007/s10614-020-10091-5 (accessed on 10 May 2021).
- Yaylaci, E.D. A Sustainability Assessment Framework for Evaluation of Coal Mining Sector Plans in Afşin-Elbistan Coal Basin with A Special Emphasis on Land Disturbance. Ph.D. Thesis, Middle East Tecnhical University, Ankara, Turkey, 2015. [Google Scholar]
- Yaylaci, E.D.; Kalaycioglu, S.; Duzgun, S. Stakeholder engagement-based evaluation of social sustainability with respect to the mining sector stakeholder engagement-based evaluation of social sustainability with respect to the mining sector. In Proceedings of the 23rd Annual International Sustainable Development Research Society, Bogotá, Colombia, 14–16 June 2017. [Google Scholar]
- Yaylacı, E.D.; Düzgün, H.Ş. Evaluating the mine plan alternatives with respect to bottom-up and top-down sustainability criteria. J. Clean. Prod. 2017, 167, 837–849. [Google Scholar] [CrossRef]
- Tysiac, K. New ESG Reporting Metrics Released by World Economic Forum. Available online: https://www.journalofaccountancy.com/news/2020/sep/esg-reporting-metrics-environmental-social-governance.html. (accessed on 10 May 2021).
- Forbes. The World’s Largest Public Companies. Available online: https://www.forbes.com/global2000/list/#industry:Oil (accessed on 10 February 2019).
- Els, F. Top 50 Biggest Mining Companies. Available online: https://www.mining.com/top-50-biggest-mining-companies/ (accessed on 10 February 2019).
- Papoutsi, A.; Sodhi, M.M.S. Does disclosure in sustainability reports indicate actual sustainability performance? J. Clean. Prod. 2020, 260, 121049. [Google Scholar] [CrossRef]
- Fuisz-Kehrbach, S.K. A three-dimensional framework to explore corporate sustainability activities in the mining industry: Current status and challenges ahead. Resour. Policy 2015, 46, 101–115. [Google Scholar] [CrossRef]
- Krippendorff, K. Reliability in content analysis: Some common misconceptions and recommendations. Hum. Commun. Res. 2004. [Google Scholar] [CrossRef]
- University of Georgia. Content Analysis as a Research Technique. Available online: https://www.terry.uga.edu/_contentanalysis/research/ (accessed on 5 May 2019).
- Columbia University. Content Analysis. Available online: https://www.mailman.columbia.edu/research/population-health-methods/content-analysis (accessed on 5 May 2019).
- Zaiontz, C. Real Statistics Using Excel. Available online: https://www.real-statistics.com/ (accessed on 2 February 2021).
- Hamann, R. Mining companies’ role in sustainable development: The “why” and “how” of corporate social responsibility from a business perspective. Dev. S. Afr. 2003, 20, 237–254. [Google Scholar] [CrossRef]
- Smith, N.M.; Olson Hoal, K.E.; Thompson, J.F.H. Goal 4: Ensure inclusive and equitable quality education and promote lifelong learning opportunities for all. In Mining, Materials, and the Sustainable Development Goals (SDGs) 2030 and Beyond; Parra, C., Lewis, B., Ali, S.H., Eds.; Taylor & Francis Group: Abingdon, UK, 2020; pp. 29–39. [Google Scholar] [CrossRef]
- Lee, J.; Bazilian, M. Mining the Energy Transition. Available online: https://www.globalpolicyjournal.com/blog/02/04/2020/mining-energy-transition (accessed on 8 May 2021).
- Mubarik, M.; Zuraidah, R. Triad of big data supply chain analytics, supply chain integration and supply chain performance: Evidences from oil and gas sector. Humanit. Soc. Sci. Lett. 2019, 7, 209–224. [Google Scholar] [CrossRef]
- Upson, S.; Clarke, C. Socio-economic assessment in the extractive industries-avoiding the pitfalls. In Extractive Industries and Society; Elsevier: Amsterdam, The Netherlands, 1 December 2015; pp. 671–675. [Google Scholar] [CrossRef]
- Kaplan, R.S.; Norton, D.P. Transforming the balanced scorecard from performance measurement to strategic management: Part I. Account. Horizons 2001, 15, 87–104. [Google Scholar] [CrossRef]
- Lages, L.F. VCW—Value Creation Wheel: Innovation, Technology, Business, and Society. J. Bus. Res. 2016, 69, 4849–4855. [Google Scholar] [CrossRef] [Green Version]
- Nidumolu, R.; Prahalad, C.K.; Rangaswami, M.R. Why sustainability is now the key driver of innovation. Harv. Bus. Rev. 2009, 87, 56–64. [Google Scholar]
- Gurzawska, A. Towards responsible and sustainable supply chains–innovation, multi-stakeholder approach and governance. Philos. Manag. 2020, 19, 267–295. [Google Scholar] [CrossRef] [Green Version]
- van den Brink, S.; Kleijn, R.; Tukker, A.; Huisman, J. Approaches to responsible sourcing in mineral supply chains. Resour. Conserv. Recycl. 2019, 145, 389–398. [Google Scholar] [CrossRef]
- Lambrechts, W. Ethical and Sustainable Sourcing: Towards Strategic and Holistic Sustainable Supply Chain Management. In Encyclopedia of the UN Sustainable Development Goals; Decent Work and Economic Growth; Springer Nature Switzerland AG: Cham, Switzerland, 2020; pp. 1–13. [Google Scholar] [CrossRef]
- ATHEX. ESG Reporting Guide. Available online: https://www.athexgroup.gr/documents/10180/5665122/ENG-ESG+REPORTING+GUIDE/28a9a0e5-f72c-4084-9047-503717f2f3ff (accessed on 8 May 2021).
- BM&F Bovespa. New Value-Corporate Sustainability. Available online: http://www.b3.com.br/data/files/96/D0/37/3C/0F07751035EA4575790D8AA8/GuiaNovoValor_SustentabilidadeNasEmpresas_EN.PDF (accessed on 8 May 2021).
- Borsa Istanbul. Şirketler İçin Sürdürülebilirlik Rehberi. Available online: https://www.borsaistanbul.com/files/Surdurulebilirlik_Rehberi_2020.pdf (accessed on 8 May 2021).
- Bursa Malaysia. Sustainability Reporting Guide. Available online: https://www.bursamalaysia.com/sites/5bb54be15f36ca0af339077a/content_entry5ce3b5005b711a1764454c1a/5ce3c83239fba2627b286508/files/bursa_malaysia_sustainability_reporting_guide-final.pdf?1570701456 (accessed on 8 May 2021).
- Environmental & Social (E&S) Disclosure Guide. Available online: https://sseinitiative.org/wp-content/uploads/2014/08/20161212_ES-Disclosure-Guideline-ENGLISH.pdf (accessed on 8 May 2021).
- KASE. METHODOLOGY for Preparing an Environmental, Social and Governance Report. Available online: https://kase.kz/files/normative_base/met_ekolog_soc_eng.pdf (accessed on 8 May 2021).
- Botswana Stock Exchange. Guidance for Listed Companies on Reporting ESG Information to Investors. Available online: https://www.bse.co.bw/wp-content/uploads/2021/02/BSE_Guidance-for-Listed-Companies-on-Reporting-ESG-Information-to-Invest....pdf (accessed on 8 May 2021).
- UN Water. Water, Food and Energy. Available online: https://www.unwater.org/water-facts/water-food-and-energy/ (accessed on 21 June 2021).
- FSC.; ACSI. ESG Reporting Guide for Australian Companies. Available online: https://www.asx.com.au/documents/asx-compliance/acsi-fsc-esg-reporting-guide-final-2015.pdf (accessed on 8 May 2021).
- Santiago Exchange. Design and Construction of Sustainability Reports. Available online: https://sseinitiative.org/wp-content/uploads/2014/08/2017-Design-and-Construction-of-Sustainability-Reports-Santiago-Exchange.pdf (accessed on 8 May 2021).
- TMX. A Primer for Environmental & Social Disclosure. Available online: https://www.tsx.com/resource/en/2388 (accessed on 8 May 2021).
- Bahrain Bourse. ESG Reporting Guide. Available online: https://www.bahrainbourse.com/resources/files/Sustainability/ESG_11%20June%202020.pdf (accessed on 8 May 2021).
- BNV. Guía Voluntaria Para La Creación de Reportes de Sostenibilidad. Available online: https://www.bolsacr.com/empresas/guia-para-reporte-de-sostenibilidad (accessed on 8 May 2021).
- BSE. Guidance Document on ESG Disclosures. Available online: https://www.bseindia.com/downloads1/BSEs_Guidance_doc_on_ESG.pdf (accessed on 8 May 2021).
- DFM. ESG Reporting Guide. Available online: https://www.dfm.ae/docs/default-source/default-document-library/esg-reporting-guide_en.pdf?sfvrsn=60fa7681_0 (accessed on 8 May 2021).
- Nasdaq. ESG Reporting Guide 2.0. Available online: https://www.nasdaq.com/docs/2019/11/26/2019-ESG-Reporting-Guide.pdf (accessed on 8 May 2021).
- Rentschler, J.E.; Flachenecker, F. Investing in Resource Efficiency–The Economics and Politics of Financing the Resource Transition. Available online: https://blogs.worldbank.org/climatechange/investing-resource-efficiency-economics-and-politics-financing-resource-transition (accessed on 21 June 2021).
- Bartos, P.J. Is mining a high-tech industry?: Investigations into innovation and productivity advance. Resour. Policy 2007, 32, 149–158. [Google Scholar] [CrossRef]
- Sánchez, F.; Hartlieb, P. Innovation in the mining industry: Technological trends and a case study of the challenges of disruptive innovation. Min. Metall. Exploration 2020, 37, 1385–1399. [Google Scholar] [CrossRef]
- The Case for Innovation in the Mining Industry. Available online: https://www.ceecthefuture.org/wp-content/uploads/2016/01/Clareo_Case-for-Innovation-in-Mining_20150910_lo.pdf (accessed on 8 May 2021).
- Theron, E.; Volk, P.J. Research and Development: Driving Innovation in a Declining Mining Industry. In Lecture Notes in Mechanical Engineering; Springer: Cham, Switzerland, 2015. [Google Scholar] [CrossRef]
- Top 10 Business Risks and Opportunities. 2020. Available online: https://www.ey.com/en_us/mining-metals/10-business-risks-facing-mining-and-metals (accessed on 8 October 2019).
- LSEG. Your Guide to ESG Reporting. Available online: https://sseinitiative.org/wp-content/uploads/2016/02/ESG_Guidance_Report_LSEG.pdf (accessed on 8 May 2021).
- SET. Guidelines for the Preparation of Sustainability Reports. Available online: https://www.setsustainability.com/ (accessed on 8 May 2021).
- Deloitte. Sustainability Disclosure Getting Ahead of the Curve. Available online: https://www2.deloitte.com/content/dam/Deloitte/us/Documents/risk/us-risk-sustainability-disclosure.pdf (accessed on 8 May 2021).
- The United Nations. Policy Brief: Transforming Extractive Industries for Sustainable Development. Available online: https://www.un.org/sites/un2.un.org/files/sg_policy_brief_extractives.pdf (accessed on 21 June 2021).
- Opoku, A. SDG2030: A Sustainable Built Environment’s Role in Achieving the Post-2015 United Nations Sustainable Development Goals. In Proceedings of the 32nd Annual ARCOM Conference, Manchester, UK, 5–7 September 2016. [Google Scholar]
- Caraka, R.E.; Noh, M.; Chen, R.-C.; Lee, Y.; Gio, P.U.; Pardamean, B. Connecting climate and communicable disease to penta helix using hierarchical likelihood structural equation modelling. Symmetry 2021, 13, 657. [Google Scholar] [CrossRef]
- Upe, A.; Ibrahim, Z.; Arsyad, M.; Sumandiyar, A.; Jabar, A. Strengthening of social capital through penta helix model in handling Covid-19 pandemic. Int. J. Pharm. Res. 2021, 13, 4243–4248. [Google Scholar] [CrossRef]
- RMI Report. 2020. Available online: https://2020.responsibleminingindex.org/en/key-findings (accessed on 3 July 2020).
Figure 1.
Research methodology flowchart.

Figure 2.
Range in reporting rates of social indicator categories, representing the extent of change in their appearance in reports over seven years (2012–2018).
Figure 2.
Range in reporting rates of social indicator categories, representing the extent of change in their appearance in reports over seven years (2012–2018).

Figure 3.
Range in reporting rates of environmental indicator categories, representing the extent of change in their appearance in reports over seven years (2012–2018).
Figure 3.
Range in reporting rates of environmental indicator categories, representing the extent of change in their appearance in reports over seven years (2012–2018).

Figure 4.
Range in reporting rates of economic indicator categories, representing the extent of change in their appearance in reports over seven years (2012–2018).
Figure 4.
Range in reporting rates of economic indicator categories, representing the extent of change in their appearance in reports over seven years (2012–2018).

Table 1.
Coverage of indicator subsets in sustainability reports.
| Indicator Subsets | Indicator Set | Oil and Gas Companies | Mining Companies | ||
|---|---|---|---|---|---|
| Total Number of Indicators | Number of Indicators Covered | Coverage Ratio | Number of Indicators Covered | Coverage Ratio | |
| Social | 105 | 53 | 50% | 61 | 58% |
| Environmental | 87 | 32 | 37% | 41 | 47% |
| Economic | 33 | 15 | 45% | 15 | 45% |
| Total | 225 | 100 | 45% | 117 | 52% |
Table 2.
Means and standard deviations (Mean ± SD) of reporting rates of social indicator categories by oil and gas.
Table 2.
Means and standard deviations (Mean ± SD) of reporting rates of social indicator categories by oil and gas.
| Social Indicator Categories | 2012 | 2013 | 2014 | 2015 | 2016 | 2017 | 2018 | 7-Year Average |
|---|---|---|---|---|---|---|---|---|
| External Indicator Categories | ||||||||
| Product/Materials Stewardship | 0.30 ± 0.46 | 0.33 ± 0.47 | 0.29 ± 0.46 | 0.23 ± 0.42 | 0.28 ± 0.45 | 0.24 ± 0.43 | 0.21 ± 0.41 | 0.27 ± 0.44 |
| Suppliers and Contractors | 0.13 ± 0.34 | 0.19 ± 0.40 | 0.31 ± 0.48 | 0.31 ± 0.48 | 0.31 ± 0.48 | 0.31 ± 0.48 | 0.31 ± 0.48 | 0.27 ± 0.44 |
| Customer Health and Safety | 0.30 ± 0.46 | 0.40 ± 0.50 | 0.43 ± 0.50 | 0.35 ± 0.48 | 0.30 ± 0.46 | 0.30 ± 0.46 | 0.23 ± 0.42 | 0.33 ± 0.47 |
| Child Labor | 0.38 ± 0.49 | 0.42 ± 0.50 | 0.33 ± 0.48 | 0.38 ± 0.49 | 0.33 ± 0.48 | 0.33 ± 0.48 | 0.33 ± 0.48 | 0.36 ± 0.48 |
| Indigenous Peoples | 0.42 ± 0.50 | 0.46 ± 0.51 | 0.38 ± 0.49 | 0.38 ± 0.49 | 0.42 ± 0.50 | 0.33 ± 0.48 | 0.33 ± 0.48 | 0.39 ± 0.49 |
| Forced or Compulsory Labor | 0.31 ± 0.48 | 0.44± 0.51 | 0.38 ± 0.50 | 0.38 ± 0.50 | 0.50 ± 0.52 | 0.38 ± 0.50 | 0.44 ± 0.51 | 0.40 ± 0.49 |
| Community Engagement/Impacts | 0.41 ± 0.49 | 0.43 ± 0.50 | 0.44 ± 0.50 | 0.39 ± 0.49 | 0.40 ± 0.49 | 0.38 ± 0.49 | 0.40 ± 0.49 | 0.41 ± 0.49 |
| Human Rights | 0.59 ± 0.50 | 0.63 ± 0.49 | 0.70 ± 0.46 | 0.68 ± 0.47 | 0.66 ± 0.48 | 0.63 ± 0.49 | 0.70 ± 0.46 | 0.65 ± 0.48 |
| Internal Indicator Categories | ||||||||
| Labor/Management Relations | 0.38 ± 0.49 | 0.42 ± 0.50 | 0.40 ± 0.49 | 0.48 ± 0.50 | 0.46 ± 0.50 | 0.40 ± 0.49 | 0.40 ± 0.49 | 0.42 ± 0.49 |
| Employment Practices | 0.58 ± 0.50 | 0.54 ± 0.50 | 0.56 ± 0.50 | 0.54 ± 0.50 | 0.54 ± 0.50 | 0.48 ± 0.50 | 0.54 ± 0.50 | 0.54 ± 0.50 |
| Diversity and Equal Opportunity | 0.58 ± 0.50 | 0.48 ± 0.50 | 0.56 ± 0.50 | 0.56 ± 0.50 | 0.58 ± 0.50 | 0.58 ± 0.50 | 0.59 ± 0.50 | 0.56 ± 0.50 |
| Occupational Health and Safety | 0.59 ± 0.49 | 0.58 ± 0.50 | 0.60 ± 0.49 | 0.61 ± 0.49 | 0.58 ± 0.49 | 0.53 ± 0.50 | 0.52 ± 0.50 | 0.57 ± 0.49 |
| Training and Education | 0.58 ± 0.50 | 0.60 ± 0.50 | 0.65 ± 0.48 | 0.60 ± 0.50 | 0.58 ± 0.50 | 0.60 ± 0.50 | 0.55 ± 0.50 | 0.59 ± 0.49 |
| Business Ethics | 0.54 ± 0.50 | 0.57 ± 0.50 | 0.61 ± 0.49 | 0.60 ± 0.49 | 0.63 ± 0.48 | 0.63 ± 0.49 | 0.62 ± 0.49 | 0.60 ± 0.49 |
| Social Performance Management | 0.68 ± 0.47 | 0.73 ± 0.45 | 0.77 ± 0.43 | 0.75 ± 0.44 | 0.75 ± 0.44 | 0.73 ± 0.45 | 0.73 ± 0.45 | 0.73 ± 0.44 |
Table 3.
Means and standard deviations (Mean ± SD) of reporting rates of social indicator categories by mining.
Table 3.
Means and standard deviations (Mean ± SD) of reporting rates of social indicator categories by mining.
| Social Indicator Categories | 2012 | 2013 | 2014 | 2015 | 2016 | 2017 | 2018 | 7-Year Average |
|---|---|---|---|---|---|---|---|---|
| External Indicator Categories | ||||||||
| Customer Health and Safety | 0.38 ± 0.49 | 0.33 ± 0.47 | 0.28 ± 0.45 | 0.18 ± 0.38 | 0.20 ± 0.41 | 0.20 ± 0.41 | 0.20 ± 0.41 | 0.25 ± 0.43 |
| Product/Materials Stewardship | 0.50 ± 0.50 | 0.39 ± 0.49 | 0.39 ± 0.49 | 0.16 ± 0.37 | 0.16 ± 0.37 | 0.19 ± 0.39 | 0.19 ± 0.39 | 0.28 ± 0.45 |
| Suppliers and Contractors | 0.25 ± 0.45 | 0.31 ± 0.48 | 0.31 ± 0.48 | 0.31 ± 0.48 | 0.38 ± 0.50 | 0.29 ± 0.47 | 0.25 ± 0.45 | 0.30 ± 0.46 |
| Forced or Compulsory Labor | 0.56 ± 0.51 | 0.50± 0.52 | 0.44 ± 0.51 | 0.56 ± 0.51 | 0.50 ± 0.52 | 0.50 ± 0.52 | 0.44 ± 0.51 | 0.50 ± 0.50 |
| Child Labor | 0.54 ± 0.51 | 0.58 ± 0.50 | 0.54 ± 0.51 | 0.58 ± 0.50 | 0.54 ± 0.51 | 0.38 ± 0.50 | 0.42 ± 0.50 | 0.51 ± 0.50 |
| Human Rights | 0.63 ± 0.49 | 0.66 ± 0.48 | 0.61 ± 0.49 | 0.63 ± 0.49 | 0.70 ± 0.46 | 0.61 ± 0.49 | 0.66 ± 0.48 | 0.64 ± 0.48 |
| Indigenous Peoples | 0.58 ± 0.50 | 0.71 ± 0.46 | 0.67 ± 0.48 | 0.54 ± 0.51 | 0.71 ± 0.46 | 0.67 ± 0.48 | 0.71 ± 0.46 | 0.65 ± 0.48 |
| Community Engagement/Impacts | 0.63 ± 0.49 | 0.67 ± 0.47 | 0.66 ± 0.47 | 0.63 ± 0.48 | 0.69 ± 0.46 | 0.64 ± 0.48 | 0.67 ± 0.47 | 0.66 ± 0.47 |
| Internal Indicator Categories | ||||||||
| Occupational Health and Safety | 0.57 ± 0.50 | 0.53 ± 0.50 | 0.51 ± 0.50 | 0.49 ± 0.50 | 0.52 ± 0.50 | 0.48 ± 0.50 | 0.57 ± 0.50 | 0.52 ± 0.50 |
| Training and Education | 0.60 ± 0.50 | 0.63 ± 0.49 | 0.60 ± 0.50 | 0.63 ± 0.49 | 0.58 ± 0.50 | 0.57 ± 0.50 | 0.53 ± 0.51 | 0.59 ± 0.49 |
| Diversity and Equal Opportunity | 0.66 ± 0.48 | 0.64 ± 0.48 | 0.63 ± 0.49 | 0.69 ± 0.47 | 0.72 ± 0.45 | 0.68 ± 0.47 | 0.64 ± 0.48 | 0.66 ± 0.47 |
| Business Ethics | 0.67 ± 0.47 | 0.70 ± 0.46 | 0.68 ± 0.47 | 0.67 ± 0.47 | 0.67 ± 0.47 | 0.62 ± 0.49 | 0.68 ± 0.47 | 0.67 ± 0.47 |
| Labor/Management Relations | 0.65 ± 0.48 | 0.69 ± 0.47 | 0.63 ± 0.49 | 0.69 ± 0.47 | 0.73 ± 0.45 | 0.67 ± 0.48 | 0.67 ± 0.48 | 0.67 ± 0.47 |
| Social Performance Management | 0.73 ± 0.45 | 0.73 ± 0.45 | 0.75 ± 0.44 | 0.73 ± 0.45 | 0.73 ± 0.45 | 0.71 ± 0.46 | 0.75 ± 0.44 | 0.73 ± 0.44 |
| Employment Practices | 0.75 ± 0.44 | 0.75 ± 0.44 | 0.73 ± 0.45 | 0.81 ± 0.39 | 0.77 ± 0.42 | 0.79 ± 0.42 | 0.71 ± 0.46 | 0.76 ± 0.43 |
Table 4.
Means and standard deviations (Mean ± SD) of reporting rates of environmental indicator categories by oil and gas.
Table 4.
Means and standard deviations (Mean ± SD) of reporting rates of environmental indicator categories by oil and gas.
| Environmental Indicator Categories | 2012 | 2013 | 2014 | 2015 | 2016 | 2017 | 2018 | 7-Year Average |
|---|---|---|---|---|---|---|---|---|
| Material Use | 0.13 ± 0.33 | 0.15 ± 0.36 | 0.08 ± 0.28 | 0.08 ± 0.28 | 0.06 ± 0.24 | 0.10 ± 0.31 | 0.04 ± 0.20 | 0.09 ± 0.29 |
| Nuisance | 0.13 ± 0.34 | 0.13 ± 0.34 | 0.13 ± 0.34 | 0.13 ± 0.34 | 0.17 ± 0.38 | 0.17 ± 0.38 | 0.21 ± 0.41 | 0.15 ± 0.36 |
| Transport and Logistics | 0.28 ± 0.46 | 0.31 ± 0.47 | 0.25 ± 0.44 | 0.22 ± 0.42 | 0.25 ± 0.44 | 0.19 ± 0.40 | 0.22 ± 0.42 | 0.25 ± 0.43 |
| Liquid Effluents | 0.23 ± 0.42 | 0.27 ± 0.45 | 0.29 ± 0.46 | 0.29 ± 0.46 | 0.31 ± 0.47 | 0.29 ± 0.46 | 0.29 ± 0.46 | 0.28 ± 0.45 |
| Closure and Rehabilitation | 0.30 ± 0.46 | 0.38 ± 0.49 | 0.30 ± 0.46 | 0.30 ± 0.46 | 0.28 ± 0.45 | 0.23 ± 0.42 | 0.23 ± 0.42 | 0.29 ± 0.45 |
| Emissions | 0.26 ± 0.44 | 0.26 ± 0.44 | 0.32 ± 0.47 | 0.33 ± 0.47 | 0.32 ± 0.47 | 0.33 ± 0.47 | 0.35 ± 0.48 | 0.31 ± 0.46 |
| Biodiversity | 0.41 ± 0.50 | 0.38 ± 0.49 | 0.41 ± 0.50 | 0.44 ± 0.50 | 0.41 ± 0.50 | 0.41 ± 0.50 | 0.41 ± 0.50 | 0.41 ± 0.49 |
| Energy | 0.36 ± 0.48 | 0.36 ± 0.48 | 0.44 ± 0.50 | 0.44 ± 0.50 | 0.43 ± 0.50 | 0.43 ± 0.50 | 0.41 ± 0.50 | 0.41 ± 0.49 |
| Solid Waste | 0.42 ± 0.50 | 0.42 ± 0.50 | 0.44 ± 0.50 | 0.44 ± 0.50 | 0.42 ± 0.50 | 0.40 ± 0.49 | 0.42 ± 0.50 | 0.42 ± 0.49 |
| Mineral Resources | 0.44 ± 0.51 | 0.44 ± 0.51 | 0.44 ± 0.51 | 0.44 ± 0.51 | 0.44 ± 0.51 | 0.44 ± 0.51 | 0.44 ± 0.51 | 0.44 ± 0.50 |
| Polluting Incidents | 0.49 ± 0.50 | 0.47 ± 0.50 | 0.49 ± 0.50 | 0.47 ± 0.50 | 0.47 ± 0.50 | 0.47 ± 0.50 | 0.46 ± 0.50 | 0.47 ± 0.50 |
| Environmental Management | 0.48 ± 0.50 | 0.52 ± 0.50 | 0.52 ± 0.50 | 0.56 ± 0.50 | 0.58 ± 0.50 | 0.60 ± 0.49 | 0.50 ± 0.51 | 0.54 ± 0.50 |
| Water Consumption | 0.50 ± 0.51 | 0.53 ± 0.51 | 0.73 ± 0.45 | 0.68 ± 0.47 | 0.50 ± 0.51 | 0.60 ± 0.50 | 0.63 ± 0.49 | 0.59 ± 0.49 |
| Environmental Investments and Activities | 0.94 ± 0.25 | 0.94 ± 0.25 | 0.94 ± 0.25 | 0.88 ± 0.34 | 0.88 ± 0.34 | 0.88 ± 0.34 | 0.94 ± 0.25 | 0.91 ± 0.29 |
Table 5.
Means and standard deviations (Mean ± SD) of reporting rates of environmental indicator categories by mining.
Table 5.
Means and standard deviations (Mean ± SD) of reporting rates of environmental indicator categories by mining.
| Environmental Indicator Categories | 2012 | 2013 | 2014 | 2015 | 2016 | 2017 | 2018 | 7-Year Average |
|---|---|---|---|---|---|---|---|---|
| Transport and Logistics | 0.09 ± 0.29 | 0.13 ± 0.34 | 0.13 ± 0.34 | 0.09 ± 0.29 | 0.16 ± 0.37 | 0.14 ± 0.36 | 0.19 ± 0.40 | 0.13 ± 0.34 |
| Material Use | 0.27 ± 0.45 | 0.25 ± 0.44 | 0.15 ± 0.36 | 0.13 ± 0.33 | 0.13 ± 0.33 | 0.10 ± 0.30 | 0.10 ± 0.31 | 0.16 ± 0.37 |
| Emissions | 0.33 ± 0.47 | 0.31 ± 0.46 | 0.28 ± 0.45 | 0.29 ± 0.46 | 0.32 ± 0.47 | 0.33 ± 0.47 | 0.33 ± 0.47 | 0.31 ± 0.46 |
| Mineral Resources | 0.38 ± 0.50 | 0.38 ± 0.50 | 0.38 ± 0.50 | 0.38 ± 0.50 | 0.38 ± 0.50 | 0.36 ± 0.50 | 0.38 ± 0.50 | 0.37 ± 0.48 |
| Solid Waste | 0.48 ± 0.50 | 0.48 ± 0.50 | 0.38 ± 0.49 | 0.38 ± 0.49 | 0.44 ± 0.50 | 0.33 ± 0.48 | 0.50 ± 0.51 | 0.43 ± 0.49 |
| Biodiversity | 0.44 ± 0.50 | 0.50 ± 0.51 | 0.47 ± 0.51 | 0.53 ± 0.51 | 0.47 ± 0.51 | 0.43 ± 0.50 | 0.41 ± 0.50 | 0.46 ± 0.50 |
| Closure and Rehabilitation | 0.45 ± 0.50 | 0.50 ± 0.51 | 0.55 ± 0.50 | 0.53 ± 0.51 | 0.65 ± 0.48 | 0.40 ± 0.50 | 0.43 ± 0.50 | 0.50 ± 0.50 |
| Nuisance | 0.42 ± 0.50 | 0.50 ± 0.51 | 0.50 ± 0.51 | 0.46 ± 0.51 | 0.67 ± 0.48 | 0.48 ± 0.51 | 0.58 ± 0.50 | 0.51 ± 0.50 |
| Liquid Effluents | 0.54 ± 0.50 | 0.54 ± 0.50 | 0.48 ± 0.50 | 0.50 ± 0.51 | 0.54 ± 0.50 | 0.48 ± 0.51 | 0.52 ± 0.50 | 0.51 ± 0.50 |
| Polluting Incidents | 0.50 ± 0.50 | 0.51 ± 0.50 | 0.51 ± 0.50 | 0.50 ± 0.50 | 0.58 ± 0.50 | 0.49 ± 0.50 | 0.60 ± 0.49 | 0.53 ± 0.50 |
| Environmental Management | 0.56 ± 0.50 | 0.54 ± 0.50 | 0.52 ± 0.50 | 0.58 ± 0.50 | 0.60 ± 0.49 | 0.55 ± 0.50 | 0.56 ± 0.50 | 0.56 ± 0.50 |
| Environmental Investments and Activities | 0.69 ± 0.48 | 0.69 ± 0.48 | 0.75 ± 0.45 | 0.75 ± 0.45 | 0.81 ± 0.40 | 0.79 ± 0.43 | 0.75 ± 0.45 | 0.75 ± 0.44 |
| Water Consumption | 0.70 ± 0.46 | 0.65 ± 0.48 | 0.65 ± 0.48 | 0.78 ± 0.42 | 0.83 ± 0.38 | 0.83 ± 0.38 | 0.85 ± 0.36 | 0.75 ± 0.43 |
| Energy | 0.79 ± 0.41 | 0.78 ± 0.42 | 0.79 ± 0.41 | 0.79 ± 0.41 | 0.75 ± 0.44 | 0.71 ± 0.46 | 0.75 ± 0.44 | 0.76 ± 0.42 |
Table 6.
Means and standard deviations (Mean ± SD) of reporting rates of economic indicator categories by oil and gas.
Table 6.
Means and standard deviations (Mean ± SD) of reporting rates of economic indicator categories by oil and gas.
| Economic Indicator Categories | 2012 | 2013 | 2014 | 2015 | 2016 | 2017 | 2018 | 7-Year Average |
|---|---|---|---|---|---|---|---|---|
| Customers | 0.25 ± 0.45 | 0.25 ± 0.45 | 0.25 ± 0.45 | 0.25 ± 0.45 | 0.19 ± 0.40 | 0.19 ± 0.40 | 0.31 ± 0.48 | 0.24 ± 0.43 |
| Resource Intensity | 0.28 ± 0.46 | 0.28 ± 0.46 | 0.34 ± 0.48 | 0.28 ± 0.46 | 0.31 ± 0.47 | 0.28 ± 0.46 | 0.28 ± 0.46 | 0.29 ± 0.46 |
| Employees | 0.35 ± 0.48 | 0.35 ± 0.48 | 0.35 ± 0.48 | 0.35 ± 0.48 | 0.33 ± 0.47 | 0.38 ± 0.49 | 0.38 ± 0.49 | 0.35 ± 0.48 |
| Procurement Practices | 0.29 ± 0.46 | 0.38 ± 0.49 | 0.42 ± 0.50 | 0.38 ± 0.49 | 0.42 ± 0.50 | 0.50 ± 0.51 | 0.58 ± 0.50 | 0.42 ± 0.49 |
| Market Presence | 0.46 ± 0.51 | 0.46 ± 0.51 | 0.50 ± 0.51 | 0.42 ± 0.50 | 0.38 ± 0.49 | 0.42 ± 0.50 | 0.42 ± 0.50 | 0.43 ± 0.50 |
| Technology | 0.38 ± 0.50 | 0.38 ± 0.50 | 0.50 ± 0.52 | 0.56 ± 0.51 | 0.44 ± 0.51 | 0.56 ± 0.51 | 0.63 ± 0.50 | 0.49 ± 0.50 |
| Compliance and Public Sector | 0.41 ± 0.50 | 0.38 ± 0.49 | 0.50 ± 0.51 | 0.50 ± 0.51 | 0.53 ± 0.51 | 0.56 ± 0.50 | 0.63 ± 0.49 | 0.50 ± 0.50 |
| Providers of Capital | 0.50 ± 0.51 | 0.50 ± 0.51 | 0.50 ± 0.51 | 0.50 ± 0.51 | 0.53 ± 0.51 | 0.56 ± 0.50 | 0.50 ± 0.51 | 0.51 ± 0.50 |
| Economic Performance | 0.56 ± 0.50 | 0.53 ± 0.51 | 0.56 ± 0.50 | 0.56 ± 0.50 | 0.56 ± 0.50 | 0.63 ± 0.49 | 0.59 ± 0.50 | 0.57 ± 0.49 |
| Products | 0.88 ± 0.35 | 0.88 ± 0.35 | 0.88 ± 0.35 | 0.88 ± 0.35 | 0.75 ± 0.46 | 0.75 ± 0.46 | 0.75 ± 0.46 | 0.82 ± 0.38 |
| Indirect Economic Impacts | 1.00 ± 0.00 | 1.00 ± 0.00 | 1.00 ± 0.00 | 1.00 ± 0.00 | 1.00 ± 0.00 | 1.00 ± 0.00 | 1.00 ± 0.00 | 1.00 ± 0.00 |
Table 7.
Means and standard deviations (Mean ± SD) of reporting rates of economic indicator categories by mining.
Table 7.
Means and standard deviations (Mean ± SD) of reporting rates of economic indicator categories by mining.
| Economic Indicator Categories | 2012 | 2013 | 2014 | 2015 | 2016 | 2017 | 2018 | 7-Year Average |
|---|---|---|---|---|---|---|---|---|
| Customers | 0.06 ± 0.25 | 0.00 ± 0.00 | 0.00 ± 0.00 | 0.00 ± 0.00 | 0.06 ± 0.25 | 0.00 ± 0.00 | 0.00 ± 0.00 | 0.02 ± 0.13 |
| Technology | 0.13 ± 0.34 | 0.06 ± 0.25 | 0.13 ± 0.34 | 0.19 ± 0.40 | 0.06 ± 0.25 | 0.14 ± 0.36 | 0.19 ± 0.40 | 0.13 ± 0.33 |
| Resource Intensity | 0.03 ± 0.18 | 0.06 ± 0.25 | 0.13 ± 0.34 | 0.16 ± 0.37 | 0.16 ± 0.37 | 0.14 ± 0.36 | 0.25 ± 0.44 | 0.13 ± 0.34 |
| Employees | 0.28 ± 0.45 | 0.28 ± 0.45 | 0.33 ± 0.47 | 0.30 ± 0.46 | 0.33 ± 0.47 | 0.31 ± 0.47 | 0.30 ± 0.46 | 0.30 ± 0.46 |
| Providers of Capital | 0.47 ± 0.51 | 0.47 ± 0.51 | 0.53 ± 0.51 | 0.53 ± 0.51 | 0.59 ± 0.50 | 0.57 ± 0.50 | 0.53 ± 0.51 | 0.53 ± 0.50 |
| Economic Performance | 0.59 ± 0.50 | 0.53 ± 0.51 | 0.53 ± 0.51 | 0.50 ± 0.51 | 0.63 ± 0.49 | 0.61 ± 0.50 | 0.56 ± 0.50 | 0.56 ± 0.50 |
| Compliance and Public Sector | 0.53± 0.51 | 0.56 ± 0.50 | 0.63 ± 0.49 | 0.59 ± 0.50 | 0.59 ± 0.50 | 0.64 ± 0.49 | 0.66 ± 0.48 | 0.60 ± 0.49 |
| Procurement Practices | 0.54 ± 0.51 | 0.54 ± 0.51 | 0.63 ± 0.49 | 0.67 ± 0.48 | 0.71 ± 0.46 | 0.67 ± 0.48 | 0.71 ± 0.46 | 0.64 ± 0.48 |
| Market Presence | 0.58 ± 0.50 | 0.63 ± 0.49 | 0.67 ± 0.48 | 0.71 ± 0.46 | 0.79 ± 0.41 | 0.81 ± 0.40 | 0.67 ± 0.48 | 0.69 ± 0.46 |
| Products | 0.88 ± 0.35 | 0.88 ± 0.35 | 1.00 ± 0.00 | 0.88 ± 0.35 | 1.00 ± 0.00 | 0.86 ± 0.38 | 1.00 ± 0.00 | 0.93 ± 0.26 |
| Indirect Economic Impacts | 1.00 ± 0.00 | 1.00 ± 0.00 | 1.00 ± 0.00 | 1.00 ± 0.00 | 1.00 ± 0.00 | 0.86 ± 0.38 | 1.00 ± 0.00 | 0.98 ± 0.13 |
Publisher’s Note: MDPI stays neutral with regard to jurisdictional claims in published maps and institutional affiliations. |
© 2021 by the authors. Licensee MDPI, Basel, Switzerland. This article is an open access article distributed under the terms and conditions of the Creative Commons Attribution (CC BY) license (https://creativecommons.org/licenses/by/4.0/).
Share and Cite
MDPI and ACS Style
Perdeli Demirkan, C.; Smith, N.M.; Duzgun, H.S.; Waclawski, A. A Data-Driven Approach to Evaluation of Sustainability Reporting Practices in Extractive Industries. Sustainability 2021, 13, 8716. https://doi.org/10.3390/su13168716
AMA Style
Perdeli Demirkan C, Smith NM, Duzgun HS, Waclawski A. A Data-Driven Approach to Evaluation of Sustainability Reporting Practices in Extractive Industries. Sustainability. 2021; 13(16):8716. https://doi.org/10.3390/su13168716
Chicago/Turabian StylePerdeli Demirkan, Cansu, Nicole M. Smith, H. Sebnem Duzgun, and Aurora Waclawski. 2021. "A Data-Driven Approach to Evaluation of Sustainability Reporting Practices in Extractive Industries" Sustainability 13, no. 16: 8716. https://doi.org/10.3390/su13168716
Note that from the first issue of 2016, this journal uses article numbers instead of page numbers. See further details here.