
Human Appropriation of Net Primary Production: From a Planet to a Pixel

1
Department of Environment and Society, Utah State University, Logan, UT 84322, USA
2
Department of Environment and Society, Utah State University, Blanding Utah, 576 W 200 S, Blanding, UT 84511, USA
3
Utah Agricultural Experiment Station, Utah State University, Logan, UT 84322, USA
*
Author to whom correspondence should be addressed.
Sustainability 2021, 13(15), 8606; https://doi.org/10.3390/su13158606
Submission received: 29 June 2021
/
Revised: 23 July 2021
/
Accepted: 27 July 2021
/
Published: 2 August 2021
(This article belongs to the Special Issue Local- to Global-Scale Environmental Issues)
Abstract
:Human appropriation of net primary production (HANPP) is a substantial improvement upon 20th century attempts at developing an ecological footprint indicator because of its measurability in relation to net primary production, its close relationship to other key footprint measures, such as carbon and water, and its spatial specificity. This paper explores HANPP across four geographical scales: through literature review, the planet; through reanalysis of existing data, variations among the world’s countries; and through novel analyses, U.S. counties and the 30 m pixel scale for one U.S. county. Results show that HANPP informs different sustainability narratives at different scales. At the planetary scale, HANPP is a critical planetary limit that improves upon areal land use indicators. At the country macroscale, HANPP indicates the degree to which meeting the needs of the domestic population for provisioning ecosystem services (food, feed, biofiber, biofuel) presses against the domestic ecological endowment of net primary production. At the county mesoscale, HANPP reveals the dependency of metropolitan areas upon regional specialized rural forestry and agroecosystems to which they are teleconnected through trade and transport infrastructures. At the pixel microscale, HANPP provides the basis for deriving spatial patterns of remaining net primary production upon which biodiversity and regulatory and cultural ecosystem services are dependent. HANPP is thus a sustainability indicator that can fulfill similar needs as carbon, water and other footprints.
1. Introduction
Led by concerns over carbon emissions that drive climate change, footprint accounting has become increasingly sophisticated and scientifically sound, and taken on growing importance in environmental policy. Carbon emissions can now be accurately accounted at spatial scales of 100 km2, and temporal scales of hours [1]. Carbon footprints are central to the periodic reports from the Intergovernmental Panel on Climate Change (IPCC) and are widely discussed in traditional and social media. Water footprinting has similarly become increasingly accurate, spatially resolved and high profile through the work of Hoekstra et al. [2,3], with an important literature emerging on “virtual water” [4]. Equally relevant, ecological footprints were the first to emerge. Here we trace the development from initial 20th century popularized versions of ecological footprints to the more sophisticated and precise 21st century concept of Human Appropriation of Net Primary Production (HANPP). The primary research question addressed is: how does HANPP inform our understanding of environmental sustainability at various geographical scales, from a planet, to a country, to a U.S. county, to a pixel?
2. Background and Literature Review
In the 1990s, Wackernagel and Rees developed the ecological footprint concept as the area of biologically productive land and ocean that is required to continuously provide the resources consumed by a group of people (such as a country), and to process their wastes [5]. According to their analysis, the average human used 6 to 7 acres; since the Earth contains 5 “productive” acres per capita, a figure that declines with population growth, humans were overshooting planetary limits. They identified substantial variation due to consumption differences, with, for example, the average person in India using 2 acres, China 3, Germany 13, Canada 19, and the U.S. 25. For countries such as the U.S. that were exceeding domestic carrying capacity, the difference had to be made up through imports from lands abroad, or by utilizing domestic natural capital unsustainably. This ecological footprint framework also enabled the analysis of temporal trends, and the partitioning of ecological footprints into their components, such as diet, raw materials, energy needs (including carbon absorption), land development, and land contaminated by nuclear weapons and power development.
As an important innovation in its time, these comparisons yielded insights and illustrated relevant temporal and geographical trends; they were fraught, however, with conceptual weaknesses and scientific imprecision. A generic, geographically unidentified acre of “biologically productive land” was the currency through which the ecological footprint was measured, yet the biological productivity of ecosystems varies enormously. Resource consumption that was not inherently land-based had to be converted to acreage using questionable stoichiometries. For example, how many acres are committed when a ton of coal is surface mined, burned in a power plant, and emits carbon dioxide that must either be sequestered or allowed to change the climate?
2.1. HANPP as a Modernized Ecological Footprint
A more precise and broadly useful approach to measuring ecological footprint is offered by the Human Appropriation of Net Primary Production (HANPP). HANPP is defined by Haberl et al. (2007) [6] as the difference between potential net primary production (NPP) and the NPP remaining post-harvest. This is the NPP made unavailable to ecosystems by human use of land. By using this externally consistent approach, the problem of “generic” land inherent in the ecological footprint concept is solved on two fronts. First, enormous variations in the ecological productivity of land, which range from 0 to about 1500 gCm−2yr−1 [7,8], are incorporated into the analysis. Second, the varying degrees to which this productivity is appropriated or colonized by human use are measured, whether by changing the ecological productivity of the land (HANPP-land use) or by harvesting it (HANPP-harvest). In this manner, it is not the land area of the Earth that constrains human carrying capacity, but the Earth’s terrestrial ecological productivity. Rather than geographical space, the human ecological niche is compared to photosynthetic capacity that can be measured at scales from the planet to a 30 m pixel, as explored below.
Third, HANPP is also identifiable to specific plots of land, thus enabling spatially-specific and geospatial analysis. Critically, by tracing HANPP (harvest) in the form of biomass products such as food or lumber, from the point of production to the point of consumption, a spatially-specific ecological footprint can also be developed on the basis of the consumption of biomass products at specific times and places (this is termed embodied HANPP) [9].
Fourth, HANPP is quantifiable in relation to carrying capacity limitations—among which NPP is perhaps the most critical (Running 2012)—and a safe operating space within those limits [10]. For HANPP, the local safe operating space can be defined as a maximum percentage of NPP, or as a minimum NPP remaining post-harvest—termed NPP (ecological). Moreover, a focus on HANPP as the core of an ecological footprint takes into account the dominant effect HANPP has, through photosynthesis, on water [11], nitrogen [12] and phosphorus [13] use, the profound effect land use and habitat change have on biodiversity loss [14], and the substantial effect, both positive and negative, land use has on atmospheric carbon through Forestry and Other Land Use (FOLU) [15]. HANPP is often measured in terms of dry organic matter but can be easily converted to carbon simply by taking the carbon content of plant biomass—usually 45% [7], or sometimes 47% [16], though there is some variation in individual plants and species [8]. This enables HANPP to be related to carbon footprint, such as the land use component of net carbon emissions.
Fourth, carbon can be readily converted to an energy measure, (e.g., 1 g C = 32,800 joules) so that energy-based comparisons can be drawn. For example, the energy content of global gross terrestrial primary production (GPP) of about 110–120 PgCyr−1 is about 37–39 × 1020 joules, and NPP, using the 56.8 PgCyr−1 estimate, is 18.6 × 10²⁰ joules—0.15 percent of the 37,693 × 1020 joules yr−1 of radiant solar energy reaching Earth. In comparison, global commercial energy consumption is about 6–7 × 10²⁰ joules yr−1 and rising (International Energy Administration 2020). In fact, HANPP is an energy-based concept at its heart, and this enables analyses founded in energy accounting, such as energy return on investment (EROI).
Fifth and finally, like other footprints that have withstood the test of scientific critique, such as water and carbon footprints, HANPP is closely tied to fundamental, measurable earth system processes. Water footprint is measured as evapotranspiration, carbon footprint as net CO2-equivalent emissions to the atmosphere, and HANPP is net primary production made unavailable to ecosystems.
2.2. Limitations of HANPP
While the advantages of HANPP as an ecological footprint measure are dispositive, there are important measurement and definitional issues [8], as is the case with all footprint analyses. First, the definition of HANPP (land use) is the difference between potential and actual NPP, yet the former is hypothetical and can only be simulated using ecosystem models such as Lund–Potsdam–Jena [17], or the Carnegie–Ames–Stanford Approach [18]. Different ecosystem models have been shown to generate quite different results, with none of them achieving accuracy within the bounds of flux tower measurement uncertainty [19]. While gross primary production can be directly measured using flux tower data, albeit on a course and unrepresentative spatial framework, net primary production can only be estimated indirectly from remote sensing data.
Human “appropriation” of ecological energy flows also brings to bear definitional issues. For example, in a grain field, the yield of grain is clearly appropriated but the roots of annual crops and much of the straw or stover remain in place, providing ecological energy to detritus cycles. Are these then “appropriated” by humans? Partitioning HANPP into above and below-ground, and into economic yield and unused components, enables calculation of it under a variety of definitions [20,21].
3. Materials and Methods
This paper examines HANPP across four scales: the planet, countries across the globe, the counties of the U.S., and an individual U.S. county at a 30 m pixel scale. At the planetary scale, we compare estimates made by the most prominent studies and interpret them considering recent research on planetary limits. At the national scale, we accessed data made publicly available by the Institute for Social Ecology (2021) in Vienna, Austria and re-analyzed them at the national scale using geospatial methods. We then compared the results to critical temporal and spatial trends in HANPP emerging from the literature [22].
At the county mesoscale, we analyzed total HANPP (harvest) for each U.S. county derived from crop and timber production and livestock grazing. Here, we present only the overall results for 2012, as a summary of a large and detailed analysis of HANPP in the U.S. Readers are referred to Paudel (in preparation) for further methodological details and crop-specific estimates.
At the microscale of the 30 m pixel for Lyons County, Iowa, we used geospatial analysis of available data to derive HANPP (harvest) estimates. County-level data on yields of corn grain, soybeans, and alfalfa, the crops grown in that county in 2012, were taken from the U.S. Department of Agriculture (2018). Yields were converted to NPP using stoichiometries described in Paudel et al. (in preparation). We also used raster data from the U.S. Department of Agriculture National Agriculture Statistics Service (USDA-NASS) [23] Cropland Data Layer (2021) that identifies specific crops and other land covers at a 30 m spatial resolution. We clipped the original raster to the extent of Lyon County and selected pixels classified as specific crops that were grown in the county, including corn, soybeans, and alfalfa, as well as grassland/pasture where livestock grazing occurs. Moreover, we used a raster calculator function to assign NPP values to the pixels matching these categories, and all pixels were then overlaid to produce a HANPP (harvest) map for the county at a 30 m pixel scale for the year 2012.
4. Results
4.1. HANPP at the Planetary Scale
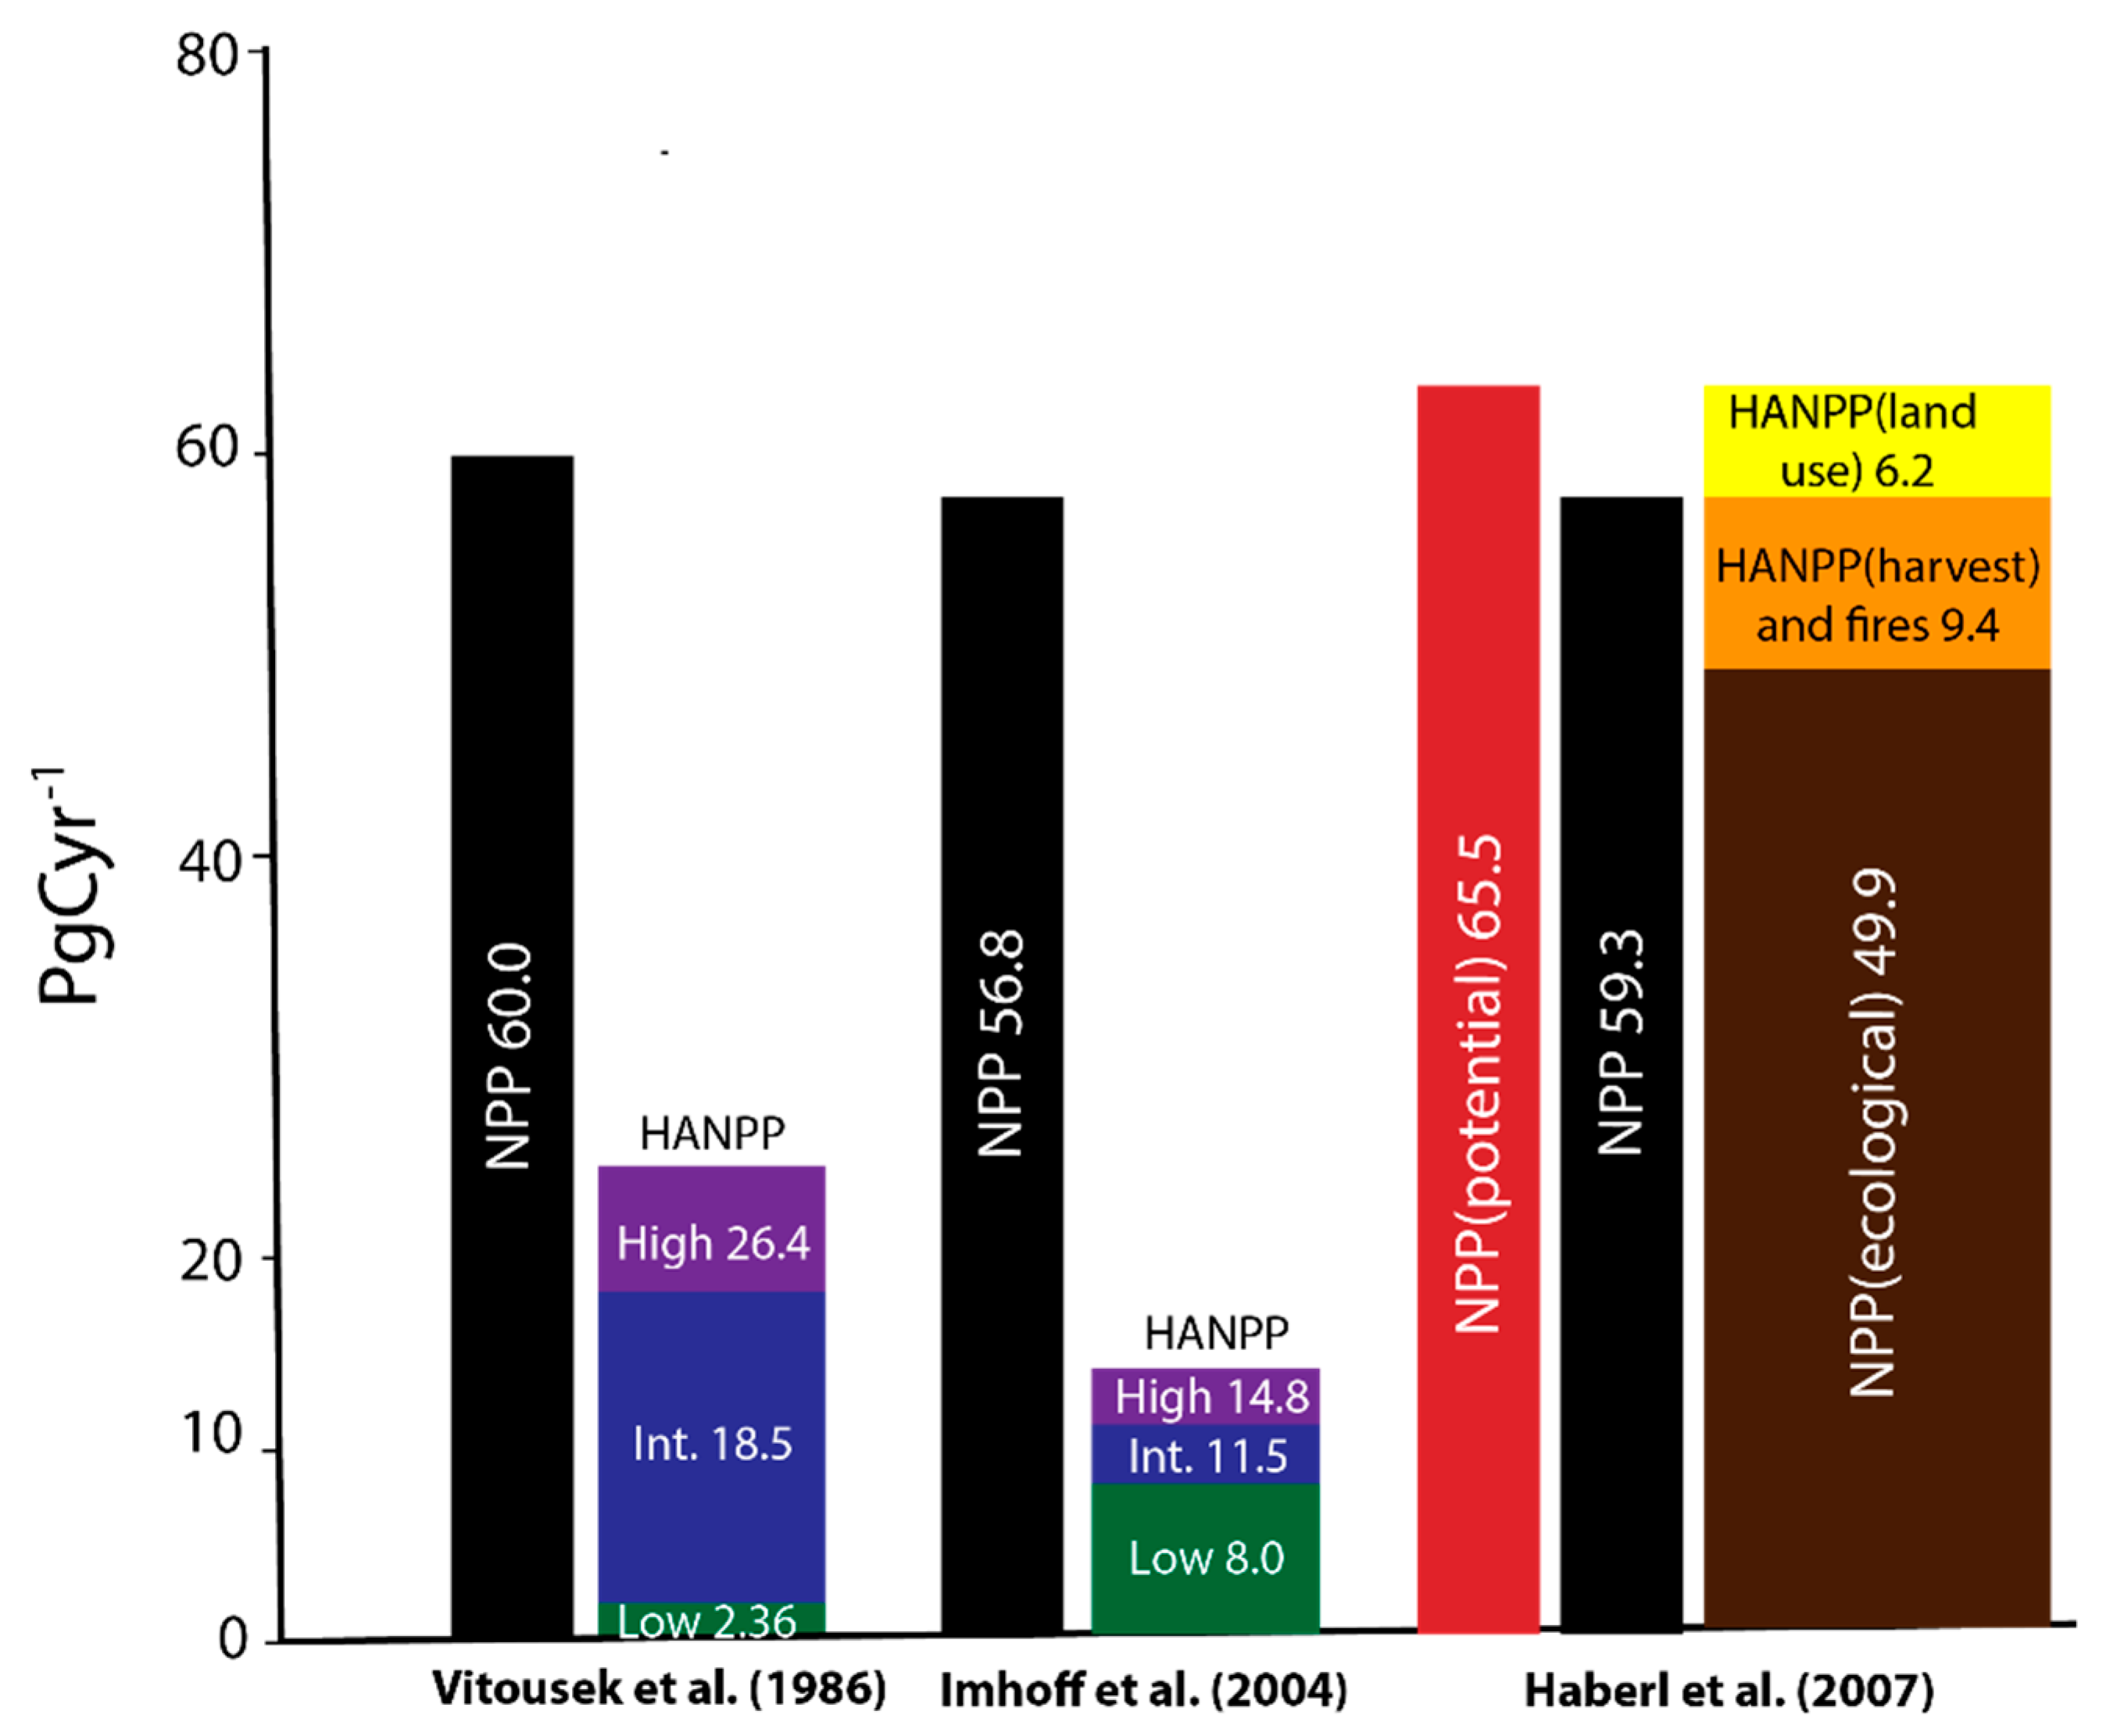
The concept of “human appropriation of the products of photosynthesis” began in earnest with the 1986 paper by Vitousek et al. [24] that estimated global terrestrial NPP at 60 PgCyr−1, with low, intermediate, and high estimates of human appropriation of NPP of 2.36 PgCyr−1 (3.9%), 18.5 PgCyr−1 (30.7%), and 26.4 PgCyr−1 (38.8%), using different definitions of “appropriation” of human managed ecosystems (Figure 1). Imhoff et al. [16] estimated global terrestrial NPP at 56.8 PgCyr−1 and a narrower range of human appropriation of NPP ranging from 8.0 to 14.8 PgCyr−1 (14–26% of NPP) with great regional variation. Haberl et al. (2007) refined the definition of HANPP to include two components. HANPP (land use) is the difference between the potential NPP of terrestrial ecosystems in the absence of human land use and the actual NPP. This applies to a variety of forms of land degradation, such as deforestation, desertification, and soil erosion, as well as urbanization and infrastructure, but it can also be negative where intensive cultivation, usually involving irrigation, raises actual NPP beyond the natural photosynthetic potential of the land. Note, however, the methodological difficulties in measuring it identified above. HANPP (harvest) is the amount of biomass removed through crop and timber production and livestock grazing, with consideration of human-induced fires. They found global potential NPP of 65.5 PgCyr−1 and HANPP of 15.6 PgCyr−1, 23.8% of potential NPP, of which 40% is HANPP (land use), 53% is HANPP (harvest), and 7% is human-induced fires.
The work of Rockstrom et al. [10] illuminates these data from the global perspective of planetary limits and safe operating spaces within them. Alongside atmospheric carbon, reactive nitrogen and other planetary limits, HANPP emerges as a key planetary limit. Running (2012) argues persuasively that it is the most critical of these several limits; global NPP measures the photosynthetic capacity of Earth against which HANPP is increasingly pressing. Krausmann et al. [25], for example, found that global HANPP doubled in the 20th century from 13% to 25% of global potential NPP. Another doubling to half would entail enormous consequences for ecosystem services and biodiversity. Moreover, the agricultural and forestry activities that enable HANPP have reduced standing stocks of terrestrial carbon by half [25], while doubling its turnover time; this has displaced upwards of 450 PC from the terrestrial landscape to the atmosphere. These observations make HANPP an essential and underappreciated global scale sustainability indicator that improves upon “land transformation,” based on areal units, because it captures spatial variations in ecological productivity and the intensity with which humans appropriate it.
4.2. HANPP at a National Macroscale
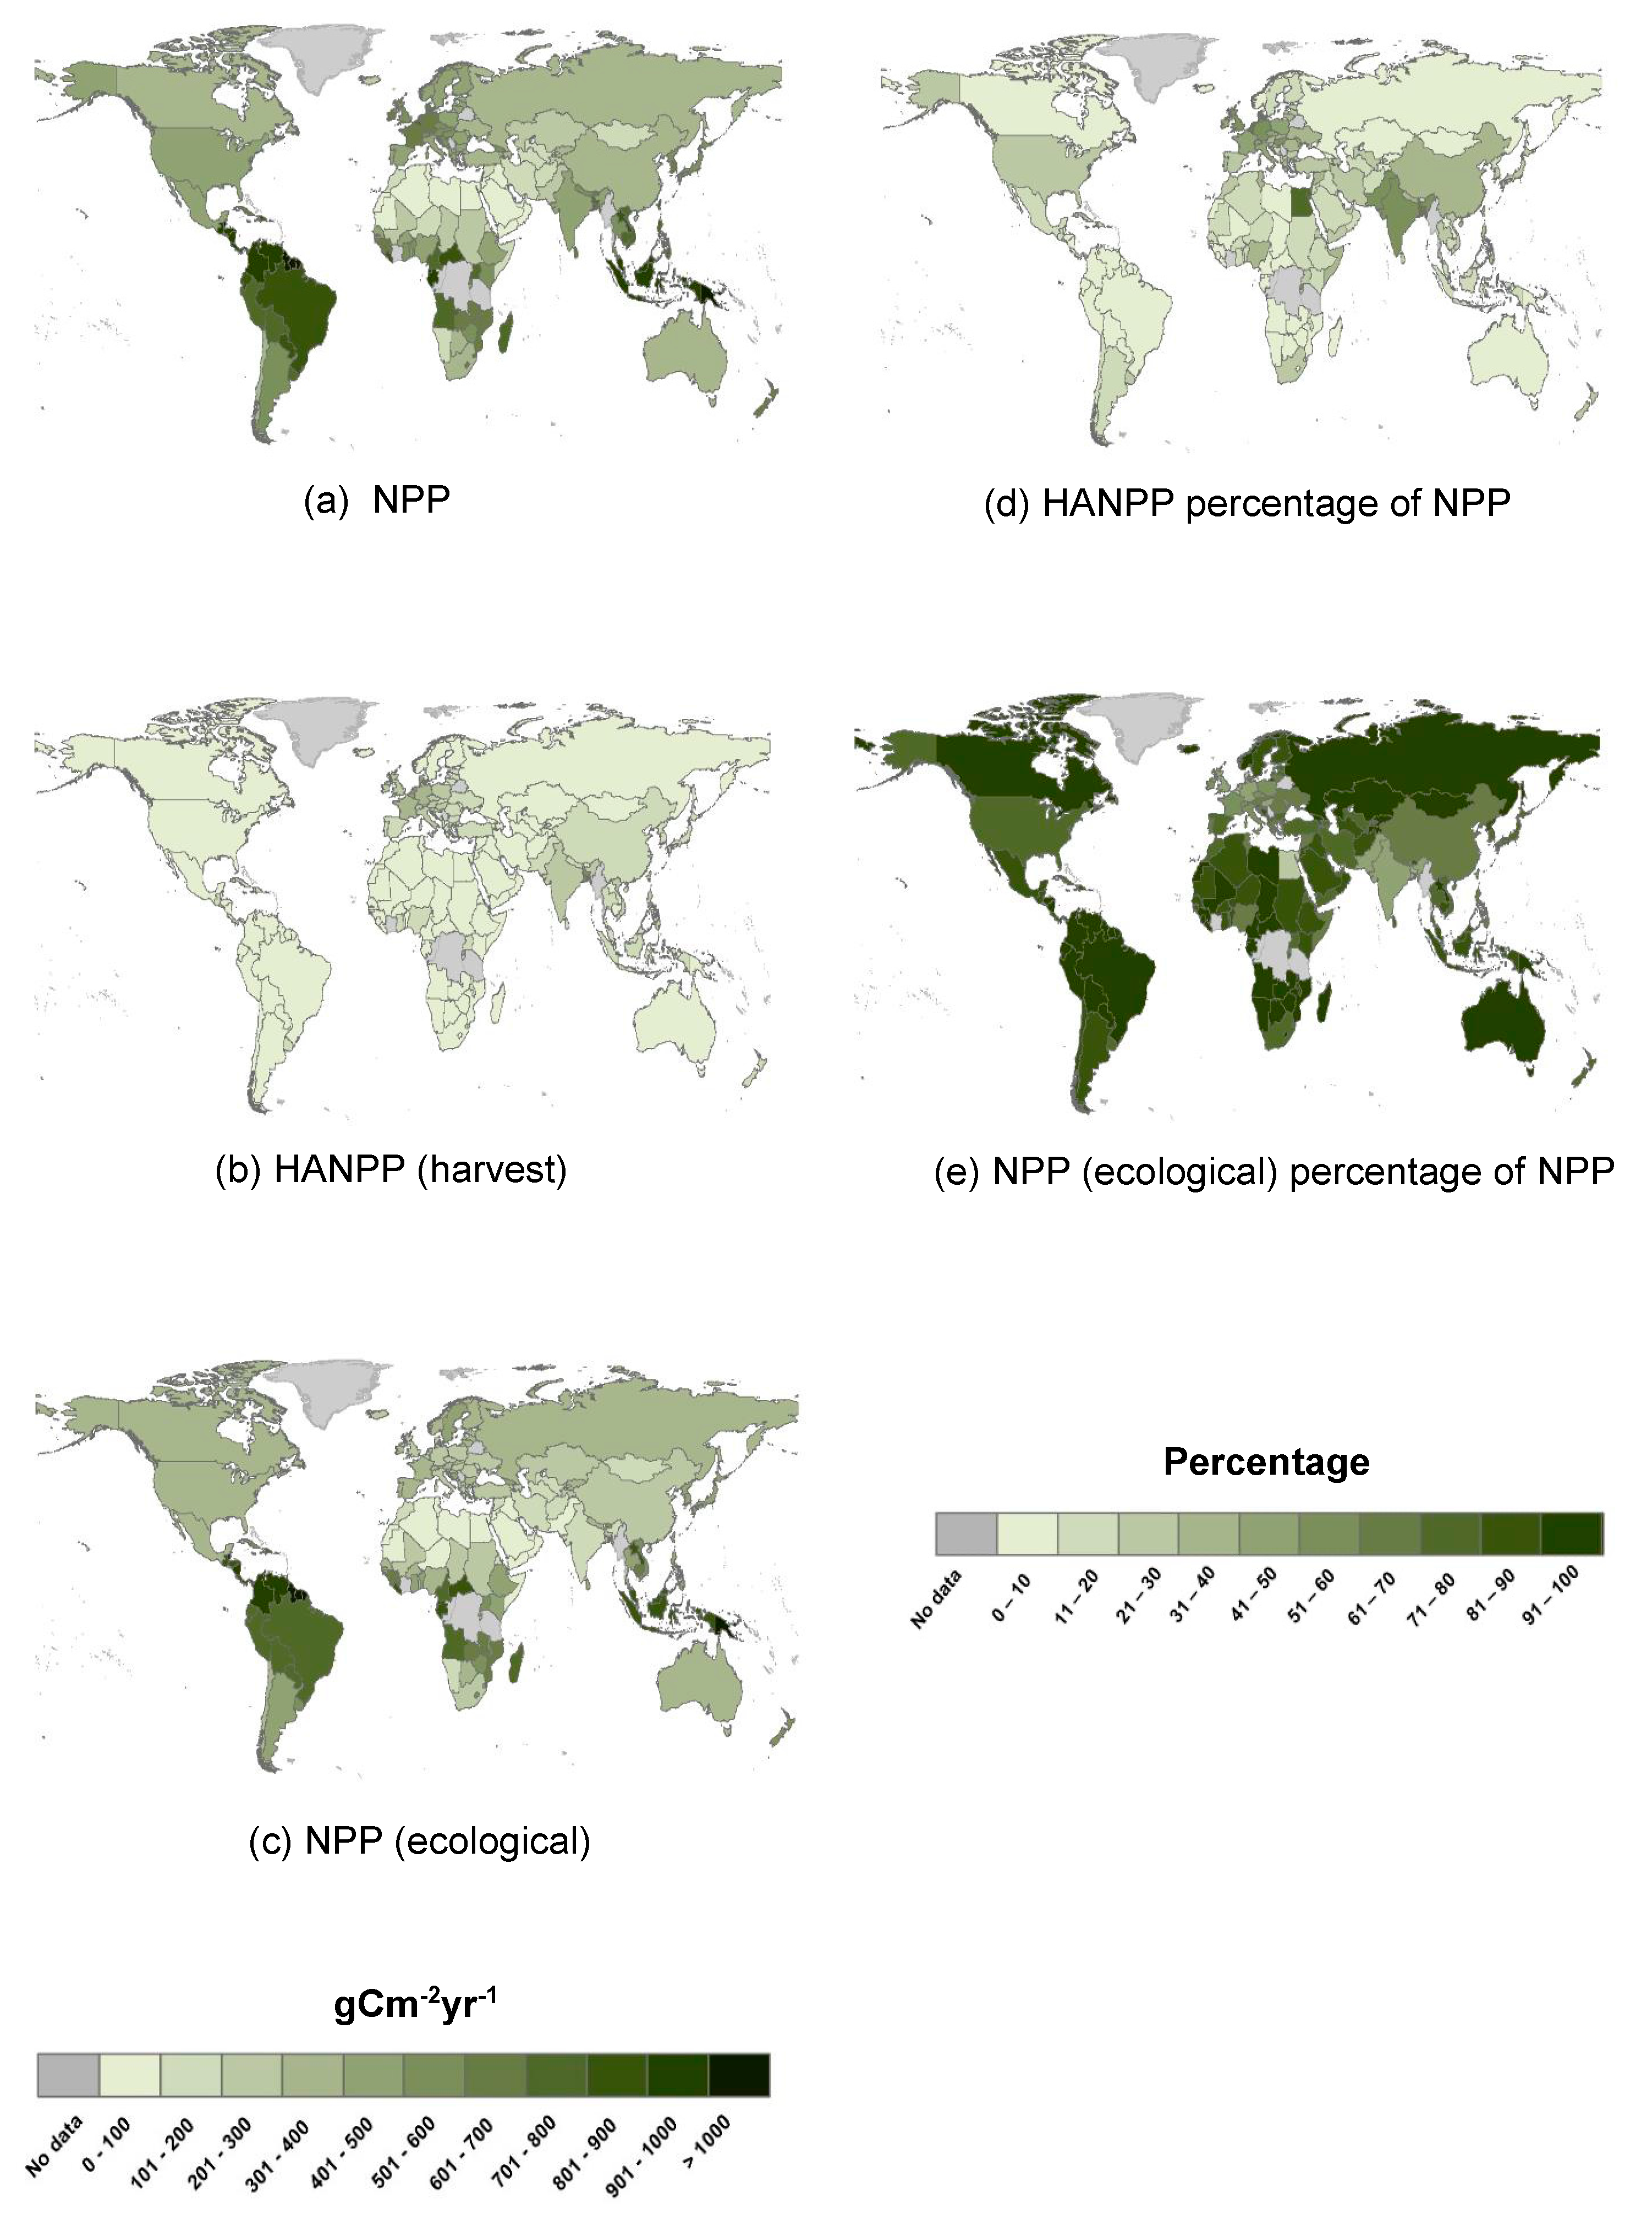
Authors at the Institute of Social Ecology in Vienna (e.g., [12]) provide a solid basis for comparing HANPP among the world’s countries around the year 2000. By country, NPP varies from 10 gCm−2yr−1 in Western Sahara, to 1144 gCm−2yr−1 in French Guiana (Figure 2a). HANPP (harvest) varies from 0.1 gCm−2yr−1 in Western Sahara to 518 gCm−2yr−1 in the fertile multi-cropped fields of Bangladesh (Figure 2b). NPP (ecological) varies from about 10 gCm−2yr−1 in Egypt and Western Sahara, to over 1100 gCm−2yr−1 in Guyana, French Guyana and Suriname (Figure 2c). The percentage of NPP that is appropriated ranges from less than one percent in these three small Latin American countries, to 60% in Bangladesh, and 76% in Egypt (Figure 2d), where most NPP is induced in irrigated crop fields. Conversely, the percentage of NPP (ecological) ranges from 23% in Egypt and 30% in Bangladesh to over 99% in the Guianas (Figure 2e).
These broad geographical comparisons and large variations are generated by underlying trends that bear upon fundamental human–ecological relationships that are central to issues of sustainability. HANPP per capita varies among countries, but less so than for more industrially-oriented footprints, such as carbon emissions from fossil fuel combustion. Less densely populated countries and countries with greater ecological resource endowments, as measured by NPP/capita, have higher levels of HANPP/capita than more densely populated or ecologically impoverished countries [21]. These relationships reflect the greater opportunity cost of higher levels of HANPP/cap where ecologically productive land is scarce.
HANPP/capita rises with affluence due to higher consumption of meat and wood-based products but also falls with affluence due to greater agro-ecological efficiencies, such as high crop yields and less pronounced soil degradation. Affluence, for example, is related to a higher ratio of HANPP (harvest) to HANPP (land use) [22]. Due to these trade-offs, the relationship between HANPP/capita and affluence is surprisingly weak, and this makes HANPP a useful lens through which to explore issues of human populations and the regional or national ecological capacity to support them. These relationships indicate that each country has its own unique HANPP signature that has much to offer in understanding the dependence of its population upon provisioning ecosystem services, how and where they are produced, and the quantity of remaining “nature” from which supporting, regulatory, and cultural ecosystem services are derived.
4.3. HANPP at County Mesoscale: The U.S. Case
The mesoscale, here represented by U.S. counties, is a critical scale through which to examine HANPP because it captures most ecological interdependencies between HANPP-consuming areas—focused on metropolitan areas—and HANPP-producing areas—the agricultural and forestry belts upon which they depend for food, feed, biofuel and biofiber. International trade in biomass products is increasingly important but, because they usually have a low value per unit weight and are variably perishable, most trade occurs over more moderate distances along transport infrastructures that teleconnect these ecological interdependencies [26].
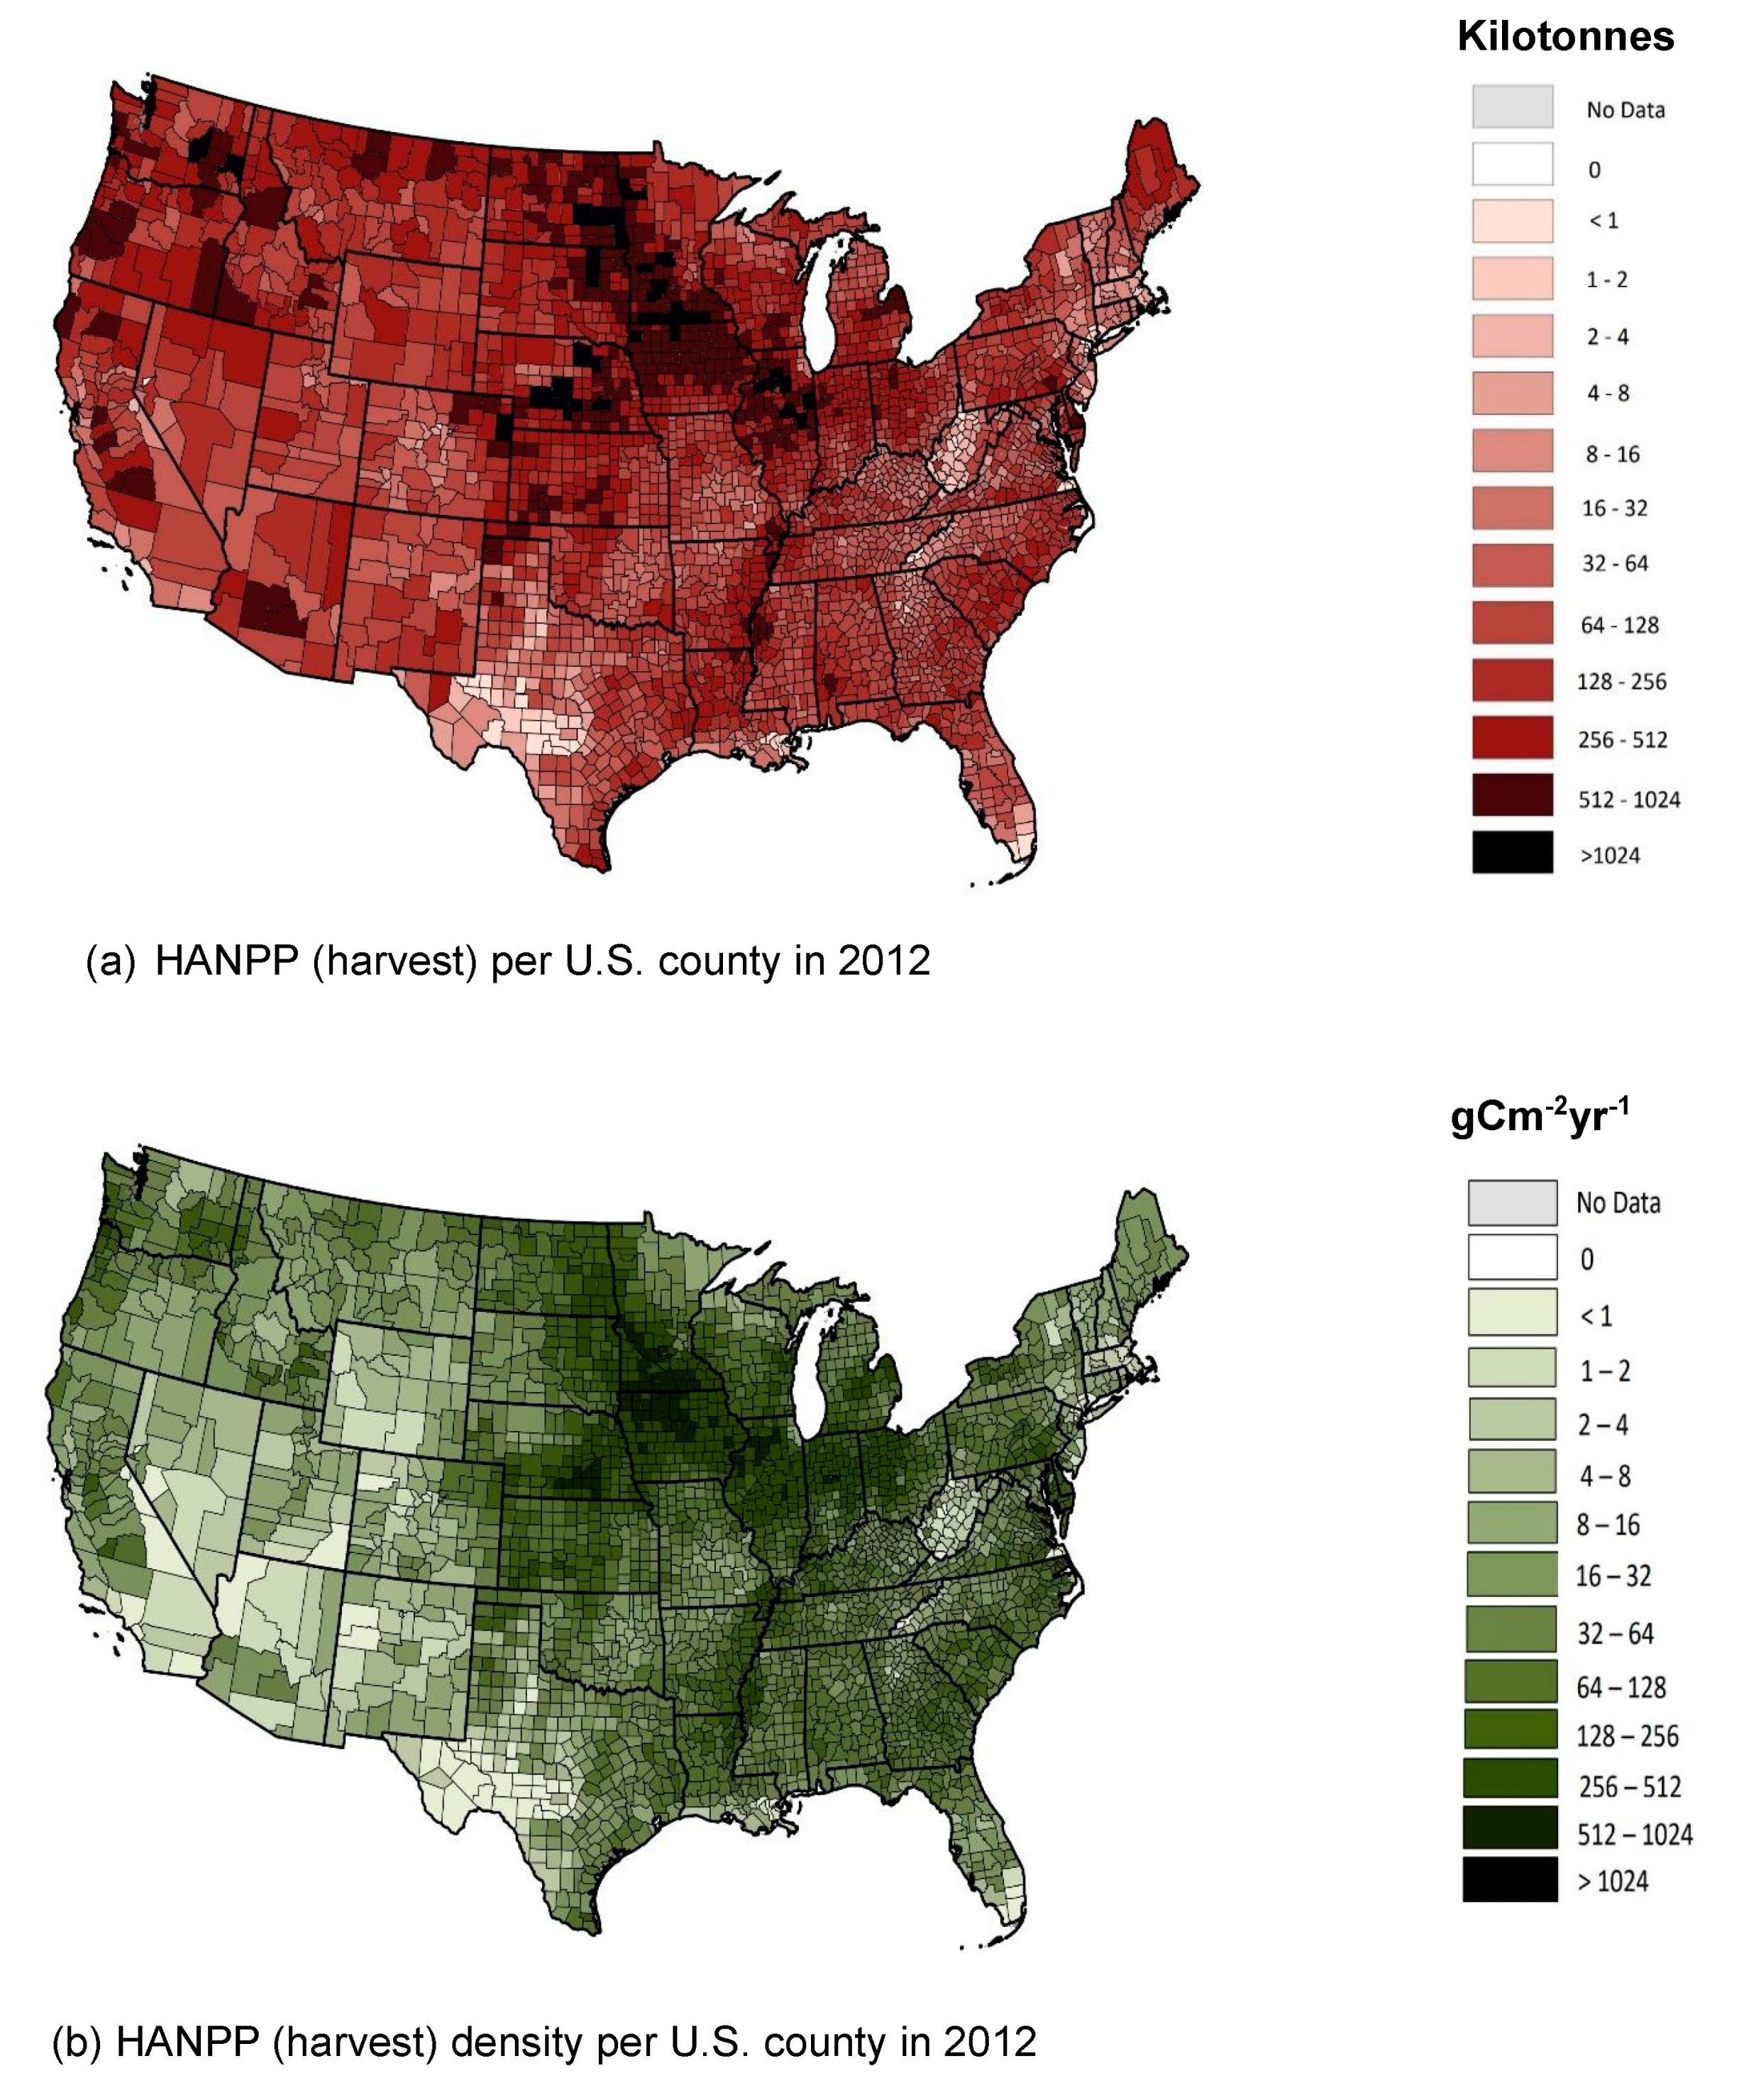
The variation in HANPP (harvest) among US counties in 2012 varies enormously, from 0.0000363 to 1752 kilotonnes, a seven order of magnitude range (Figure 3a). Countywide HANPP density in gCm−2yr−1 varies from 0.0003027 to 783 gCm−2yr−1, a six order of magnitude range (Figure 3b). We have therefore mapped county-level HANPP (harvest), totaling crops, grazing and forestry, on a logarithmic scale. Methods used to derive this figure are described in Paudel et al. [27].
Foremost among centers of HANPP (harvest) are intensively cropped regions including, in order of importance, the Midwestern corn and soybean belt, the spring and winter wheat belts of the Great Plains, the Lower Mississippi Valley, the Central Valley of California, the Palouse and Snake River Plain of the northwest, and pockets of crop production on dispersed fertile soils across the eastern U.S. Second in importance are intensively timbered areas spread across much of the southeast, the Pacific northwest and Maine. Grazing harvests NPP at lower levels throughout much of the U.S. [27]. These are the ecosystems upon which Americans and major U.S. export markets rely for products derived from biomass. Estimating embedded HANPP (consumption) and deriving the specific teleconnections among HANPP-exporting and HANPP-importing cities, counties, states and regions awaits further research.
4.4. HANPP at a Pixel Microscale: Lyon County, IA
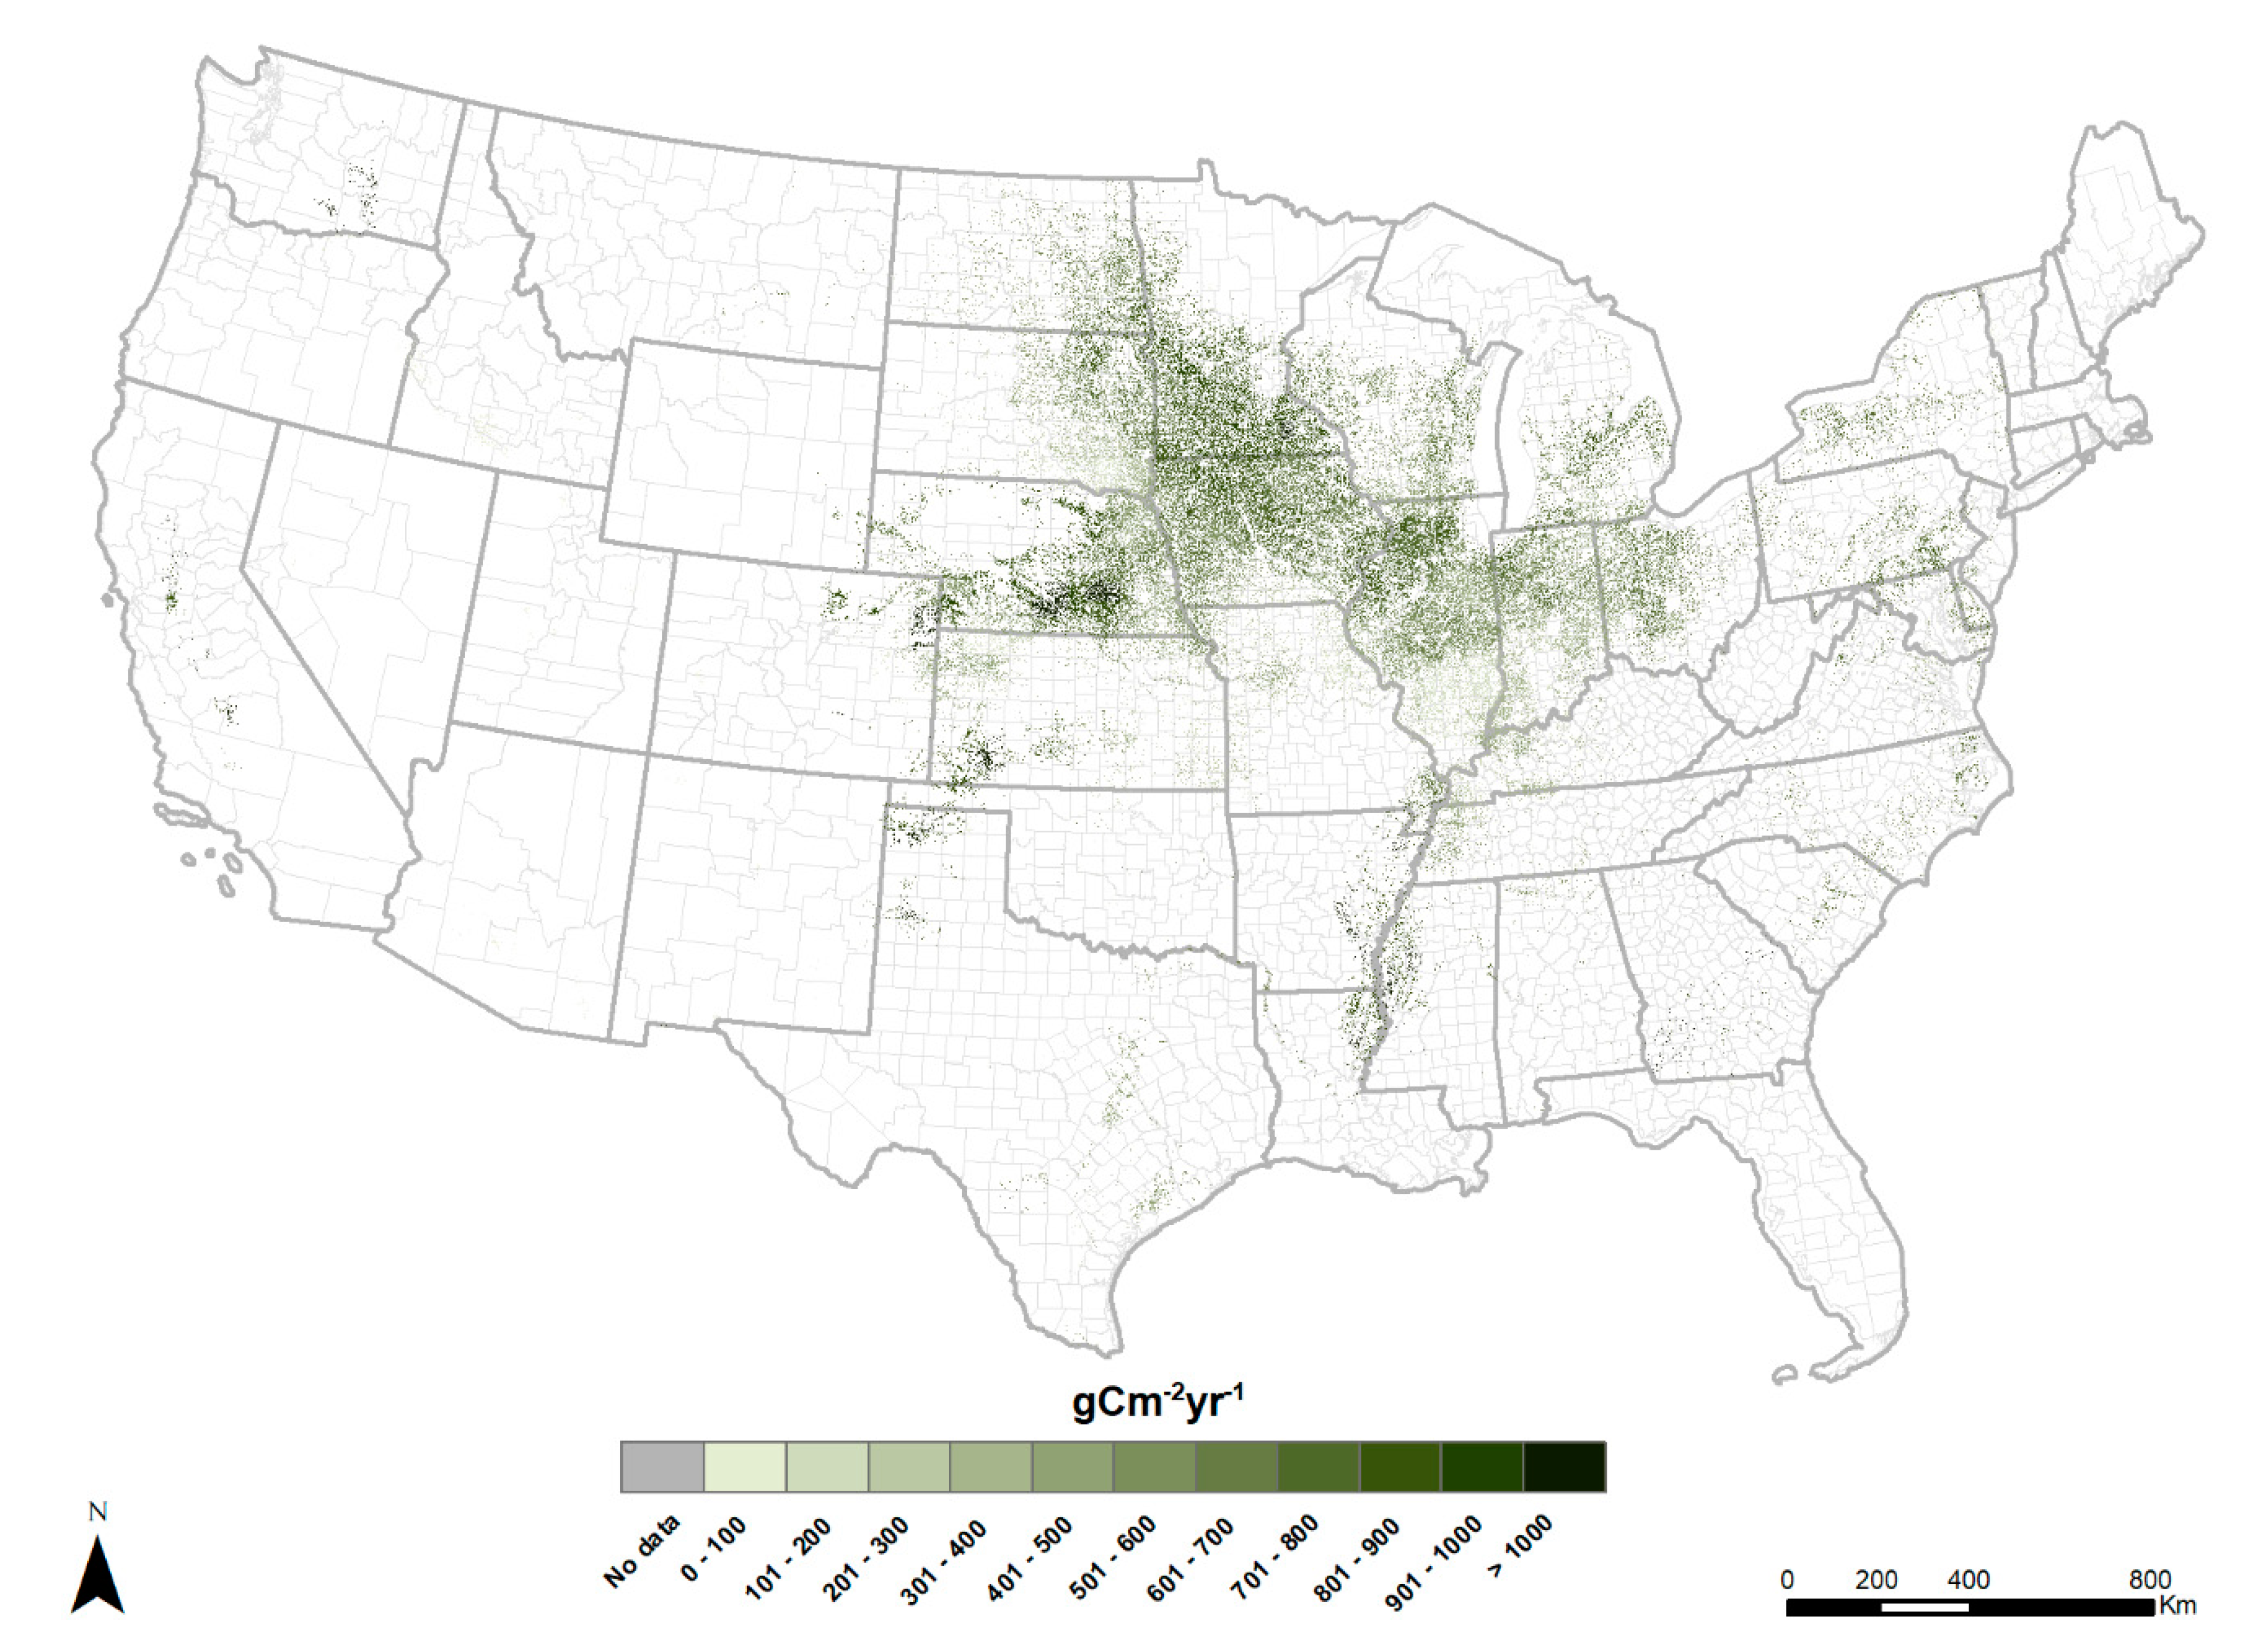
The USDA-NASS Cropland Data Layer (2021) provides a means to apply big data techniques to study HANPP at a pixel scale. By combining these data with annual mean yield data for counties from USDA Quick Stats (2018) [28], a pixel-level measurement of HANPP (harvest) can be derived, such as for corn grain (Figure 4). Applying these data for all crops grown in a specific county and assigning HANPP estimates through livestock grazing to pixels in the grassland/pasture category allows for a pixel-level analysis of HANPP (harvest) for a U.S. county, such as the Corn belt county of Lyons county, Iowa.
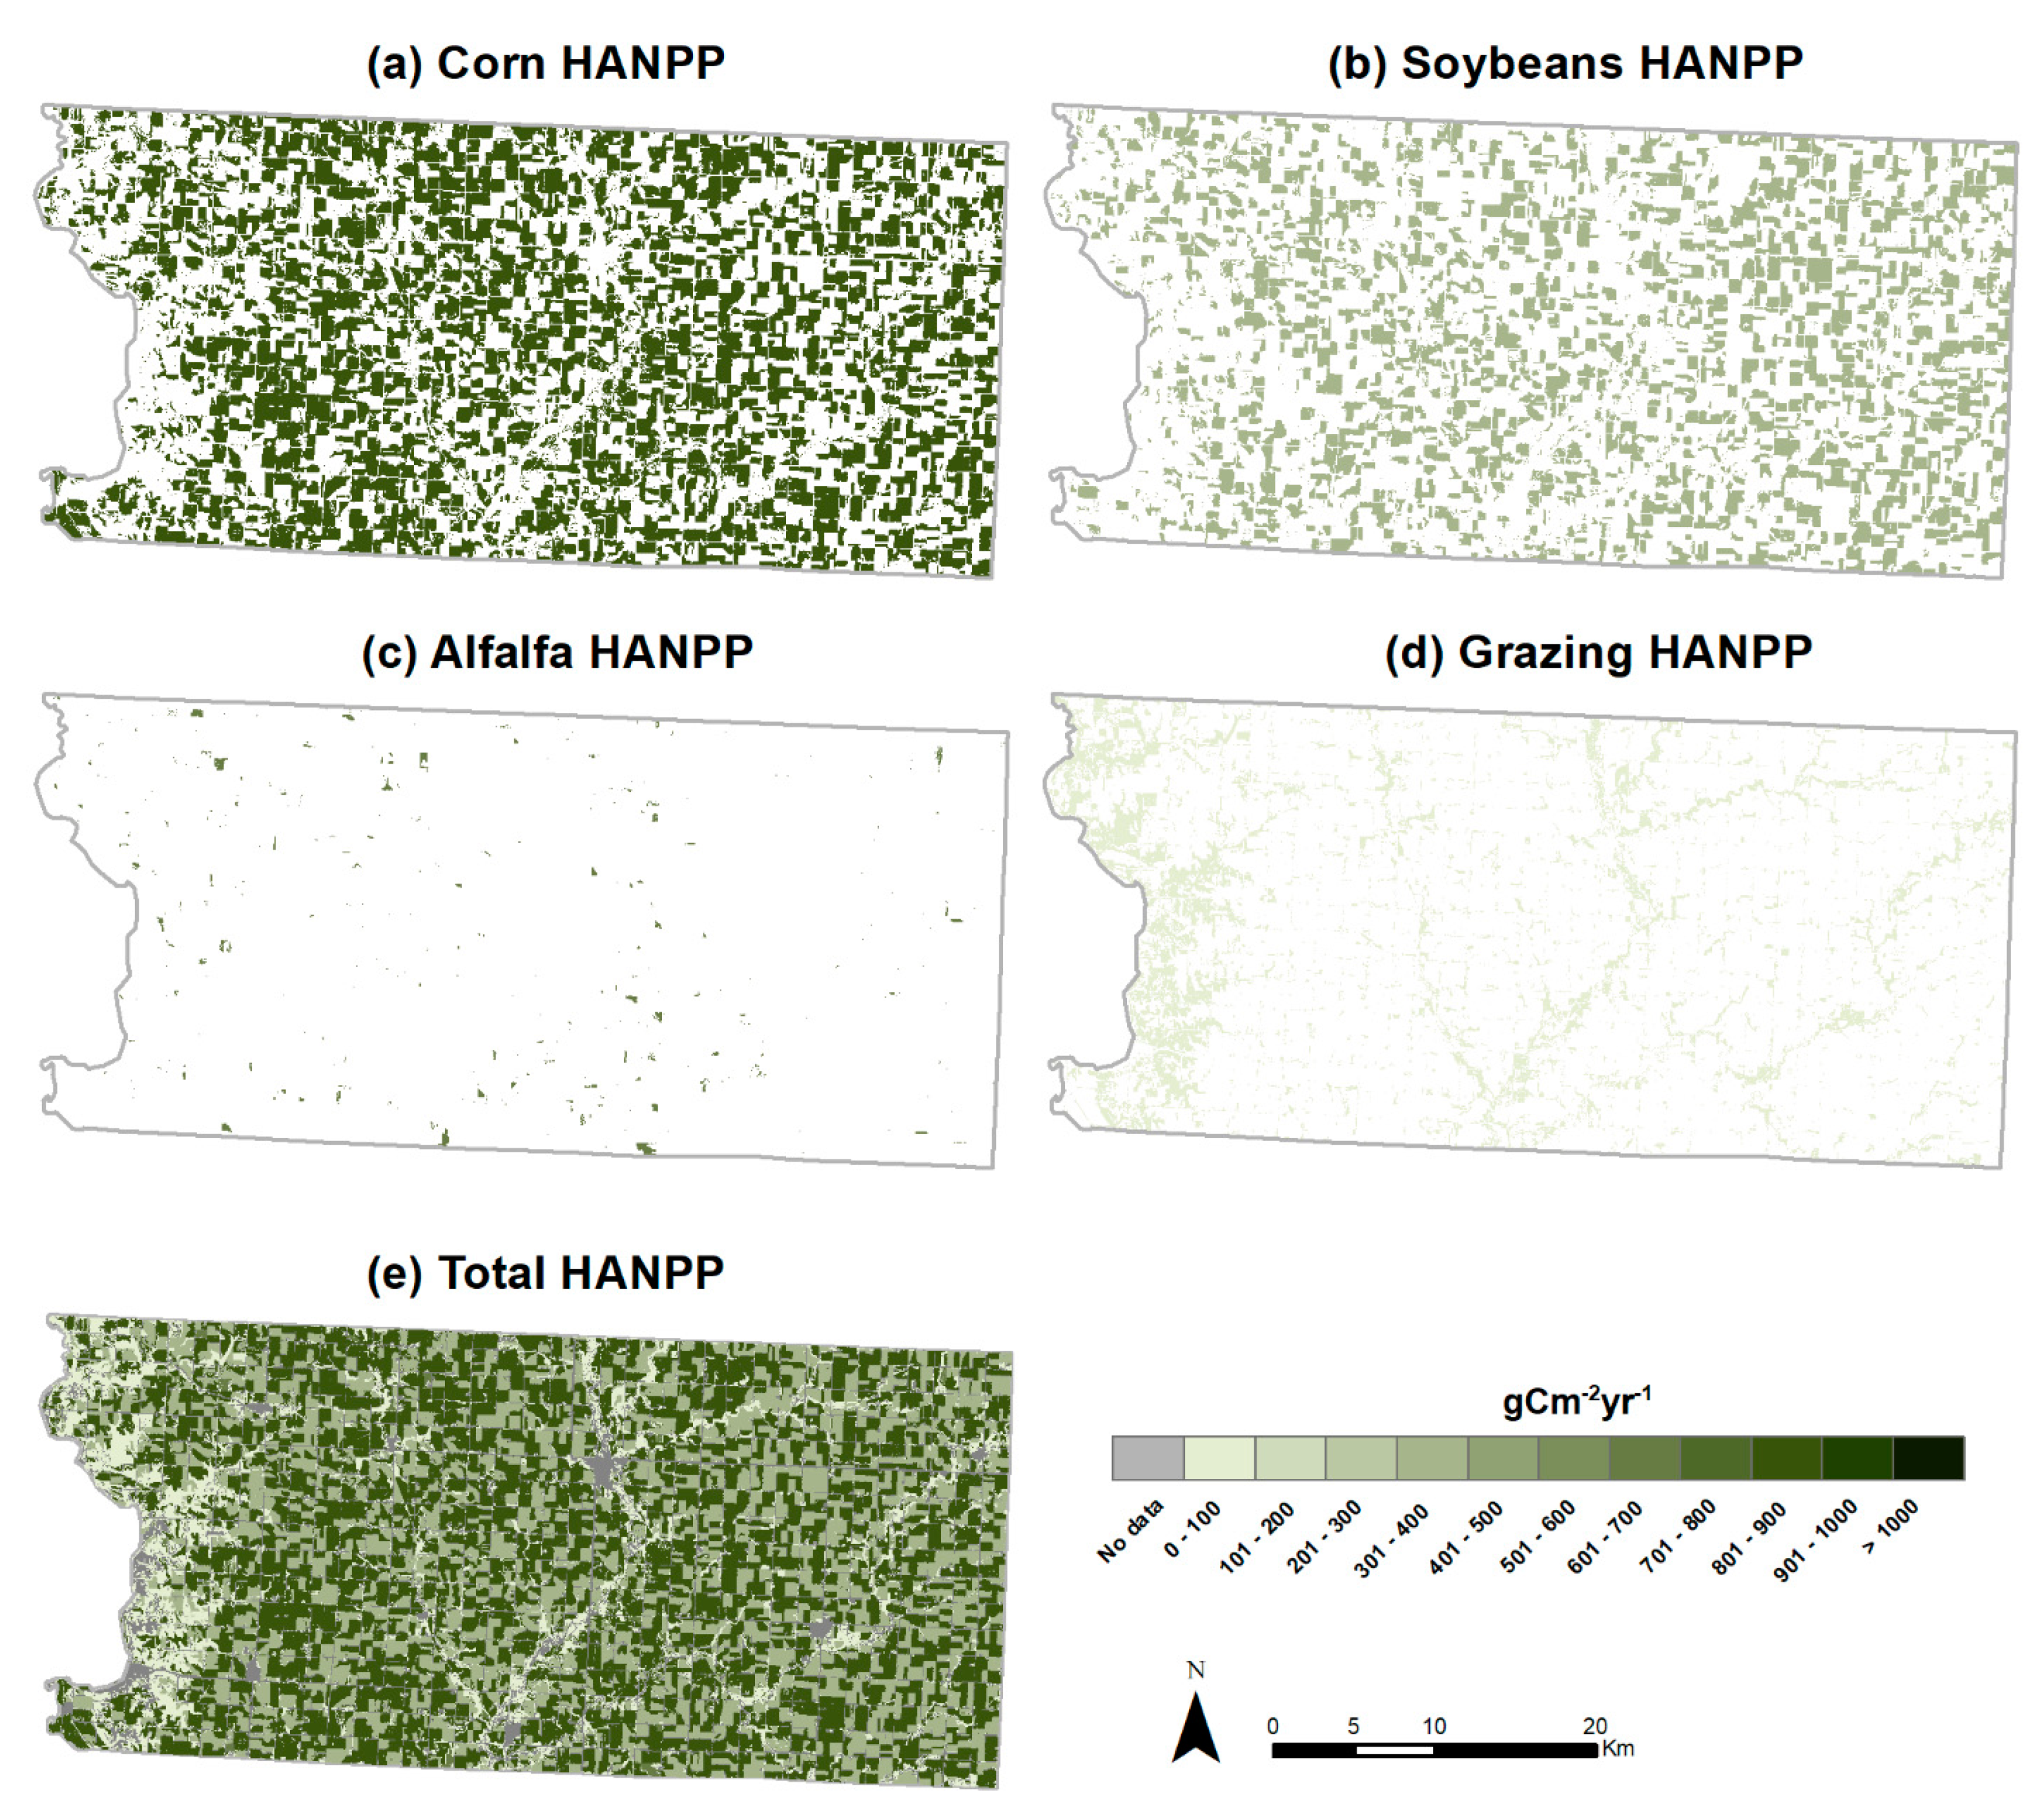
HANPP (harvest) density in gCm−2yr−1 of corn grain in Lyon County is 855 gCm−2yr−1, representing a mean county yield in 2012 of 10 tonnes per hectare (162 bushels per acre). With a lower yield of 3 tonnes per hectare (52 bushels/acre), HANPP (harvest) from soybeans is 341 gCm−2yr−1 (Figure 5b). Alfalfa is grown on steeper slopes and less fertile soils. A perennial crop that is harvested multiple times per season, it has a high HANPP of 644 gCm−2yr−1 (Figure 5c). The highest slopes and poorest soils are assigned to livestock grazing, where HANPP (harvest) is a lower 41 gCm−2yr−1 (Figure 5d).
Figure 5e captures the overall map of HANPP (harvest) for Lyon County, IA in 2012 at the 30 m pixel scale. This map shows the variable intensity at which humans appropriate net primary production at the finest scale that is currently possible using widely available geospatial data. At this scale, definitional questions emerge pertaining to the minimum scale at which HANPP is definable. Is it a crop field, a pasture, a timbering tract—all of which range upwards from 900 m2—or is it an individual plant at a scale of meters? We have thus titled this paper “HANPP: From a planet to a pixel”, capturing the full range of scales at which HANPP is currently meaningfully measurable.
5. Discussion: HANPP Tells Different Stories at Different Scales
One of the strengths of HANPP as a sustainability indicator and ecological footprint measure is that it is applicable across scales—both temporal and spatial, though here we focus on the latter. At the different scales explored above, HANPP illuminates different narratives about human–ecological relationships and their sustainability.
At a planetary scale, HANPP is at the center of the debate about planetary limits. It is itself an improvement on the “changes in land use” limit of 15% cropland proposed by Rockstrom et al. (2009) [9]. As argued by Running (2012) [29], NPP, the photosynthetic capacity of Earth, is the appropriate measuring stick against which to apply a planetary limit because it is this ecological space, rather than the cruder land areal measuring stick, that represents the fundamental biological resource that humans share with other species. Moreover, the agricultural and forestry processes humans use to harvest NPP also bear directly and dominantly upon other planetary limits—freshwater use, nitrogen cycle, phosphorus cycle—directly and importantly upon others—biodiversity, climate change, chemical pollution—and indirectly upon ocean acidification. It is thus critical to monitor the percentage of global NPP that humans appropriate. We do not propose here a precise planetary HANPP limit; however, this illustrates the conceptual flaws in setting global limits when ecological realities are a sliding scale and are often more relevant locally than globally.
At the national scale, variations in NPP, HANPP, and NPP (ecological) provide a different set of insights. The “New World” continents of Australia and the Americas appropriate a smaller percentage of NPPand enjoy higher levels of NPP (ecological) than the “Old World” continents of Asia, Africa and Europe, where basic needs for large human populations derived from ecosystems press harder against national and regional ecological endowments. Most trade in biomass products is from the former to the latter, for example, as virtual water studies indicate [4]. Yet much of densely populated Asia appropriates a very high percentage of NPP with little NPP (ecological) remaining, despite its low per capita HANPP consumption rates. These indicators illuminate time-honored issues of land use, land degradation, natural capital, and what may constitute overpopulation.
At the county scale, as illustrated in the U.S. example, the critical importance of the “mesoscale” emerges, where ever-growing urban populations, and even urban regions (e.g., the Atlantic seaboard, coastal California, growing sunbelt metropolitan areas from Florida to Arizona) are reliant for their basic food and other biomass needs upon ever-specializing rural areas. These relationships, however, are not dominantly global, as most biomass products are uneconomical to transport huge distances, nor does each city have its own delineable “hinterland.” Rather, a network of interdependencies emerges where HANPP-exporting regions specializing in agriculture (e.g., the Midwestern crop belts, the lower Mississippi Valley, the Central Valley of California) or commercial forestry (Maine, the Pacific Northwest, parts of the southeast) supply broad, mostly domestic urban areas and regions with food, feed, biofiber and biofuel [30], while also exporting to meet the shortfalls of Eurasia. We leave it to future studies to explore the many nuanced environmental justice issues embedded in these networks of interdependencies.
At the pixel scale, here chosen at 30 m to match the spatial resolution of the USDA/NASS Cropland Data Layer, additional narratives are illustrated. The case study of Lyon County, IA in the western Corn Belt illustrates the fine-grained pattern of HANPP (harvest), at the scale of individual crop fields and pastures. This lays the foundation for further work relating spatial patterns of NPP (ecological) to biodiversity, and supporting, regulatory and cultural ecosystem services, each of which are emergent properties of landscape ecological patterns at various scales.
6. Summary and Future Research
Human Appropriation of Net Primary Production (HANPP) brings to the task of measuring ecological footprint the scientific rigor, empirical measurability, external consistency and applicability across geographical scales that make carbon and water footprints critical sustainability indicators. It is also closely tied to those and other nascent footprints, such as for nitrogen [31,32] and phosphorus. While, like other footprints, definitional and methodological issues are evident, HANPP can reveal critical human–ecological relationships embedded in the production of provisioning ecosystem services from the macro-, through the meso- to the micro-scale.
Further research tying HANPP-production to HANPP-consumption through supply chains for food, feed, biofiber and biofuel promises to refine our understanding of urban-rural teleconnections [33] and ecological interdependencies among people and places, relationships that are central both to environmental sustainability and environmental justice. This makes it an appropriate tool for environmental impact assessment under the U.S. National Environmental Policy Act and similar assessments in other countries.
Author Contributions
S.P. conducted the analysis of HANPP in each U.S. county, produced Figure 2 and Figure 3 and was the secondary writer of the manuscript. G.A.O.-M. conducted the analysis of HANPP at the 30 m pixel scale and produced Figure 4 and Figure 5. C.L.L. conceptualized the paper, produced Figure 1 and was the primary writer. All authors have read and agreed to the published version of the manuscript.
Funding
The research reported here was funded by the U.S. National Science Foundation Innovations at the Nexus of Food, Energy, and Water Systems (INFEWS) program Grant No. 1639529.
Institutional Review Board Statement
Not applicable.
Informed Consent Statement
Not applicable.
Data Availability Statement
The datasets generated during and/or analyzed during the current study are available from the corresponding author on reasonable request.
Acknowledgments
The authors would like to thank the Institute of Social Ecology for their leadership in the study of HANPP. We would also like to thank Lauren Tango for processing these data at the national scale.
Conflicts of Interest
The authors declare no conflict of interest.
References
- Gurney, K.R.; Mendota, D.L.; Zhou, Y.; Fischer, M.L.; Miller, C.C.; Geethakumar, S.; de la Rue du Can, S. High resolution fossil fuel combustion CO2 emission fluxes for the United States. Environ. Sci. Technol. 2009, 43, 5535–5541. [Google Scholar] [CrossRef] [Green Version]
- Hoekstra, A.Y.; Chapagain, A.K.; Aldaya, M.M.; Mekonnen, M.M. Water Footprint Assessment Manual: Setting the Global Standard; Earthscan: London, UK, 2011. [Google Scholar]
- Hoekstra, A.Y. The water footprint of humanity. Proc. Natl. Acad. Sci. USA 2012, 109, 3232–3237. [Google Scholar] [CrossRef] [PubMed] [Green Version]
- Dalin, C.; Konar, M.; Hanasaki, N.; Rinaldo, A.; Rodriguez-Iturbe, I. Evolution of the global virtual water trade network. Proc. Natl. Acad. Sci. USA 2012, 109, 5989–5994. [Google Scholar] [CrossRef] [Green Version]
- Wackernagel, M.; Rees, W. Our Ecological Footprint: Reducing Human Impact on Earth; New Society Publishers: Gabriola Island, BC, Canada, 1996. [Google Scholar]
- Schlesinger, W.H.; Bernhardt, E.S. Biogeochemistry: An Analysis of Global Change, 3rd ed.; Elsevier: Amsterdam, The Netherlands, 2013. [Google Scholar]
- Smil, V. Harvesting the Biosphere; MIT Press: Cambridge, MA, USA, 2012. [Google Scholar]
- Kastner, T.; Kastner, M.; Nonhebel, S. Tracing distant environmental impacts of agricultural products from a consumer perspective. Ecol. Econ. 2011, 70, 1032–1040. [Google Scholar] [CrossRef]
- Rockstrom, J.; Steffen, W.; Noone, K.; Persson, Å.; Chapin, F.S.; Lambin, E.F.; Lenton, T.M.; Scheffer, M.; Folke, C.; Schellnhuber, H.J.; et al. A safe operating space for humanity. Nature 2009, 461, 472–475. [Google Scholar] [CrossRef]
- Schyns, J.F.; Hoekstra, A.Y.; Booij, M.J.; Hogeboom, R.J.; Mekonnen, M.M. Limits of the world’s green water resources for food, feed, timber, and bioenergy. Proc. Natl. Acad. Sci. USA 2019, 116, 4893–4898. [Google Scholar] [CrossRef] [Green Version]
- Galloway, J.N.; Townsend, A.R.; Erisman, J.W.; Bekunda, M.; Cai, Z.; Freney, J.R.; Martinelli, L.A.; Seitzinger, S.P.; Sutton, M.A. Transformation of the nitrogen cycle: Recent trends, questions and potential solutions. Science 2008, 320, 889–892. [Google Scholar] [CrossRef] [Green Version]
- Cordell, D.; Drangert, J.-O.; White, S. The story of phosphorus: Global food security and food for thought. Glob. Environ. Chang. 2009, 19, 292–305. [Google Scholar] [CrossRef]
- Brondizio, E.S.; Settele, J.; Díaz, S.; Ngo, H.T. (Eds.) Global Assessment Report on Biodiversity and Ecosystem Services of the Intergovernmental Science-Policy Platform on Biodiversity and Ecosystem Services; International Platform on Biodiversity and Ecosystem Services Secretariat: Bonn, Germany, 2019. [Google Scholar]
- IPCC. Summary for Policymakers. In Climate Change and Land: An IPCC Special Report on Climate Change, Desertification, Land Degradation, Sustainable Land Management, Food Security, and Greenhouse Gas Fluxes in Terrestrial Ecosystems; Shukla, P.R., Skea, J., Buendia, E.C., Masson-Delmotte, V., Pörtner, H.-O., Roberts, D.C., Zhai, P., Slade, R., Connors, S., van Diemen, R., et al., Eds.; Cambridge University Press: Cambridge, UK; New York, NY, USA, 2019. [Google Scholar]
- Haberl, H.; Erb, K.-H.; Krausmann, F.; Gaube, V.; Bondeau, A.; Plutzar, C.; Gingrich, S.; Lucht, W.; Fischer-Kowalski, M. Quantifying and mapping the human appropriation of net primary production in earth’s terrestrial ecosystems. Proc. Natl. Acad. Sci. USA 2012, 104, 12942–12947. [Google Scholar] [CrossRef] [Green Version]
- Imhoff, M.L.; Bounoua, L.; Ricketts, T.; Loucks, C.; Harriss, R.; Lawrence, W.T. Global patterns of human consumption of net primary productivity. Nature 2004, 429, 870–873. [Google Scholar] [CrossRef] [Green Version]
- Sitch, S.; Smith, B.; Prentice, I.C.; Arneth, A.; Bondeau, A.; Cramer, W.; Kaplans, J.O.; Levis, S.; Lucht, W.; Sykes, M.T.; et al. Evaluation of ecosystem dynamics, plant geography and terrestrial carbon cycling in the LPJ dynamic global vegetation model. Glob. Chang. Biol. 2003, 9, 161–185. [Google Scholar] [CrossRef]
- Potter, C.S.; Randerson, J.T.; Field, C.B.; Matson, P.A.; Vitousek, P.M.; Mooney, H.A.; Klooster, S.A. Terrestrial ecosystem production: A process model based on global satellite and surface data. Glob. Biogeochem. Cycles 1993, 7, 811–841. [Google Scholar] [CrossRef]
- Schaefer, K.; Schwalm, C.R.; Williams, C.; Arain, M.A.; Barr, A.; Chen, J.M.; Davis, K.J.; Dimitrov, D.; Hilton, T.W.; Hollinger, D.Y.; et al. A model-data comparison of gross primary productivity: Results from the North American Carbon Program site synthesis. J. Geophys. Res. 2012, 117, G03010. [Google Scholar] [CrossRef] [Green Version]
- Institute of Social Ecology. 2021. Data Download. BOKU. Available online: https://boku.ac.at/en/wiso/sec/data-download (accessed on 1 April 2021).
- Krausmann, F.; Erb, K.-H.; Gingrich, S.; Lauk, C.; Haberl, H. Global patterns of socioeconomic biomass flows in the year 2000, A comprehensive assessment of supply, consumption and constraints. Ecol. Econ. 2008, 65, 471–487. [Google Scholar] [CrossRef]
- Haberl, H.; Erb, K.-H.; Krausmann, F. Human appropriation of net primary production: Patterns, trends, and planetary boundaries. Ann. Rev. Envir. Resour. 2014, 39, 363–391. [Google Scholar] [CrossRef]
- United States Department of Agriculture National Agricultural Statistics Service (USDA NASS). Cropland Data Layer. 2021. Available online: https://nassgeodata.gmu.edu/CropScape/ (accessed on 22 March 2021).
- Vitousek, P.M.; Ehrlich, P.R.; Ehrlich, A.H.; Matson, P.A. Human Appropriation of the Products of Photosynthesis. BioScience 1986, 36, 368–373. [Google Scholar] [CrossRef]
- Krausmann, F.; Erb, K.-H.; Gingrich, S.; Haberl, H.; Bondeau, A.; Gaube, V.; Lauk, C.; Plutzar, C.; Searchinger, T.D. Global human appropriation of net primary production doubled in the 20th century. Proc. Natl. Acad. Sci. USA 2013, 110, 10324–10329. [Google Scholar] [CrossRef] [Green Version]
- Erb, K.-H.; Kastner, T.; Plutzar, C.; Bais, A.L.S.; Carvalhais, N.; Fetzel, T.; Gingrich, S.; Haberl, H.; Lauk, C.; Niedertscheider, M.; et al. Unexpectedly large impact of forest management and grazing on global vegetation biomass. Nat. Lett. 2018, 553, 73–76. [Google Scholar] [CrossRef] [PubMed]
- Seto, K.C.; Reenberg, A.; Boone, C.G.; Fragkias, M.; Haass, D.; Langanke, T.; Marcotullio, P.; Monroe, D.K.; Olah, B.; Simon, D. Urban land teleconnections and sustainability. Proc. Natl. Acad. Sci. USA 2012, 109, 7687–7692. [Google Scholar] [CrossRef] [Green Version]
- Paudel, S. Human Appropriation of Net Primary Production through Crops, Grazing and Forestry from U.S. Counties, 1997–2012. Ph.D. Dissertation, Utah State University, Logan, UT, USA. in preparation.
- United States Department of Agriculture, National Agricultural Statistics Service. Quick Stats. Available online: https://quickstats.nass.usda.gov/ (accessed on 6 April 2018).
- Running, S.W. A measurable planetary boundary for the biosphere. Science 2012, 337, 1458–1459. [Google Scholar] [CrossRef] [PubMed] [Green Version]
- Paterson, W.; Rushforth, R.; Ruddell, B.L.; Konar, M.; Ahams, I.C.; Gironás, J.; Mijic, A.; Mejia, A. Water footprint of cities: A review and suggestions for future research. Sustainability 2015, 7, 8461–8490. [Google Scholar] [CrossRef] [Green Version]
- Leach, A.M.; Galloway, J.N.; Bleeker, A.; Erisman, J.W.; Kohn, R.; Kitzes, J. A nitrogen footprint model to help consumers understand their role in nitrogen losses to the environment. Environ. Dev. 2012, 1, 40–66. [Google Scholar] [CrossRef] [Green Version]
- Steffen, W.; Grinevald, J.; Crutzen, P.; McNeill, J. The Anthropocene: Conceptual and historical perspectives. Philos. Trans. R. Soc. A 2011, 369, 842–867. [Google Scholar] [CrossRef] [PubMed]
Figure 1.
Changing estimates and definitions of global HANPP.

Figure 2.
National-scale comparisons of (a) NPP, (b) HANPP (harvest), (c) NPP (ecological), (d) HANPP (harvest/NPP), and (e) NPP (ecological)/NPP.
Figure 2.
National-scale comparisons of (a) NPP, (b) HANPP (harvest), (c) NPP (ecological), (d) HANPP (harvest/NPP), and (e) NPP (ecological)/NPP.

Figure 3.
(a) HANPP (harvest) per U.S. county in 2012 (kilotonnes). (b) HANPP (harvest) density per U.S. county in 2012 (gCm2yr−1).
Figure 3.
(a) HANPP (harvest) per U.S. county in 2012 (kilotonnes). (b) HANPP (harvest) density per U.S. county in 2012 (gCm2yr−1).

Figure 4.
HANPP (harvest) density for corn grain (gCm2yr−1) at 30m pixel scale for the contiguous US in 2012.
Figure 4.
HANPP (harvest) density for corn grain (gCm2yr−1) at 30m pixel scale for the contiguous US in 2012.

Figure 5.
HANPP (harvest) density (gCm2yr−1) for Lyon County, Iowa in 2012 for (a) corn grain, (b) soybeans, (c) alfalfa, (d) livestock grazing and (e) total HANPP (harvest).
Figure 5.
HANPP (harvest) density (gCm2yr−1) for Lyon County, Iowa in 2012 for (a) corn grain, (b) soybeans, (c) alfalfa, (d) livestock grazing and (e) total HANPP (harvest).

Publisher’s Note: MDPI stays neutral with regard to jurisdictional claims in published maps and institutional affiliations. |
© 2021 by the authors. Licensee MDPI, Basel, Switzerland. This article is an open access article distributed under the terms and conditions of the Creative Commons Attribution (CC BY) license (https://creativecommons.org/licenses/by/4.0/).
Share and Cite
MDPI and ACS Style
Paudel, S.; Ovando-Montejo, G.A.; Lant, C.L. Human Appropriation of Net Primary Production: From a Planet to a Pixel. Sustainability 2021, 13, 8606. https://doi.org/10.3390/su13158606
AMA Style
Paudel S, Ovando-Montejo GA, Lant CL. Human Appropriation of Net Primary Production: From a Planet to a Pixel. Sustainability. 2021; 13(15):8606. https://doi.org/10.3390/su13158606
Chicago/Turabian StylePaudel, Suman, Gustavo A. Ovando-Montejo, and Christopher L. Lant. 2021. "Human Appropriation of Net Primary Production: From a Planet to a Pixel" Sustainability 13, no. 15: 8606. https://doi.org/10.3390/su13158606
Note that from the first issue of 2016, this journal uses article numbers instead of page numbers. See further details here.