
A Planning Tool for Reliability Assessment of Overhead Distribution Lines in Hybrid AC/DC Grids


Department of Energy Technologies and Renewable Sources, ENEA, 00196 Rome, Italy
*
Author to whom correspondence should be addressed.
Sustainability 2021, 13(11), 6099; https://doi.org/10.3390/su13116099
Submission received: 27 April 2021
/
Revised: 18 May 2021
/
Accepted: 24 May 2021
/
Published: 28 May 2021
(This article belongs to the Special Issue Power Distribution System and Sustainability)
Abstract
:Integration of DC grids into AC networks will realize hybrid AC/DC grids, a new energetic paradigm which will become widespread in the future due to the increasing availability of DC-based generators, loads and storage systems. Furthermore, the huge connection of intermittent renewable sources to distribution grids could cause security and congestion issues affecting line behaviour and reliability performance. This paper aims to propose a planning tool for congestion forecasting and reliability assessment of overhead distribution lines. The tool inputs consist of a single line diagram of a real or synthetic grid and a set of 24-h forecasting time series concerning climatic conditions and grid resource operative profiles. The developed approach aims to avoid congestions criticalities, taking advantage of optimal active power dispatching among “congestion-nearby resources”. A case study is analysed to validate the implemented control strategy considering a modified IEEE 14-Bus System with introduction of renewables. The tool also implements reliability prediction formulas to calculate an overhead line reliability function in congested and congestions-avoided conditions. A quantitative evaluation underlines the reliability performance achievable after the congestion strategy action.
1. Introduction
Energy transition is creating a massive renewable introduction in the main AC grid with security and stability possible consequences for the grid itself, and for users and prosumers [1,2]. Electrical systems originally designed to function according to a unidirectional functioning model (unidirectional power flows from large generators to end users), have started to operate according to a bidirectional model, accommodating electricity production from multiple, distributed and intermittent generation sources.
In this context, a modernization process of the electrical networks is necessary to enable advanced monitoring and smart management logics for grid operation to improve efficiency and preserve security and adequacy.
Nowadays, availability of DC-based storage systems, and also generation (photovoltaic and fuel cells) systems and loads, are boosting a novel energy paradigm consisting of DC grids connected to AC grids, i.e., hybrid AC/DC grids.
In particular, the integration of DC microgrids into the AC distribution networks makes it possible to promote DC energy communities (renewables + storage + DC loads) reducing energy losses, increasing grid stability and contributing to congestion solutions.
Congestion problems are more evident where renewables installations are concentrated, and in the presence of low meshed and limited capacity grids. Usually, such criticalities are solved with Renewable Energy Sources (RES) curtailment or shutdown. It is evident that energy transition cannot be implemented with these constraining actions. Renewable sources have to be integrated and managed, congestion events must be forecast, and grid reliability must be calculated and monitored with the aim of implementing solutions that can preserve power systems safety and adequacy.
In the literature, managing congestion issues has been addressed by preventive or corrective methods. Preventive congestion management methods consider the transmission rights and the available transfer capability. The latter approach focuses on customer information to optimally satisfy consumption profiles in order to mitigate the congestion that causes drawbacks for customers [3]. In particular, the demand-response method is a preventive methodology based on available transfer capability, in which customers participate in some programs devoted to selectively modify consumption curves on the basis of location and time determined by independent operators [1].
Congestion management methods can be also classified in technical and nontechnical (or market) methods. Market methods are characterized by a noncost-free approach, in which network and generation dispatching security factors, congestion pricing and market-based criteria are considered. Such an approach focuses on the actions aimed to correct congestion, set congestion price or system rescheduling by the reduction of trading contracts, transmission plans, the modulation of generation output, load shedding and the implementation of interruptible load rights. Marked-based congestion management methods are considered indirect control methods, since they involve the distributed capacity market, shadow price and the flexible market. Dynamic congestion occurs if the power system suffers from large disturbances that cannot be countered by the power of energy traded in the power market [2]; the dynamic congestion management market involves several participants with different market attributes. When a dynamic congestion occurs, resources involved in the dynamic congestion management market are considered by acting operations aimed at minimizing the total dynamic congestion cost of the system [4].
Technical methods neglect economic impact, and only pay attention to the outages along the network [1]. This approach proposes algorithms to improve power capability, decrease system losses and enhance system stability by controlling power flow. Such a congestion management strategy is considered a direct control method and involves distribution network reconfiguration, removal of loads, reduction of distributed energy output, and the control of active and reactive power. Typical examples of direct control methods are load shedding, optimal location of Distributed Generation (DG), generator rescheduling, Optimal Power Flow (OPF), Flexible Alternating Current Transformer System (FACTS) devices and Demand Response (DR) programs [5]. Network reconfiguration was also considered as an effective solution: the literature reported that the optimal network layout could be achieved through a genetic algorithm [6].
In detail, the FACTS devices [7] assure a quick response, allowing an effective modulation of current and system parameters, thus assuring an improvement of system transmission capacity and a reduction of network loss, and, as a consequence, the system stability is achieved.
The power flow management method was analysed by Dolan et al. [8] who proposed two different approaches. The first was modelled as a Constraint Satisfaction Problem (CSP), while the second was based on an Optimal Power Flow (OPF) approach. The two approaches to power flows managing can significantly increase the output of DG units in a thermally constrained network, alleviating line congestion by reducing distributed power output.
Among the direct methods, the management of distributed energy sources arouses great interest in the smart grid-based network scenario. To counter energy congestion due to RES utilization, the increasing of energy reserve in a power system was highlighted as a viable solution [9]. A strategy focused on the control of storage, electric vehicles (EVs), as well as flexible loads connected at the distributed level, increases the availability of active resources that, in turn, enable power system reliability. Congestion management for AC transmission and distribution power systems, and hybrid network reliability have been investigated in several papers in the literature [3,10,11,12,13].
Furthermore, reliability aspects of power systems have been considered in the literature with respect to different methodologies, models and by different performance indices [14,15,16].
In fact, reliability represents a topic of great interest, especially in the latest energetic contexts characterized by huge renewable generation sources injecting energy into the grid. Renewable production reaches high levels at specific hours of the day, causing critical line overloading. Such congestion events cause temperature rise, which can strongly affect the power line’s reliability. On the basis of these premises, it is evident that reliability evaluation is an essential study for design, operation and maintenance of power lines in which behaviour can be affected by various stresses [17] such as thermal, electrical, mechanical and environmental effects. It is, therefore, necessary to develop appropriate models able to represent the behaviour of the components or systems of interest in the presence of the aforementioned stresses. Such models can be obtained by analytical and simulation-based statistical methods [18,19].
Analytical methods are based on the representation of a system by means of a mathematical model. In other words, the evaluation of reliability indices is carried out by solving mathematical equations. It is evident that these mathematical equations can be characterized by medium and high complexity degrees with difficult solutions. In these cases, simplified models are used whose solutions can be calculated by approximate analytical techniques. Possible solutions can be obtained also by statistical methods; time-sequential simulations [18,19] are especially used in power systems contexts. These techniques allow the estimation of reliability indices directly by simulating the system under investigation and its components in chronological time.
Fault Tree Analysis [20,21,22], Failure Mode and Effect Analysis [23], Monte Carlo [19] and Markov chains [24] represent applied methodologies to power systems reliability assessment.
However, a lack of data and research exists on the relationship between congestion management and reliability in hybrid networks. In this paper, we focus attention on this particular aspect to understand the impact of congestion events on overhead reliability performances.
The novel contribution of the proposed methodology consists of the development of a planning tool able to forecast hybrid grid critical operating conditions in order to avoid them, as well as to improve power system line reliability. The proposed control analyses, at 24 h ahead planning stage, the line’s reliability and possible grid congestion events. Then, it evaluates the optimal active power dispatching solutions to prevent critical events and improve reliability by involving, as a first step, the resources nearest to the congested area, and then the farthest ones. The proposed tool represents a promising approach to evaluate possible ancillary services (i.e., congestion control logic) on a 24-h ahead horizon-time, also preserving the reliability of the hybrid AC/DC power system components. Thus, it could represent a useful instrument for Virtual Power Plants (VPPs) agents and aggregators during preliminary planning phases and during operating conditions. This paper is organized as follows. Section 2 explains the overhead line electro-thermal model and the reliability prediction model for overhead line characterization. Section 3 presents the proposed tool and a scheme of the congestion algorithm. Section 4 is dedicated to the modified IEEE 14-Bus system as a possible synthetic grid to the developed strategy validation, and achieved results are reported.
2. Overhead Line Electro-Thermal and Reliability Assessment Models
2.1. Grid Lines: Model and Thermal Behavior Study
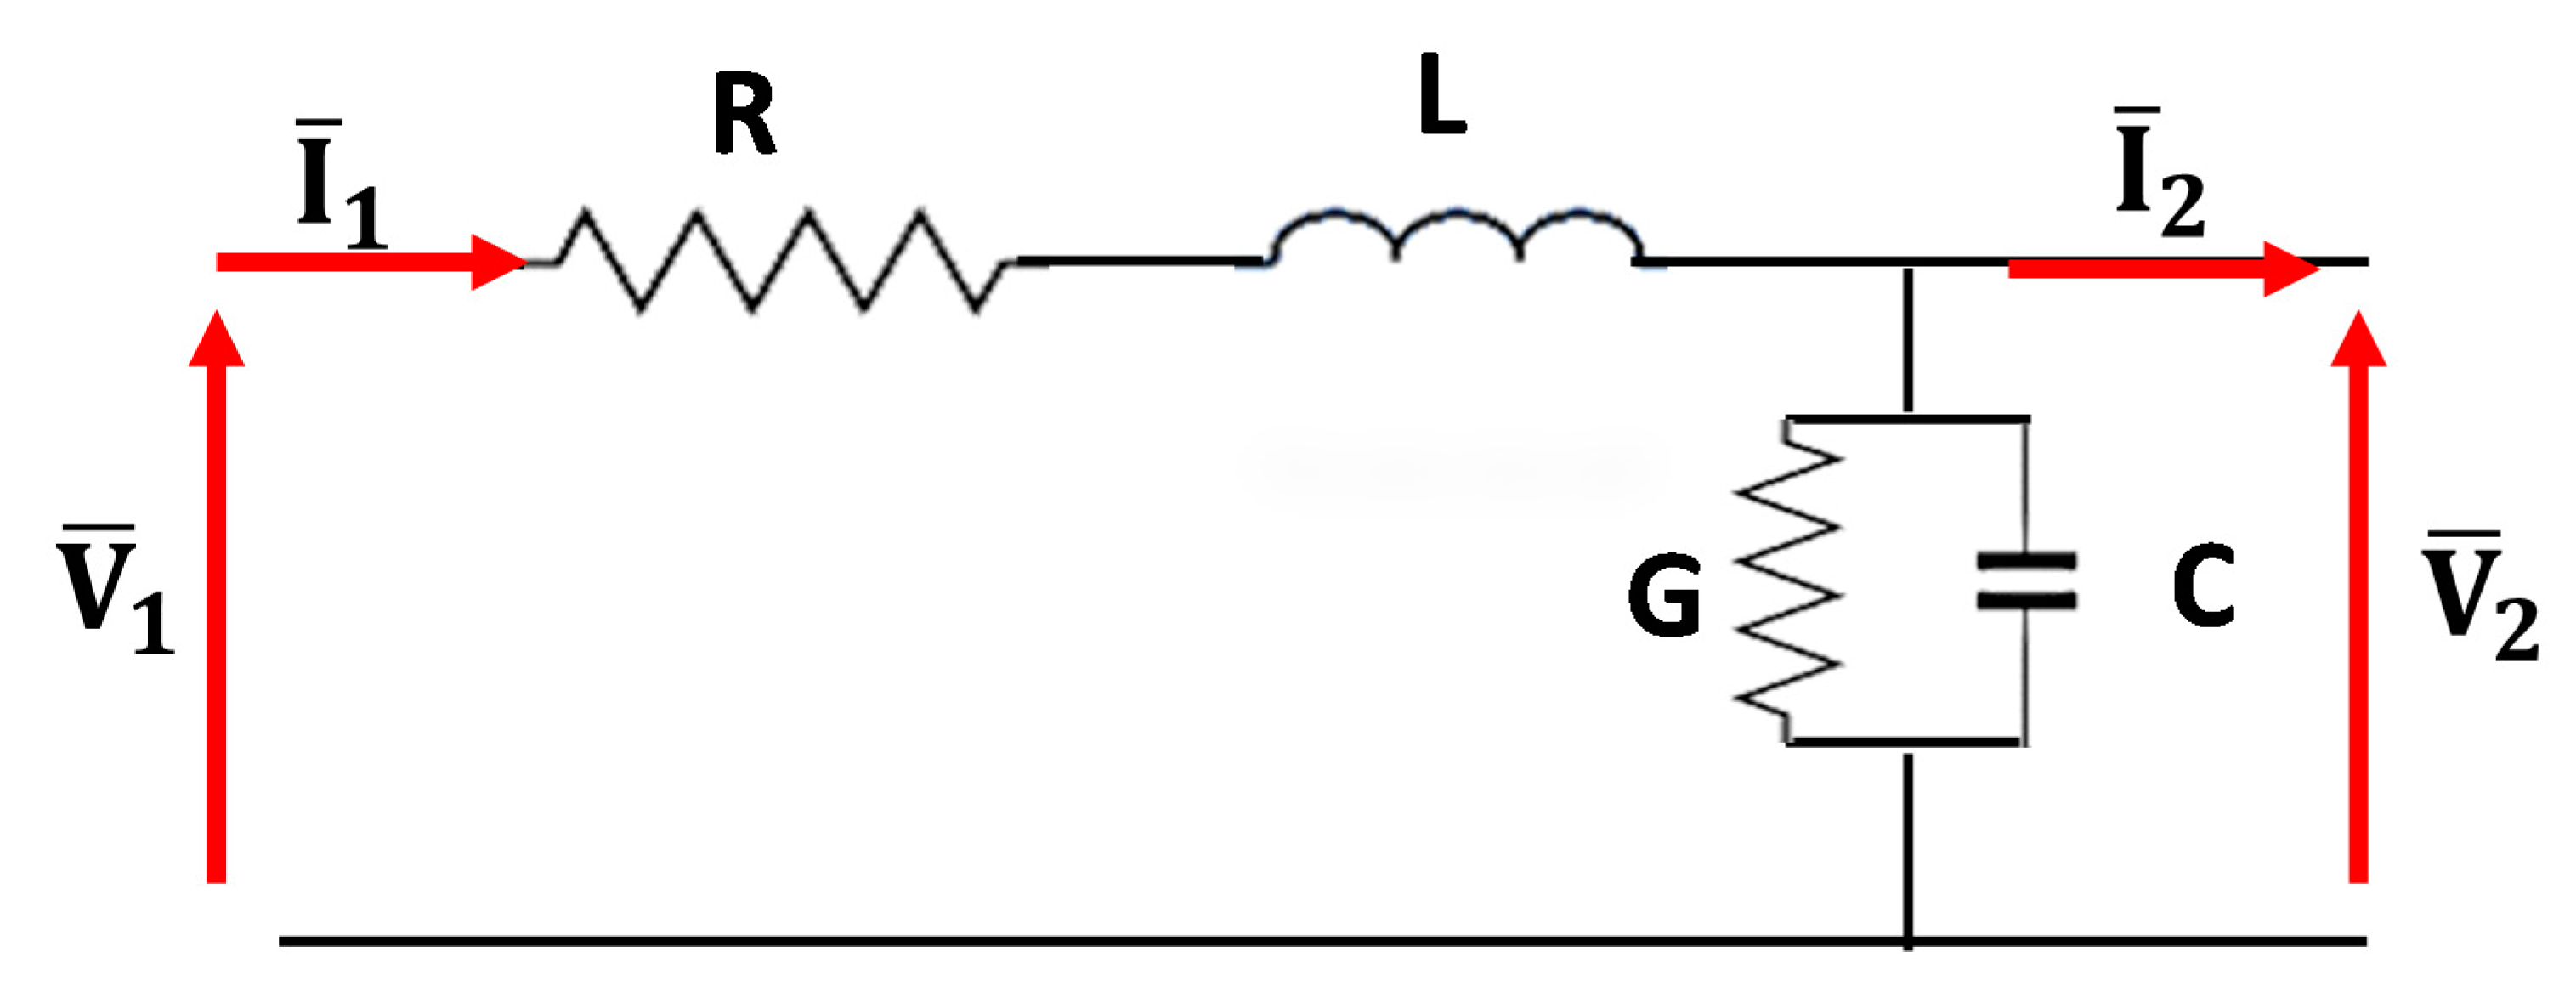
In the case of industrial or hospital loads, energy distribution takes place through MV lines. Limited lengths characterize such lines to assure low voltage drops. This aspect allows the study of lumped-parameter circuits to model MV line behavior by a series impedance and a shunt admittance (Figure 1), thus neglecting propagative effects.
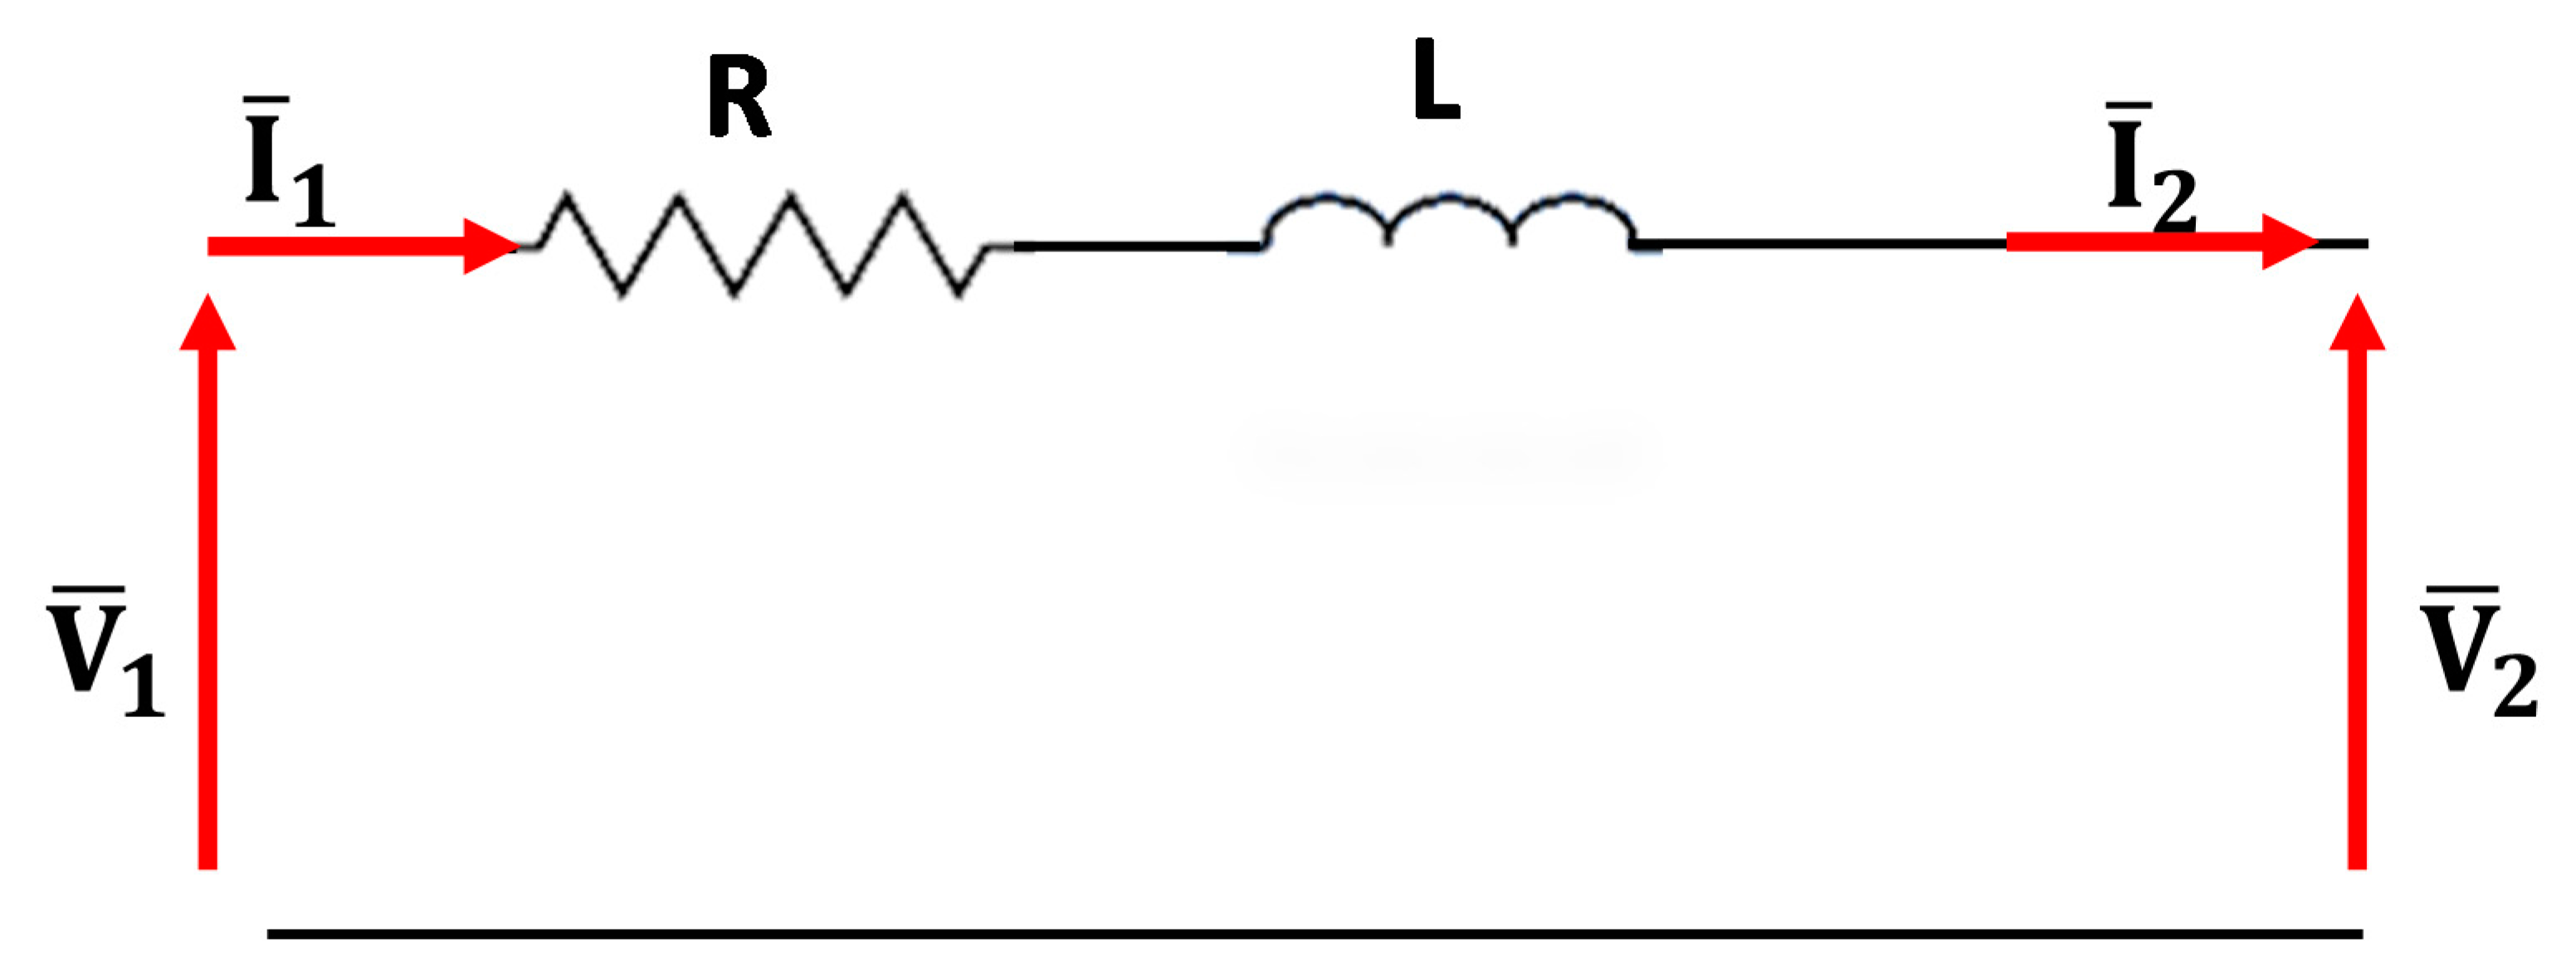
The reported model can be further simplified for MV short lines as in Figure 2.
The considered overhead MV lines have to be characterized considering their thermal behaviour. Actual operating conditions can cause temperature rise events able to impact on overhead line performance. Environmental factors, such as high temperature and low wind velocity, can further worsen line temperature rise due to overloading events. A planning tool for congestion events forecasting and reliability assessment cannot disregard adequate modelling of the cable’s thermal behavior. In the literature, numerical simulations or approximated methodologies have been proposed to address this task [25]. In the following, an applied approximated model is described.
In detail, in every infinitesimal time interval dt, the current flowing in a cable produces a temperature variation due to the energy conservation law (Equation (1)).
where:
is the heat flow rate due to the solar radiation on an overhead cable;
is the heat generation rate in a cable due to the line conductor, dielectric, armour and sheath losses;
is the dissipated heat flow rate;
is the heat accumulation rate in the cable.
As a first approximation, is considered as the heat generation rate due to the Joule effect losses in the cable conductor, represented by the formula in Equation (2).
The produced heat spreads out through the insulating layer according to heat conductive laws, and the and terms can be calculated applying Equations (3) and (4) respectively.
where:
m is the cable mass [kg];
cp is the cable heat capacity [J/(kg °C];
Δθ is the cable temperature rise over ambient temperature [°C];
d(Δθ) is the temperature rise variation in dt [°C];
U is the heat transfer coefficient [W/m2 °C];
A is the heat transfer surface [m2].
This paper aims to focus on thermal impact due to overloading conditions, thus neglecting the solar irradiation contribution (). Mathematical steps obtain the temperature rise formula as reported in Equation (5).
The multiplicand represents the steady state temperature rise Δθss while is the thermal constant T (Equation (6)).
So, Equation (5) can be written as the following formula:
The temperature rise tends to Δθss value and reaches it in four or five thermal constants.
It is worth noting that the Δθss value depends on the quantitative evaluation of the cable losses.
In detail, these power losses are due to different phenomena occurring in the cable materials. The Joule effect is responsible for a conspicuous dissipated power in the cable conductor material. Equation (8) reports the formula to calculate these Joule losses.
where:
R is the conductor material resistance;
I is the load current;
ρ is the conductor material electrical resistivity [Ω m];
l is the cable length;
S is the cable cross-sectional area [m2].
Other loss phenomena concern line dielectric, armour and sheath materials [7,26]. In addition, the increasing introduction of electronic converters and inverters in the grid determines the presence of harmonic components with cable temperature increase. This study takes account of these aspects considering corrective factors.
The obtained power loss formula and the cable lateral area, reported in Equation (9), can be substituted in the Δθss expression, thus providing Equation (10).
where p is the cable perimeter [m].
Furthermore, the thermal constant calculation does not represent a straightforward task since a cable consists of different materials, i.e., the central conductor with insulation, sheath and jacket layers. Different thermal behavior and specific heat capacity characterize each material. In addition, the U value definition requires accurate evaluation. An approximate approach allows simplifying the calculation, taking advantage of Δθss formula as reported in Equation (11).
In addition, considering the volumetric mass density γ, the cable mass can be calculated by Equation (12).
Finally, the substitution of Equations (11) and (12) in the thermal constant formula (Equation (6)) provides the following expression.
A similar approach can be applied to the cable temperature decrease in the case of load current reduction.
Furthermore, the thermal behaviour of a cable under varying load conditions depends on the flowing current Ic, its duration and on the current value in the preceding interval. The load current produces a temperature rise that can be evaluated by Equation (14).
where:
Iz is the cable rated current;
Δθz is the temperature rise corresponding to a flowing current equal to Iz.
On the basis of the Δθc evaluation, the final temperature rises Δθf in the time interval t, in which the load current Ic flows in the cable, can be calculated substituting Δθ and Δθss terms for (Δθf–Δθi) and (Δθc–Δθi) respectively in Equation (7), thus obtaining Equation (15).
where Δθi represents the initial temperature rise.
In the proposed tool, the overhead line temperature rises have been calculated for each forecasting time step considering ambient temperature and load currents graphs, as below reported.
Inputs for the developed subroutine are cables lengths, sections, steady state temperature resistivity, cable perimeters and U coefficients. Load currents are assumed to be balanced among the power system three-phase lines. In this paper ampacity reduction phenomena are neglected to mainly focus attention on overhead line behavior in case of heavy load conditions. Recently, and in coming years, they could represent frequent functioning conditions in the case of not updated energy transmission and distribution systems. In these conditions, the possibility to forecast and avoid congestion events means avoidance of cable damage and customer outage with increased performance in terms of reliability indices.
2.2. Overhead Lines Reliability Assessment
In this section, the focus is on reliability assessment concerning the considered overhead lines. In detail, reliability R(t) is defined as the probability that a product, system or service will perform its intended function adequately for a specified period of time, or it will operate in a defined environment without failure.
Reliability is, therefore, a function of time characterized by a monotonically decreasing graph; it decreases over time in the absence of external interventions.
The concept of reliability is implicitly associated with failure events. Data concerning malfunction, breakdown events and maintenance and repair actions allow assessment of the degree of reliability of nonrepairable and repairable units.
In detail, overhead line R(t) evaluation can be carried out by different models, methodology and standards. In this paper, the Military Handbook 217 [27] is applied considering the approximated overhead lines model (Figure 2). This reliability prediction model is one of the most applied manuals for estimating component reliability. Written for the first time in 1961 [18] for military and aerospace purposes, it has been updated several times over the years, up to the most recent version “Military Handbook, Reliability Prediction of Electronic Equipment”, MIL-HDBK-217, Revision F, Notice 2 [27].
The application of the MIL-HDBK-217 model allows system reliability assessment starting from a single component failure rates calculation. This failure rate is obtained considering a base failure rate λb multiplied by πi factors representative of the different stresses (thermal, environment, electrical, etc) on component reliability. System failure rate is evaluated adequately analysing components subsystems, their series/shunt configurations and calculating the relative reliability indices.
The reported lines lumped-parameters model permits short line failure rate evaluation considering the series configuration represented by the cable series impedance:
According to MIL-HDBK-217F, and to the lumped-parameter models, the resistor and inductor failure rates can be calculated by the following formulas, respectively.
where:
πT is the thermal stress factor;
πE is the environment factor;
πQ is the quality factor;
πP is the power factor;
πS is the power stress factor.
The MIL-HDBL-217F provides tables and formulas for the identification and calculation of these factors in specific operating conditions and applications.
The thermal stress factor πT is a function of the component temperature. In the considered application, this temperature value is calculated taking into account the ambient temperature and line power losses.
Furthermore, the cable longitudinal impedance represents a series connection through which failure rate can be obtained summing the resistive and inductor failure rates.
On the base of the overall system failure rate, the reliability function R(t) can be estimated. In this paper, memory of previous failure events, ageing and further impacting factors are omitted in order to solely evaluate the incidence of congestion events on each line reliability performance. Thus, overhead lines R(t) function is evaluated according to the exponential model as reported in Equation (21).
where t is the mission time.
3. Hybrid Grids Planning Tool
3.1. Planning Tool Overview
The proposed tool is a planning software tool whose inputs consist of the single line diagram of the grid under investigation and 24-h ahead forecasting time series concerning not only ambient temperature and wind velocity profiles but also RES generations, storage and loads system graphs.
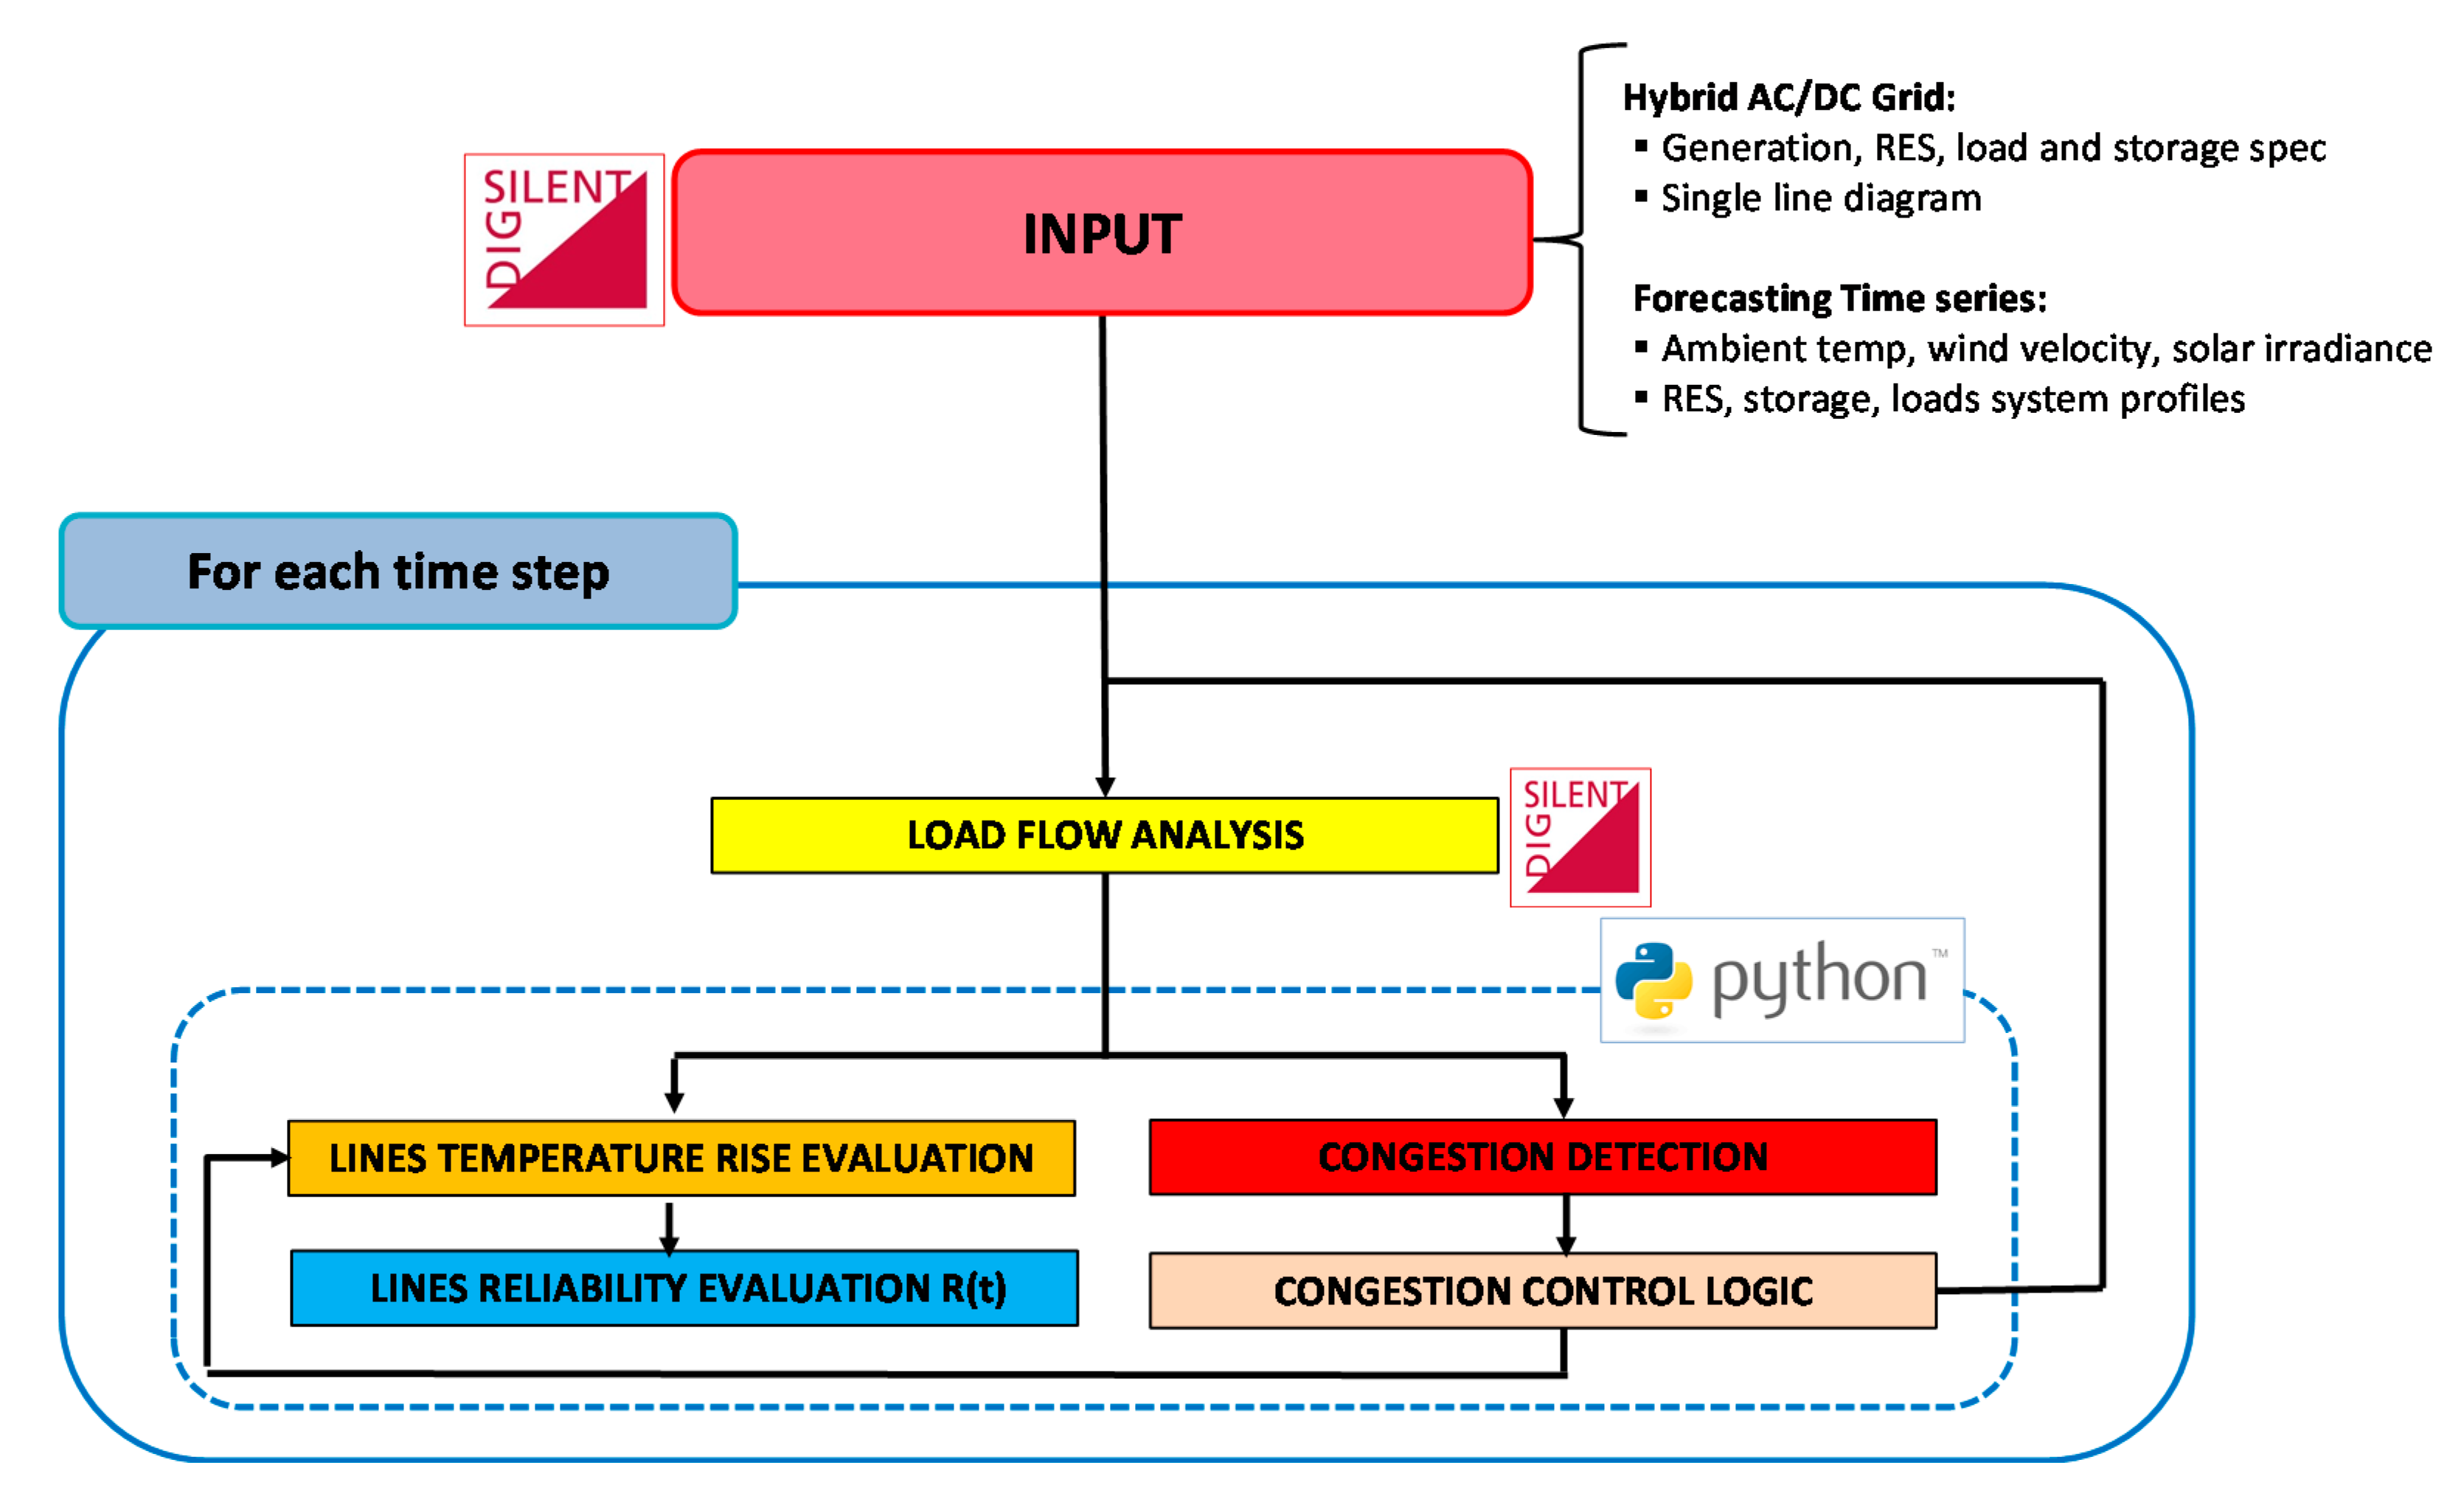
It is based on a Python script interacting with a grid model developed in DIgSILENT Powerfactory environment. Starting from the input data, per each forecasting time step, DIgSILENT Powerfactory executes the Load Flow (LF) calculation. This analysis is used to evaluate grid operating conditions and detect eventual line congestion events. Then LF results are sent to the Python script for evaluating line reliability and, if necessary, congestion avoidance control (Figure 3) is applied.
3.2. Congestion Detection Control
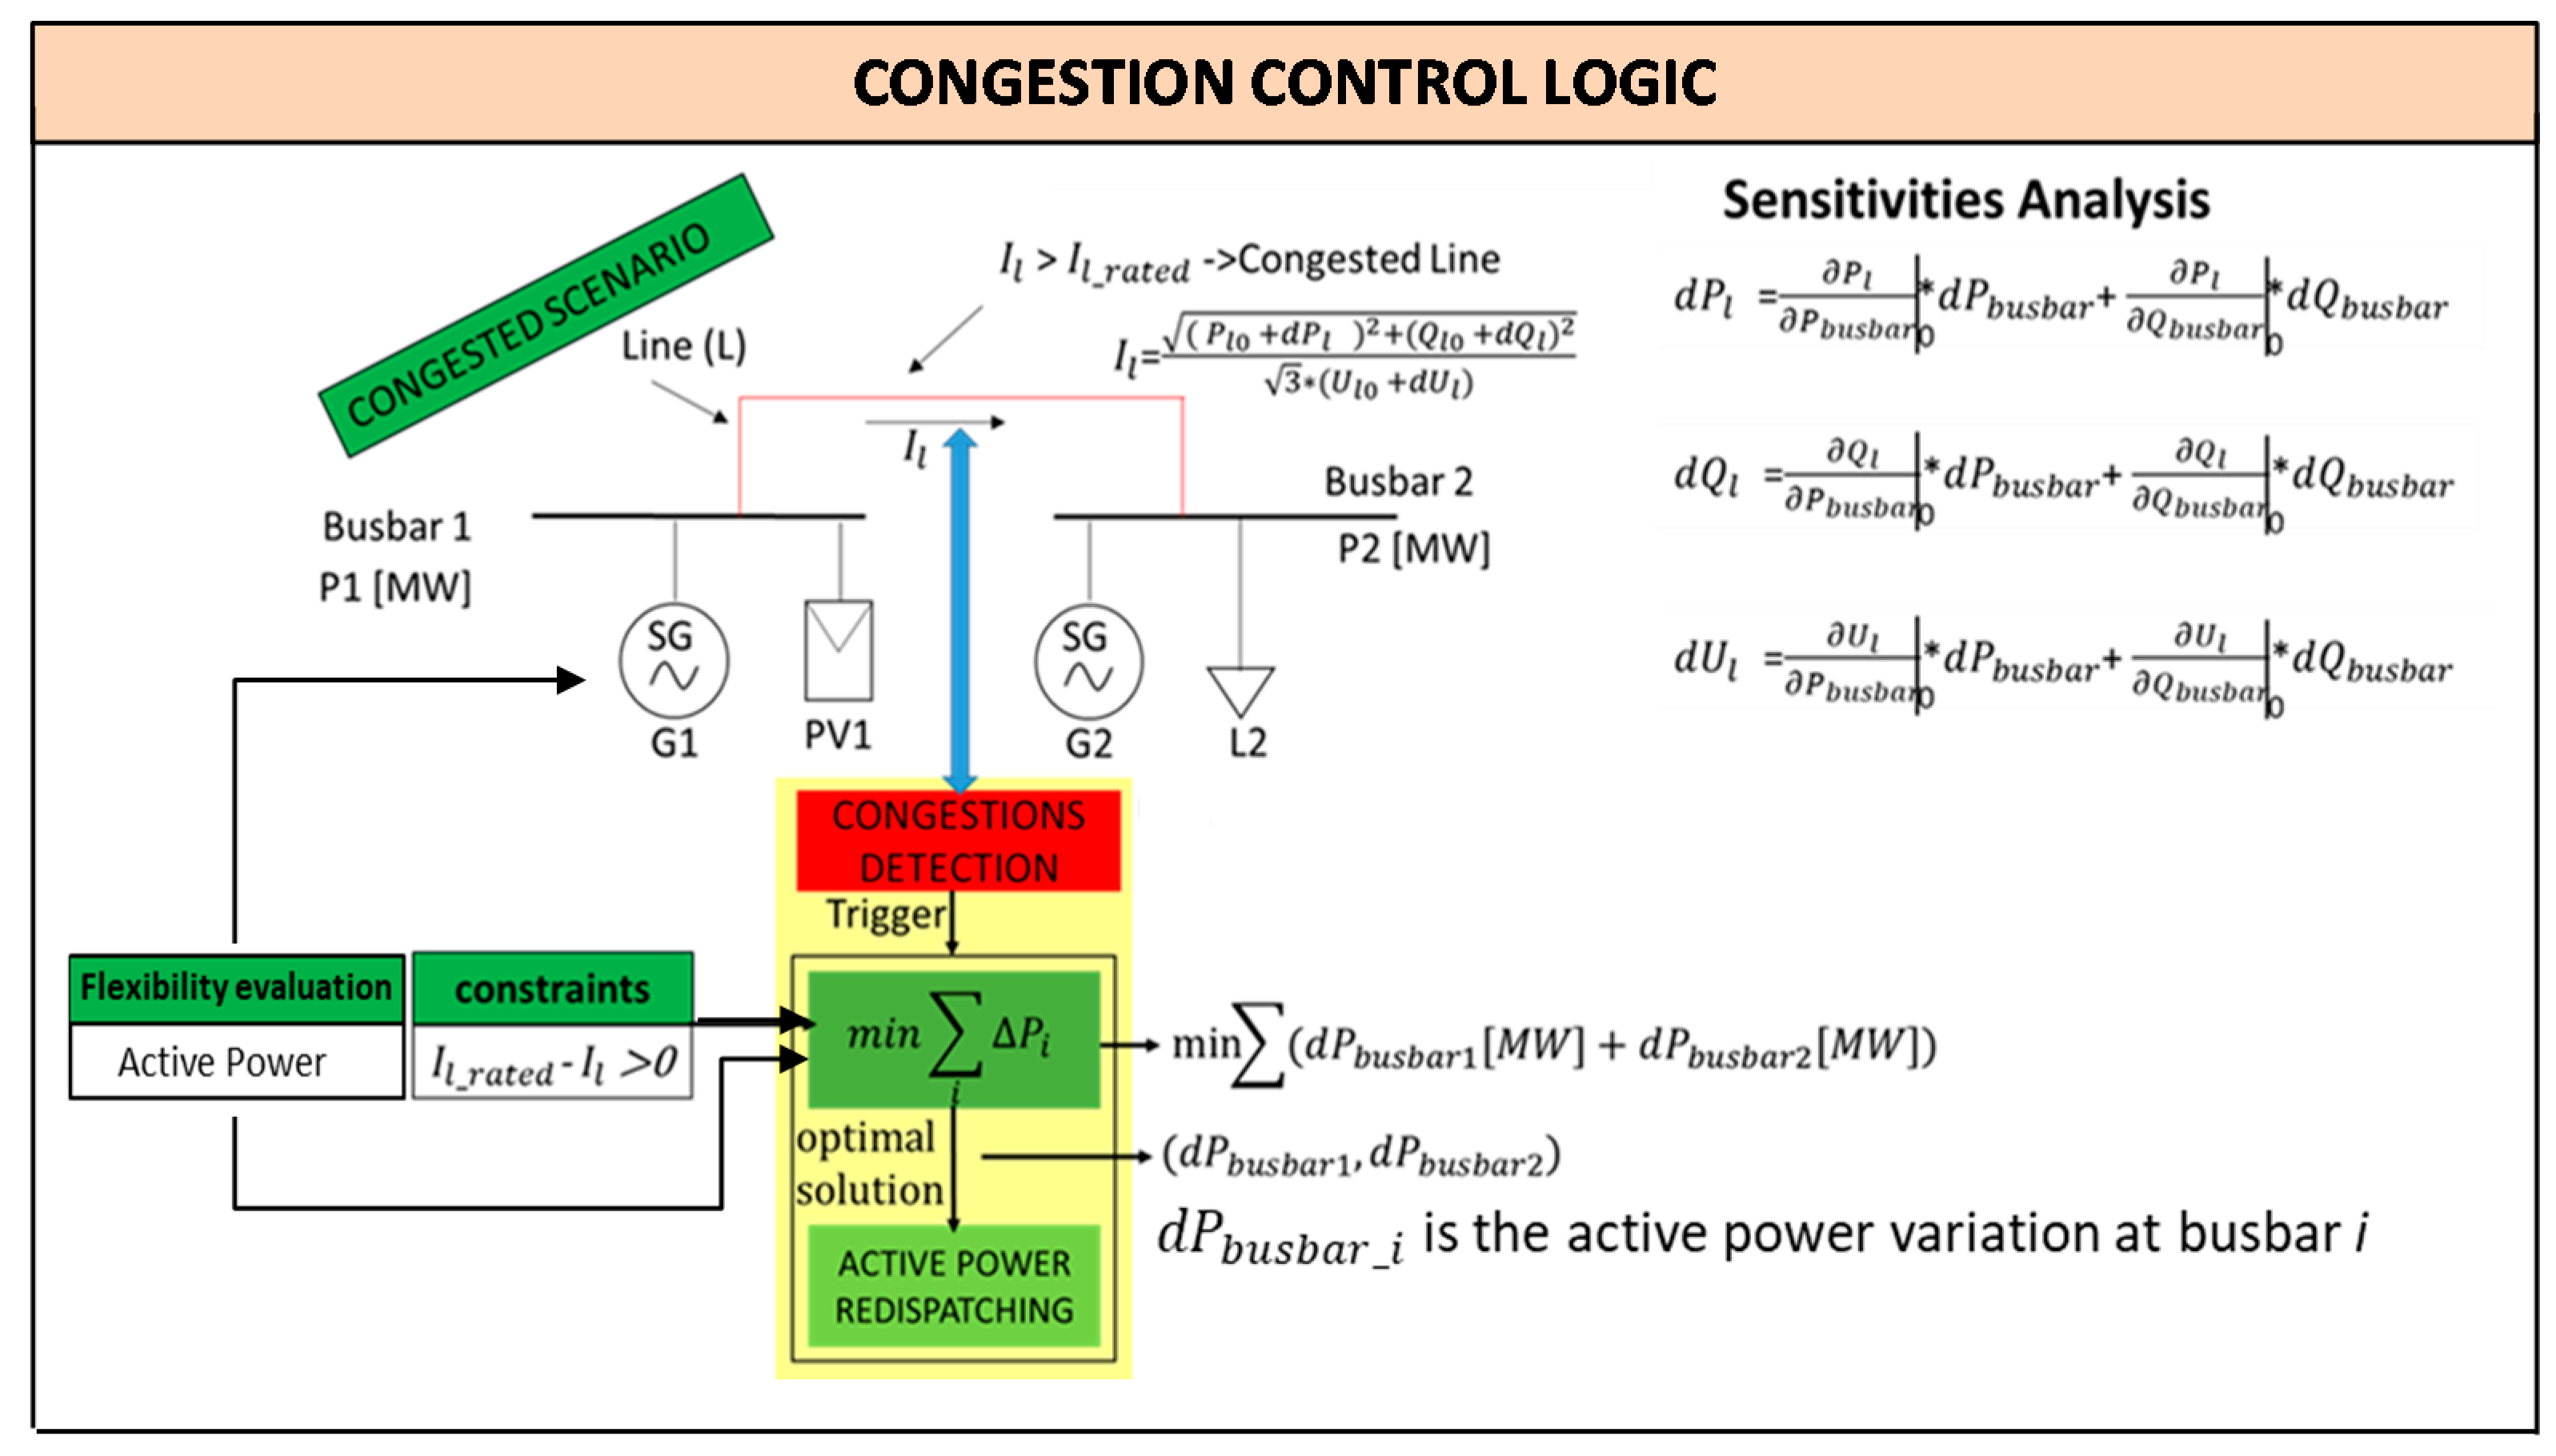
In detail, congestion control is synthetically reported in Figure 4. It consists of different functions:
- Congestion Detection;
- Active Power Flexibility Evaluation;
- Sensitivities Analysis;
- Active Power Redispatching;
- Line Reliability R(t) Evaluation
The Congestion Detection function is in charge of continuous grid monitoring; in particular, it measures the current for each line and compares it with line rated current. When the measured current value is greater than the reference value, the active power flexibility evaluation function and the Sensitivities Analysis are triggered.
The Active Power Flexibility function evaluates the active power flexibility made available from each asset in the grid. With this aim, an internal table is created including, for each resource, information (e.g., maximum/minimum active/reactive power per each asset, busbar connected with the asset, etc.) needed to calculate the optimal solution (minimum active power variation at each busbar) and to solve the detected congestion problems. The implemented optimization function [5,7,26] is:
where:
is the positive active power variation at busbar i;
is the negative active power variation at busbar i;
is the total number of busbars.
The optimization problem constraint is:
where:
is the rating current value of line j;
is the active power initial condition that flows through line j;
is the reactive power initial condition that flows through line j;
is the active power that flows through line j;
is the reactive power that flows through line j;
is the effect on active power of the injection of ΔP at busbar for line j;
is the effect on active power of the injection of ΔQ at busbar for line j;
is the effect on reactive power of the injection of ΔP at busbar for line j;
is the effect on reactive power of the injection of ΔQ at busbar for line j;
is the voltage initial condition for line j;
is the nominal voltage for line j;
where is the voltage of the line j.
The formula represents the difference between the line rating current and the line current based on the active and reactive power variation of the resources. All derivatives in Equation (23) are calculated with the Load Flow sensitivities function provided by DIgSILENT Powerfactory environment.
Once the optimal solution in terms of minimal active power variation at each Busbar is calculated, the active power redispatching function is activated. This function performs the following steps:
- a list is defined for each grid busbar with the connected assets;
- a priority list is defined for the active power redispatching based on the optimal solution;
- the reliability assessment is carried for each grid line after the control action.
The developed control strategy is able to localize the instability event and to solve the detected issues involving more suitable local resources (optimal solution).
The effectiveness of the proposed methodology is verified investigating the modified IEEE 14-Bus System above reported.
4. Case Study and Results
To test the proposed logic performance, a hybrid synthetic grid model was carried out modifying the IEEE 14 Bus System. Then, the developed tool was applied to this synthetic grid to evaluate how the control logics perform when power grid congestion problems occur due to a high RES generation presence.
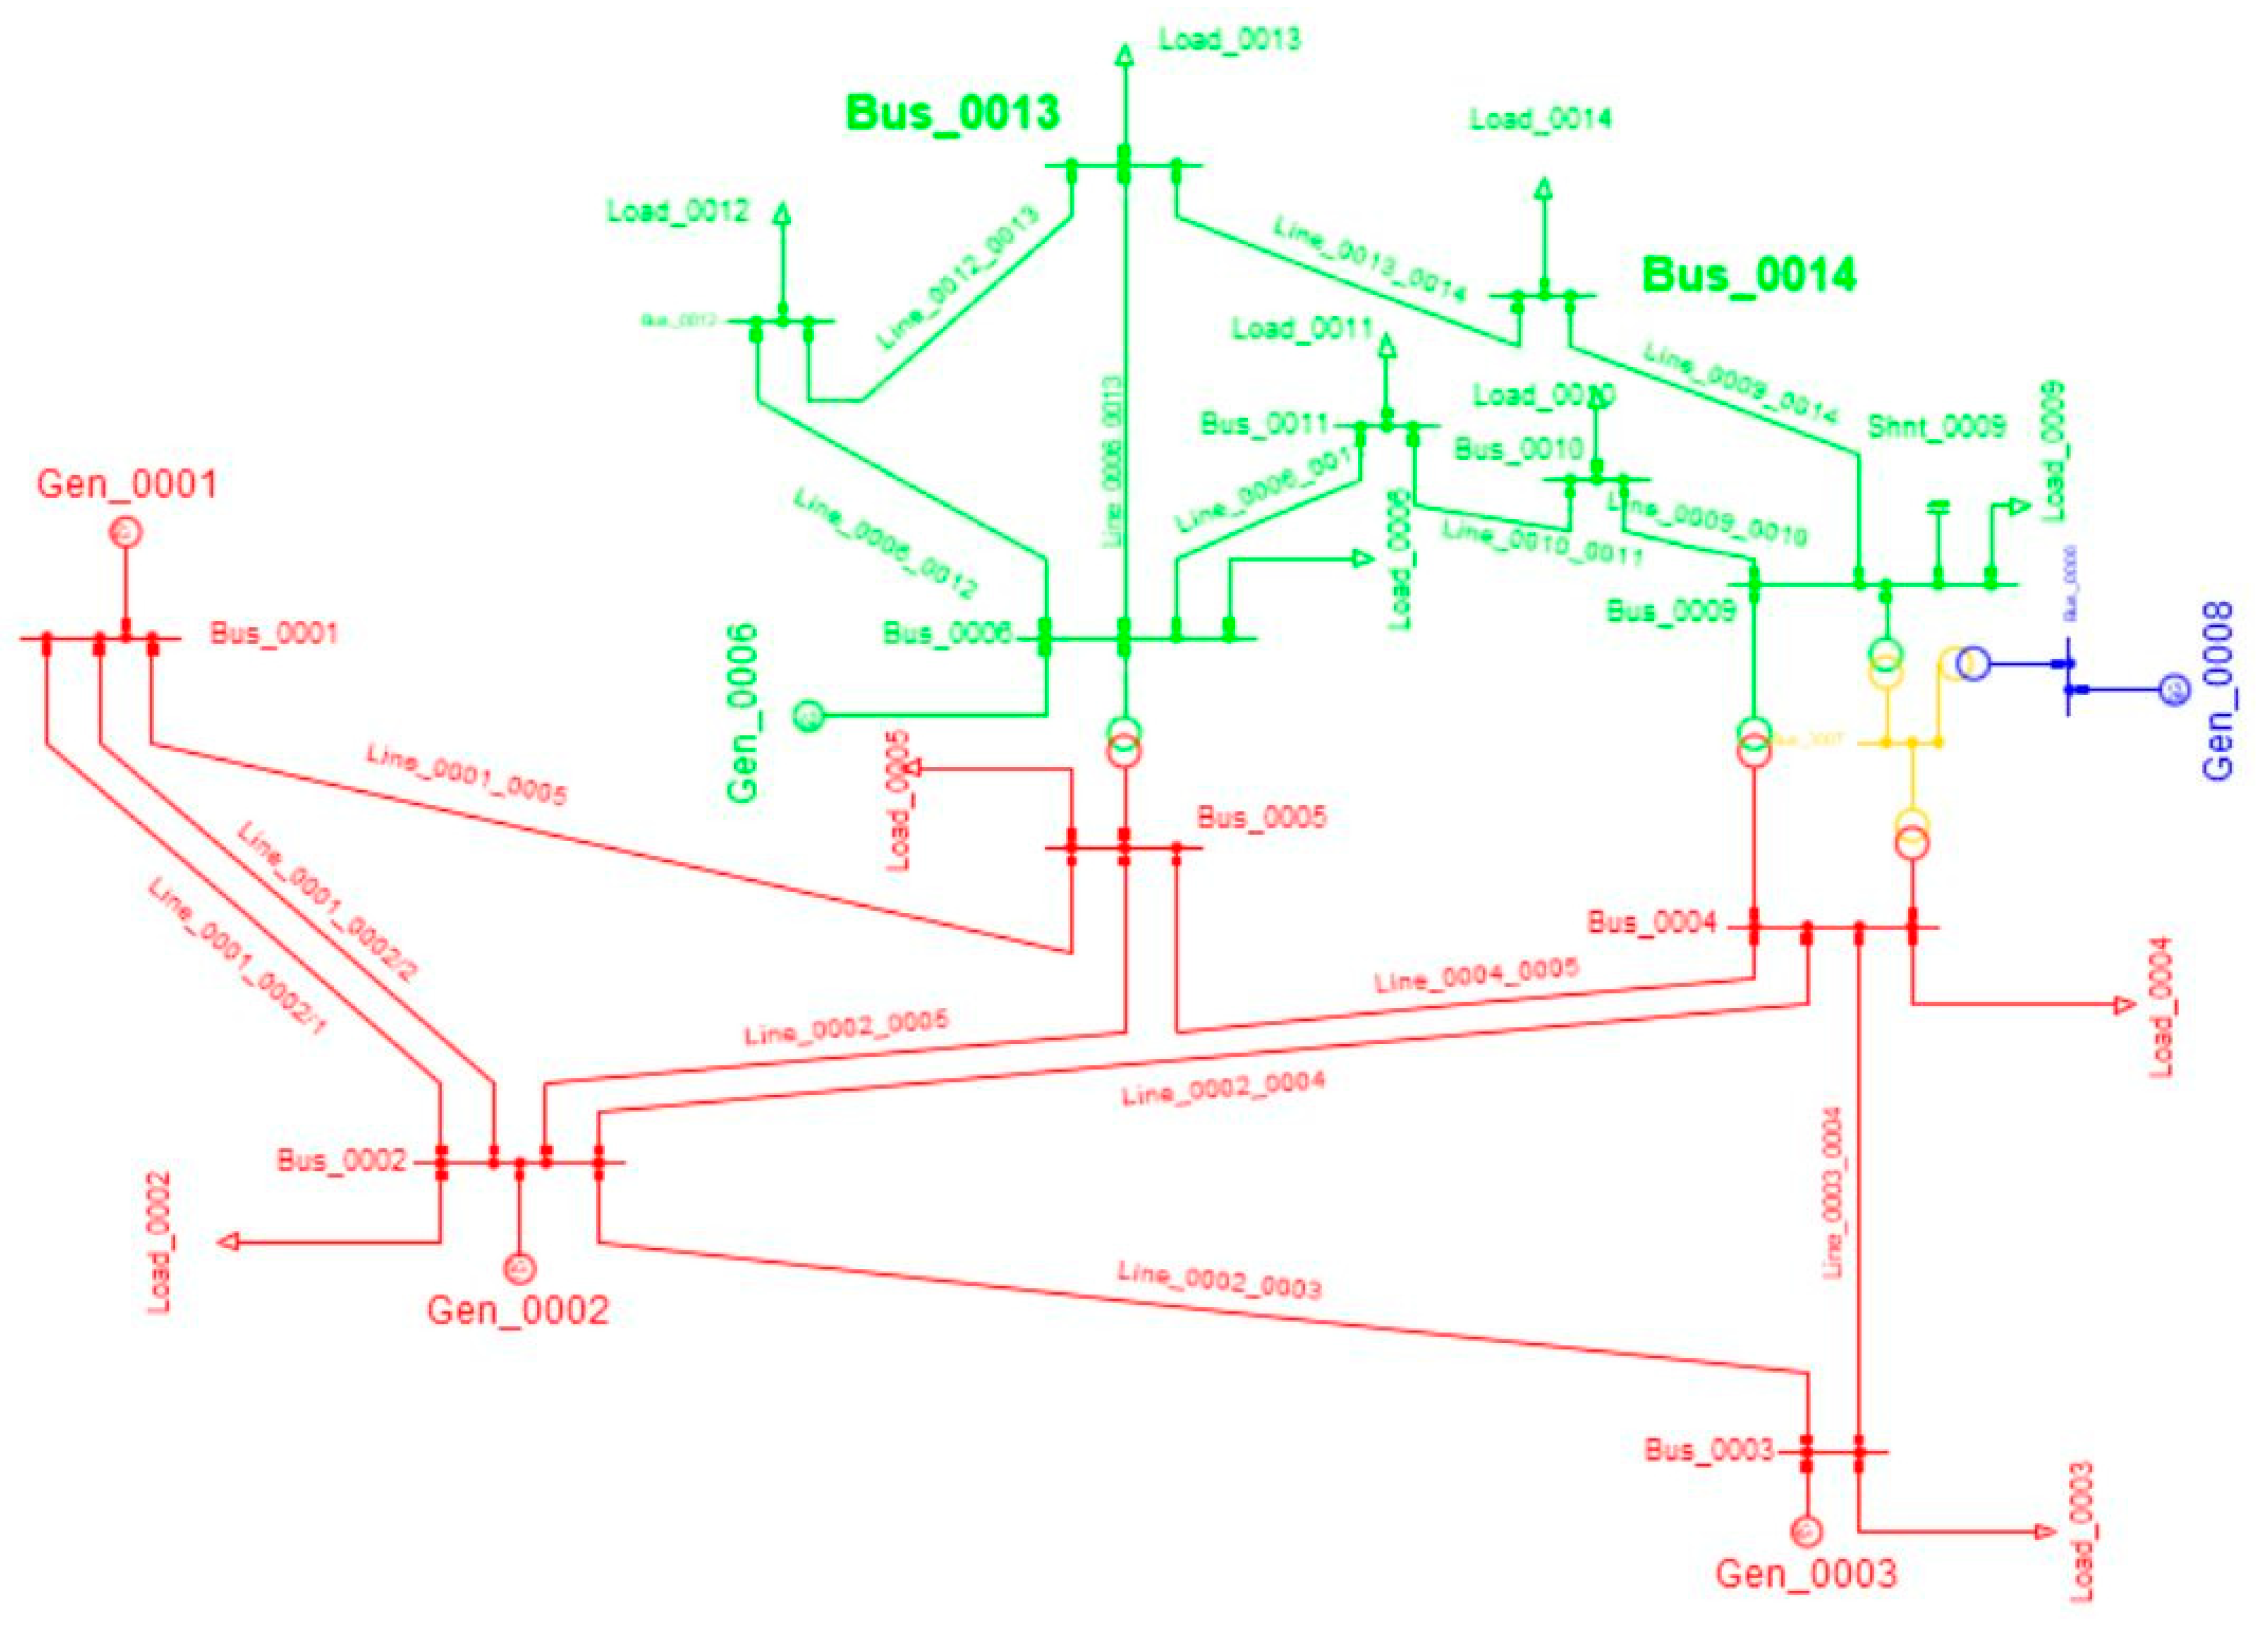
In detail, the IEEE 14 Bus System is an AC grid representing a Midwest United States power system simplified model constituted by fourteen AC buses, five generators, sixteen lines and eleven loads. The related graph is reported in Figure 5. It was studied by the single line diagram provided by DIgSILENT Powerfactory software. In detail, this power system is characterized by the reference machine G1 and the synchronous machine G2 which inject active power and regulate connected buses voltage levels. The other three generators are synchronous compensators absorbing and injecting reactive power from/into the AC grid. Five transformers adjust bus voltage levels. Eleven loads are distributed in the grid absorbing active and reactive power by the power system lines.
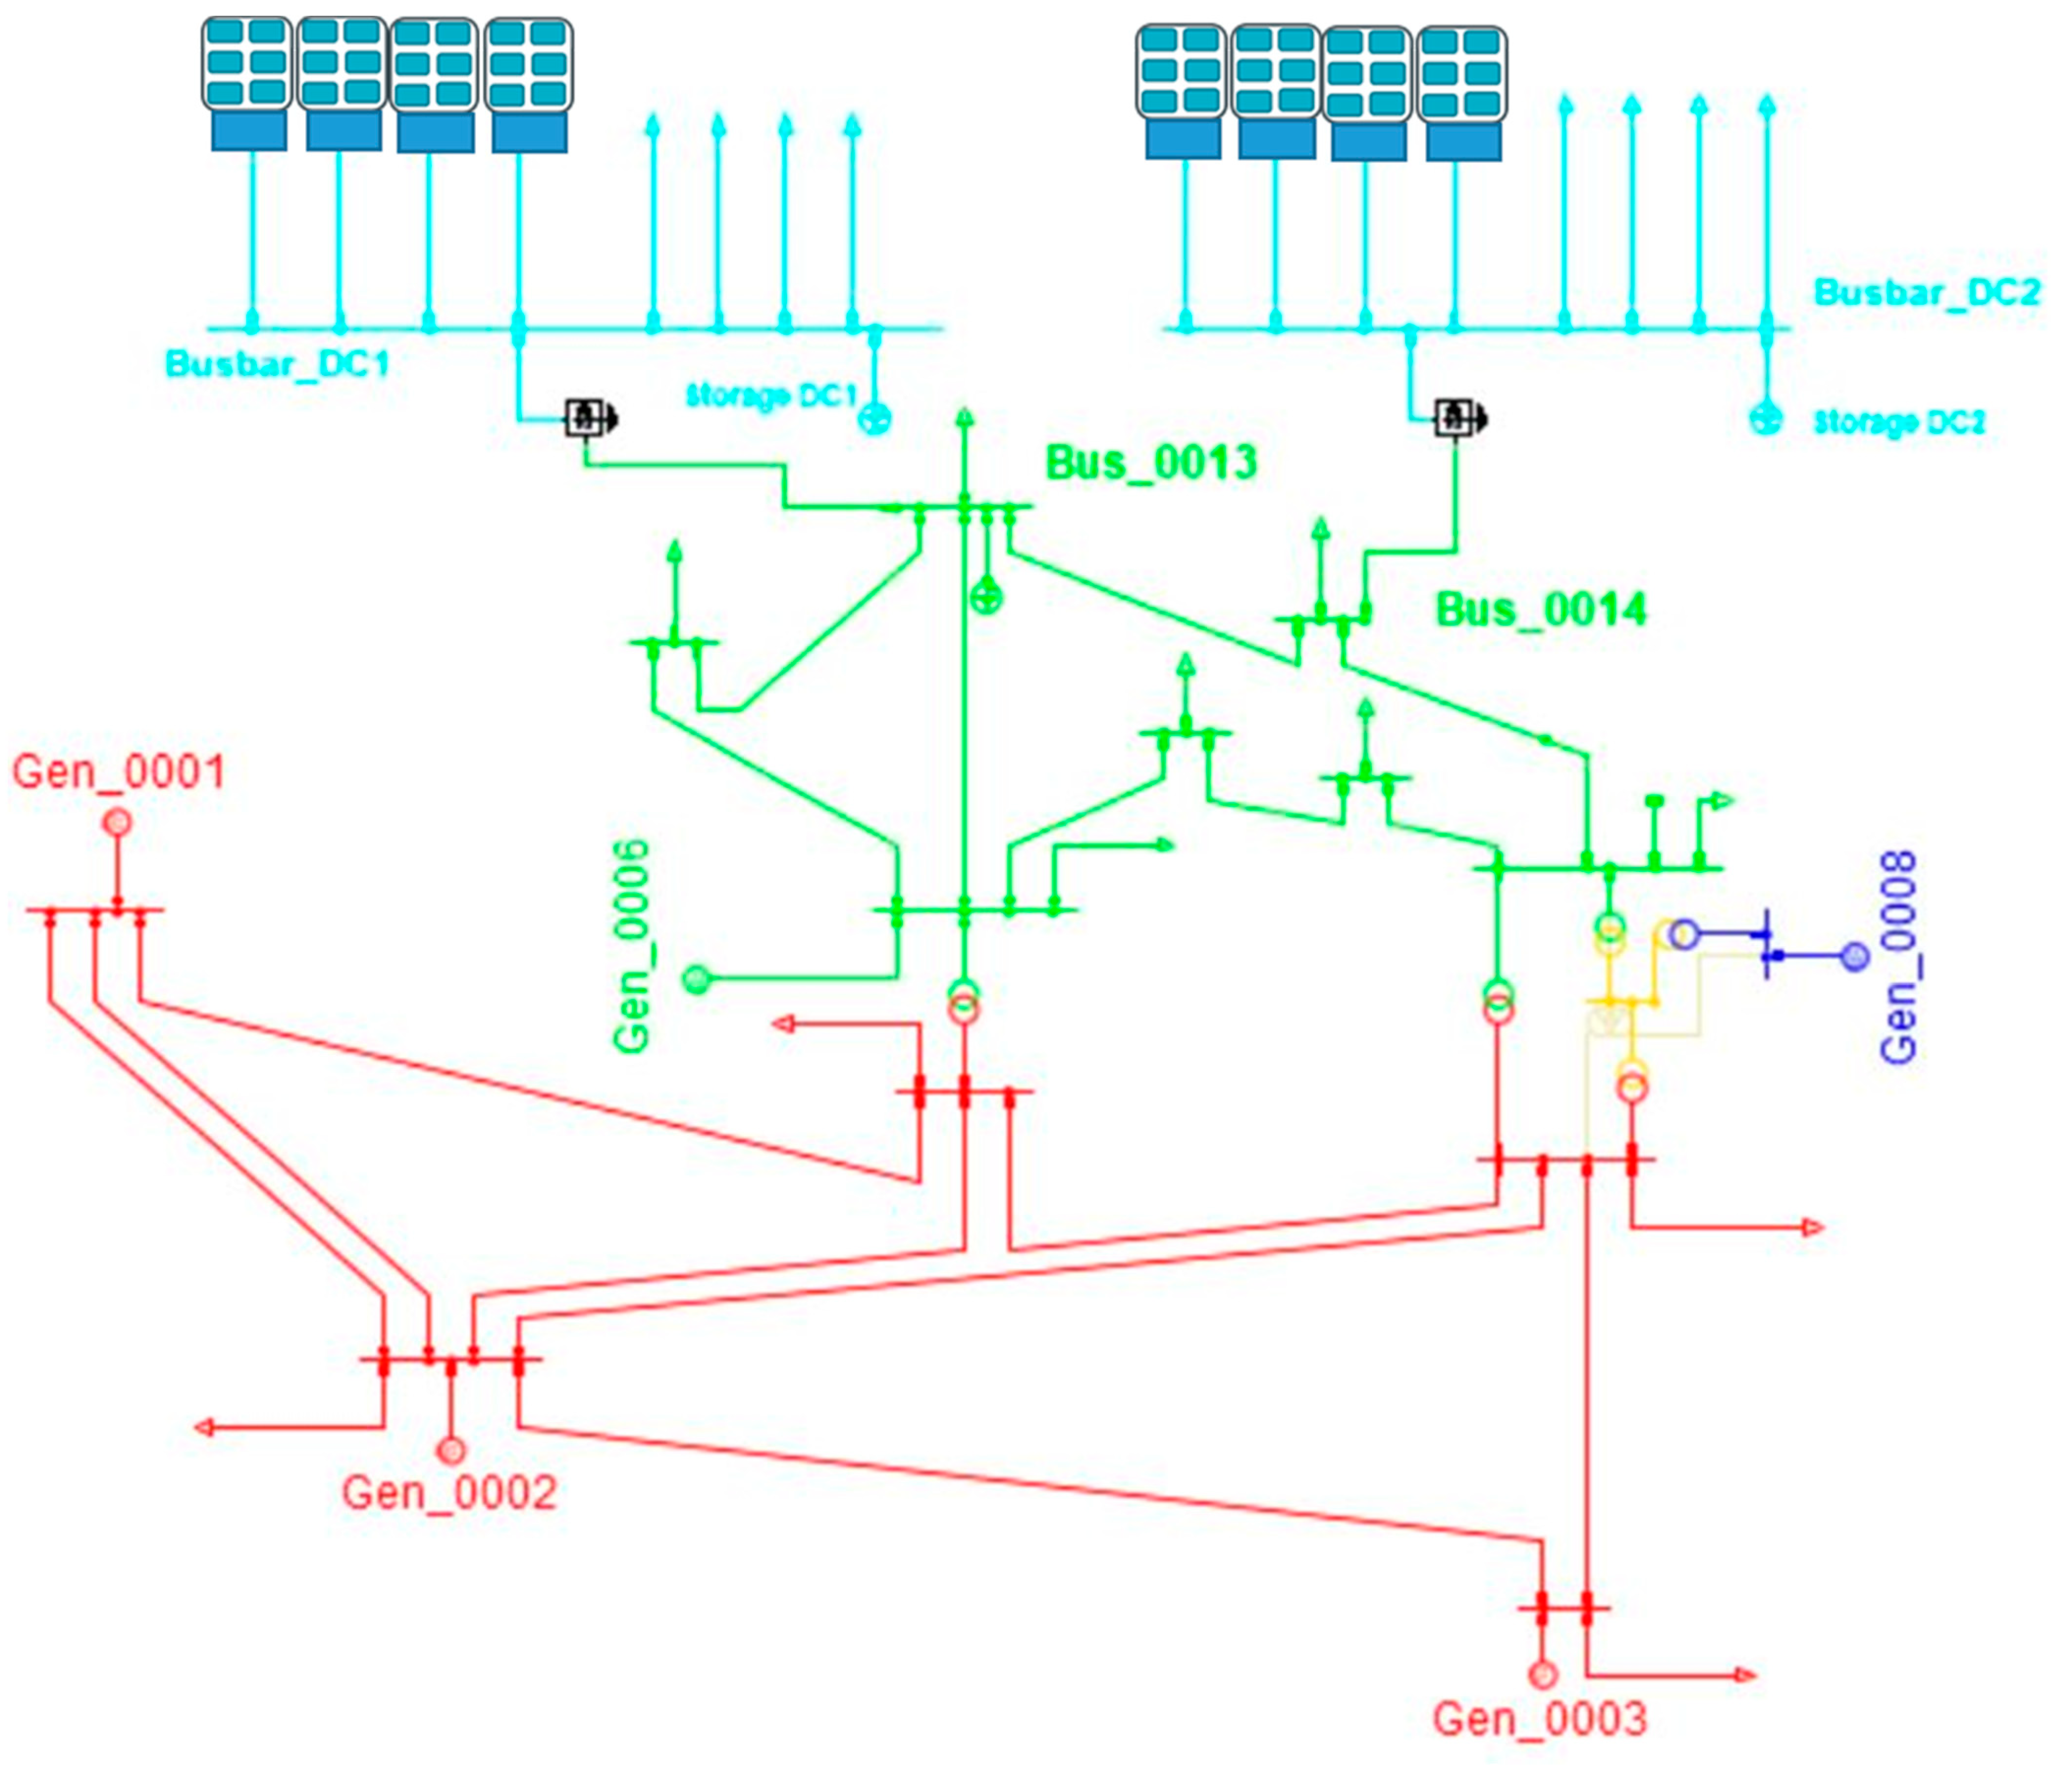
The synthetic grid was modified to obtain a hybrid AC/DC grid including DC renewables generators, loads and storage systems. In detail, the hybrid IEEE 14-Bus System results already characterized by fourteen AC buses but further DC busbars are added. MV Busbar_DC1 and Busbar_DC2 are connected to AC BUS_0013 and BUS_0014, respectively, as reported in Figure 6. Two additional bidirectional DC/AC converters interface the original buses with the new DC ones, allowing DC RES (such as PhotoVoltaic (PV) generators) and DC loads connection. Overhead lines, whose model is described above, characterize the hybrid IEEE 14-Bus system.
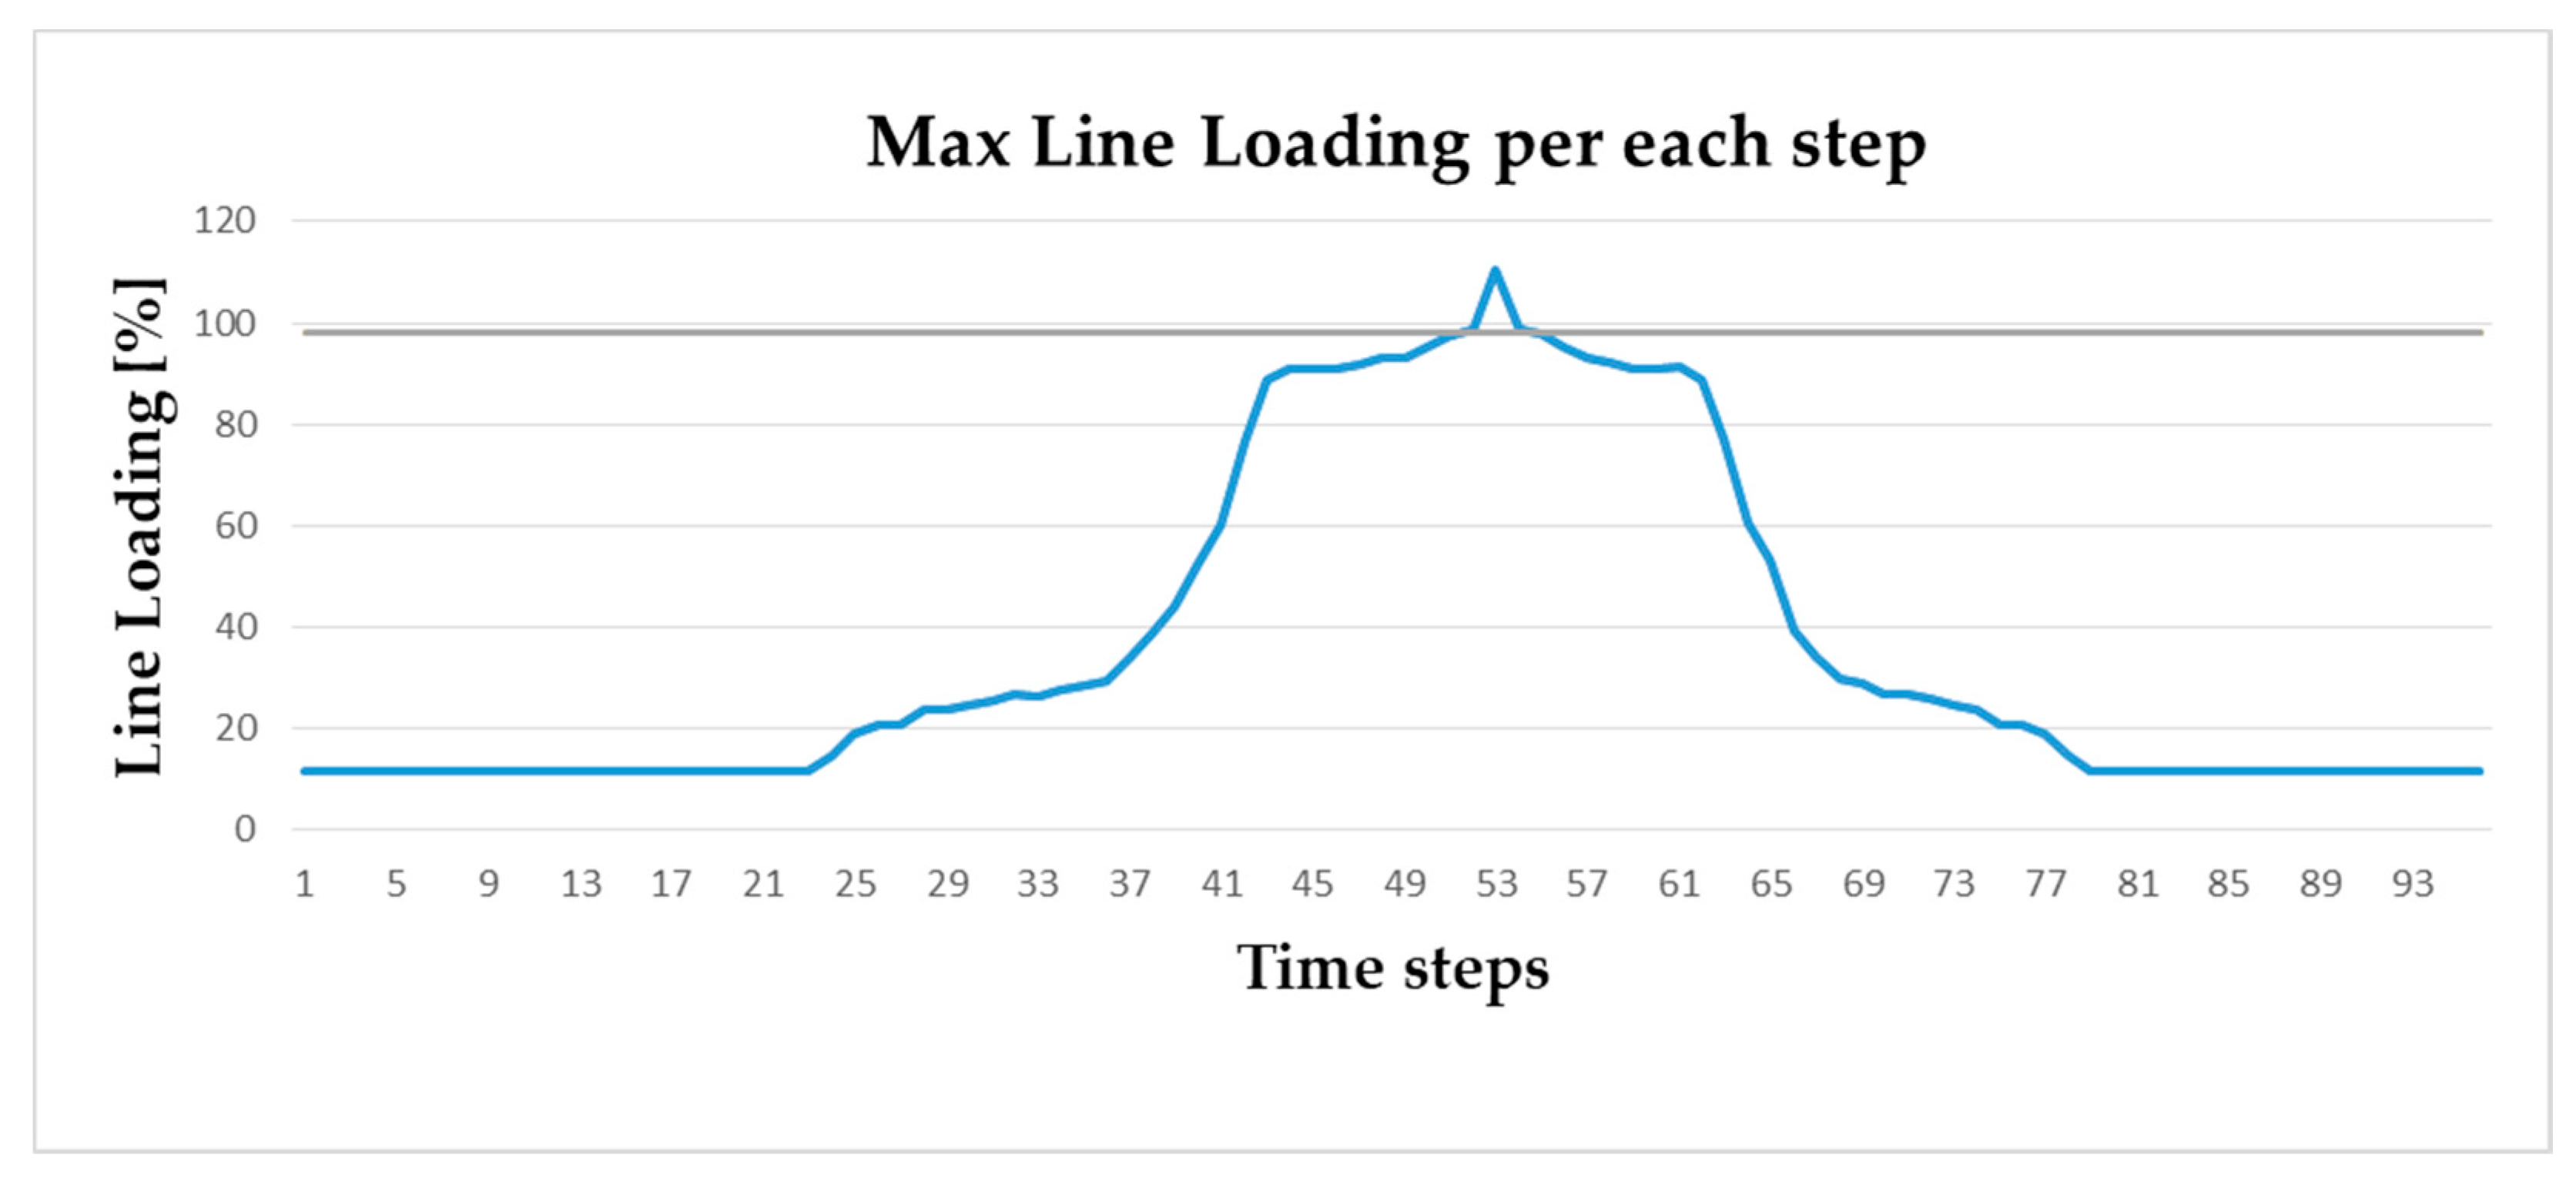
After the DIgSILENT Powerfactory grid model was constructed, the operating conditions were customized by integrating the time series of loads and generation resources (24-h ahead values) into the model. Then, a preliminary LF analysis was carried out for estimating the line loading levels and their reliability.
Figure 7 shows the maximum line loading obtained per each time step. At time steps 53, 54 and 55 the maximum loading is equal to 98.78%, 110.33% and 98.82% respectively. These percentages results are higher than the loading level threshold set for the control activation. In particular, the AC Line_0006_0013 and the AC Line_0009_0014 lines result in congested conditions.
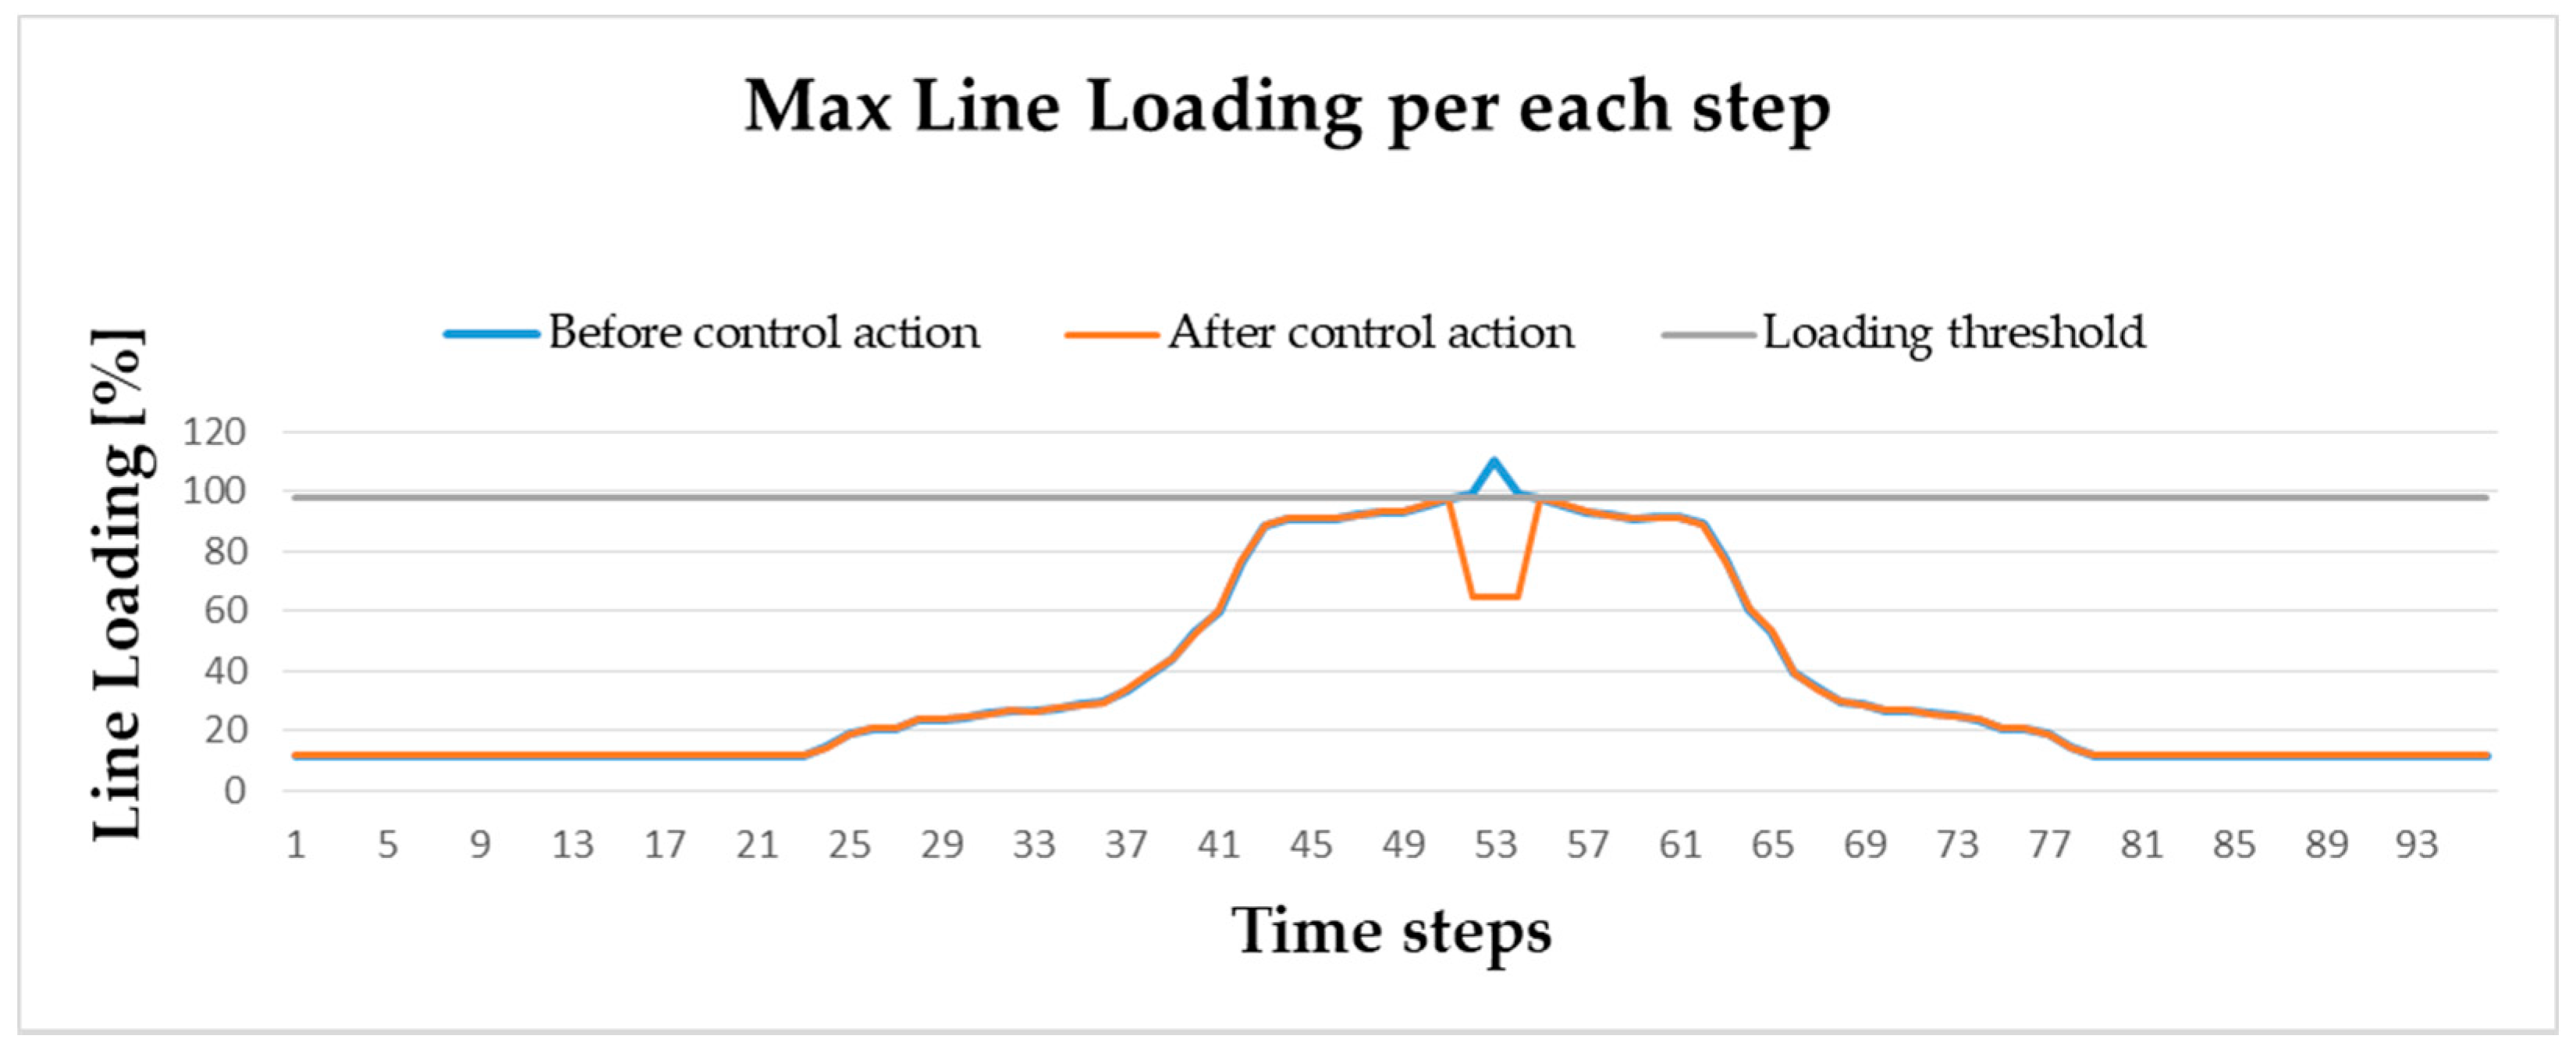
The control calculates the optimal solution for each congested time step in order to solve the detected problems and improve the congested line’s reliability as shown in the following figures. In detail, Figure 8 shows the maximum line loading per each time step before and after the control action.
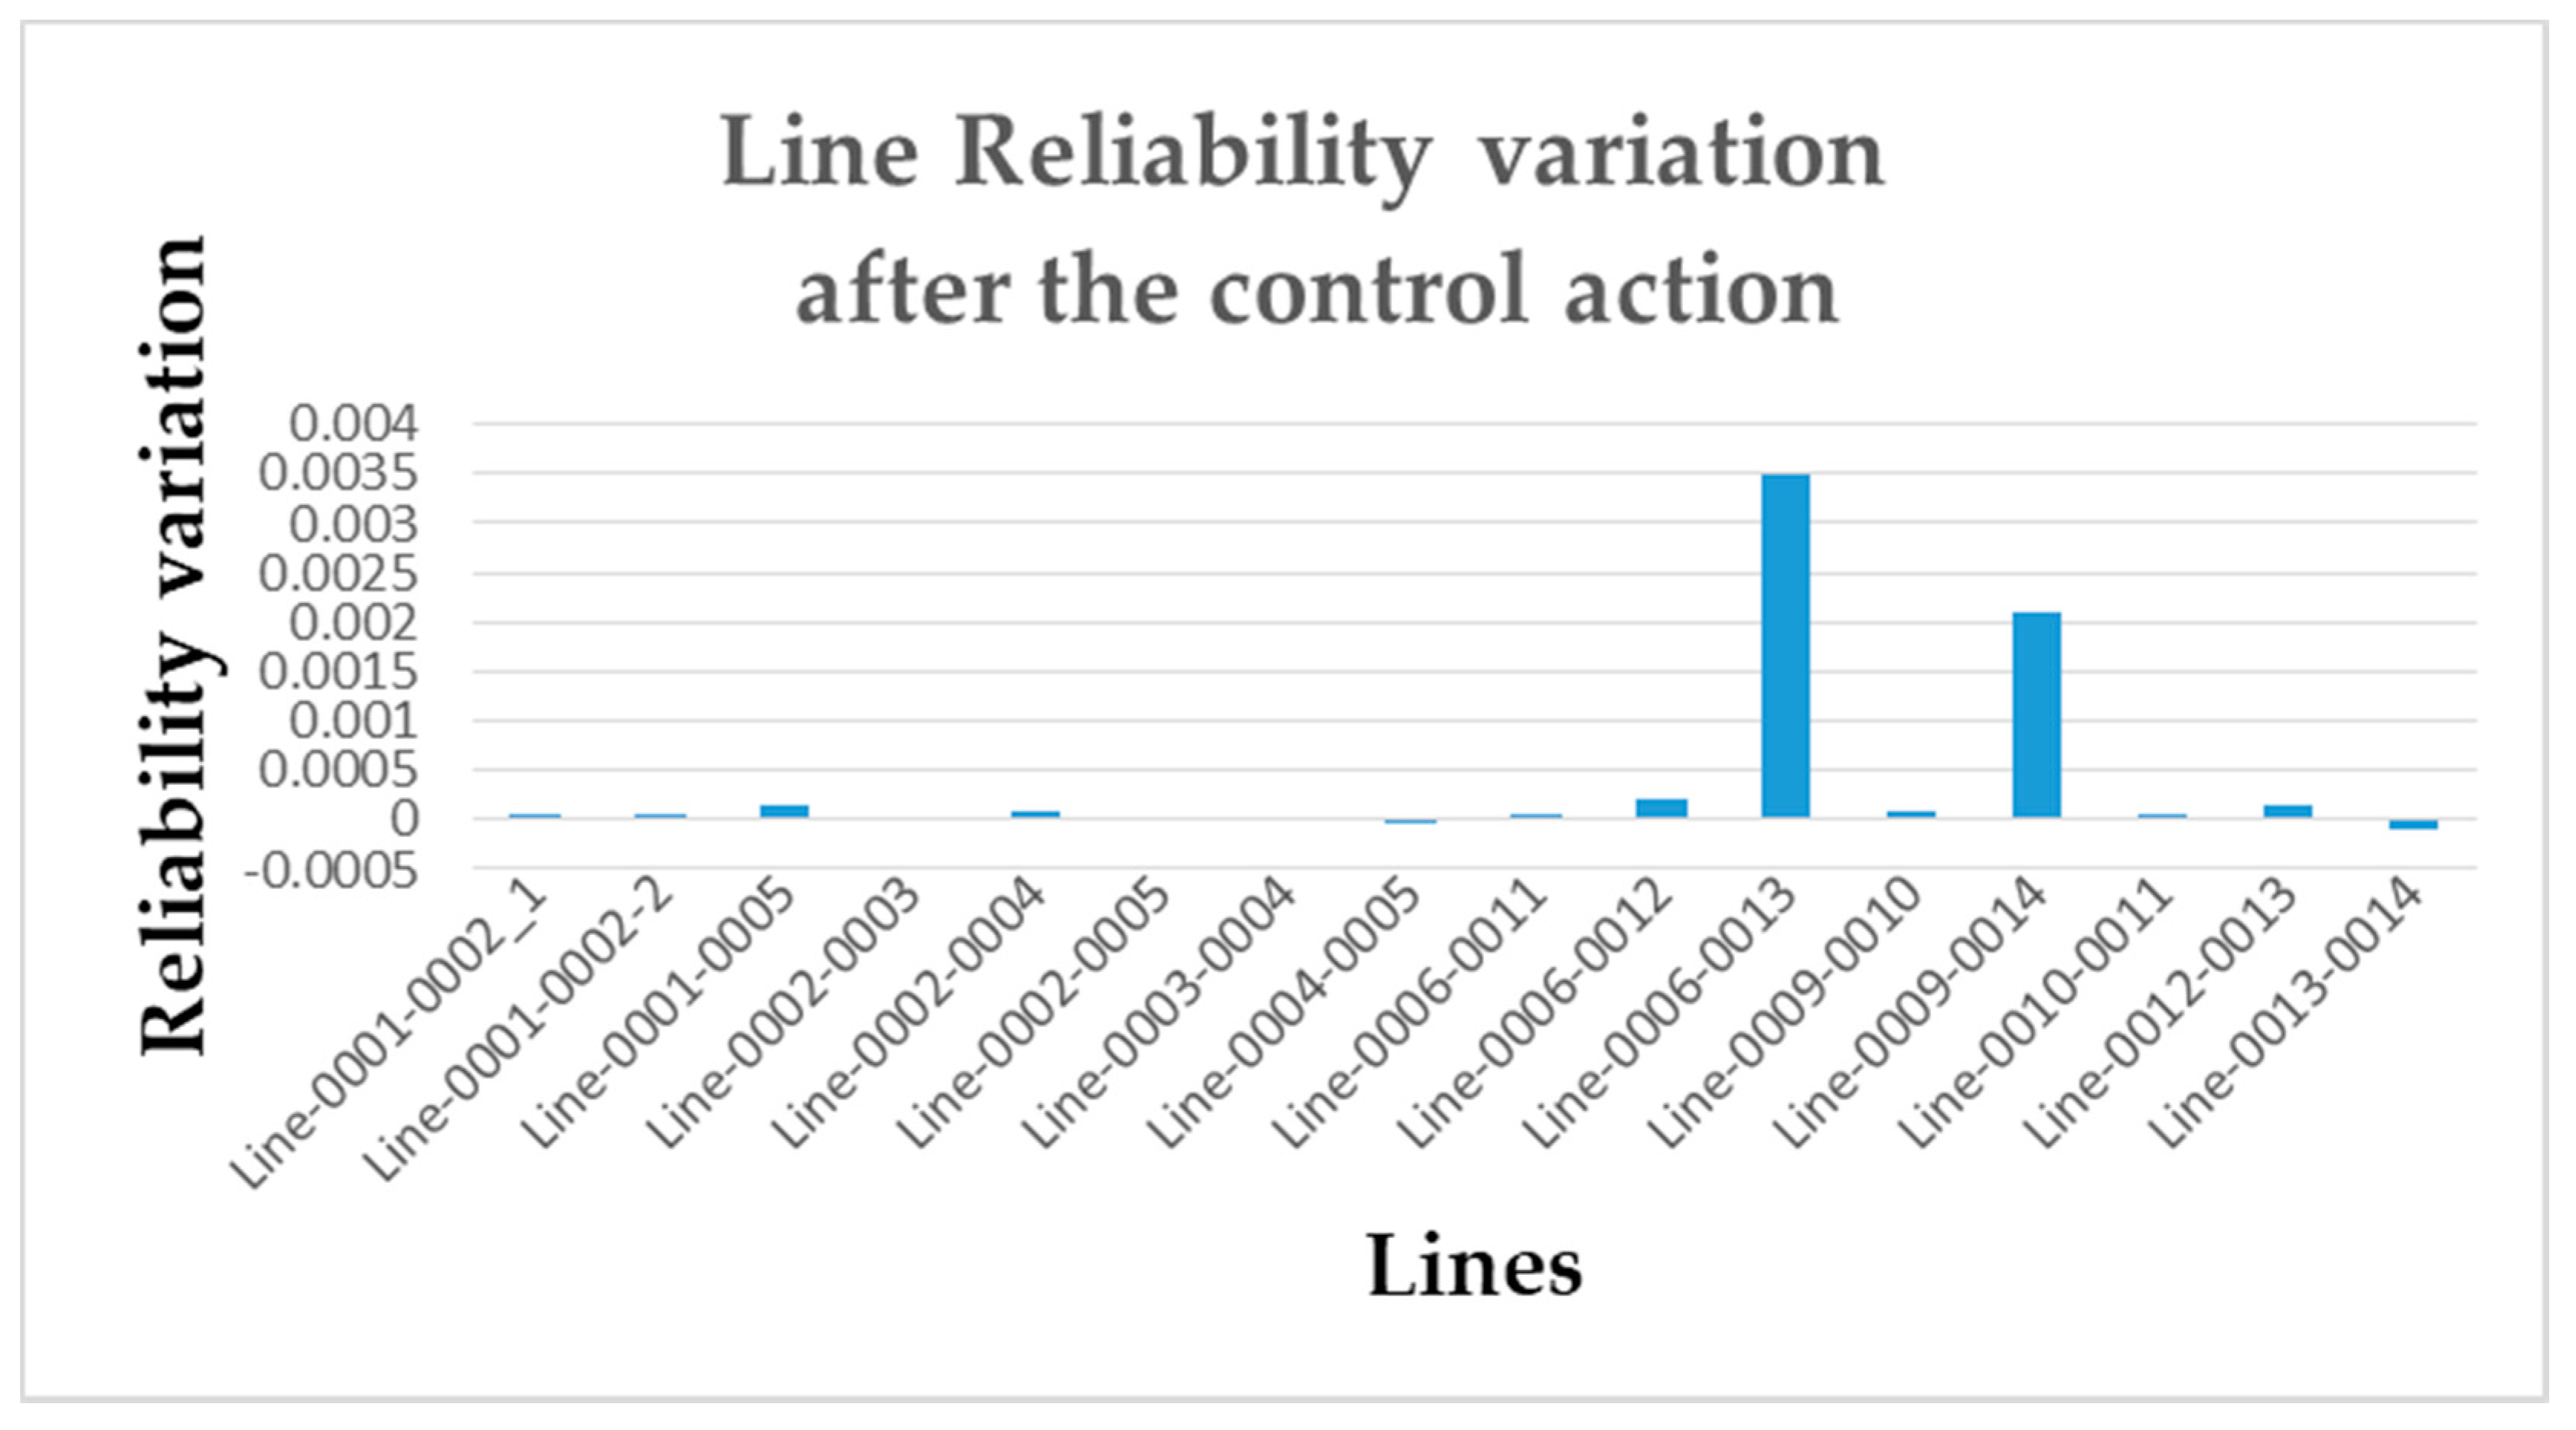
The implemented control action permits forecasting to avoid lines congestion problems. In fact, optimum dispatching among grid resources allows active power management, preventing overloading conditions. Furthermore, the control action determines a positive reliability variation for congested lines and other grid lines. Insignificant reliability worsening occurs only for a few lines. Therefore, the proposed control strategy globally improves line reliability performance as shown in Figure 9.
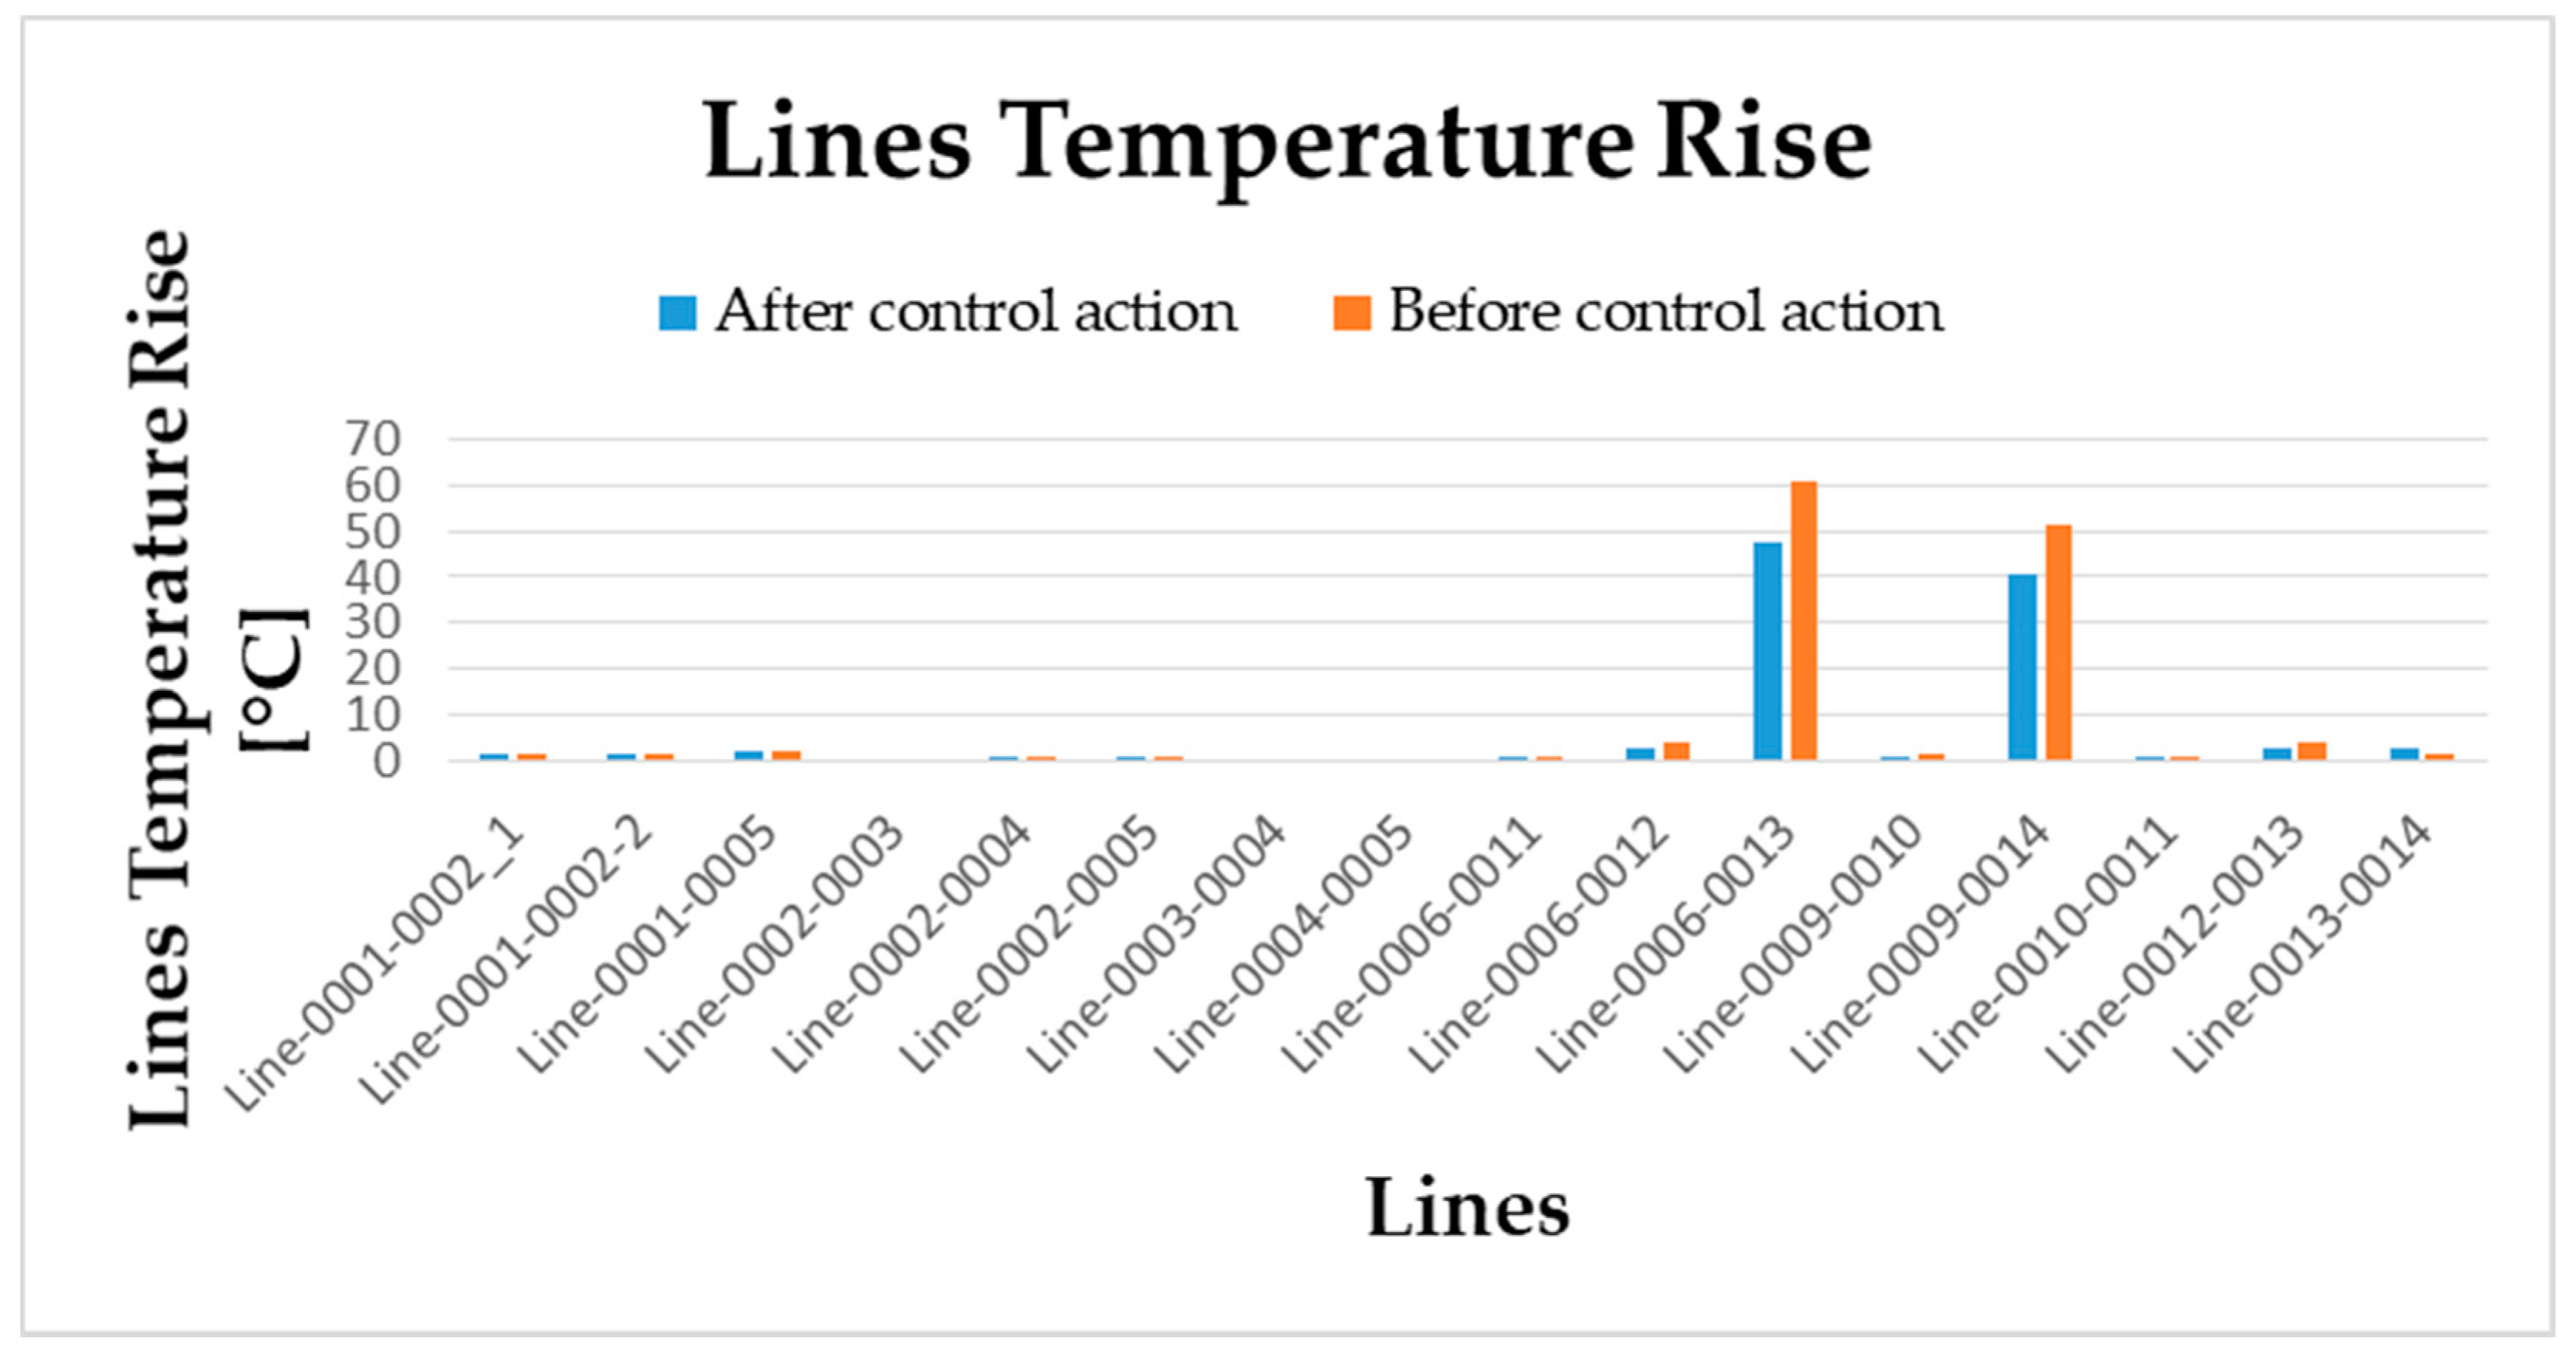
In addition, Figure 10 shows a comparative analysis among line temperature rise before and after control action. Temperature rises tend to decrease for each grid line, especially in the case of congested lines where temperature decrease is approximately 10 °C.
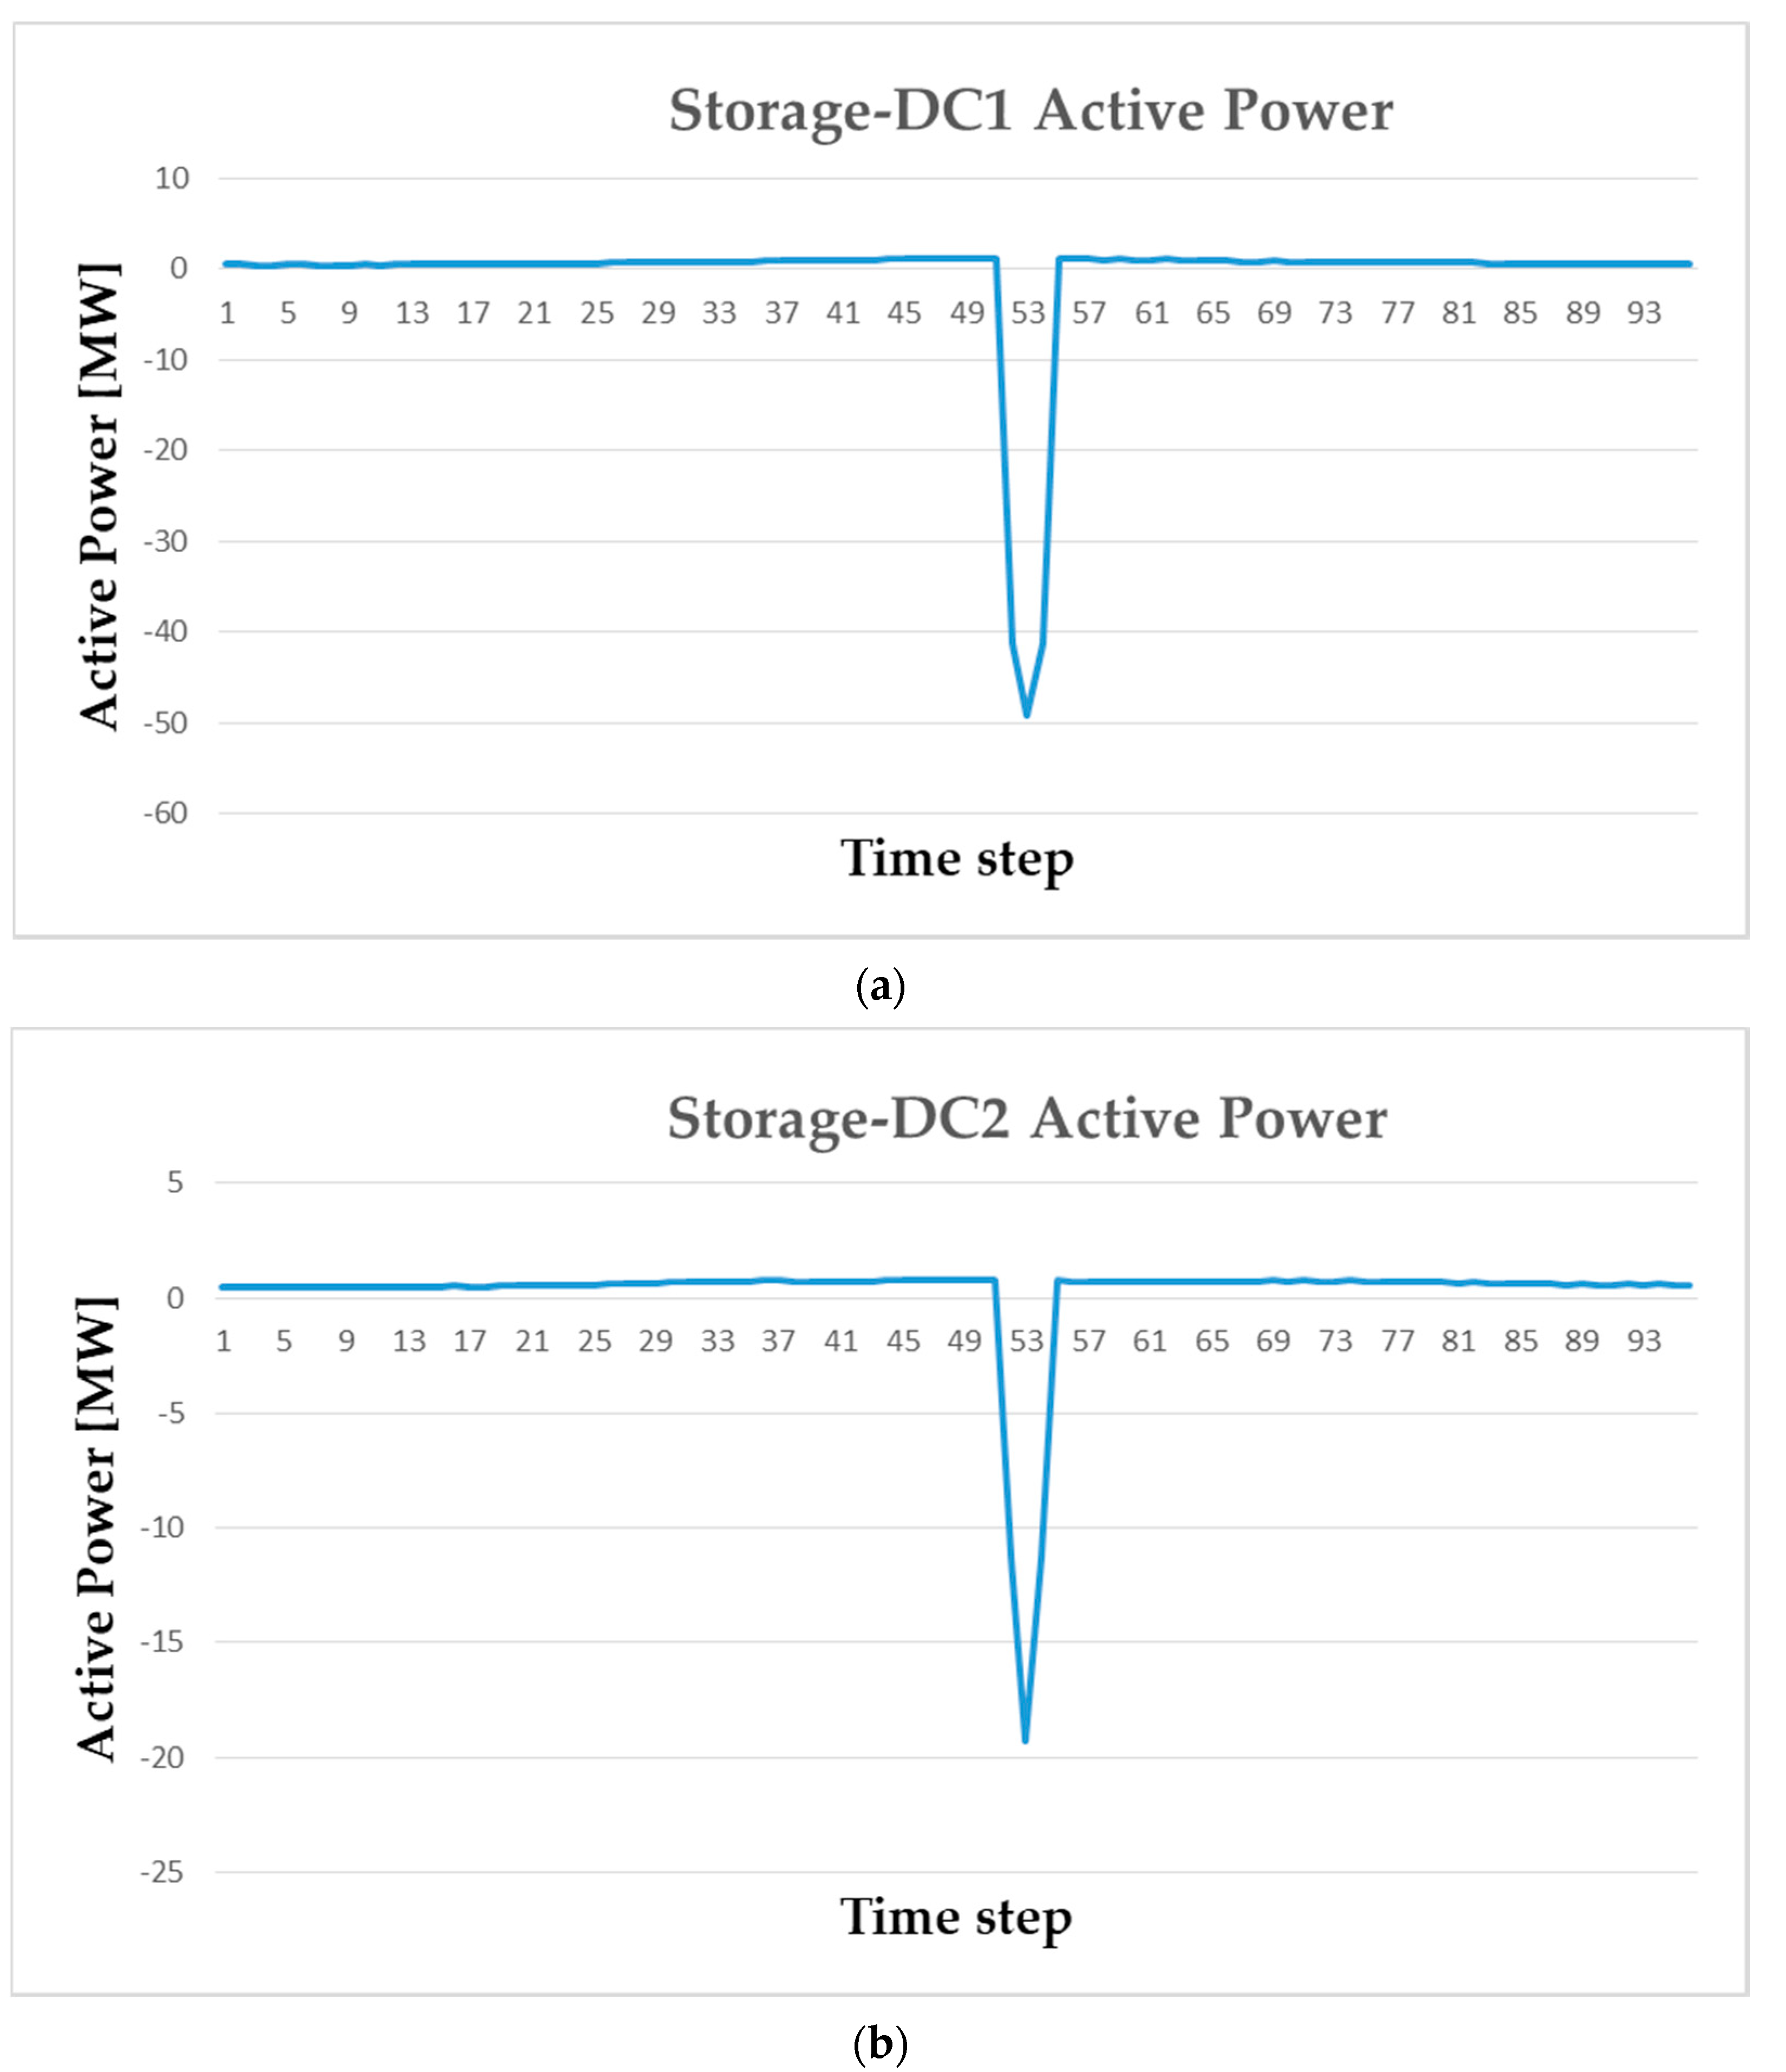
Finally, the proposed control is able to localize the instability event and solve it by optimum involvement of local available resources. In the analyzed case study, the congestion issue is due to high RES introduction in the main AC grid. Since RES are connected to DC buses, the congestion control avoids a line overloading event due to renewables generation involving storage systems connected to DC buses, as shown in Figure 11.
5. Discussion
The developed planning tool to forecast and avoid congestion events implements a strategy also able to improve overhead line reliability. It is characterized by the novel concept of solving the issues by prioritizing grid resources closely placed to the cause of the critical events. As shown in the considered case study, congestion issues caused by renewables are solved involving a local storage resource. This approach permits minimization of the critical event’s impact on the hybrid power system lines, assuring reliability performance improvement.
6. Conclusions
In this paper, a planning tool for congestion events forecasting and reliability assessment in the case of overhead lines is developed with particular attention to a novel energy paradigm represented by hybrid grids. Line electro-thermal models and reliability prediction formulas are implemented to correctly carry out real and synthetic grid load flow analysis.
A congestion strategy is proposed. It represents a novel control logic since a “closed-congestion” approach is activated to optimally dispatch active power among grid resources near the congested overhead line, with a limited impact on the hybrid AC/DC grid.
The methodology validation is carried out considering a modified IEEE 14-Bus system to permit RES introduction and DC bus connection to the main AC grid. The obtained hybrid grid permits analysis of a high RES penetration scenario. Results demonstrate the proposed strategy effort in avoidance of congestion events, also determining line reliability improvement for the congested lines and the whole hybrid grid. The tool could represent promising software to support VPPs agents and aggregators to forecast criticalities and reliability performance in order to provide ancillary services.
Author Contributions
Conceptualization: G.A. and R.C.; methodology: G.A. and R.C.; model implementation: G.A. and R.C.; data curation: G.A., R.C., G.G., A.R. and M.V.; writing, review and editing: G.A., R.C., G.G., A.R. and M.V. All authors have read and agreed to the published version of the manuscript.
Funding
This research was funded by the Research Fund for the Italian Electrical System under the Contract Agreement “Accordo di Programma 2019–2021—PTR_19_21_ENEA_PRG_10” between ENEA and the Ministry of Economic Development.
Institutional Review Board Statement
Not applicable.
Informed Consent Statement
Not applicable.
Data Availability Statement
Not applicable.
Conflicts of Interest
The authors declare no conflict of interest.
References
- Dehnavi, E.; Abdi, H. Determining Optimal Buses for Implementing Demand Response as an Effective Congestion Management Method. IEEE Trans. Power Syst. 2016, 32, 1. [Google Scholar] [CrossRef]
- Yuan, C.; Hu, C.; Li, T. Review of Congestion Management Methods for Power Systems. IOP Conf. Ser. Earth Environ. Sci. 2019, 233, 032025. [Google Scholar] [CrossRef]
- Pillay, A.; Prabhakar Karthikeyan, S.; Kothari, D.P. Congestion management in power systems—A review. Int. J. Electr. Power Energy Syst. 2015, 70, 83–90. [Google Scholar] [CrossRef]
- Jin, M.; Song, Y.H.; Qiang, L.; Shengwei, M. Dynamic Congestion Management in Open Electricity Markets. Autom. Electr. Power Syst. 2004, 10, 23–28. [Google Scholar]
- Ciavarella, R.; Di Somma, M.; Graditi, G.; Valenti, M. Congestion Management in distribution grid networks through active power control of flexible distributed energy resources. In Proceedings of the 2019 IEEE Milan PowerTech, Milan, Italy, 23–27 June 2019; pp. 1–6. [Google Scholar]
- Shariatkhah, M.H.; Haghifam, M.R. Using feeder reconfiguration for congestion management of smart distribution network with high DG penetration. In Proceedings of the CIRED 2012 Workshop: Integration of Renewables into the Distribution Grid, Lisbon, Portugal, 29–30 May 2012; pp. 1–4. [Google Scholar]
- Graditi, G.; Ciavarella, R.; Di Somma, M.; Valenti, M. A control strategy for participation of DSO flexible resources in TSO ancillary services provision. In Proceedings of the ICCEP 2019: 7th International Conference on Clean Electrical Power: Renewable Energy Resources Impact, Otranto, Italy, 2–4 July 2019; pp. 586–592. [Google Scholar]
- Dolan, M.J.; Davidson, E.M.; Kockar, I.; Ault, G.W.; McArthur, S.D.J. Reducing Distributed Generator Curtailment Through Active Power Flow Management. IEEE Trans. Smart Grid 2014, 5, 149–157. [Google Scholar] [CrossRef]
- Hirth, L.; Ueckerdt, F.; Edenhofer, O. Integration costs revisited—An economic framework for wind and solar variability. Renew. Energy 2015, 74, 925–939. [Google Scholar] [CrossRef]
- NI, L.; WEN, F.; LIU, W.; MENG, J.; LIN, G.; DANG, S. Congestion management with demand response considering uncertainties of distributed generation outputs and market prices. J. Mod. Power Syst. Clean Energy 2017, 5, 66–78. [Google Scholar] [CrossRef] [Green Version]
- Hazra, J.; Das, K.; Seetharam, D.P. Smart grid congestion management through demand response. In Proceedings of the 2012 IEEE Third International Conference on Smart Grid Communications (SmartGridComm), Tainan, Taiwan, 5–8 November 2012; pp. 109–114. [Google Scholar]
- Sagwal, R.; Kumar, A. Congestion Management Solution for Hybrid System Considering Voltage Stability Margin. Procedia Technol. 2016, 25, 726–734. [Google Scholar] [CrossRef] [Green Version]
- Asija, D.; Choudekar, P. Congestion management using multi-objective hybrid DE-PSO optimization with solar-ess based distributed generation in deregulated power Market. Renew. Energy Focus 2021, 36, 32–42. [Google Scholar] [CrossRef]
- Billinton, R.; Allen, R.N. Reliability Assessment of Large Electric Power Systems; Kluwer Academic Publishers: Norwell, MA, USA, 1988. [Google Scholar]
- Adinolfi, G.; Ciavarella, R.; Merola, A. Analisi e Valutazione Preliminare Delle Problematiche di Affidabilità Delle reti di Distribuzione Ibride AC/DC; Deliverable RdS/PTR2019/159, PROJECT 2.7 Contract Agreement “Accordo di Programma 2019–2021—PTR_19_21_ENEA_PRG_10”; ENEA and the Ministry of Economic Development: Roma, Italy, 2019. [Google Scholar]
- Adinolfi, G.; Atrigna, M.; Ricca, A.; Valenti, M. Studio Degli Standard e Analisi dei Modelli di Riferimento per la Stima Dell’affidabilità di Componenti e Apparati Delle reti Ibride AC/DC; Deliverable RdS/PTR2019/160, PROJECT 2.7 Contract Agreement “Accordo di Programma 2019–2021—PTR_19_21_ENEA_PRG_10”; ENEA and the Ministry of Economic Development: Roma, Italy, 2019. [Google Scholar]
- Passarelli, G. Modelli Affidabilistico-Diagnostici per i Componenti Delle reti Elettriche; Alma Mater Studiorum—Università di Bologna: Bologna, Italy, 2008. [Google Scholar]
- Allan, R.N.; Billinton, R.; Breipohl, A.M.; Grigg, C.H. Bibliography on the application of probability methods in power system reliability evaluation. IEEE Trans. Power Syst. 1999, 14, 51–57. [Google Scholar] [CrossRef]
- Allan, R.N.; Bhuiyan, M.R. Effects of failure and repair process distribution on composite system adequacy indices in sequential Monte Carlo simulation. In Proceedings of the Joint International IEEE Power Conference, Power Tech, Los Alamitos, CA, USA, 5–8 September 1993; pp. 622–628. [Google Scholar]
- Haasl, D.F.; Roberts, N.H.; Vesely, W.E.; Goldberg, F.F. Fault Tree Handbook; Office of Nuclear Regulatory Research: Washington, DC, USA, 1981. [Google Scholar]
- Dugan, J.B.; Bavuso, S.J.; Boyd, M.A. Dynamic fault-tree models for fault-tolerant computer systems. IEEE Trans. Reliab. 1992, 41, 363–377. [Google Scholar] [CrossRef] [Green Version]
- Rao, K.D.; Rao, V.V.S.S.; Verma, A.K.; Srividya, A. Dynamic Fault Tree Analysis: Simulation Approach BT—Simulation Methods for Reliability and Availability of Complex Systems; Faulin, J., Juan, A.A., Martorell, S., Ramírez-Márquez, J.-E., Eds.; Springer: London, UK, 2010; pp. 41–64. ISBN 978-1-84882-213-9. [Google Scholar]
- Stamatis, D.H. Failure Mode and Effect Analysis: FMEA from Theory to Execution; ASQ Quality Press: Milwaukee, WI, USA, 2003. [Google Scholar]
- Ibe, O. Continuous-Time Markov Chains. In Markov Processes for Stochastic Modeling, 2nd ed.; Elsevier: Oxford, UK, 2013; pp. 85–102. [Google Scholar]
- Enescu, D.; Colella, P.; Russo, A. Thermal Assessment of Power Cables and Impacts on Cable Current Rating: An Overview. Energies 2020, 13, 5319. [Google Scholar] [CrossRef]
- Graditi, G.; Di Somma, M.; Ciavarella, R.; Valenti, M.; Cigolotti, V.; Kadam, S.; Brunner, H.; Sosnina, M.; Khavari, A.; Calin, M.; et al. “Project Handbook (DoW)” Deliverable D1.5 INTERPLAN Project; European Commission: Brussels, Belgium, 2018. [Google Scholar]
- Defense Standardization Program Office (DSPO). Reliability Prediction of Electronic Equipment (Military Handbook); Department of Defense: Washington, DC, USA, 1991; p. 205. [Google Scholar]
- Graditi, G.; Adinolfi, G. Temperature influence on photovoltaic power optimizer components reliability. In Proceedings of the International Symposium on Power Electronics Power Electronics, Electrical Drives, Automation and Motion, Sorrento, Italy, 19 June–22 July 2012; pp. 1113–1118. [Google Scholar]
- Scognamiglio, A.; Adinolfi, G.; Graditi, G.; Saretta, E. Photovoltaics in Net Zero Energy Buildings and Clusters: Enabling the Smart City Operation. Energy Procedia 2014, 61, 1171–1174. [Google Scholar] [CrossRef] [Green Version]
- Catelani, M.; Ciani, L.; Graditi, G.; Adinolfi, G. Measurement and Comparison of Reliability Performance of Photovoltaic Power Optimizers for Energy Production. Metrol. Meas. Syst. 2015, 22, 139–152. [Google Scholar] [CrossRef]
Figure 1.
Power line lumped-parameter model.

Figure 2.
Short line equivalent circuit model.

Figure 3.
Planning tool schematic representation.

Figure 4.
Grid Congestion Management and Lines Reliability Evaluation—main functionalities.

Figure 5.
IEEE 14 Bus System.

Figure 6.
Hybrid IEEE 14-Bus System.

Figure 7.
Max line loading per each time step: congested scenario.

Figure 8.
Max Line Loading per each time step before and after control action.

Figure 9.
Line reliability variation after the control action.

Figure 10.
Line temperature rise comparison.

Figure 11.
Storage systems operating conditions: (a) Storage-DC1; (b) Storage-DC2.

Publisher’s Note: MDPI stays neutral with regard to jurisdictional claims in published maps and institutional affiliations. |
© 2021 by the authors. Licensee MDPI, Basel, Switzerland. This article is an open access article distributed under the terms and conditions of the Creative Commons Attribution (CC BY) license (https://creativecommons.org/licenses/by/4.0/).
Share and Cite
MDPI and ACS Style
Adinolfi, G.; Ciavarella, R.; Graditi, G.; Ricca, A.; Valenti, M. A Planning Tool for Reliability Assessment of Overhead Distribution Lines in Hybrid AC/DC Grids. Sustainability 2021, 13, 6099. https://doi.org/10.3390/su13116099
AMA Style
Adinolfi G, Ciavarella R, Graditi G, Ricca A, Valenti M. A Planning Tool for Reliability Assessment of Overhead Distribution Lines in Hybrid AC/DC Grids. Sustainability. 2021; 13(11):6099. https://doi.org/10.3390/su13116099
Chicago/Turabian StyleAdinolfi, Giovanna, Roberto Ciavarella, Giorgio Graditi, Antonio Ricca, and Maria Valenti. 2021. "A Planning Tool for Reliability Assessment of Overhead Distribution Lines in Hybrid AC/DC Grids" Sustainability 13, no. 11: 6099. https://doi.org/10.3390/su13116099
Note that from the first issue of 2016, this journal uses article numbers instead of page numbers. See further details here.