
Investor Sentiment and Price Discrepancies between Common and Preferred Stocks in Korea


1
Department of Global Economics and Commerce, Dongguk University-Gyeongju, Gyeongju-si 38066, Korea
2
College of General Education, Kookmin University, Seoul 02707, Korea
*
Author to whom correspondence should be addressed.
Sustainability 2021, 13(10), 5539; https://doi.org/10.3390/su13105539
Submission received: 19 April 2021
/
Revised: 11 May 2021
/
Accepted: 11 May 2021
/
Published: 15 May 2021
(This article belongs to the Special Issue The 4th Industrial Revolution, Financial Markets and Economic Development)
Abstract
:We examine whether investor sentiment affects price discrepancies between preferred and common stocks, based on a sample of Korean firms that issue preferred stocks. While most research has focused on corporate finance features such as voting rights, we examine price discrepancies as a behavioral finance feature from a new perspective. Based on the investor sentiment index, as investor sentiment increases, price discrepancies between preferred and common stocks widen in the KOSPI market. These findings confirm that investor sentiment—not merely voting premiums, cash flow rights, and liquidity—is a significant factor in explaining price discrepancies between preferred and common stocks in Korea.
Keywords:
investor sentiment; dual-class share; preferred stock; price discrepancies; emerging marketJEL Classification:
G10; G32; G411. Introduction
Different types of stock issued by the same firms in the same stock market have been used as valuable tools by many researchers demonstrating evidence related to agency problems (costs), ownership, voting right or premiums, and private benefits in the finance field [1,2,3,4].
Accordingly, the price discrepancies of dual-class shares are regarded as the value of the voting premium [5,6]. While most research focuses on the corporate finance features mentioned above, we examine price discrepancies as a behavioral finance feature from a new perspective. Although voting rights, private benefits, and agency costs can explain a large part of price discrepancies between different types of stock issued by the same company, an unexplained part remains.
Meanwhile, Baker and Wurgler [7] focused on the irrational movements of asset prices in the financial market using the investor sentiment index. Many studies on behavioral finance have suggested that investor sentiment can be a pricing factor [8,9,10,11]. To follow this trend, we examine whether investor sentiment can be a significant factor in explaining price discrepancies between different stock types issued by the same company in Korea, even after controlling the effects of voting premium, liquidity, and other corporate finance factors.
We use 85 listed, traded preferred stocks and (matched) common stocks issued by companies in the Korean stock market, especially KOSPI, to examine whether investor sentiment can help explain the price discrepancies between different shares issued by the same company. We empirically demonstrate, using daily data, that investor sentiment can help explain part of the price discrepancies between preferred and common stocks in Korea.
Our first and unique contribution is that, unlike the previous studies, we suggest the investor sentiment concept as a missing piece that is not explained by corporate finance features. To the best of our knowledge, this is the first major paper to investigate the effects of investor sentiment on price discrepancies. Second, we argue that our findings shed light on price discrepancies focused on behavior finance features, indicating that other factors can exist for price discrepancies. Third, our empirical results contribute to the literature on investor sentiment, voting premiums, agency problems, and private benefits. Fourth, the discussion of this paper suggests the potential for further inquiry.
The remainder of this paper is organized as follows. Section 2 describes the characteristics of preferred stocks in Korea, including the theoretical background on the price discrepancies between preferred and common stocks. Section 3 presents our data construction, calculation of variables (especially investor sentiment index), and empirical analysis model. Section 4 describes our empirical results. Finally, Section 5 concludes the paper.
2. Preferred Stocks in Korea and Price Discrepancies
Strictly speaking, dual-class shares do not exist in the Korean stock market, and they are not the same as preferred stocks in the U.S. However, some preferred stocks in Korea work similar to dual-class shares. Based on each company’s articles of association, preferred stockholders can obtain equal to or greater than the minimum dividends in any circumstance, as well as “no” voting rights. Usually, the preferred stock dividend ratio is higher than the common stock dividend ratio in Korea. However, the cash dividend for preferred stocks is similar to the cash dividend for common stocks in Korea. This is why preferred stocks in Korea feature dual-class shares in the U.S. Moreover, whereas each U.S. company with dual-class shares has a different voting right system, preferred stocks in Korea have no voting rights. Only one type of common stock exists per company in the Korean stock market, with only one voting right per share. Accordingly, we believe that this feature facilitates the construction of the research setting.
Theoretically, the difference between common and preferred stock prices is determined by the difference between the dividend ratio and voting right. Furthermore, preferred stock has only a senior residual claim right. The role of the different dividend ratios reduces the price discrepancies, and the value of the voting right increases the price discrepancies. The difference in cash dividend is negatively related, and the value of voting right is positively related to the price discrepancies. We summarize the characteristics comparison of preferred and common stocks in Korea in Table 1.
The price discrepancies between common and preferred stocks are expressed by Equation (1).
where VC is the value of common stocks, VP is the value of preferred stocks, VV is the value of the voting right (premium), VC.D is the value of the dividend payout of common stocks, VP.D is the value of the dividend payout of preferred stocks, and VR is the value of preferred stocks’ right (as in a senior residual claim right, except a cash dividend right).
We examine only KOSPI stocks (most are in KOSPI 200), which indicates we can ignore very small liquidation and residual claim values because they are blue-chip stocks. Usually, the (cash) dividend per share for common and preferred stocks is almost identical (equal or close to ₩1–₩2 Korean Won, $0.0009–$0.0018) in Korea; the dividend payout ratio difference is the result of the price discrepancies, although DPS is identical. Consequently, the dividend payout ratio cannot be a factor in the price discrepancies between common stocks and preferred stocks. In contrast, considering the lead-lag relationship, the differences in dividend payout ratio result from price discrepancies. Taken together, should be equal to zero.
In other words, common and preferred stocks’ essential differences are (cash) dividends, voting rights, and some additional rights in the article of association in Korea. According to Zingales [12], voting rights are worth almost as much as dividend rights in Italy. Moreover, the value of the voting right is directly and significantly related to the value of control. Nenova [1] suggests that the value of the voting premium is based on the size of the private benefits, and that firms in Korea have the highest average value of control-block votes (48%). Therefore, firm size can be a primary factor for explaining the size of price discrepancies between common and preferred stocks in Korea. However, although we assume the value of control is extremely high, the exceptionally high price discrepancies between common and preferred stocks cannot be explained by the difference in voting rights in Korea.
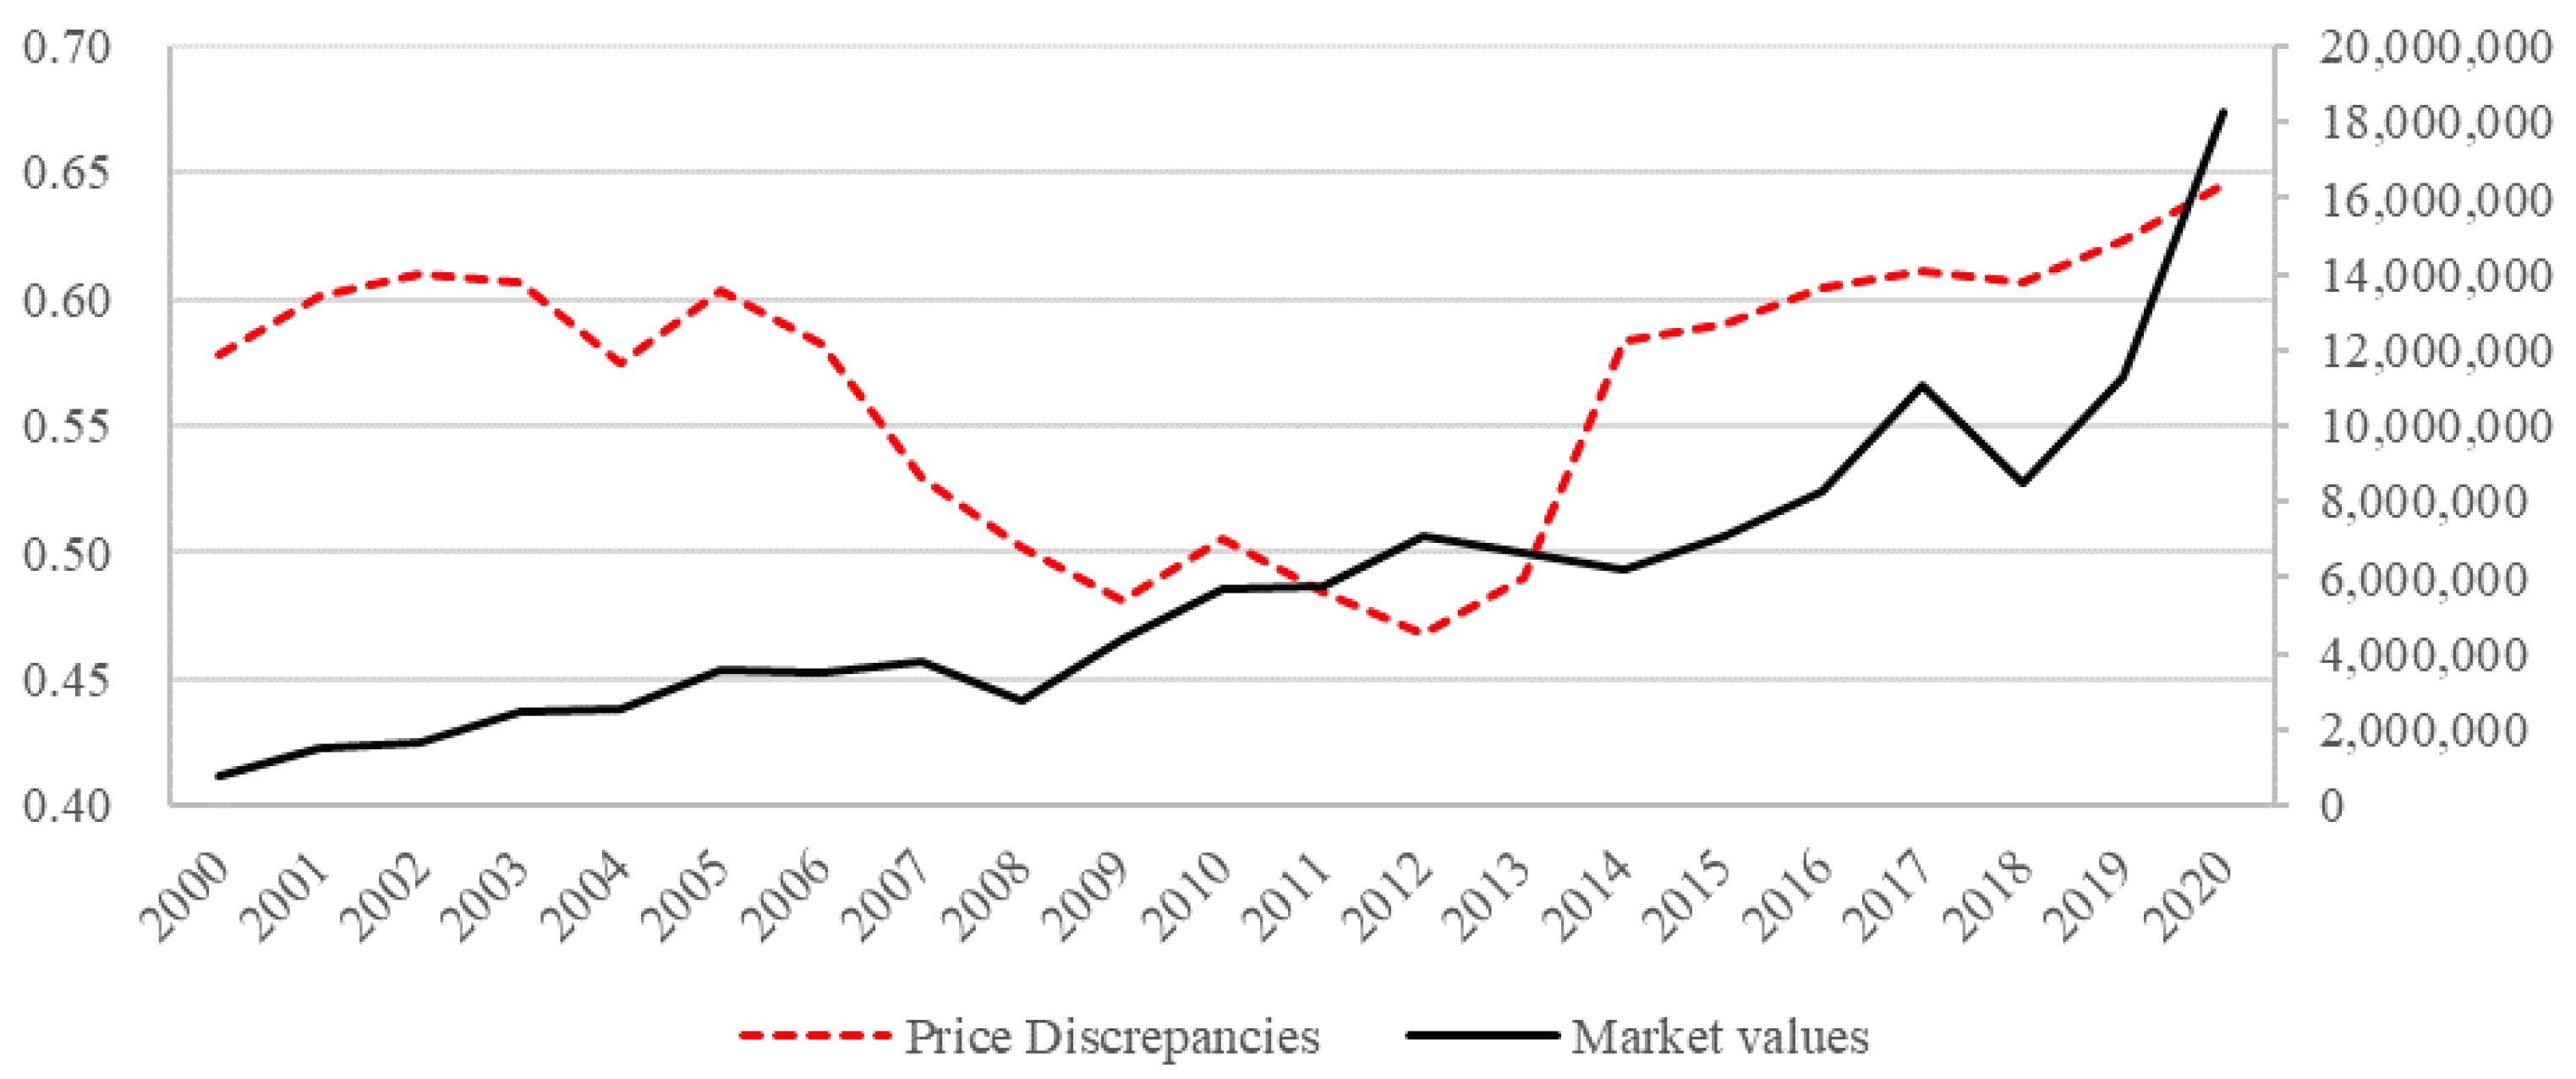
Assuming that voting premium creates the majority of the difference in preferred and common stock prices in Korea, the increase in stock price and firm value over time indicates that, if an identical differential ratio between preferred and common stocks is maintained, the size of voting premium remains large due to the increase in firm size (market values or assets). If so, their movement pattern should be similar or at least should not move in the opposite direction, in contrast to what the evidence shows.
In this context, we intuitively and graphically compare the relationship between price discrepancies of market values (assets) by year. Figure 1 and Figure 2 indicate the movement of price discrepancies and market values (assets). The dashed-dotted line indicates the average price discrepancies of preferred and common stocks (primary y-axis). The solid line indicates the firm size calculated by market values or total assets (secondary y-axis). Figure 1 and Figure 2 illustrate that proxies of firm size are increasing by year. However, the price discrepancy ratio does not behave accordingly. This result implies that the price discrepancies between preferred and common stocks are not fully explained by voting premium, requiring additional factors.
Neumann [13] suggests that, in Denmark, the price difference between dual-class stocks does not reflect voting premium but rather liquidity. More generally, there may be other factors that explain the price discrepancies. Therefore, we suggest that investor sentiment is a candidate for price discrepancies because individual investors represent a substantial portion of the stock market—they are regarded as speculators (noisy and uninformed traders), and their stock market participation can change the decision of corporations in Korea [14]. Moreover, we believe that the Korean market can provide superior and credible data as a leading emerging market. By changing the notation from Value (VC, VP) to Price (PC, PP) in the left hand side of Equation (1), and reflecting the above arguments, we can derive Equation (2):
3. Data and Methods
The daily data (based on trading day) used in this study are from FnGuide. We identify the sample of preferred-stock-issuing firms using the last digit or character in the stock code. In the Korea Exchange (KRX), a stock code that ends with “0” indicates a common stock; a code that ends with “5”, “7”, “9”, “K”, “L”, or “M” indicates a preferred stock. Starting with eligible firms that are preferred-stock-issuing firms listed on the KOSPI market, we exclude observations with missing data that may have arisen for any reason. We also exclude other preferred stocks except for a last digit in the stock code of “5”; because the other preferred stocks had features that deviated from our assumptions in Section 2. Moreover, most of the existing preferred stocks’ last-digit code was “5”.
Furthermore, we use adjusted stock prices for corporate events such as stock splits, share issuance, and stock repurchases. We exclude preferred stocks whose price was higher than the common stock price because it indicates the possibility that some events are not reflected correctly. Consequently, we construct a one-to-one matching between preferred and common stocks in the same company. Moreover, each pair of shares had almost the same cash dividend and different voting rights in our sample. Therefore, our final sample included 85 firms (170 stocks, 5183 trading days, and 325,198 observations) spanning from 3 January 2000, to 30 December 2020.
For this study, we construct an individual stock-level sentiment index based on the methods proposed by Baker and Wurgler [7] and Ryu, Ryu, and Yang [14]. We extract five investor sentiment factors: the relative strength index (RSI), which measures overbought (or oversold) market conditions based on 14 trading days [15,16]; the psychological line index (PLI), which measures the psychological stability of investors, and overbought (or oversold) market conditions based on 12 trading days [17]; the logarithm of trading volume (LTV), which represents investors’ various opinions on the overall stock market or each individual stock [7,18,19]; the adjusted turnover rate (ATR), which determines whether investor sentiment is optimistic or pessimistic [18,20]; and the buy-sell imbalance of individual investors (IBSI), which measures individual investors’ behavior in the Korean stock market [14,21,22,23]. We summarize the definitions of factors for the investor sentiment index in Table 2.
Considering the five proxies simultaneously, we use a principal component analysis and constructed a composite investor sentiment index (Si,t) by extracting the first principal component and evaluating each individual stock (i), as shown in Equation (3):
where Pi,RSI, Pi,PLI, Pi,LTV, Pi,ATR, and Pi,IBSI are the loadings of the first principal component. We subsequently eliminat the portion explained by the market risk factor and adopted the residual (εi,t) as our sentiment measure for individual stock (i) in Equation (4).
where MKTt is the stock market excess return calculated by KOSPI market returns after subtracting the risk-free rate at time t. For testing the effects of investor sentiment, we estimate the following:
where Price discrepanciesi,t is the price discrepancies ratio between preferred and common stocks for firm i, at time t. The calculation method was inspired by Zingales (1994, 1995). Sentimenti,t denotes the investor sentiment measure for stock i, at time t. We control variables that may affect the price discrepancies, trading volume differential (Volume), outstanding shares differential (Outstanding) between preferred and common stocks, firm size (Size), and leverage (Lev). Volume is the proxies of liquidation, Outstanding indicates how easily control is gained through the market, Size is a proxy for voting premium, and Lev is a proxy for the order of residual claim rights. We suggest the definition of variables in Table 3.
Si,t = Pi,RSI × RSIi,t + Pi,PLI × PLIi,t + Pi,LTV × LTVi,t + Pi,ATR × ATRi,t + Pi,IBSI × IBSIi,t
Si,t = a0 + a1 × MKTt + εi,t
Price discrepanciesi,t = β0 + β1 × ΔSentimenti,t + β2 × ΔVolumei,t + β3 × ΔOutstandingi,t + β4 × Sizei,t + β5 × Levi,t + ei,t
Table 4 illustrates the summary statistics for stock-level variables. In comparing preferred and common stocks, most common stock variables had higher values than those of preferred stocks, except for Sentiment. Panel C of Table 4 presents the differential between preferred and common stocks and firm-level variables used in our empirical analysis.
4. Empirical Results
Table 5 indicates coefficient estimates from the price discrepancies between preferred and common stock regression in Korea. Investor sentiment (Sentiment) has a negative and statistically significant effect on the price discrepancies ratio, consistent with our prediction. Based on the definition of the price discrepancies ratio, the high (low) value indicates that the price discrepancies between preferred and common stock are small (large), and a significant difference in sentiment drives up the price discrepancies between preferred and common stocks in Korea. This result also implies that, ceteris paribus, investor sentiment is a meaningful factor for explaining the price discrepancies.
For the control variables, we also found the interesting result that price discrepancies are: (i) lower when the difference in liquidity (ΔVolume) is higher, consistent with a significant trading volume decrease with the market over-reacting; (ii) higher when the difference in (ΔOutstanding) is higher, indicating that a large number of shares are in the open market that easily collect voting rights through market transactions, decreasing price discrepancies; (iii) lower when firm size (Size) is higher, indicating higher voting premiums when the size of the private benefits is larger; and (iv) higher when leverage (Lev) is higher, consistent with bankruptcy costs increasing the value of safe securities that have a senior right.
Conducting additional analyses, we verified the reliability and robustness of our empirical results, indicating that investor sentiment has significant effects on increasing the price discrepancies between preferred and common stocks in Korea. First, we constructed sub-period samples by year from 2000 to 2020. Second, we used a different dependent variable (proxy) calculated by subtracting the preferred stock price from the common stock price.
Table 6 presents the regression results of the price discrepancies analysis by year. The dependent variable is the price discrepancies ratio, the same as in Table 5, with the sample divided by year. Consequently, we constructed and run the 21 regression analyses by each year. Based on the results, for most of the years, the coefficients of all variables have the same signs and significances, as in Table 5. Most of the analysis results revealed that a difference in investor sentiment has a negatively significant coefficient, consistent with our prediction and reliability in Table 6, except the positively significant results in 2014.
The results for the control variables in Table 7 are also mostly consistent with previous analyses and our predictions. Contrary to the price discrepancies ratio as the dependent variable in Table 5 and Table 6, the interpretation of the price discrepancies calculated by subtracting the preferred stock price from the common stock price suggests the following: a low (high) value indicates that the price discrepancies between preferred and common stock are small (large); however, the signs and significances of the coefficients of the investor sentiment are split. Nonetheless, the result of the complete sample in the last column in Table 7 supports our predictions.
5. Conclusions and Suggestions
This study examines whether investor sentiment can be a significant factor for explaining stock price discrepancies using preferred and common stocks in Korea. Our empirical results suggest that investor sentiment significantly affects price discrepancies—high (low) investor sentiment increases (decreases) price discrepancies. This finding is the primary contribution of our paper. Furthermore, we reconfirm that liquidity, controls, voting premiums, and senior claim rights are the significant explanations for price discrepancies. Our results have implications for future research. For instance, we find that the price discrepancies between common and preferred stocks can be explained by other factors such as investor sentiment.
The following suggestions can be made for further research. First, although our empirical results are still valid, we cannot separate the exact proportions that voting premium, investor sentiment, and other factors comprise in price discrepancies, which suggests the possibility of other factors. Second, the possibility that the effects (or features) of investor sentiment may change the time or market circumstances arises from the results of Table 6; if significant classification criteria are applied, a meaningful result is produced. Third, other investor sentiment proxies and methods would be more suitable for adjustment in related research. Fourth, our argument should be extended to an international context or applied to different stock markets with other dual-class share systems. Fifth, this study uncovered the possibility of price discrepancies even when a majority shareholder (e.g., over 50%) exists, although the voting premium value should be 0. However, we were unable to find the proper research setting for considering this in the present study, so it will be addressed in future research.
Author Contributions
Conceptualization, D.R.; Data curation, D.R.; Formal analysis, D.R.; Methodology, H.Y. and D.R.; Supervision, D.R.; Writing—original draft, H.Y. and D.R.; Writing—review & editing, H.Y. and D.R. All authors have read and agreed to the published version of the manuscript.
Funding
This work was supported by the Dongguk University Research Fund of 2019.
Acknowledgments
We are grateful for the valuable comments of two anonymous referees.
Conflicts of Interest
The authors declare no conflict of interest.
References
- Nenova, T. The value of corporate voting rights and control: A cross-country analysis. J. Financ. Econ. 2003, 68, 325–351. [Google Scholar] [CrossRef]
- Doidge, C.U.S. Cross-listings and the private benefits of control: Evidence from dual-class firms. J. Financ. Econ. 2004, 72, 519–553. [Google Scholar] [CrossRef]
- Masulis, W.R.; Wang, C.; Xie, F. Agency problems at dual-class companies. J. Financ. 2009, 64, 1697–1727. [Google Scholar] [CrossRef]
- Gompers, P.A.; Ishii, J.; Metrick, A. Extreme governance: An analysis of dual-class firms in the United States. Rev. Financ. Stud. 2010, 23, 1051–1088. [Google Scholar] [CrossRef]
- Zingales, L. What determines the value of corporate votes? Q. J. Econ. 1995, 110, 1047–1073. [Google Scholar] [CrossRef]
- Schultz, P.; Shive, S. Mispricing of dual-class shares: Profit opportunities, arbitrage, and trading. J. Financ. Econ. 2010, 98, 524–549. [Google Scholar] [CrossRef]
- Baker, M.; Wurgler, J. Investor sentiment and the cross-section of stock returns. J. Financ. 2006, 61, 1645–1680. [Google Scholar] [CrossRef] [Green Version]
- Kumar, A.; Lee, C.M.C. Retail investor sentiment and return comovements. J. Financ. 2006, 61, 2451–2486. [Google Scholar] [CrossRef]
- Baker, M.P.; Wurgler, J.A. Investor sentiment in the stock market. J. Econ. Perspect. 2007, 21, 129–152. [Google Scholar] [CrossRef] [Green Version]
- Baker, M.; Wurgler, J.; Yuan, Y. Global, local, and contagious investor sentiment. J. Financ. Econ. 2012, 104, 272–287. [Google Scholar] [CrossRef] [Green Version]
- Stambaugh, R.F.; Yu, J.; Yuan, Y. The short of it: Investor sentiment and anomalies. J. Financ. Econ. 2012, 104, 288–302. [Google Scholar] [CrossRef] [Green Version]
- Zingales, L. The value of the voting right: A study of the milan stock exchange experience. Rev. Financ. Stud. 1994, 7, 125–148. [Google Scholar] [CrossRef] [Green Version]
- Neumann, R. Price differentials between dual-class stocks: Voting premium or liquidity discount? Eur. Financ. Manag. 2003, 9, 315–332. [Google Scholar] [CrossRef]
- Ryu, D.; Ryu, D.; Yang, H. Investor sentiment, market competition, and financial crisis: Evidence from the Korean stock market. Emerg. Mark. Financ. Trade 2020, 56, 1804–1816. [Google Scholar] [CrossRef]
- Chong, T.T.-L.; Ng, W.-K. Technical analysis and the London stock exchange: Testing the MACD and RSI rules using the FT30. Appl. Econ. Lett. 2008, 15, 1111–1114. [Google Scholar] [CrossRef]
- Chen, H.; Chong, T.T.-L.; Duan, X. A principal-component approach to measuring investor sentiment. Quant. Financ. 2010, 10, 339–347. [Google Scholar] [CrossRef]
- Yang, C.; Gao, B. The term structure of sentiment effect in stock index futures market. N. Am. J. Econ. Financ. 2014, 30, 171–182. [Google Scholar] [CrossRef]
- Baker, M.; Stein, J. Market liquidity as a sentiment indicator. J. Financ. Mark. 2004, 7, 271–299. [Google Scholar] [CrossRef] [Green Version]
- Liao, T.-L.; Huang, C.-J.; Wu, C.-Y. Do fund managers herd to counter investor sentiment? J. Bus. Res. 2011, 64, 207–212. [Google Scholar] [CrossRef]
- Yang, C.; Zhang, R. Does mixed-frequency investor sentiment impact stock returns? Based on the empirical study of MIDAS regression model. Appl. Econ. 2014, 46, 966–972. [Google Scholar] [CrossRef]
- Kim, K.; Ryu, D.; Yang, H. Investor sentiment, stock returns, and analyst recommendation changes: The KOSPI stock market. Invest. Anal. J. 2019, 48, 89–101. [Google Scholar] [CrossRef]
- Ryu, D.; Kim, H.; Yang, H. Investor sentiment, trading behavior and stock returns. Appl. Econ. Lett. 2017, 24, 826–830. [Google Scholar] [CrossRef]
- Yang, H.; Ryu, D.; Ryu, D. Investor sentiment, asset returns and firm characteristics: Evidence from the Korean stock market. Invest. Anal. J. 2017, 46, 132–147. [Google Scholar] [CrossRef]
Figure 1.
Movement of market values and price discrepancies by year. Notes: The average of price discrepancies (ratio) calculated by the adjusted preferred stock price divided by the adjusted common stock price.
Figure 1.
Movement of market values and price discrepancies by year. Notes: The average of price discrepancies (ratio) calculated by the adjusted preferred stock price divided by the adjusted common stock price.

Figure 2.
Movement of total assets and price discrepancies by year. Notes: The average of price discrepancies (ratio) calculated by the adjusted preferred stock price divided by the adjusted common stock price.
Figure 2.
Movement of total assets and price discrepancies by year. Notes: The average of price discrepancies (ratio) calculated by the adjusted preferred stock price divided by the adjusted common stock price.


Table 1.
Characteristics comparison of preferred and common stocks in Korea.
| Type | Cash Flow Rights | Dividend Ratio | Voting Rights | Residual Claims |
|---|---|---|---|---|
| Preferred stock | Almost same | High (relatively) | None | Senior |
| Common stock | Almost same | Low (relatively) | Yes | Junior |
Notes: Cash flow right (cash dividend) follows each firm’s policy and year but is almost identical, except for a few companies, in our sample. However, dividend ratio differs because of price discrepancies.
Table 2.
Factors for the investor sentiment index.
| Factors | Definitions |
|---|---|
| Relative Strength Index (RSI) | |
| Psychological line index (PLI) | |
| Logarithm of trading volume (LTV) | |
| Adjusted turnover rate (ATR) | |
| Buy-sell imbalance of individual investors (IBSI) |
Notes: Pi,t denotes closing price, Ri,t denotes the stock returns, Vi,t denotes the trading volume, and IBVi,t (ISVi,t) denotes the volume of buy (sell) trades by individual investor for sotck i, on day t.
Table 3.
Definitions of variables.
| Variable | Definitions |
|---|---|
| Price discrepancies (Dependent variable) | 1. (Ratio) Preferred stock price divided by common stock price. |
| 2. (Difference) Common stock price minus preferred stock price. | |
| Sentiment (Main variable) | Consider the five sentiment proxies: relative strength index (RSI), psychological line index (PLI), adjusted turnover rate (ATR), the logarithm of trading volume (LTV), and the buy-sell imbalance of individual investors (IBSI), simultaneously, through the principal component analysis. Then, set the regression model with the market risk factor and adopt the residual as sentiment measure for individual stock. |
| Volume | Total number of shares of a security that were traded during the day. |
| Outstanding | Number of the firms’ outstanding common (preferred) stock. |
| Size | Natural log of total assets. |
| Lev | Total debt divided by total assets. |
| ΔSentiment | Difference between common and preferred stock characteristics for each variable. |
| ΔVolume | |
| ΔOutstanding |
Notes: Price-based variables are adjusted. In the empirical analysis, we calculate the difference (Δ) between common and preferred stocks. Furthermore, Size and Lev variables are not used at the stock level, but at the firm level, based on the empirical analysis.
Table 4.
Summary statistics.
| Panel A. Preferred Stock (N = 325,198) | |||||||
| Variable | Mean | Min. | P25 | Median | P75 | Max. | Std. |
| Sentiment | −0.0176 | −7.8674 | −0.9019 | −0.0851 | 0.7983 | 13.6855 | 1.3019 |
| Price | 37,009 | 97 | 3359 | 10,400 | 33,225 | 1,419,971 | 90,807 |
| Volume | 30,943 | 1 | 640 | 3590 | 15,619 | 11,126,669 | 154,459 |
| Outstanding | 5,958,453 | 9074 | 589,875 | 2,067,500 | 4,021,927 | 903,629,000 | 38,030,064 |
| Panel B. Common Stock (N = 325,198) | |||||||
| Variable | Mean | Min. | P25 | Median | P75 | Max. | Std. |
| Sentiment | 0.0195 | −14.0459 | −0.9511 | −0.0255 | 0.9422 | 12.0080 | 1.3835 |
| Price | 74,719 | 108 | 6169 | 20,000 | 66,007 | 3,687,967 | 180,659 |
| Volume | 489,462 | 1 | 25,910 | 123,357 | 414,488 | 205,995,279 | 1,880,330 |
| Outstanding | 68,541,398 | 624,615 | 11,152,546 | 27,543,086 | 74,958,735 | 6,419,324,700 | 279,701,268 |
| Panel C. Dependent and Control Variables (N = 325,198) | |||||||
| Variable | Mean | Min. | P25 | Median | P75 | Max. | Std. |
| ΔSentiment | 0.0371 | −15.3646 | −0.7588 | 0.0416 | 0.8449 | 15.1008 | 1.2757 |
| Price discrepancies ratio | 0.5609 | 0.1191 | 0.4287 | 0.5415 | 0.6752 | 1.0000 | 0.1800 |
| Price discrepancies | 37.7099 | 0.0000 | 2.1070 | 8.3000 | 31.4510 | 2307.4400 | 96.2360 |
| ΔVolume | 0.4585 | −6.9137 | 0.0214 | 0.1113 | 0.3868 | 202.9676 | 1.8104 |
| ΔOutstanding | 0.0626 | 0.0004 | 0.0095 | 0.0240 | 0.0718 | 5.5157 | 0.2429 |
| Firm Size | 21.7619 | 17.2473 | 20.4452 | 21.7584 | 23.0776 | 26.6588 | 1.7694 |
| Leverage | 0.5847 | 0.1300 | 0.4282 | 0.6058 | 0.7418 | 1.5006 | 0.2136 |
Notes: This table reports the summary statistics of stock-level variables. The sample includes 85 firms (170 stocks, 5183 trading days, and 325,198 observations) from 3 January 2000, to 30 December 2020. Variables are calculated based on the descriptions in Table 3. Panel A describes the preferred stock samples, Panel B describes the common stock sample, and Panel C describes the dependent and control variables used in the regression model. Notation Δ indicates the difference between preferred and common stocks. The number of firm size and leverage variables is 324,536. The reported values look odd because the adjusted stock price is used, especially Price related variables. For readability, values of ΔVolume and ΔOutstanding are divided by 1,000,000 and 1,000,000,000.
Table 5.
Does investor sentiment explain the price discrepancies between preferred and common stocks?
Table 5.
Does investor sentiment explain the price discrepancies between preferred and common stocks?
| Dependent Variable: Price Discrepancies Ratio (Preferred Stock Price Divided by Common Stock Price) | ||||
|---|---|---|---|---|
| Variable | (1) | (2) | (3) | (4) |
| ΔSentiment | −0.009 *** (−38.42) | −0.009 *** (−38.24) | −0.009 *** (−37.66) | −0.01 *** (−41.58) |
| ΔVolume | −0.003 *** (−13.77) | −0.003 *** (−17.25) | ||
| ΔOutstanding | 0.051 *** (39.38) | 0.059 *** (41.56) | 0.11 *** (77.08) | |
| Size | −0.026 *** (−135.9) | |||
| Lev | 0.089 *** (57.36) | |||
| Intercept | 0.561 *** (1781.3) | 0.558 *** (1719.18) | 0.559 *** (1701.42) | 1.071 *** (272.56) |
| Adj. R2 | 0.005 | 0.009 | 0.01 | 0.063 |
| F-Value | 1476.39 (Pr. < 0.0001) | 1516.98 (Pr. < 0.0001) | 1075.08 (Pr. < 0.0001) | 4393.69 (Pr. < 0.0001) |
| N | 325,198 | 325,198 | 325,198 | 324,536 |
Notes: Results of OLS regressions using price discrepancies ratio as the dependent variable. t-statistics are in parentheses. *** denote significance at the 1% levels.
Table 6.
Does investor sentiment explain the price discrepancies? (analysis by year).
| Dependent Variable: Price Discrepancies Ratio (Preferred Stock Price Divided by Common Stock Price) | ||||||||||||||||||||
|---|---|---|---|---|---|---|---|---|---|---|---|---|---|---|---|---|---|---|---|---|
| Variable/Year | 2000 | 2001 | 2002 | 2003 | 2004 | 2005 | 2006 | 2007 | 2008 | 2009 | 2010 | |||||||||
| ΔSentiment | −0.017 *** (−16.04) | −0.015 *** (−13.28) | −0.013 *** (−10.42) | −0.017 *** (−14.18) | 0.004 *** (3.46) | −0.005 *** (−6.6) | −0.003 *** (−3.31) | −0.009 *** (−10.94) | −0.011 *** (−10.63) | −0.002 ** (−2.56) | −0.007 *** (−6.89) | |||||||||
| ΔVolume | 0.003 *** (5.5) | 0.001 ** (2.27) | −0.008 *** (−4.09) | −0.033 *** (−19.12) | −0.017 *** (−8.86) | −0.024 *** (−26.52) | −0.03 *** (−9.34) | −0.002 *** (−2.93) | −0.02 *** (−21.35) | −0.008 *** (−15.09) | −0.012 *** (−8.32) | |||||||||
| ΔOutstanding | 0.242 *** (8.23) | 0.313 *** (10.03) | 0.59 *** (13.63) | 0.644 *** (17.15) | 0.547 *** (17.54) | 1.033 *** (35.36) | 0.444 *** (16.28) | 1.051 *** (42.55) | 1.379 *** (52.62) | 0.724 *** (28.54) | 0.183 *** (9.32) | |||||||||
| Size | −0.036 *** (−37.7) | −0.059 *** (−48.77) | −0.055 *** (−43.86) | −0.043 *** (−36.21) | −0.04 *** (−38.34) | −0.02 *** (−23.46) | −0.008 *** (−8.75) | −0.025 *** (−32.71) | −0.05 *** (−55.81) | −0.046 *** (−51.87) | −0.043 *** (−48.96) | |||||||||
| Lev | 0.053 *** (8.54) | 0.089 *** (9.62) | −0.009 (−1.22) | −0.089 *** (−10.97) | −0.048 *** (−6.43) | −0.076 *** (−11.93) | 0.135 *** (22.36) | −0.047 *** (−8.4) | −0.027 *** (−3.81) | 0.051 *** (7.98) | 0.102 *** (15.7) | |||||||||
| Intercept | 1.285 *** (67.89) | 1.772 *** (79.09) | 1.752 *** (74.08) | 1.55 *** (69.05) | 1.427 *** (71.18) | 1.047 *** (63.48) | 0.693 *** (36.42) | 1.056 *** (69.38) | 1.56 *** (87.32) | 1.424 *** (79.85) | 1.386 *** (74.53) | |||||||||
| Adj. R2 | 0.116 | 0.191 | 0.2 | 0.206 | 0.151 | 0.107 | 0.051 | 0.129 | 0.224 | 0.135 | 0.128 | |||||||||
| F-Value | 374.67 (Pr. < 0.0001) | 648.48 (Pr. < 0.0001) | 663.36 (Pr. < 0.0001) | 708.64 (Pr. < 0.0001) | 498.66 (Pr. < 0.0001) | 380.93 (Pr. < 0.0001) | 167.2 (Pr. < 0.0001) | 503.58 (Pr. < 0.0001) | 955.11 (Pr. < 0.0001) | 572.16 (Pr. < 0.0001) | 522.32 (Pr. < 0.0001) | |||||||||
| N | 14,311 | 13,676 | 13,214 | 13,632 | 14,048 | 15,911 | 15,440 | 17,020 | 16,518 | 18,311 | 17,702 | |||||||||
| Variable/Year | 2011 | 2012 | 2013 | 2014 | 2015 | 2016 | 2017 | 2018 | 2019 | 2020 | ||||||||||
| ΔSentiment | −0.022 *** (−18.69) | −0.001 (−0.68) | −0.004 *** (−4.39) | 0.005 *** (6.02) | −0.005 *** (−4.94) | −0.003 *** (−3.31) | −0.006 *** (−5.79) | −0.004 *** (−3.89) | −0.01 *** (−10.1) | −0.007 *** (−6.31) | ||||||||||
| ΔVolume | −0.005 *** (−11.2) | −0.007 *** (−6.7) | −0.001 (−0.66) | 0.001 (0.81) | −0.007 *** (−5.27) | −0.03 *** (−9.34) | −0.025 *** (−10.93) | −0.013 *** (−7.53) | −0.014 *** (−6.86) | 0.002 ** (2.28) | ||||||||||
| ΔOutstanding | 0.316 *** (15.22) | 0.436 *** (20.82) | 0.67 *** (27.75) | 0.475 *** (19.1) | 0.42 *** (17.42) | 0.444 *** (16.28) | 0.254 *** (12.54) | 0.093 *** (22.47) | 0.114 *** (26.21) | 0.08 *** (18.5) | ||||||||||
| Size | −0.059 *** (−61.05) | −0.06 *** (−62.81) | −0.048 *** (−51.33) | −0.02 *** (−23.82) | −0.015 *** (−17.66) | −0.008 *** (−8.75) | −0.017 *** (−18.81) | −0.025 *** (−27.2) | −0.036 *** (−40.68) | −0.029 *** (−26.9) | ||||||||||
| Lev | 0.141 *** (20.11) | 0.26 *** (36.19) | 0.194 *** (30.03) | 0.169 *** (30.31) | 0.146 *** (26.25) | 0.135 *** (22.36) | 0.183 *** (28.17) | 0.238 *** (35.18) | 0.331 *** (49.72) | 0.349 *** (44.53) | ||||||||||
| Intercept | 1.674 *** (82.36) | 1.607 *** (79.7) | 1.394 *** (71.04) | 0.905 *** (51.17) | 0.818 *** (46.47) | 0.693 *** (36.42) | 0.891 *** (46.24) | 1.021 *** (54.69) | 1.25 *** (67.8) | 1.09 *** (48.35) | ||||||||||
| Adj. R * | 0.205 | 0.213 | 0.159 | 0.089 | 0.06 | 0.051 | 0.065 | 0.105 | 0.201 | 0.19 | ||||||||||
| F-Value | 884.44 (Pr. < 0.0001) | 928.41 (Pr. < 0.0001) | 656.66 (Pr. < 0.0001) | 337.87 (Pr. < 0.0001) | 213.85 (Pr. < 0.0001) | 167.2 (Pr. < 0.0001) | 205.13 (Pr. < 0.0001) | 334.67 (Pr. < 0.0001) | 673.35 (Pr. < 0.0001) | 532.9 (Pr. < 0.0001) | ||||||||||
| N | 17,092 | 17,132 | 17,389 | 17,219 | 16,547 | 15,440 | 14,703 | 14,289 | 13,342 | 11,378 | ||||||||||
Notes: Results of OLS regressions using price discrepancies ratio as the dependent variable. t-statistics are in parentheses. ** and *** denote significance at the 5% and 1% levels, respectively.
Table 7.
Robustness check (analysis by year).
| Dependent Variable: Price Discrepancies (Common Stock Price Subtract Preferred Stock Price) | |||||||||||
|---|---|---|---|---|---|---|---|---|---|---|---|
| Variable/Year | 2000 | 2001 | 2002 | 2003 | 2004 | 2005 | 2006 | 2007 | 2008 | 2009 | 2010 |
| ΔSentiment | 0.751 *** (3.76) | 0.737 *** (5.87) | 0.739 *** (3.03) | −0.363 (−1.6) | −1.014 * (−1.87) | −1.88 *** (−3.46) | 2.632 *** (5.2) | 1.807 (1.57) | −0.034 (−0.04) | −1.368 ** (−2.42) | 2.707 *** (4.24) |
| ΔVolume | 0.76 *** (7.31) | 0.485 *** (7.54) | −2.473 *** (−6.36) | −0.475 (−1.44) | −2.902 *** (−2.92) | 0.875 (1.44) | −1.404 (−1.56) | 4.715 *** (6.18) | 5.553 *** (7.39) | 2.14 *** (7.1) | −1.241 (−1.39) |
| ΔOutstanding | −10.8 * (−1.94) | −28.677 *** (−8.34) | −79.946 *** (−9.12) | −124.348 *** (−17.11) | −269.878 *** (−16.21) | −378.678 *** (−19.7) | −342.682 *** (−20.98) | −831.246 *** (−23.46) | −565.096 *** (−26.26) | −330.449 *** (−22.42) | −119.614 *** (−9.71) |
| Size | 4.269 *** (23.47) | 3.741 *** (28.12) | 5.334 *** (21.07) | 6.518 *** (28.56) | 11.968 *** (21.72) | 12.503 *** (22.19) | 11.838 *** (24.89) | 25.319 *** (22.85) | 19.301 *** (25.99) | 12.97 *** (24.97) | 15.322 *** (27.41) |
| Lev | −0.282 (−0.24) | −9.804 *** (−9.6) | −1.351 (−0.87) | −21.036 *** (−13.38) | −13.276 *** (−3.3) | −4.634 (−1.11) | −6.038 * (−1.68) | 12.383 (1.53) | −14.201** (−2.44) | −1.664 (−0.45) | −46.035 *** (−11.24) |
| Intercept | −76.43 *** (−21.3) | −62.595 *** (−25.38) | −92.425 *** (−19.31) | −107.701 *** (−24.81) | −211.78 *** (−19.79) | −222.76 *** (−20.53) | −206.072 *** (−22.32) | −459.723 *** (−21.07) | −334.972 *** (−22.83) | −224.486 *** (−21.66) | −253.378 *** (−21.66) |
| Adj. R2 | 0.058 | 0.065 | 0.045 | 0.057 | 0.036 | 0.04 | 0.049 | 0.042 | 0.056 | 0.045 | 0.045 |
| F-Value | 178.28 (Pr. < 0.0001) | 190.06 (Pr. < 0.0001) | 126.66 (Pr. < 0.0001) | 166.55 (Pr. < 0.0001) | 105.6 (Pr. < 0.0001) | 132.6 (Pr. < 0.0001) | 163.67 (Pr. < 0.0001) | 150.38 (Pr. < 0.0001) | 196.69 (Pr. < 0.0001) | 173.29 (Pr. < 0.0001) | 169.44 (Pr. < 0.0001) |
| N | 14,311 | 13,676 | 13,214 | 13,632 | 14,048 | 15,911 | 15,662 | 17,020 | 16,518 | 18,311 | 17,702 |
| Variable/Year | 2011 | 2012 | 2013 | 2014 | 2015 | 2016 | 2017 | 2018 | 2019 | 2020 | Full Sample |
| ΔSentiment | −2.695 *** (−4.55) | 2.597 *** (5.09) | 0.29 (0.64) | −0.885 ** (−2.55) | 2.483 *** (5.14) | 2.574 *** (4.68) | −0.002 ** (−2.41) | −1.407 ** (−2.45) | −0.006 (−0.01) | 3.52 *** (4.53) | 1.074 ***(7.75) |
| ΔVolume | 1.384 *** (6.07) | 1.13 ** (2.55) | 0.373 (0.36) | 3.997 *** (6.28) | 4.874 *** (6.6) | 5.796 *** (3.35) | −0.023 *** (−15.69) | −1.745 * (−1.85) | −1.719 (−1.49) | −1.352 ** (−2.04) | −0.292 *** (−2.9) |
| ΔOutstanding | −141.469 *** (−13.33) | −167.756 *** (−18) | −274.092 *** (−23.43) | −309.801 *** (−29.99) | −417.397 *** (−33.27) | −457.407 *** (−31.29) | 0.729 *** (27.02) | −29.857 *** (−13.31) | −32.409 *** (−13.39) | −39.575 *** (−13.68) | −35.224 *** (−45.72) |
| Size | 17.898 *** (36.46) | 17.182 *** (40.41) | 16.703 *** (36.88) | 12.548 *** (35.67) | 15.295 *** (34.69) | 16.437 *** (33.07) | −0.015 *** (−19.06) | 16.216 *** (33.2) | 18.525 *** (37.09) | 26.155 *** (35.98) | 11.763 *** (113.5) |
| Lev | −92.056 *** (−25.69) | −112.523 *** (−35.2) | −106.019 *** (−33.93) | −90.234 *** (−38.94) | −112.052 *** (−38.73) | −127.662 *** (−39.43) | −0.027 *** (−4.56) | −186.776 *** (−50.92) | −186.429 *** (−50.22) | −235.973 *** (−44.89) | −81.833 *** (−98.07) |
| Intercept | −276.218 *** (−26.59) | −252.382 *** (−28.09) | −244.644 *** (−25.73) | −174.504 *** (−23.75) | −210.006 *** (−22.94) | −226.456 *** (−22.19) | 0.897 *** (58.86) | −208.243 *** (−20.61) | −265.574 *** (−25.85) | −407.835 *** (−27.02) | −168.056 *** (−79.18) |
| Adj. R * | 0.098 | 0.139 | 0.124 | 0.144 | 0.151 | 0.154 | 0.056 | 0.165 | 0.172 | 0.169 | 0.051 |
| F-Value | 372.49 (Pr. < 0.0001) | 551.98 (Pr. < 0.0001) | 493.84 (Pr. < 0.0001) | 580.77 (Pr. < 0.0001) | 588.33 (Pr. < 0.0001) | 563.18 (Pr. < 0.0001) | 185.89 (Pr. < 0.0001) | 564.47 (Pr. < 0.0001) | 554.51 (Pr. < 0.0001) | 462.27 (Pr. < 0.0001) | 3458.45 (Pr. < 0.0001) |
| N | 17,092 | 17,132 | 17,389 | 17,219 | 16,547 | 15,440 | 15,662 | 14,289 | 13,342 | 11,378 | 324,536 |
Notes: Results of OLS regressions using price discrepancies as dependent variable. t-statistics are in parentheses. *, **, and *** denote significance at the 10%, 5%, and 1% levels, respectively.
Publisher’s Note: MDPI stays neutral with regard to jurisdictional claims in published maps and institutional affiliations. |
© 2021 by the authors. Licensee MDPI, Basel, Switzerland. This article is an open access article distributed under the terms and conditions of the Creative Commons Attribution (CC BY) license (https://creativecommons.org/licenses/by/4.0/).
Share and Cite
MDPI and ACS Style
Yang, H.; Ryu, D. Investor Sentiment and Price Discrepancies between Common and Preferred Stocks in Korea. Sustainability 2021, 13, 5539. https://doi.org/10.3390/su13105539
AMA Style
Yang H, Ryu D. Investor Sentiment and Price Discrepancies between Common and Preferred Stocks in Korea. Sustainability. 2021; 13(10):5539. https://doi.org/10.3390/su13105539
Chicago/Turabian StyleYang, Heejin, and Doowon Ryu. 2021. "Investor Sentiment and Price Discrepancies between Common and Preferred Stocks in Korea" Sustainability 13, no. 10: 5539. https://doi.org/10.3390/su13105539
Note that from the first issue of 2016, this journal uses article numbers instead of page numbers. See further details here.