
Multicriteria Ranking for the Efficient and Effective Assessment of Police Departments


1
Technology Center, Federal University of Pernambuco, Caruaru 55014-900, Brazil
2
Department of Computer, Control and Management Engineering Antonio Ruberti, Sapienza University of Rome, 00185 Roma, Italy
3
Department of Management Engineering, Federal University of Pernambuco, Recife 50740-550, Brazil
*
Author to whom correspondence should be addressed.
Sustainability 2021, 13(8), 4251; https://doi.org/10.3390/su13084251
Submission received: 18 March 2021
/
Revised: 31 March 2021
/
Accepted: 7 April 2021
/
Published: 12 April 2021
(This article belongs to the Special Issue Sustainability on Crime Analysis and Public Safety)
Abstract
:The nonparametric assessment of police efficiency and effectiveness is challenging due to the stochastic nature of criminal behavior and the subjective dependence on multiple decision criteria, leading to different prospects depending on the regulation, necessity, or organizational objective. There is a trade-off between sustainable efficiency and effectiveness in many police performance assessments, because many departments can be crime-specialized or cannot reproduce good results effectively on more severe or complex occurrences. This study aims to provide a non-compensatory ranking classification combining Conditional Frontier Analysis with the PROMETHEE II methodology for the multidimensional efficiency and effectiveness analysis of police. The results on Pernambuco (Brazil) Police departments offer interesting perspectives for public administrations concerning prioritizations of units based on the mitigation of resources and strategic objectives.
1. Introduction
The sustainable development of a society requires the optimal usage of resources for the provision of goods and services and the ability to reach the desired social goals. Efficiency can be defined as the capacity to avoid wasting materials, resources, efforts, or time to produce a result or outcome. This concept is strictly related to sustainability. On the other hand, effectiveness can be defined as the ability to produce a desired result. This concept is strictly related to quality. In the simple words of Peter Drucker, efficiency is doing things right, while effectiveness is doing the right things. These two perspectives are not always walking in the same direction and their potential conflict can jeopardize some of the promising prospects of sustainable service provisions, especially considering public administrations.
There is a recurrent trade-off between quality and efficiency in many empirical assessments [1,2,3]. Lo Storto [4], investigating the relationship between efficiency and effectiveness of public expenditure in 108 major Italian municipalities, suggests shreds of evidence for this trade-off, involving public service quality indicators (expenditure effectiveness) and DEA measures for cost-efficiencies. Nepomuceno et al. [5], investigating 88 public and private health service units in Pernambuco, Brazil, also offer support in addition to this discussion. According to the authors, most hospitalization-efficient units are crowded public hospitals working at full capacity most of the year, which can only meet all the demand for hospitalizations (the output in the analysis) by compromising the service’s quality.
Some composite indicators, such as the Civil Society Organization Sustainability Index developed by the United States Agency for International Development, offer an interesting methodology for measuring civil society’s short-term quality in implementing development solutions and long-term achievement of sustainable outcomes. The index, which ranges from 1 (enhanced sustainability) to 7 (impeded sustainability), evaluates the legal environment, organizational capacity, financial viability, advocacy, service provision, sectorial infrastructure, and public image of 82 countries. Other composite methodologies considering multiple perspectives for ranking regions are also provided in the scientific literature [6,7,8,9,10].
Ranking Decision Making Units (DMUs) according to their productive performance has been the objective of Data Envelopment Analysis (DEA) applications in many sectors of economic activities for classifying both efficient and inefficient units [11,12,13]. Ranking service units provides valuable discriminations that support strategic decision-making by creating incentive structures for rewarding efficient managers, teams, resource allocations, recognizing prospective policies, and best practices, changing misleading business competencies, operations, and activities, and developing sustainable directions for continuous improvement [14]. It also offers clear information for taxpayers and society on investments’ returns, regarding public and state companies. Ranking police units under the influence of different environments, subjective value judgments, contexts, and exogenous potentials of policing and criminality is challenging in the field of nonparametric efficiency analysis, due to the stochastic nature of criminal occurrences.
According to Nepomuceno et al. [15], crime cannot be considered an input or output from police departments’ production systems in the short-run because: 1. it cannot be directly controlled (reduced); 2. stochastic characteristics (increasing police efficiency, e.g., by solving more cases and still having a more than proportional increase in crime); 3. influence of exogenous determinants (income, educational attainment, religious preference, population density, social status, age, race and ethnicity, among others) which are neither in control nor can be coherently measured by police; 4. dependence and strict correlation with other results; 5. simultaneity bias; and 6. impossibility to measure the number of crimes that have been prevented. The authors suggest using nonparametric robust estimators [16,17,18], which account for extreme values in the data and permit measurement of the effect of crime as exogenous variables on the efficiency of decision making units. This methodology is explained in detail in the first part of the next section.
Ranking service units also requires much effort for defining quality standards for the organization’s products and services. Such a prospect is not limited to measuring decision units’ technical efficiency with projections for how much outputs can be expanded or how inputs contracted in relation to the industry’s production capacity. It also extends to measuring how effective the decision unit is in achieving predefined objectives, which is strictly related to the quality of products and services. Multicriteria decision aid (MCDA) methods are a valuable resource for systematic ranking of multiple alternatives based on decision criteria weighted and evaluated by one or many decision-makers and stakeholders.
In particular, outranking methodologies, such as the ELECTRE (Elimination and Choice Translating Algorithm) [19,20] and PROMETHEE (Preference Ranking Organization Method for Enrichment of Evaluations) [21,22,23] families, offer outranking relations on the set of alternatives considering the decision marker’s preferences so that an alternative x (e.g., university, bank, hospital, police department, vendor, city, region, person), is claimed to outrank another alternative y if, and only if, x is at least as good as y and there is no strong argument to contradict this assertion [24].
There are many outranking methods for multicriteria decision analysis (see e.g., a recent comprehensive survey reported in Greco et al. [25]). Among existing outranking methods, we choose the PROMETHEE II approach that has been widely used in multicriteria decision analysis, as witnessed by recent surveys (see e.g., Behzadian et al. [26,27]). According to Behzadian et al. [26], applications of the PROMETHEE approach are found in environment management, hydrology and water management, business and financial management, chemistry, logistics and transportation, manufacturing and assembly, energy management, social science, medicine, agriculture, education, design, government, and sports.
The choice of the PROMETHEE II approach in this application was made due to the (i) methodology characteristic providing a quantitative measure (the Outranking Net Flow) for aggregating different decision perspectives to support the ranking of service units (see the methodology described in the next section), (ii) simplicity of its implementation that is particularly helpful when being explained to policymakers and applied in combination with other methods, and (iii) wide application of the approach in different fields and contexts both from academics and practitioners [26,27,28].
In this paper, we combine robust directional efficiency measures [15,18,29] for policing, conditional to crime as an exogenous factor, with the PROMETHEE outranking for a complete classification of Pernambuco’s municipalities based on the sustainable efficiency of each police department in solving three types of crimes, violent crimes (CVLI—Crimes Violentos Letais e Intencionais), street robberies (mugging), and carjacking (or more generally motor vehicle theft and robbery), using officers as input, and based on the effectiveness of reaching the Pact for Life state goal on reducing homicides [15,30,31]. To the best of our knowledge, this is the first application of this robust and combined methodology to assess the efficiency and effectiveness of police units. Our methodology relies on recent advances in conditional frontier analysis used with a traditional PROMETHEE methodology for outranking decision units.
Some assessments of crime and policing in Pernambuco used statistical, multicriteria, and geospatial tools for ranking, clustering, and classifying units and regions according to the vulnerability to homicides [32,33,34], preference learning [35,36], property crimes [37,38], and investigating the violent behavior in Pernambuco [39]. Despite providing valuable support for policymakers, to the best of our knowledge, ranking regions or police units for public security purposes based on a multicriteria combination of nonparametric robust estimators for technical efficiency with measures for effectiveness of results were not featured in the current literature. This combined methodology is presented in detail in the next section, highlighting the potentials not limited to this application. The third section is dedicated to evaluating and discussing the compensatory and non-compensatory rankings generated from different perspectives, which can aid substantial subsidies for strategic decision-making. The conclusion summarizes the proposal, empirical evaluation, and contributions of the paper.
2. Methodology
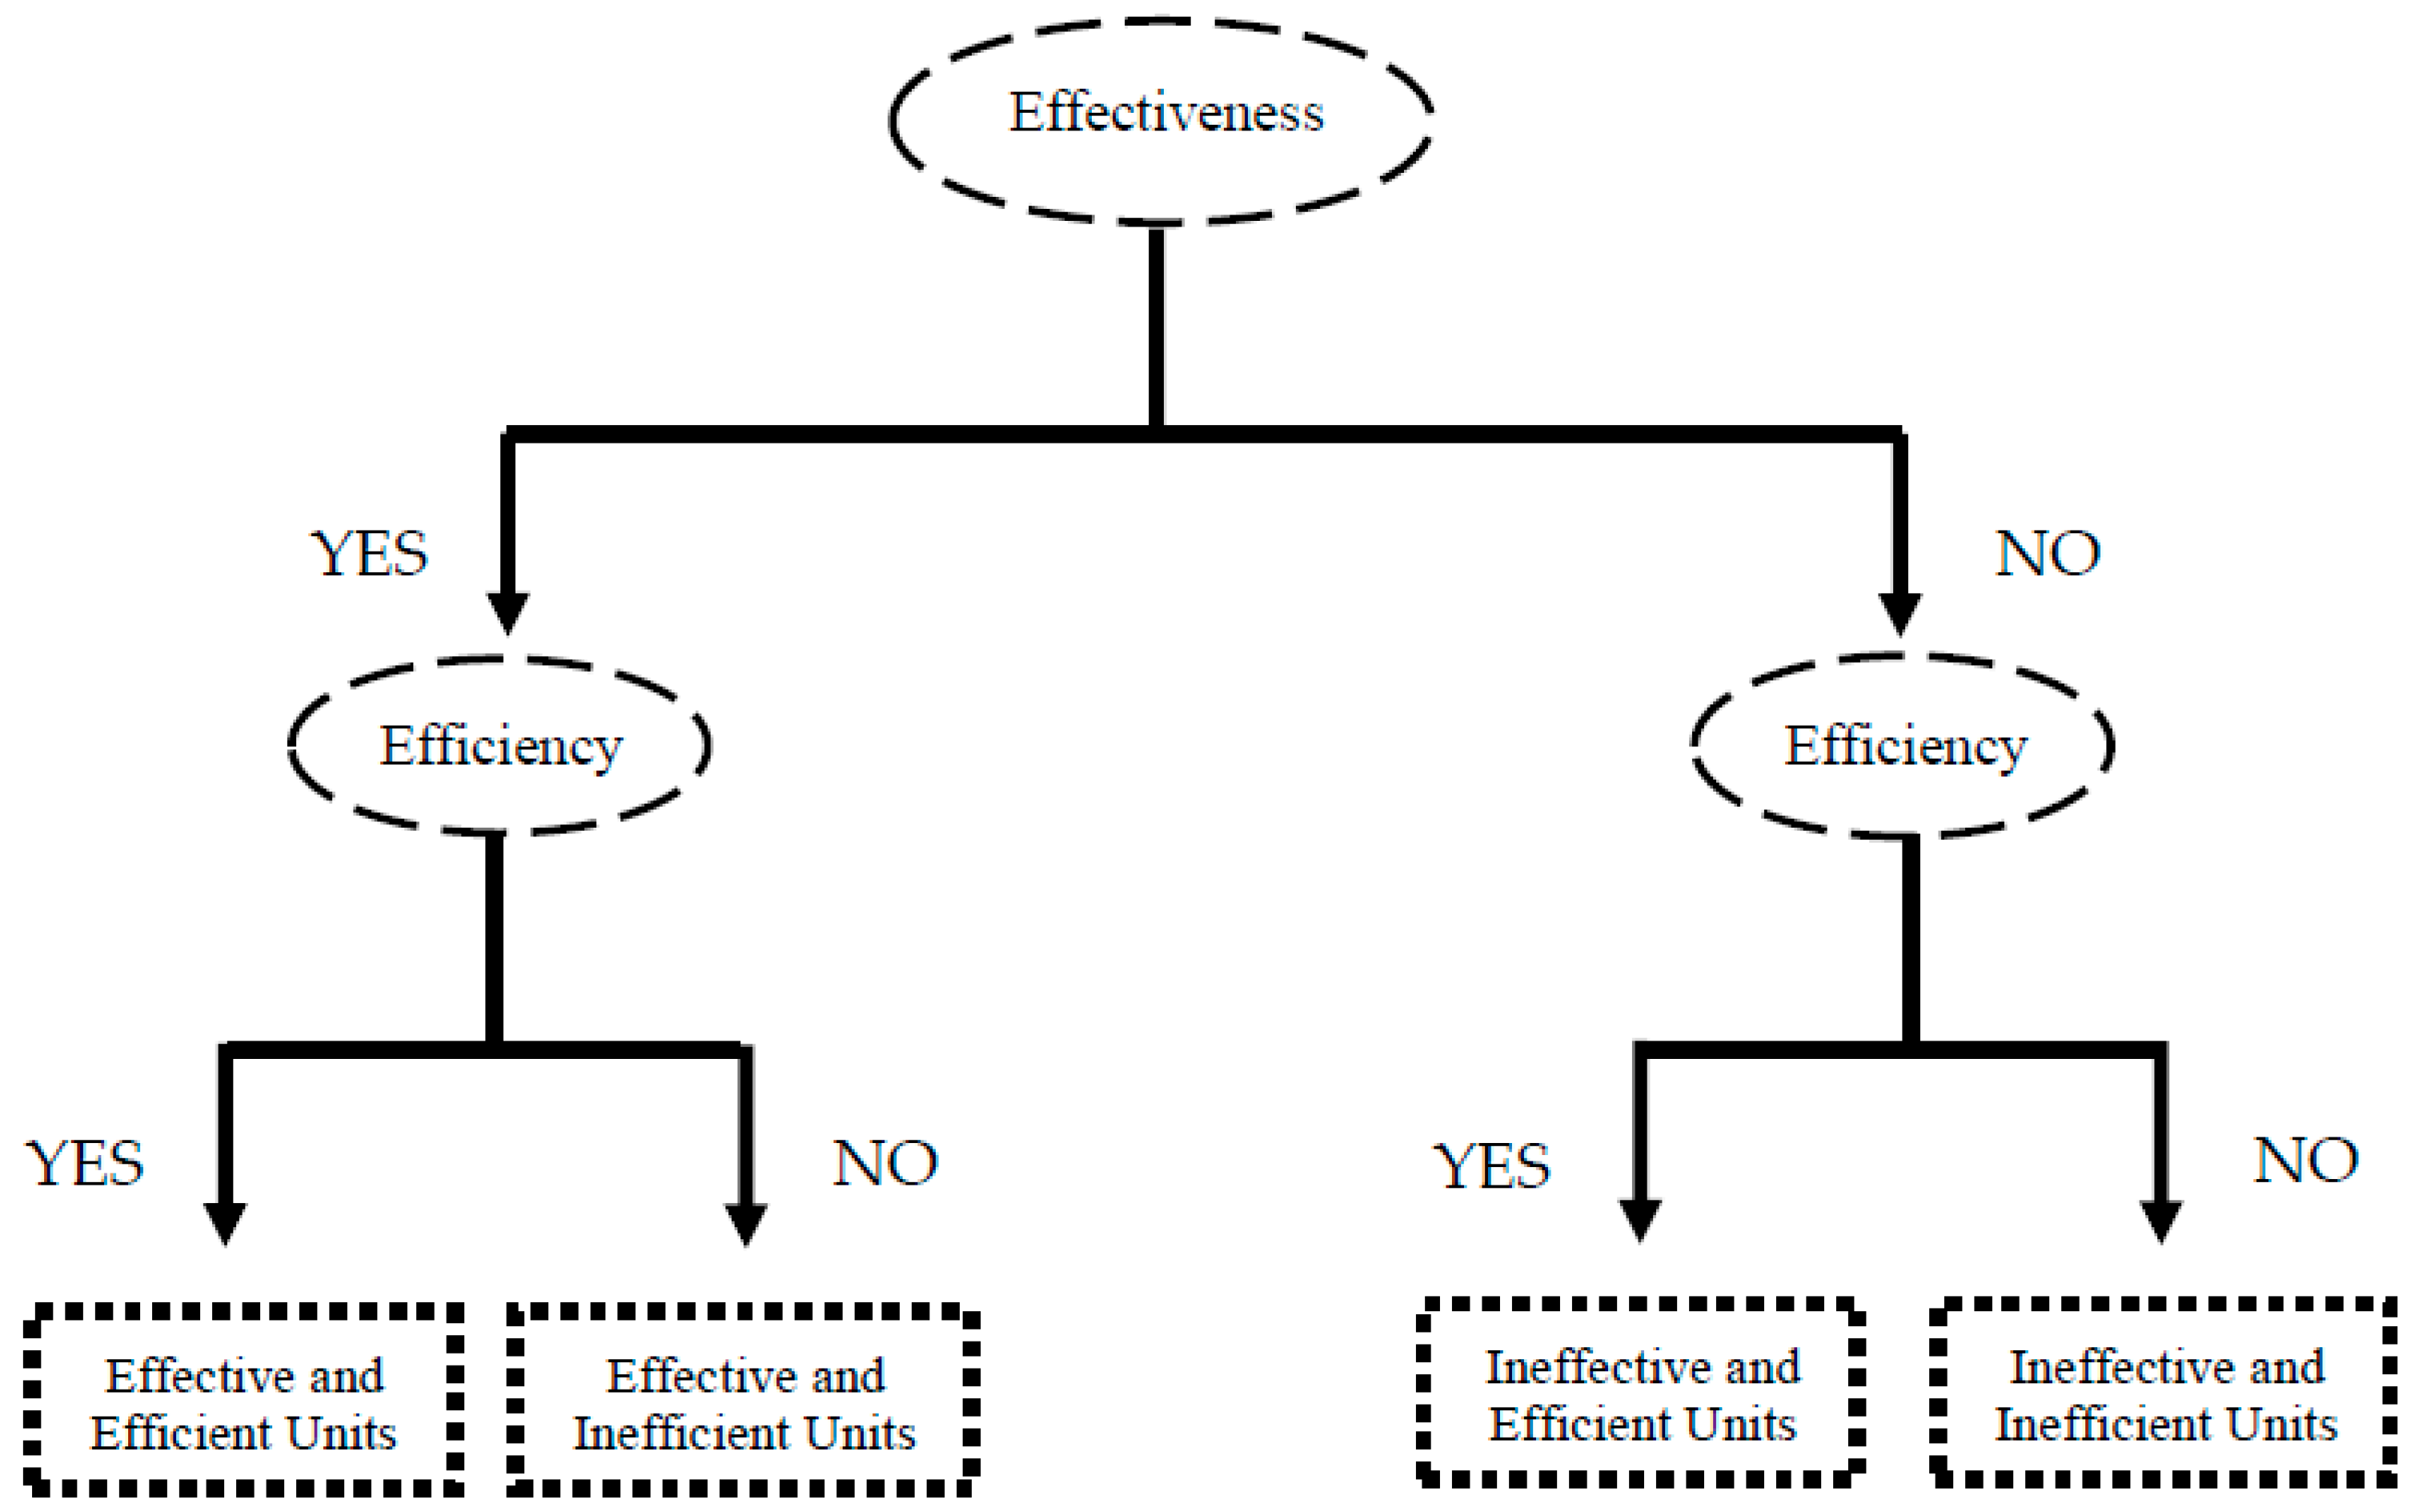
Many DEA ranking methods in the productive and efficiency analysis literature are considered post-analysis approaches [13]. The framework illustrated in Figure 1 can be situated in this classification. Four sub-ranks are constructed through pairwise comparisons. Compensations between efficiency and effectiveness are restricted by the imposition of vetoes for clustering effective/ineffective and efficient/inefficient alternatives (municipalities). The municipality is top-ranked when it is sufficiently effective according to the predefined objective, and efficient in using the available resources to produce clear-ups for the specified felonies and misdemeanors. The second sub-rank has effective but not efficient municipalities, i.e., excellent efficiency prospects cannot offset poor effectiveness. If the municipality is efficient in using the available resources to solve crimes but is not effective in reaching the specified institutional goal, it is located in the third sub-rank with similar municipalities. The last sub-rank had both ineffective and inefficient units. The PROMETHEE II net flow coefficient outranks the units in each sub-rank of this framework.
2.1. Effectiveness: The Pact for Life Initiative
The Pact for Life program (Programa Pacto pela Vida) [30,31] was Pernambuco’s state policy for police repression and social prevention of crime and violence. The initiative, utilizing preventive and repressive actions, aims to reduce impunity of violent crime through the integration of the public security system, readjustment and modernization of processes, protocols, and routines directly related to the police operational capacity and the criminal justice system, consolidation and integration of information, dissemination and democratization of data, and strategic training of new police officers. Focusing on reducing homicides prior to any other criminal occurrence, the Pact for Life program was one of the most successful state-level projects in their first years of execution.
The program’s goal is to reduce homicides by 12%. Pernambuco’s municipalities are considered effective when they reach this coefficient. As crime is a stochastic concept which depends on many objective and subjective determinants which are out of the police department field of action, the interesting perspective in this program is trying to integrate the many sectors and public institutions (police courts, justice courts, the prison system, and the community) which are part of the solution. In this analysis, the effectiveness veto of 12% was used to improve DEA’s discriminant power, supporting a more appropriate ranking of both efficient and inefficient police units in the state.
2.2. Efficiency: Conditional Frontier Analysis
The advances in nonparametric robust estimators [16,17,18], besides the benefit of not imposing a functional specification for the frontier projection, are also not affected by extreme observations and outlier data. This is due to the projection of partial frontiers of order-m or order-α which do not envelop all data points, being less affected by extreme data values [17]. In this particular application, a directional version of the FDH was provided, in which results are robust to outliers and extreme values.
Conditional frontier analysis [17,18], in its directional version [40,41], is part of the nonparametric robust estimators proposed to overcome some drawbacks in the traditional DEA measures for technical efficiency. The application of this methodology permits assessment of police performance by considering criminal data as exogenous variables (Z) that were not under the service units’ control. Consider a particular DMU j from a set of m decision units using i = 1, 2, 3, …, n inputs to produce r = 1, 2, 3, …, s outputs. The directional efficiency is obtained by choosing a feasible direction g(x,y) ≥ 0 for contracting resources (inputs) and/or expanding results (outputs) to reach the industry efficient frontier:
The results for efficiency projections depend on the choice of the directional input vectors, which aim to contract the production resources, and directional output vectors, which aim to expand the products. Thus, the overall evaluation is sensitive to the opted directions. From an economic point of view, this is consistent with the optimization behavior of service units (maximizing results or reducing production costs). Nepomuceno et al. [42] offer a brief discussion on the choice of sustainable directions, and a review of methodologies for selecting directions in a non-parametric framework can be found in the work of Wang et al. [43]. For instance, directions can be defined exogenously, including subjective preferences or conditional techniques [42,44,45], or they can be defined endogenously, by optimization approaches [43,46,47]. While the former has the benefit of flexibility for decision-making, the latter has the adherence of statistical properties and theoretical support.
The choice for the data direction g(x,y) = (X,Y) or for the unit vector g(x,y) = (1, 1) are the most appropriate in many circumstances due to the simplicity of underlying aggregations. In this assessment, we opt for the unit vector. As this assessment can be considered a two-step methodology (first as an efficiency application, then prioritization), choosing another potential flexible or optimized direction would require double aggregations, and the results in the prioritization phase (for constructing the effective-efficient sub-ranks) would be biased. Exogenous factors can affect police production by changing the input/output configuration or by affecting the distribution of inefficiencies. Including potential exogenous determinants of efficiency is based on the premise that the joint probability distribution H(XY) = prob (X ≤ x, Y ≥ y) when conditional to Z = z can define an attainable production, such that x can produce y when Z = z. For the directional efficiency, the conditional directional distance function is defined as [35,36]:
is the joint conditional probability that a given unit j with production (X, Y) dominates the unit under evaluation with production configuration (x, y). This is empirically developed using a non-parametric estimator that smooths the multiple exogenous factors Z in the neighborhood of z from a sample of q = 1, 2, 3, …, p observations based on an appropriate kernel estimation and choice for a bandwidth vector. Three models were developed to derive FDH directional efficiency measures which compose the decision criteria in the ranking of municipalities: a model for violent crimes clear-ups as output (CVLI—Crimes Violentos Letais e Intencionais), a model for street mugging as output (Trans—Assalto a Transeúnte), and the last one for carjacking as output (Veíc—Roubo de Veículos), all conditional to the occurrences, using sworn and administrative officers as input.
2.3. Outranking: PROMETHEE II Net Flow
According to Brans et al. [22], the PROMETHEE method offers a preference function for each decision criterion in the elicitation process and prioritizes multiple alternatives. The intensity of preference for an alternative x over another option y, Pi(x,y), was developed through differences in performance levels on that criterion for the two alternatives fi(x) − fi(y) ∀ i = 1, 2, 3… I decision criteria. This takes on values between 0 and 1. The decision-maker defines a standard function shape (usual, u-shape, level, linear, or Gaussian), specifying potential parameters according to their evaluation. The preference index P(x,y) is defined as a weighted average of preferences on the individual criteria:
This weight elicitation represents a notion of global importance in the decision-maker’s perspective instead of scaling factors (trade-offs). When the decision-maker cannot provide or is not willing to provide details on how critical each decision criteria is, an alternative is using Rank Order Centroid (ROC) weights [48] for evaluating criteria with partial information about attribute weights. In this methodology, ranking the least to the most important criteria in the decision-maker’s perspective is sufficient to obtain the optimal weights to be considered in the pairwise comparisons for definitions of outranking flows. The weights for each criterion are determined by:
where L is the total of criteria from w = k to L. After defining weights and potential threshold parameters (for preference and indifference comparisons), the PROMETHEE preference index provides a valued outranking relation for ordering alternatives. The positive outranking flow and the negative outranking flow (over all alternatives under consideration) are defined as follows [24]:
The positive outranking flow expresses the scope of how much x outranks all other alternatives. The negative outranking flow expresses the scope to which all other options outrank x. A complete order of alternatives was derived from the “net flow” for each alternative, defined as:
Q(x) = Q + (x) − Q − (x)
Thus, an alternative x outranks y if Q(x) > Q(y), and it is indifferent when Q(x) = Q(y). This complete preorder is more disputable than partial orders derived from the individual positive and negative flows due to some information loss. Nevertheless, they are attractive in providing a DEA post-analysis non-compensatory ranking of DMUs.
3. Data, Application, and Discussion
The policing structure in Brazil is composed of four instances: the Military Police, the Civil Police, the Federal Police, and Federal Highway Police. This assessment regards the production of public security produced by the Civil Police, which aims at preventing, suppressing, and investigating crimes of all types, performing judicial investigative functions directed by police delegates.
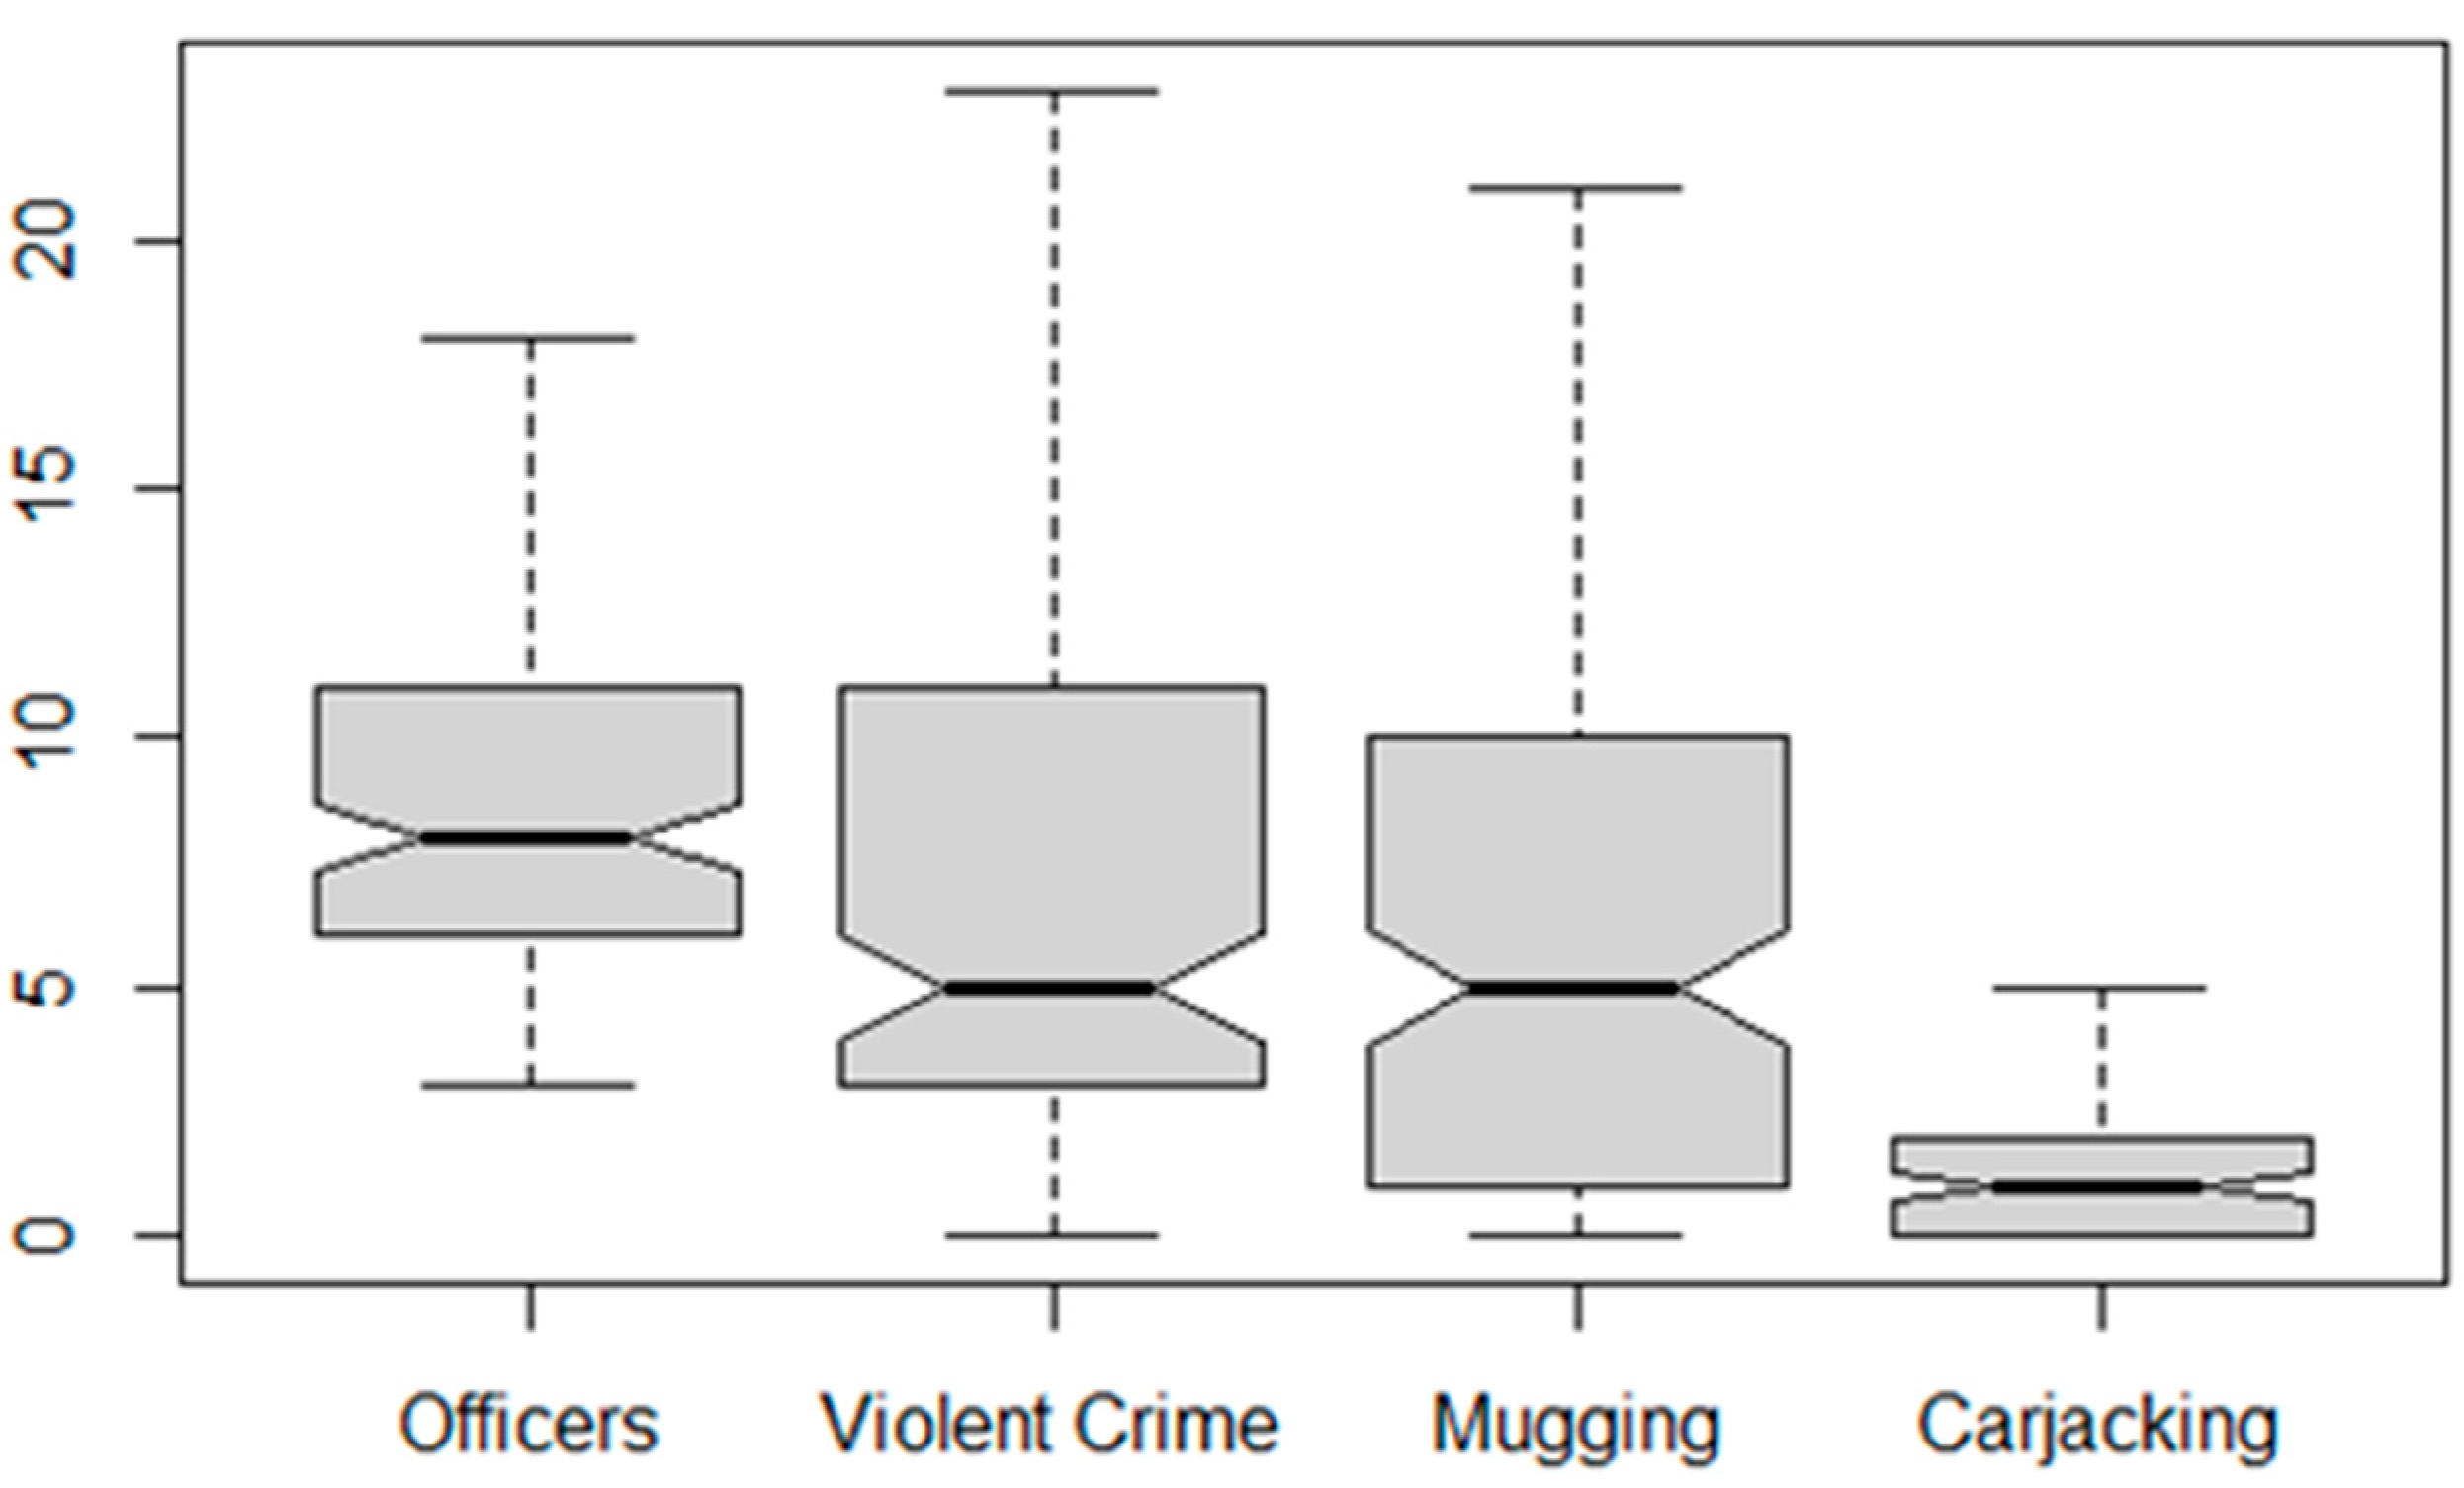
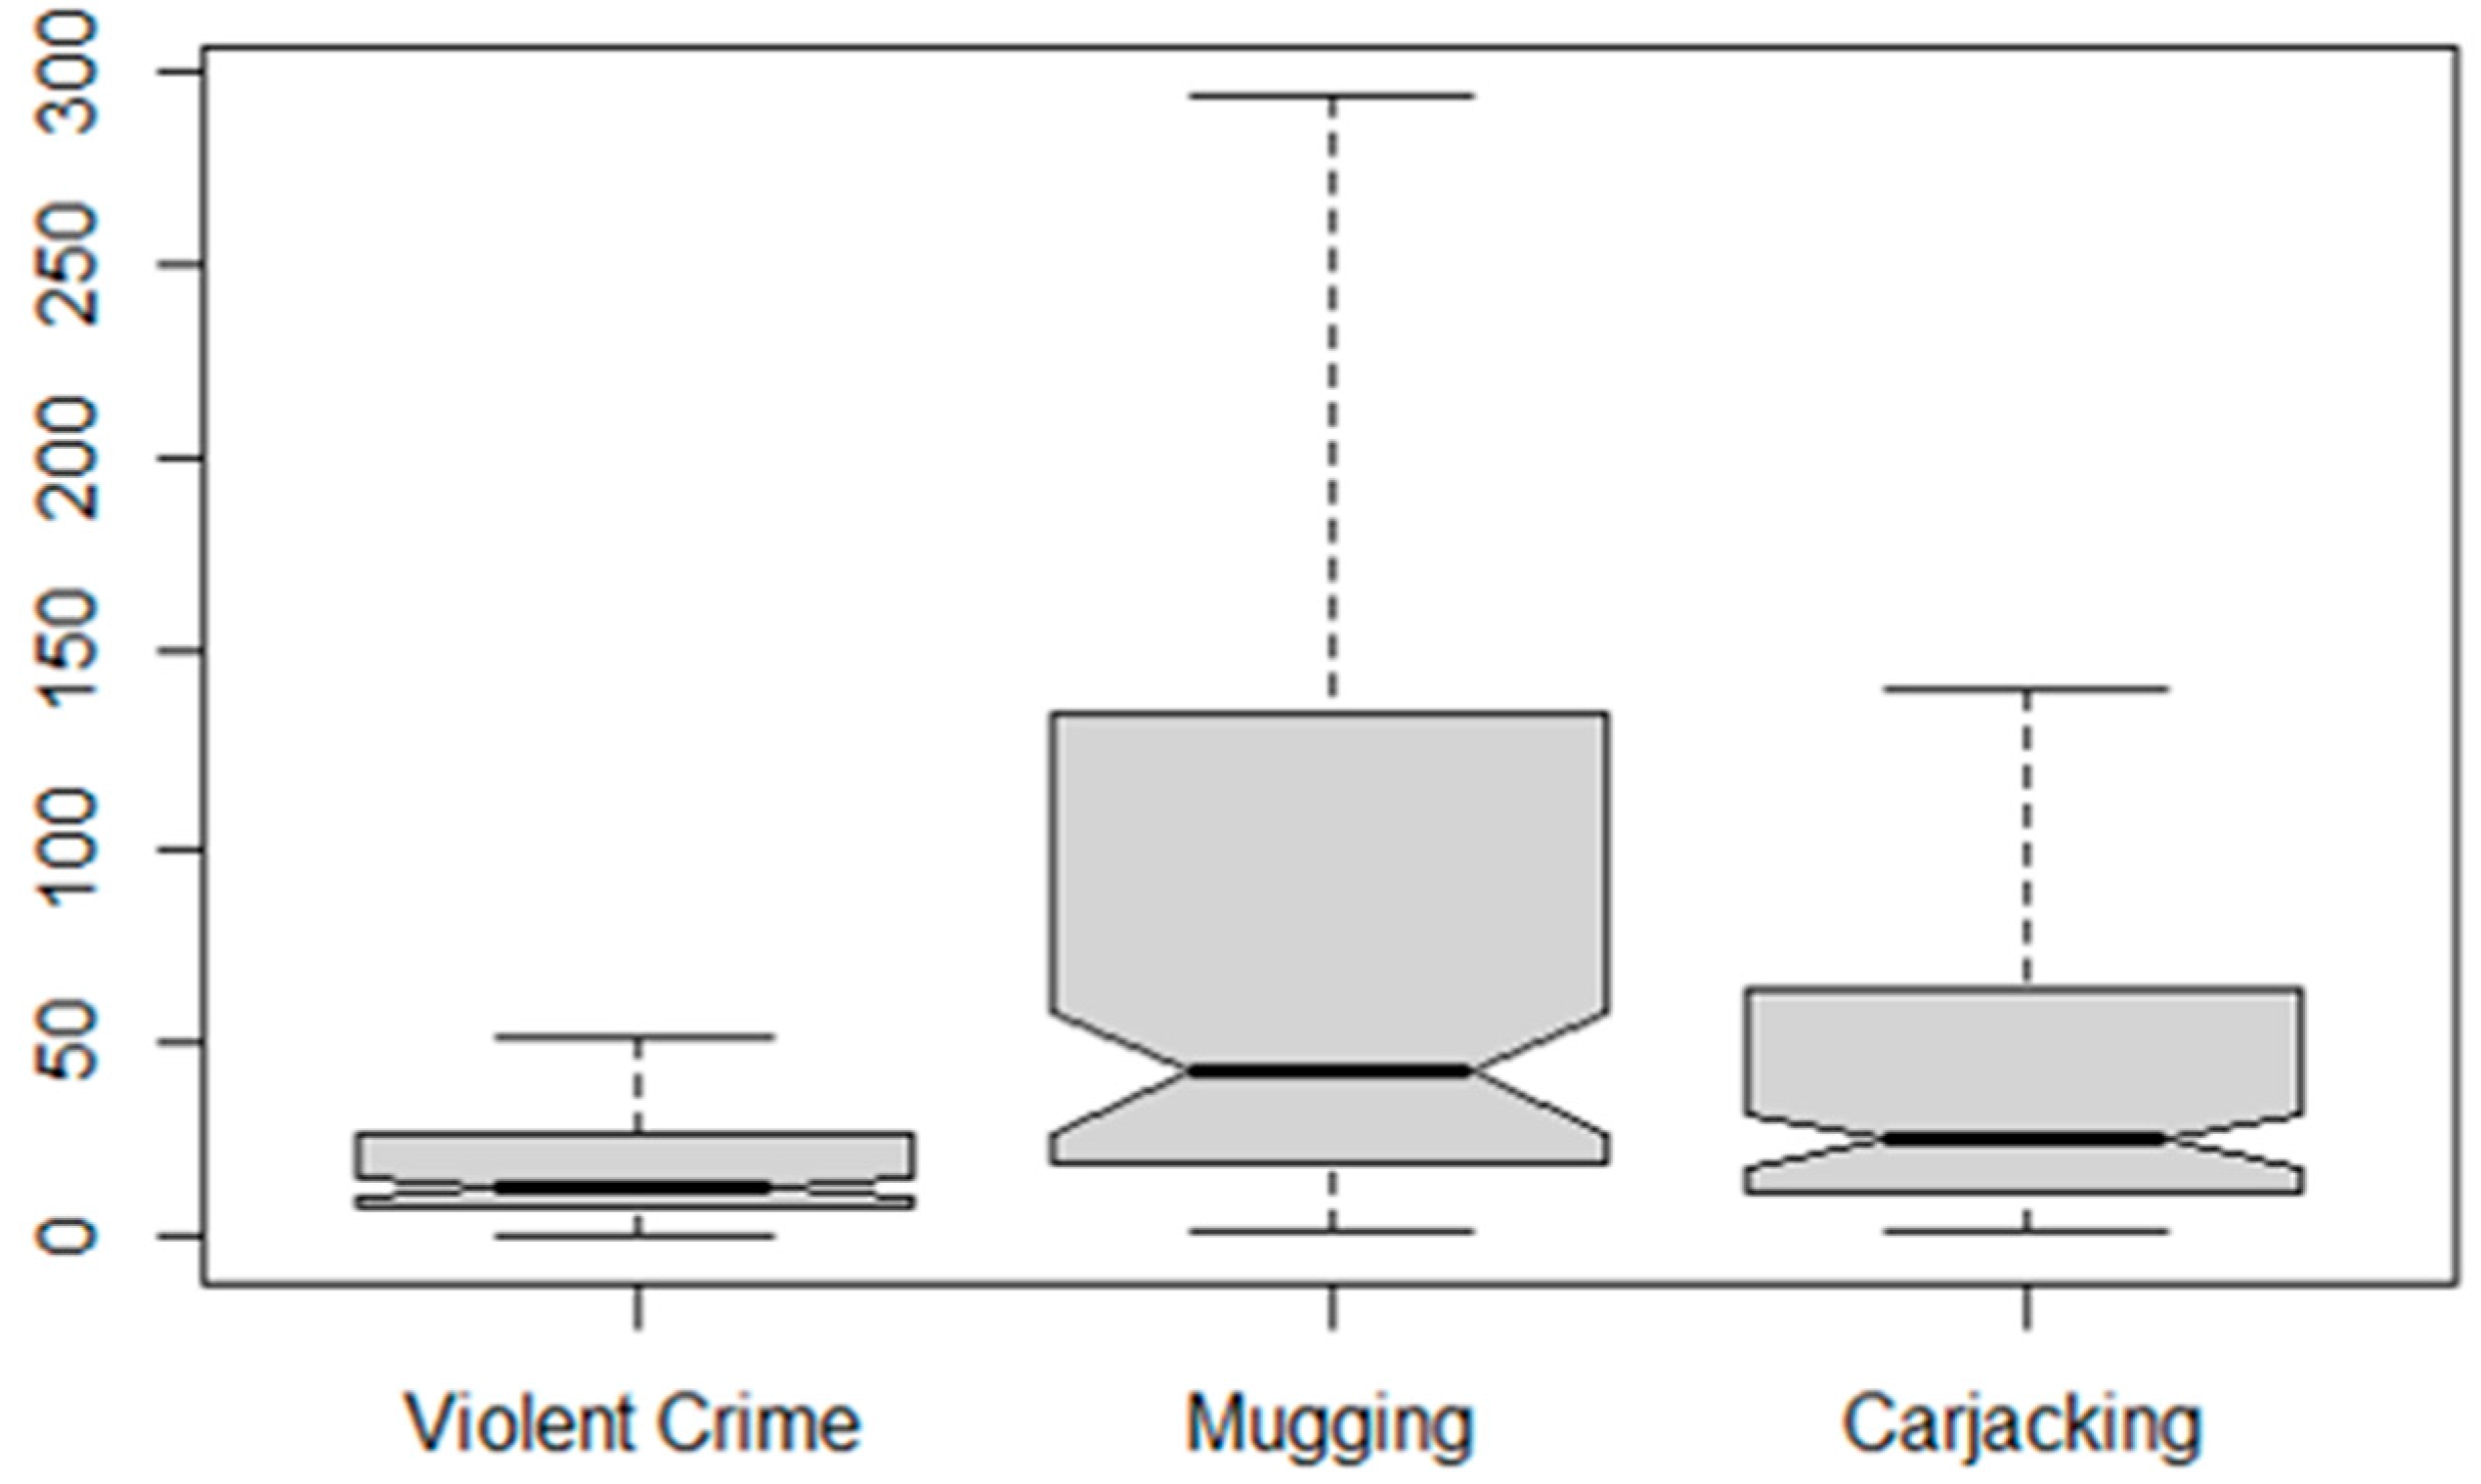
Data regarding the number of police officers (input) and inquiries with the definition of responsibility (clear-ups) for three types of felonies (output), and the corresponding occurrences (violent crime, street mugging and carjack) in 145 of the 185 Pernambuco cities were provided by the Secretariat for Social Defense (SDS-PE). The criminal occurrences were the environmental factors conditioning the directional efficiency of the police departments. Adequacy of this data can find support in similar assessments of police efficiency [15]. Table 1 and Figure 1 summarize the main descriptive data information.
Pernambuco had a total of 1430 sworn officers and administrative staff as inputs in this application. The high number of human resources comes from the city Cabo de Santo Agostinho, in the coastal region, which also reports higher occurrences for violent crime (198 incidents) and street mugging (2198) than other cities in this assessment. There are a smaller number of officers in Camocim de São Felix, in the countryside region. The clear-up rates for Pernambuco as a whole, according to Table 1, are 41.72% for violent crimes, 6.38% for street mugging, and about 2.93% for carjacking, with a global efficiency of 58.08% considering an input-oriented variable returns to scale application. Figure 2 and Figure 3 illustrate this description in notched boxplots. There is strong evidence for median equality, as the confidence intervals represented by the notches overlaps those of violent crime and mugging.
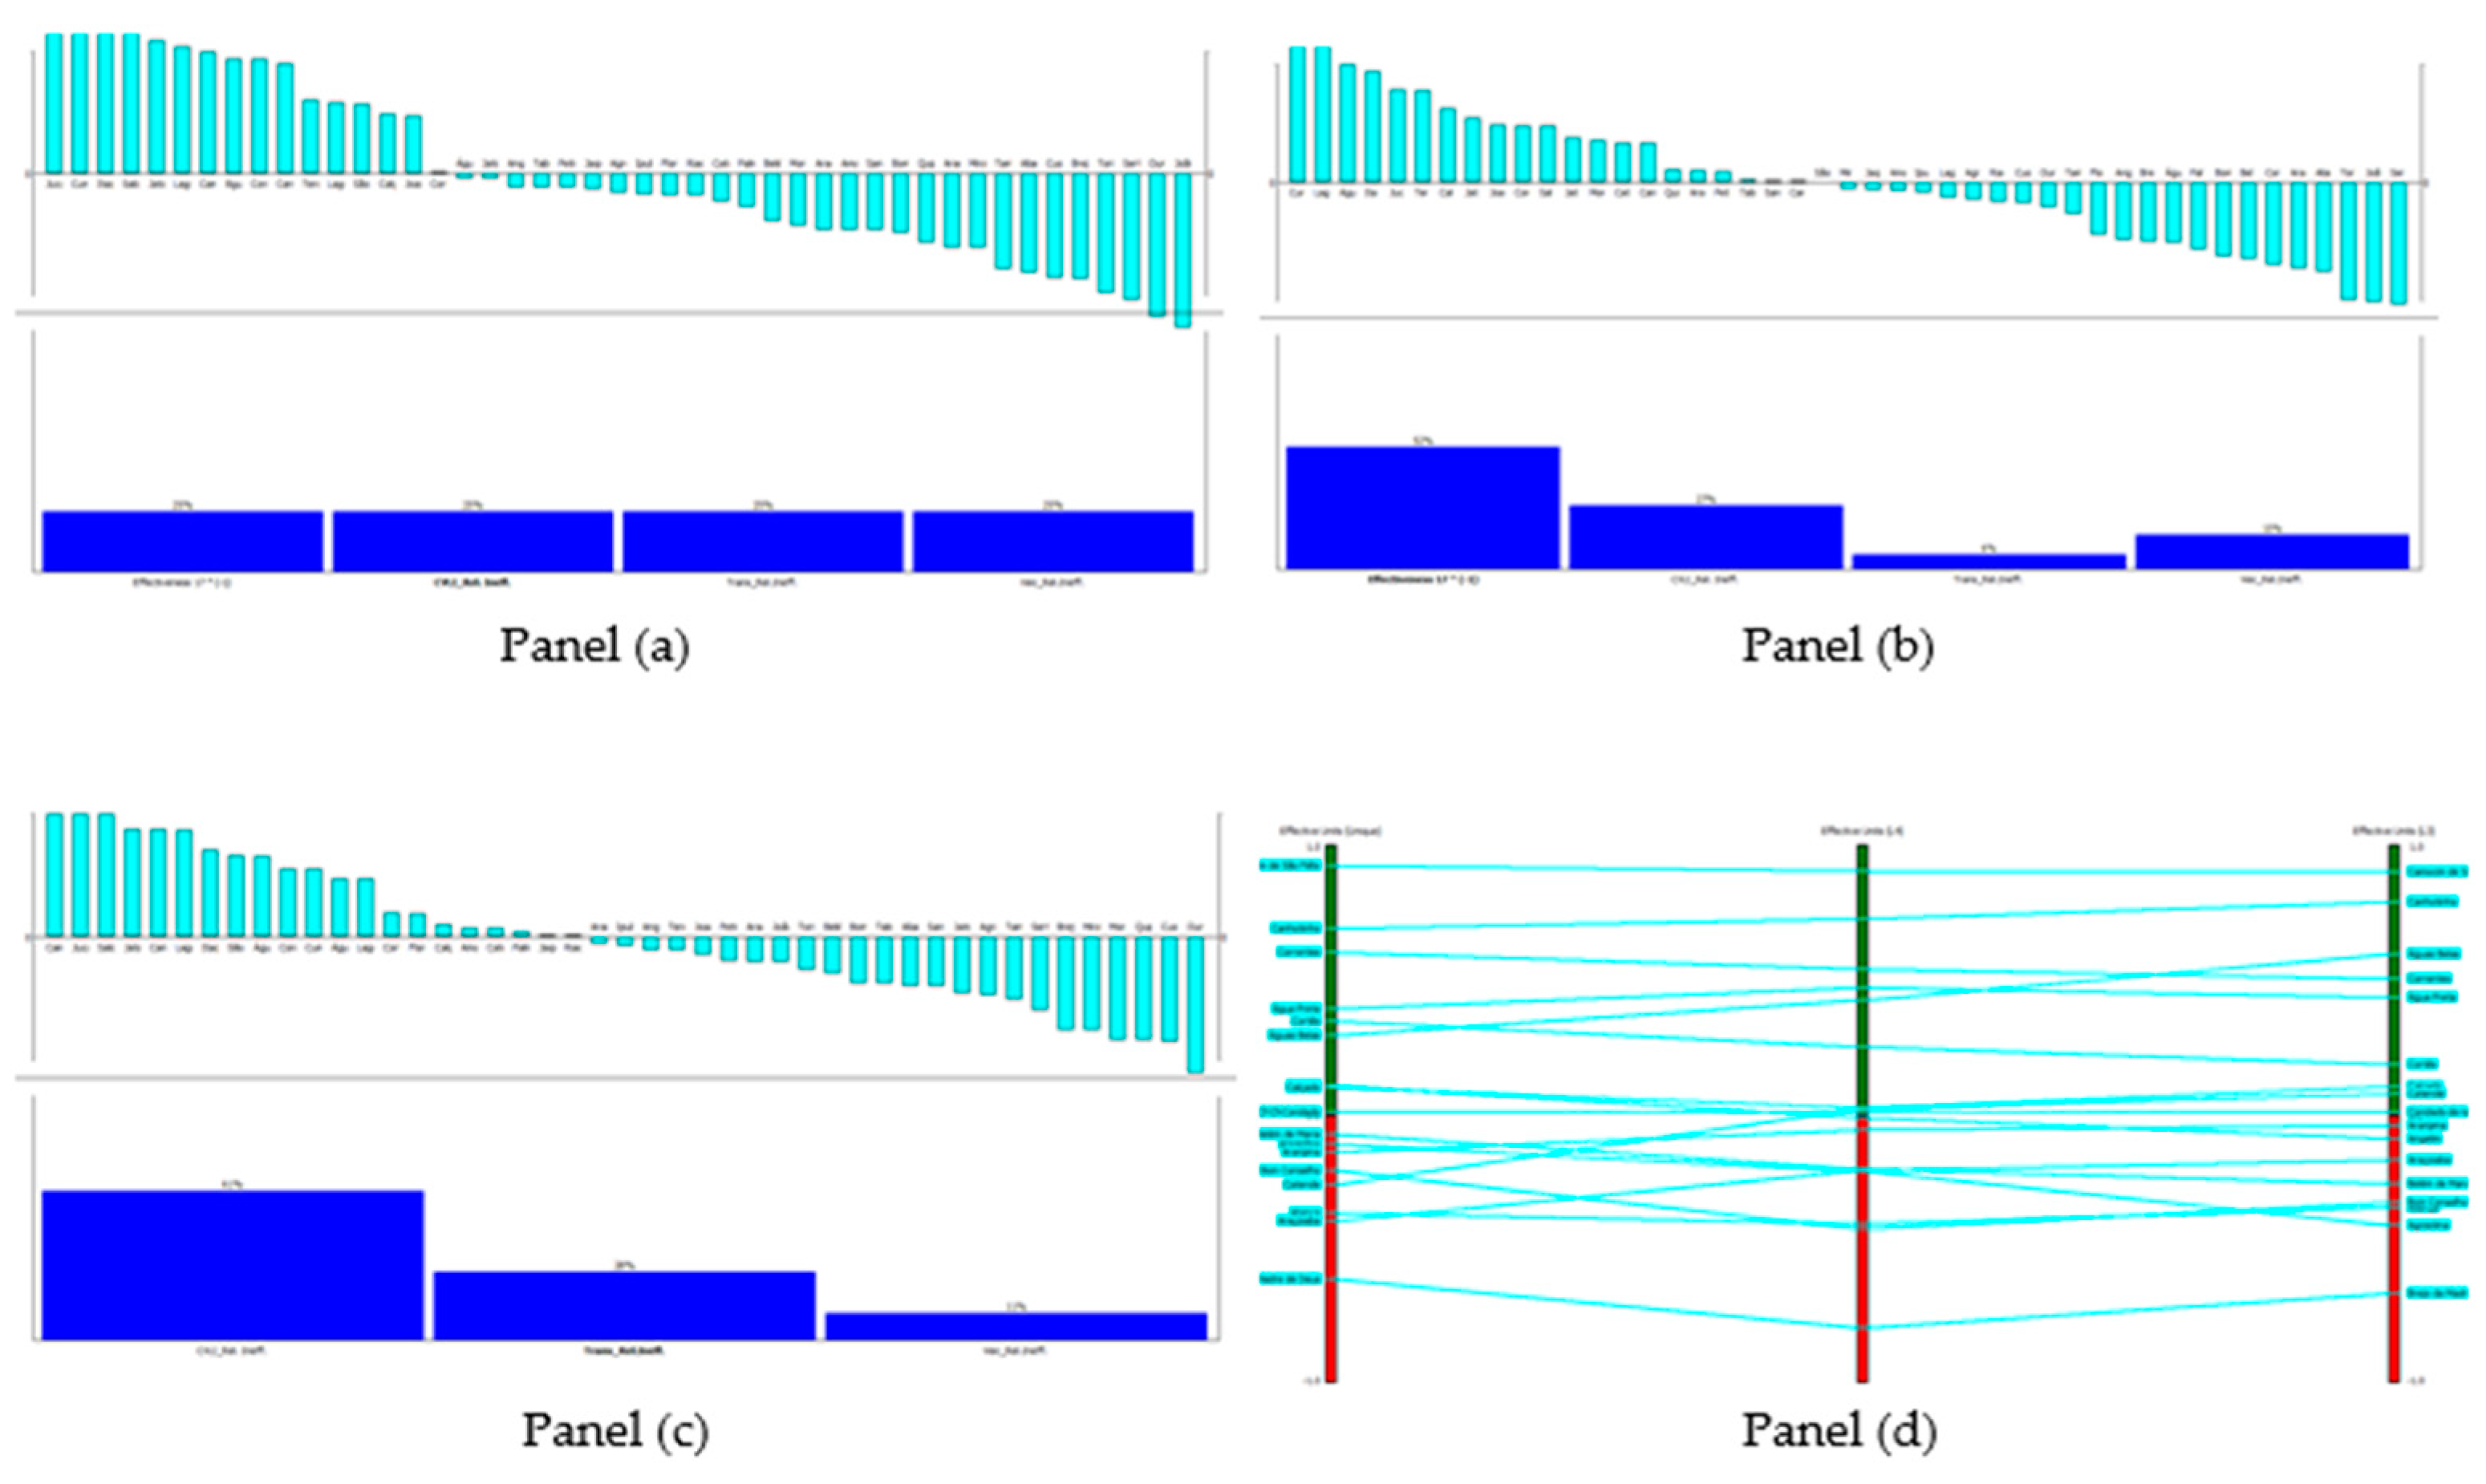
We adopted the usual standard function shape for prioritizing units using the PROMETHEE method. In this case, we do not consider indifference or preference thresholds during the elicitation process. Compensations were considered with the effectiveness veto threshold. ROC weights were used considering the four decision metrics from Nepomuceno et al. [5]: Pact for Life effectiveness in reducing 12% homicides (the most important criterion, w = 0.521), relative directional efficiency in violent crimes (CVLI_Rel.Ineff., the second most important criterion, w = 0.271), relative directional efficiency in carjacking (Veic_Rel.Ineff., the third most important criterion, w = 0.146), and relative directional efficiency in street mugging (Trans_Rel.Ineff., the least important criterion, w = 0.062). Figure 4 illustrates the classification of the police units sensitive to weighting changes according to this ROC weights configuration (L = 4), equal weights (L = 4), ROC weights considering only measures for the police efficiency (L = 3), and scenarios comparisons.
The panels of Figure 4 report rankings that are sensitive to weighting definitions. When comparing a traditional efficiency-based ranking (L3) to a complete classification considering effectiveness, one can see some significant ranking reversals, such as Cumaru, Terezinha, and Joaquim Nabuco. Cumaru was the first in absolute efficiency and effectiveness (L4). It was located at the eleventh position in a ranking considering only efficiency (L3). Terezinha, the sixth in absolute efficiency and effectiveness (L4) was located at the 24th position considering only efficiency criteria (L3) (18 position change). Joaquim Nabuco, from the ninth position in efficiency and effectiveness (L4), was located in position 26 when only efficiency criteria were considered (L3). Several other ranking changes highlight the importance of assessing this scientific soundness, combining sustainable efficiency measures with effectiveness prospects. Table 2 provides some useful information comparing PROMETHEE ranking reversals sensitive to the three types of weighting definitions. The ranking of L4 for the effective units (both efficient and inefficient) was the benchmark for comparing the classification changes.
The following Table 3, Table 4 and Table 5 report the overall policing effectiveness-efficiency application for a non-compensatory ranking of 145 of Pernambuco’s municipalities described in the methodology. According to the results, none of the three completely efficient units (i.e., efficient in all three output models) were ineffective. For this reason, we have three sub-rankings instead of four, as illustrated in Figure 1. The tables provide information on the non-compensatory compared to the compensatory ranking position, i.e., when the municipalities were all outranked in the same group without the imposition of effectiveness or efficiency vetoes. The net flow parameter was used to outrank the units in each sub-rank.
The effectiveness was measured by how much the municipality reached the target of 12% reduction in homicides (more is preferable, but 0.12 is sufficient). The last column for the relative inefficiency aggregates each unit’s relative inefficiency scores for all three models considering the slacks (less is preferable, and zero means the unit is efficient in all three models, with no slack for police officers). It was interesting how different the non-compensatory top-ranked municipalities would feature in a compensatory evaluation. Jucati, the first top-ranked municipality, was a small city in the agreste pernambucano (rural/wasteland region) of about 11,000 residents and a population density of 87.92 per km2. It had 4 officers as input along the year, 4 homicide occurrences (all solved), 12 street mugging (10 solved) and 15 carjackings (8 recovered). The municipality reduced from 9 homicides in 2015 to 6 homicides in 2016 (about 33% reduction) and from 6 homicides in 2016 to 4 homicides in 2017 (about 33% reduction).
When compared to the first effective but not efficient unit (Cumaru, Table 4) we can observe the compensation effect; as Cumaru, another small city in Pernambuco, could reduce the homicides entirely in the year of evaluation (from 2 to 0, 100% effectiveness, w = 0.5208333), this more than compensated a poor efficiency performance (25% relative inefficiency), locating this municipality at the second position in the compensatory ranking, and Jucati at the 18th position. Compensations of this nature can be observed all over the rankings. Non-compensatory/compensatory ranking inversions were even bigger for Saloá (2 compared to 37) and Camocim de São Félix (3 compared to 69). The non-compensatory ranking of units in this assessment tends to provide a fairer evaluation in line with what is expected by the policymaker. Effective and Efficient Units are shown in Table 3, Effective and Inefficient Units. in Table 4 and Ineffective and Inefficient Units in Table 5.
4. Conclusions
In many problems involving human resources’ strategic management and their consequences, it is essential to consider ranking alternatives in a sustainable perspective. This paper shows that each particular ranking reflects specific values, preferences, and criteria for specific design purposes. We highlight the importance of a fair non-compensatory judgment on police units’ performance using multiple decision criteria based on efficiency and effectiveness. The proposed methodology may be applied and extended to many other contexts, areas of economic activities, policies, and empirical scenarios to include potential environmental non-discretionary determinants of productivity, robust to extreme data and super-efficient frontier projections.
Different types of felonies have different degrees of severity, complexity, and social importance. Traditional DEA measures for ranking technical efficiency fail to consider those clear-up specifications. The resulting rankings of police units are strongly affected by this limitation. In this work, we have combined recent advances in robust non-parametric frontier estimation with multiple criteria outranking to provide a more realistic and valuable public security ranking of municipalities. By including crime as an exogenous factor affecting the regular distribution of efficiencies in three police performance models, we derived more robust technical efficiency measures to be used with effectiveness goals as decision criteria for classifying the police units. Similar “efficient and effective” rankings may be obtained by applying this paper’s methodology to assess other regions or other fields of analysis.
Additional analyses that could be interesting to carry out include considering intervals of efficiency or the inclusion of indifference and preference thresholds in the decision matrix based on an elicitation of the society’s values reflected by a public authority. Intervals of efficiency, instead of an absolute measure of efficiency, could be an alternative for permitting service units to discount relatively small and irrelevant differences in the efficiency score that would drastically lead to ranking reversal because of eventual unconventional weighting structures. Efficiency-based models for re-allocating sworn officers and administrative police staff based on time-series data [49,50] and inverse frontier methods [51] might offer an additional post-analysis value added to identify efficient strategies to improve the current police productivity. Another interesting analysis would be to explore other multicriteria decision approaches [26,27] to check the robustness of the results obtained by applying the PROMETHEE II approach. All these analyses are left for future research.
Author Contributions
Conceptualization: T.C.C.N., C.D. and A.P.C.S.C.; Data curation: T.C.C.N.; Formal analysis: T.C.C.N., C.D. and A.P.C.S.C.; Funding acquisition: T.C.C.N. and C.D.; Investigation: T.C.C.N. and C.D.; Methodology: T.C.C.N. and C.D.; Project administration: T.C.C.N., C.D. and A.P.C.S.C.; Resources: T.C.C.N.; Software: T.C.C.N.; Supervision: C.D. and A.P.C.S.C.; Validation: T.C.C.N., C.D. and A.P.C.S.C.; Visualization: T.C.C.N.; Writing—original draft: T.C.C.N.; Writing—review & editing: T.C.C.N., C.D. and A.P.C.S.C. All authors have read and agreed to the published version of the manuscript.
Funding
The Article Processing Charge (APC) for this research was funded by the Dipartimento di Ingegneria Meccanica e Aerospaziale (DIMA) from Sapienza Università di Roma.
Institutional Review Board Statement
Not applicable.
Informed Consent Statement
Not applicable.
Data Availability Statement
Data available on request due to privacy/ethical restrictions.
Acknowledgments
The authors acknowledge the support from Pernambuco’s Secretariat for Planning and Management (SEPLAG) in providing data for this analysis, and the financial support from DIMA/Sapienza in this research.
Conflicts of Interest
The authors declare no conflict of interest. The funders had no role in the design of the study; in the collection, analyses, or interpretation of data; in the writing of the manuscript, or in the decision to publish the results.
References
- Daraio, C.; Simar, L.; Wilson, P.W. Quality as a latent heterogeneity factor in the efficiency of universities. Econ. Model. 2021, 99, 105485. [Google Scholar] [CrossRef]
- Dismuke, C.E.; Sena, V. Is there a trade-off between quality and productivity? The case of diagnostic technologies in Portugal. Ann. Oper. Res. 2001, 107, 101–116. [Google Scholar] [CrossRef]
- Nuti, S.; Daraio, C.; Speroni, C.; Vainieri, M. Relationships between technical efficiency and the quality and costs of health care in Italy. Int. J. Qual. Heal. Care 2011, 23, 324–330. [Google Scholar] [CrossRef] [PubMed] [Green Version]
- Storto, C.L. The trade-off between cost efficiency and public service quality: A non-parametric frontier analysis of Italian major municipalities. Cities 2016, 51, 52–63. [Google Scholar] [CrossRef]
- Nepomuceno, T.C.C.; Silva, W.M.N.; Nepomuceno, K.T.C.; Barros, I.K.F. A DEA-based complexity of needs approach for hospital beds evacuation during the COVID-19 outbreak. J. Heal. Eng. 2020, 2020, 1–9. [Google Scholar] [CrossRef] [PubMed]
- Ruiz, F.; Cabello, J. MRP-PCI: A multiple reference point based partially compensatory composite indicator for sustainability assessment. Sustainability 2021, 13, 1261. [Google Scholar] [CrossRef]
- Seibert, R.; Macagnan, C.; Dixon, R. Priority stakeholders’ perception: Social responsibility indicators. Sustainability 2021, 13, 1034. [Google Scholar] [CrossRef]
- Pereira, D.V.E.S.; Mota, C.M.D.M. Human development index based on ELECTRE TRI-C multicriteria method: An application in the city of Recife. Soc. Indic. Res. 2016, 125, 19–45. [Google Scholar] [CrossRef]
- Morais, D.C.; De Almeida, A.T. Integrated model of problem structuring and multicriteria group decision making for social sustainable development. Braz. J. Oper. Prod. Manag. 2009, 6, 27–49. [Google Scholar]
- Martins, C.L.; López, H.M.L.; de Almeida, A.T.; Almeida, J.A.; Bortoluzzi, M.B.D.O. An MCDM project portfolio web-based DSS for sustainable strategic decision making in an electricity company. Ind. Manag. Data Syst. 2017, 117, 1362–1375. [Google Scholar] [CrossRef] [Green Version]
- Daraio, C.; Kerstens, K.; Nepomuceno, T.; Sickles, R.C. Empirical surveys of frontier applications: A meta-review. Int. Trans. Oper. Res. 2020, 27, 709–738. [Google Scholar] [CrossRef] [Green Version]
- Daraio, C.; Nepomuceno, T.C.C.; Costa, A.P.C.S. Theoretical and empirical advances in the assessment of productive efficiency since the introduction of DEA: A bibliometric analysis. Int. J. Oper. Res. 2021, 1. [Google Scholar] [CrossRef]
- Aldamak, A.; Zolfaghari, S. Review of efficiency ranking methods in data envelopment analysis. Measurement 2017, 106, 161–172. [Google Scholar] [CrossRef]
- Lee, J.; Choi, G. A dominance-based network method for ranking efficient decision-making units in data envelopment analysis. Sustainability 2019, 11, 2059. [Google Scholar] [CrossRef] [Green Version]
- Nepomuceno, T.C.C.; Santiago, K.T.M.; Daraio, C.; Costa, A.P.C.S. Exogenous crimes and the assessment of public safety efficiency and effectiveness. Ann. Oper. Res. 2020, 1–34. [Google Scholar] [CrossRef]
- Daraio, C.; Simar, L. Introducing environmental variables in nonparametric frontier models: A probabilistic approach. J. Prod. Anal. 2005, 24, 93–121. [Google Scholar] [CrossRef]
- Daraio, C.; Simar, L. Advanced Robust and Nonparametric Methods in Efficiency Analysis: Methodology and Applications; Springer Science & Business Media: New York, NY, USA, 2007. [Google Scholar]
- Daraio, C.; Simar, L. Conditional nonparametric frontier models for convex and nonconvex technologies: A unifying approach. J. Prod. Anal. 2007, 28, 13–32. [Google Scholar] [CrossRef] [Green Version]
- Benayoun, R.; Roy, B.; Sussman, N. Manual de Reference du Programme Electre: Note De Synthese et Formaton; Direction Scientifque SEMA: Paris, France, 1966; Volume 25. [Google Scholar]
- Roy, B. Classement et choix en présence de points de vue multiples (la méthode ELECTRE). Rev. d’Inform. Rech. Opérationelle 1968, 8, 57–75. [Google Scholar]
- Brans, J.P. L’Ingénierie de la Décision: Élaboration d’Instruments d’Aide à la Décision. La Méthode PROMETHEE; Presses de l’Université Laval: Québec, QC, Canada, 1982. [Google Scholar]
- Brans, J.P.; Vincke, P.; Mareschal, B. How to select and how to rank projects: The PROMETHEE method. Eur. J. Oper. Res. 1986, 24, 228–238. [Google Scholar] [CrossRef]
- Mareschal, B.; Brans, J.P.; Vincke, P. PROMETHEE: A New Family of Outranking Methods in Multicriteria Analysis; No. 2013/9305; Universite Libre de Bruxelles: Bruxelles, Belgium, 1984. [Google Scholar]
- Belton, V.; Stewart, T.J. Multiple Criteria Decision Analysis: An Integrated Approach; Kluwer Academic Publisher: Amsterdam, The Netherlands, 2002. [Google Scholar]
- Figueira, J.; Greco, S.; Ehrogott, M. Multiple Criteria Decision Analysis: State of the Art Surveys; Springer Science and Business Media: New York, NY, USA, 2016. [Google Scholar]
- Behzadian, M.; Kazemzadeh, R.; Albadvi, A.; Aghdasi, M. PROMETHEE: A comprehensive literature review on methodologies and applications. Eur. J. Oper. Res. 2010, 200, 198–215. [Google Scholar] [CrossRef]
- Huber, S.; Geiger, M.J.; de Almeida, A.T. Multiple Criteria Decision Making and Aiding; Springer: Berlin/Heidelberg, Germany, 2019. [Google Scholar]
- De Almeida, A.T.; Alencar, M.H.; Garcez, T.V.; Ferreira, R.J.P. A systematic literature review of multicriteria and multi-objective models applied in risk management. IMA J. Manag. Math. 2017, 28, 153–184. [Google Scholar] [CrossRef]
- Deprins, D.; Simar, L.; Tulkens, L. Measuring labor efficiency in post offices. In The Performance of Public Enterprises: Concepts and Measurement; Marchand, M., Pestieau, P., Tulkens, H., Eds.; North-Holland: Amsterdam, The Netherlands, 1984; pp. 243–267. [Google Scholar]
- Ratton, J.L.; Daudelin, J. Construction and deconstruction of a homicide reduction policy: The case of pact for life in Pernambuco, Brazil. Int. J. Criminol. Sociol. 2018, 7, 173–183. [Google Scholar] [CrossRef] [Green Version]
- Ratton, J.L.; Galvão, C.; Fernandez, M. Pact for life and the reduction of homicides in the state of Pernambuco. Stab. Int. J. Secur. Dev. 2014, 3, 18. [Google Scholar] [CrossRef]
- Mota, C.M.D.M.; de Figueiredo, C.J.J.; Pereira, D.V.E.S. Identifying areas vulnerable to homicide using multiple criteria analysis and spatial analysis. Omega 2020, 100, 102211. [Google Scholar] [CrossRef]
- De Figueiredo, C.J.J.; Pereira, D.V.D.S.; Mota, C.M.D.M. Multi-criteria approach with spatial analysis and remote sensing for public security planning. GI_Forum 2017, 1, 164–172. [Google Scholar] [CrossRef]
- Menezes, T.; Silveira-Neto, R.; Monteiro, C.; Ratton, J.L. Spatial correlation between homicide rates and inequality: Evidence from urban neighborhoods. Econ. Lett. 2013, 120, 97–99. [Google Scholar] [CrossRef]
- Figueiredo, C.; Mota, C. Learning preferences in a spatial multiple criteria decision approach: An application in public security planning. Int. J. Inf. Technol. Decis. Mak. 2019, 18, 1403–1432. [Google Scholar] [CrossRef]
- De Figueiredo, C.J.J.; Mota, C.M.D.M. A classification model to evaluate the security level in a city based on GIS-MCDA. Math. Probl. Eng. 2016, 2016, 1–10. [Google Scholar] [CrossRef] [Green Version]
- Nepomuceno, T.C.C.; Costa, A.P.C.S. Spatial visualization on patterns of disaggregate robberies. Oper. Res. 2019, 19, 857–886. [Google Scholar] [CrossRef]
- De Gusmão, A.P.; Pereira, R.M.A.; Silva, M.M.; Borba, B.F.D.C. The use of a decision support system to aid a location problem regarding a public security facility. In Lecture Notes in Business Information Processing; Freitas, P., Dargam, F., Moreno, J., Eds.; Springer: Cham, Switzerland, 2019; Volume 348. [Google Scholar]
- Nepomuceno, T.C.C.; De Moura, J.A.; E Silva, L.C.; Costa, A.P.C.S. Alcohol and violent behavior among football spectators: An empirical assessment of Brazilian’s criminalization. Int. J. Law. Crime Justice 2017, 51, 34–44. [Google Scholar] [CrossRef]
- Daraio, C.; Simar, L. Directional distances and their robust versions: Computational and testing issues. Eur. J. Oper. Res. 2014, 237, 358–369. [Google Scholar] [CrossRef] [Green Version]
- Daraio, C.; Simar, L.; Wilson, P.W. Fast and efficient computation of directional distance estimators. Ann. Oper. Res. 2020, 288, 805–835. [Google Scholar] [CrossRef] [Green Version]
- Nepomuceno, T.C.C.; Daraio, C.; Costa, A.P.C.S. Combining multi-criteria and directional distances to decompose non-compensatory measures of sustainable banking efficiency. Appl. Econ. Lett. 2020, 27, 329–334. [Google Scholar] [CrossRef]
- Wang, K.; Xian, Y.; Lee, C.-Y.; Wei, Y.-M.; Huang, Z. On selecting directions for directional distance functions in a non-parametric framework: A review. Ann. Oper. Res. 2019, 278, 43–76. [Google Scholar] [CrossRef]
- Briec, W. A graph-type extension of Farrell technical efficiency measure. J. Prod. Anal. 1997, 8, 95–110. [Google Scholar] [CrossRef]
- Fukuyama, H.; Weber, W.L. Directional distance DEA Models. In Advances in DEA Theory and Applications: With Extensions to Forecasting Models, 1st ed.; Tome, K., Ed.; John Wiley & Sons: Hoboken, NJ, USA, 2017; Chapter 3; pp. 20–27. [Google Scholar]
- Daraio, C.; Simar, L. Efficiency and benchmarking with directional distances: A data-driven approach. J. Oper. Res. Soc. 2016, 67, 928–944. [Google Scholar] [CrossRef] [Green Version]
- Färe, R.; Grosskopf, S.; Whittaker, G. Directional output distance functions: Endogenous directions based on exogenous normalization constraints. J. Prod. Anal. 2013, 40, 267–269. [Google Scholar] [CrossRef]
- Barron, F.H. Selecting a best multi-attribute alternative with partial information about attribute weights. Acta Psychol. 1992, 80, 91–103. [Google Scholar] [CrossRef]
- Nepomuceno, T.C.; Costa, A.P.C. Resource allocation with time series DEA applied to Brazilian federal saving banks. Econ. Bull. 2019, 39, 1384–1392. [Google Scholar]
- Nepomuceno, T.C.C.; De Carvalho, V.D.H.; Costa, A.P.C.S. Time-series directional efficiency for knowledge benchmarking in service organizations. In Advances in Intelligent Systems and Computing; Springer: Cham, Switzerland, 2020; Volume 1159, pp. 333–339. [Google Scholar] [CrossRef]
- Nepomuceno, K.; Nepomuceno, T.; Sadok, D. Measuring the internet technical efficiency: A ranking for the world wide web pages. IEEE Lat. Am. Trans. 2020, 18, 1119–1125. [Google Scholar] [CrossRef]
Figure 1.
Framework for the Non-compensatory Ranking Methodology.

Figure 2.
Boxplots of the variables used as input and outputs in the analysis.

Figure 3.
Boxplots of the crime variables used as environmental factors in the analysis.

Figure 4.
Rankings sensitivity. Panel (a): equal weighs (unique); Panel (b): ROC weights considering the four criteria (L4); Panel (c): ROC weights considering only the efficiency models (L3); Panel (d): scenarios comparison.
Figure 4.
Rankings sensitivity. Panel (a): equal weighs (unique); Panel (b): ROC weights considering the four criteria (L4); Panel (c): ROC weights considering only the efficiency models (L3); Panel (d): scenarios comparison.


Table 1.
Data Descriptive Statistics.
| Variable. | Total | Min. | Max. | Median | Mean | 1st Q. | 3rd Q. | Std. Dev. |
|---|---|---|---|---|---|---|---|---|
| Input | ||||||||
| Officers | 1430 | 3.000 | 48.000 | 8.000 | 9.862 | 6.000 | 11.000 | 6.36 |
| Outputs | ||||||||
| Violent Crime | 1212 | 0.000 | 42.000 | 5.000 | 8.359 | 3.000 | 11.000 | 9.24 |
| Street Mugging | 1334 | 0.0 | 79.0 | 5.0 | 9.2 | 1.0 | 10.0 | 13.24 |
| Carjacking | 298 | 0.000 | 25.000 | 1.000 | 2.055 | 0.000 | 2.000 | 3.89 |
| Environmental Factors | ||||||||
| Violent Crime | 2905 | 0.00 | 198.00 | 13.00 | 20.03 | 7.00 | 26.00 | 23.94 |
| Street Mugging | 20,890 | 2.0 | 2198.0 | 42.0 | 144.1 | 19.0 | 135.0 | 300.9 |
| Carjacking | 10,180 | 1.00 | 1161.00 | 25.00 | 70.21 | 11.00 | 63.00 | 127.92 |
Table 2.
Some Relevant Ranking Reversals (Weights Sensitivity Analysis).
| DMUs | Position (L4) | Position (Unique) | Position (L3) |
|---|---|---|---|
| Cumaru | 1 | 1 | 11 |
| Lagoa do Ouro | 2 | 6 | 6 |
| Água Preta | 3 | 8 | 9 |
| Itaquitinga | 4 | 3 | 7 |
| Jucati | 5 | 1 | 1 |
| Terezinha | 6 | 11 | 24 |
| Camocim de São Félix | 7 | 7 | 1 |
| Jataúba | 8 | 5 | 4 |
| Joaquim Nabuco | 9 | 15 | 26 |
| Correntes | 10 | 16 | 14 |
Table 3.
Effective and Efficient Units.
| Position | Compensatory Position | DMUs | Net Flow | Effectiveness | Relative Inefficiency |
|---|---|---|---|---|---|
| 1 | 18 | Jucati | 0.456 | 0.333 | 0.000 |
| 2 | 37 | Saloá | 0.279 | 0.250 | 0.000 |
| 3 | 69 | Camocim de São Félix | 0.006 | 0.154 | 0.000 |
Table 4.
Effective and Inefficient Units.
| Position | Compensatory Position | DMUs | Net Flow | Effectiveness | Relative Inefficiency |
|---|---|---|---|---|---|
| 4 | 2 | Cumaru | 0.778 | 1.000 | 0.250 |
| 5 | 4 | Lagoa do Ouro | 0.686 | 0.600 | 0.333 |
| 6 | 10 | Água Preta | 0.579 | 0.500 | 0.333 |
| 7 | 11 | Itaquitinga | 0.545 | 0.444 | 0.200 |
| 8 | 19 | Terezinha | 0.452 | 0.600 | 0.400 |
| 9 | 26 | Calçado | 0.363 | 0.500 | 0.389 |
| 10 | 32 | Jataúba | 0.315 | 0.286 | 0.167 |
| 11 | 35 | Joaquim Nabuco | 0.284 | 0.500 | 0.381 |
| 12 | 36 | Correntes | 0.281 | 0.333 | 0.250 |
| 13 | 40 | Jatobá | 0.219 | 0.500 | 0.476 |
| 14 | 45 | Moreilândia | 0.205 | 0.667 | 0.541 |
| 15 | 46 | Catende | 0.195 | 0.432 | 0.466 |
| 16 | 47 | Canhotinho | 0.193 | 0.250 | 0.200 |
| 17 | 60 | Quipapá | 0.063 | 0.500 | 0.541 |
| 18 | 61 | Araçoiaba | 0.060 | 0.422 | 0.500 |
| 19 | 62 | Petrolândia | 0.053 | 0.400 | 0.458 |
| 20 | 67 | Tabira | 0.014 | 0.444 | 0.444 |
| 21 | 68 | Santa Cruz | 0.010 | 0.400 | 0.500 |
| 22 | 71 | São Caitano | −0.006 | 0.187 | 0.259 |
| 23 | 76 | Mirandiba | −0.033 | 0.500 | 0.545 |
| 24 | 78 | Jaqueira | −0.039 | 0.272 | 0.428 |
| 25 | 79 | Amaraji | −0.042 | 0.300 | 0.466 |
| 26 | 80 | Ipubi | −0.051 | 0.307 | 0.444 |
| 27 | 85 | Lagoa de Itaenga | −0.076 | 0.166 | 0.190 |
| 28 | 87 | Agrestina | −0.083 | 0.333 | 0.444 |
| 29 | 90 | Riacho das Almas | −0.098 | 0.250 | 0.428 |
| 30 | 91 | Custódia | −0.103 | 0.4545 | 0.566 |
| 31 | 93 | Ouricuri | −0.124 | 0.500 | 0.648 |
| 32 | 96 | Tamandaré | −0.157 | 0.347 | 0.533 |
| 33 | 107 | Floresta | −0.259 | 0.181 | 0.393 |
| 34 | 109 | Angelim | −0.282 | 0.200 | 0.400 |
| 35 | 110 | Brejo da Madre de Deus | −0.293 | 0.355 | 0.545 |
| 36 | 111 | Águas Belas | −0.295 | 0.136 | 0.296 |
| 37 | 116 | Palmares | −0.328 | 0.232 | 0.375 |
| 38 | 119 | Bom Conselho | −0.364 | 0.250 | 0.444 |
| 39 | 121 | Belém de Maria | −0.375 | 0.200 | 0.428 |
| 40 | 125 | Cortês | −0.404 | 0.125 | 0.333 |
| 41 | 127 | Araripina | −0.423 | 0.166 | 0.461 |
| 42 | 128 | Aliança | −0.438 | 0.210 | 0.500 |
| 43 | 135 | Toritama | −0.577 | 0.152 | 0.500 |
| 44 | 138 | João Alfredo | −0.586 | 0.142 | 0.515 |
| 45 | 140 | Sertânia | −0.599 | 0.181 | 0.518 |
Table 5.
Ineffective and Inefficient Units.
| Position | Compensatory Position | DMUs | Net Flow | Effectiveness | Relative Inefficiency |
|---|---|---|---|---|---|
| 46 | 1 | Paranatama | 0.819 | 0.000 | 0.166 |
| 47 | 3 | Jupi | 0.761 | 0.000 | 0.0555 |
| 48 | 5 | Goiana | 0.681 | 0.000 | 0.288 |
| 49 | 6 | Santa Terezinha | 0.597 | 0.000 | 0.333 |
| 50 | 7 | Venturosa | 0.586 | −0.166 | 0.208 |
| 51 | 8 | Sanharó | 0.586 | −0.111 | 0.166 |
| 52 | 9 | Casinhas | 0.583 | −0.182 | 0.166 |
| 53 | 12 | Lajedo | 0.542 | −0.107 | 0.091 |
| 54 | 13 | Iati | 0.540 | −0.166 | 0.266 |
| 55 | 14 | Bezerros | 0.529 | 0.020 | 0.354 |
| 56 | 15 | Nazaré da Mata | 0.512 | 0.100 | 0.424 |
| 57 | 16 | Escada | 0.459 | −0.021 | 0.411 |
| 58 | 17 | Ribeirão | 0.456 | 0 | 0.416 |
| 59 | 20 | Cabo de Santo Agostinho | 0.443 | −0.294 | 0.144 |
| 60 | 21 | Macaparana | 0.429 | −0.111 | 0.375 |
| 61 | 22 | Brejão | 0.392 | −0.166 | 0.333 |
| 62 | 23 | Feira Nova | 0.378 | 0.000 | 0.375 |
| 63 | 24 | Camutanga | 0.377 | 0.000 | 0.444 |
| 64 | 25 | Tuparetama | 0.377 | 0.000 | 0.444 |
| 65 | 27 | Cupira | 0.351 | −0.464 | 0.111 |
| 66 | 28 | Vitória de Santo Antão | 0.339 | −0.430 | 0.166 |
| 67 | 29 | Limoeiro | 0.336 | −0.227 | 0.111 |
| 68 | 30 | Vertentes | 0.335 | −0.315 | 0.285 |
| 69 | 31 | Camaragibe | 0.318 | −0.277 | 0.363 |
| 70 | 33 | Itambé | 0.314 | −0.111 | 0.416 |
| 71 | 34 | Itaíba | 0.310 | 0.000 | 0.476 |
| 72 | 38 | Ferreiros | 0.277 | −0.333 | 0.166 |
| 73 | 39 | Barreiros | 0.265 | −0.304 | 0.333 |
| 74 | 41 | Capoeiras | 0.219 | −0.333 | 0.333 |
| 75 | 42 | Sairé | 0.209 | −0.143 | 0.381 |
| 76 | 43 | Belo Jardim | 0.205 | −0.589 | 0.143 |
| 77 | 44 | Timbaúba | 0.205 | −0.307 | 0.372 |
| 78 | 48 | Caetés | 0.193 | −0.363 | 0.333 |
| 79 | 49 | Serrita | 0.189 | 0.000 | 0.518 |
| 80 | 50 | Taquaritinga do Norte | 0.176 | −0.500 | 0.333 |
| 81 | 51 | Rio Formoso | 0.155 | −0.176 | 0.466 |
| 82 | 52 | Sirinhaém | 0.155 | −0.518 | 0.200 |
| 83 | 53 | Pesqueira | 0.138 | −0.272 | 0.285 |
| 84 | 54 | Trindade | 0.122 | −0.210 | 0.407 |
| 85 | 55 | Machados | 0.090 | −0.666 | 0.277 |
| 86 | 56 | Arcoverde | 0.086 | −0.090 | 0.529 |
| 87 | 57 | São José do Egito | 0.080 | 0.000 | 0.545 |
| 88 | 58 | Santa Maria da Boa Vista | 0.077 | −0.090 | 0.547 |
| 89 | 59 | Ibimirim | 0.074 | −0.071 | 0.555 |
| 90 | 63 | São Bento do Una | 0.046 | −0.280 | 0.500 |
| 91 | 64 | Passira | 0.041 | −0.333 | 0.388 |
| 92 | 65 | Belém do São Francisco | 0.031 | 0.000 | 0.606 |
| 93 | 66 | São Vicente Ferrer | 0.019 | −0.545 | 0.285 |
| 94 | 70 | Tupanatinga | −0.002 | −0.444 | 0.428 |
| 95 | 72 | Serra Talhada | −0.014 | −0.025 | 0.597 |
| 96 | 73 | Paudalho | −0.017 | −0.115 | 0.463 |
| 97 | 74 | Afrânio | −0.020 | −0.500 | 0.388 |
| 98 | 75 | São João | −0.021 | −1.000 | 0.200 |
| 99 | 77 | São Benedito do Sul | −0.037 | −1.500 | 0.166 |
| 100 | 81 | Vicência | −0.053 | −0.647 | 0.407 |
| 101 | 82 | Panelas | −0.054 | −0.727 | 0.375 |
| 102 | 83 | São Joaquim do Monte | −0.063 | −1.900 | 0.133 |
| 103 | 84 | Lagoa Grande | −0.069 | −1.000 | 0.333 |
| 104 | 86 | Lagoa do Carro | −0.080 | −1.375 | 0.208 |
| 105 | 88 | Carpina | −0.083 | −0.551 | 0.283 |
| 106 | 89 | Gameleira | −0.089 | −0.529 | 0.407 |
| 107 | 92 | Barra de Guabiraba | −0.121 | −1.166 | 0.333 |
| 108 | 94 | Bonito | −0.133 | −1.416 | 0.250 |
| 109 | 95 | Santa Cruz do Capibaribe | −0.142 | −0.288 | 0.473 |
| 110 | 97 | Salgueiro | −0.168 | −0.150 | 0.636 |
| 111 | 98 | Tracunhaém | −0.172 | −0.375 | 0.444 |
| 112 | 99 | Bom Jardim | −0.173 | −1.154 | 0.333 |
| 113 | 100 | Chã Grande | −0.174 | −0.666 | 0.388 |
| 114 | 101 | Tacaimbó | −0.174 | −0.666 | 0.388 |
| 115 | 102 | Primavera | −0.175 | −0.571 | 0.444 |
| 116 | 103 | Moreno | −0.184 | −0.311 | 0.388 |
| 117 | 104 | Vertente do Lério | −0.207 | −1.333 | 0.333 |
| 118 | 105 | Altinho | −0.210 | −1.500 | 0.200 |
| 119 | 106 | Surubim | −0.214 | −0.421 | 0.509 |
| 120 | 108 | São José da Coroa Grande | −0.263 | −1.277 | 0.407 |
| 121 | 112 | Xexéu | −0.295 | −0.714 | 0.458 |
| 122 | 113 | Buíque | −0.299 | −0.900 | 0.407 |
| 123 | 114 | Palmeirina | −0.301 | −1.000 | 0.4 |
| 124 | 115 | Iguaraci | −0.306 | −1.000 | 0.333 |
| 125 | 117 | Flores | −0.338 | −0.333 | 0.600 |
| 126 | 118 | Orobó | −0.349 | −3.000 | 0.333 |
| 127 | 120 | São Lourenço da Mata | −0.368 | −0.444 | 0.433 |
| 128 | 122 | São José do Belmonte | −0.381 | −0.375 | 0.600 |
| 129 | 123 | Orocó | −0.390 | −1.200 | 0.444 |
| 130 | 124 | Betânia | −0.400 | −1.000 | 0.476 |
| 131 | 126 | Condado | −0.421 | −2.000 | 0.380 |
| 132 | 129 | Glória do Goitá | −0.485 | −0.800 | 0.500 |
| 133 | 130 | Alagoinha | −0.500 | −2.000 | 0.388 |
| 134 | 131 | Cabrobó | −0.518 | −1.000 | 0.431 |
| 135 | 132 | Terra Nova | −0.543 | −2.000 | 0.444 |
| 136 | 133 | Parnamirim | −0.557 | −0.833 | 0.566 |
| 137 | 134 | Itapissuma | −0.577 | −0.833 | 0.583 |
| 138 | 136 | Exu | −0.584 | −1.600 | 0.500 |
| 139 | 137 | Tacaratu | −0.585 | −4.000 | 0.444 |
| 140 | 139 | Gravatá | −0.587 | −1.000 | 0.500 |
| 141 | 141 | Carnaíba | −0.637 | −3.000 | 0.4762 |
| 142 | 142 | Chã de Alegria | −0.647 | −1.500 | 0.500 |
| 143 | 143 | Bodocó | −0.710 | −1.333 | 0.566 |
| 144 | 144 | Pombos | −0.727 | −1.571 | 0.500 |
| 145 | 145 | Afogados da Ingazeira | −0.780 | −1.333 | 0.608 |
Publisher’s Note: MDPI stays neutral with regard to jurisdictional claims in published maps and institutional affiliations. |
© 2021 by the authors. Licensee MDPI, Basel, Switzerland. This article is an open access article distributed under the terms and conditions of the Creative Commons Attribution (CC BY) license (https://creativecommons.org/licenses/by/4.0/).
Share and Cite
MDPI and ACS Style
Nepomuceno, T.C.C.; Daraio, C.; Costa, A.P.C.S. Multicriteria Ranking for the Efficient and Effective Assessment of Police Departments. Sustainability 2021, 13, 4251. https://doi.org/10.3390/su13084251
AMA Style
Nepomuceno TCC, Daraio C, Costa APCS. Multicriteria Ranking for the Efficient and Effective Assessment of Police Departments. Sustainability. 2021; 13(8):4251. https://doi.org/10.3390/su13084251
Chicago/Turabian StyleNepomuceno, Thyago C. C., Cinzia Daraio, and Ana Paula C. S. Costa. 2021. "Multicriteria Ranking for the Efficient and Effective Assessment of Police Departments" Sustainability 13, no. 8: 4251. https://doi.org/10.3390/su13084251
Note that from the first issue of 2016, this journal uses article numbers instead of page numbers. See further details here.