
Design and Implementation of Probabilistic Transient Stability Approach to Assess the High Penetration of Renewable Energy in Korea


Abstract
:1. Introduction
2. The Proposed Flowchart for Probabilistic Transient Stability Assessment
2.1. Overall Flowchart
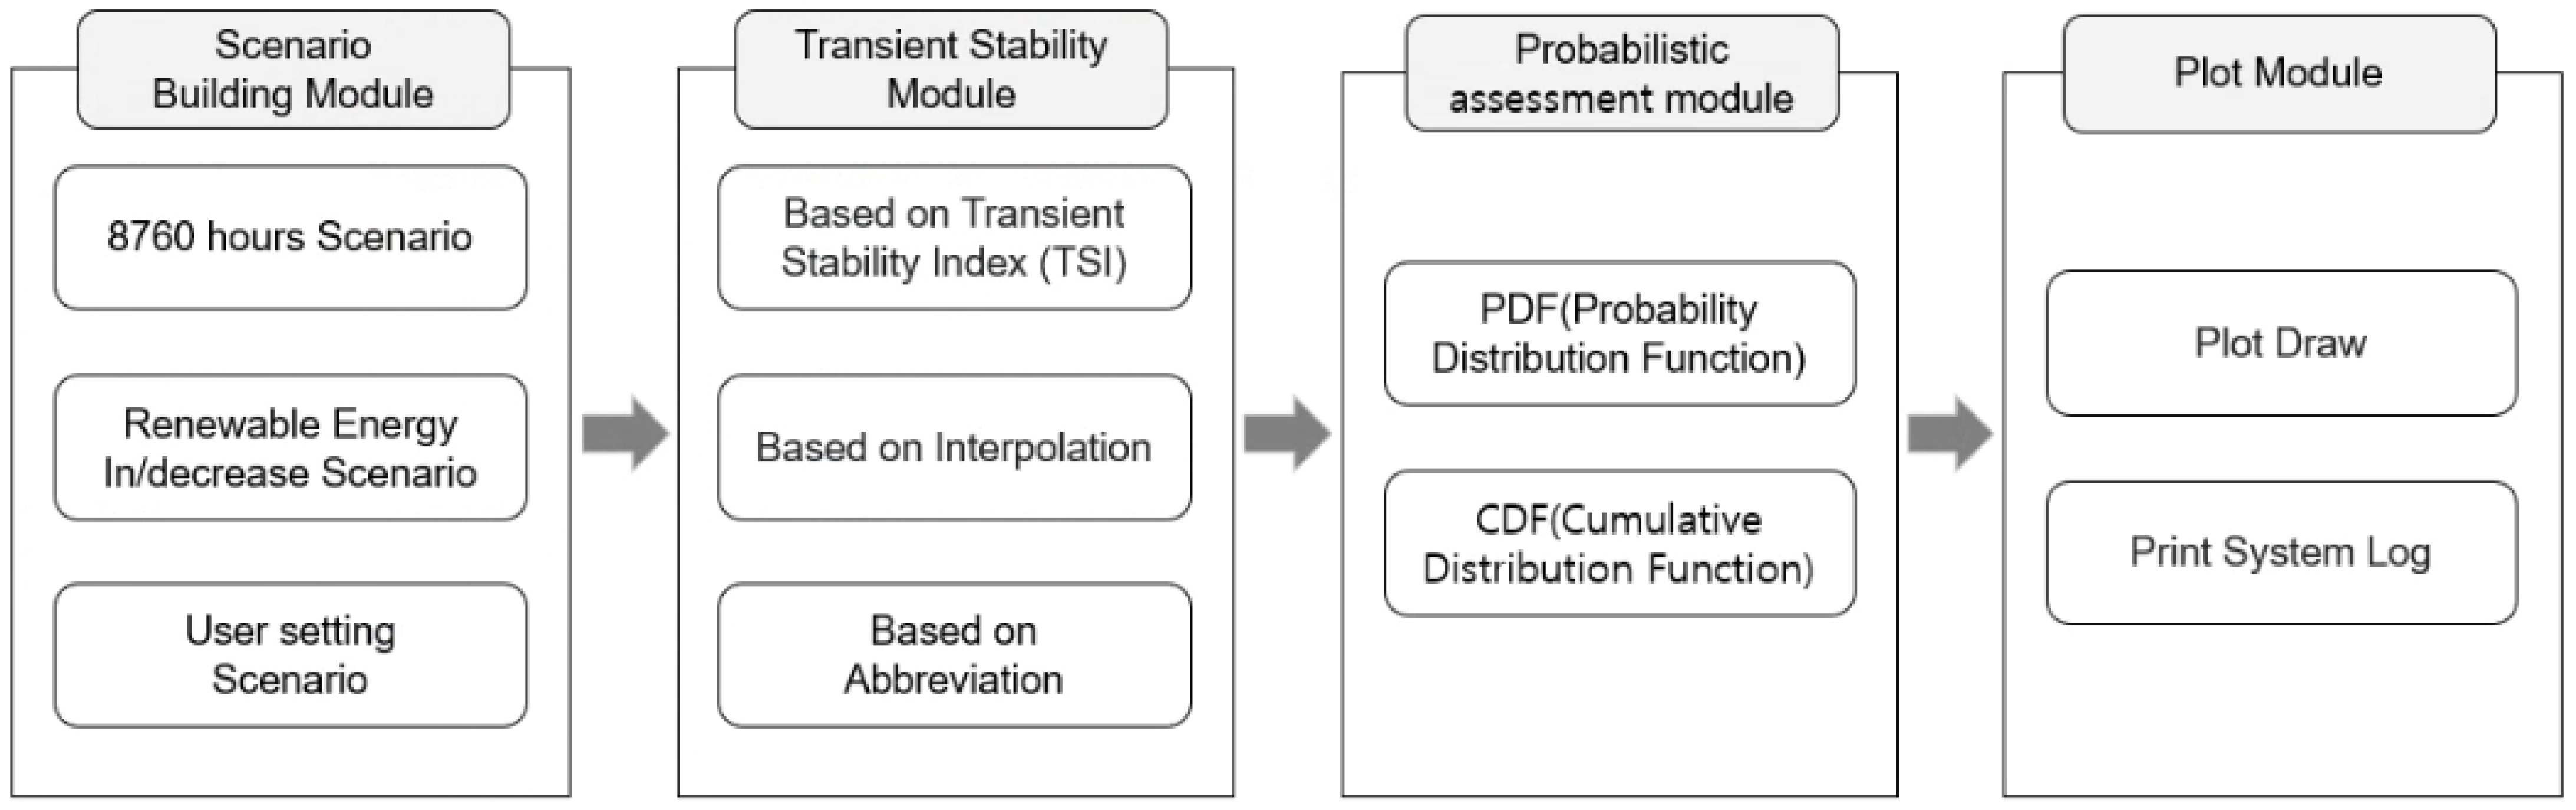
- Scenario creation module: to create 8760-h scenarios or scenarios for different increase/decrease ratios of renewable energy
- Transient stability assessment module: stability assessment based on transient stability index, stability assessment based on interpolation and reduction
- Wind turbine gust modelling module: Wind turbine gust modelling using a dynamic model for renewable energy
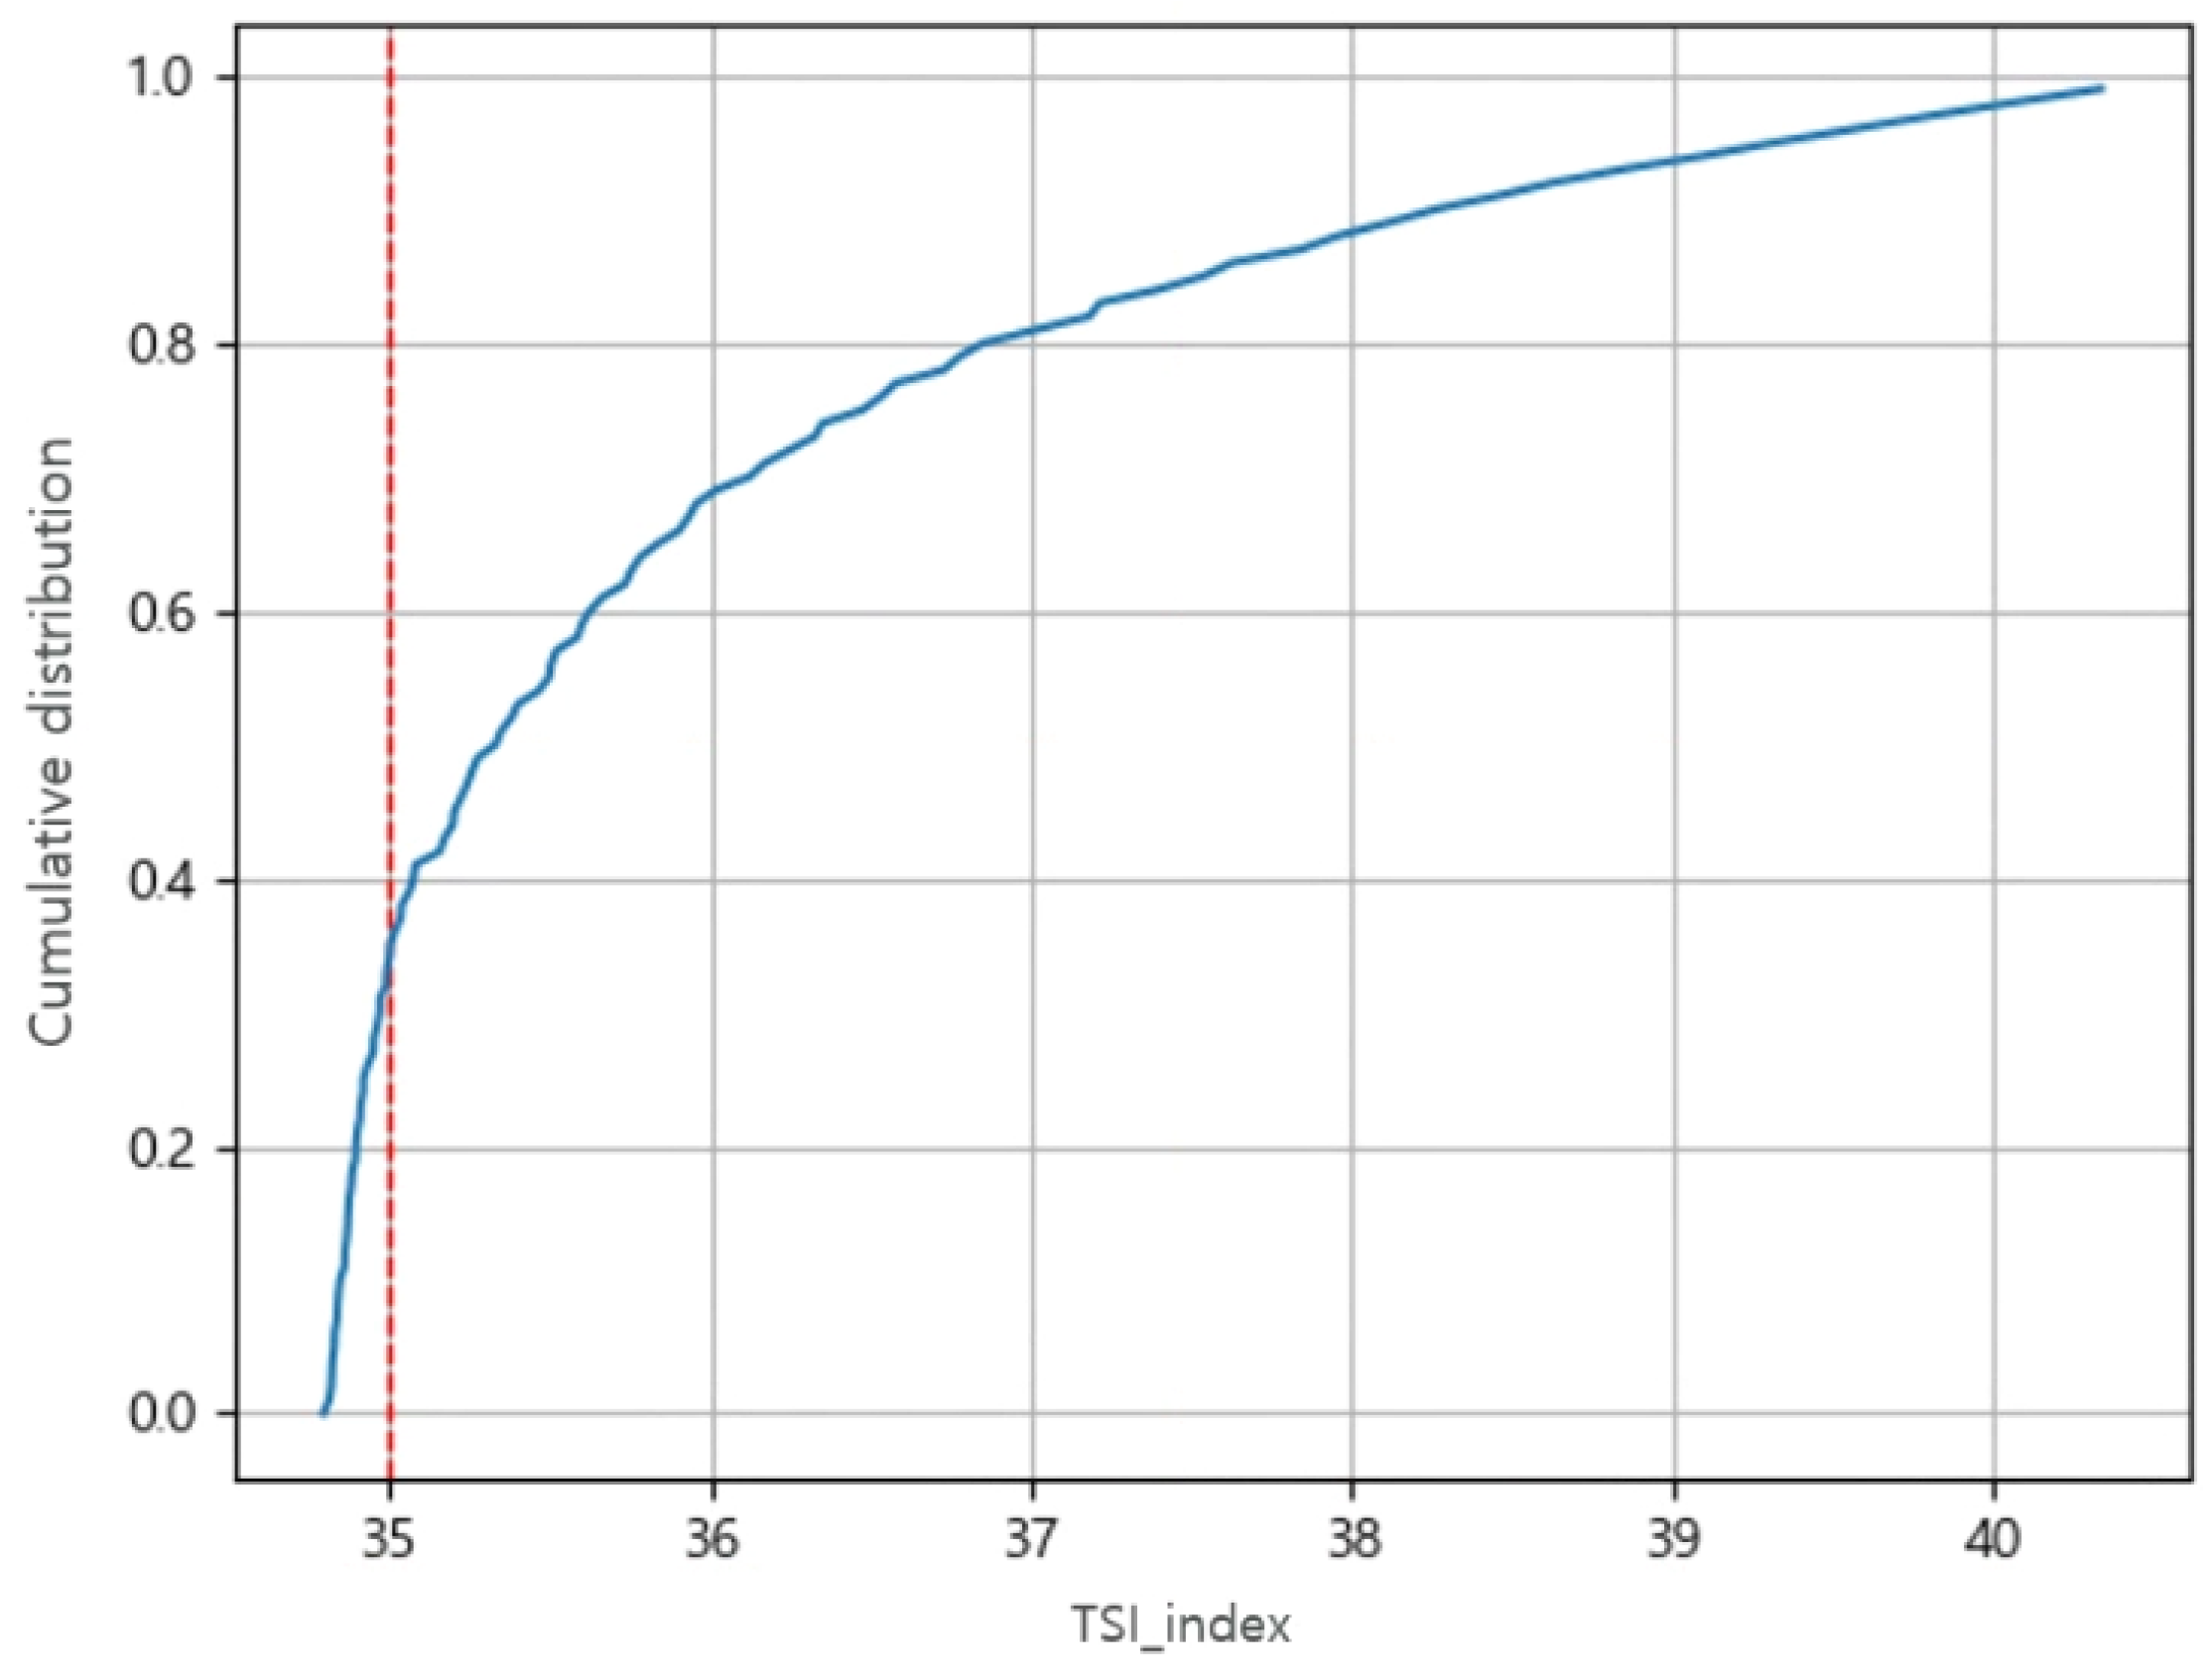
- Probabilistic assessment module: Probabilistic analysis and output in PDF and cumulative distribution functions (CDF) based on the results of the transient stability assessment
- Output module: Transient stability assessment results (text, charts, etc.) output, log output, etc.
2.2. Scenario Creation
- Input data: Basecase data (Power System Simulation for Engineering (PSS/E) data format), information on renewable energy link (interconnected bus, type and capacity of the renewable energy)
- Scenario Creation Process
- (1)
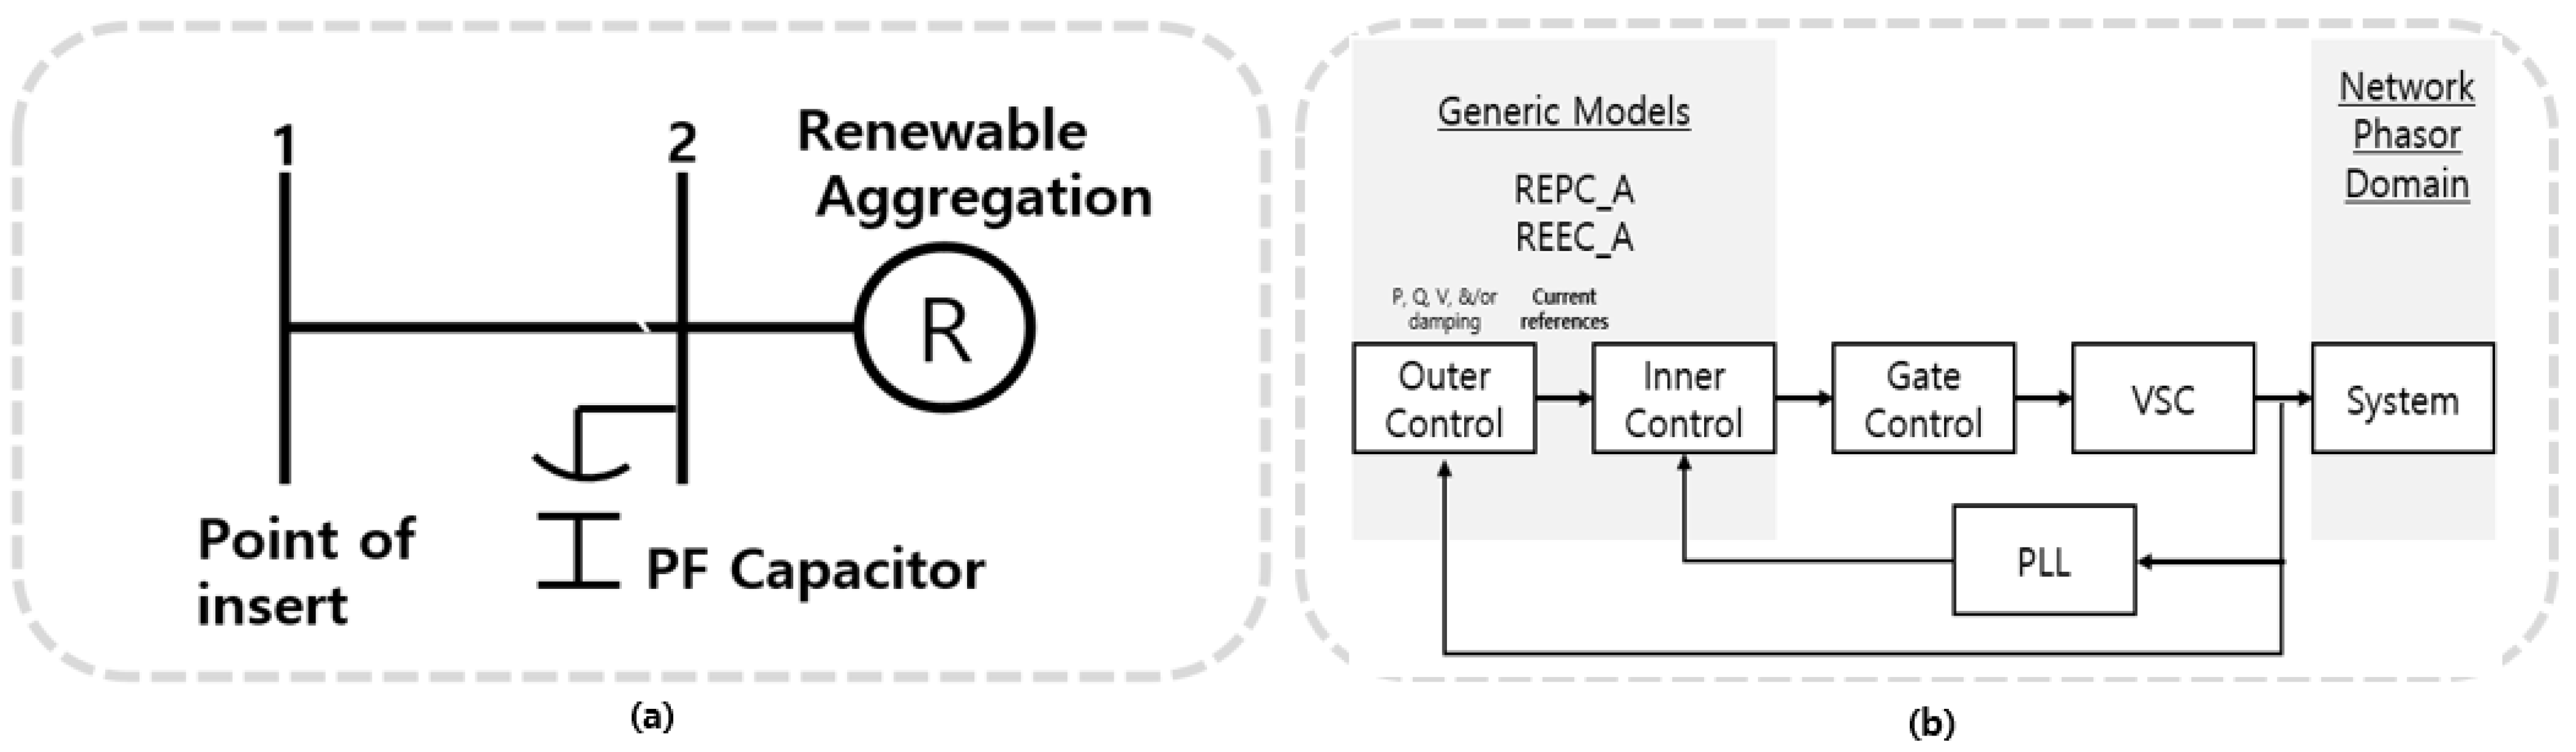
- Renewable energy is modelled into the basecase. As shown in Figure 4a, it is modelled using a simple renewable energy topology. This study simplified the modelling method and used connecting lines and transformers for modelling. Additionally, generators with step-up transformers are used to reduce the database size. As shown in Figure 4b, it is modelled using a dynamic model of renewable energy. Solar and wind power models are applied using the Western Electricity Coordinating Council (WECC) second generation model [13].
- (2)
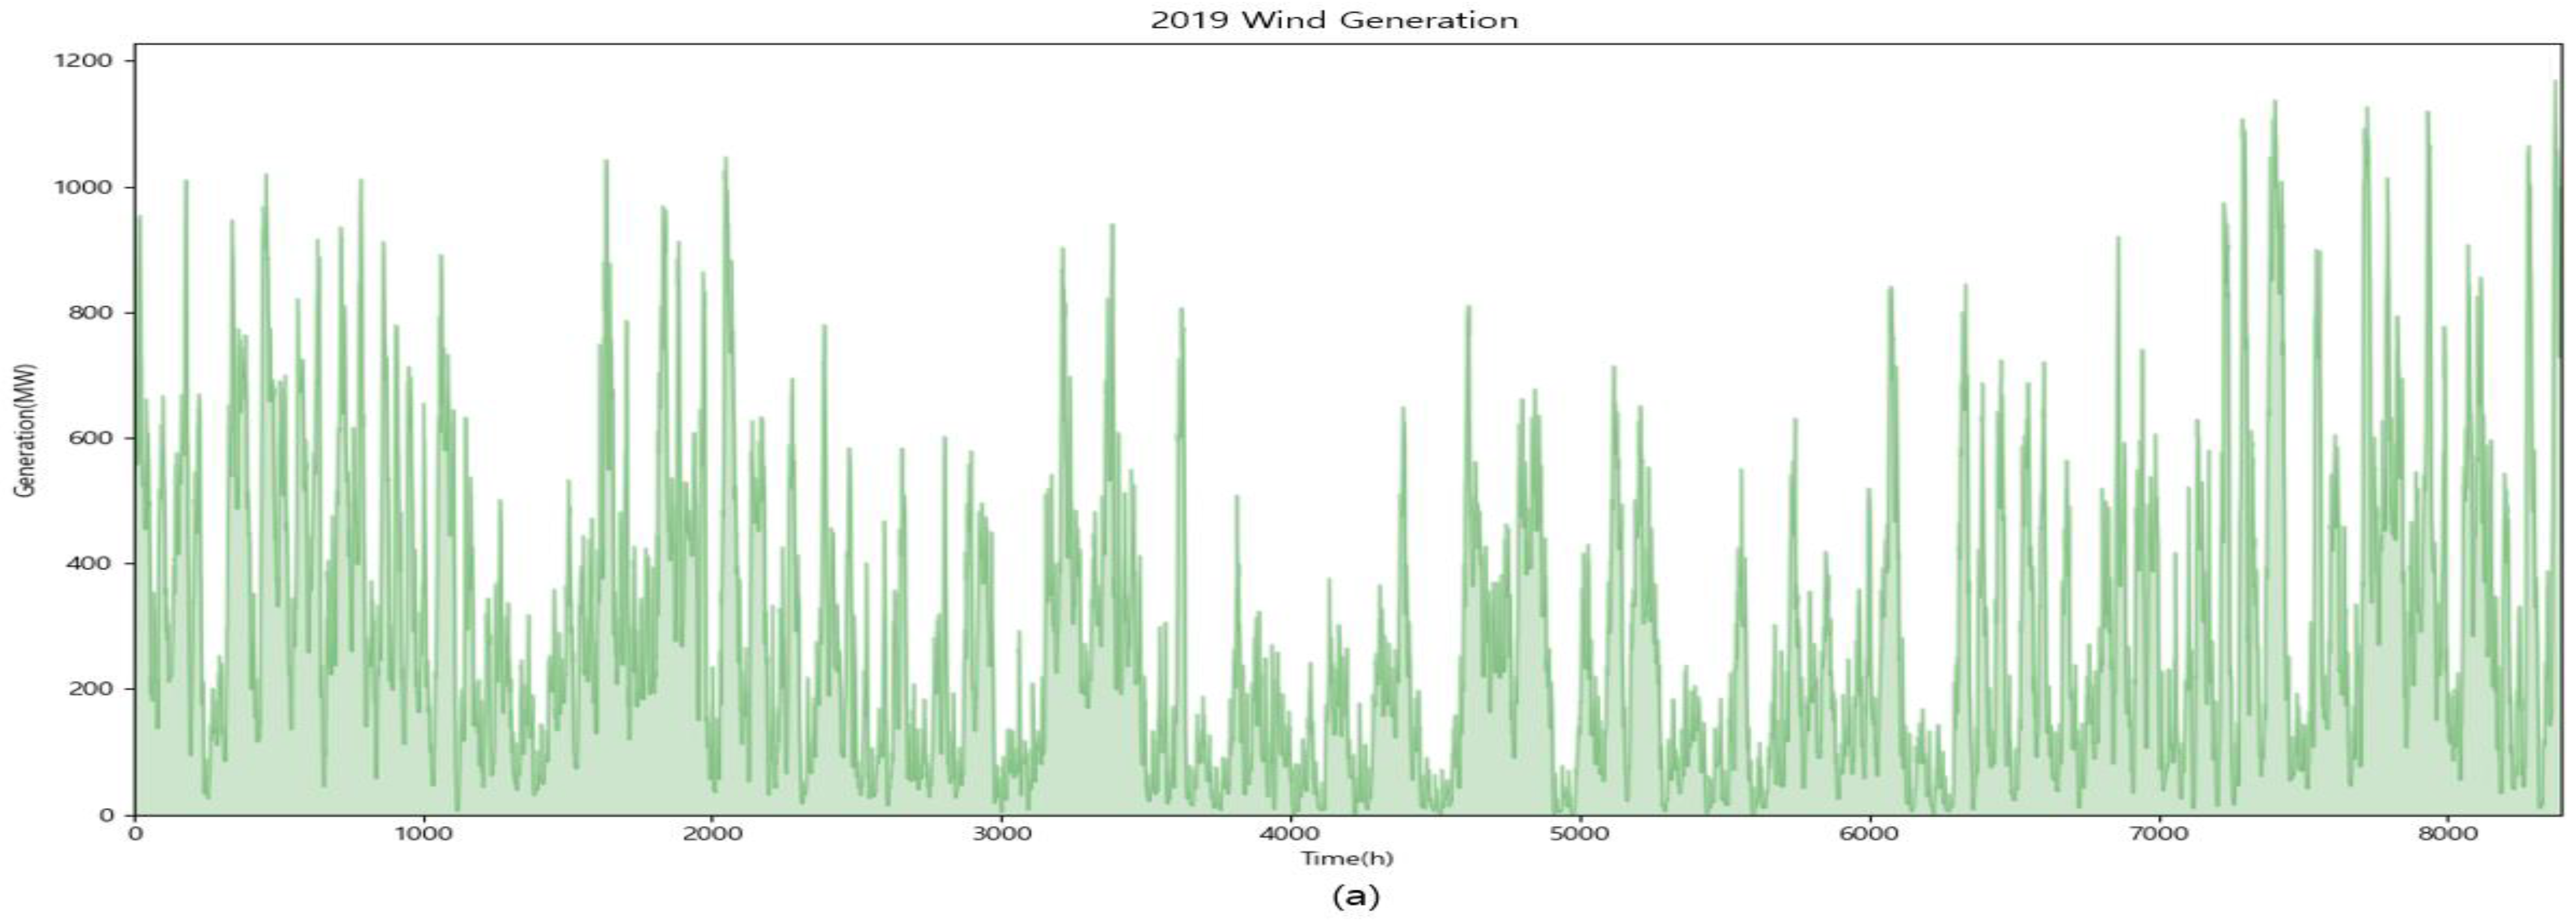
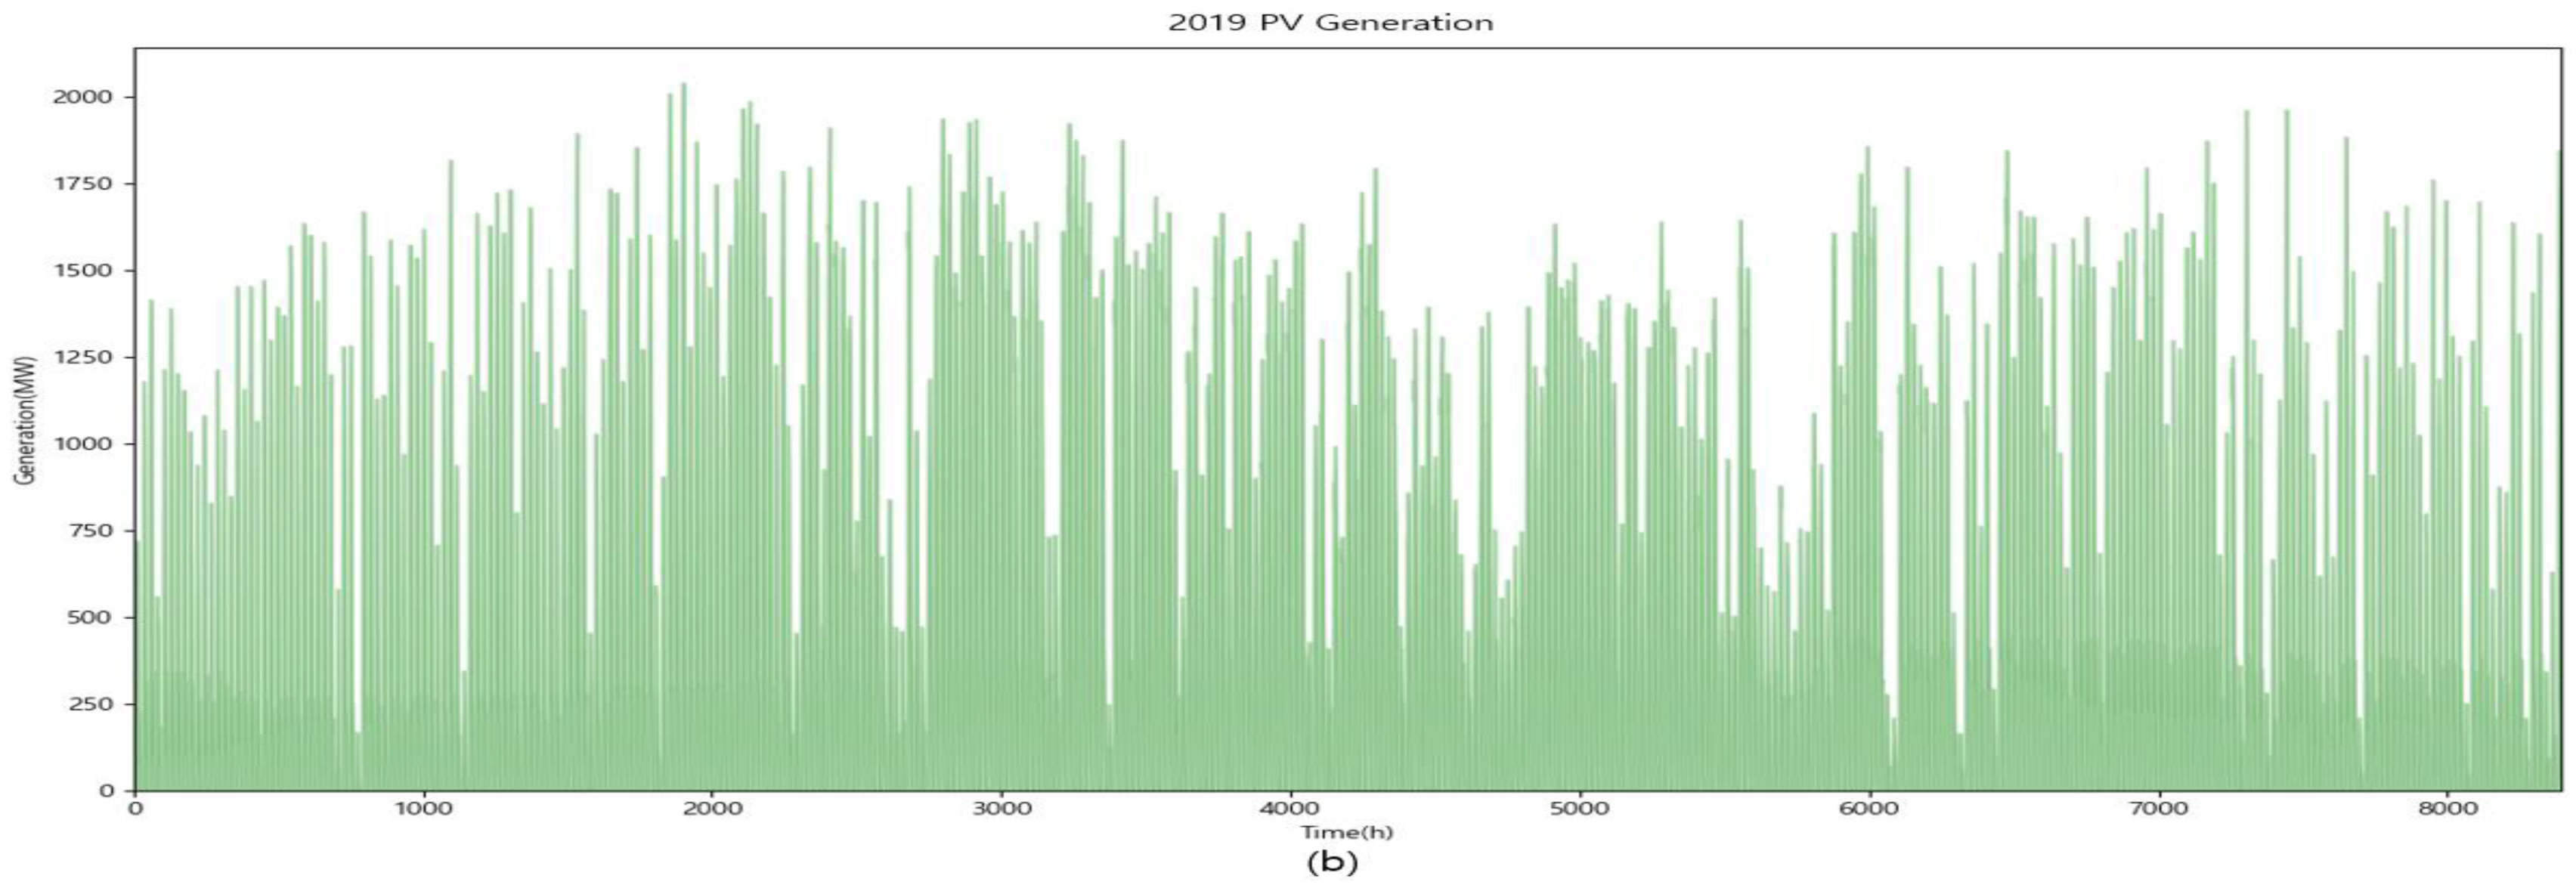
- Renewable energy generation quantity is adjusted based on the effective capacity data of renewable energy. As shown in Figure 5, the hourly generation of solar and wind power in Korea in 2019 is not constant and is distributed in various ways. Based on this, the amount of renewable energy output is adjusted in several stages. In this paper, the modeled effective capacity of renewable energy composed of 1% to 95%.
- (3)
- When the scenario is generated for the static analysis, the renewable energy power system was connected, leading to an increase in the amount of renewable energy generation, which causes errors in supply and demand, thereby enlarging the mismatch in the power system. To rebalance the supply and demand, either the existing generator should be suspended via dispatch, or the amount of power generation must be reduced. Thus, Generators are dispatched based on the merit order of the generators.
2.3. Transient Stability Assessment
2.3.1. Transient Stability Assessment Based on Transient Stability Index (TSI)
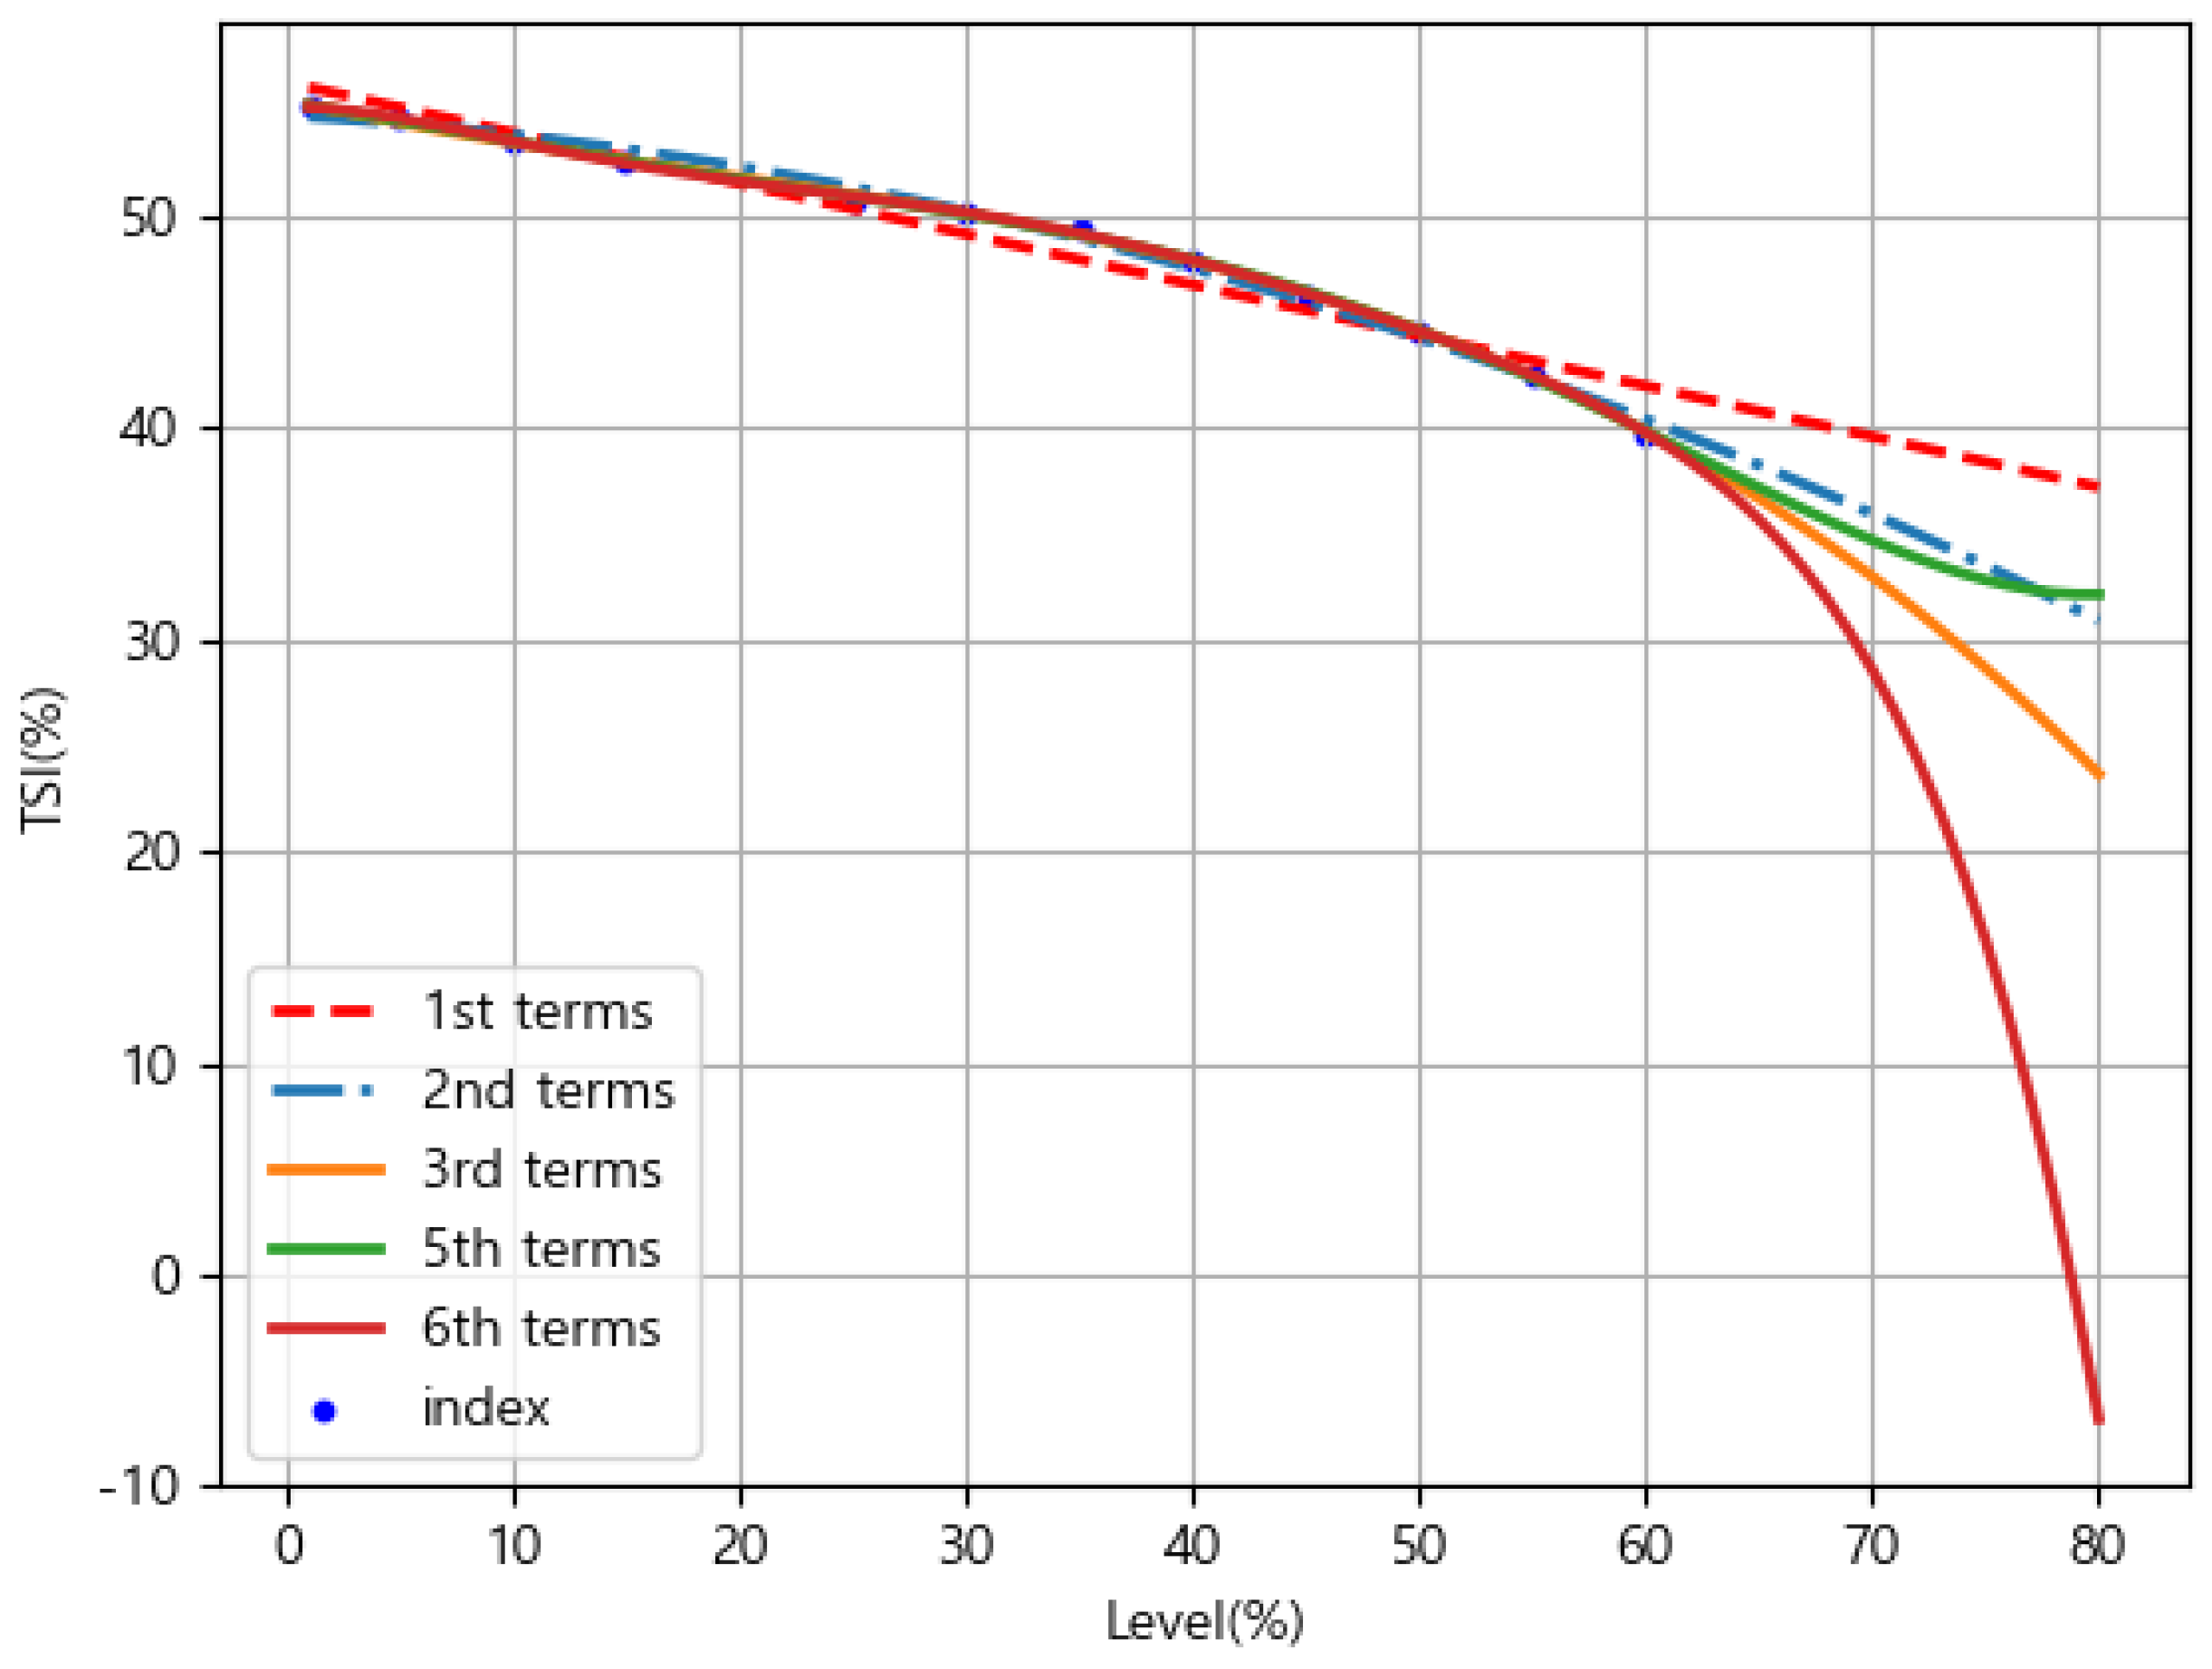
2.3.2. Interpolation-Based Transient Stability Assessment
- Step (1)
- Scenarios are selected for the transient stability assessment. The minimum capacity and average capacity of renewable energy are determined to calculate critical capacity of renewable energy. This study applied the average capacity based on the effective capacity.
- Step (2)
- A total of 10 scenarios are selected with increases/decreases in renewable energy between the minimum and average capacities.
- Step (3)
- For the scenarios selected in Step (2), TSI-based transient stability assessment is conducted.
- Step (4)
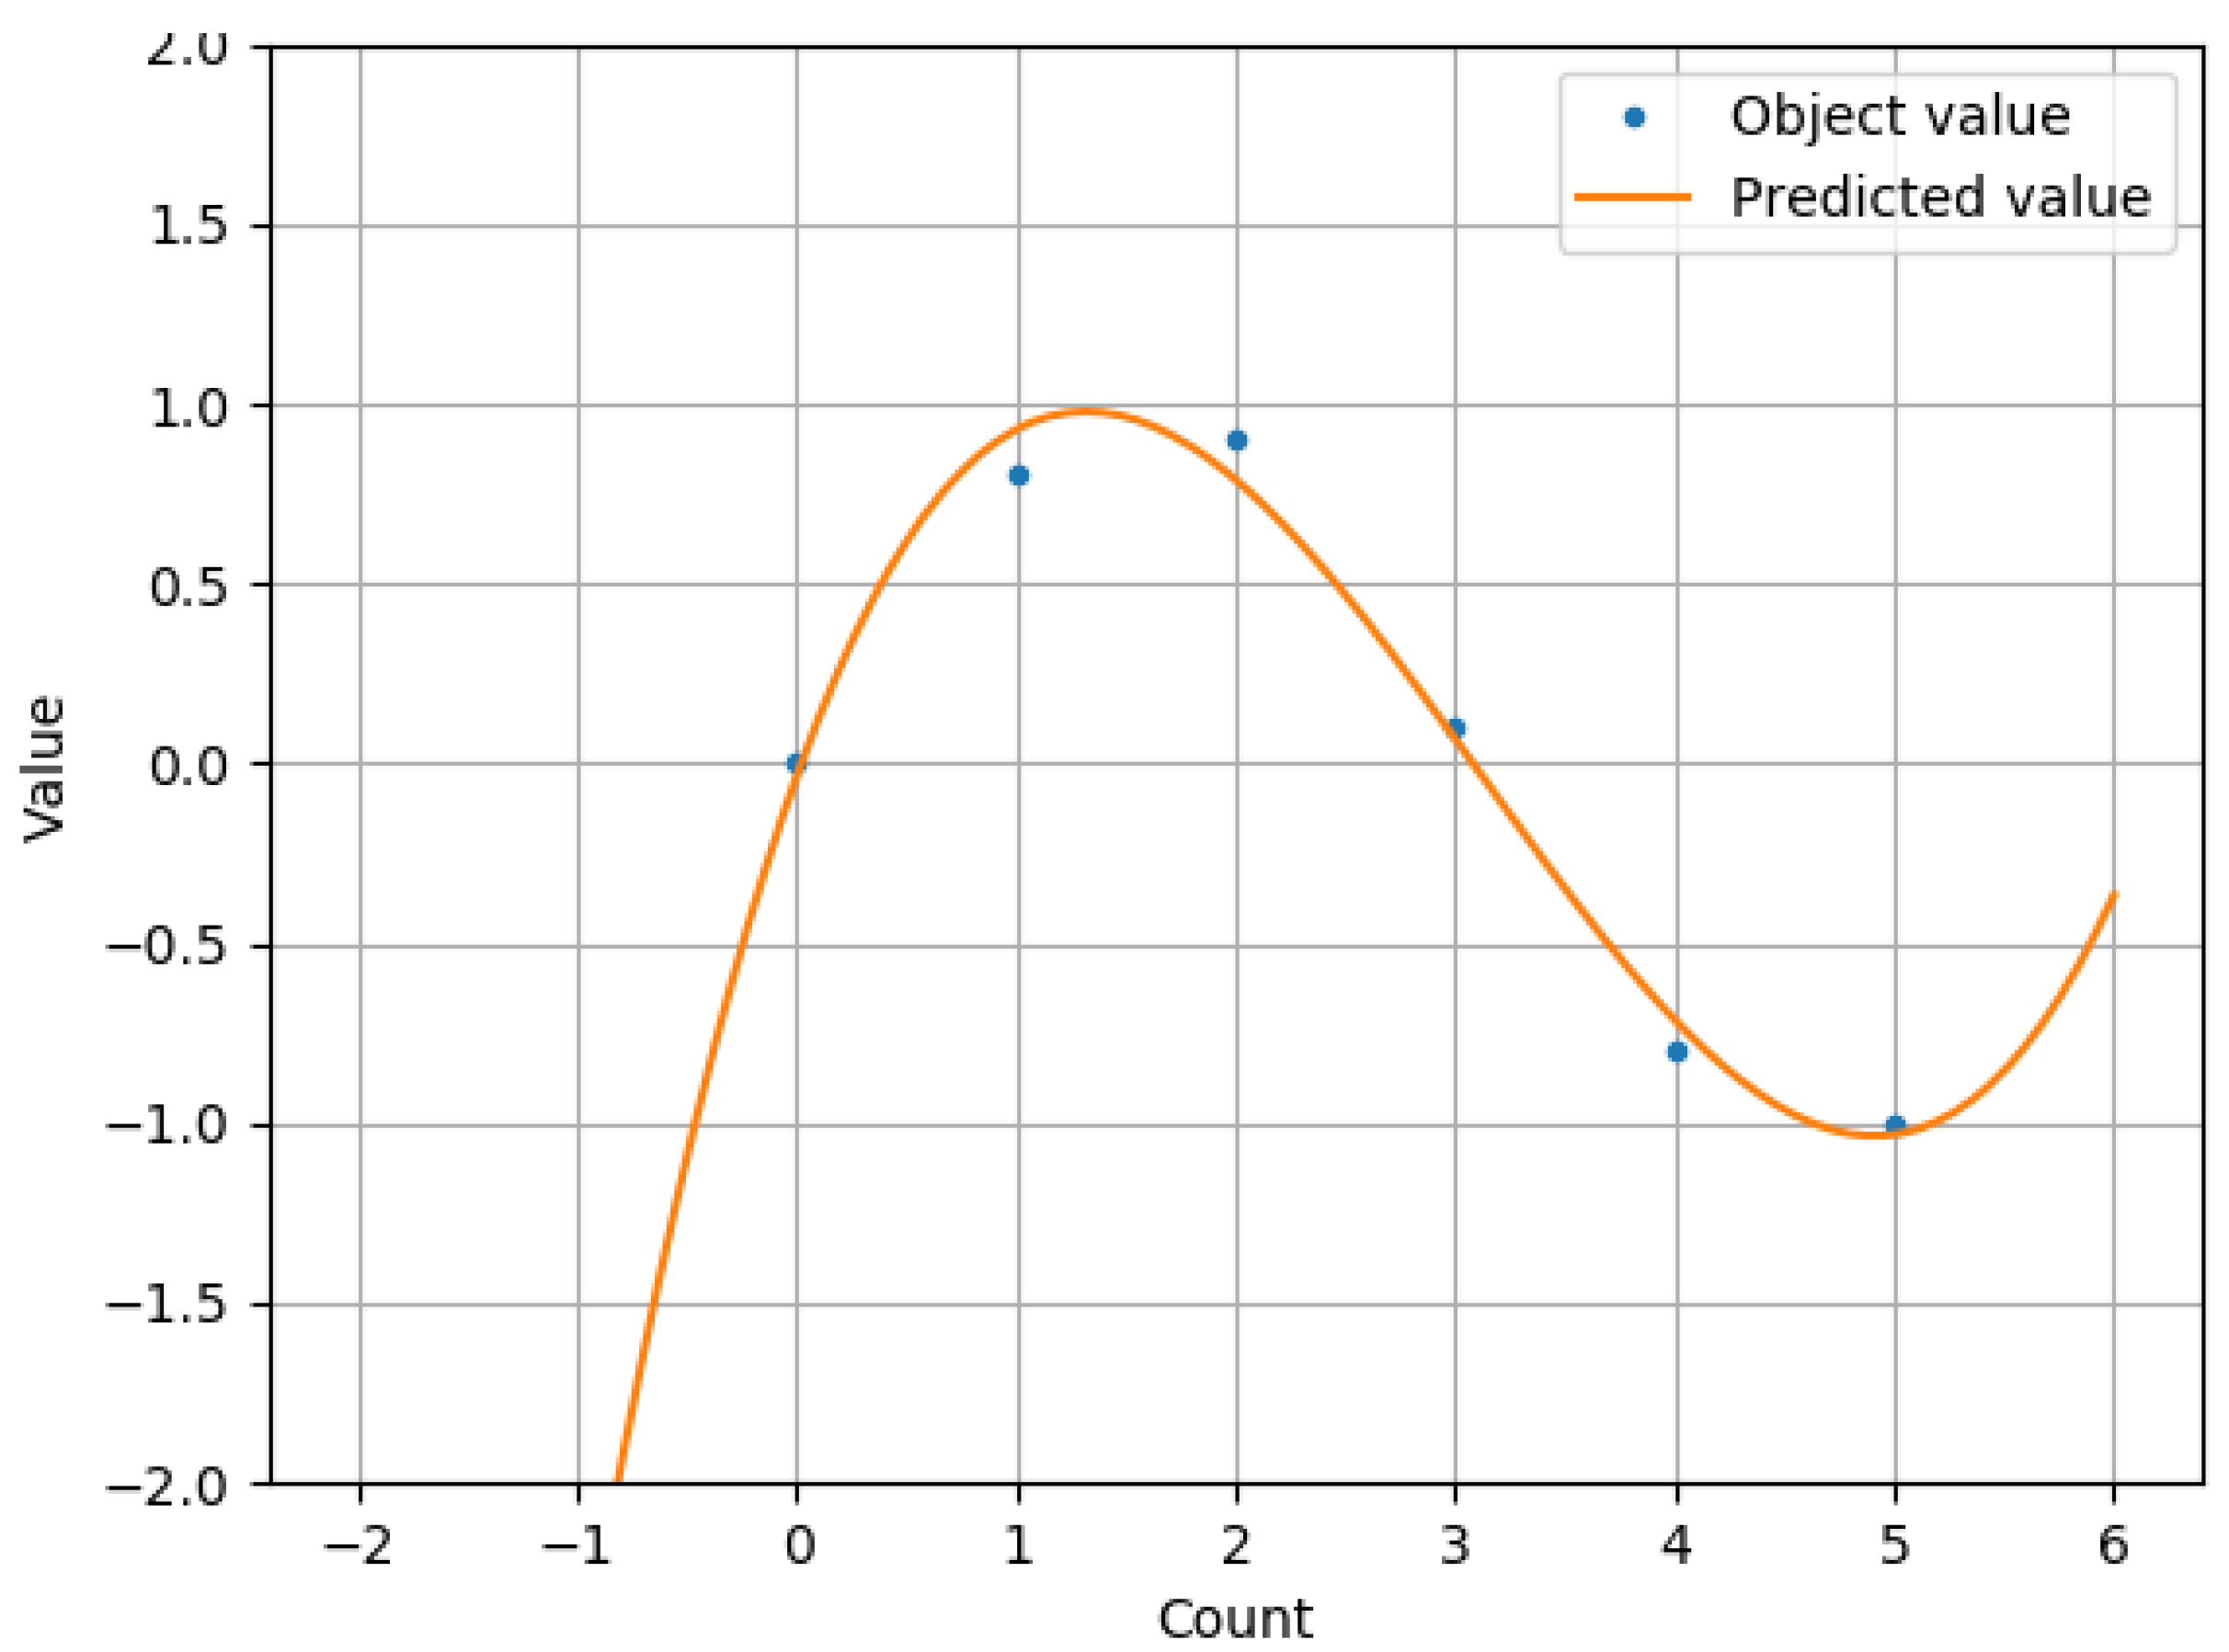
- the maximum capacity of renewable energy is calculated based on interpolation.
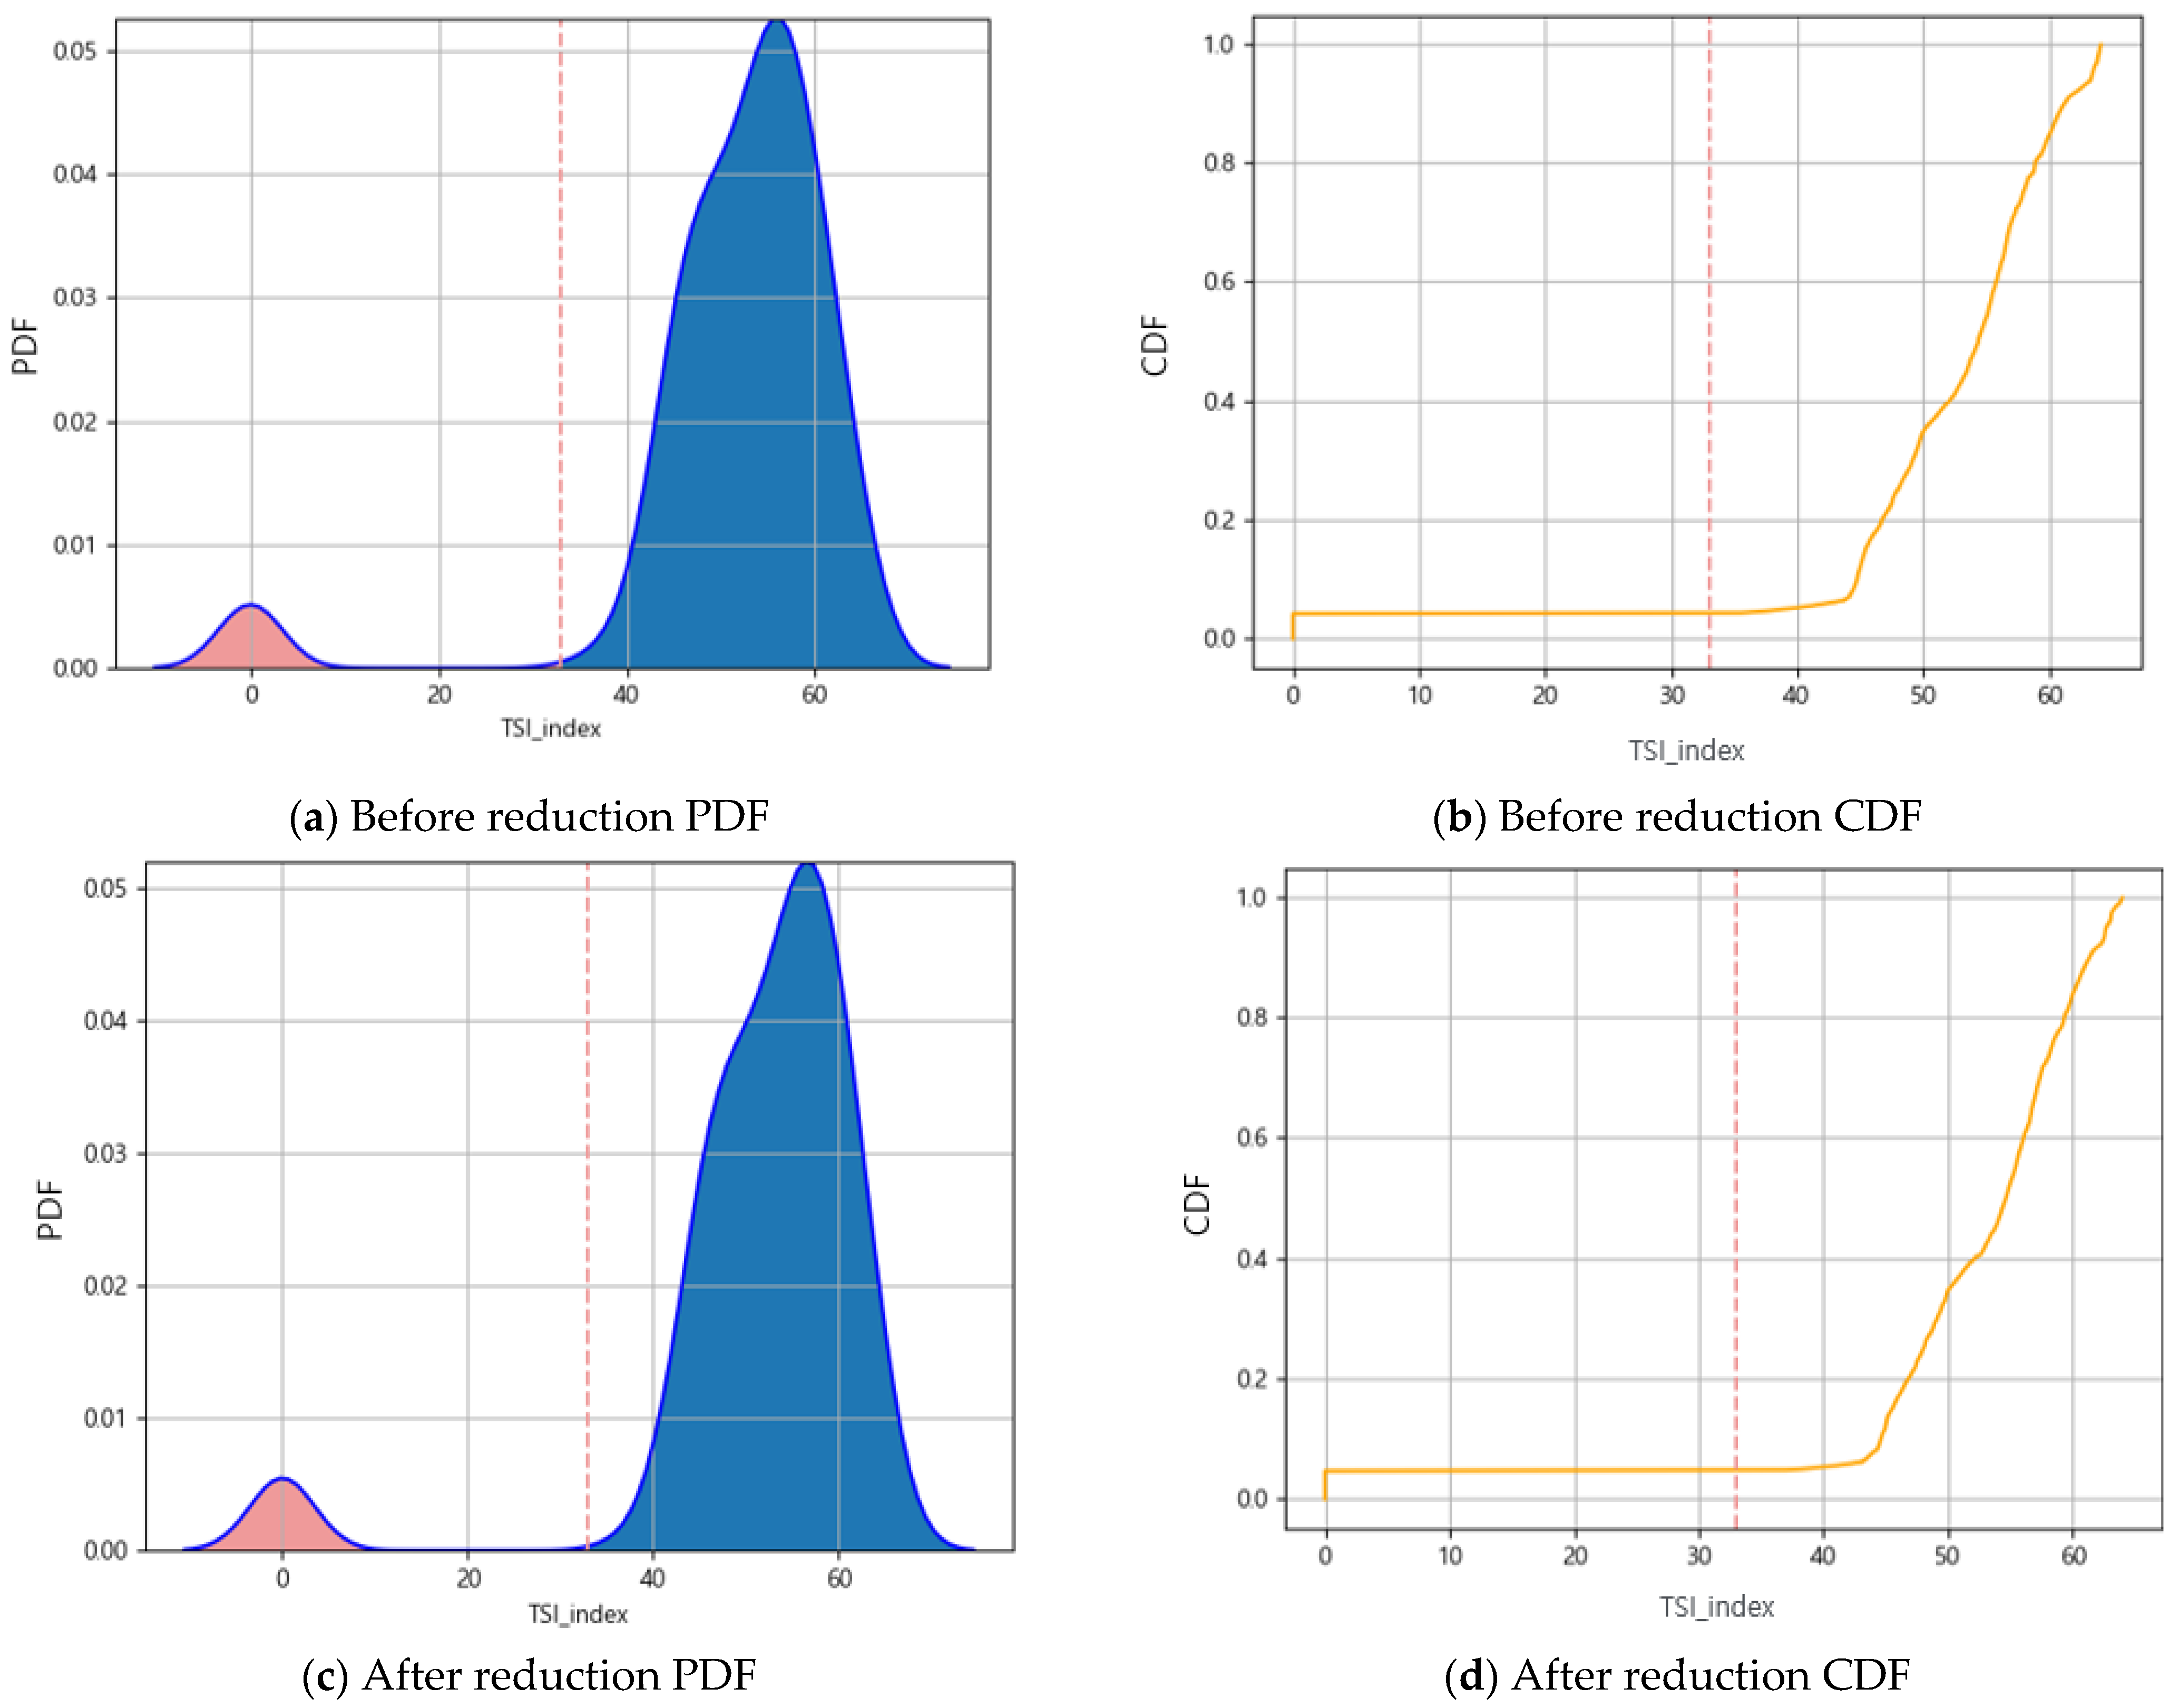
2.3.3. Reduction-Based Transient Stability Assessment
- Step (1)
- Interested areas and uninterested areas are selected for the transient stability assessment.
- Step (2)
- For the uninterested areas, generators and buses of 154 kV or higher are maintained and the rest is reduced.
- Step (3)
- For the scenarios in Step (2), TSI-based transient stability assessment is conducted.
- Step (4)
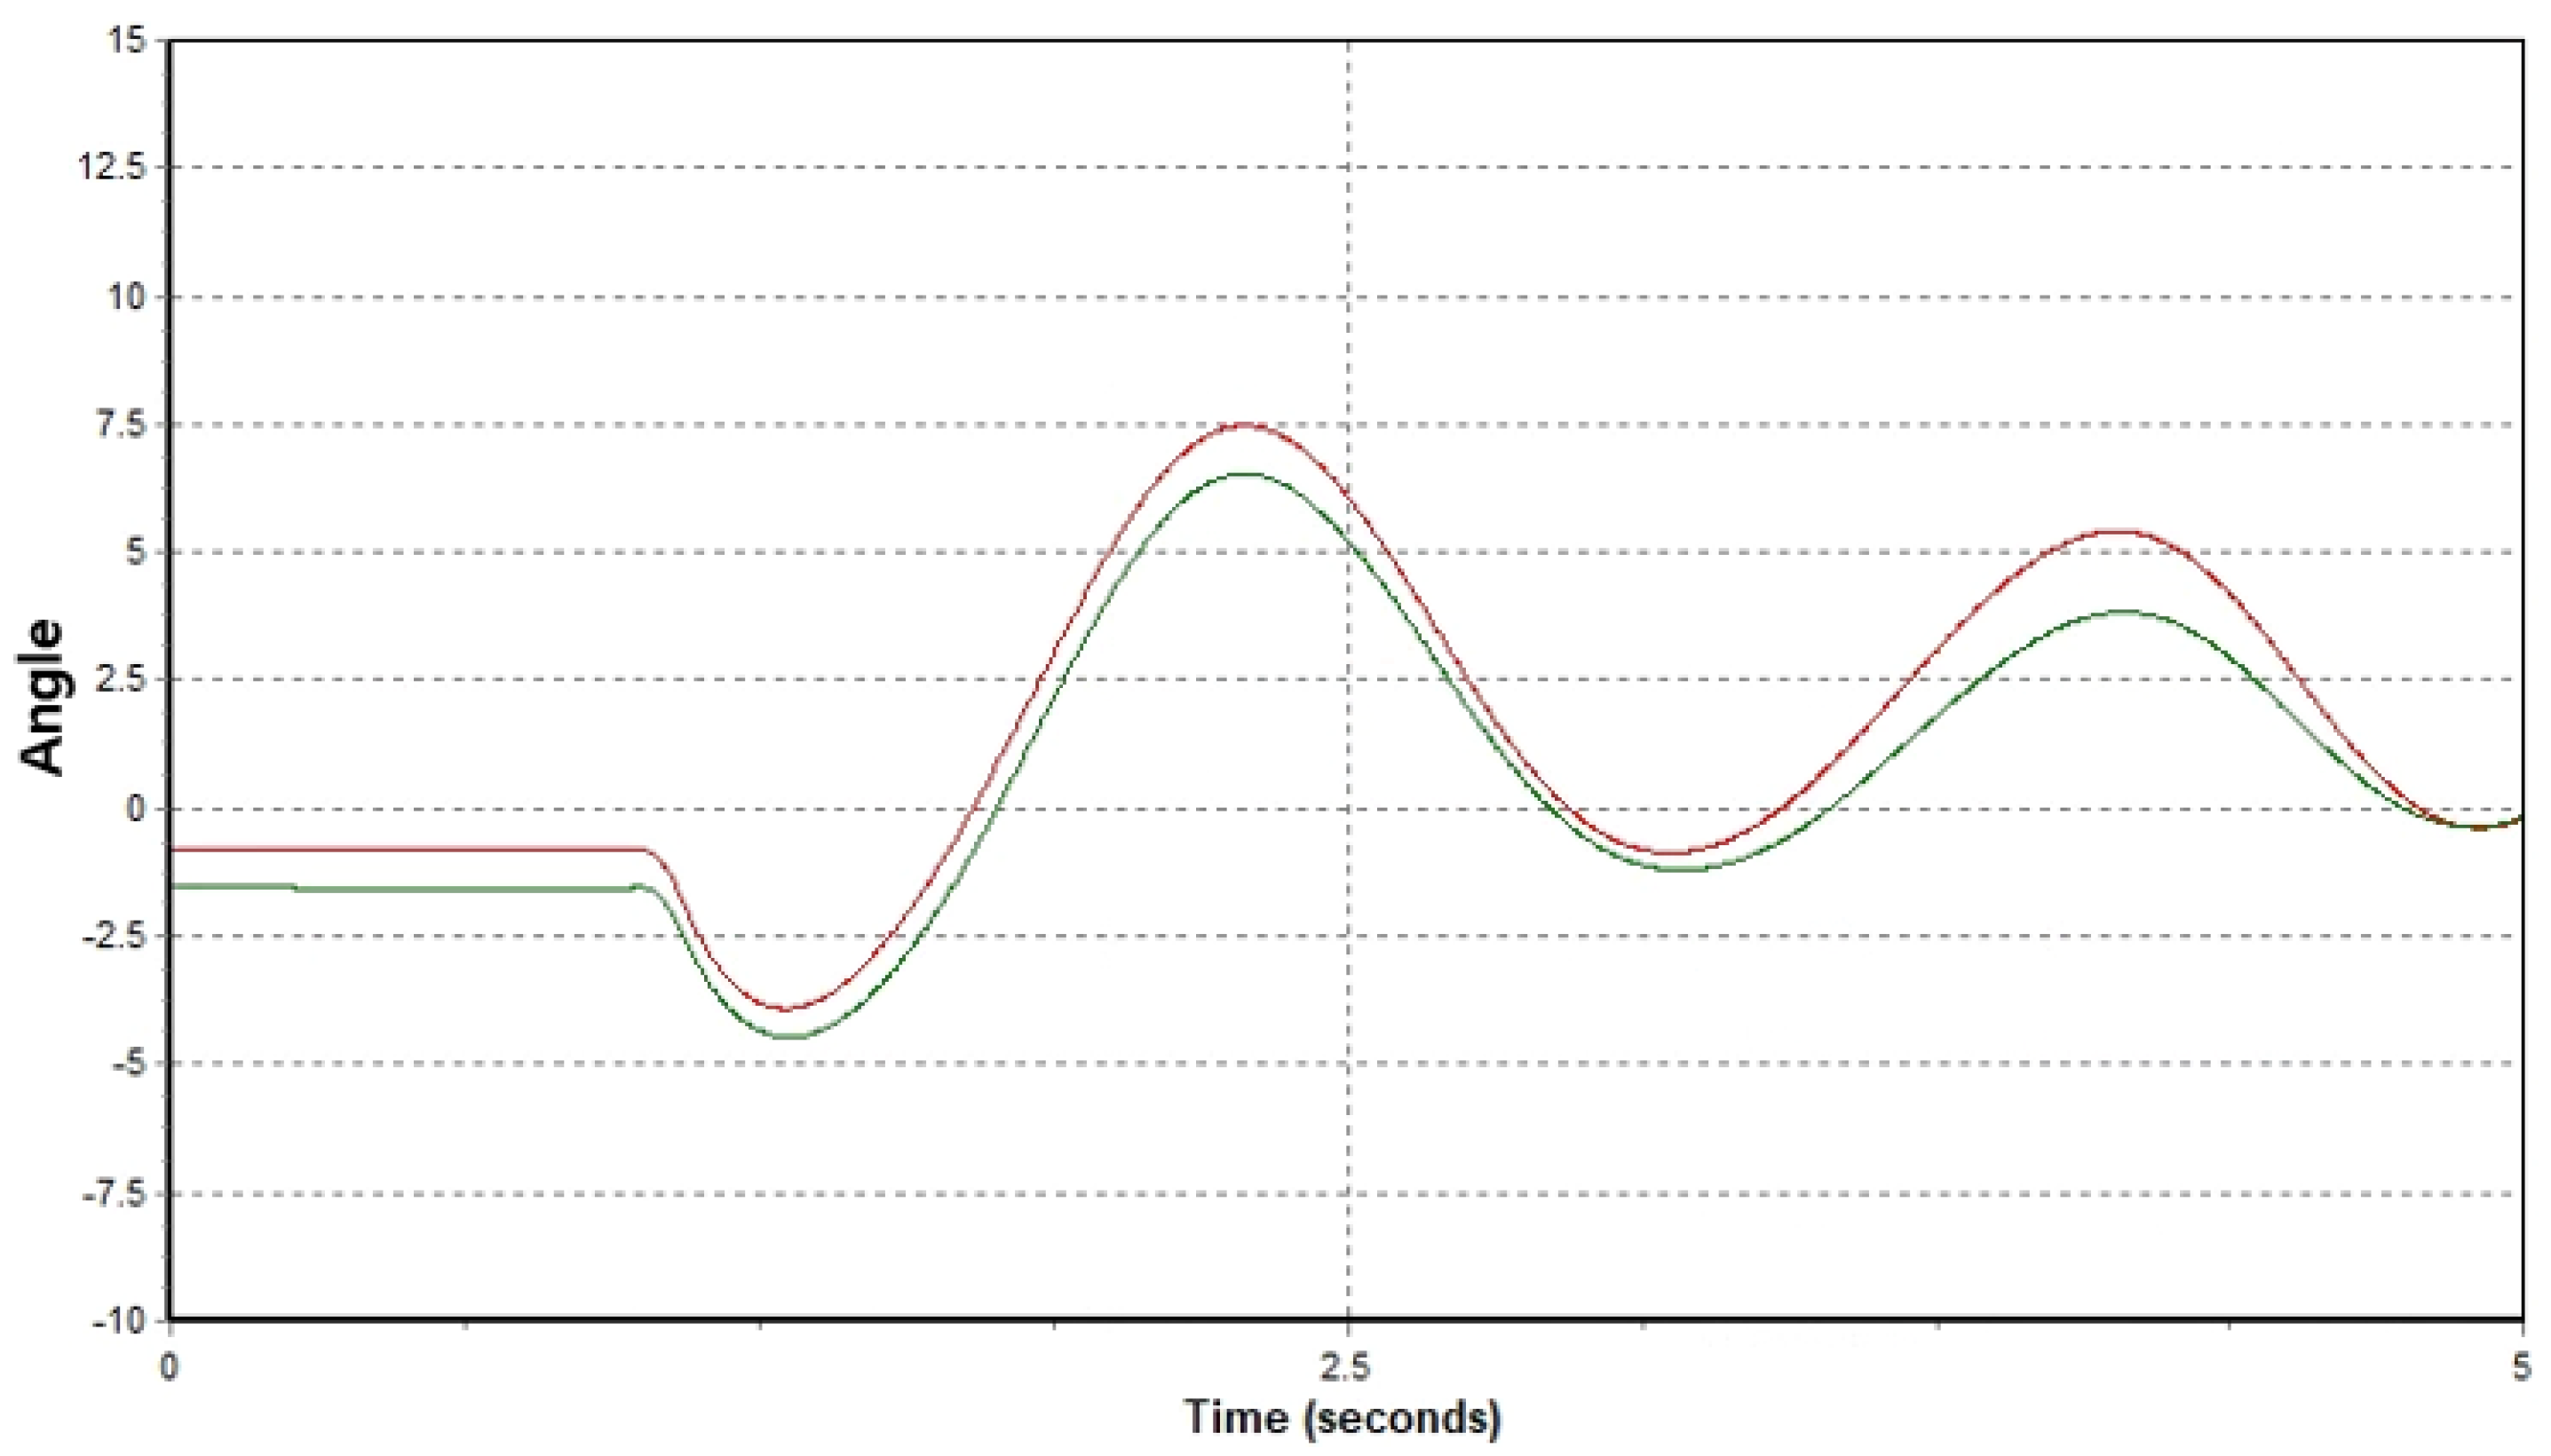
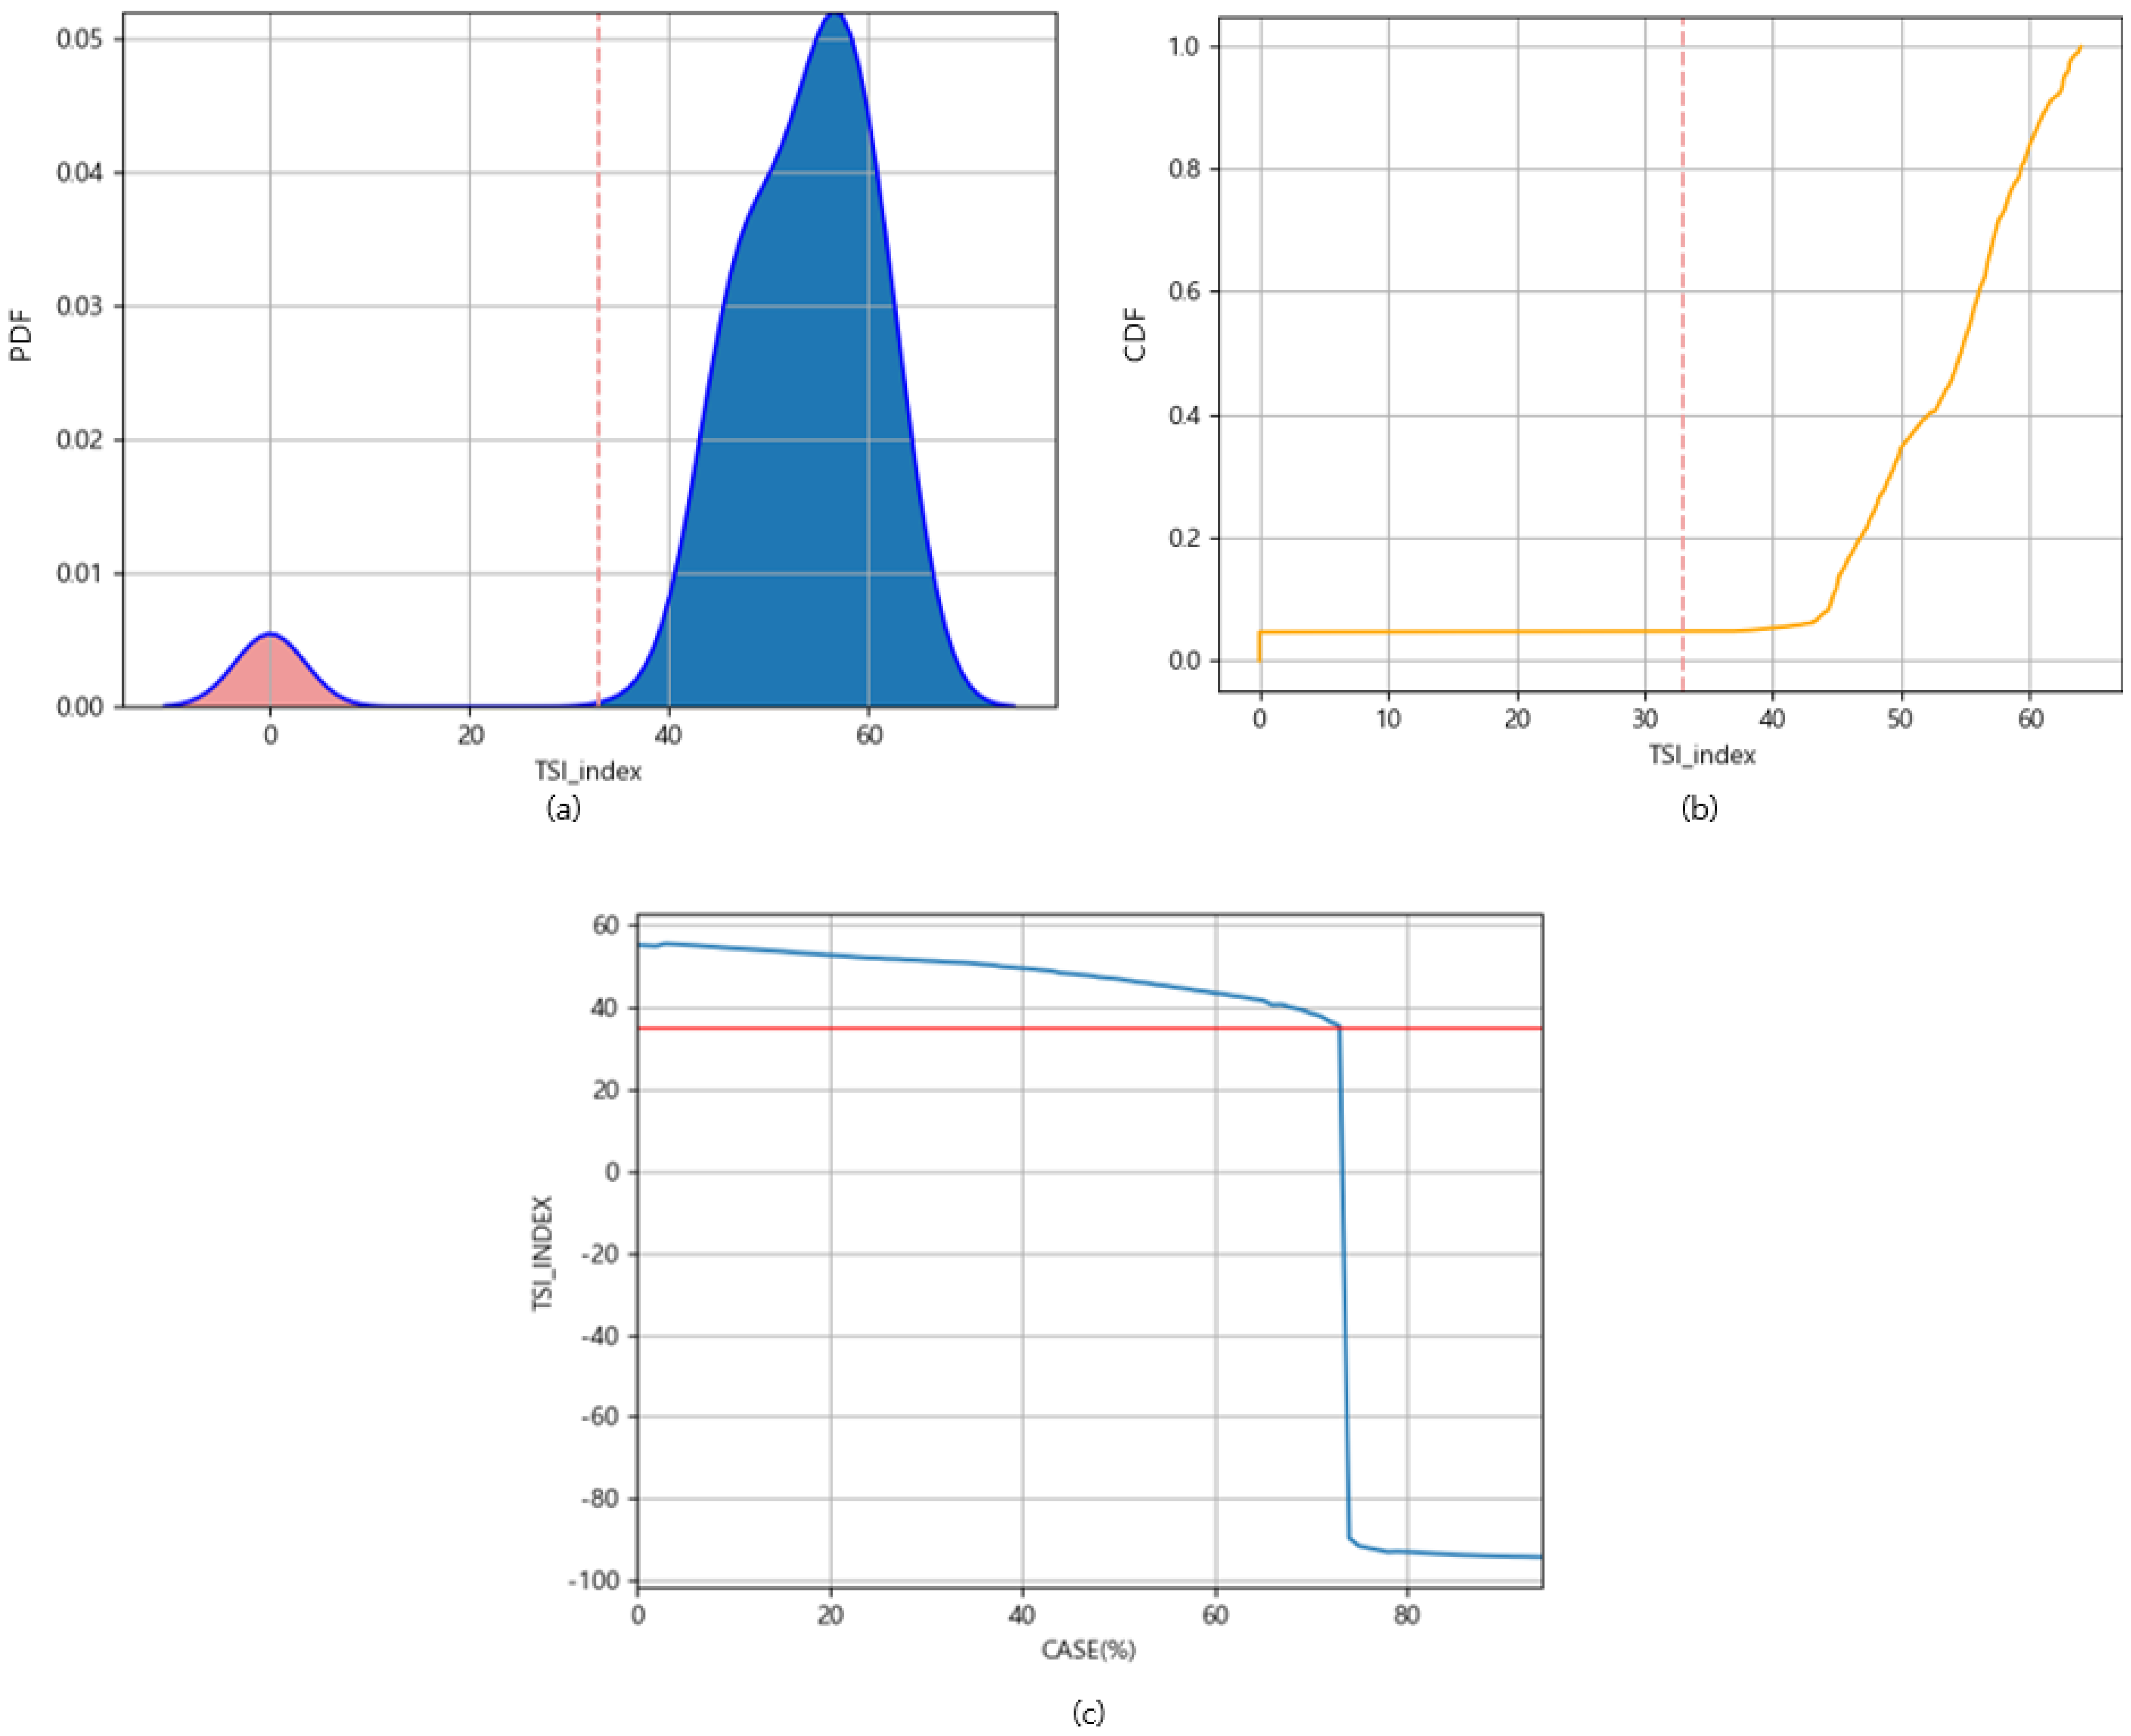
- As shown in Figure 8, calculate the maximum capacity for renewable energy by using the little difference between voltage and phase angle before and after reduction.
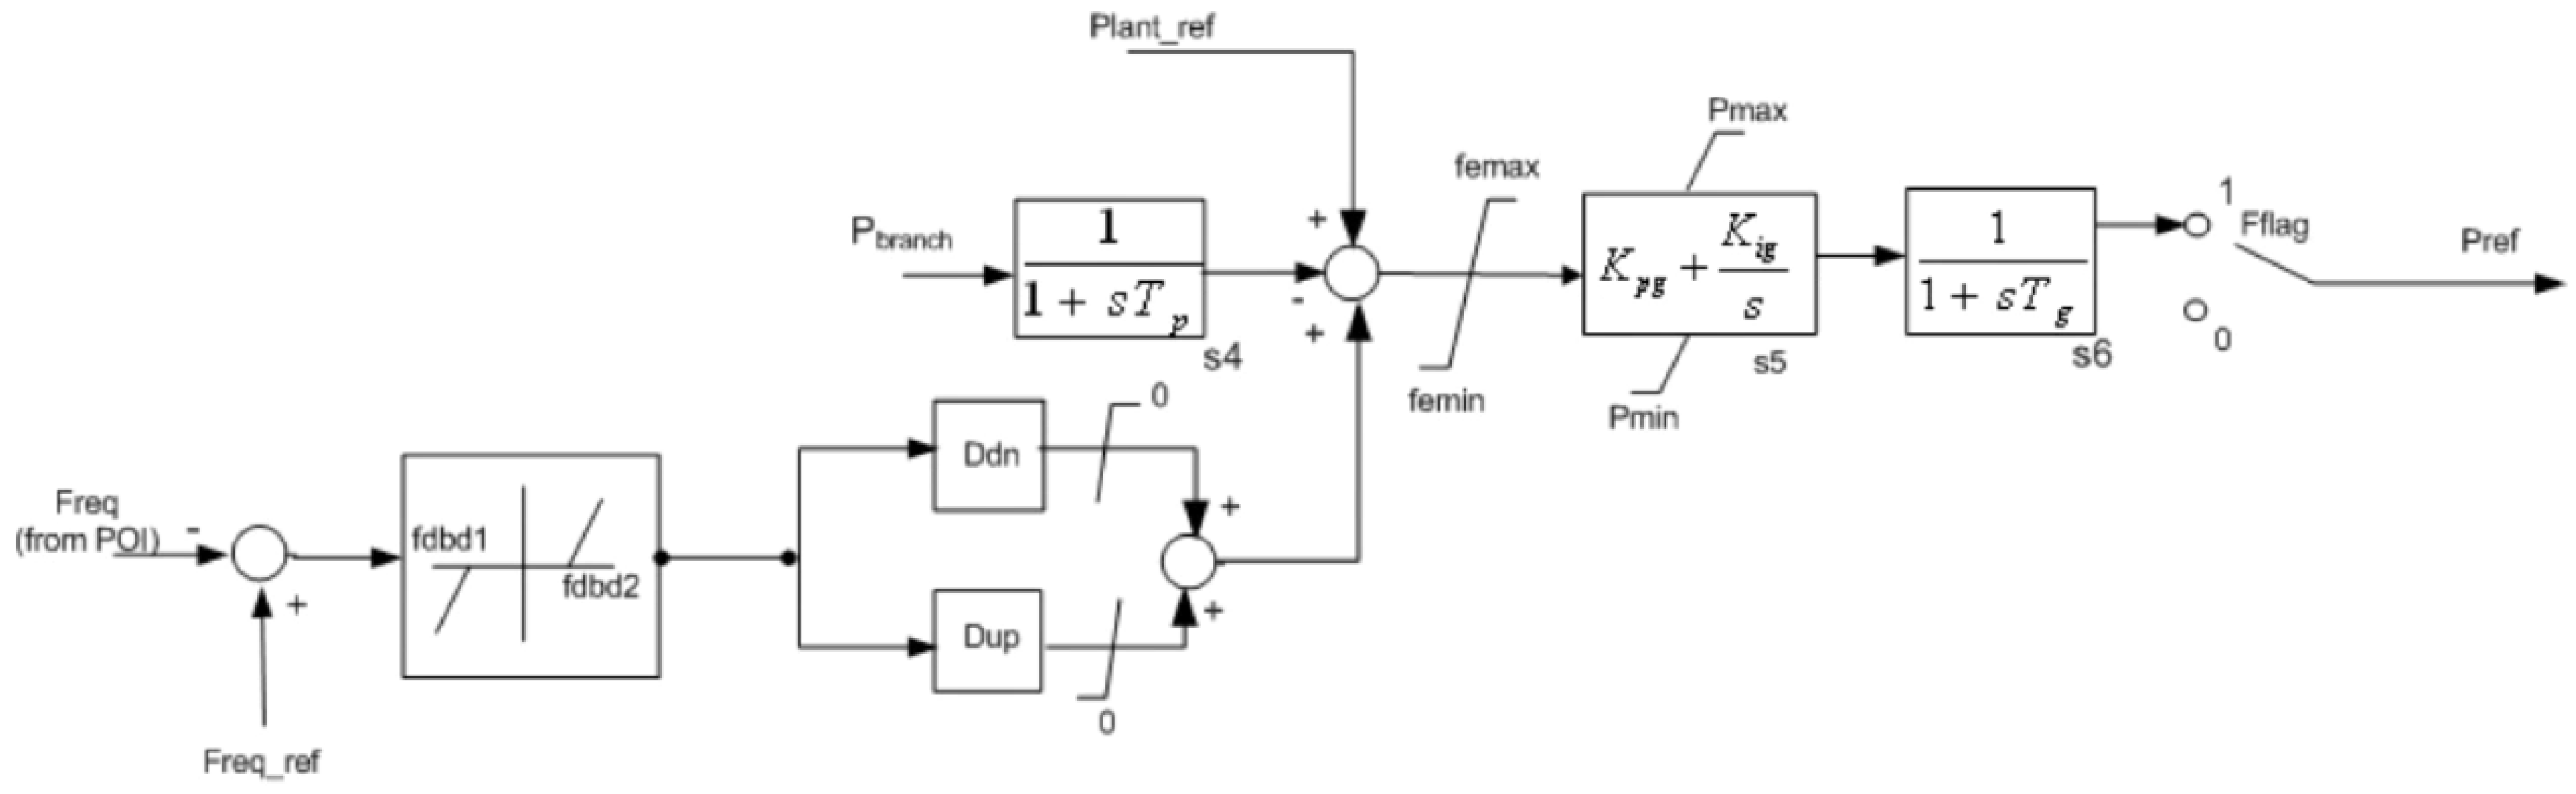
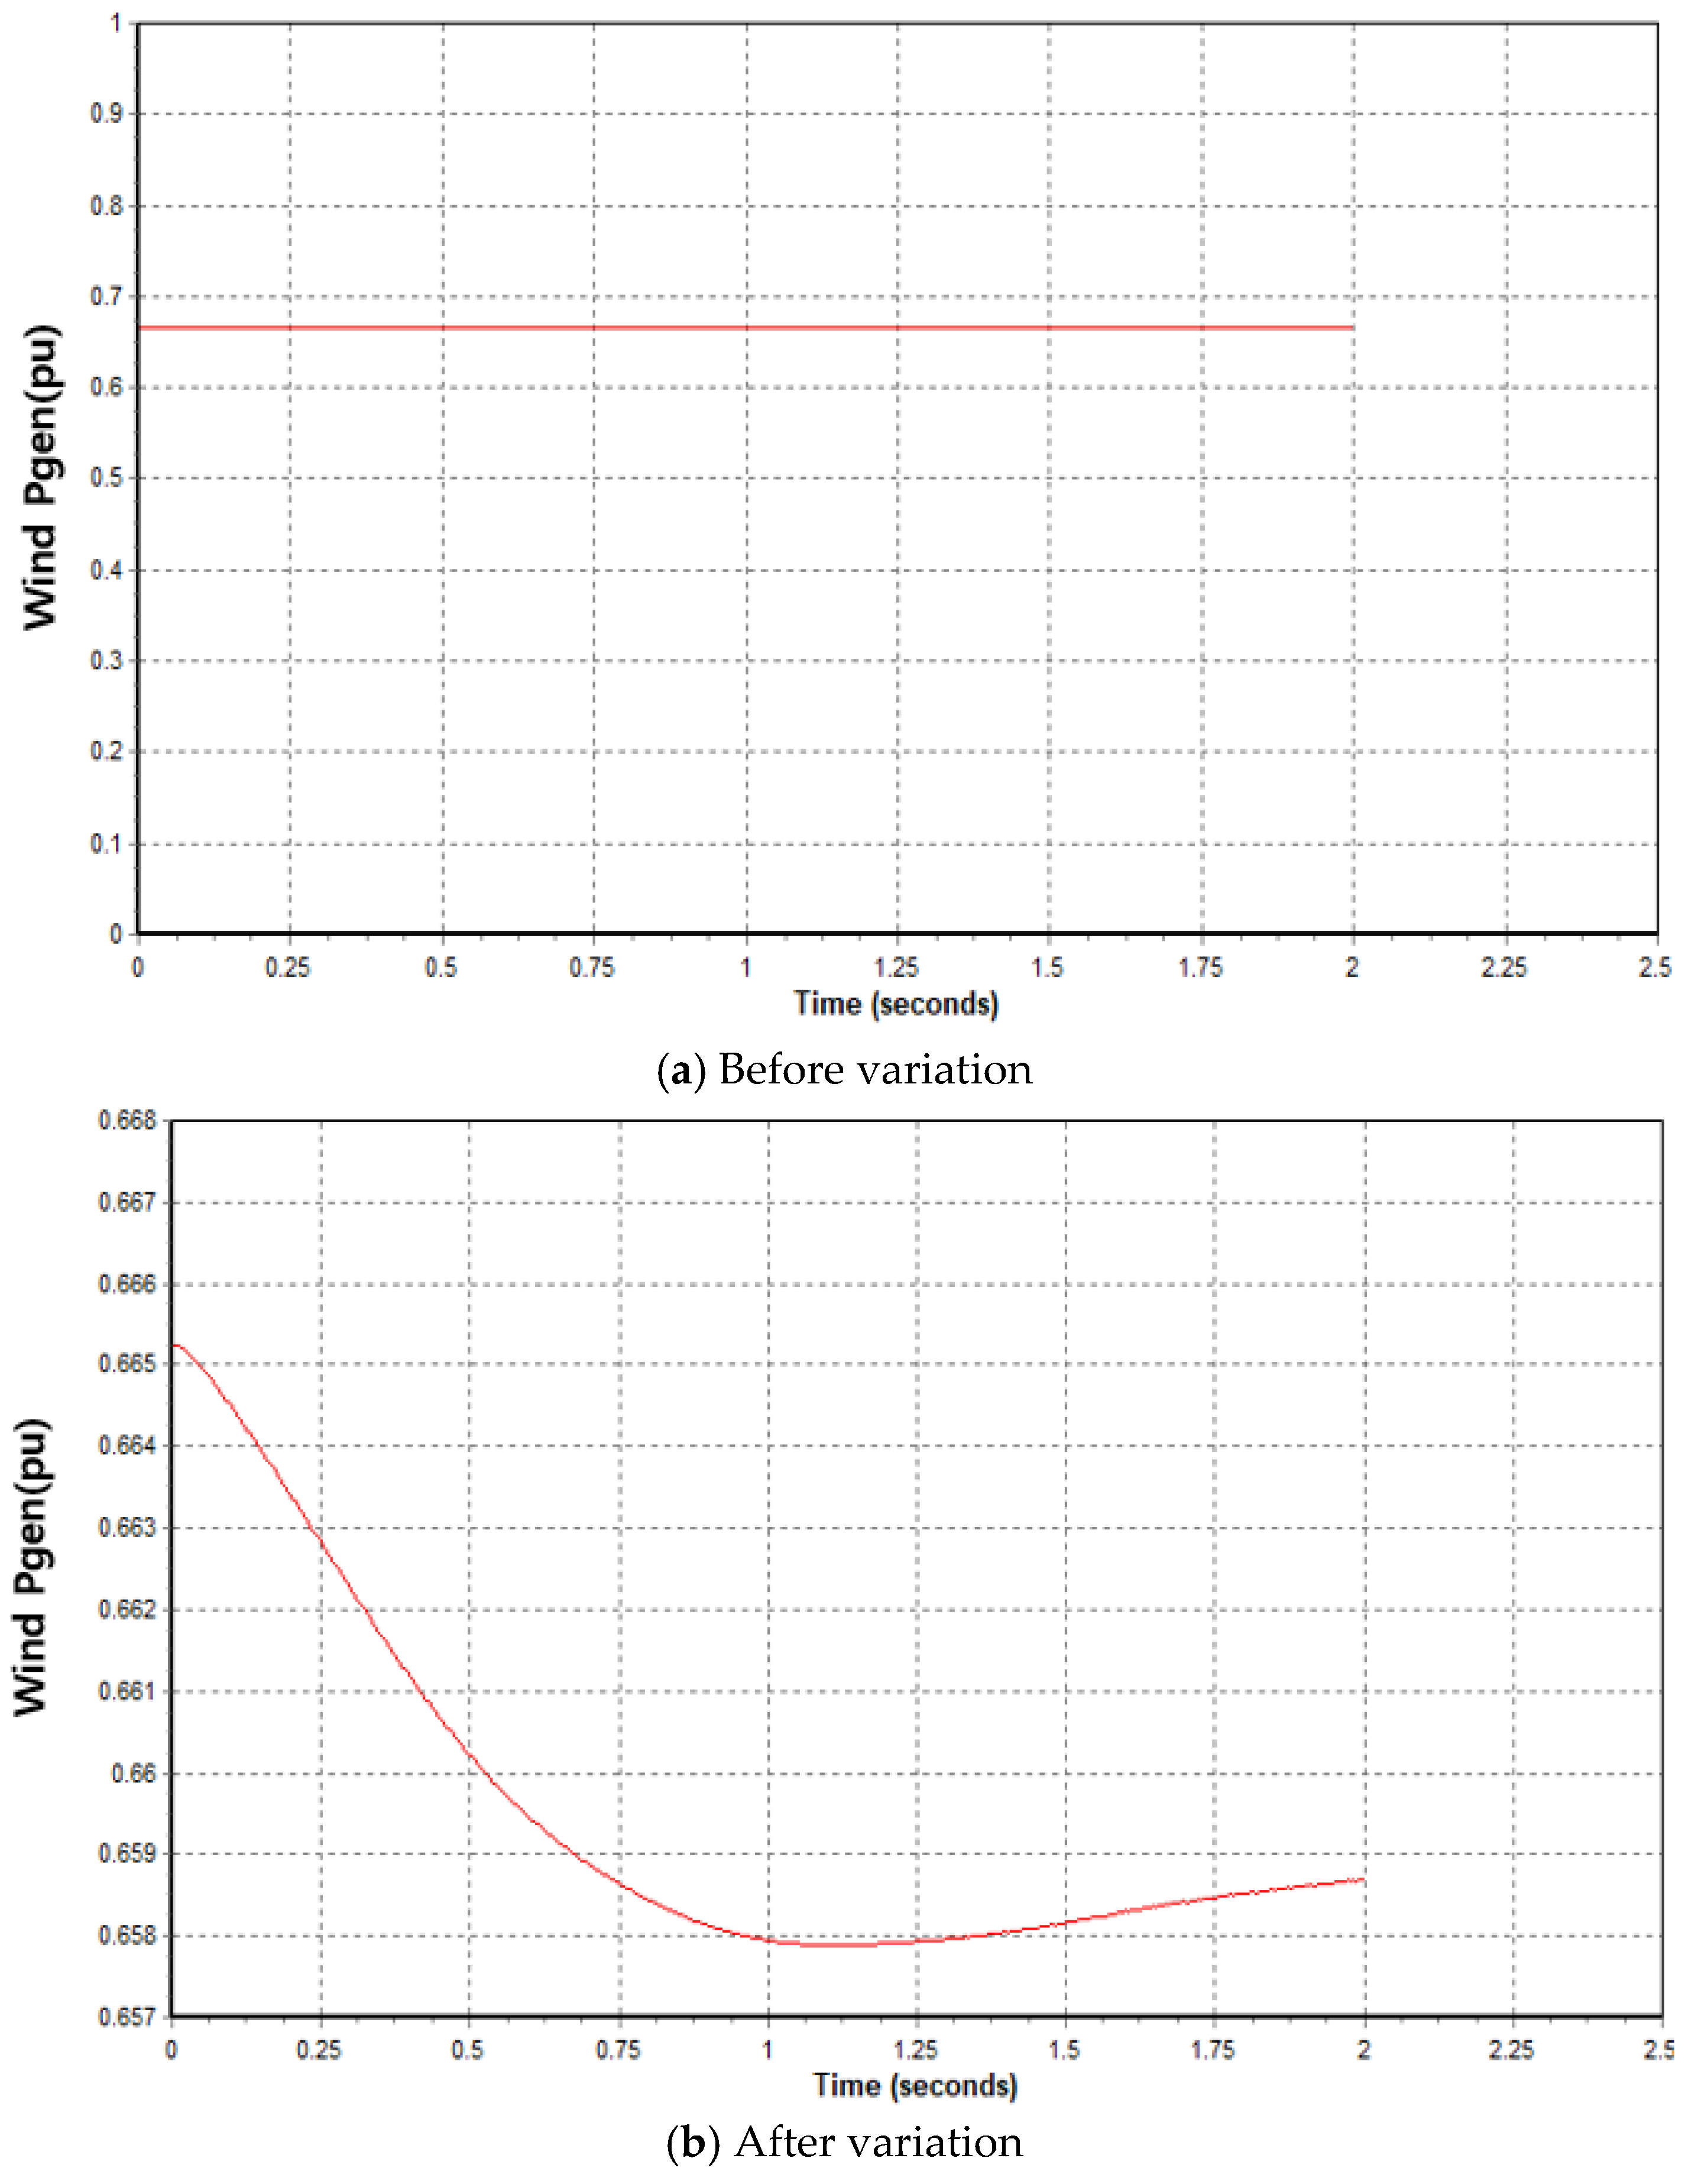
2.4. Wind Gust Modeling
3. Implementation of Probabilistic Transient Stability Assessment Simulator
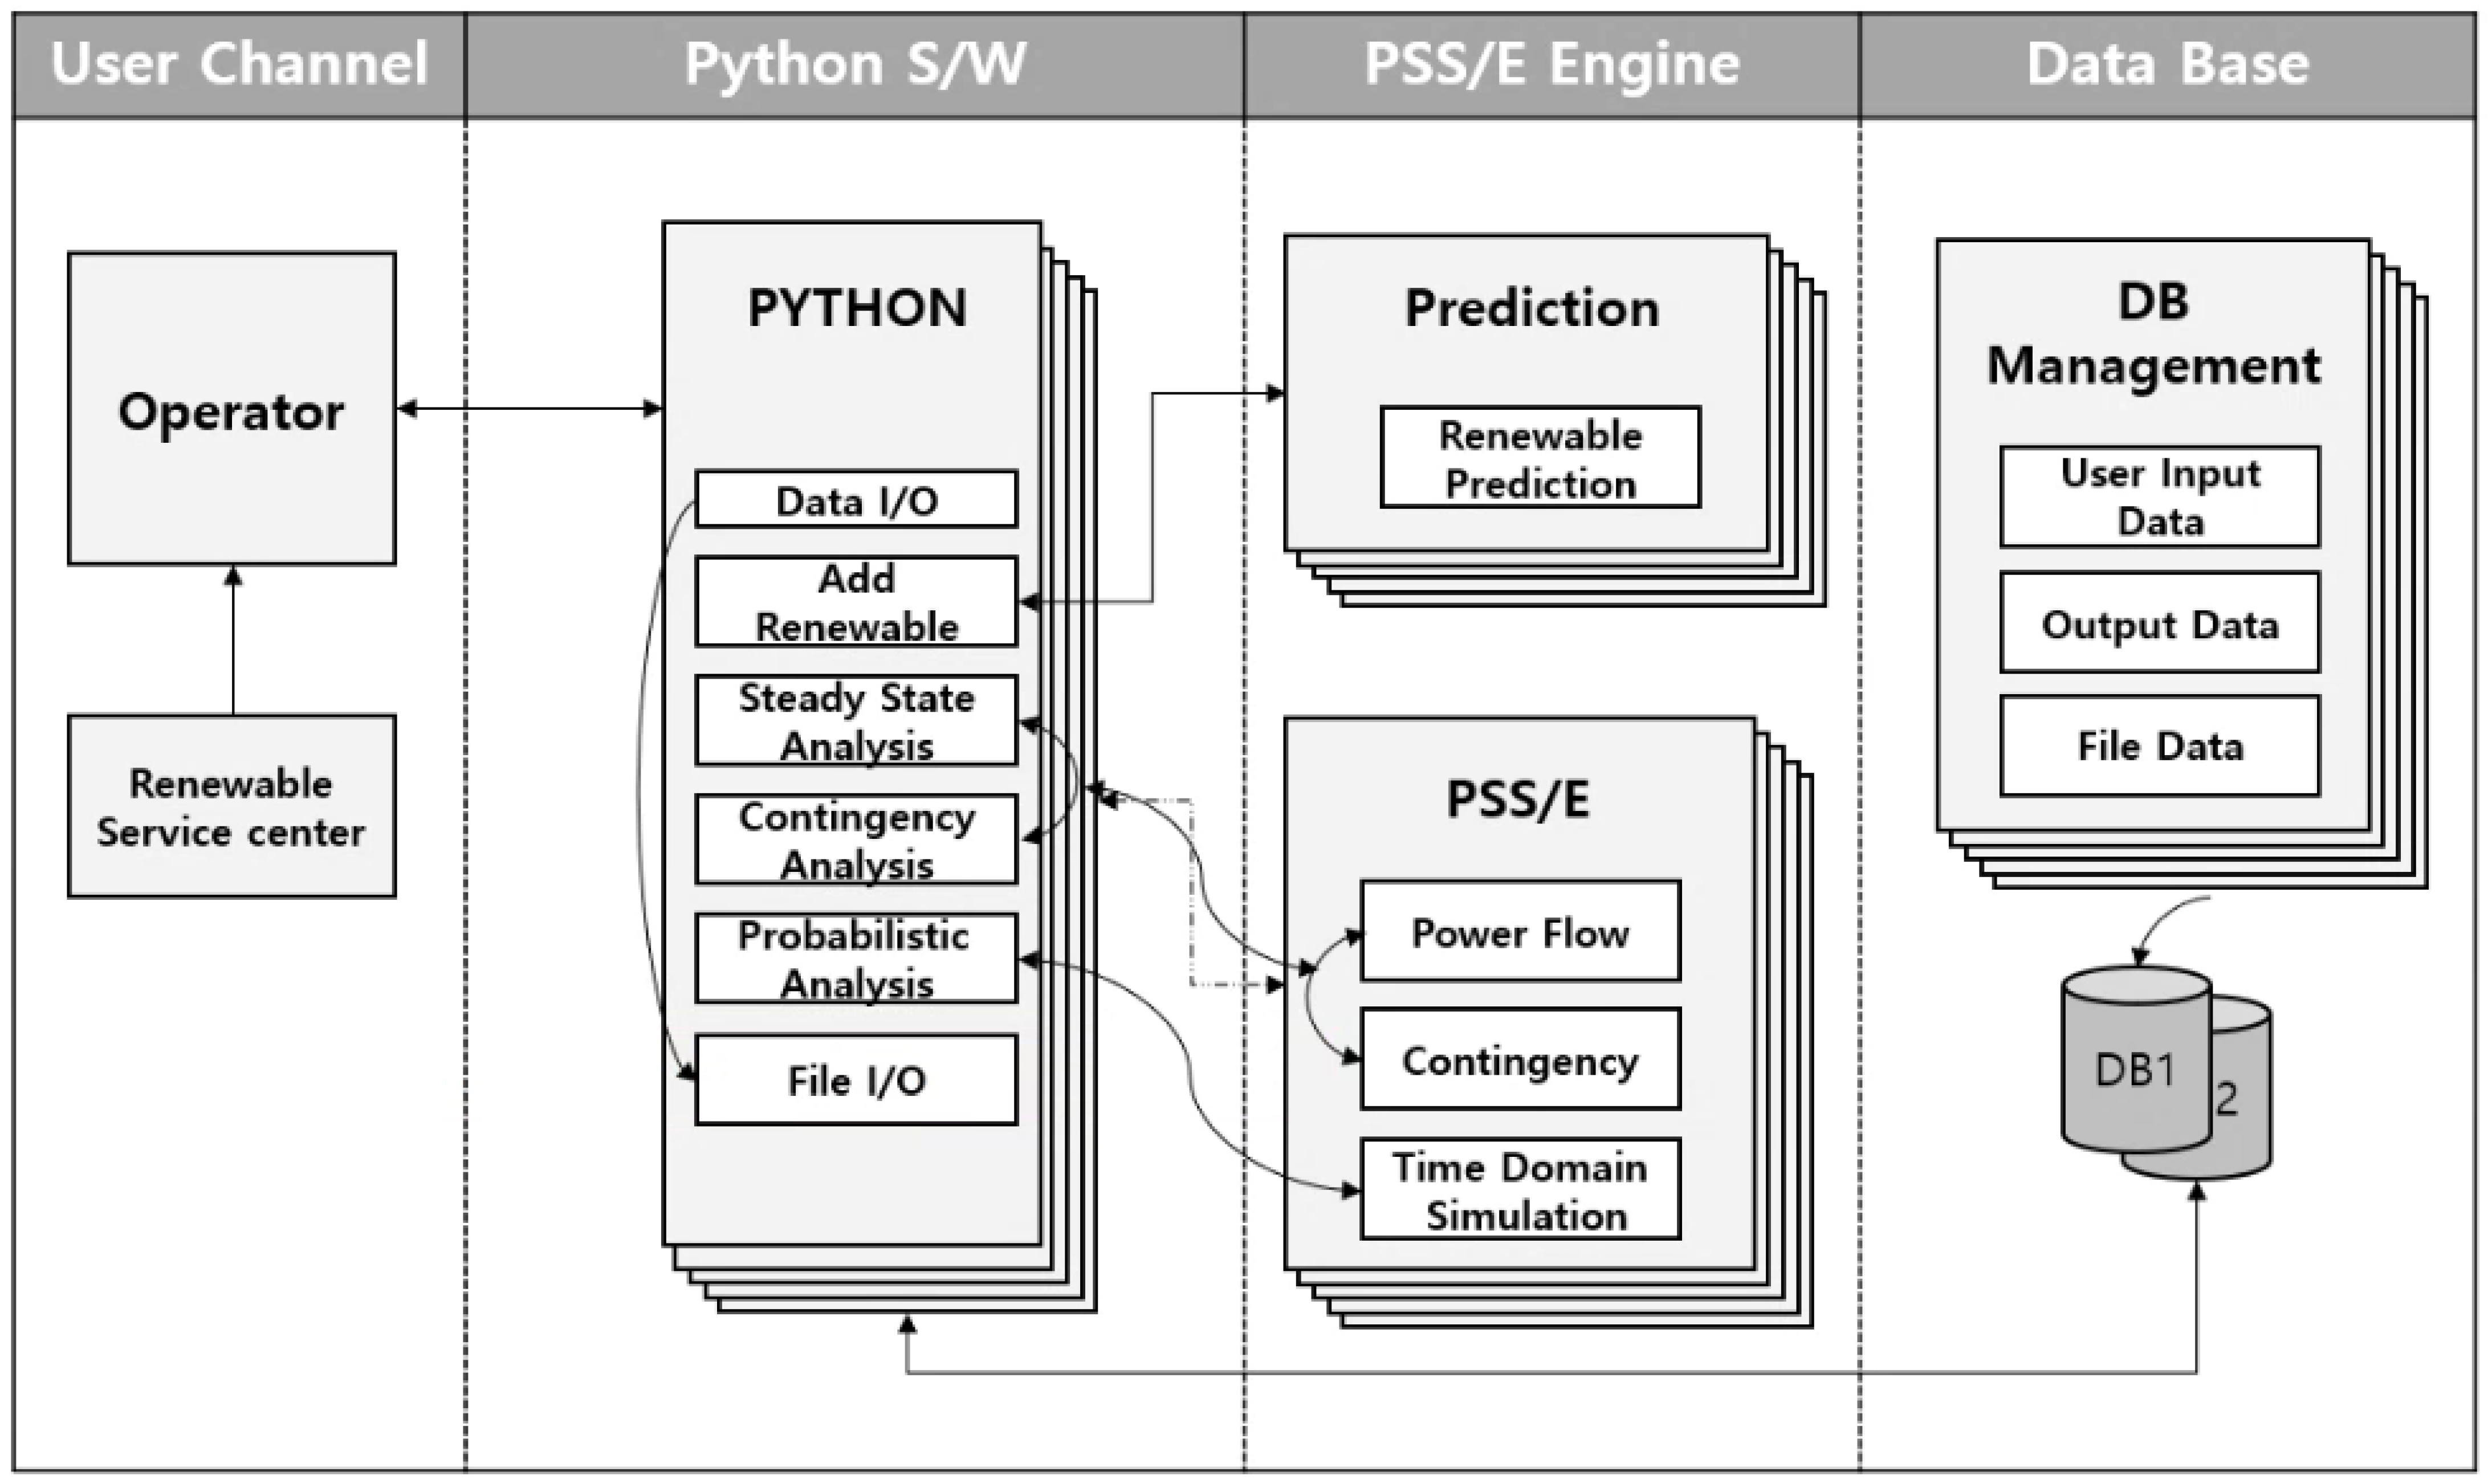
3.1. Overall Flowchart
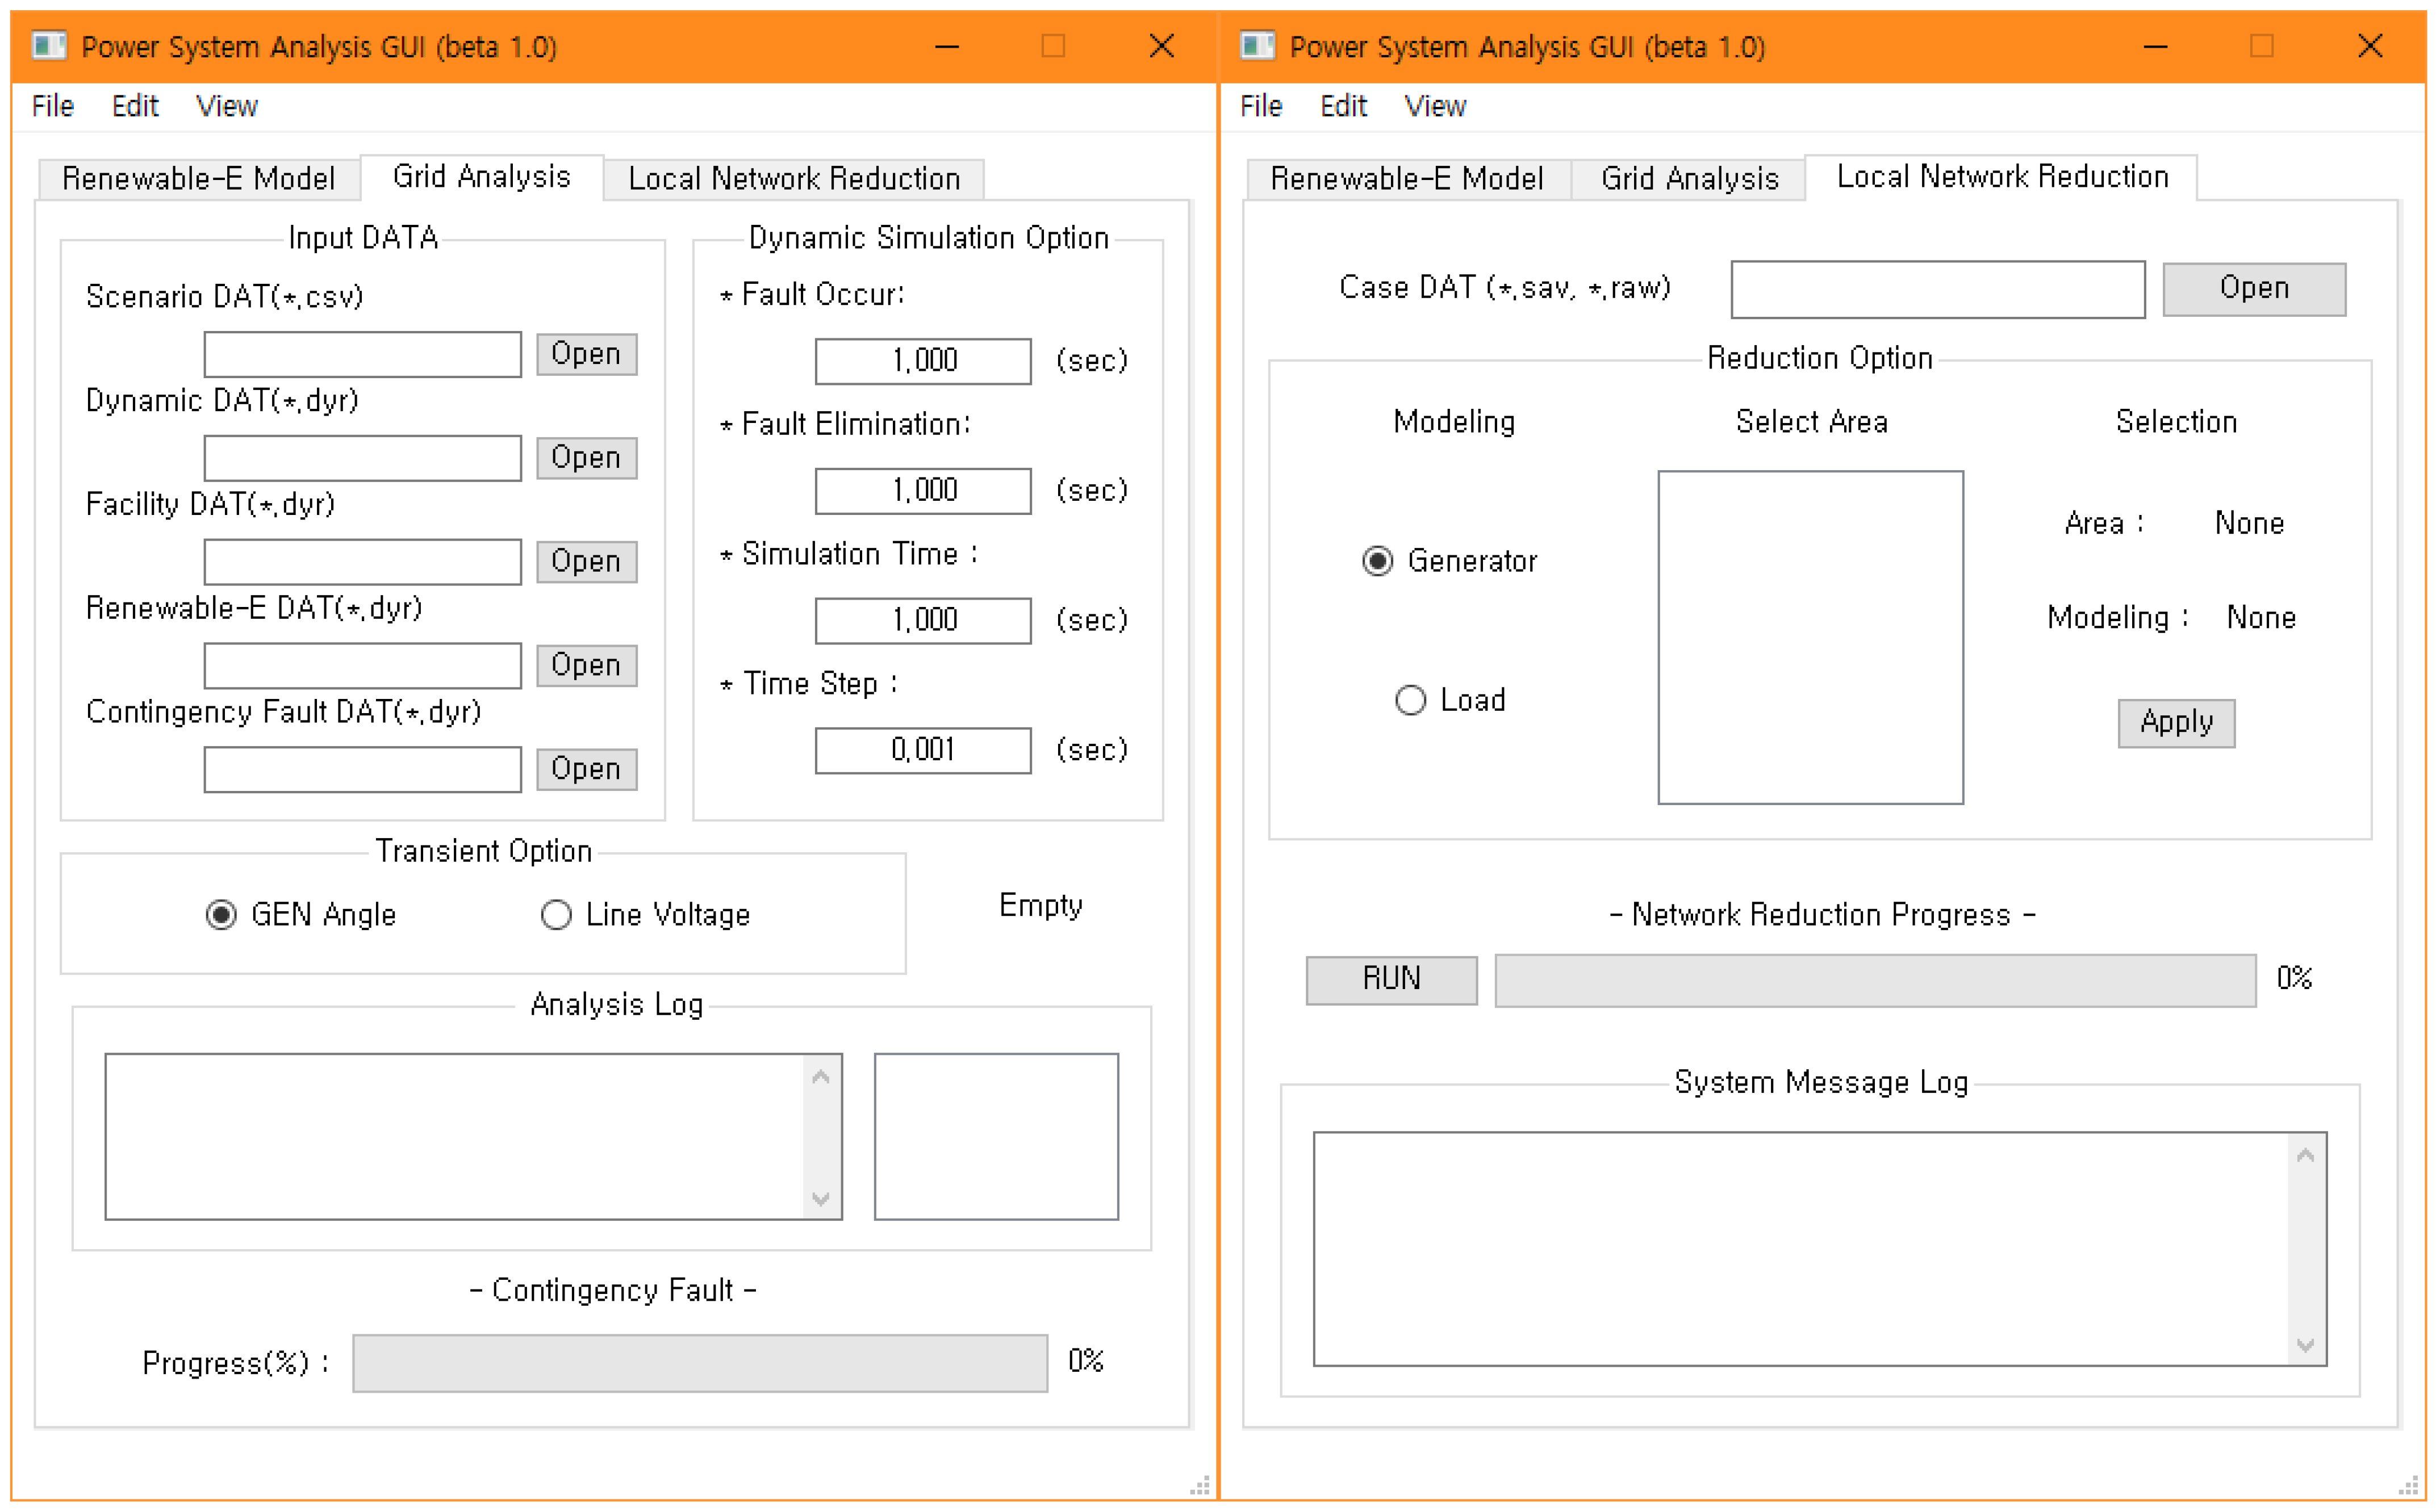
3.2. Major Display of Simulator
4. Case Study
4.1. Scenario A
- -
- The confirmed amount of renewable energy plan for 2034
- -
- Load levels of 100%
- -
- 1% increase of power production in the East area (approximately 83 MW)
- -
- 5.4 GW of power production in other areas, 7 contingencies in the East area
4.2. Scenario B
4.3. Scenario C
4.4. Scenario D
- -
- Including renewable energy of around 9.5 GW in the East area
- -
- Load levels of 100%
4.5. Scenario E
- -
- 95 Cases
- -
- 10 Contingency list
5. Simulation Result and Discussion
6. Conclusions
Author Contributions
Funding
Institutional Review Board Statement
Informed Consent Statement
Data Availability Statement
Conflicts of Interest
References
- Ministry of Trade, Industry and Energy (MOTIE). The 8th Basic Plan of Long-Term Electricity Supply and Demand; Ministry of Trade, Industry and Energy (MOTIE): Sejong, Korea, 2017.
- Ministry of Trade, Industry and Energy (MOTIE). Plan of Renewable Energy 3020 Implementation; Ministry of Trade, Industry and Energy (MOTIE): Sejong, Korea, 2017.
- Jeju Island’s New and Renewable Energy Power System Supplement ‘Hourly Wage’. Available online: https://www.todayenergy.kr/news/articleView.html?idxno=232935 (accessed on 20 January 2021).
- National Grid ESO (NGESO). Network Development Roadmap. Available online: https://www.nationalgrideso.com/research-publications/etys-2020/4-year-round-probabilistic-analysis (accessed on 1 June 2018).
- Tajdinian, M.; Allahbakhshi, M.; Seifi, A.R.; Chamorro, H.R.; Jahromi, M.Z.; Sood, V.K. An enhanced approach for probabilistic evaluation of transient stability. Int. J. Electr. Power Energy Syst. 2020, 120, 106055. [Google Scholar] [CrossRef]
- Milanović, J.V. Probabilistic stability analysis: The way forward for stability analysis of sustainable power systems. Philos. Trans. R. Soc. A Math. Phys. Eng. Sci. 2017, 375. [Google Scholar] [CrossRef] [Green Version]
- Kim, S.; Hur, J. Probabilistic Approaches to the Security Analysis of Smart Grid with High Wind Penetration: The Case of Jeju Island’s Power Grids. Energies 2020, 13, 5785. [Google Scholar] [CrossRef]
- Parajuli, A. A Statistical Analysis of Wind Speed and Power Density Based on Weibull and Rayleigh Models of Jumla, Nepal. Energy Power Eng. 2016, 8, 271–282. [Google Scholar] [CrossRef] [Green Version]
- Carrillo, C.; Cidrás, J.; Díaz-Dorado, E.; Obando-Montaño, A.F. An Approach to Determine the Weibull Parameters for Wind Energy Analysis: The Case of Galicia (Spain). Energies 2014, 7, 2676–2700. [Google Scholar] [CrossRef] [Green Version]
- Haupt, S.E.; Pestana, R.; Zack, J.; Casado, M.G.; Davidson, M.; Dobschinski, J.; Du, P.; Lange, M.; Miller, T.; Mohrlen, C.; et al. The Use of Probabilistic Forecasts: Applying Them in Theory and Practice. IEEE Power Energy Mag. 2019, 17, 46–57. [Google Scholar] [CrossRef]
- Ramírez, P.; Carta, J.A. Influence of the data sampling interval in the estimation of the parameters of the Weibull wind speed probability density distribution: A case study. Energy Convers. Manag. 2005, 46, 2419–2438. [Google Scholar] [CrossRef]
- Alqunun, K.; Guesmi, T.; Albaker, A.; Alturki, M. Stochastic unit commitment problem, incorporating wind power and an energy storage system. Sustainability 2020, 12, 10100. [Google Scholar] [CrossRef]
- Type 4–Generic Wind Turbine Generator Model (Phase II). Available online: https://www.esig.energy/wiki-main-page/type-4-generic-wind-turbine-generator-model-phase-ii/ (accessed on 1 June 2015).
- DSA Tools (Dynamic Security Assessment), TSAT User Manual; Powertech: Surrey, BC, Canada, April 2018; pp. 25–30.
- Numpy Documentation. Available online: https://numpy.org/doc/stable/reference/generated/numpy.polyfit.html (accessed on 31 January 2021).
- Siemns PTI. Documentation MODELS PSS/E 33 Manual; Siemns PTI: New York, NY, USA, 2013. [Google Scholar]
- Siemns PTI. Documentation API PSS/E 33 Manual; Siemns PTI: New York, NY, USA, 2013. [Google Scholar]


| Characteristic | Required Input Data | |
|---|---|---|
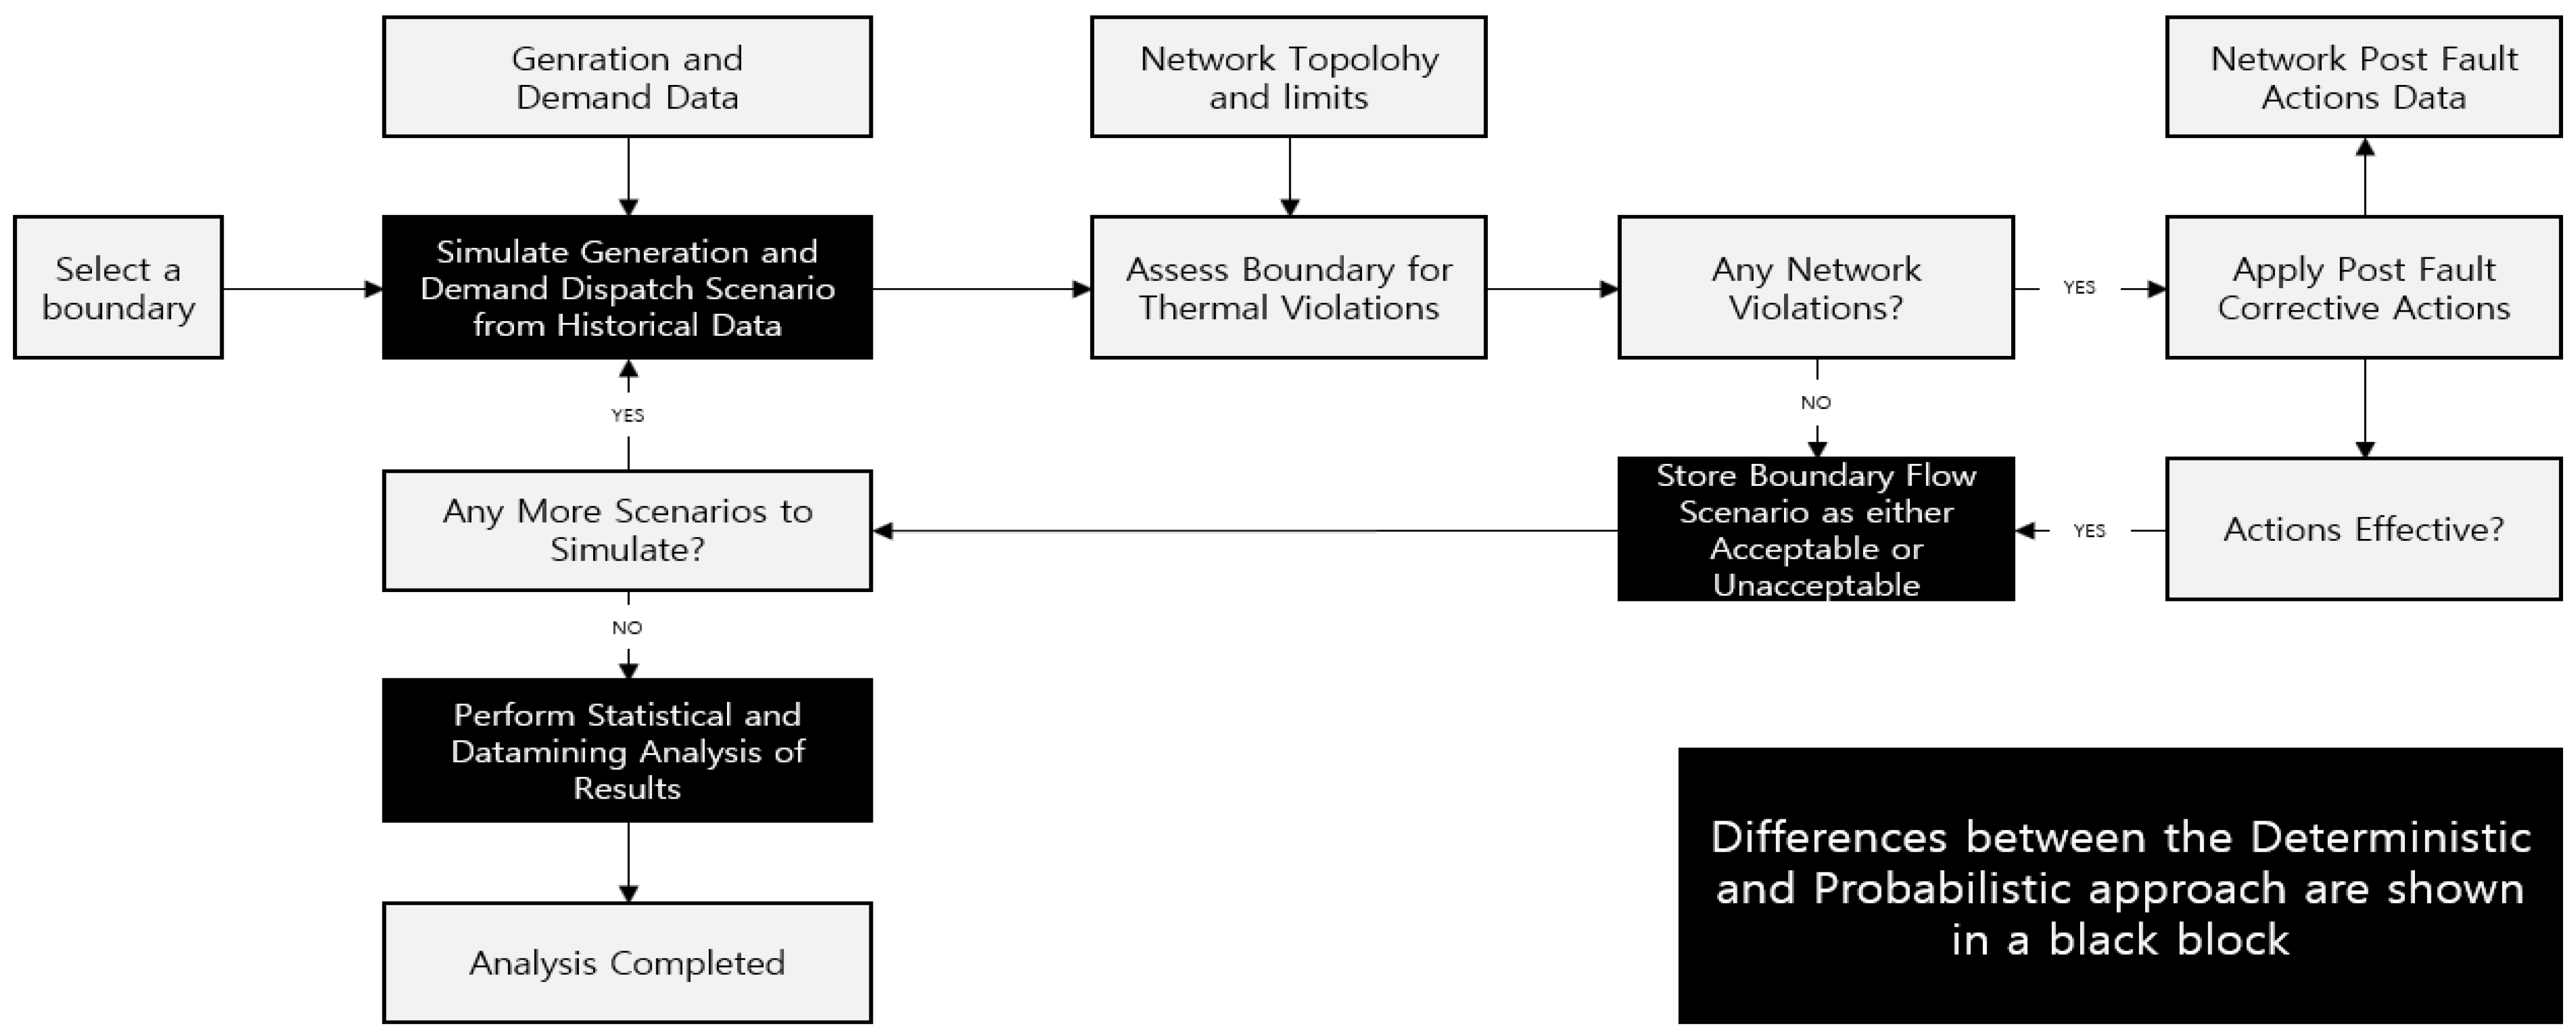
| Deterministic method |
|
|
| Probabilistic method |
|
|
| No. | Description |
|---|---|
| Scenario A | 665 cases, which is 95 cases with effective capacity of 1 95% in Region A times 7 contingencies |
| Scenario B | Simulating the 95 cased in Scenario A with the reduction method |
| Scenario C | Estimating stability of some cases with interpolation method |
| Scenario D | Simulating stability with the volatility of renewable energy using the gust model |
| Scenario E | Comparing calculation time |
| Level (%) | 1 | 2 | 3 | 4 | 5 | 6 | 7 | 8 | ~ | 92 | 93 | 94 | 95 |
| Renewable Generation (MW) | 83 | 166 | 249 | 332 | 415 | 498 | 581 | 664 | ~ | 7659 | 7742 | 7825 | 7908 |
| No. | Name | Voltage Level | Active Power (MW) |
|---|---|---|---|
| Contingency 1 | SGP–GN | 765 | 2510 |
| Contingency 2 | ST–SHW | 765 | 984 |
| Contingency 3 | ST–GN | 765 | 1674 |
| Contingency 4 | GN–DH | 345 | 120 |
| Contingency 5 | GN–GN#2 | 345 | 1846 |
| Contingency 6 | SC–DH | 345 | 326 |
| Contingency 7 | SYJ–SJ | 345 | 296 |
| Scenario No. | TSI | Time | Scenario No | TSI | Time |
|---|---|---|---|---|---|
| 1 | 54.9751 | Stable | 14 | 52.722 | Stable |
| 5 | 54.41605 | Stable | 18 | 51.98562 | Stable |
| ~ | |||||
| 63 (Unstable) | −98.1799 | 3.351 | 72 | −98.5122 | 2.435983 |
| 64 | −98.2984 | 2.951976 | 73 | −98.5222 | 2.415983 |
| ~ | |||||
| Scenario A | Scenario B | Scenario C | |
|---|---|---|---|
| Cases | 95 | 95 | 12 |
| Contingency list | 10 | 10 | 10 |
| Simulation time | 110 min | 77 min | 15 min |
Publisher’s Note: MDPI stays neutral with regard to jurisdictional claims in published maps and institutional affiliations. |
© 2021 by the authors. Licensee MDPI, Basel, Switzerland. This article is an open access article distributed under the terms and conditions of the Creative Commons Attribution (CC BY) license (https://creativecommons.org/licenses/by/4.0/).
Share and Cite
Cho, Y.-B.; Cho, Y.-S.; Lee, J.-G.; Oh, S.-C. Design and Implementation of Probabilistic Transient Stability Approach to Assess the High Penetration of Renewable Energy in Korea. Sustainability 2021, 13, 4205. https://doi.org/10.3390/su13084205
Cho Y-B, Cho Y-S, Lee J-G, Oh S-C. Design and Implementation of Probabilistic Transient Stability Approach to Assess the High Penetration of Renewable Energy in Korea. Sustainability. 2021; 13(8):4205. https://doi.org/10.3390/su13084205
Chicago/Turabian StyleCho, Young-Been, Yun-Sung Cho, Jae-Gul Lee, and Seung-Chan Oh. 2021. "Design and Implementation of Probabilistic Transient Stability Approach to Assess the High Penetration of Renewable Energy in Korea" Sustainability 13, no. 8: 4205. https://doi.org/10.3390/su13084205