1. Introduction
The substitution of fossil fuels for the use of renewable energies does not pursue any other purpose than to implement sustainable development worldwide, both in its social and economic fields. With this, it is possible to break with the trend of associating the economic development of a country and its energy consumption with the increase in greenhouse gas emissions. The current global concern to mitigate climate change has made renewable resources attractive in world economies in order to reduce environmental and health impacts derived from the normalized use of fossil fuels.
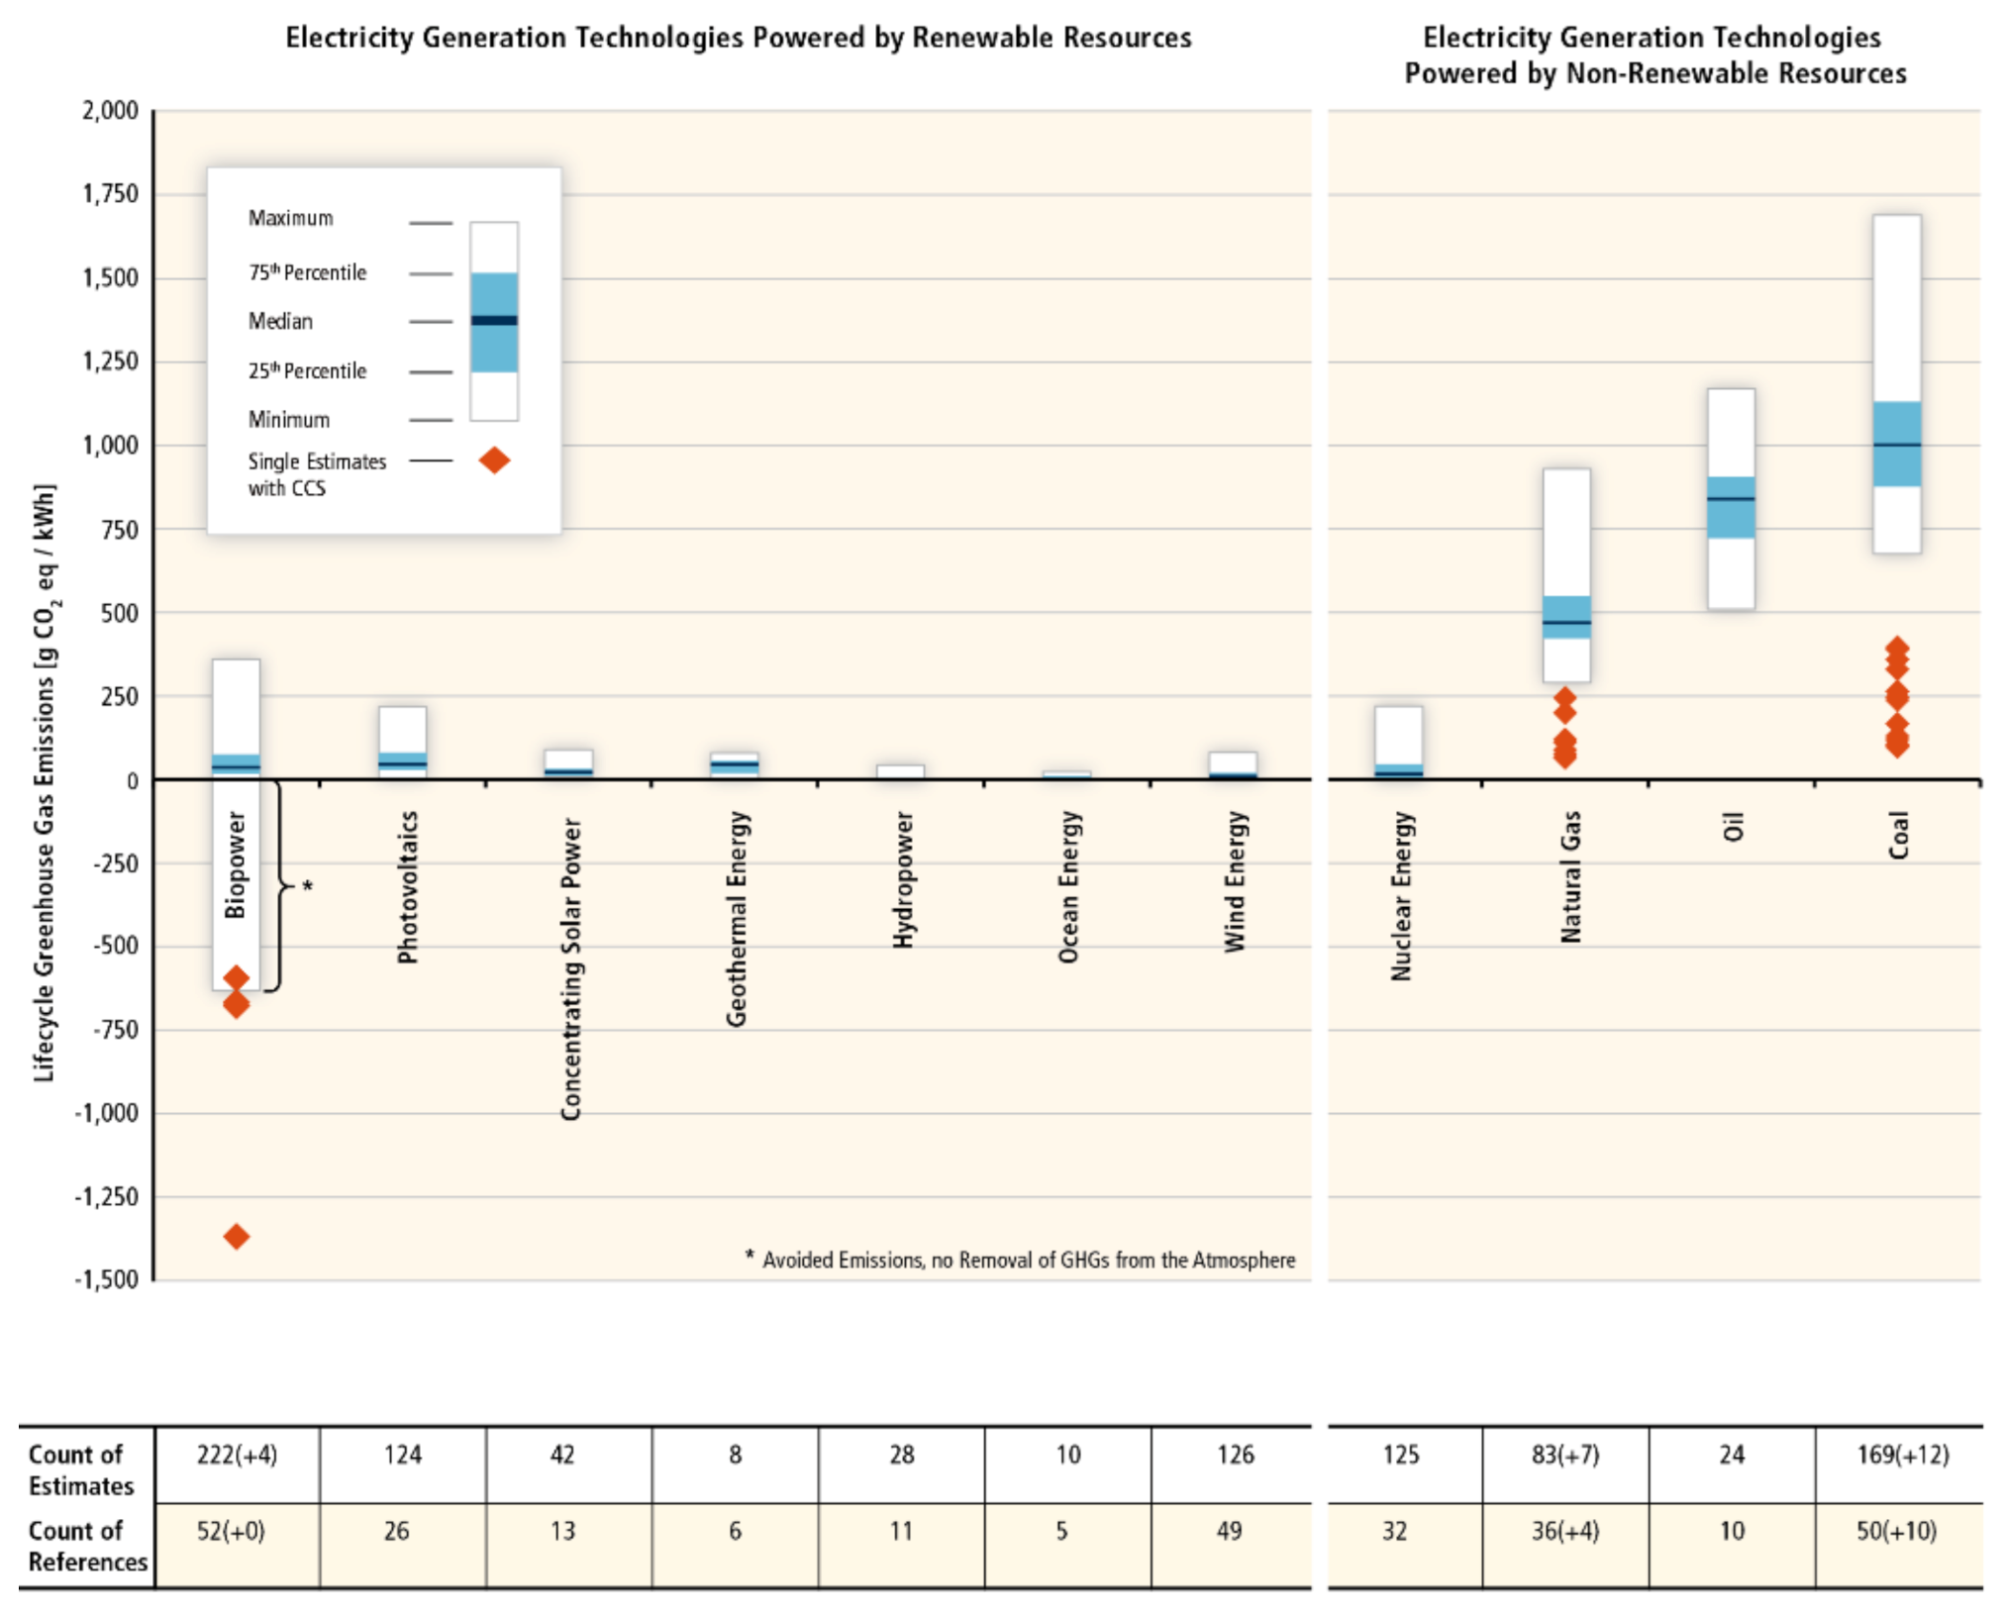
As it can be seen in
Figure 1, different analyses of the life cycle of electricity production show that greenhouse gas emissions from renewable energy technologies are, in general, quite a bit lower than those caused by fossils fuels. For the set of renewable energies, average values vary between 4 and 46 g of CO
2eq/kWh, the concentrating solar power technology being the one with the lowest value, while for fossil fuels values are between 469 and 1001 g CO
2eq/kWh [
1]. This figure also shows the relatively low number of studies carried out, especially for renewable energies (only wind energy and biopower list around 50 studies, other renewable energy technologies list between 5 and 10 studies each). Moreover, those technologies showing a larger number of studies also present high variability in the emissions.
Over the years, renewable energy technologies have been integrated into a wide range of power supply systems, but in order to achieve a seamless integration and increase the penetration of these technologies, their specific characteristics must be taken into consideration. That is the case for the variability and uncertainty of renewables, which represent a challenge on the programming required by the electrical energy system, with variations in the electricity production by day, week, and season. In this context, the concept of dispatchability is used, where electricity can be dispatched on demand at the request of power grid operators, according to market needs. Dispatchable generation systems can have differing characteristics, including response time, availability to generate, duration of generation, practical upper and lower limits on generation level, or the ramp rate from one generation level to another. Other characteristics that have to be considered are the location of the renewable energy resources, as well as the capacity factor. Dispatchability of renewable electricity increases when storage is included in the power supply systems.
As countries agree to pursue transition goals towards cleaner energy, reducing the use of fossil fuels, it is clear that energy storage to promote the penetration of renewable energy is vital. In this context, the impact generated by storage technologies, both in investment cost and in the environmental field, is seen as of high interest [
2].
One of the commercial renewable energy systems is solar thermal electricity (STE) production, produced in the so-called concentrating solar power (CSP) plants. STE generates electricity thanks to mirrors, which allow concentrating the sun rays at a high temperature, between 400 °C and 1000 °C, with the ultimate goal of powering a heat engine, usually a steam turbine, to generate electricity to feed the electrical grid. STE can be specifically integrated with thermal energy storage or in hybrid operation, offering firm capacity and dispatchable power on demand. Therefore, STE can replace fossil fuel power plants and contribute to a 100% renewable energy supply as one of the renewable technologies capable of following the demand curve and ensuring a secure supply 24/7 (
Figure 2) [
3].
Figure 2 shows that in a plant with storage, a constant electricity power is achieved during the 24 h of a day. When the sun is available, the hot tank increases its energy availability, that it is used when the sun is not available (from 19:00 h to 6:00 h in the day shown).
Although these power plants have been studied in depth regarding different aspects, their environmental impact is still a pending issue. Only a few studies are found in the literature, and none of them presents a detailed inventory of a complete CSP plant. For example, Piemonte et al. [
4] presented a life cycle assessment (LCA) of an innovative solar technology combining a concentrated solar power plant (CSP) with an auxiliary biomass burner to compare the results with the LCAs of other energy technologies such as gas and heavy oil power plants (data taken from literature). Oró et al. [
5] compared the environmental impact of three different thermal energy storage (TES) systems for solar power plants: sensible heat storage both in solid (high temperature concrete) and liquid (molten salts) thermal storage media, and latent heat storage using phase change material (PCM). Lalau et al. [
6] evaluated the environmental impacts of a conventional CSP storage technology “two tanks/molten salt” and those of an innovative storage “thermocline/Cofalit and molten salt”, evaluating only the impacts of the storage system. Whitaker et al. [
7] evaluated greenhouse gas (GHG) emissions, water consumption, cumulative energy demand (CED), and energy payback time (EPBT) for reference design of a tower CSP plant hypothetically located in the United States, whose characteristics were derived from previous research by Sandia National Laboratories on molten salt tower plant designs in conjunction with operational plant modeling work performed by the National Renewable Energy Laborory (NREL). Pelay et al. [
8] presented a LCA of a hypothetical tower CSP plant with a Rankine power cycle with thermochemical energy storage (TCES) with calcium hydroxide. The result of the comparison of the LCA with the reference plant without storage concluded that the additional environmental impact due to the TCES system was relatively small. Those authors found that conventional component libraries (e.g., Ecoinvent, LCA Food DK, USA Input Output Database) were not suitable for the study of power plants due to lack of data.
Therefore, the aim of this paper is to do, for the first time, a complete LCA analysis of a CSP tower plant in baseload configuration using data from real plants. Moreover, the influence of the storage system in the overall LCA is evaluated comparing a commercial baseload CSP tower plant with a two-tanks molten salts system with a hypothetical CSP tower plant without TES. Finally, the impact of the salts’ source is evaluated to understand if the nature of the salts (natural from mines vs. synthetic) has more or less impact than the transport from long distances.
2. Methods
2.1. Description of the Considered CSP Plants
Solar power towers (SPT), also known as central receiver system (CRS), basically consist of a solar field, receiver system, thermal storage system, and finally a power block.
First, incident sunrays are tracked by large mirrors, called heliostats, which reflect and concentrate the energy flux towards the heat exchanger, called solar receiver, where incoming radiative energy is transferred to a heat transfer fluid (HTF). Afterwards the collected heat can be stored in a thermal energy storage (TES) or directly used in a power block which has many similarities with a fossil-fired power plant power block [
9].
A molten-salt tower uses a tubular-type receiver mounted on top of a tower where the reflected solar energy from a heliostat field heats the molten salt receiver; molten salts are heated from 290 °C to 565 °C in the receiver and then enter into the hot thermal storage tank. Later, hot salts are pumped from the storage system to generate steam within a molten salt steam generator. The generated steam is then fed into a conventional reheat steam turbine to produce electricity. The cooled salt is returned through the thermal storage system to the receiver.
The thermal storage system buffers the molten salt steam generator from solar transients and supplies energy during periods of no insolation, at night or on partly cloudy days. Since the salt remains in a single liquid phase throughout the process, and because of its relatively high heat capacity, it is stored in compact storage tanks. The hot salt temperature of 565 °C enables steam production at temperatures and pressures typical of those used in conventional subcritical Rankine plants, commonly superheated steam at 540 °C and 130 bar and reheat steam conditions of 538 °C and 30 bar approximately.
Varying the storage capacity is a method of tailoring STE plants to meet different needs. There are four different strategies [
10]:
- -
Intermediate load configuration, designed to produce electricity when sunshine covers peak and shoulder loads.
- -
Delayed intermediate load configuration, designed to collect solar energy all day, but produce electricity from noon onwards after sunset to meet local peak and shoulder loads.
- -
Peak load configuration, designed to provide electricity only for a few hours to meet the extreme peak load.
- -
Baseload configuration, designed to operate 24 h per day for most of the year. This is the case with larger storage capacity and reach higher capacity factor.
The thermal energy storage system consists of the following elements: (i) nitrate salt inventory, (ii) hot and cold storage tanks, and (iii) the molten salt circulation pumps. Regarding the storage tanks, cold storage tanks are commonly fabricated with ASTM A-516 Gr.70 carbon steel while hot storage tanks are fabricated with stainless steel, mainly ASTM A-347H or ASTM A-321H. Due to the higher operating temperature for the hot storage tank, special design considerations are needed to limit loadings and stress resulting from thermal effects. That means better quality materials for the walls of the hot storage tanks. Tank foundations are also passively air-cooled. Inside the tanks, the vertical design molten salt circulation pumps are located.
Molten salt steam generators generally consist of a train of shell and tube heat exchangers, composed of a preheater, an evaporator, a superheater, and a reheater as well as a steam drum. The high-pressure fluid (steam) is placed on the tube side and the low-pressure fluid (molten salt) is placed on the shell side. The tubes are rolled and seal-welded to the tube-sheet in order to improve the reliability of the heat exchanger. Those equipment are made of stainless steel, mainly ASTM A-347H, as the temperature operation or corrosion issues require such kind of materials.
For the case under study, a baseload solar power tower configuration was selected. The baseload power plant is designed to provide a constant electric output for the full day, maximizing the capacity factor of the plant on a yearly basis. To achieve this using solar energy as an input, it is indispensable to have a storage system able to cope with solar transients (such as cloudy days) and to provide the energy needed for nighttime electric production. The configuration of the tower power plant is the one described above, but with a special consideration on the TES sizing. This sizing is highly dependent on the weather conditions of the emplacement, which directly affect the final capacity factor achievable by the solar power plant. Considering these factors, the CSP plant used for this study had a storage capacity in molten salts of 17.5 equivalent hours at nominal conditions. This storage capacity coupled with the daytime simultaneous production allows for a 24/7 electric baseload production.
Since the aim of this paper was to assess the effect of the thermal storage on the LCA of a CSP tower plant, a CSP tower plant without storage was needed for comparison (
Figure 3). To extract the influence of the TES on state-of-the-art CSP tower plants, the comparison had to be performed using the same technology, and thus a specific molten salts solar tower power plant without storage was generated by the authors for this study, even when this configuration is not a commercial nor under-investigation solution. Nevertheless, the proposed configuration was fully functional and considered the main issues and needs of a power plant of the requested characteristics.
First, a solar tower power plant with zero storage is not recommended technically due to the incapability of the steam cycle to absorb transients and the impossibility of operating a steam turbine under quickly varying inlet conditions. In order to have the closest approach to a technically viable no storage molten salts tower power plant, a small molten salts buffer able to mitigate solar transients was included in the configuration. This configuration had a lower impact on equipment modifications from the original tower power plant concept than the other possibility of installing a steam buffer, since the installation of this molten salts buffer only implies an oversizing on the equipment for the plant that is required anyway (as it will be explained below) while the installation of a steam buffer implies the inclusion of non-existing equipment (a steam storage) and the modification of the cycle set-point (varying pressure conditions on steam storage discharge).Considering the abovementioned, the configuration of the no storage molten salts solar tower power plant had the same power cycle and set point as the baseload molten salts solar tower power plant used as reference, but with the following modifications on the solar part: (i) reduced number of heliostats, (ii) reduced thermal capacity of the solar receiver, (iii) reduced tower height, (iv) increase in outlet molten salts receiver vessel for use as buffer, and (v) removal of hot molten salts tank. In this configuration, the molten salts are pumped from the cold storage tank at 290 °C into the receiver, where they are heated up to 565 °C using the solar energy reflected by the field of heliostats, same as with the baseload configuration. At this point, instead of going directly to the hot molten salts tank, the salts are partially stored in the outlet vessel of the solar receiver. This small buffer allows to absorb solar transients, thus avoiding problems in the power cycle. From the outlet vessel buffer, the salts enter the train of heat exchangers as explained before and go back to the cold molten salts storage tank closing the molten salts cycle.
When using molten salts, it is indispensable to have at least one storage tank where the salts are drained during non-operation hours, since the presence of salts on the piping during the night could lead to freezing problems. With the proposed configuration, the minimum equipment for a technically viable molten salts solar tower power plant without storage is described, allowing for a fair comparison with a baseload molten salts solar tower power plant.
2.2. LCA Methodology
2.2.1. Life Cycle Assessment
Life cycle assessment is a methodological tool that allows the estimation and evaluation of the environmental impacts generated by a product or service during all stages of its life. In most cases, it includes the manufacturing phase (extraction of raw materials, handling, and processing), operational phase (the normal and intended use of the product), and the disposal phase (the end of the product service). Any activity or process causes environmental impacts, consumes resources, emits substances into the environment, and can generate environmental modifications throughout its life [
4].
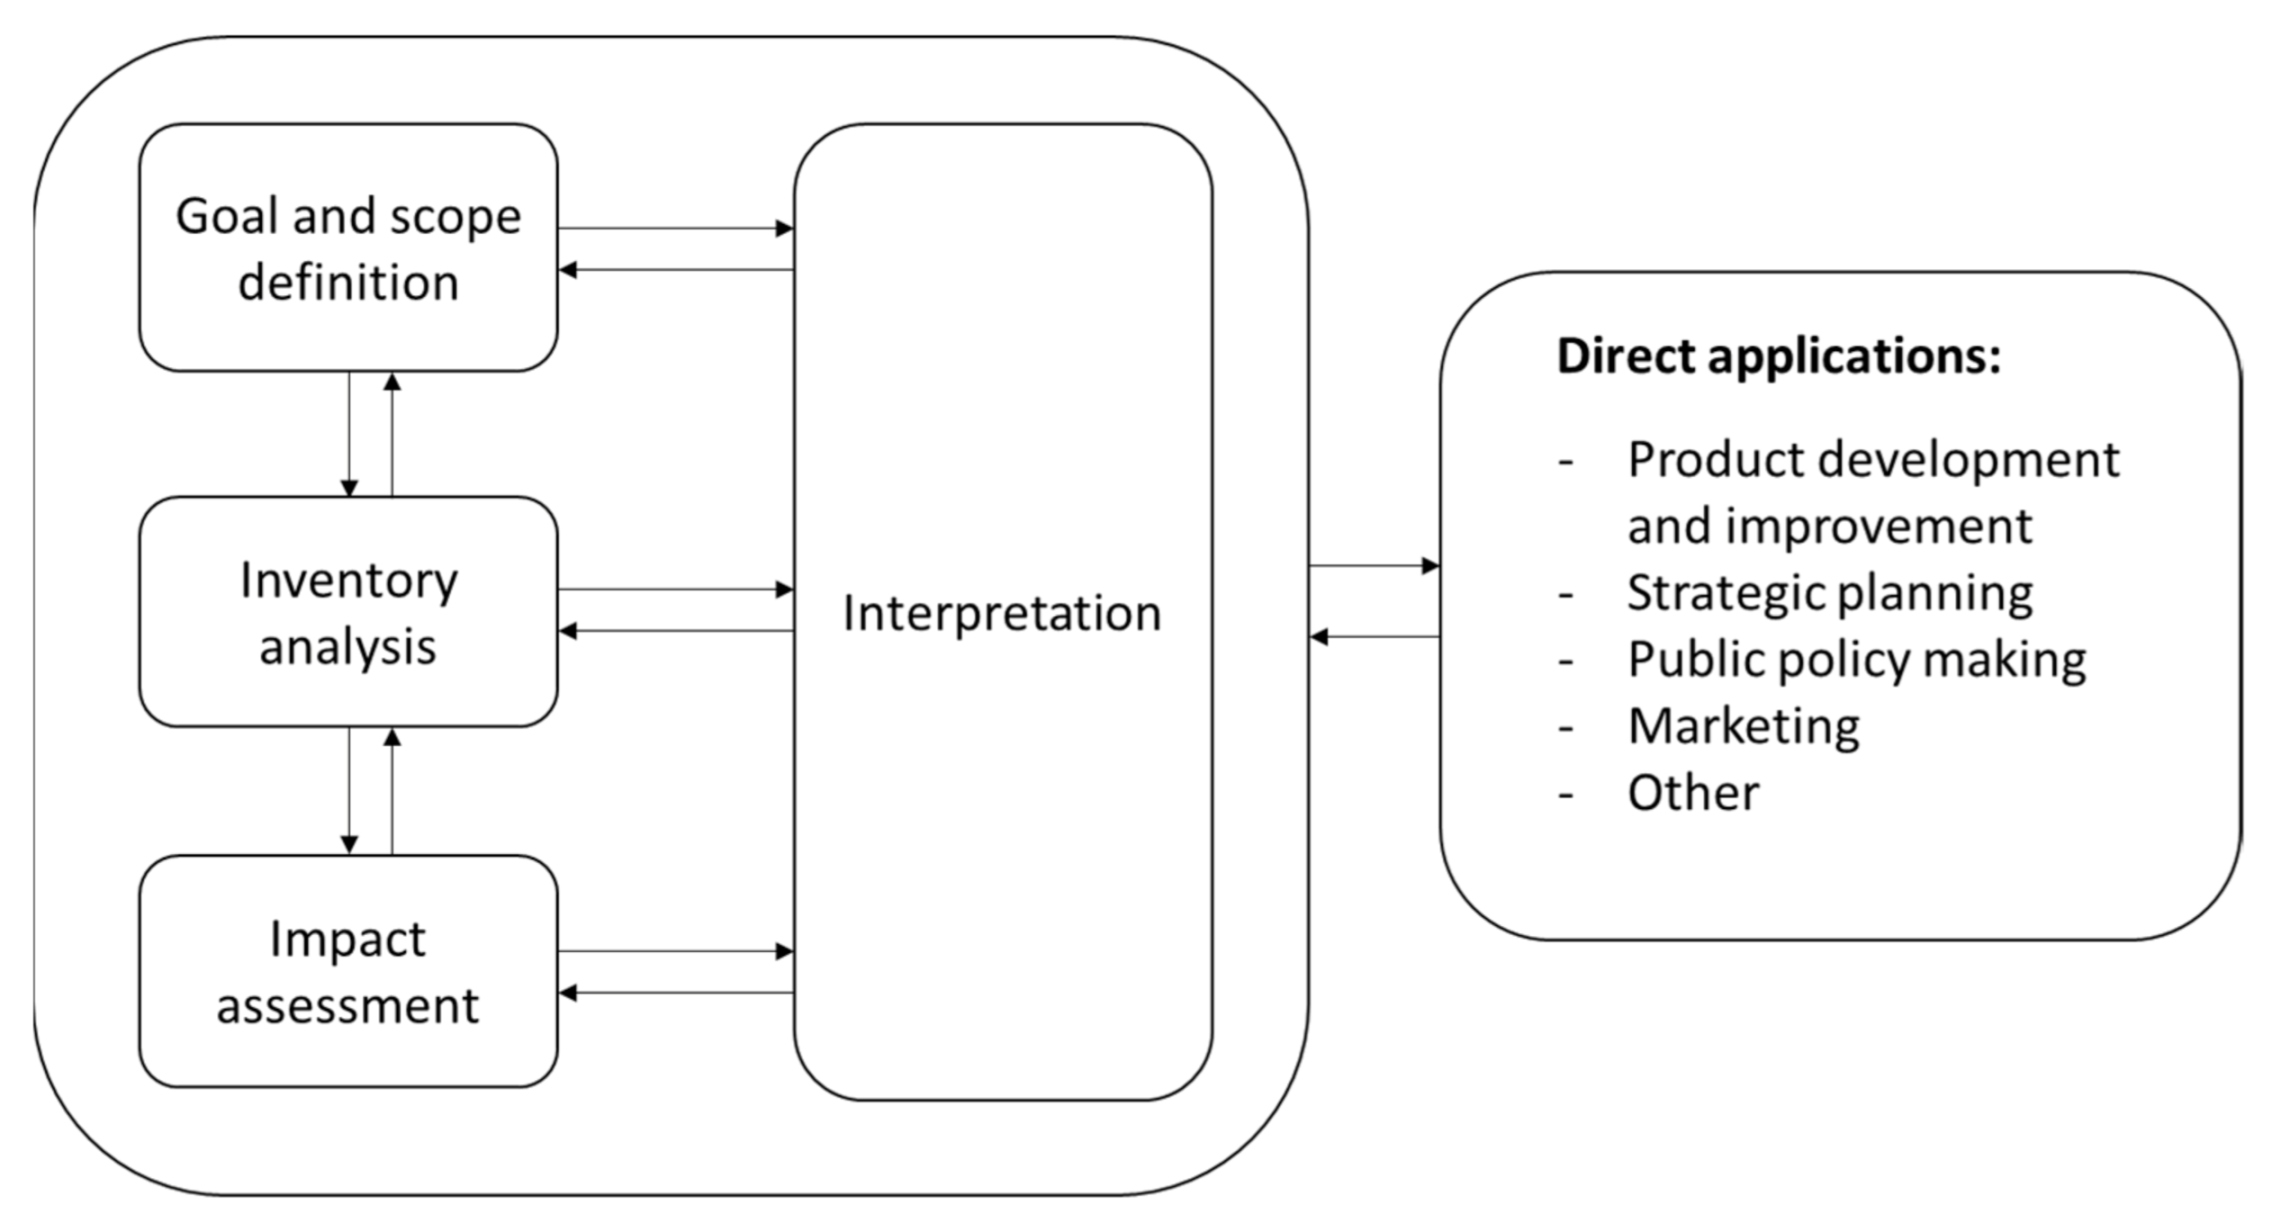
The life cycle analysis (LCA) of a product is regulated by the ISO 14040 [
11] and ISO 14044 [
12] standards. According to these standards, when analyzing environmental aspects and potential environmental impacts throughout the life cycle of a product, the following activities must be carried out, as
Figure 4 indicates:
Compile an inventory of relevant inputs and outputs of the product system.
Assess the potential environmental impacts associated with the inputs and outputs identified in the inventory.
Interpret the results of the inventory analysis and impact evaluation phases in accordance with the objectives of the study (LCIA).
Life cycle impact assessment (LCIA) allows the interpretation of LCA studies by translating emissions and resource extraction into a limited number of environmental impact scores. This is done through so-called characterization factors, which indicate the environmental impact per unit of stressor. There are many impact evaluation methods, but this experimental study is based on the ReCiPe and IPCC2013 GWP impact evaluation method, extracted from the Ecoinvent database [
13].
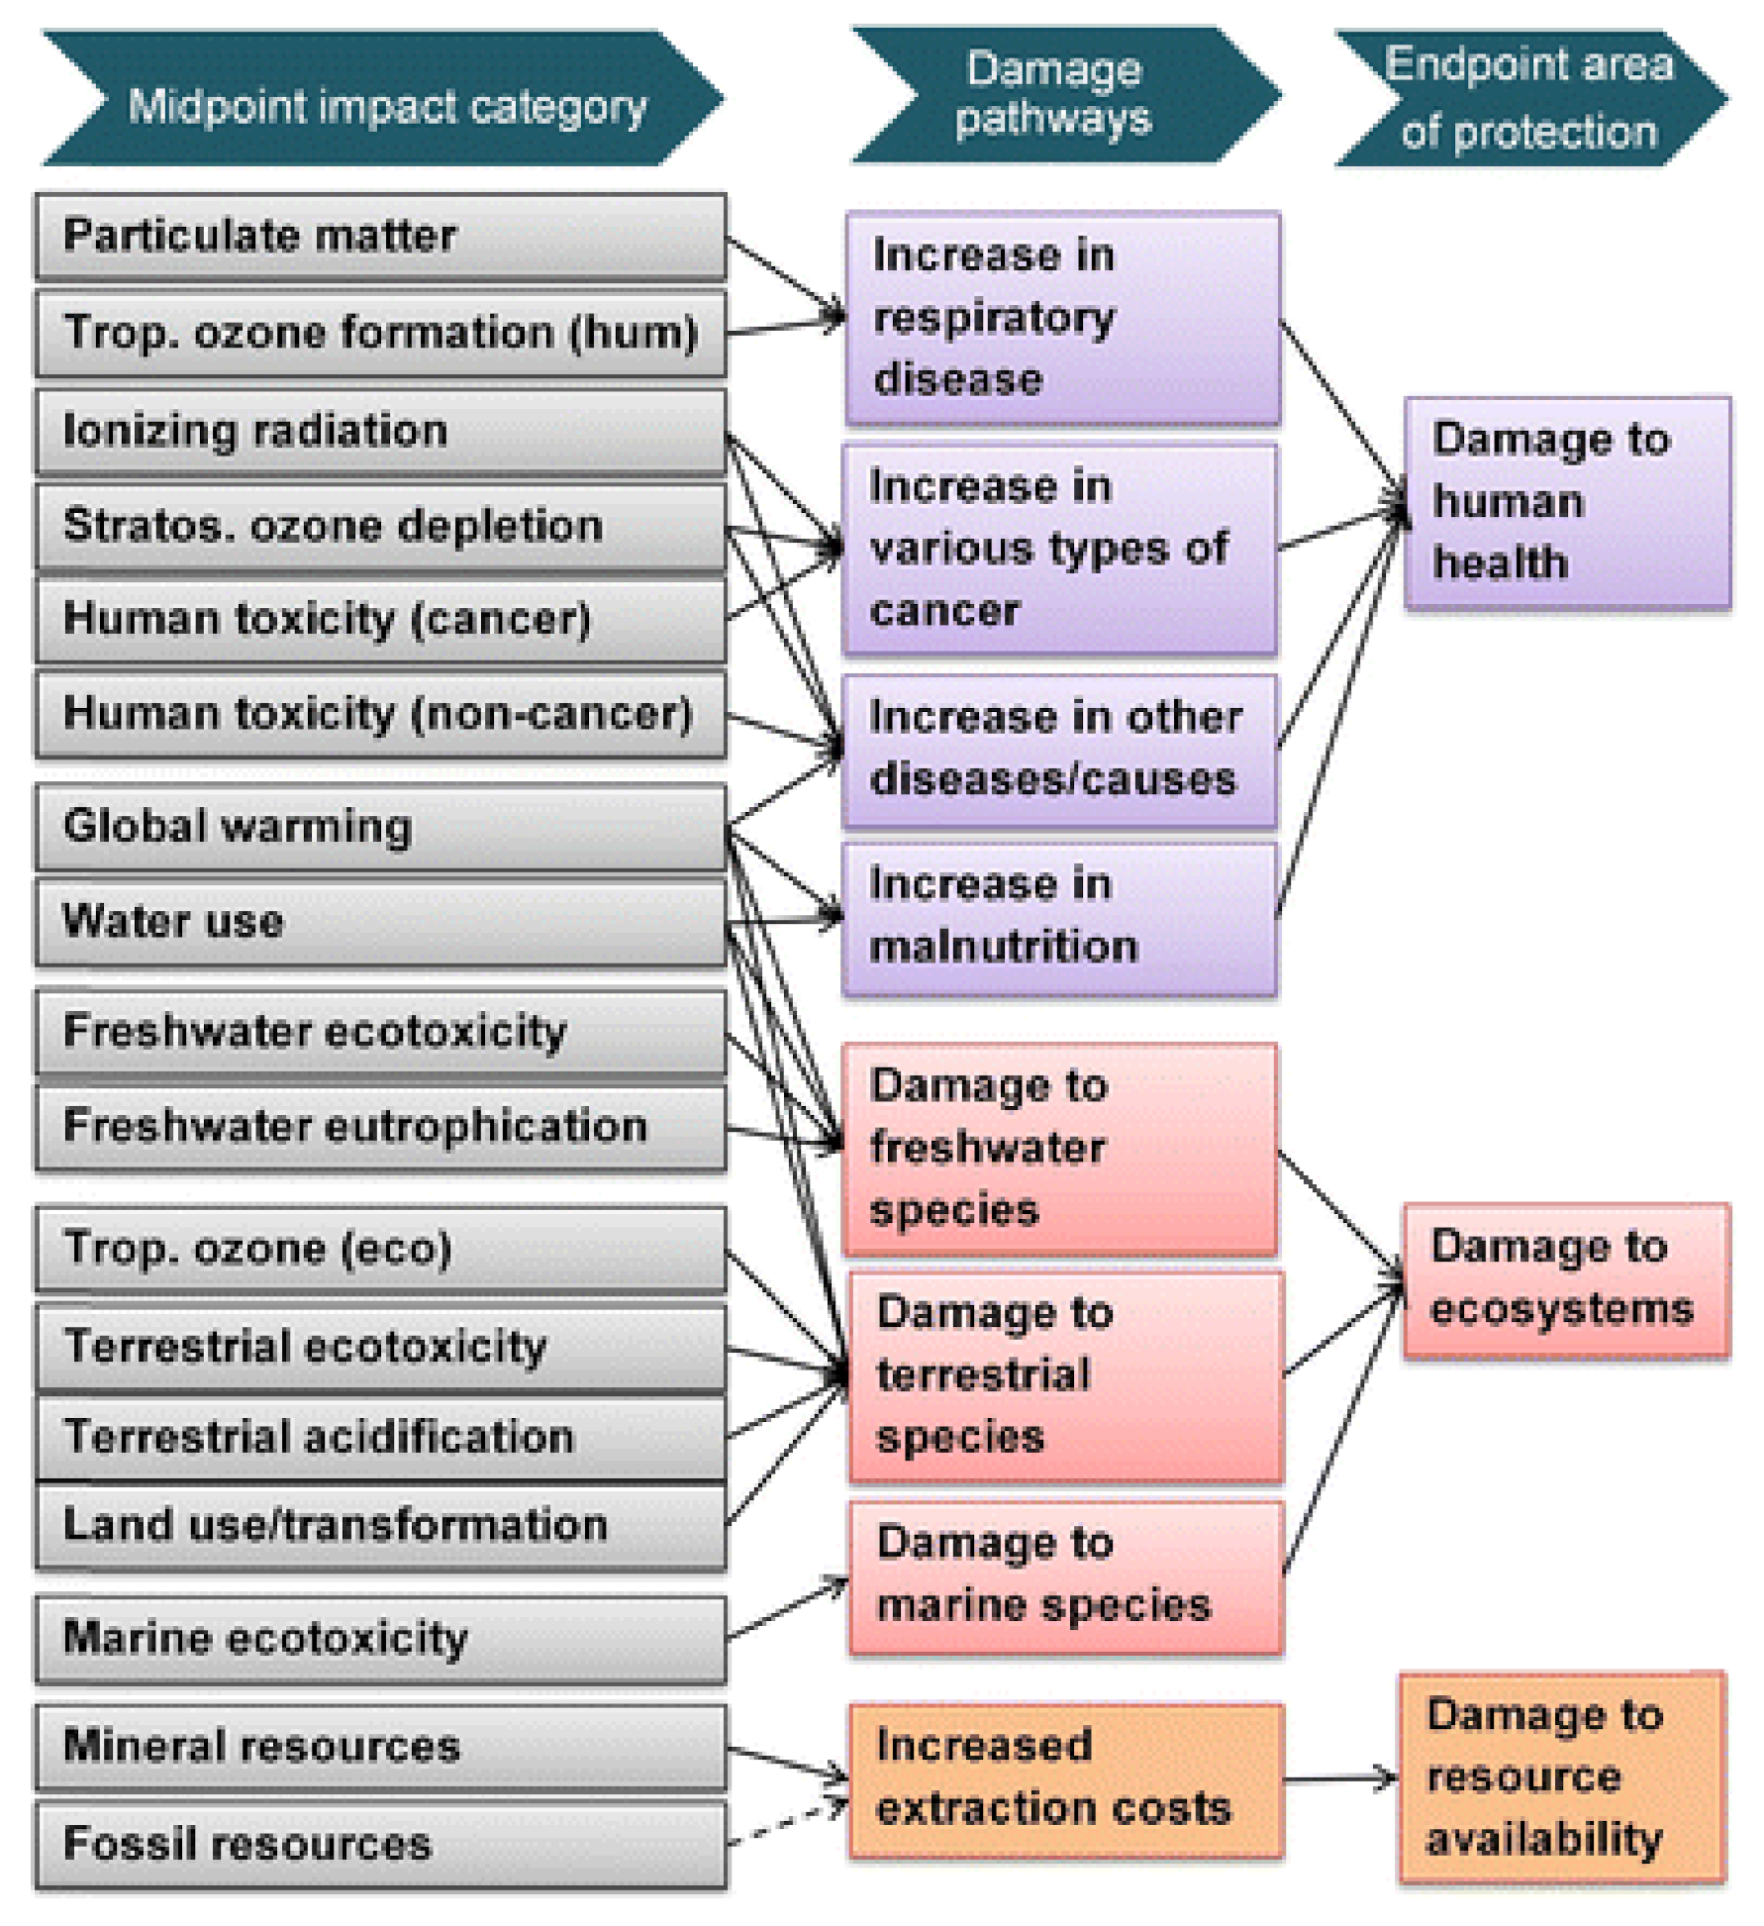
The ReCiPe method provides a recipe for calculating the lifecycle impact category indicators, allowing you to convert the results of the lifecycle inventory into a limited number of indicator scores. These scores express the relative severity in a category of environmental impact. In ReCiPe, indicators are determined at two levels, midpoint indicators and endpoint indicators. The ReCiPe2016 version includes three categories of endpoints (human health, ecosystem quality, and resource scarcity) and 17 categories of intermediate points, as shown in
Figure 5, with the aim of providing the link between the environmental mechanisms (midpoint impact categories) and the three areas of protection (endpoint indicators) [
14].
Regarding the IPCC method (climate change), it is based on the characterization of the global warming potential (GWP) since this index estimates the relative contribution to global warming due to the atmospheric emission of one kg of a particular greenhouse gas compared to the emission of one kg of carbon dioxide [
15]. Two time horizons are used to show the effects of atmospheric lifetimes of the different gases: GWP20a and GWP100a.
2.2.2. Aim and Scope
The objective of this study is to make a comparison of the LCA of a concentrated solar tower power plant (CSP) in a baseload configuration with a solar tower power plant without thermal energy storage (TES) and with the result obtained, carry out an assessment, beyond the indicator obtained of the environmental impact of each of the two configurations, which allows adjusting the value obtained from the LCA with its contribution to decarbonization and dispatchability.
The comparison of the results was carried out between two CSP tower plants with a net production of 110 MWel in tower configuration, considering that the useful life of both CSP plants is 30 years.
In the case of the CSP plant with storage, data were taken from a plant with a thermal storage of 17.5 h. The data used to perform the LCA of the CSP plant without energy storage were obtained by scaling the data of the CSP plant with energy storage.
2.2.3. Functional Unit
In this study, “1 kWh of net electricity fed to the grid” was chosen as the functional unit, and in accordance with ISO 14040 and 14044 standards, the final results of the LCA are expressed in terms of this functional unit. As the environmental impacts are expressed per kWh, they will be comparable to other studies.
2.2.4. System Boundary
The limits of the system must be defined to know which are the relevant activities for the LCA study, defined, in this case, as cradle to grave [
16]. This study includes all the parts of a CSP tower plant, assessing their impact in its construction, operation, and end-of-life phases, as shown in
Figure 6. The data considered in this study end in the generation of net electricity fed to the grid.
The life-cycle phases considered in the system boundaries were:
Manufacturing phase: This phase comprises the raw material acquisition, construction of the components, and building materials as well as the energy required for the setup at site [
17].
Operational phase: This phase includes all activities related to the operation of the plant. It included grid electricity consumption, consumption of process water, as well as materials for correct operation, such as water treatment chemicals.
End-of-life phase: It includes dismantling the plant components and demolishing the buildings, and their transport to the landfill site and/or to recycling sorting plants [
17].
2.2.5. Impact Inventory
To obtain the environmental impacts associated with materials and energy, contemplated in this study, the database Ecoinvent v3.6 was used. The data chosen from the database were from the geographical area RoW (rest of the world). The quantitative indicators used for this study were both the ReCiPe2016 and the IPCC2013 GWP.
2.2.6. Data Inventory
The inventory of the inputs and outputs included in the case of the CSP tower plant with storage was compiled with real data provided by Abengoa. For the case of the inventory of the CSP tower plant without storage, a fictitious configuration was assumed and for this, some inventory values were obtained by scaling values of the CSP plant with storage.
The number of heliostats, solar tower height, and receiver thermal capacity for the no storage configuration were obtained using SAM software, considering the turbine power requirements and defining 0 h of storage. The values obtained from SAM simulations were used to define scaling coefficients, to apply to the different related parts, and obtain the material inventory.
The minimum molten salts inventory for a solar tower power plant without storage was calculated with three main considerations: (i) piping internal volume during operation, (ii) buffer dimensioning, and (iii) dead volume on the tank for pumping requirements. For this last point, a dimensioning of the tank was performed based on the tank used for the baseload case but optimizing its useful salts inventory dead salts volume requirements.
CSP plants with thermal energy storage can offer essentially all the electric power products and services provided by conventional, flexible thermal power plants. Different combinations of solar field size, storage tank size, and electricity capacities provide great flexibility in CSP plant design. The benefit of the TES in CSP levelized cost of electricity (LCOE) has been studied in the state of the art [
18,
19]. While the highest capacity factor may lead to the lowest LCOE, this is not necessarily the optimal economic configuration. The LCA must be evaluated and considered in a more holistic way. As the storage capacity affects the LCOE, the storage capacity affects the LCA. However, for this first study, where the comparative methodology of the CSP plant with and without TES was designed, the case baseload was set because it is the case that most closely resembles fossil fuel plants. In a second study, the impact of the different TES capacities in the LCA will be analyzed.
Table 1 shows the characteristics of the two CSP tower plants, with and without storage, which were taken into account to carry out this study.
To carry out the inventory of the two plants for the manufacturing stage, the inventory was divided into nine main groups, according to
Figure 7, in order to be able to subsequently analyze all the data: solar field area, receiver system, tower, steam generation system, power block, TES & HTF systems, foundation and auxiliary buildings, wiring, and piping.
The classification used included the same criteria for both plants, so for each of these nine groups, the materials and weights are shown in
Table 2.
In order to adapt the available data from the commercial plant to the case without storage, four main scaling ratios were used: (i) the heliostat ratio, used for the solar field and the cables related to the solar field, (ii) the receiver power level ratio, used for the receiver system, in which the increase of the molten salts outlet vessel and the modifications of the molten salts mass flow rates were also considered, (iii) the expected operation time of the power block (24 h/day for the plant with storage and 8 h/day for the plant without storage) which was used partially for the dimensioning of the water treatment plant, and (iv) the tower height, used for the tower subsystem and related components such as the molten salts pump. The scaling of the system was performed considering the specifics of the solar plant without storage, combining these ratios with the resizing of the piping and deletion of not-required components, such as the hot storage tank.
As shown in
Figure 3, for this comparative study, the grid electricity consumption of both tower CSP plants, the water consumption, which includes the water consumed in the cleaning of heliostats, and the chemical products added for the treatment of process water were considered (
Table 3). As it can be seen in the table, the grid electricity consumption greatly increases when no storage is considered. This consumption is called offline consumption, and as its name suggests, it is related to the periods of time when the plant is not generating electricity, such as start-up procedures, control room powering, air conditioning, etc. In the baseload configuration, this consumption is very low due to the 24/7 generation strategy, but in a plant without storage, this electricity is required constantly.
The electrical energy used in this study is the energy mix of 2016 in Spain.
3. Results
Figure 8 shows the impact generated by each of the tower CSP systems analyzed in this study, with and without storage, according to the ReCiPe method. The indicators are expressed as a function of the functional unit of 1 kWh of electricity produced.
The total ReCiPe impacts (manufacturing + operational) per functional unit of a plant without storage was slightly more than double of that for a CSP plant with storage (
Figure 8a). When these impacts were broken down into impacts that are generated during the manufacturing phase and the operational phase,
Figure 8b shows that, for CSP without storage, the impacts were generated, practically in the same proportion, by the two phases, but for CSP with storage, almost all of the impacts generated during manufacturing phase and the operational phase impacts were very small in comparison.
Figure 9a shows how the total ReCiPe impact by functional unit was distributed in its three categories (ecosystem quality, human health, and resources). For the CSP plant without storage, the highest impacts came from the category ecosystem quality, the same as for the CSP plant with storage. During the manufacturing phase,
Figure 9b, for the two types of CSP, the category that had the highest impact was ecosystem quality, followed by resources, and then by human health. For the operational phase,
Figure 9c, for the CSP without storage, the category that had the greatest impact was ecosystem quality, followed by human health, and resources. However, for the CSP with storage, the category that had the highest impact was ecosystem quality, followed by resources, and by human health, although the latter were practically the same.
Looking at the ReCiPe categories in detail, it is interesting to see that within the category of ecosystem quality, the subcategory urban land occupation was the one with highest impact, but on the other hand this was of low impact in a CSP plant like ones studied here, which are located in the dessert. Another subcategory to look at is the natural land transformation, but this was highlighted only in the manufacturing stage in both CSP configurations. It is interesting to see that the subcategory climate change that appeared both in the category ecosystem quality and in the category human health, also showed higher impact than others. Finally, in the category of human health, the subcategories human toxicity and particulate matter formation stood out in the CSP plant with storage and not in the one without storage.
In the case of an analysis with the IPCC method with the GW20a indicator,
Figure 10a, the total of kg CO
2 emitted (manufacturing + operational) per functional unit of a plant without storage was 67% higher than for a CSP plant with storage. When these impacts are broken down into impacts that are generated during the manufacturing phase and the operational phase,
Figure 10b shows that for a CSP without storage, climate change impacts were generated mostly in the operational phase, but for CSP with storage, almost all impacts were generated in the manufacturing phase, the impacts generated in the operational phase being very low.
Figure 11 shows the contribution of each system in the CSP plants to the total impact points evaluated with the ReCiPe indicator. The main objective of this figure is to be able to see which system of the CSP plants most influenced the global environmental effects (ecosystem quality, human health, and resources) taking into account the whole life of the plant (cradle to grave). For a CSP plant without storage (
Figure 11 left), the system with the highest impact was the solar field (30%), followed by wiring (20%), and the HTF system (16%). The other parts of the plant generated impacts equal to or less than 10%. In the case of a CSP plant with storage (
Figure 11 right), the system with the highest impact was the TES & HTF systems (48%), followed by the solar field (29%). The other systems of the plant generated impacts of less than 10%.
In the case of analyzing the impact calculated with the climate change indicator (IPCC2013 method) at 20 years (
Figure 12), there were differences in terms of the impacts observed with ReCiPe. In the case of a CSP without storage (
Figure 12 left), the highest impact was mainly in the solar field (45%), and its contribution to the overall impact was higher than when the ReCiPe indicator was used. Then, the other systems that generated the highest impact were the tower (14%) and the HTF system (12%). The other systems of the plant generated impact contributing less than 10% to the overall impact. In the case of a CSP plant with storage (
Figure 12 right), the IPCC indicator at 20 years indicated that the solar field generated the highest impact of the plant (contributing 46% to the overall impact), followed by the TES & HTF systems (33%). The other systems that make up the plant generated impacts contributing less than 10% each.
Therefore, the systems with more impact identified would be those where bigger efforts need to be invested to decrease the impact of the overall CSP plant. Both indicators show that the systems with more impact are the solar field and the TES and HTF systems.
Figure 13 and
Figure 14 show which of the components of the solar field significantly influenced the overall impact of that system. Both figures show that the systems with and without storage had the same contribution of the different components. This is reasonable since the only difference between both plants was the number of heliostats, but the components of each heliostat were the same.
Figure 13, which evaluates the contribution of each solar field component of a CSP to the total ReCiPe impact, shows that the metallic structure of the heliostats contributed almost half (47%) to the overall impact of the solar field system. The next component that contributed the most to the total ReCiPe impact was the concrete foundation, with 19%.
Figure 14 shows that when the climate change indicator GWP 20a was used, again the metallic structure of the heliostats and the concrete foundation were the two components contributing most to the overall impact (38% and 33%, respectively). These results show that the ReCiPe indicator gives more impact to the use of metallic components, while the climate change indicator attributes more impact to the use of concrete.
A similar analysis is carried out for the TES & HTF systems.
Figure 15 and
Figure 16 show that the component that had the highest impact, whether with the ReCiPe indicator or with the climate change indicator and whether considering the system with or without storage, were nitrate salts. Both figures show different contribution of the different components, and this is reasonable since they are different. The plant without storage (
Figure 15 left and
Figure 16 left) used molten salts as HTF, while the plant with storage (
Figure 15 right and
Figure 16 right) used molten salts as HTF and as storage media, and also added components such as the storage tanks.
Figure 15 shows that even though molten salts were the component with highest contribution to the overall impact (84% in a plant without storage and 90% in one with storage), the biggest difference was seen in the contribution of the tanks. In the plant without storage, there was only one tank (so-called cold tank), with a contribution of 12% in the total plant impact. On the other hand, in the CSP plant with storage (
Figure 15 right), the impact of the two tanks was only 9% of the total impact (6% for the hot tank vs. 3% for the cold one). The higher impact of the hot tank vs. the cold one was due to the material used in each tank (carbon steel in the cold tank and stainless steel in the hot one).
This trend is also seen in
Figure 16, when the climate change indicator was used. Nevertheless, it is worth mentioning that the impact of the salts when using this indicator and for both plants was lower than when using the ReCiPe indicator (
Figure 15). This indicates that the ReCiPe indicator attributes more impact to the use of nitrate salts than the climate change indicator.
Therefore, since the environmental impact generated by the TES & HTF systems was mainly provided by the mixture of nitrate salts, the impact of the salt nitrates was studied in depth. The literature shows that their environmental impact could be different if synthetic molten salts or mined salts are considered [
7,
8].
The composition of the nitrate mixture used in CSP plants and considered in this study was that of the so-called solar salt, KNO
3 (40wt.%)-NaNO
3 (60wt.%) [
20], found in the Ecoinvent database. This option considered nitrates coming from mines.
Nevertheless, this database includes other options for sodium and potassium nitrate individually (
Table 4), where nitrates coming from mines or synthetized by chemical reaction can be found. Therefore, to evaluate if the impact of the nitrate salts in the LCA of the CSP plant varies when the type of salt changes, a more in-depth study of the impact of the different options was performed. Since the molten salts are a mixture of two different components, the options available in Ecoinvent were paired and the contribution of the TES and HTF systems in the overall impact was calculated (
Figure 17).
Table 5 shows the selection of pairs of salts used for the molten salts impact sensitivity study. This pairing was performed to ensure that both sodium and potassium nitrate considered in the same pair had the same market/production process and the same location consideration (global—[GLO] or [RoW], or local—[RER] or [CL]).
Figure 17 shows the ReCiPe impact for each kg of salt mixture, as per
Table 5. It should be highlighted that the first mixture shown considered exactly the same nitrate salts as the solar salt found in Ecoinvent; therefore, the impact with this combination was the same in both options. Results also show that considering global market [GLO] or local market [CL] did not show differences. The mixture with lower impact was not representative, since the sodium nitrate included had a very low purity and it is generally not sold in the market. Finally,
Figure 17 shows clearly that when nitrates coming from mines were considered, the impact was 20% lower than when synthetic products were used.
4. Discussion
This study shows that for the two indicators considered, ReCiPe and GW20a (IPCC2013), the CSP with storage generated less impact than the CSP without storage. The impacts of the operational phase determined the difference in terms of the impacts generated in the two plant types. In a plant that is operating 24/7 (with storage), the need to use electricity from the grid is very low [
20], while a plant that only works 8 h a day (without storage) needs electricity from the grid every day for its start-up and consumption of auxiliaries. Ko et al. [
17] carried out a LCA of a CSP tower plant with smaller net capacity (101 MW) and TES capacity (3450 MWhth), but without comparing it to a plant without storage. The impact obtained by Ko et al. was 24.3 g CO
2 eq/kWh, higher than the one obtained in this study (9.8 g CO
2 eq/kWh); this difference could be attributed to the high number of start-ups of the CSP plant. In summer, the plant analyzed by Ko et al. collects and stores enough solar energy to operate 24/7, but this strategy cannot be maintained during the whole year, while, as said before, the CSP plant with storage analyzed in this paper guarantees 24/7 nearly all year long.
When evaluating the manufacturing and disposal phases, there were no big differences between the two considered plants. The study carried out shows that in a CSP tower plant, the component with highest impact in the environmental analysis was the solar field; and within this system, the metallic structure. The other system with more impact was the TES & HTF, especially in the plant with storage; and within this system, the nitrates molten salts contributed up to 90% to this impact.
Given the high contribution of the nitrate salts and the fact that they can be from mines (which represent at least 60% of the market share used in TES [
7,
8,
21]) or synthetized by chemical reactions, this was evaluated, showing that the salts with lowest impact were those coming from mines (20% lower than when synthetic products were used), even when long transportation was considered. This brings a new view to the selection of the type of salts to use in a CSP plant. Previous studies focused on showing that even though the use of salts from mines can produce more NOx emissions in the plant start-up, mainly due to the contained impurities, this can be overcome with a correct plant start-up process [
22]. This paper shows that the nitrate salts life-cycle should also been considered.
The main limitation of the present study lies in the Ecoinvent database. While most of the materials included in the manufacturing phase are very common, some materials of the receiver system, for example, are very specific and not found in the database. The technical and safety data sheets and the manufacturing processes of these materials have been consulted in order to choose the most similar product from the database. Similarly, there are many types of steel within the subdivision of carbon steel and stainless steel, which surely go through different processes with different impacts, and these alloys contain metals not considered.


