
A Cross-Country Measurement of the EU Bioeconomy: An Input–Output Approach


1
Agricultural Economics and Rural Policy Group, Wageningen University, 6706 KN Wageningen, The Netherlands
2
BioMonitor Project Consultant, 41003 Seville, Spain
3
Department of Economics, Faculty of Economics and Management, Czech University of Life Sciences, 165 00 Prague-Suchdol, Czech Republic
*
Author to whom correspondence should be addressed.
Sustainability 2021, 13(6), 3033; https://doi.org/10.3390/su13063033
Submission received: 19 January 2021
/
Revised: 23 February 2021
/
Accepted: 3 March 2021
/
Published: 10 March 2021
(This article belongs to the Special Issue Accelerating Bioeconomy Growth through Applied Research and Policy Change)
Abstract
:This paper measures the development of the national income share of the bioeconomy for 28 European Union Member States (MS) and 16 industries of BioMonitor scope from 2005 to 2015. The paper proposes a model which includes the up- and downstream linkages using Input-Output tables. The results show that for the majority of the MS the value added of the up- and downstream sector is at the band of 40%–50% of the total bioeconomy value added and has on average increased since the financial crisis.
JEL Classification Numbers:
Q1; Q57; R151. Introduction
Bioeconomy research is getting more and more attention from academics, policy makers and other stakeholders. One driving force is the need to substitute the use of fossil fuels to reduce the emission of greenhouse gases. European Commission’s strategy “Innovating for sustainable growth: A bioeconomy for Europe” [1] shows the EU’s preference for the bioeconomy. Former president Juncker stated that the bioeconomy is central for: a new boost for jobs, growth and investment a resilient energy union with a forward-looking climate change policy, and a deeper and fairer internal market with a strengthened industrial base [2]. The importance has been reemphasized in the updated Bioeconomy strategy report, the European Green Deal strategy aiming at carbon neutrality and a healthy environment in the EU by 2050, and the announcement of the new circular economy action plan, all with the overall goal of sustainable development [3].
Technical change is an important part of achieving the objectives of the strategies mentioned. Acemoglu et al. (2016) [4], provides an endogenous growth model with competing clean and dirty technologies. Their analysis shows that a small technological change can have substantial implication on economic growth. They point out the importance of policies like taxes and subsidies for economic growth, and how these policies shape and effect technological change. Purnhagen and Wesseler (2019, 2020) [5,6] show the strong marginal impact regulations can have on the incentives to invest and hence on the development of the bioeconomy and sustainability. Henceforth, it is not obvious that simple announcement of strategies will provide the expected results nor related well intended policies. Whether or not objectives have been or will be reached requires information about measurable indicators linked with the objectives [3].
Until now, methodologies measuring the contribution of bioeconomy towards sustainable development are under development and discussed [7]. In this contribution we focus on a consistent methodology for assessing the value added of the bioeconomy. Jorgenson (2018) [8] provides a comprehensive literature review on current developments on the measurement of production and welfare within national statistics. He points out that one of the important advances in economic measurement in production is value added by industry. From this measure a number of additional measures can be derived. While this methodology has been well established for national accounting and related sub-sectors, deriving the value added of the bioeconomy is complicated by the fact that this includes several sectors and sub-sectors and some of them only partially [3].
The objective of this study is to provide a cross-country measure of the value added of the bioeconomy for EU 28 member states (MS). We propose an extended approach of Heijman [9], which measures the share of the bioeconomy in the Netherlands using input–output tables resulting in 6.6–7.2% of GDP between 2008 to 2012, respectively. His analysis consists of breaking down the economy into two main sectors which are agriculture, forestry, fishery, aquaculture and veterinary services (S1), and the rest (S2). In addition to S1, as part of the bioeconomy, Heijman [9], measures the downstream effect which he defines as the value added generated by the output flow from S1 to S2. He named this value added as the biobusiness which is the part of the bioeconomy excluding S1.
The novelty of our approach is four-fold:
- We extend Heijman [9], bioeconomy definition by including the upstream effect which we define as part of the value added of the output flow from partly bioeconomic industries to fully bioeconomic.
- We calculate each industry’s’ (defined by the International Standard Industrial Classification of All Economic Activities (ISIC), Revision 4) bioeconomy value added shares.
- Following the BioMonitor project scope [3], we include the relevant industries of the economy following the EU sectorial definition of the bioeconomy. This enables us to have a robust measurement of the value-added shares of the bioeconomy.
- We apply the approach on data from 28 EU member countries from year 2005 to 2015 for a cross country measurement, a method that can be implemented on any Input—Output table with certain adjustments on industry definitions. This approach provides a universal measurement method which is lacking in the literature.
The results are presented using maps of the EU member states with different shades. This allows readers for getting a quick overview about similarities and differences among EU member states. One important result is that the development of the value added in the up-and downstream sector on average shows a positive development that kicked-in after the financial crisis.
The remaining of the paper is organized as follows. The next section, Section 4, provides an overview about the approaches used for measuring the bioeconomy with a focus on the European Union. In Materials and Methods, Section 3, we provide the conceptual framework and the data explanation. Results, Section 4, presents the measurement results of the bioeconomy for the EU countries considered in the study. Section 5 discusses the results, shortcomings of the study and possible extensions.
2. Approaches Used for Measuring the Bioeconomy
There are several studies which focus on the measurement of the bioeconomy at country level. Harthoorn [10] designs a model to calculate the inter industry trade in agribusiness from an input–output table. This analysis is based on Schumann [11]. Harthoorn considers the agribusiness sector which consists in his analysis of the industries in agriculture, the industries that process agricultural products in the first stage and that are dependent on the production in agriculture, and the part of industries that deliver inputs directly or indirectly to agriculture and the processing industries. This model expands the idea of the Leontief inverse and provides a method to eliminate double counted flows. Peerlings [12], provides a general equilibrium model for Dutch agribusiness policy analysis. He analysis the effects on domestic industry transactions. Factor demand, income, and trade are of interest. Carlson [13] combines several sources and concludes that in the US total domestic revenue shares generated by the different subsectors belonging to the field of biotechnology, which are identified by three subsectors: biologics (biotech drugs), GM crops and industrial biotech, in 2012 is around 2% (USD 324 billion) of the national income. The biotechnology subsectors and their absolute shares are: biologics (drugs) with USD 91 billion; crops, seeds with USD 128 billion; and industrial products (biofuels, enzymes, biomaterials and biochemicals) with >USD 105 billion. He shows that the aggregate revenues have grown much faster than the economy as a whole. Efken et al. [14] use surveys on material and goods received (MGR) by companies (SBA 2009). They measure that the bioeconomy share (excluding the agriculture input sector) on Germany’s national income is 7.6%. The indicators they use for measuring the development of the bioeconomy include the number of companies, employment, turnover and gross value added. Golden et al. [15] calculate a bioeconomy share (excluding the energy, livestock, food, feed, and pharmaceutical sectors and subsectors) of the US national income of 2.2%. They provide an extensive economic model by using the IMPLAN software which is developed by the US Forest Service in order to analyze and trace US economy spending and to measure the effects of that spending. Nowicki et al. [16] measure the turnover of the value of biobased materials in the EU25, excluding food and feed, based on PRODCOM (The term originates from the French “PRODuction COMmunautaire” (Community Production). Prodcom covers mining, quarrying and manufacturing: sections B and C of the Statistical Classification of Economy Activity in the European Union (NACE 2, https://ec.europa.eu/eurostat/web/prodcom (accessed on 22 December 2020), 780 products within the listing) which represents the potential biobased production. They concluded that NL is producing a larger proportional share of EU-25 biobased output. They also show that the total bio-based production value for EU25 is EUR 453 billion. According to their classification the bio-based industry consists of industries using biomass separated into materials, substances and biomass fragmented to building blocks. Ronzon et al. [17] estimate the turnover, value added and employment of the EU28 bioeconomy (Pre-Brexit member states, EU27 and UK) by combining data from EUROSTAT with sector shares of biobased products derived from industry surveys for the period 2008–2017. The bioeconomy definition they use includes industries of agriculture, forestry, fisheries, food, pulp and paper production, parts of chemical, biotechnological and energy, and manufacturing of bio-based textiles. In 2007, food, beverages and tobacco provide 37% and agriculture provide 30% of the total value added. 52% of the bioeconomic employment is in the agricultural sector and 26% percent food, beverages and tobacco. In complement to these estimates, Guirra et al. [18] calculate that 46% of the EU biomass quantity consumed is used for food and animal feed, 17% for bioenergy and 17% for bio-material. The rest corresponds to losses and non-reported biomass uses. Rosegrant et al. [19], use the International Model for Policy Analysis of Agricultural Commodities and Trade (IMPACT) which combines partial equilibrium multi commodity, country and Global Trade and Environmental Models. They focus on the interlinkage between water (including trend of water scarcity, bioeconomy or non-bioeconomy related) and the bioeconomy, and how this link affects the growth of the bioeconomy. They analyze both, the effects of production of biofuel on water quantity and quality, and provide an examination of potential improvements for water quantity and quality via crop biotechnology and management. For this, they define a bioeconomy scenario which assumes a state of the world in the direction of more sustainable growth in the bioeconomy. One of the assumptions is the improved productivity in agriculture and water sectors. They show that the bioeconomy contribution to food production is 11% for meat, 10% for cereals, and to GDP growth an increase from 3.2% to 3.6% by 2050. Vandermeulen et al. [20] calculate the importance of the Flemish bioeconomy by using industry surveys with a focus on biobased energy and biobased products. They show that the value added of the biobased sector is 1.8% of the total GDP. Kuosmanen et al. [21] combine different approaches to measure the size of the bioeconomy. They estimate that the EU28 bioeconomy value added in 2015 reaches EUR 1460.6 billion. That is 11% of the GDP. Table 1 provides an overview of the Bioeconomy measurement literature and measurement methodologies applied in these papers. They are similar to ours.
The more recent literature also shows an increasing focus on bioeconomy policies. Wesseler and von Braun [22] provide a review on measuring the bioeconomy by showing the methodological challenges of measurement, the approaches employed and the outcomes reported. They provide an outline of current innovations in data storage and analytical methods that would help to realize opportunities the bioeconomy offers and the relevance of supporting policies. They stress the importance of looking beyond the traditional agriculture, fishery, forestry, and food sector and that measuring the bioeconomy following a sectorial approach can provide in combination with environmental information important information but that monitoring the institutional environment including policies and policy strategies is as important as well. The European Commission (EC) established a Knowledge Centre for Bioeconomy (KCB) to support policy making hosted by the Joint Research Centre (JRC) of the European Commission. The KCB initiated a broad stakeholder consultation process for developing a framework to monitor the EU bioeconomy. The challenge of developing a monitoring framework has been illustrated in a recent publication by Robert et al. [23].
McCormick and Kautto [24] provide an overview of the policy framework and conceptual perspective of the bioeconomy in Europe. They point out that the definition of the bioeconomy is evolving and changing depending on the actors. Staffas et al. [25] focus on a comparative statistic of national bioeconomy strategies and policies in EU, Canada and USA. They point out that across countries analyses on unemployment and investment effects are widely covered but that there is not enough emphasis on sustainability and resource use. Schmid et al. [26] state that the scope of the EU innovation policy framework for the bioeconomy should be broader and extend its focus on industry and global competitiveness to sustainable use of resources. Scarlat et al. [27] provide a review of the EU bioeconomy policies for energy and climate, agriculture and forestry, industry and research. Kardung et al. [3] analyze the scope of the bioeconomy with respect to time, sectors and products, geographical coverage and resolution including drivers and outcomes. They also provide a set of indicators connected to the objectives of the EU’s bioeconomy strategy as well as a list of sectors and subsectors following the NACE codes (Nomenclature statistique des activités économiques dans la Communauté européenne). The sectors and sub-sectors have been identified developed in collaboration with stakeholders and allows to classify the bioeconomy from a sectorial point of view. The NACE codes are a European Industry-standard classification system similar in function to the International Standard Industrial Classification of All Economic Activities (ISIC) and the North American Industry Classification System (NAICS) for classifying business activities. The statistics following the NACE codes have been used in many studies [3,26] (see also Table 1).
Despite the progress that has been made, the overall challenge still remains. The result of the contribution of the bioeconomy to economic growth depends foremost on what parts of our economy we consider to belong to the bioeconomy. While there exists a general agreement that the agriculture, forestry, and fishery sector as defined by the national accounting systems is part of the bioeconomy, there is less agreement with respect to other sectors. This is based on the argument that the value added of the sector is derived from the conversion of biological resources into intermediate and final products. Many authors also include the food sector as part of the bioeconomy based on the same reasoning (Kardung et al. [3]). Then, it becomes difficult. Many of the other sectors are not only using biological resources or intermediate products from the agriculture, fishery, and forestry sector. Fine chemicals can be derived from fossil fuels or from other biological resources. Fossil fuels also originate from biological resources but the conversion into fossil fuels took thousands of years. This complicates differentiation by what is to be considered derived from biological resources and be part of the bioeconomy.
In the context of this study and following the main stream of literature we use the term biological resources referring to biological resources that are not fossil fuel based. Hence, one approach to differentiate other downstream sectors is by looking at the share of biological resources being used. As those are derived from the agriculture, fishery and forestry sector, the output from that sector, that enters as an input into the other sectors, can be used for calculating the share by relating it to the other inputs used and using the input share for calculating the output share as discussed in more detail below. Similar issues arises with up-stream sectors. The agriculture, fishery, and forestry sector uses a number of inputs such as fertilizer, plant protection agents, and machinery. The approach we apply includes those sectors as well, based on the output they provide as an input to the agriculture, fishery and forestry sector.
There is a debate in the literature about other sectors that are not directly linked via the use of biomass. This includes tourism and education. Those sectors are not included, but can be added if one wishes.
3. Materials and Methods
The Input–Output (IO) approach focuses on measuring the bioeconomy in EU member states in terms of value added. In order to measure the bioeconomy, one needs to calculate the bioeconomy shares of partly bioeconomy industries. For this, we expand the model of Heijman [9], which accounts only for downstream effects. Our approach accounts for both downstream and upstream effects for calculating the shares of the bioeconomy on the value added of the whole economy.
Suppose there are two types of industries; full bioeconomy denoted with index , and the partly bioeconomy with index . Thus, in the model, we only distinguish two industry types and , i.e., an industry is either full bioeconomic or partly bioeconomy. The sector can be further divided as discussed below.
Following the notation of Heijman [9] with adding a time index , and assuming there are n sectors, stands for output of the full bioeconomy industry , stands for inputs to the full bioeconomy industry , stands for inputs from the full bioeconomy industry to the full bioeconomy industry , stands for inputs from the full bioeconomy industry to the partly bioeconomy industry . Note that all value added of the full bioeconomy industry automatically counts to the size of the bioeconomy; it needs no further calculation. In order to measure the value added that counts for the bioeconomy, one needs to calculate the bioeconomy shares of partly bioeconomy industries. For this, we expand the model of Heijman [9] where only the downstream effect is considered, by adding upstream effects to calculate the shares of the bioeconomy in total value added of a country. We also expand to the sector definitions of ISIC Rev. 4 of and focused on 16 industries of the BioMonitor scope, instead of the two (Sector 1 &2) in Heijman [9].
Downstream effect: this is the effect that we see in the direction from full bioeconomy industries such as agriculture, forestry, fishing to other industries such as chemical industries or construction. The magnitude of the effect is calculated by measuring the input flow from full bioeconomy industry to other industries . The percentage of a country’s value added that accounts for bioeconomy can be calculated by two approaches: one, by taking a fixed ratio between inputs and outputs, and using this fixed ratio to calculate the value added of the bioeconomy part of any industry by using the input flow from the fully bioeconomy sector to the specific industry; second by taking the ratio of the bioeconomy inputs to the rest of the inputs of those other industries. For example, the ratio between “the input flow from fully bioeconomy sectors to construction” and “the total inputs of construction.” We first show the fixed ratio approach.
The total input of partly bioeconomy sector equals the summation of all the inputs to the partly bioeconomy sector . Thus, we have the value added of industry at time is
Assuming simple production function with perfectly substitutable inputs, for each partly bioeconomy sector we have
Since we know output and input values from the IO tables for time and sector , the coefficient can be calculated by a simple division of these two values and . This coefficient is the fixed relation between inputs and outputs of each industry since we have perfect substitutability. Note that if is known we can calculate the bioeconomy part of sector . Heijman (2016) [9], used coefficient to calculate the bioeconomy share of value added of sector at time .
We calculate the downstream effect by using the input share approach from fully bio-economy industries to at time which is denoted as . Note that, sector takes inputs from both fully bioeconomy industries domestically and externally via imports. The data we use incorporates imports to the input values, so we do not differentiate the import calculation. Hence, we take the fixed ratio (that we derive from the downstream effect) of bio-economy shares for imports written as the following:
Since we know input values from IO tables for time and any sector, the coefficient can be calculated by a simple division of these two values and . This coefficient, , shows the percentage shares of the total inputs of sector (partly bioeconomy) that are coming from all other fully bioeconomy sectors. Now we show that, using either the alpha or beta coefficient would end up at the same amount of downstream bioeconomy value added part of sector .
Claim (The same claim with a different proof can be found in Kuosmanen et al. [21]): For any time , for any sector , the downstream effect bioeconomy part of sector can be calculated by both and .
Proof:
Assume that for time and partially bioeconomy sector . It is enough to show the following:
Since and for all and , we cancel both sides and multiply by
By definition of , we conclude that
Hence, Equation (4) satisfies. □
Upstream effect: It is the effect that we see in the direction from other industries to fully bioeconomy industries. In order to avoid double counting, we will deduct the downstream value added of partially bioeconomic industry. We do this by multiplying the value added of industry at time by . The magnitude of the effect is calculated by measuring the output flow from other industries to bioeconomy industries as an input. The percentage is the ratio between “the output flow to fully bioeconomy industries” and “the outputs of partly or non-bioeconomy industries”. Note that both nominator and denominator of this ratio is multiplied by to avoid double counting, and they eliminate each other. For example, the percentage is calculated by taking the ratio between “the outputs of construction going into the fully bioeconomy sectors” and “the total output of construction going into all industries plus the final demand plus exports”.
Now, we define the upstream effect for industry at time which is denoted as . Since is actually an output of industry at time , the percentage of output of transferred as an input to , , is also the percentage of value added of that is generated for . Hence, the total upstream effect is equal to the following:
Note that notation represents a fully bioeconomy industry, any industry in an economy, and for industry at time , denotes the final demand, denotes exports. From the perspective of IO tables, we define as the summation of the following items
- Final consumption expenditure of households;
- Final consumption expenditure of non-profit institutions serving households;
- Final consumption expenditure of general government;Gross Fixed Capital Formation;
- Changes in inventories;
- Direct purchases abroad by residents (imports).
The bioeconomy value added is equal to the summation of value added of downstream and upstream effects and the value added of fully bioeconomy industries that is . Finally, by Equations (1) and (6), we can calculate the share of bioeconomy in total value added of a country at time as,
Example, Netherlands 2015: Here, we use OECD data of IO tables [28] of Netherlands 2015 for only two industries: the primary industry S1 (agriculture forestry and fishing) and F (construction industry). The point is to show the input and output flow for the generation of bioeconomic value added, and that there is no case of double counting at the calculations of downstream and upstream effects. First, we provide, Table 2, a deducted version of the IO table of Netherlands 2015 to two industries while keeping value added, total input and output fixed.
Now we can calculate the downstream and upstream effects (all values are in million Euros.)
Assume there are fixed binary ratios between value added, output and input. Now we deduct the calculated downstream effect from the value added of construction which gives us . Then, the upstream calculation is as follows
Data: The data [28] are taken from OECD statistics which are input–output (IO) tables of which we take EU28 member states data from 2005 to 2015. These data show the interrelation between branches of an economy, industry by industry. Note that there is another data set, the World Input Output Database (WIOD) covering the years 2000–2014, which can be used for international comparisons. We choose to use the OECD data set since it is more recent and also easier to manage for our calculations. For real value conversions, the EUROSTAT HICP [29] data is taken with base year 2015. The units are fixed to US Dollars. We use the OECD exchange rate data [30] for currency conversion calculations. Table A1 in the Appendix shows the sectors covered by the OECD and organised according to the ISIC codes and links those codes with the bioeconomy sectors identified in the BioMonitor project [3] according to the NACE codes. Those ISIC sectors that do not have an equivalent NACE Code listed are considered not to be part of the bioeconomy. Still, they are included in the calculations of downstream value-added. Our method allows to select those sectors one is interested in to include or not as part of the bioeconomy. This may differ depending on the research question.
4. Results
Our approach lends itself easily for making cross-country comparisons. For eastern countries like Bulgaria, Romania, Cyprus which have high value-added shares of the primary sector, the bioeconomy value added share is in decline. This is to be expected as the relative share of the agriculture and food sector following Engel’s law declined over time and the bioeconomy outside agriculture, fishery, forestry, and food developed not as in other EU MSs. Many countries show a U-shape such as Croatia, Estonia, Greece, Ireland, Italy, Latvia, Lithuania, Portugal, Slovenia and Spain with an inversion in the slope around the financial crisis.
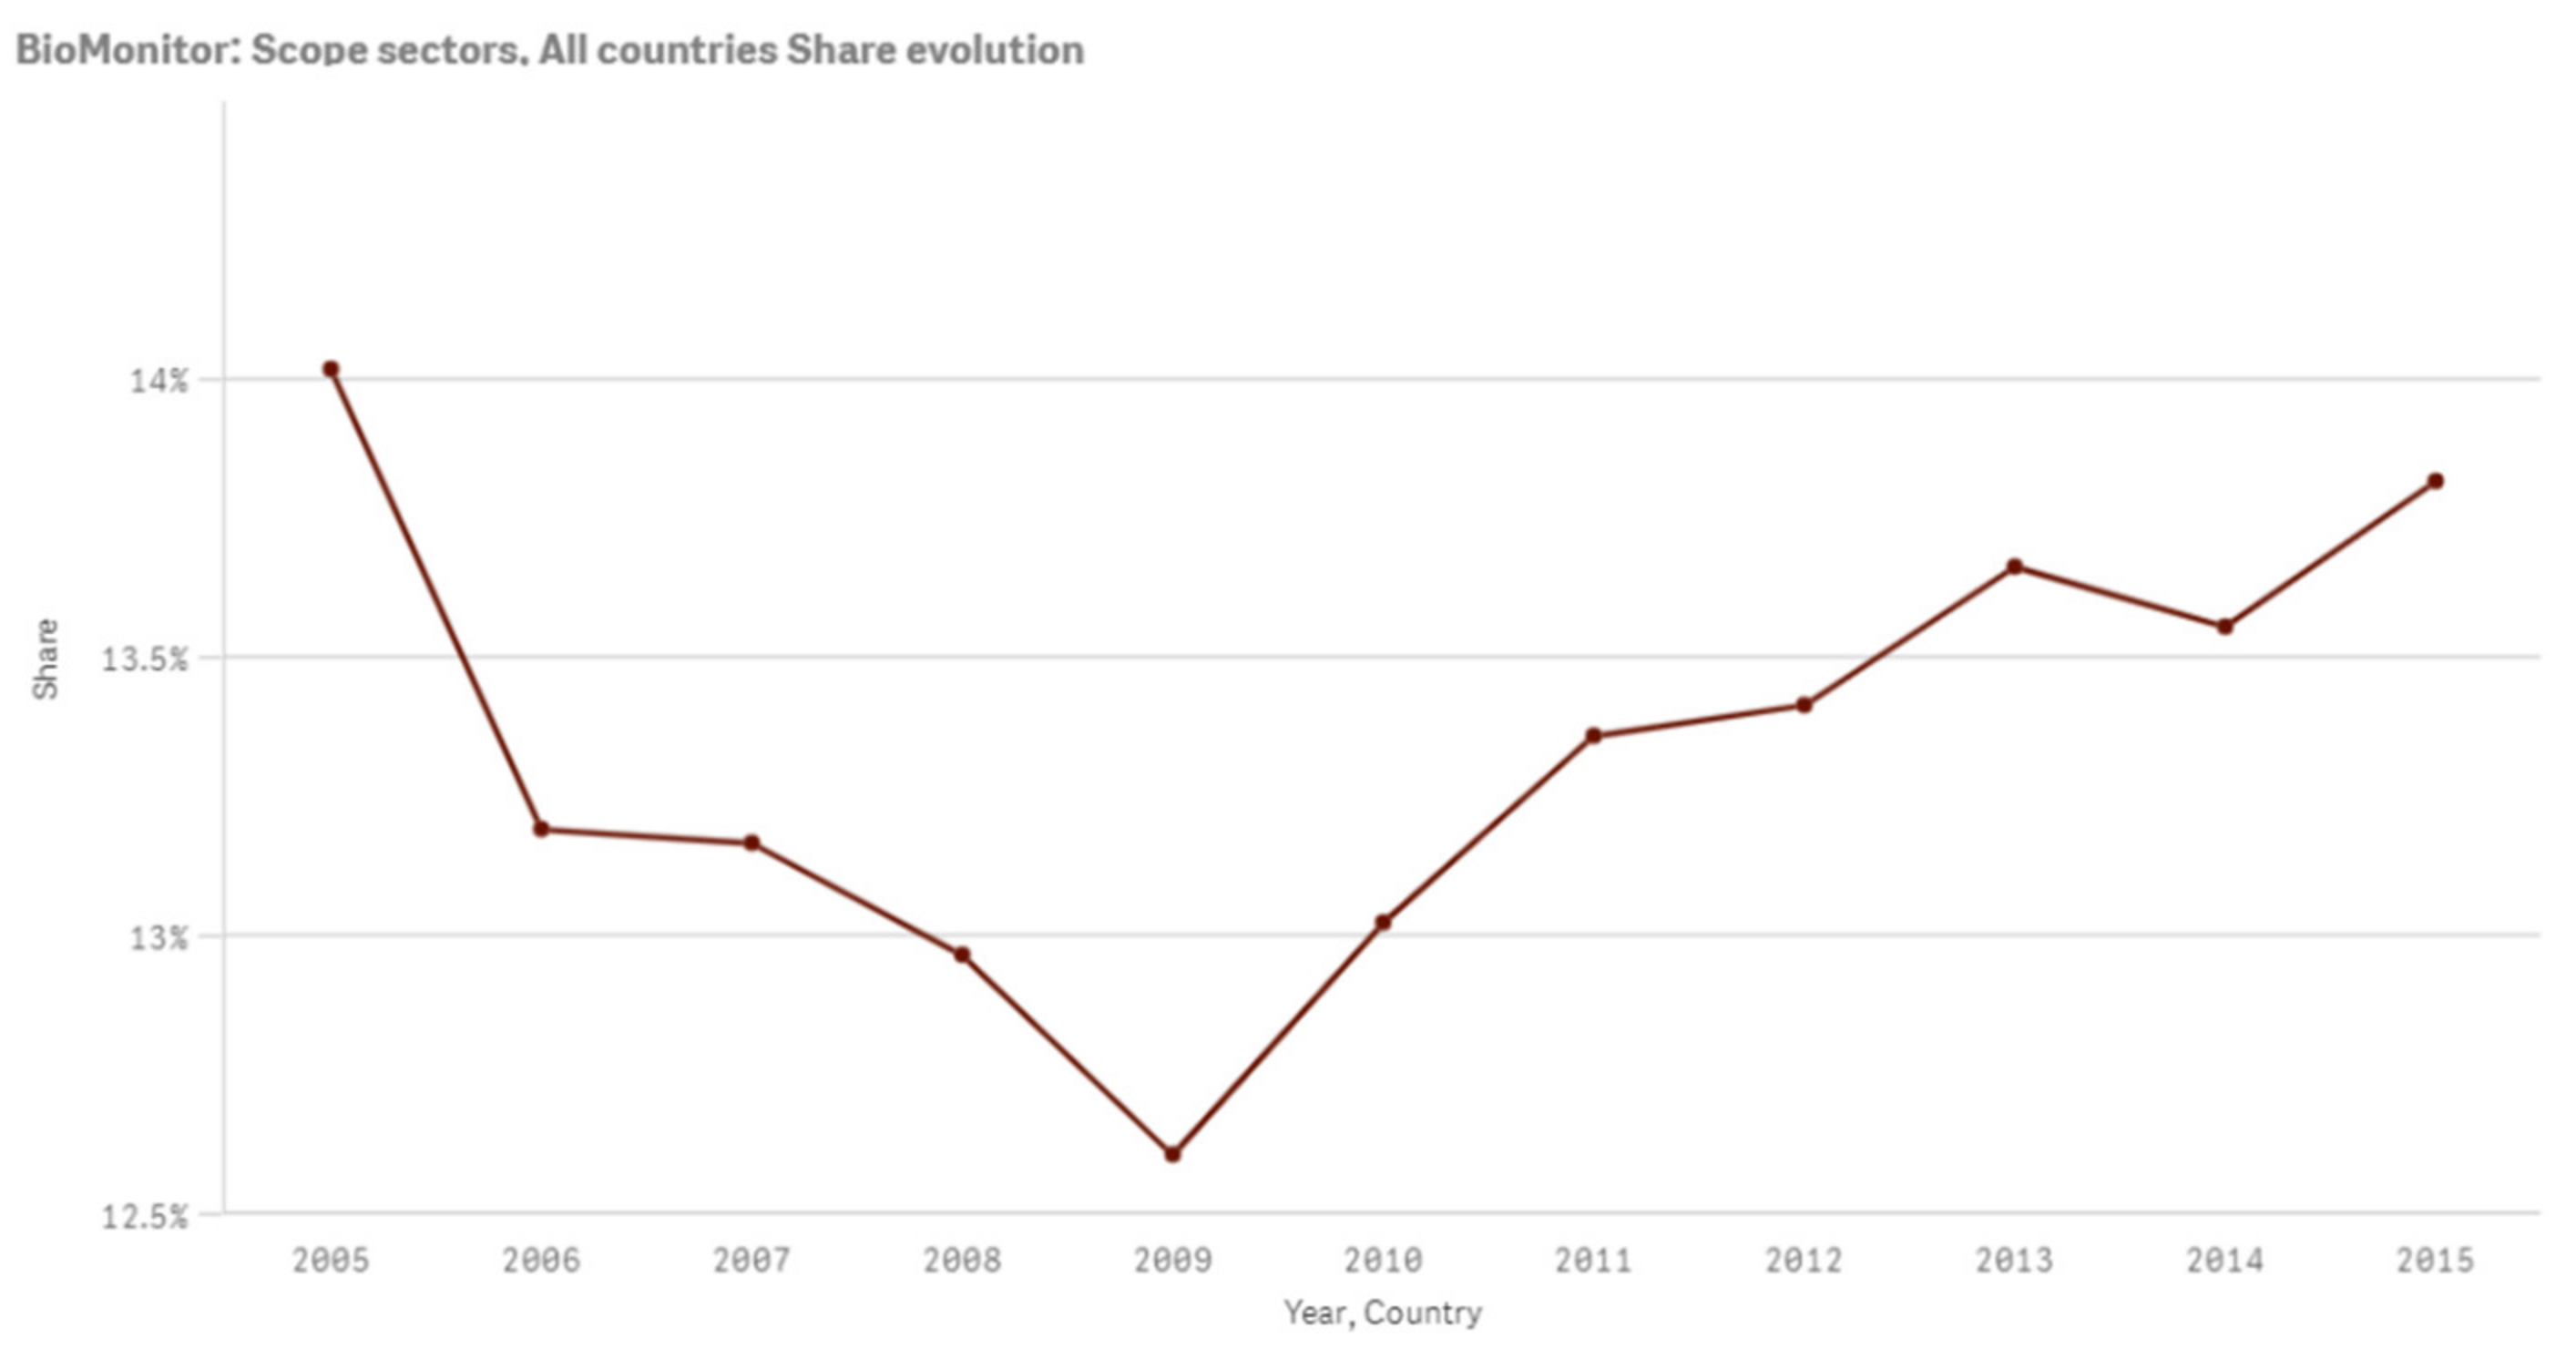
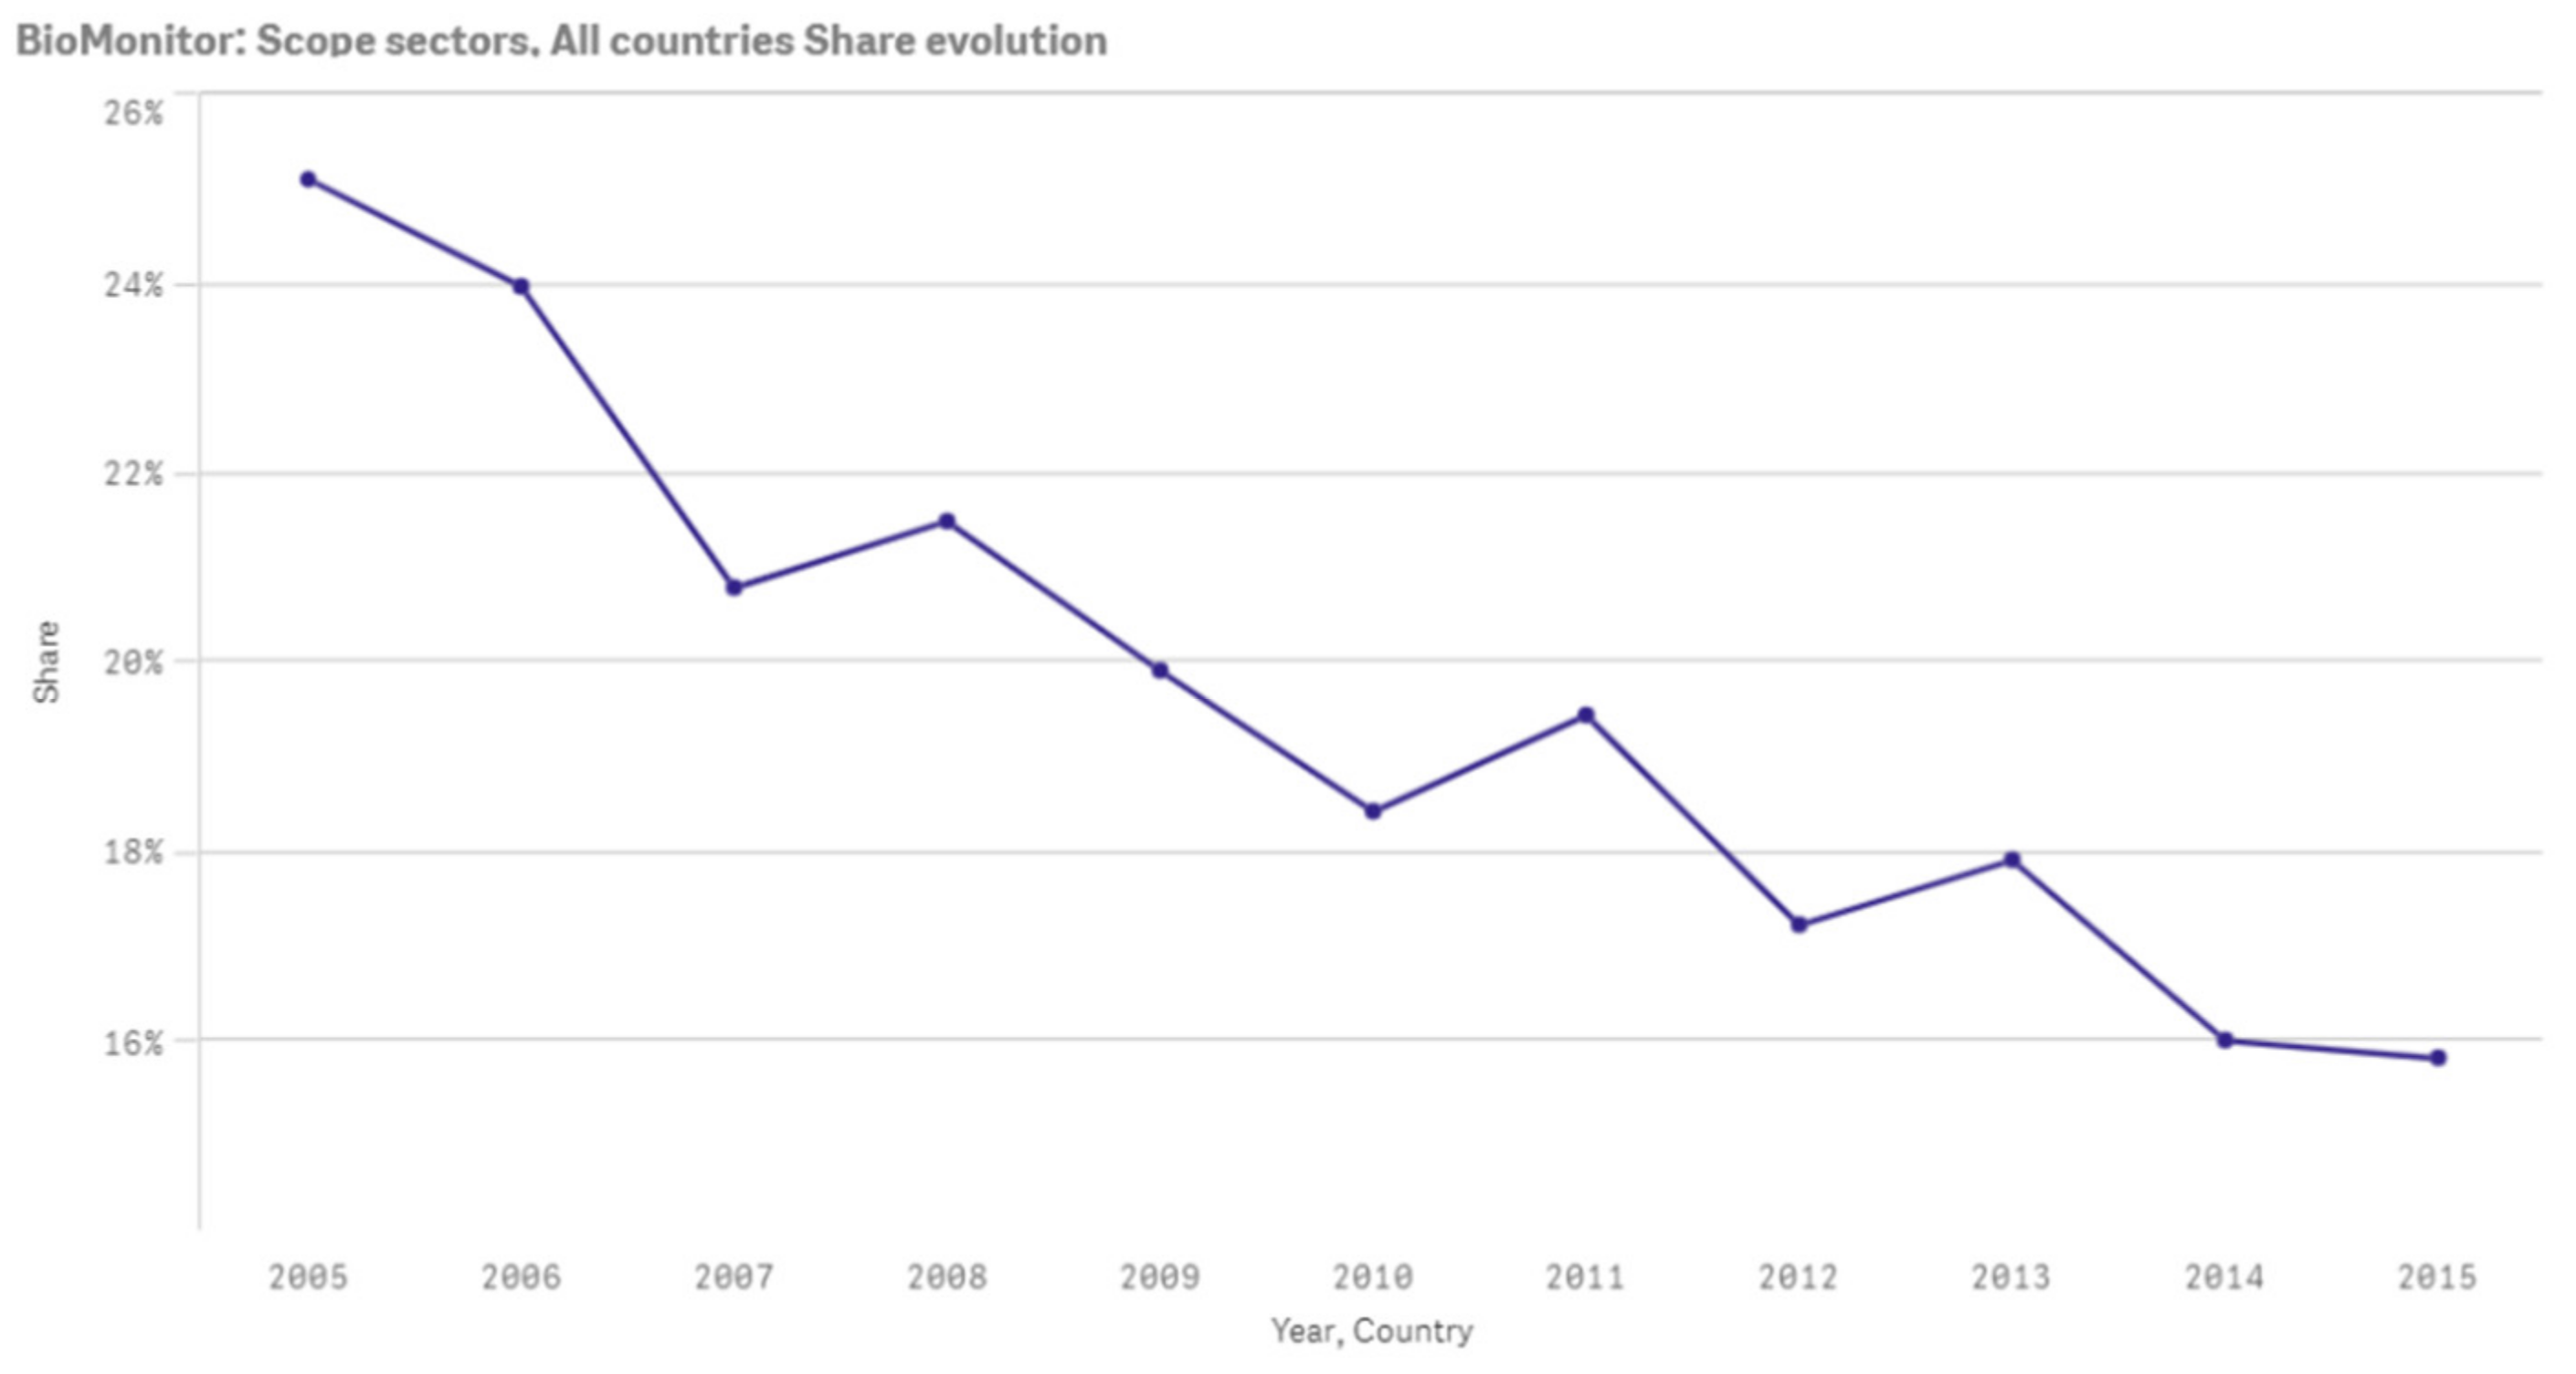
The following two Figure 1 and Figure 2 are two different examples of the curvature of the bioeconomy value added share. Figure 1 represents Spain bioeconomy value added share between 2005 and 2015 which is U-shaped with local minimum at 2009. Figure 2 represents Romania bioeconomy value added share between 2005 and 2015 which is downward sloping.
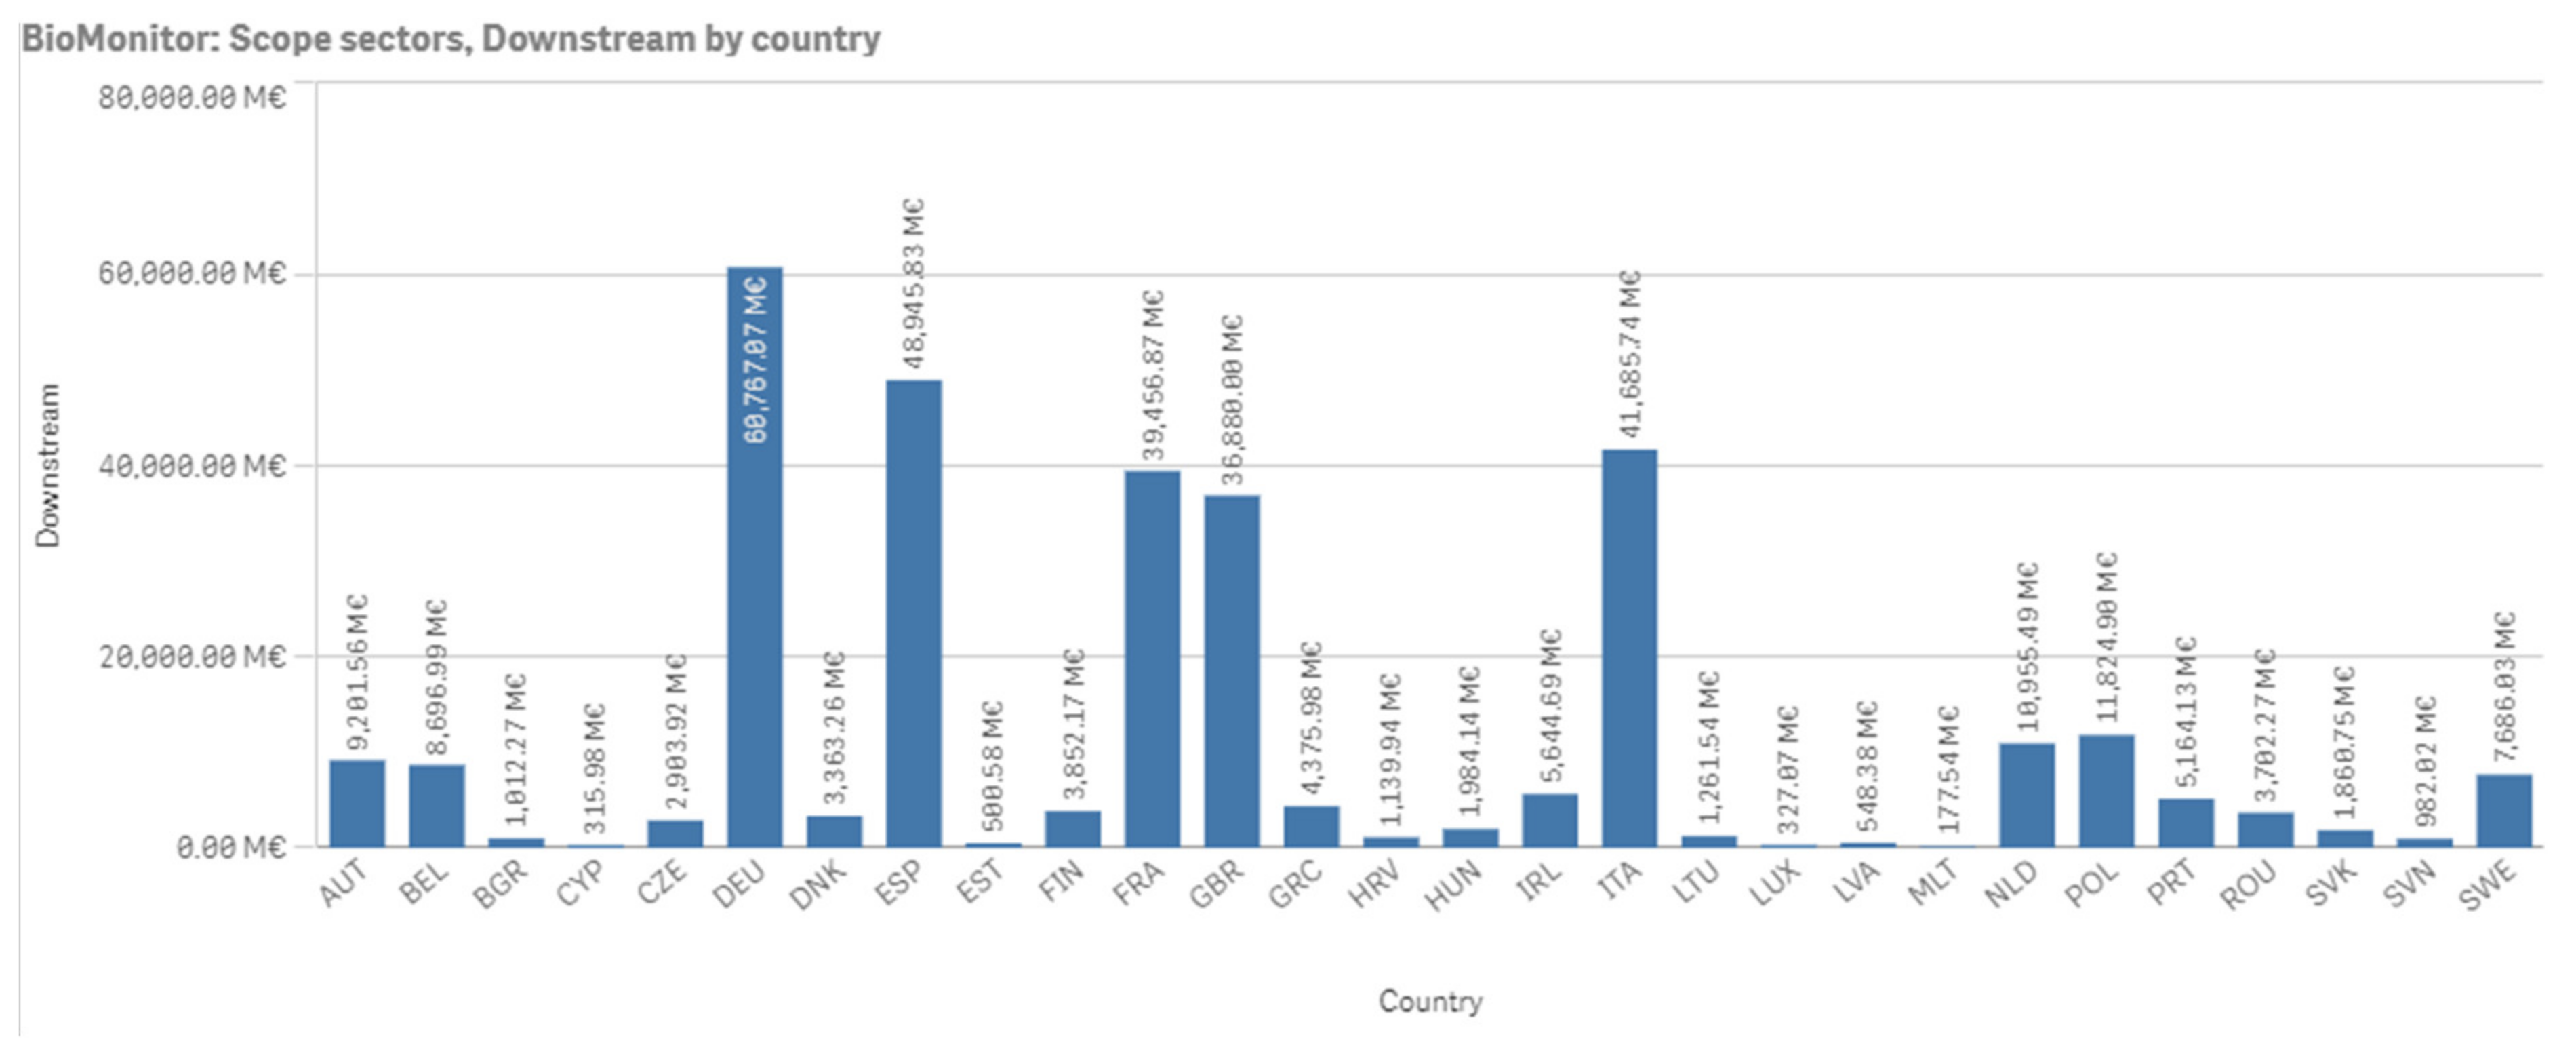
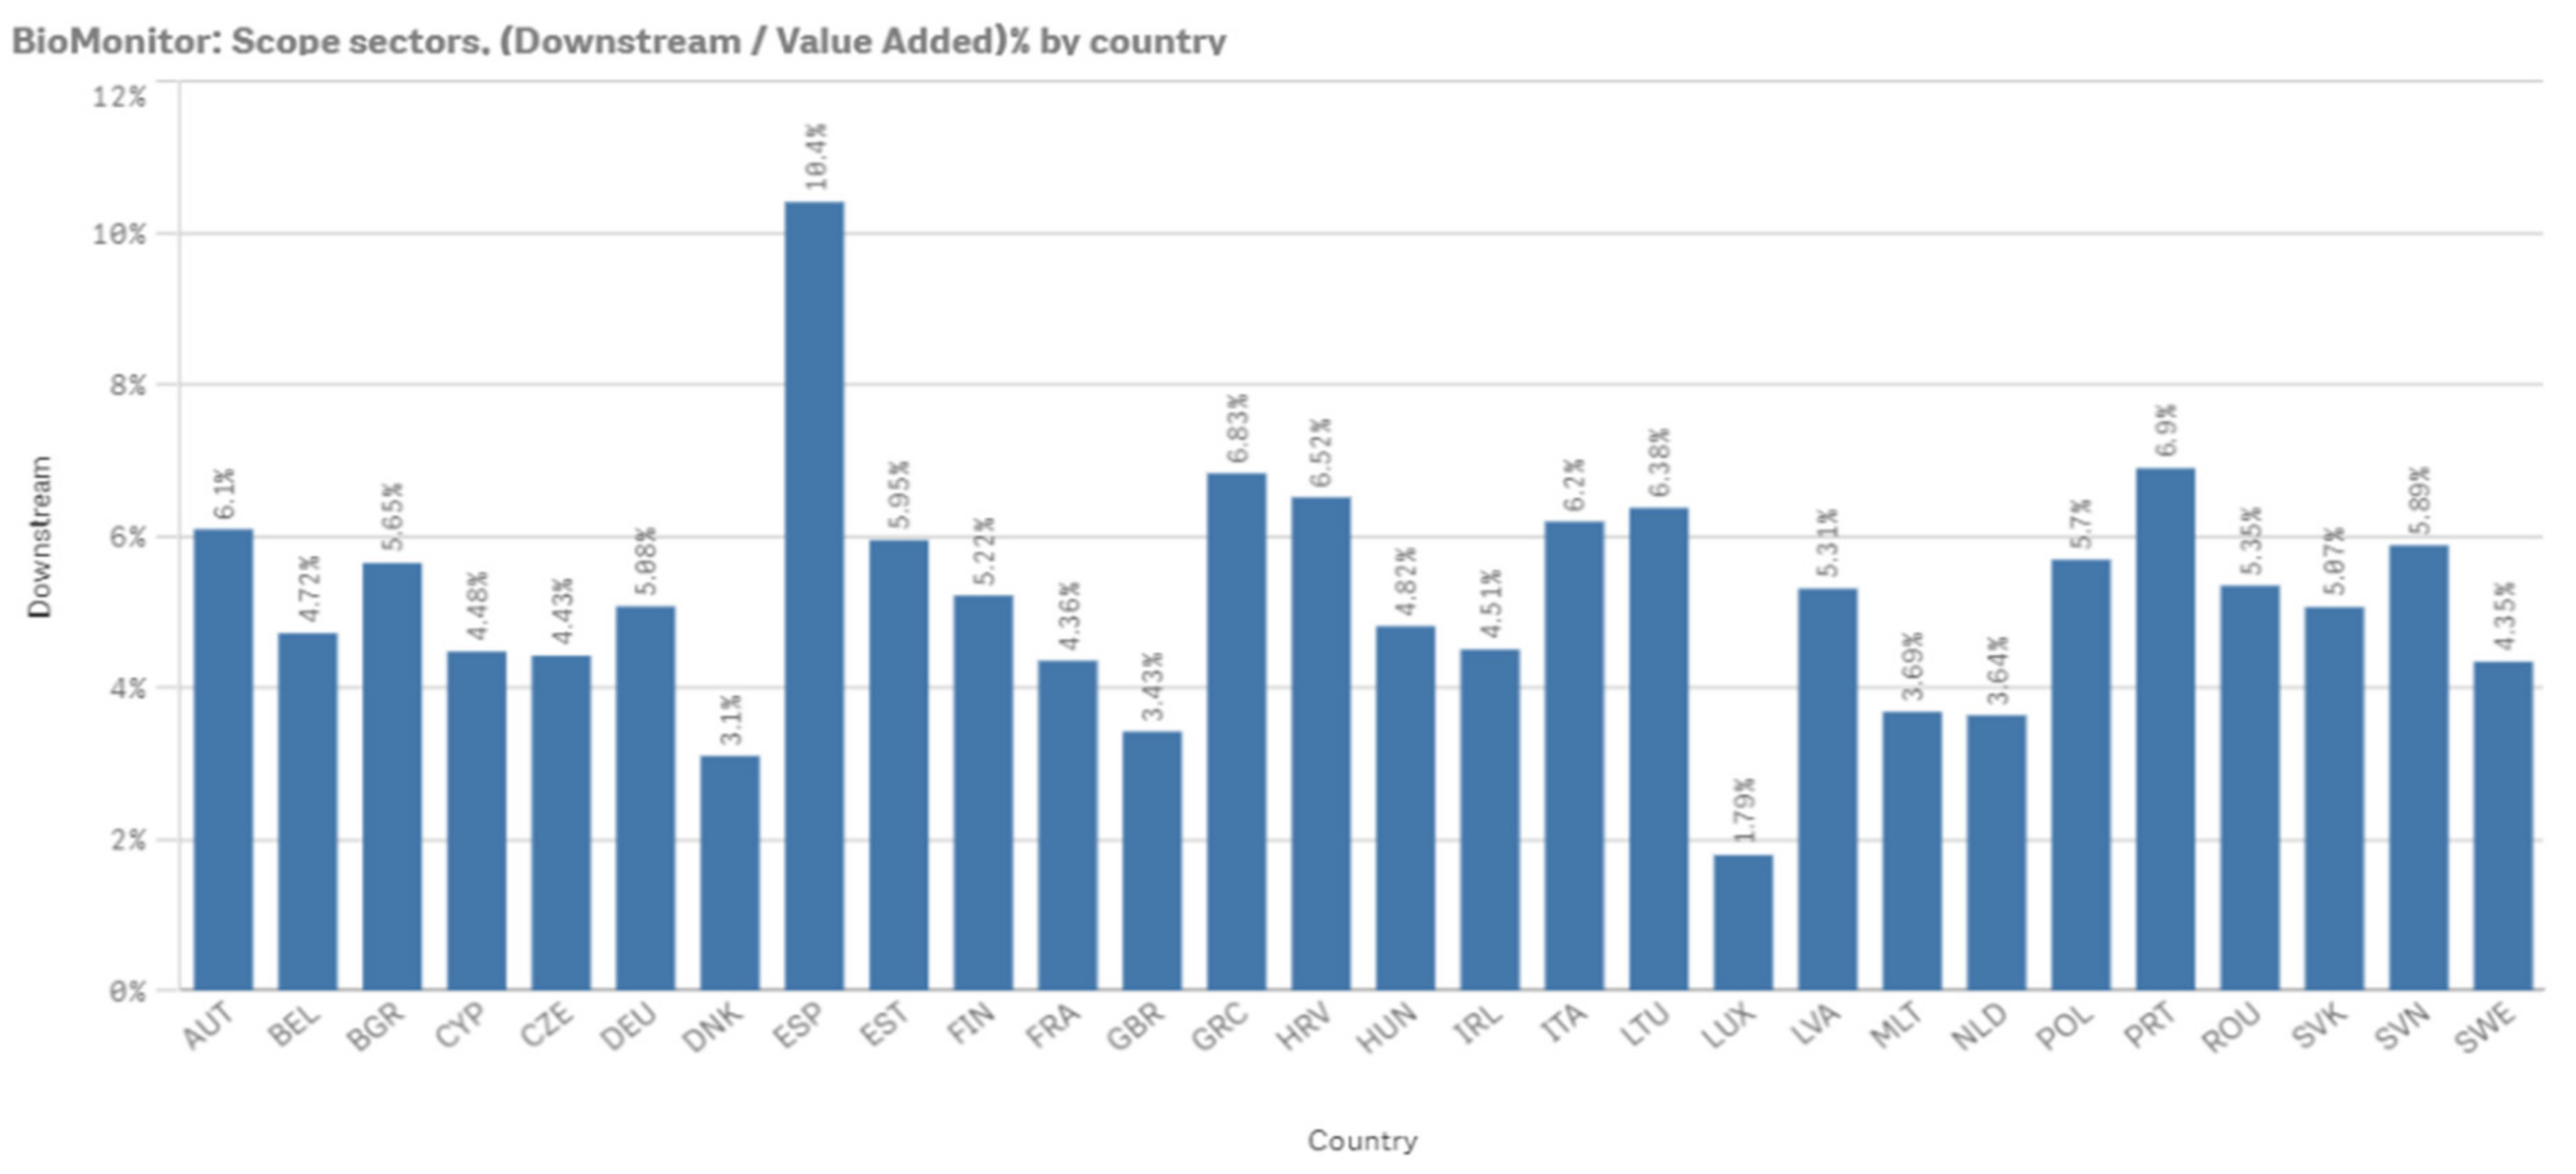
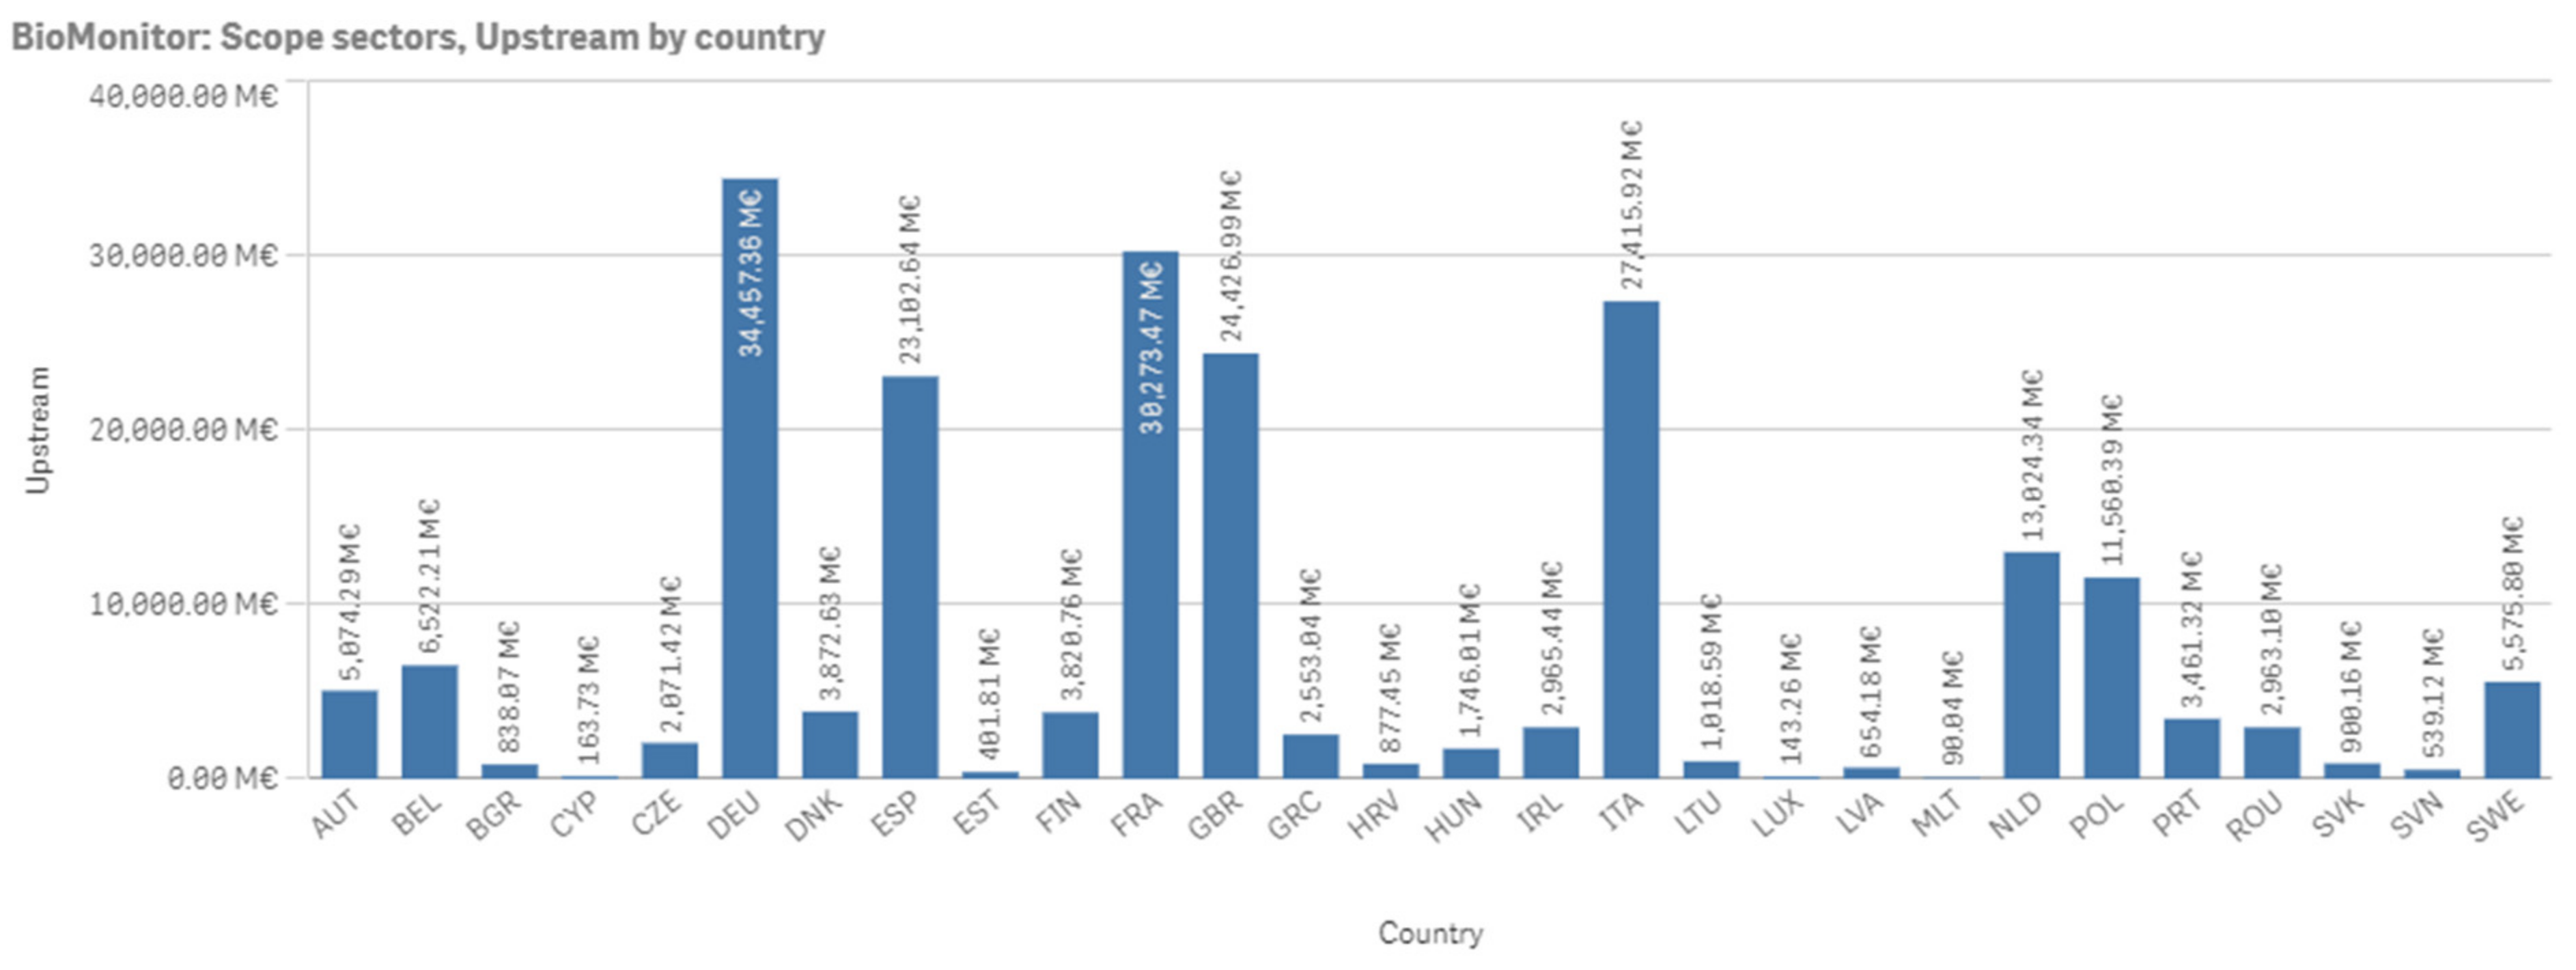
We observe from the results (Figure 3 and Figure 4) that for each EU MS the downstream value added is greater than the upstream value added as expected for the sectors not belonging by 100% to the bioeconomy. For Austria, Belgium, Germany, Spain, France, Luxemburg, Slovenia, Malta the downstream value added is greater than twice the upstream value added. It is clear that these countries possess relatively, much greater industries compared to their 100% bioeconomy industries. However, this idea cannot be generalized. Denmark for example also has relatively much greater industries compared to its 100% bioeconomy industries but upstream value added is greater than downstream value added (Figure 3, Figure 4, Figure 5 and Figure 6). This indicates, the input flow from primary sectors (100% bioeconomy sectors) to partly bioeconomy sectors generates additional value added that contributes to the bioeconomy value added more than the value added generated by the output flow from partly bioeconomy sectors to 100% bioeconomy sectors. Our educated guess is that there seems to be a correlation between primary sector size and downstream, upstream sizes but for establishing causality one needs a much deeper data analysis (which should consider attributes of each country such as geography, history, policies, population structure, and more).
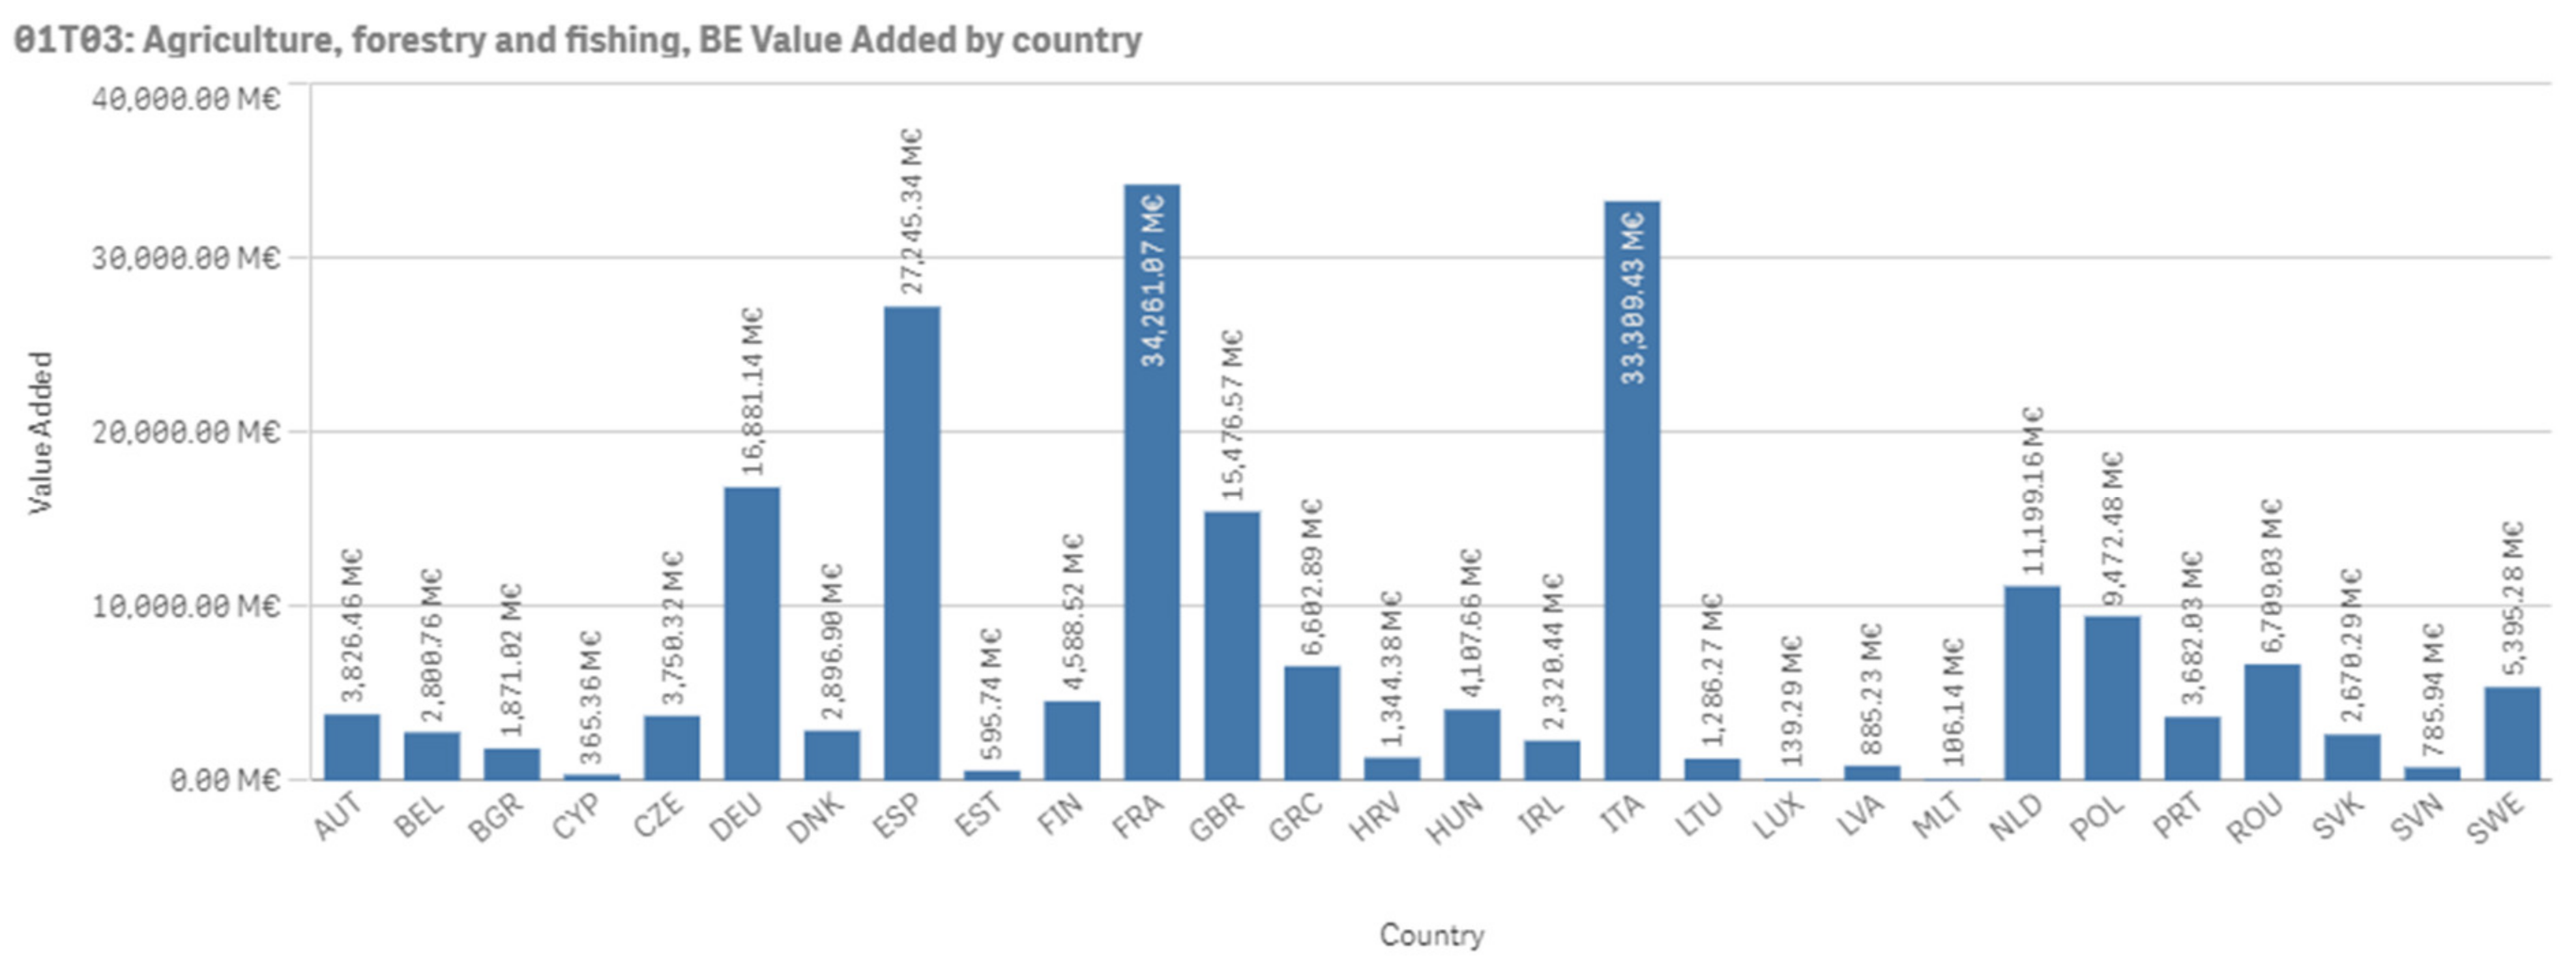
Now we can make a comparison between the sizes of agriculture, forestry and fishing, and downstream, upstream value added based on Figure 3, Figure 4, Figure 5, Figure 6 and Figure 7. If we were to compare downstream and upstream value added to the agriculture, forestry and fishery sector, we observe that for countries Bulgaria, Hungary and Romania agriculture forestry and fishing industry value added is greater than the total of downstream and upstream value added of these countries. This indicates that the biggest contribution to the bioeconomy value added is from primary sectors for these countries. However, we also point out that these countries have an initially high share of the agriculture, forestry, and fishery sector.
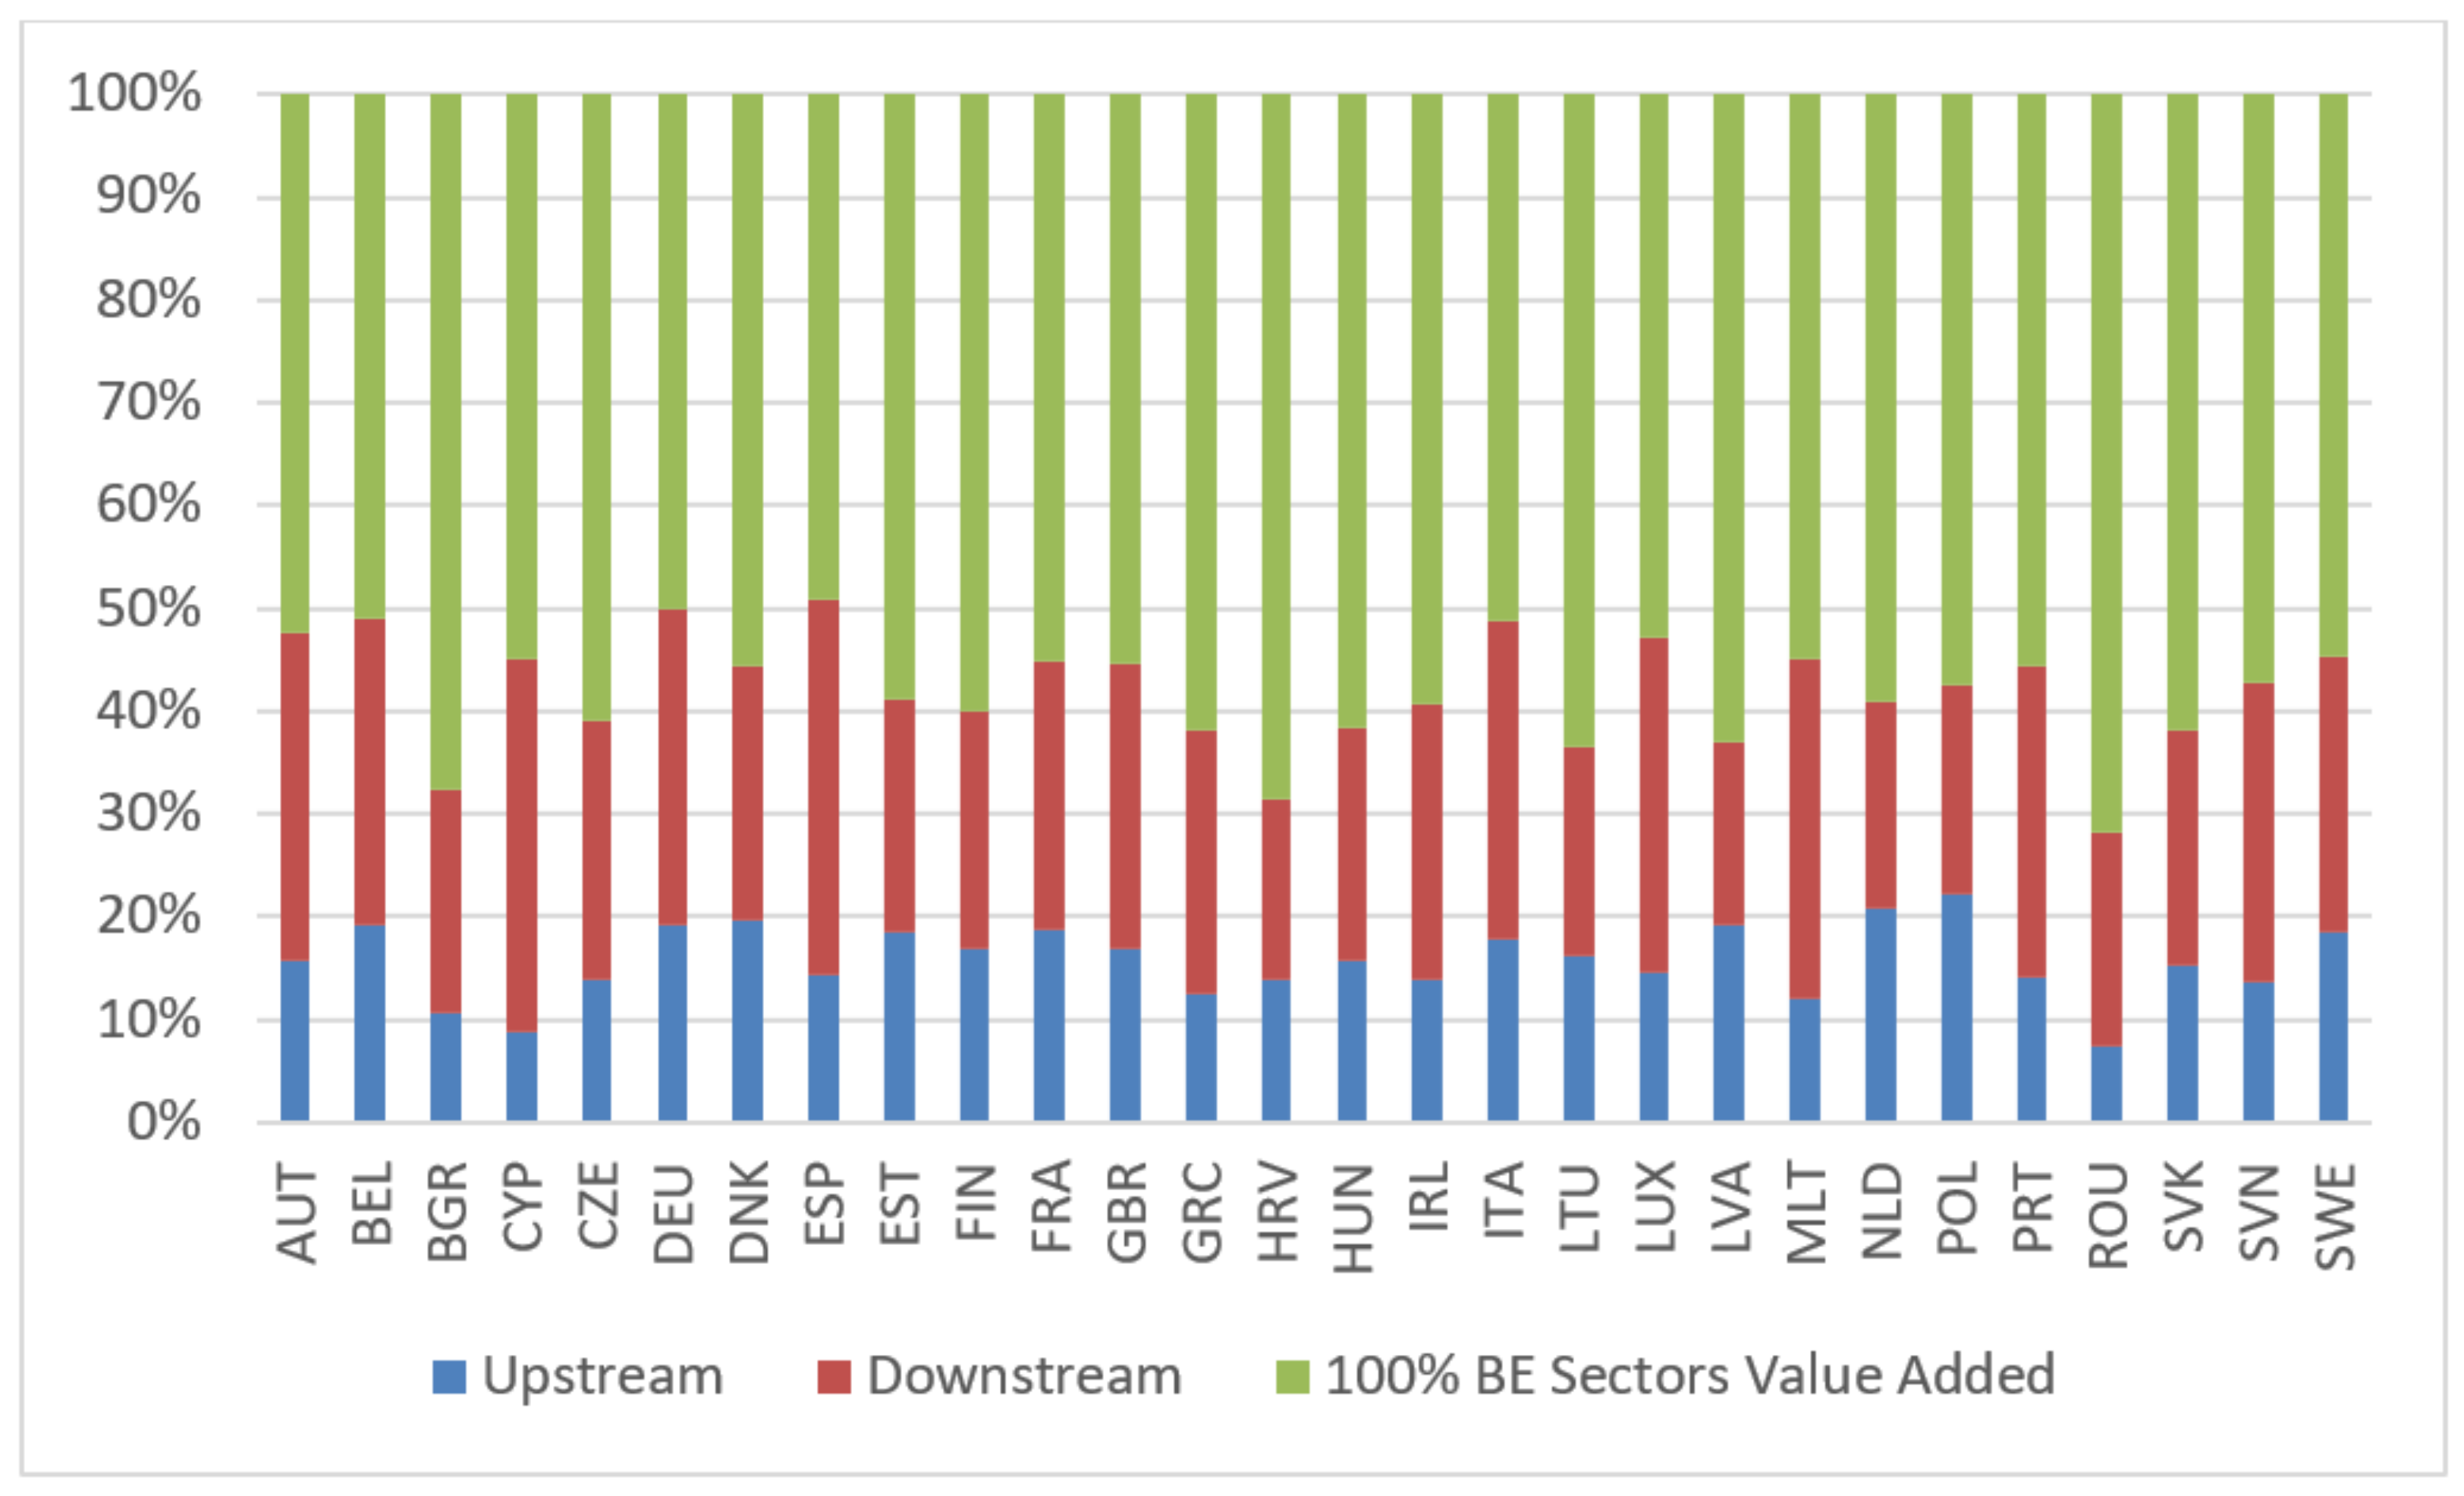
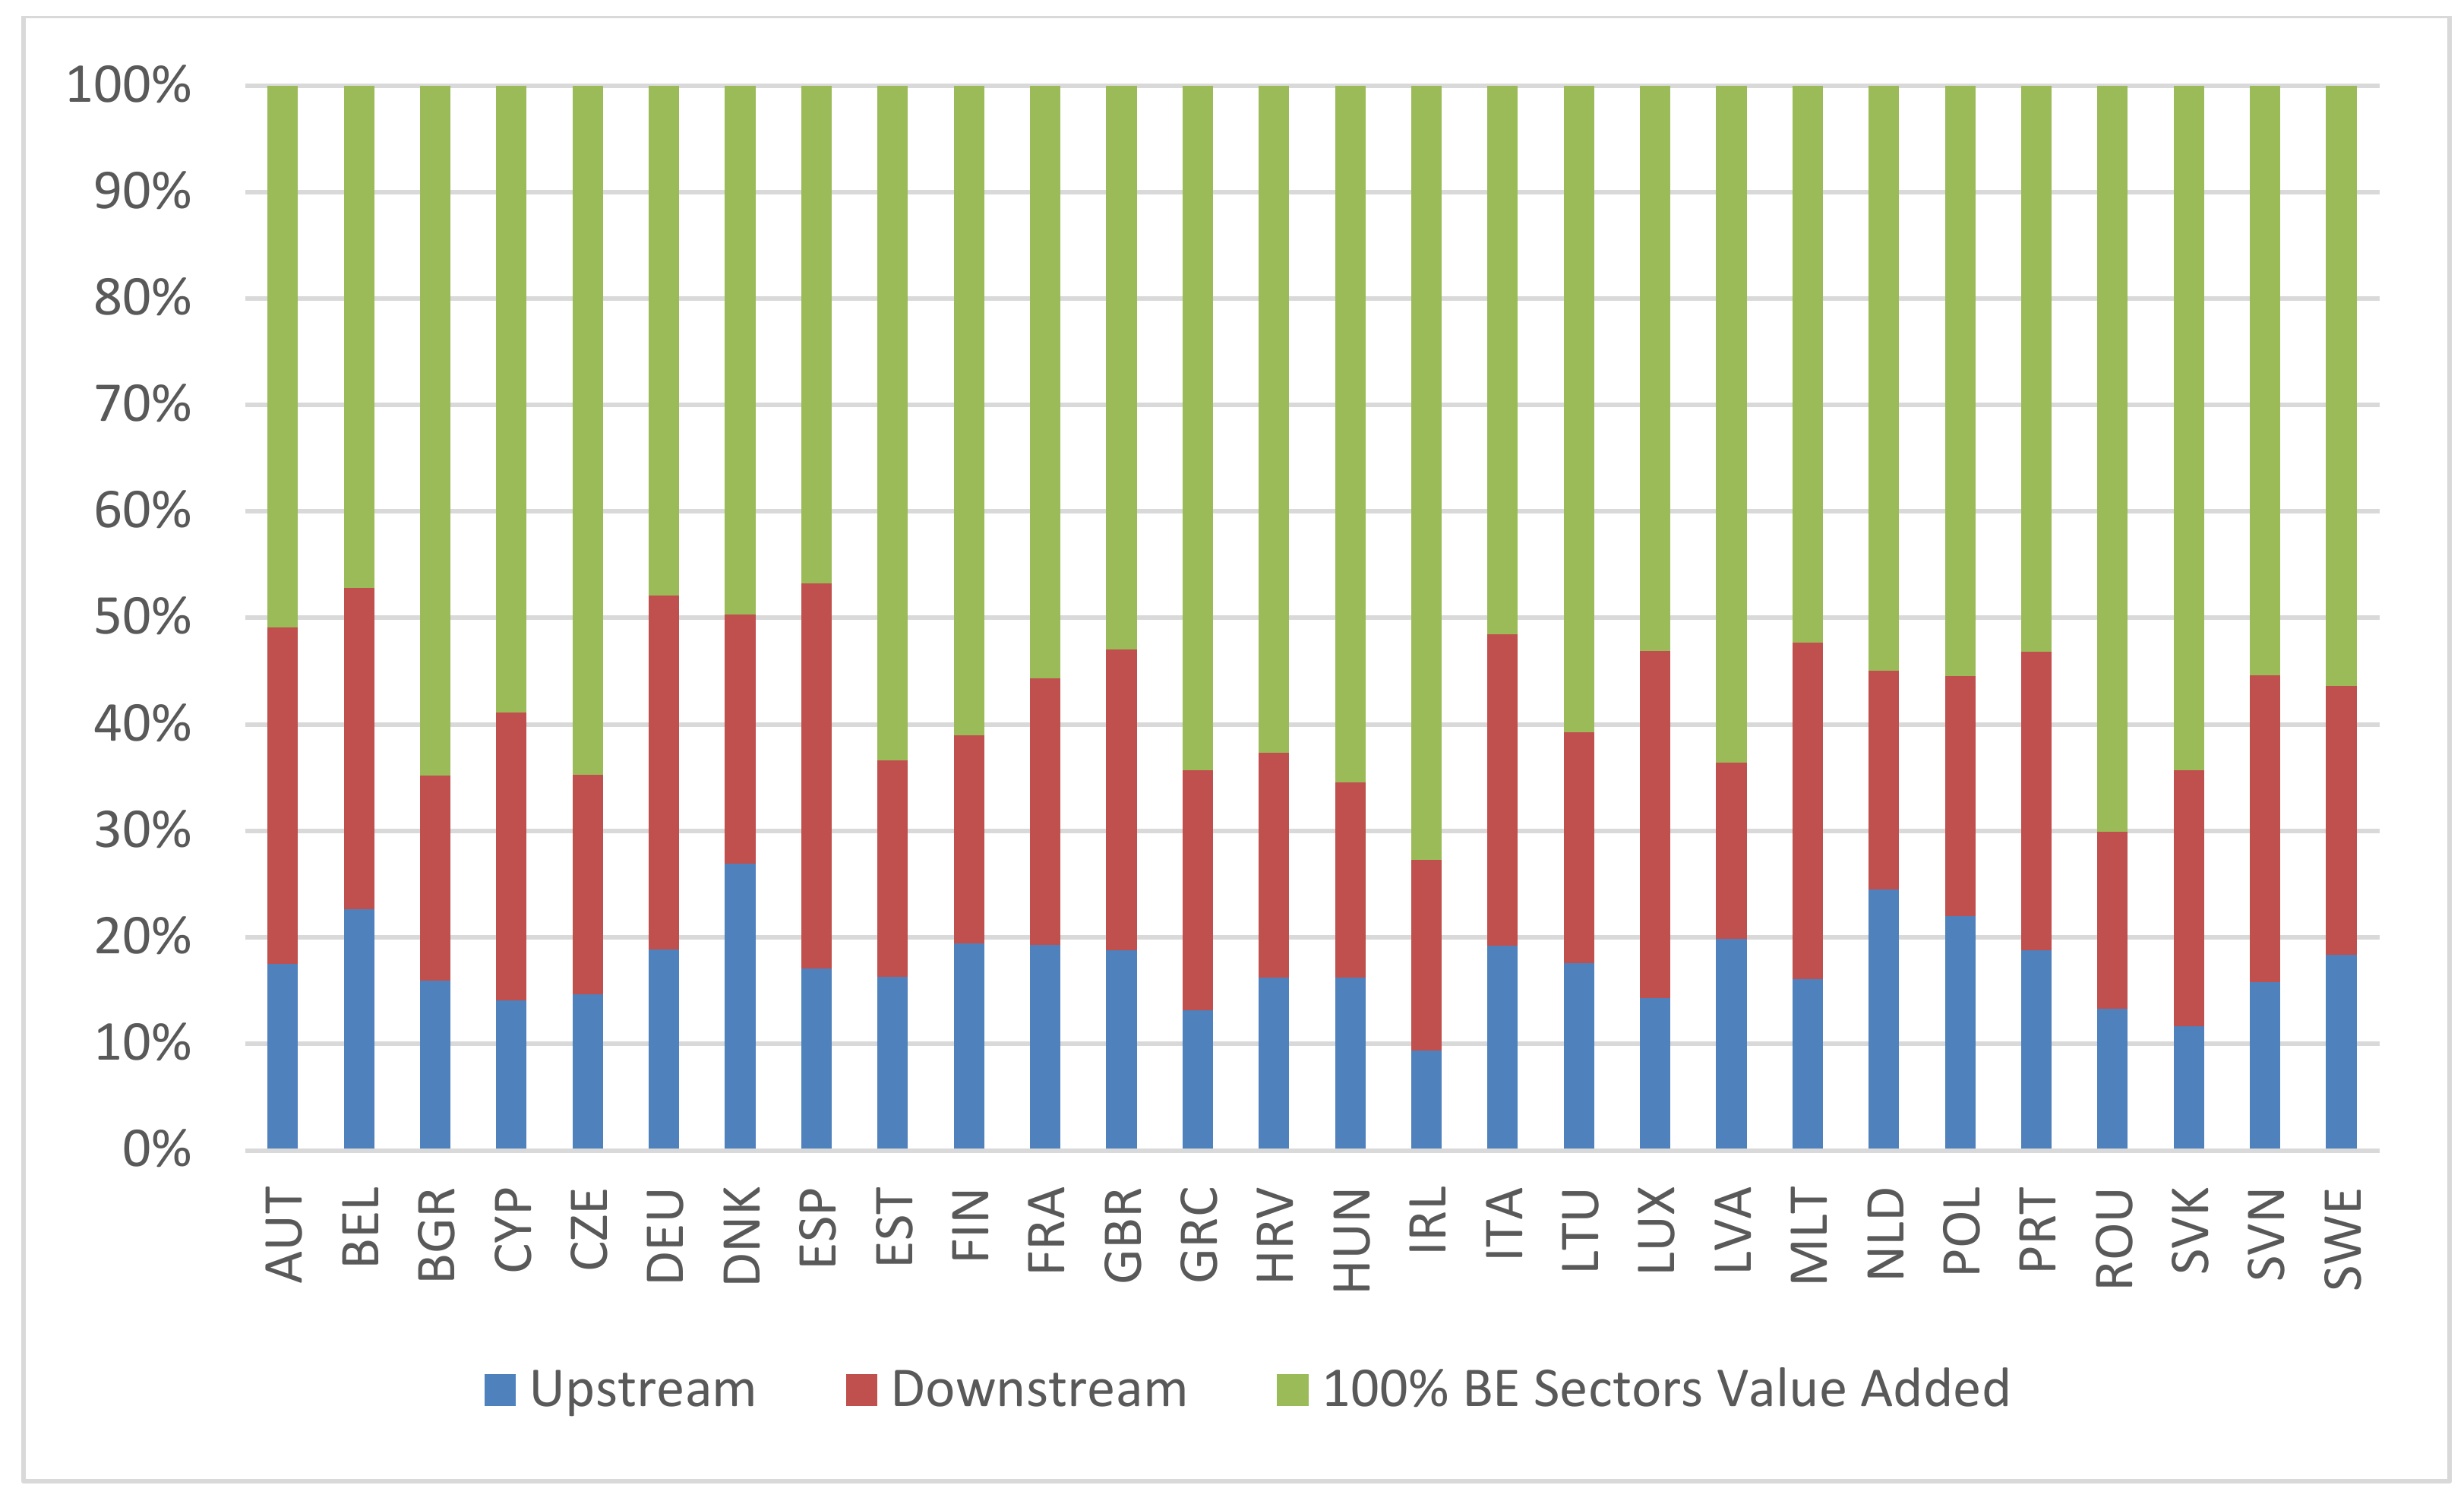
Still, this does not mean that for these countries the downstream and upstream value added do not have an impact on the bioeconomy shares, see Figure 8 and Figure 9. In 2005, for Austria, Belgium, Cyrus, Germany, Denmark, Spain, Estonia, France, UK, Ireland, Italy, Luxemburg, Malta, Netherlands, Portugal, Slovenia and Sweden, the total of their downstream and upstream value added is at the band of 40–50% of the bioeconomy value added, Spain and Germany having a greater total downstream and upstream value added than its 100% bioeconomy industries. In 2015 also Belgium is having a greater total downstream and upstream value added than its 100% bioeconomy industries. The numbers seem to indicate that for some countries the bioeconomy was more resilient against the financial crisis than other sectors. However, we need a more in depth analysis for understanding the developments and in particular the impact of the financial crisis.
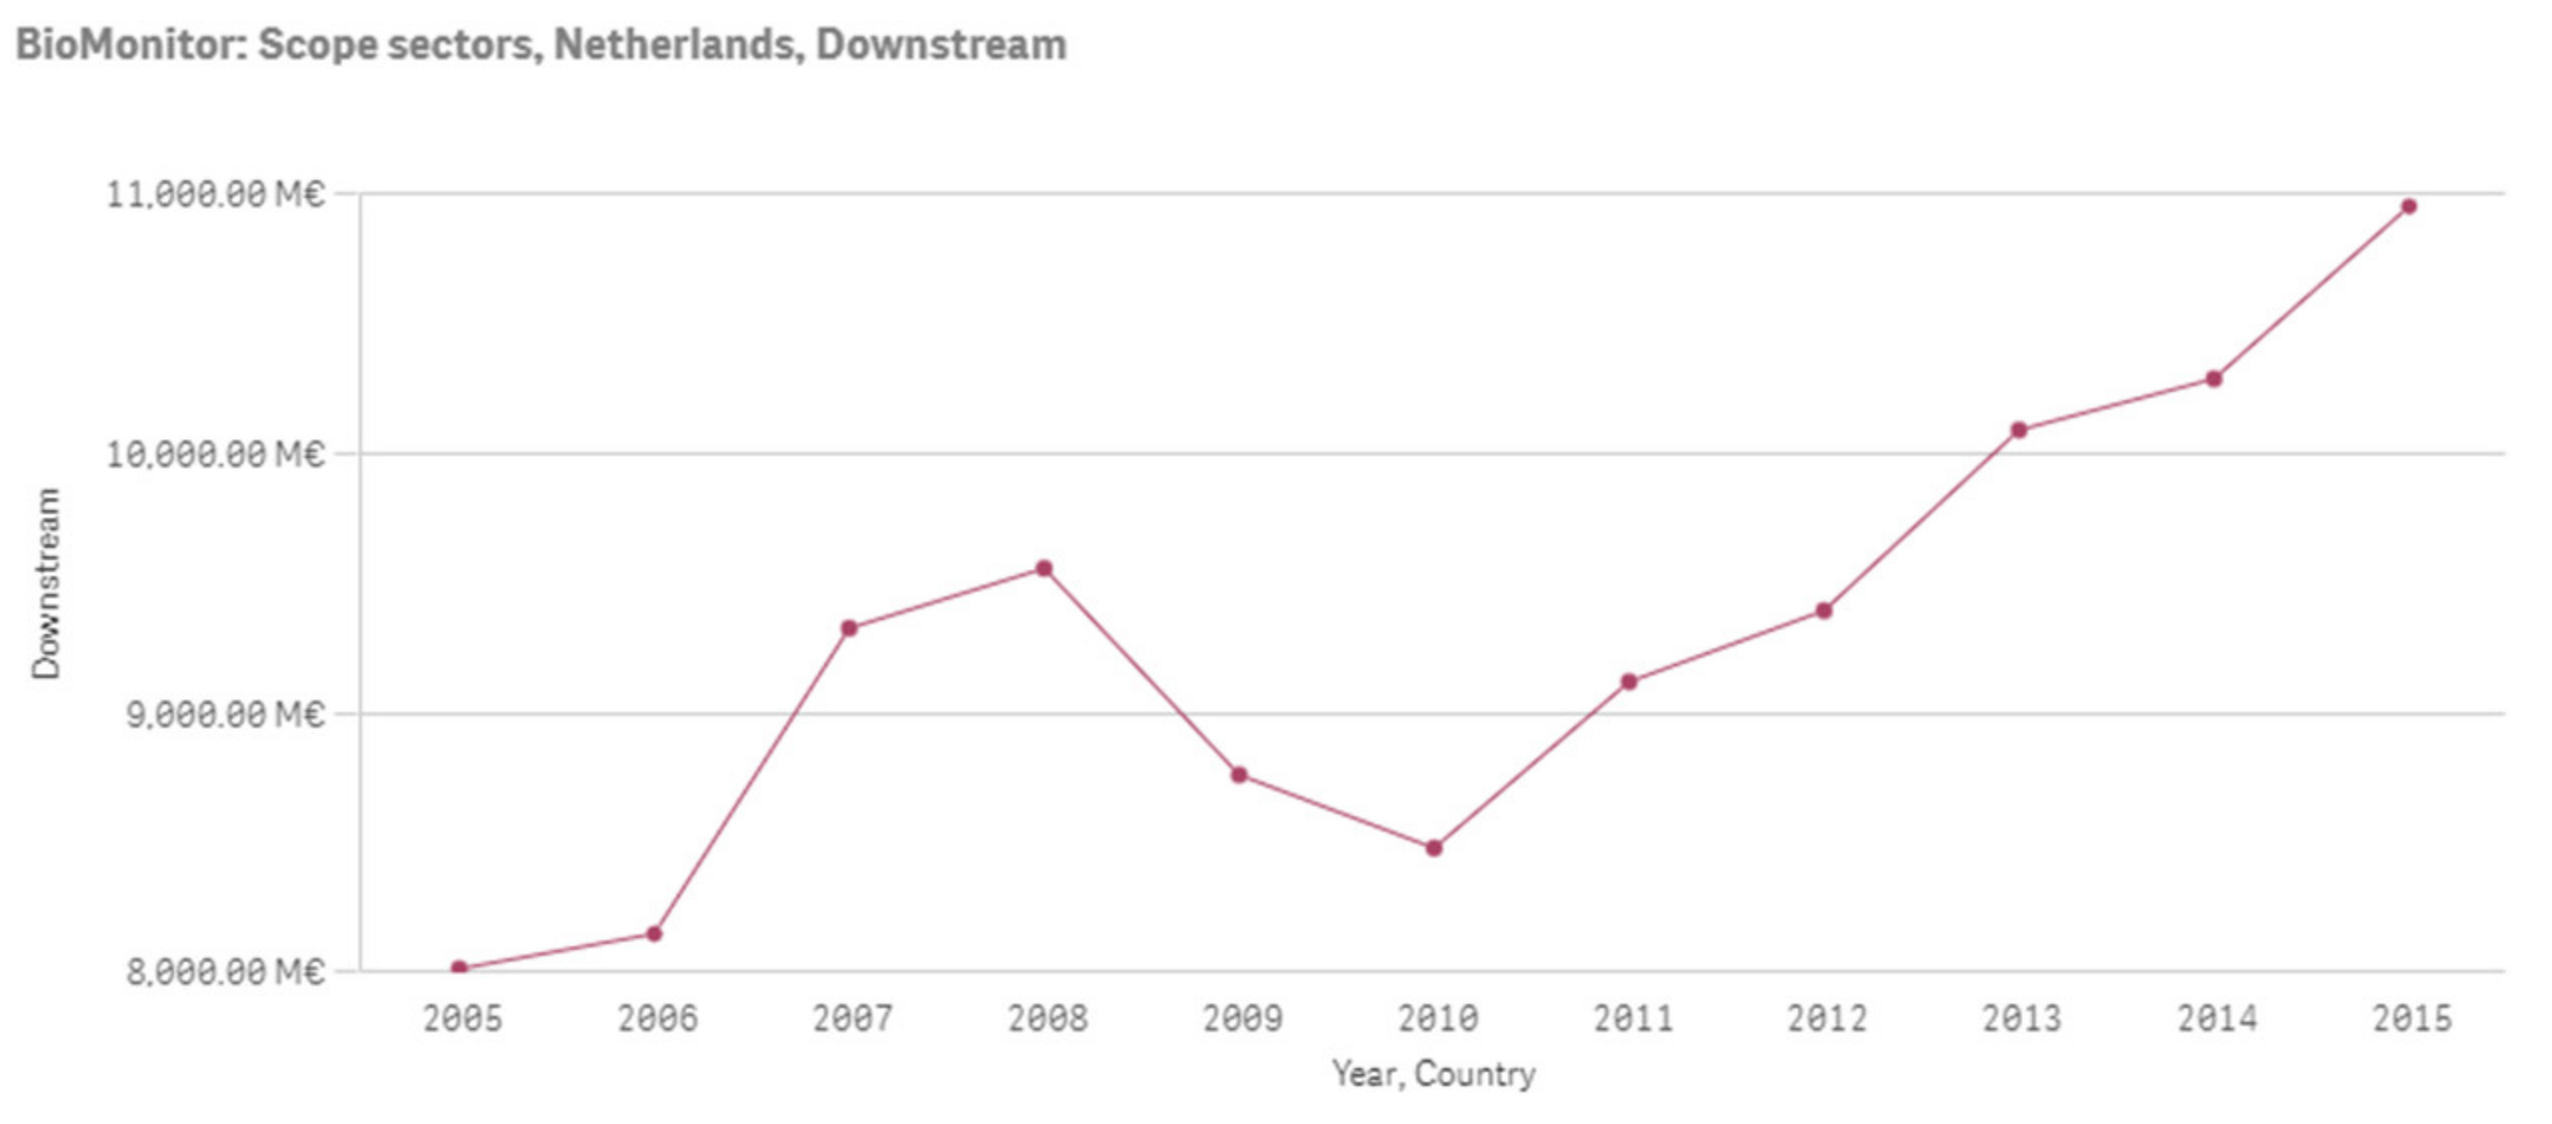
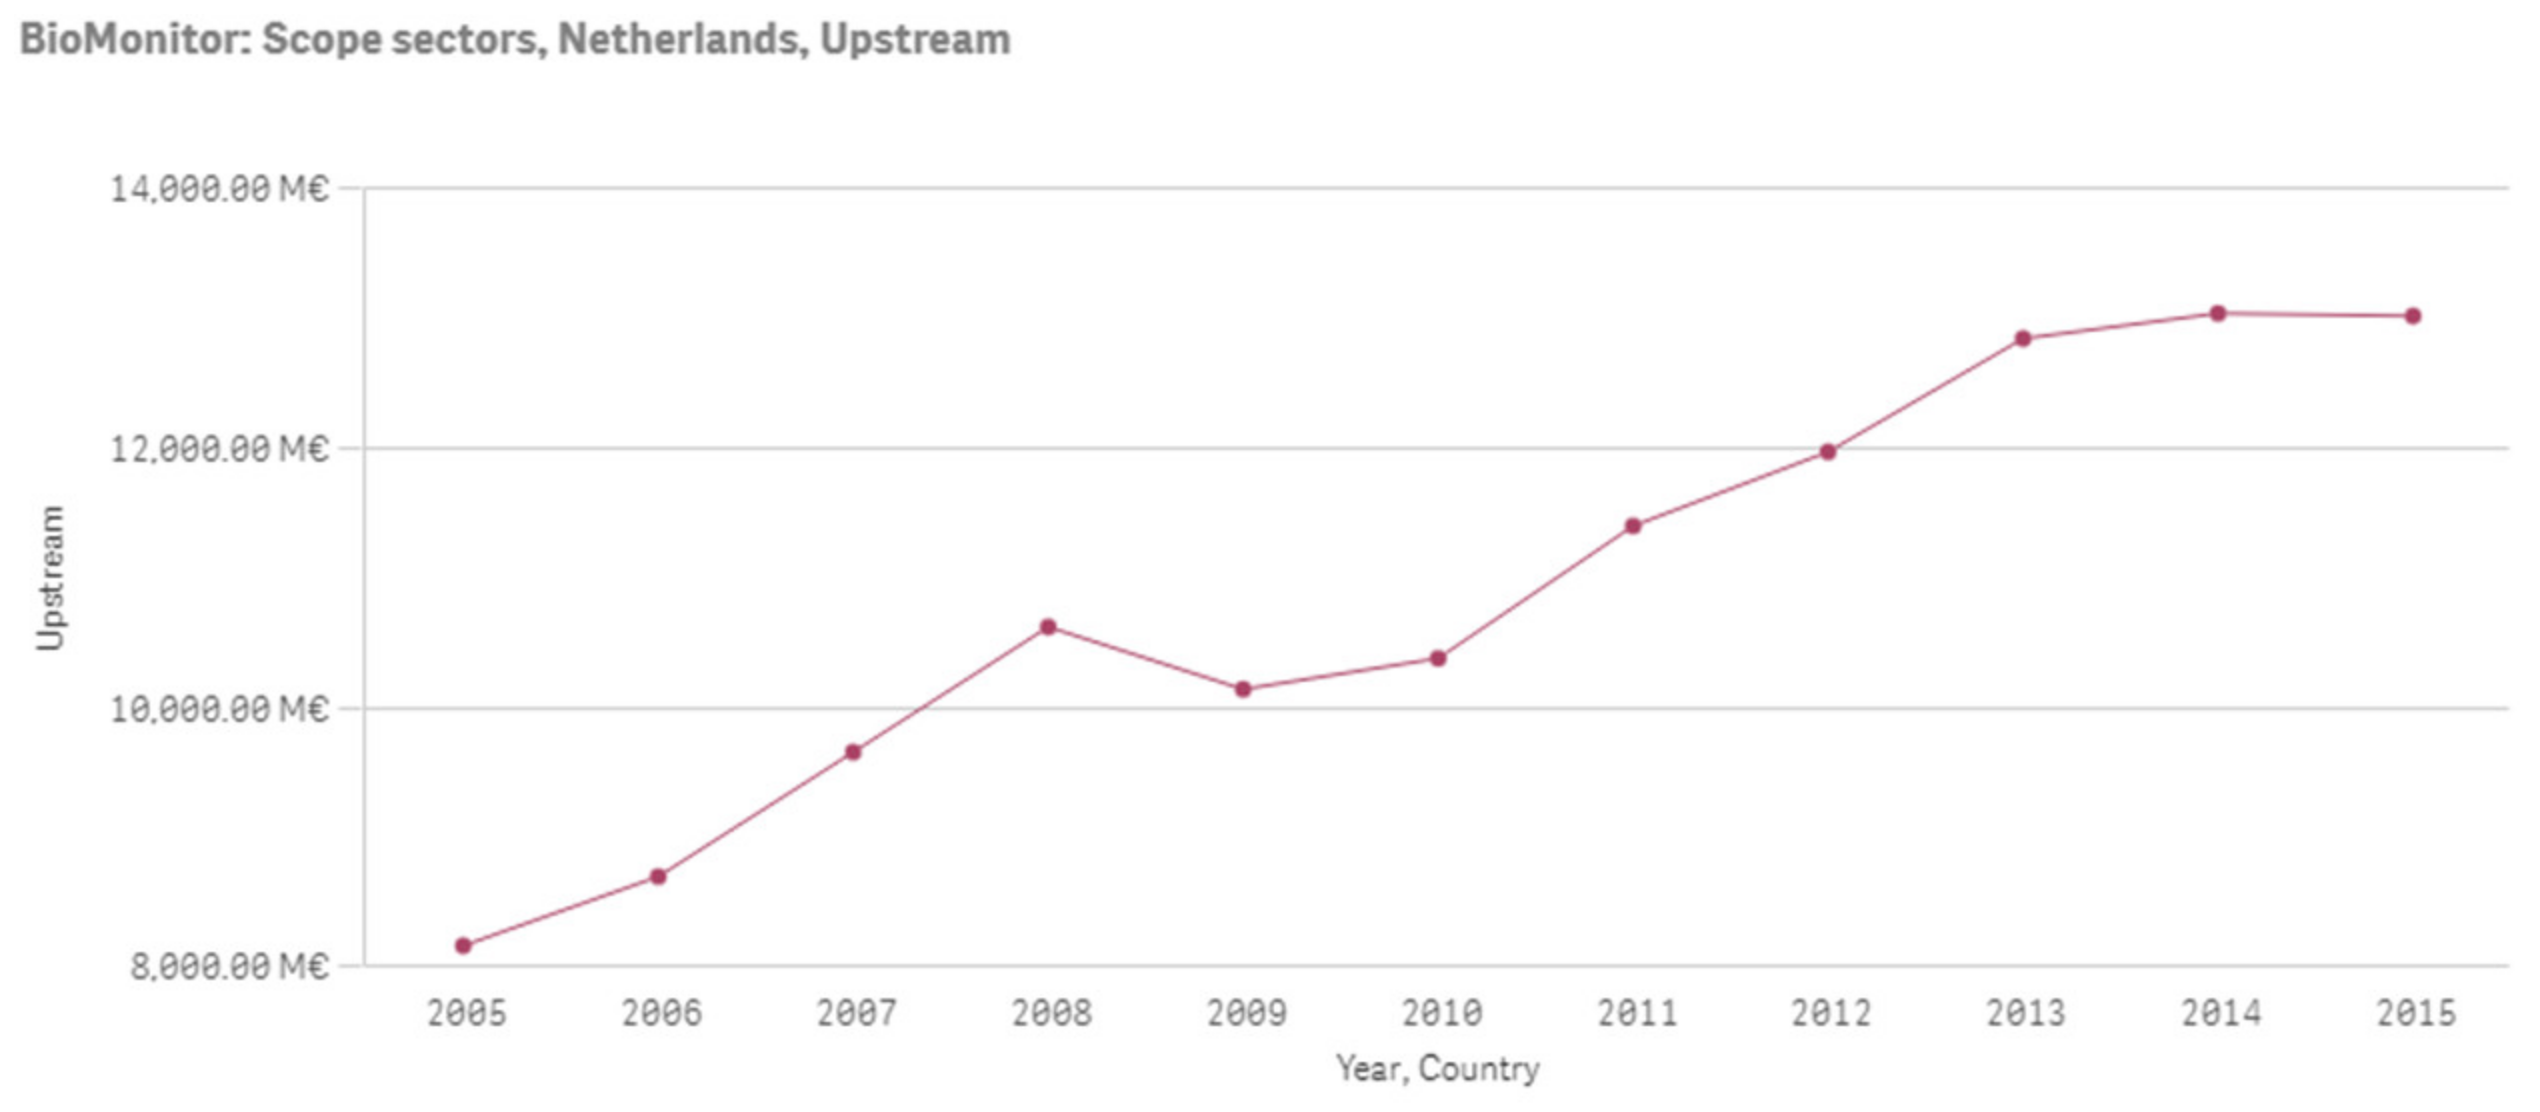
We can also observe the movement of upstream and downstream values for all EU28 between 2005 and 2015. For the upstream effect, for all EU28 countries, we see an increasing trend. For the downstream effect, for most of EU28 countries, we again see an increasing trend, please see Figure A1, Figure A2, Figure A3, Figure A4, Figure A5, Figure A6, Figure A7, Figure A8, Figure A9, Figure A10, Figure A11, Figure A12, Figure A13, Figure A14, Figure A15, Figure A16, Figure A17, Figure A18, Figure A19, Figure A20, Figure A21, Figure A22, Figure A23, Figure A24, Figure A25, Figure A26, Figure A27, Figure A28, Figure A29, Figure A30, Figure A31, Figure A32, Figure A33, Figure A34, Figure A35, Figure A36, Figure A37, Figure A38, Figure A39, Figure A40, Figure A41, Figure A42, Figure A43, Figure A44, Figure A45, Figure A46, Figure A47, Figure A48, Figure A49, Figure A50, Figure A51, Figure A52, Figure A53, Figure A54, Figure A55 and Figure A56 in the Appendix. We cannot show all the results here (the details are available at https://datam.jrc.ec.europa.eu/datam/mashup/BM_BIECONOMIC_SHARES/index.html (accessed on 22 December 2020)). We present the example of the Netherlands, both for downstream (Figure 10) and upstream value added (Figure 11). For both we observe a local maximum at 2008, but the slope of the downstream curve before and after the local maximum is much steeper. The local maximum for downstream and upstream value added seems to indicate a resilience of the bioeconomy against the financial crisis as mentioned before.
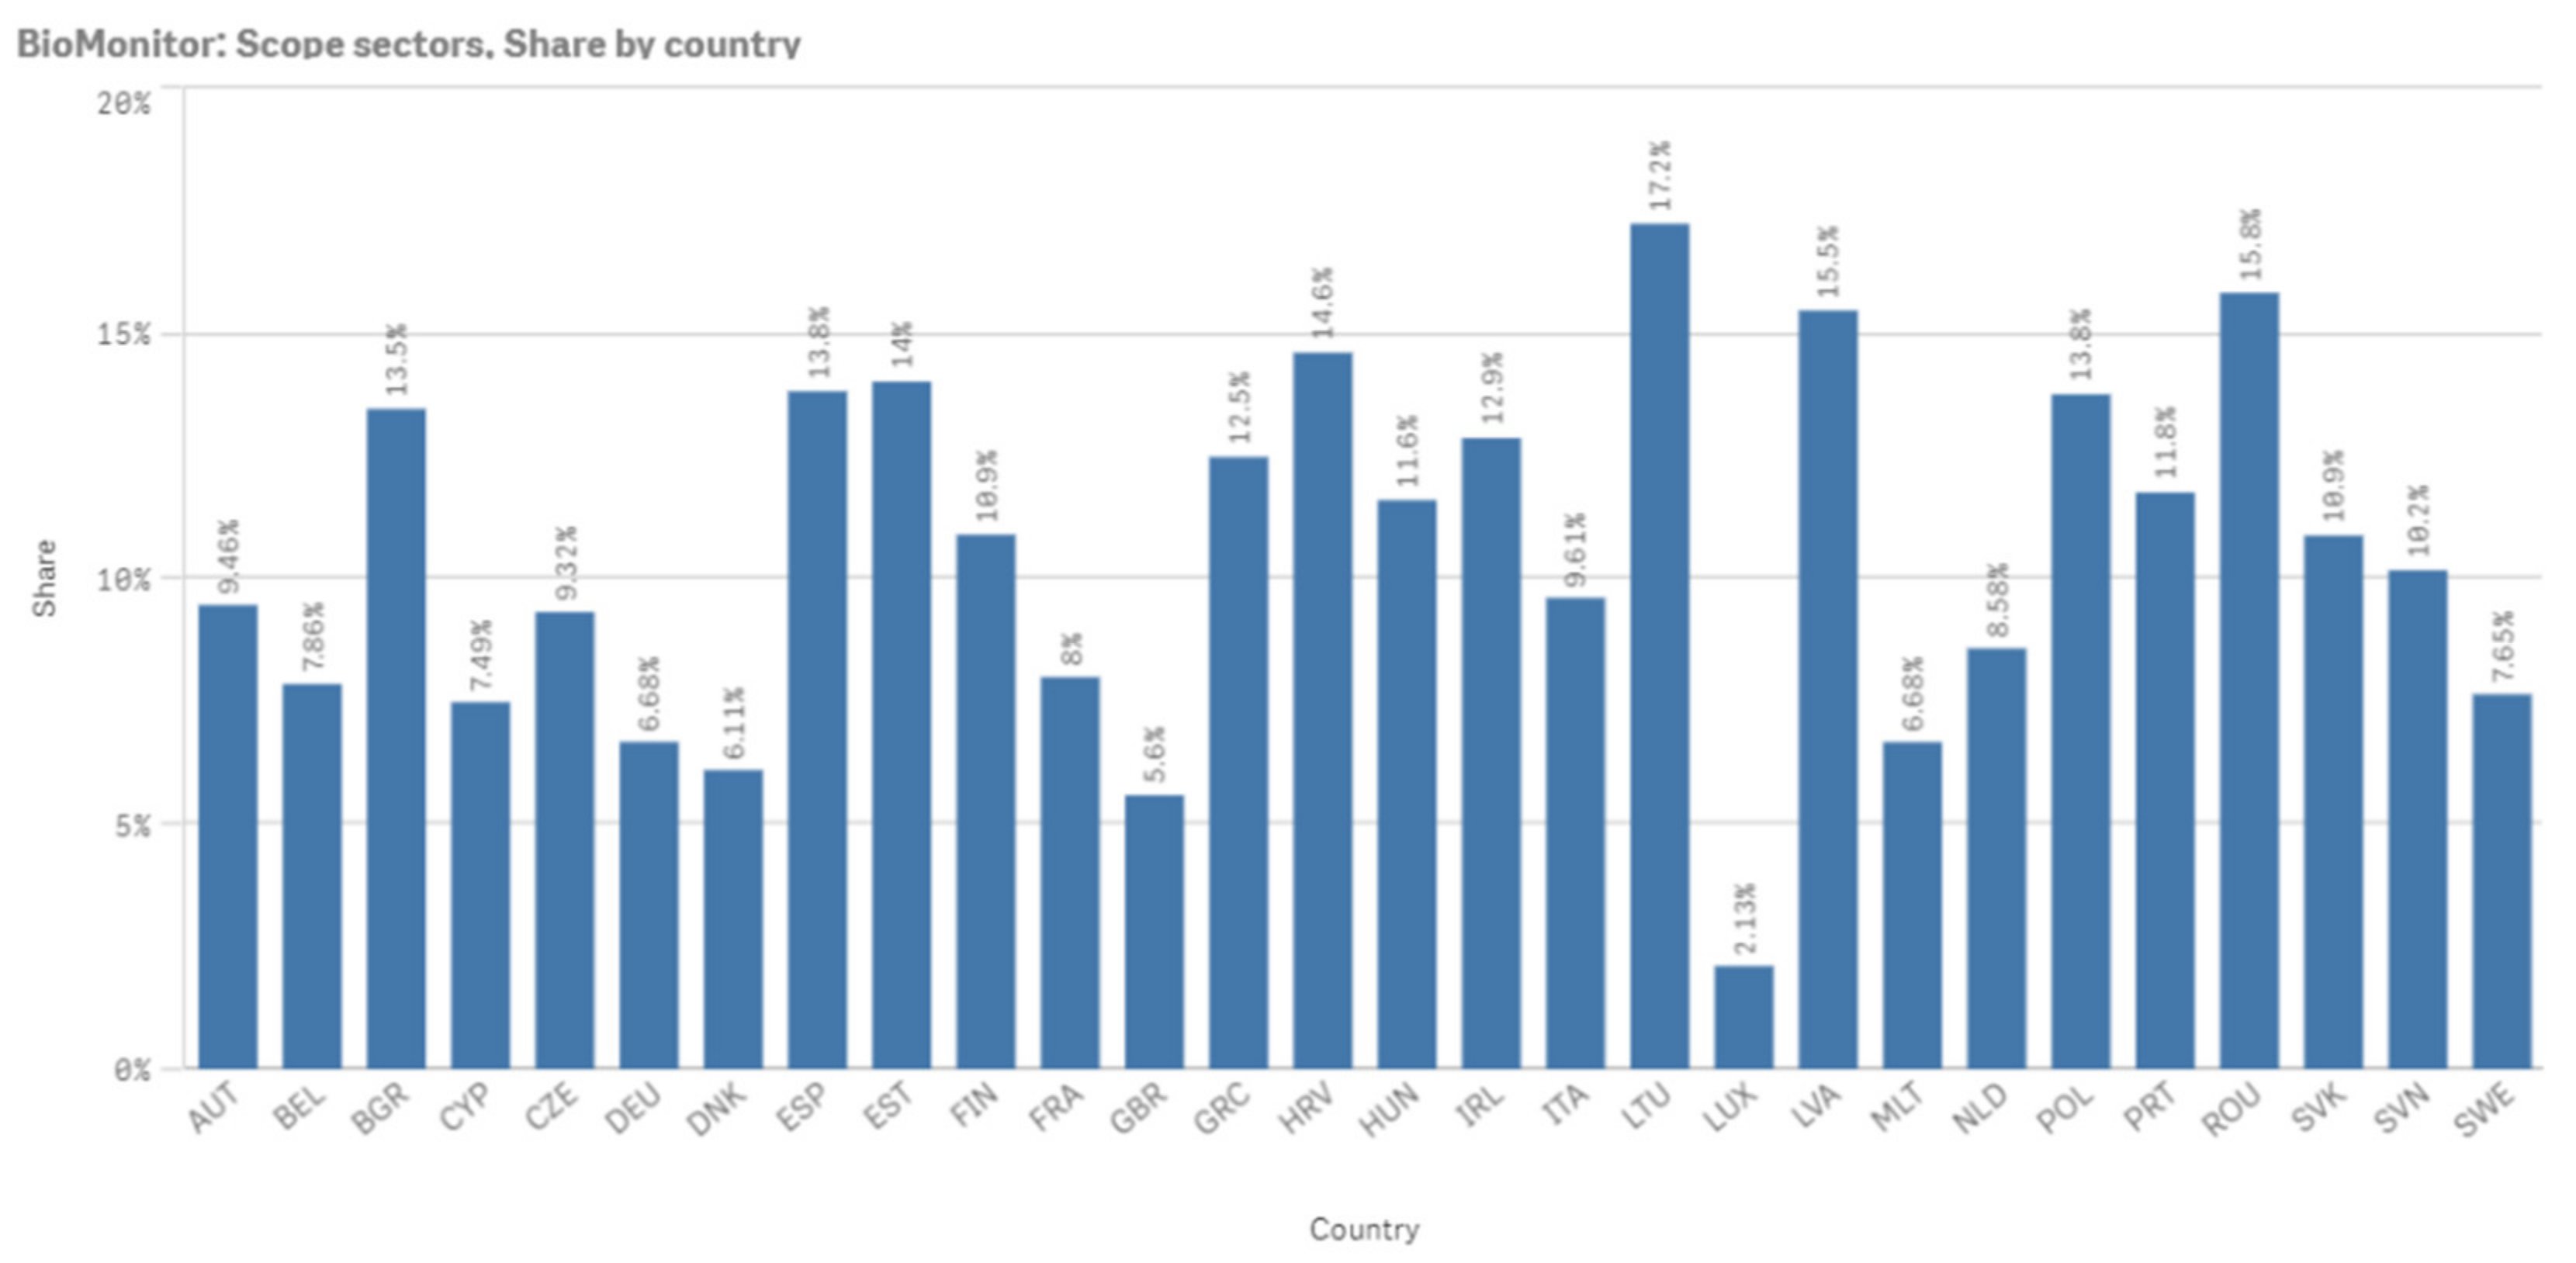
Results also show that the shares of the bioeconomy for 2015 are fluctuating in the range of 2.13% (Luxembourg) to 17.2% (Lithuania), see Figure 12. More than half of the member states have a higher than 10% bioeconomy value added share. Nevertheless, the results are quite divers. Each member state tells a different story.
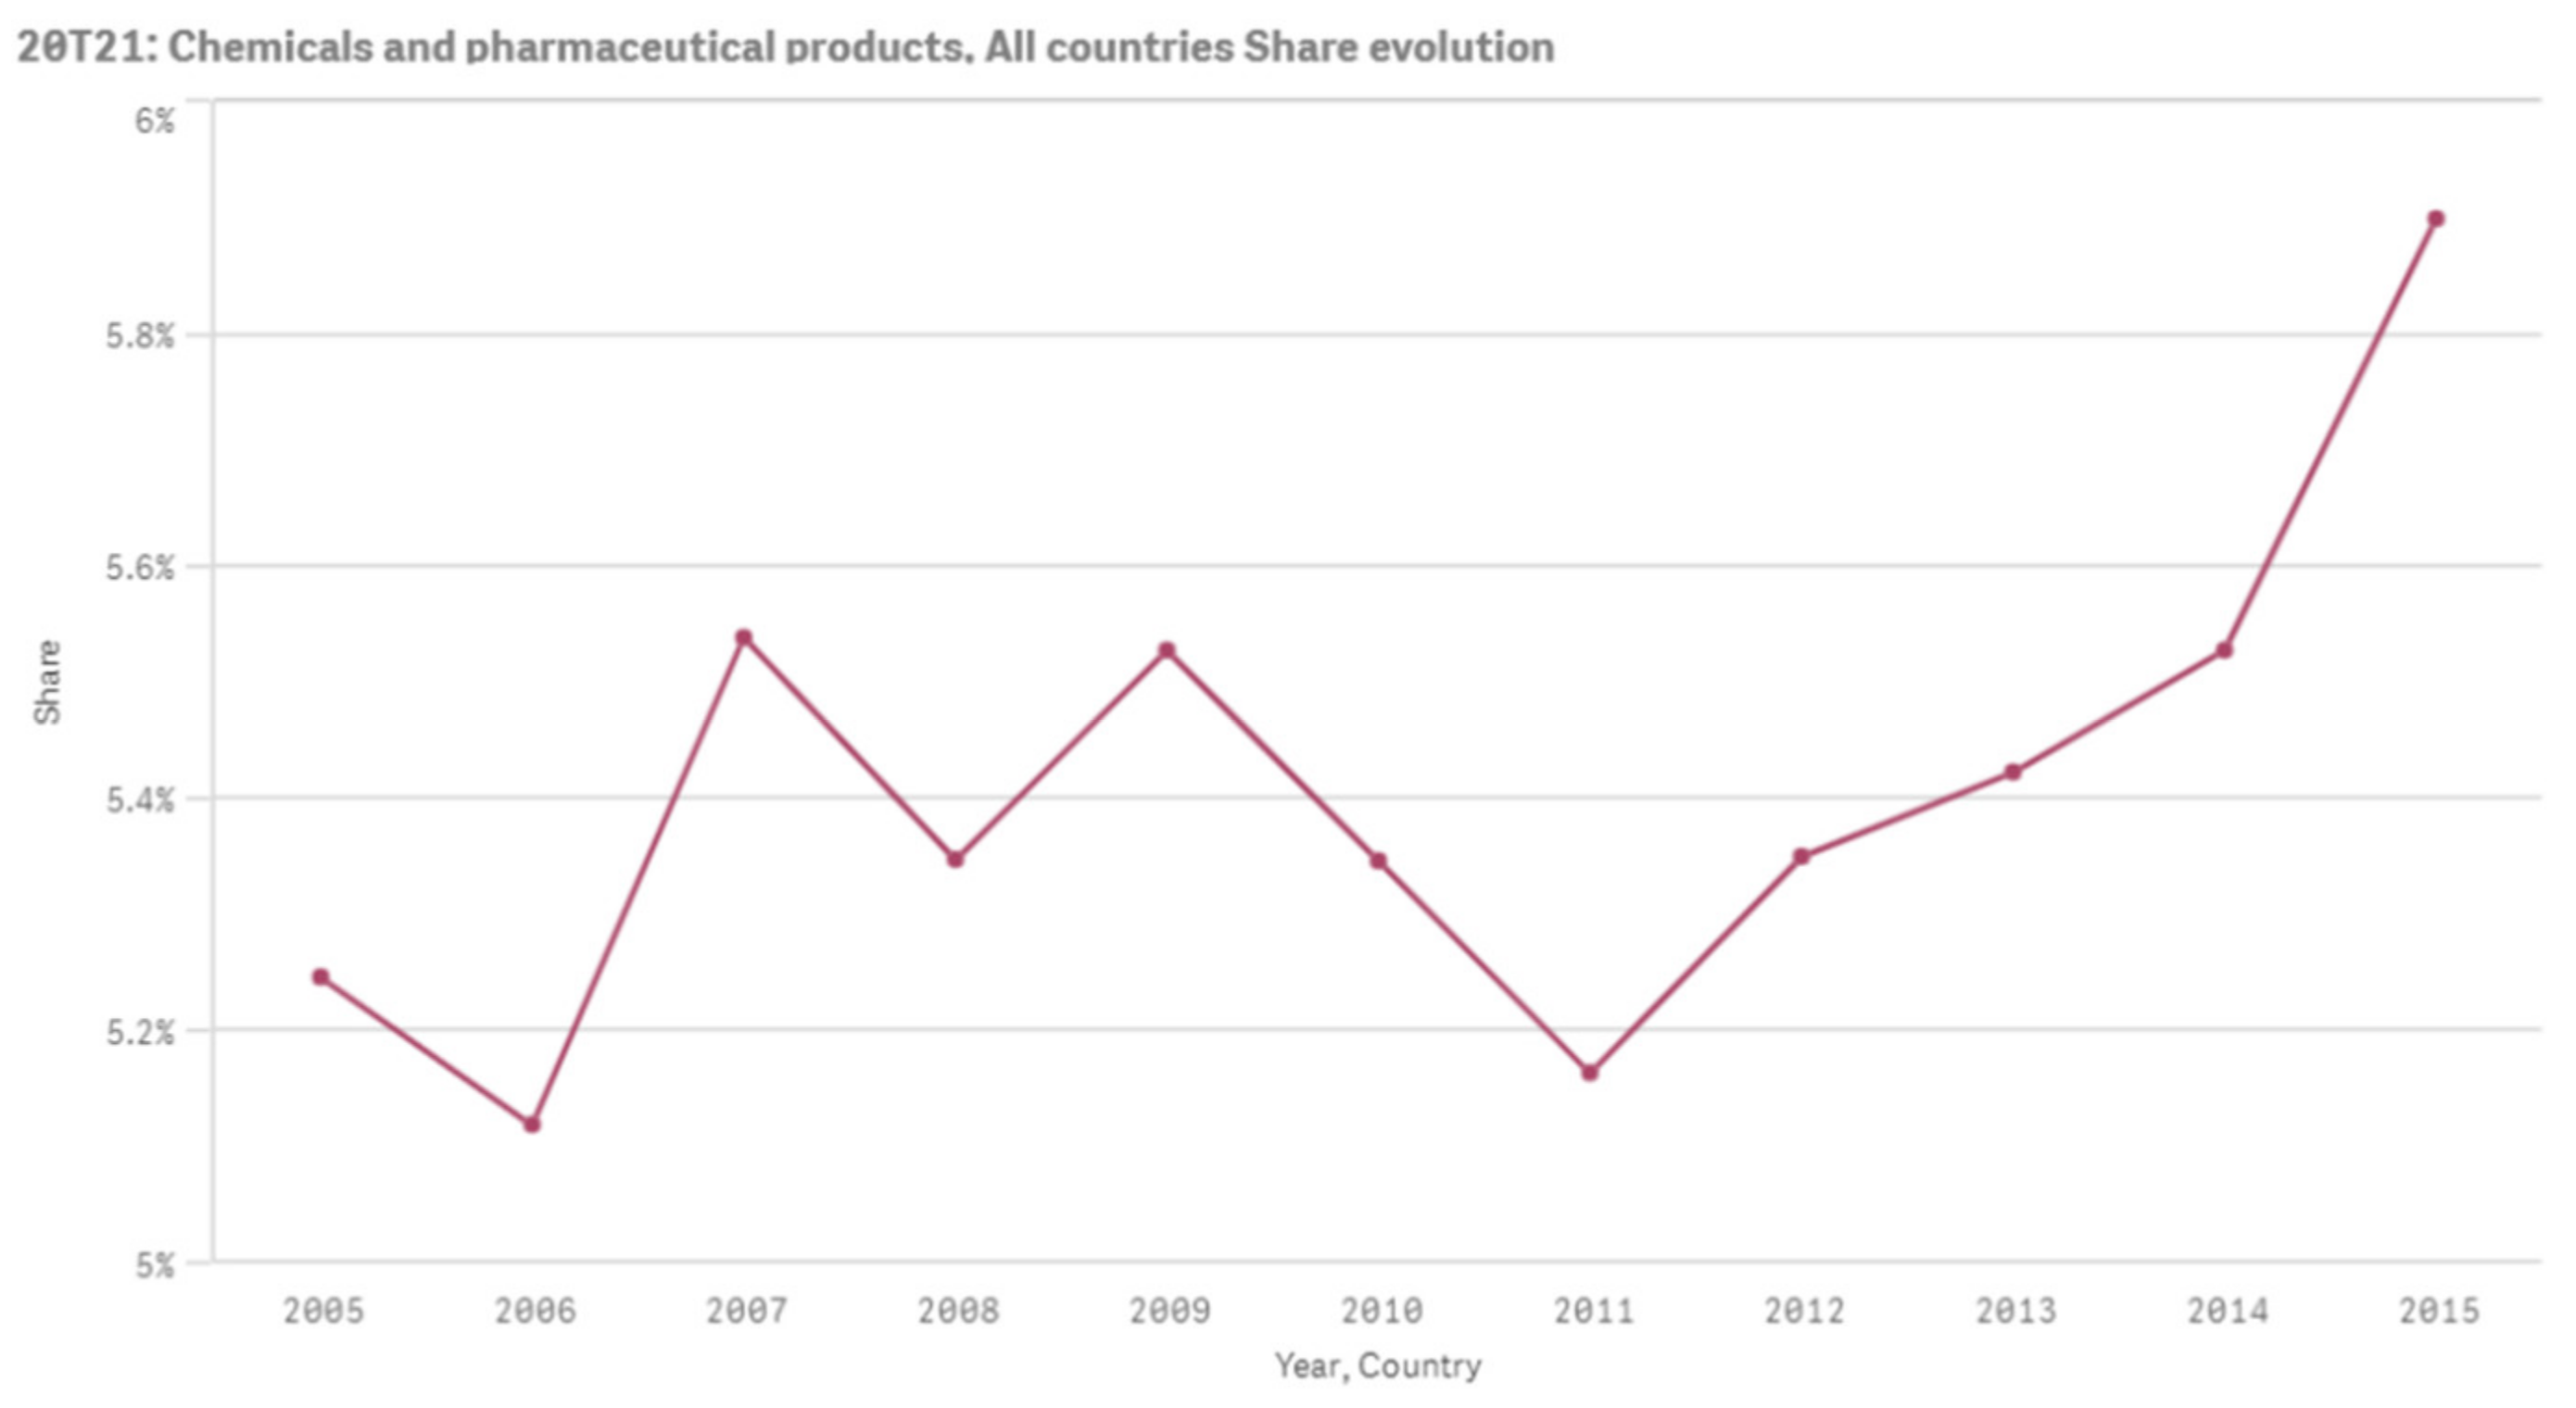
Our model and data allow us to calculate the development of the bioeconomy shares between 2005 and 2015, for all 16 industries in the Input Output Tables. For instance, for the Netherlands, the chemical and pharmaceutical products industry the bioeconomy share increased from ~5.2% to ~5.8% (see Figure 13). This is a 0.06% increase of the bioeconomy value added in this industry between 2005 to 2015.
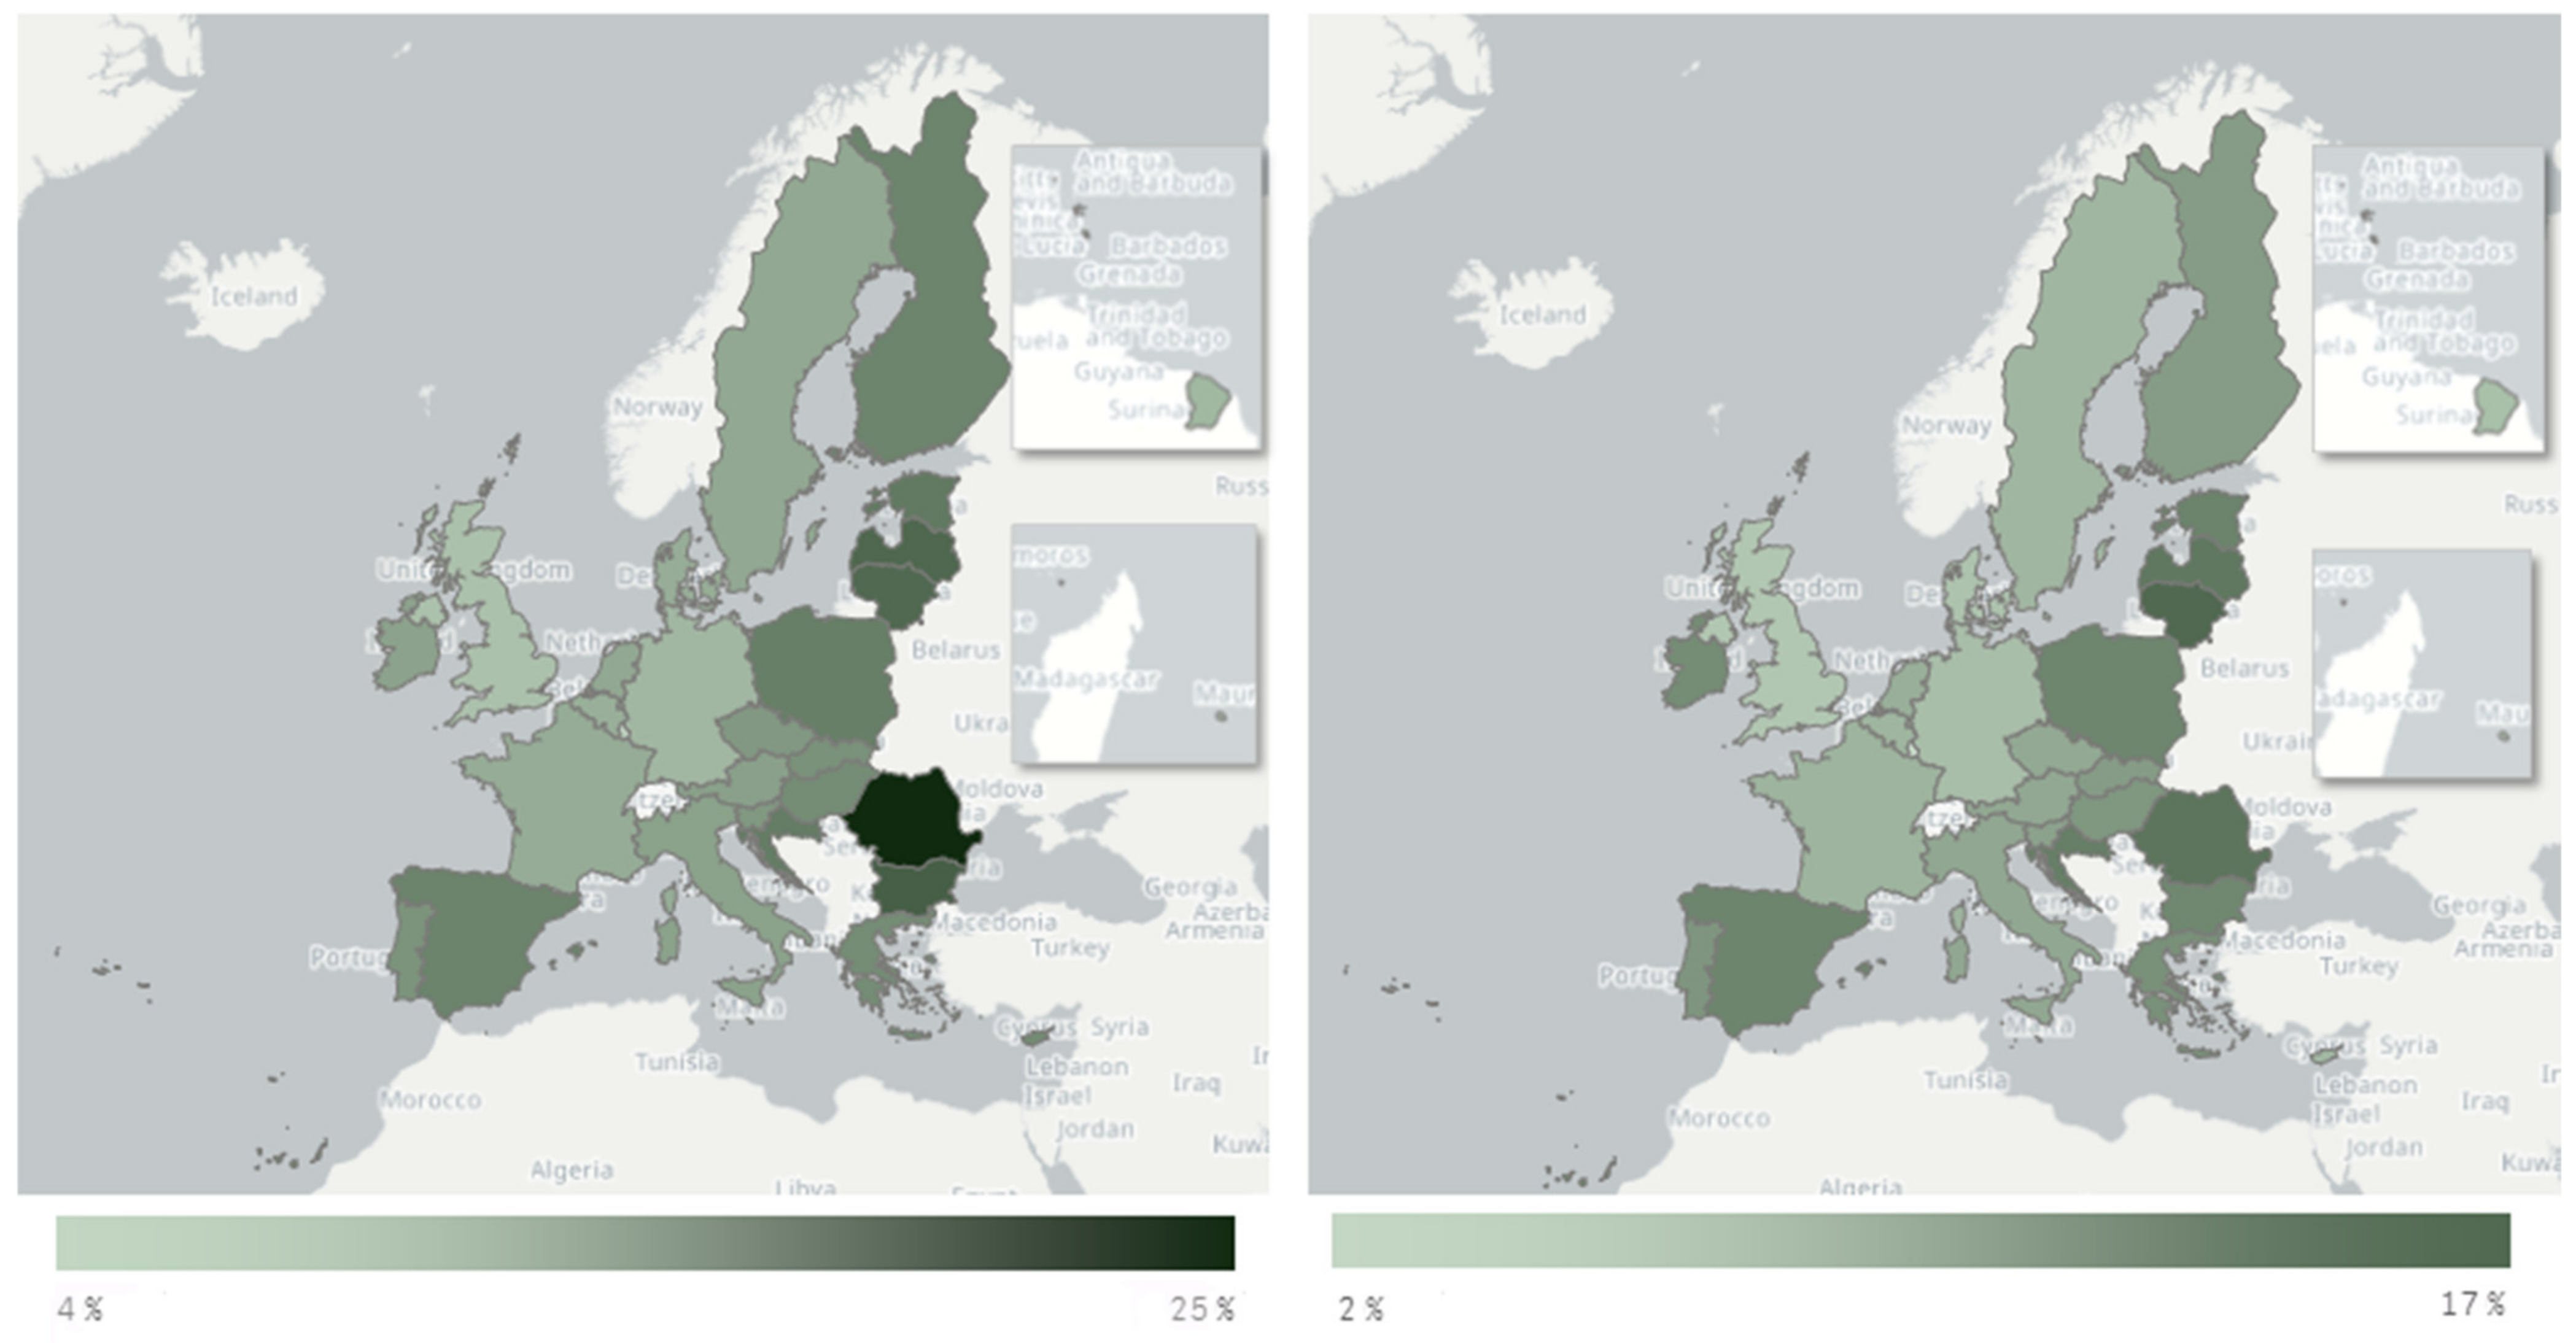
The following two maps (Figure 14) represent the EU Member States Bioeconomy shares in value added for 2005 and 2015, respectively, with green shading. The greener the higher the bioeconomy value added share. We can observe the green shading of eastern Europe is getting lighter over time whereas the western Europe shading is staying the same.
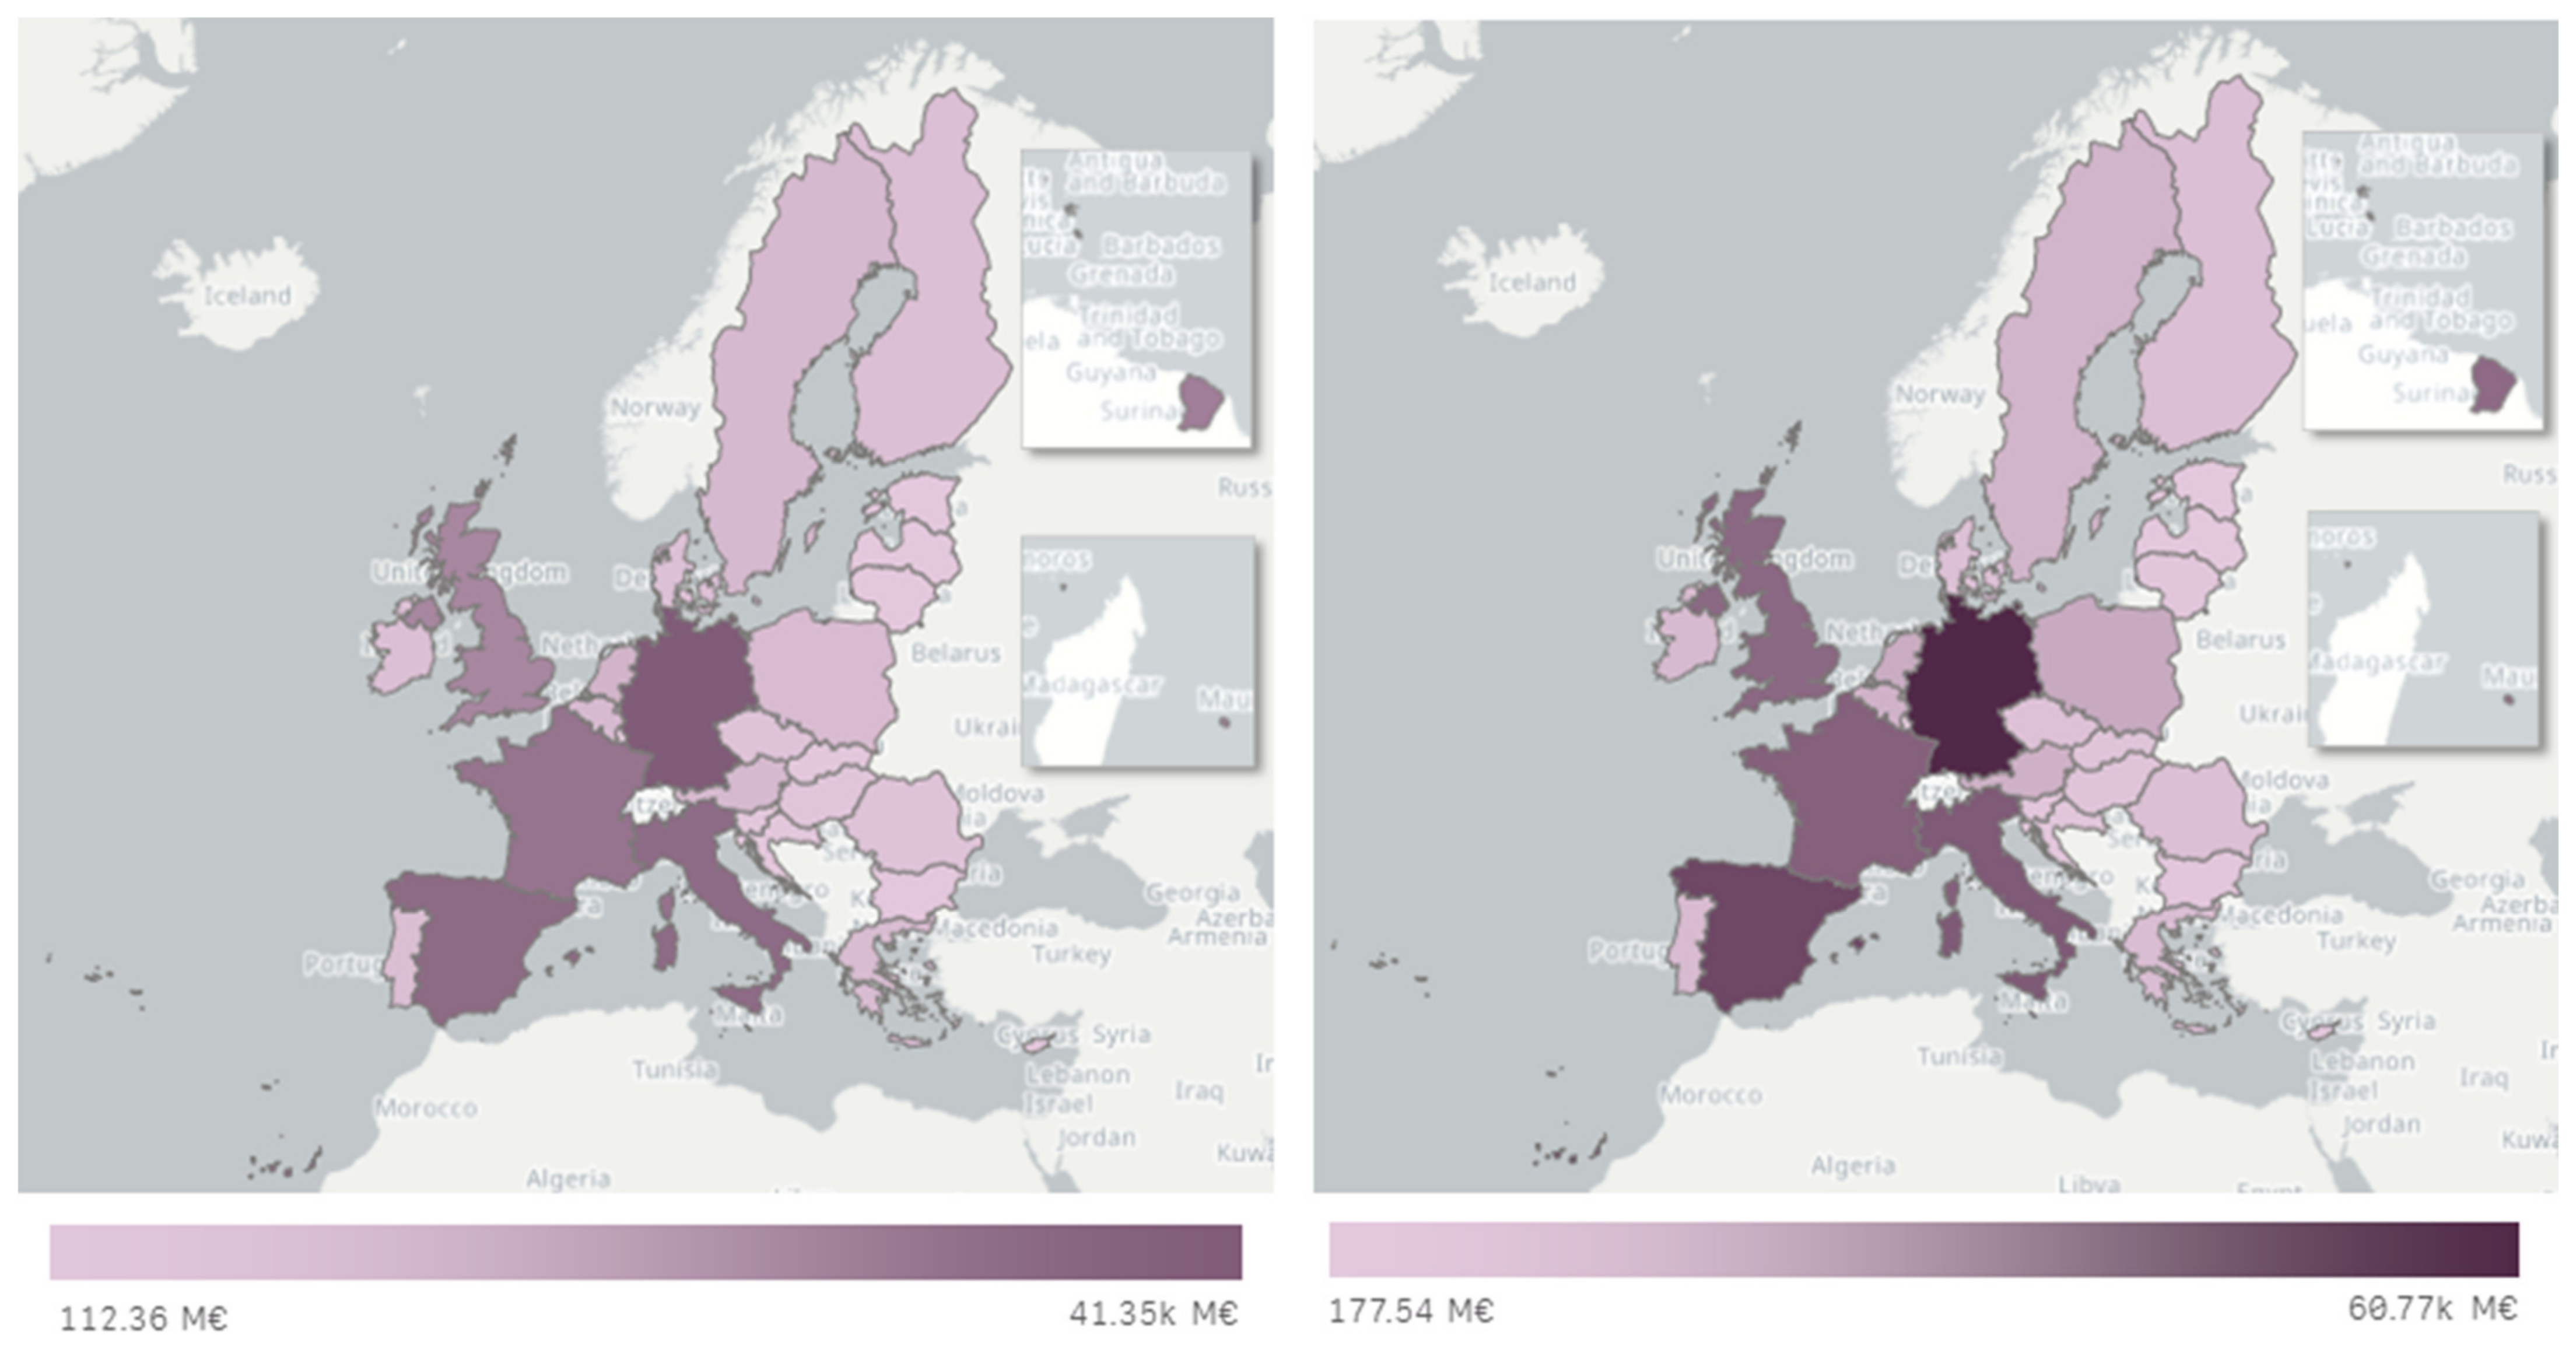
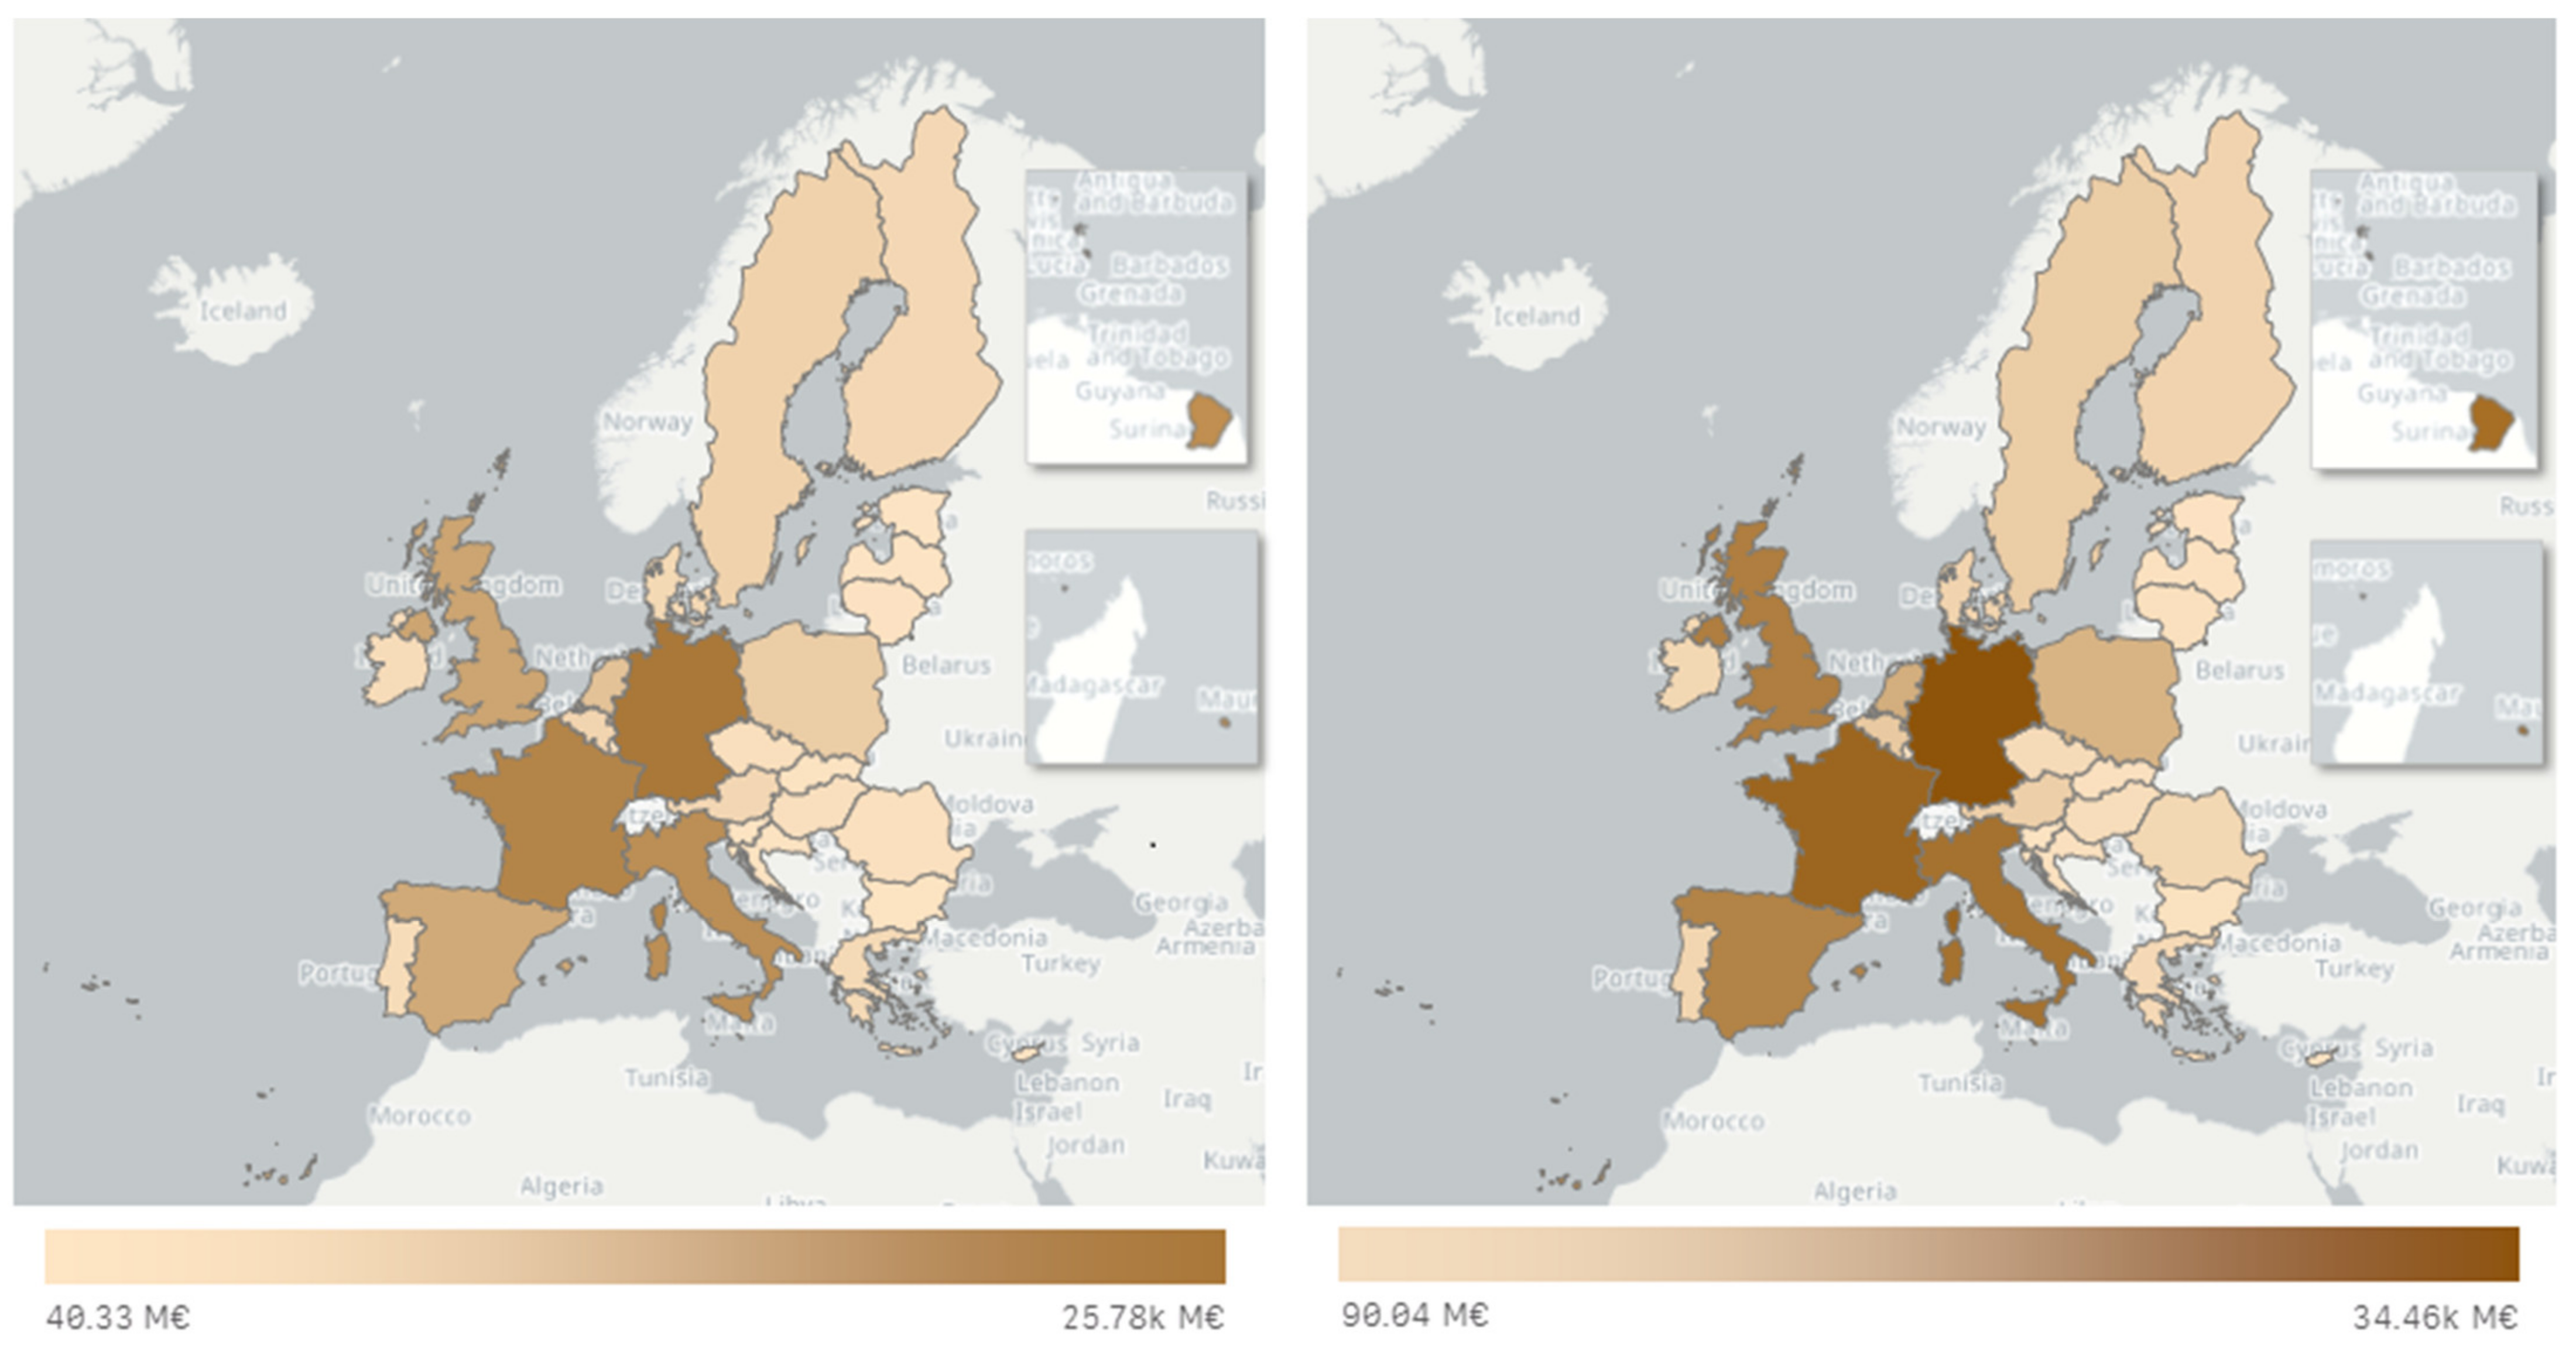
The following map (Figure 15) represent the EU Member States Downstream Bioeconomy values in value added for 2005 and 2015, respectively, with purple shading, as the purple gets darker the downstream bioeconomy value added values increase. The relative shares do not change from 2005 to 2015 except for Germany. We can observe the same (Figure 16) for the upstream bioeconomy value added effect.
In this section, we provided part of the results that we derived because of space issue. For all the other results we prepared a user interface, you can visit the website: https://datam.jrc.ec.europa.eu/datam/mashup/BM_BIECONOMIC_SHARES/index.html (accessed on 22 December 2020).
5. Discussion
In this paper, we provide a measure of the share of the bioeconomy for EU-28 countries for 2005–2015 based on input–output tables. Our results are consistent with the findings of Heijman [9] for the Netherlands for the period 2008–2012.
The input–output flow from 100% bioeconomy industries to all other industries creates the downstream and upstream effects. These effects are value added generated by 100% bioeconomy input (downstream) or outputs that generates 100% bioeconomy outputs (upstream). With this study, we manage to measure the bioeconomy value added that is not directly apparent but rather hidden under other partly bioeconomy industries. Each industry has certain levels of bioeconomy value added, some more than others. Without measuring these values, we are under estimating the value added of the bioeconomy. The difference can be substantial. The value-added share of the up- and downstream sectors reaches thirty percent and more per member state. For some member states the share reaches even more than fifty percent.
The analysis focusses on the value-added. The results can be used to derive a number of additional indicators by relating them to employment, population and more. A combination of our results with biomass flows allows for further insights with respect to the past and future potential of the bioeconomy for sustainable development. Measuring and monitoring biomass flow is much more demanding than measuring and monitoring the value-added. The method we present allows to follow the flow of resources and supports the monitoring of biomass flows. As we link the value added of the up- and downstream sectors, we expect further information about the circularity of the bioeconomy can be derived. We avoid double-counting by using a consistent approach, an often-encountered problem when identifying the value-added of a sector or a product by combining different approaches [31].
We stress that the results we present on their own do not provide insights about the sustainability of the bioeconomy. They need to be placed into the wider context of the debate on sustainability [3,22,32,33]. Nevertheless, the method and results presented provide an important input to the debate. The value added over time is an important input for ex-ante assessments of sustainable bioeconomy developments [34,35,36].
Overall, we observe a larger share of the bioeconomy than reported in previous studies. Interestingly, many EU countries show a U-shape form of the value-added over time. This indicates that the bioeconomy has kicked-in. The inversion is about the time of the financial crises. Cause and effect require further detailed analysis. The approach we have developed and the data we provide allows for such further investigations.
In comparison to other approaches that are very similar to the one we propose, our approach is less data demanding. The shares of the partly bioeconomy sectors are derived from the share of the input into these sectors from the 100% bioeconomy sectors. These shares can be derived from the input–output tables as demonstrated. Those sectors that are considered to be partly bioeconomy are those identified by the BioMonitor project. others can also be added to the bioeconomy. In the end, the sectors of the economies that are included and excluded will depend on the research question. The disadvantage of the approach presented is that it averages input and outputs over the partly bioeconomy sectors and may either over or underestimate the contributions of these sectors. Kuosmanen et al. [21] use a mixed method approach where the analysis is based on the input and output according to the biomass being used and the contribution in value added is derived using the share of biomass. This links the value added more closely with the flow of biomass. This in some cases may underestimate the contribution of the bioeconomy where a small amount of biomass results in substantial amount of value added such as in the case of pharmaceuticals or biological plant control products.
In our analysis we include the up-stream sector that provides inputs to the 100% bioeconomy sector. Many others do not include these sectors [14,21] and results in a lower share of the bioeconomy in comparison to our results. We do not include the inputs from other sectors to the partly bioeconomy sectors. This would be possible if more detailed information at the sub-sector level would be available, such as a more detailed differentiation from the PRODCOM database. However, this also generates another potential problem for those sub-sectors where only a few companies producing as companies involved might not remain confidential anymore.
Note also that the Harthoorn model [10], with cross-country comparison of Harthoorn multiplier values for industries would give us further insights on bioeconomy investment models. This analysis is a potential extension of this paper. Another extension of the paper is to devise a method to analyze emission or labor employment of the bioeconomy by linking those statistics with the Input–Output Tables [28]. Our methodology will also allow to compare the results for EU MSs with other OECD countries or by using WIOD worldwide. We also designed a user interface on data portal of agro-economics Modelling (DataM) of European Commission for readers to analyze all of our results which can be accessed through the following link: https://datam.jrc.ec.europa.eu/datam/mashup/BM_BIECONOMIC_SHARES/index.html (accessed on 22 December 2020).
Finally, we have to be aware, no method is perfect. The method used needs to be presented in a transparent manner that readers will be able to judge the advantages and disadvantages. We hope we were able to do so.
Author Contributions
Conceptualization, K.C., W.H., J.H.H.W.; methodology, K.C., W.H., J.H.H.W.; formal analysis, K.C.; investigation, K.C. and J.H.H.W.; data curation, H.G.-H. and K.C.; writing—original draft preparation, K.C.; writing—review and editing, W.H. and J.H.H.W.; supervision, W.H. and J.H.H.W. All authors have read and agreed to the published version of the manuscript.
Funding
This work was supported by the BioMonitor project (http://biomonitor.eu (accessed on 22 December 2020)), which has received funding from the European Union’s Horizon 2020 research and innovation programme under grant agreement No. 773297.
Institutional Review Board Statement
Not applicable.
Informed Consent Statement
Not applicable.
Data Availability Statement
All Data are available using this link https://datam.jrc.ec.europa.eu/datam/mashup/BM_BIECONOMIC_SHARES/index.html?rdr=1614925104260 (accessed on 22 December 2020).
Acknowledgments
Authors also would like to thank Mohammed B. Degnet and Myrna van Leeuwen for their valuable comments as well as the members of the BioMonitor project consortium.
Conflicts of Interest
The authors declare no conflict of interest.
Appendix

Table A1.
Comparison of the BioMonitor bioeconomy sectors according to the NACE Codes with the equivalent ISIC Sectors used in the analysis.
Table A1.
Comparison of the BioMonitor bioeconomy sectors according to the NACE Codes with the equivalent ISIC Sectors used in the analysis.
| BioMonitor Sectors (NACE Codes) | ISIC Sectors |
|---|---|
| A01 Crop and animal production, hunting and related service activities | 01T03: Agriculture, forestry and fishing |
| A02 Forestry and Logging | |
| A03 Fishing and aquaculture | |
| 05T06: Mining and extraction of energy producing products | |
| 07T08: Mining and quarrying of non-energy producing products | |
| 09: Mining support service activities | |
| C10 Manufacture of food | 10T12: Food products, beverages and tobacco |
| C11 Manufacture of beverages | |
| C12 Manufacture of tobacco | |
| C13 Manufacture of textiles | 13T15: Textiles, wearing apparel, leather and related products |
| C14 Manufacture of wearing apparel | |
| C15 Manufacture of leather and related products | |
| C16 Manufacture of wood and products of wood and cork, except furniture; | 16: Wood and of products of wood and cork (except furniture) |
| C17 manufacture of articles of straw and plaiting materials | 17T18: Paper products and printing |
| C18 Manufacture of paper and paper products | |
| C19 Manufacture of coke and refined petroleum products | 19: Coke and refined petroleum products |
| C20 Manufacture of chemicals and chemical products | 20T21: Chemicals and pharmaceutical products |
| C21 Manufacture of basic pharmaceutical products and pharmaceutical preparations | |
| C22 Manufacture of rubber and plastic products | 22: Rubber and plastics products |
| 23: Other non-metallic mineral products | |
| 24: Manufacture of basic metals | |
| 25: Fabricated metal products, except machinery and equipment | |
| 26: Computer, electronic and optical products | |
| 27: Electrical equipment | |
| 28: Machinery and equipment n.e.c. | |
| 29: Motor vehicles, trailers and semi-trailers | |
| 30: Other transport equipment | |
| C31 Manufacture of furniture | 31T33: Other manufacturing; repair and installation of machinery and equipment |
| D35 Electricity, gas, steam, and air conditioning supply | 35T39: Electricity, gas, water supply, sewerage, waste and remediation services |
| D3511 Production of electricity | |
| E36 Water collection, treatment, and supply | |
| E37 Sewerage | |
| E38 Waste collection, treatment, and disposal activities; materials recovery | |
| E39 Remediation activities and other waste management services | |
| F41 Construction of buildings | 41T43: Construction |
| F42 Civil engineering | |
| G46 Wholesale trade, except for motor vehicles and motorcycles | 45T47: Wholesale and retail trade; repair of motor vehicles |
| G47 Retail trade, except for motor vehicles and motorcycles | |
| H Transportation and storage | 49T53: Transportation and storage |
| I55 Accommodation | 55T56: Accommodation and food services |
| I56 Food and beverage service activities | |
| 58T60: Publishing, audio-visual and broadcasting activities | |
| 61: Telecommunications | |
| 62T63: IT and other information services | |
| 64T66: Financial and insurance activities | |
| 68: Real estate activities | |
| M7211 Research and experimental development on biotechnology | TTL_69T82: Other business sector services |
| 84: Public administration and defence; compulsory social security | |
| 85: Education | |
| 86T88: Human health and social work | |
| R9104 Botanical and zoological gardens and nature reserves activities | 90T96: Arts, entertainment, recreation and other service activities |
| 97T98: Private households with employed persons |
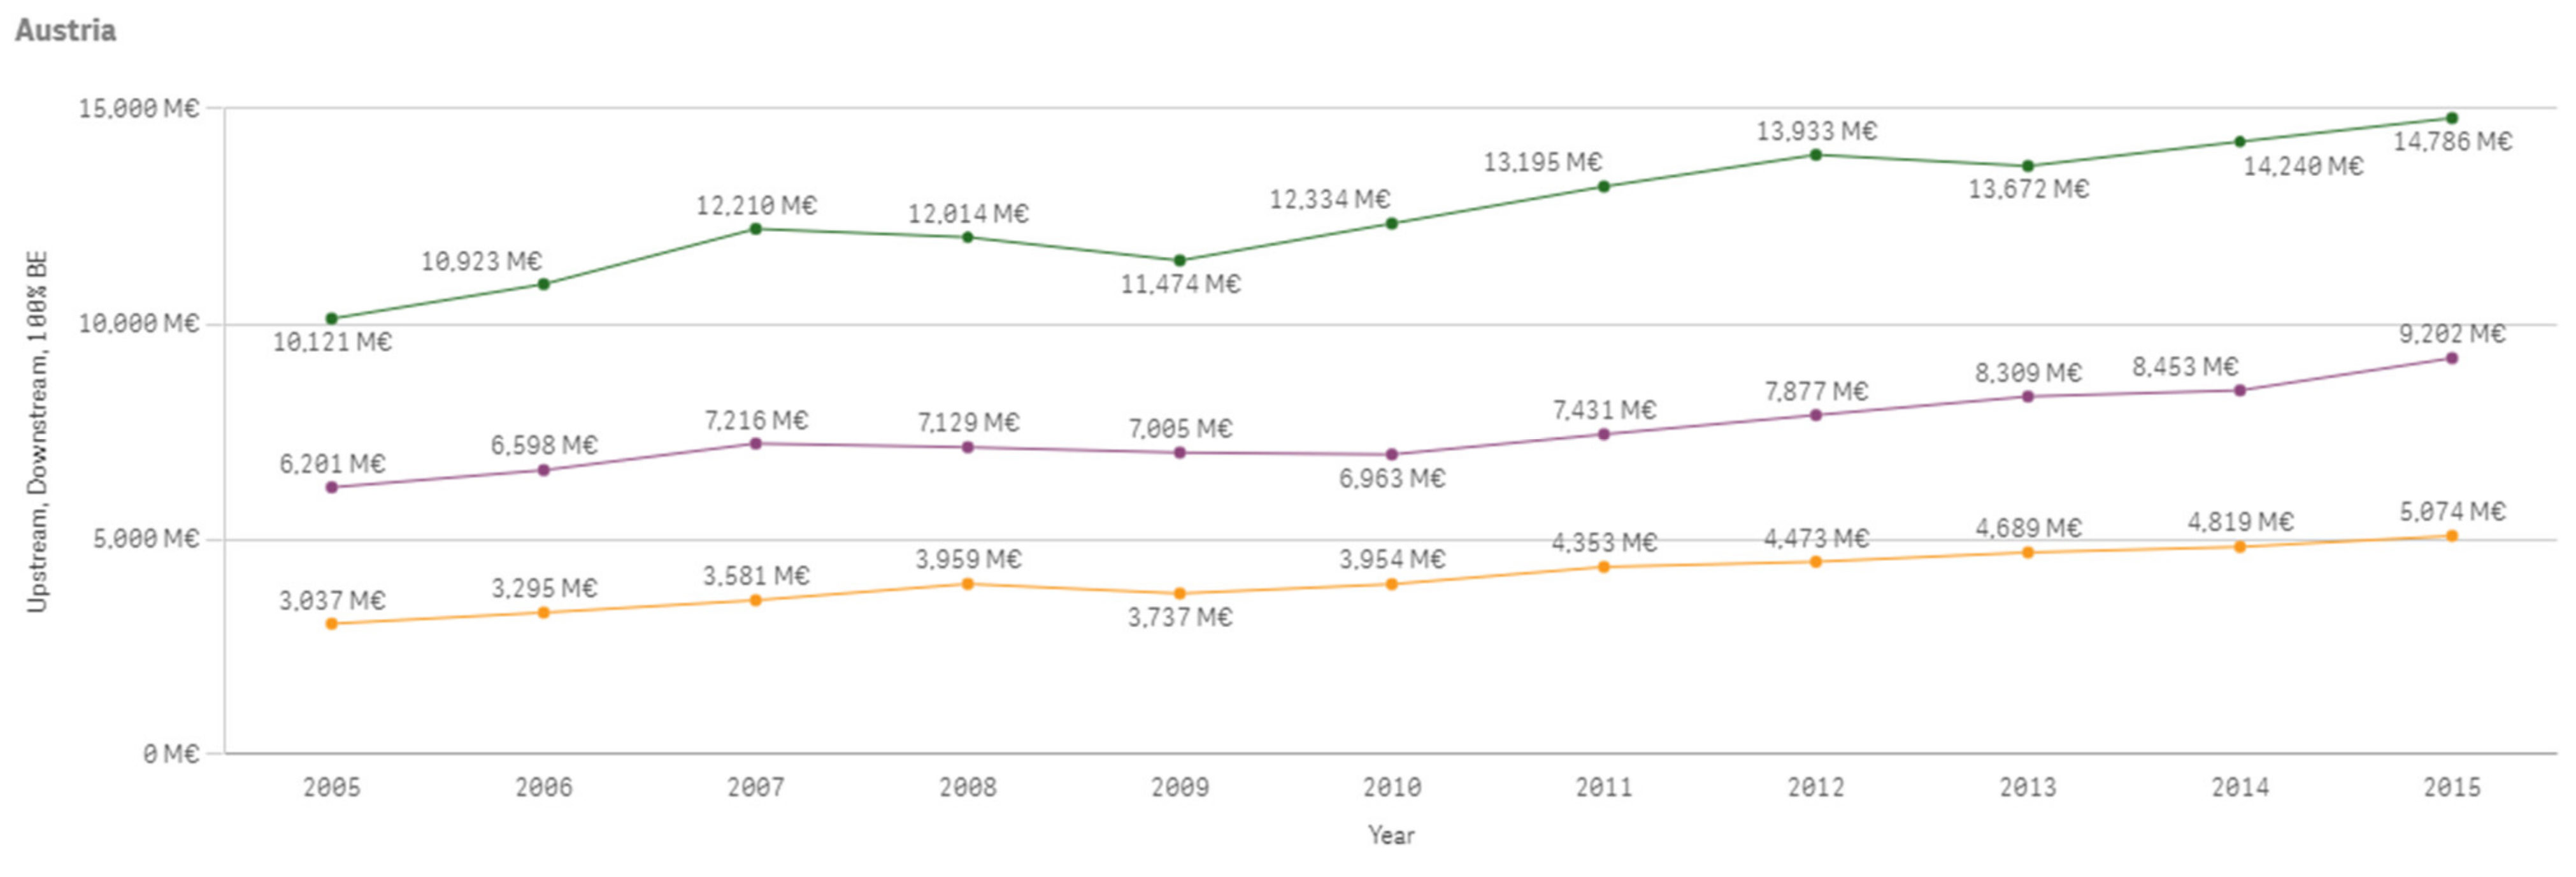
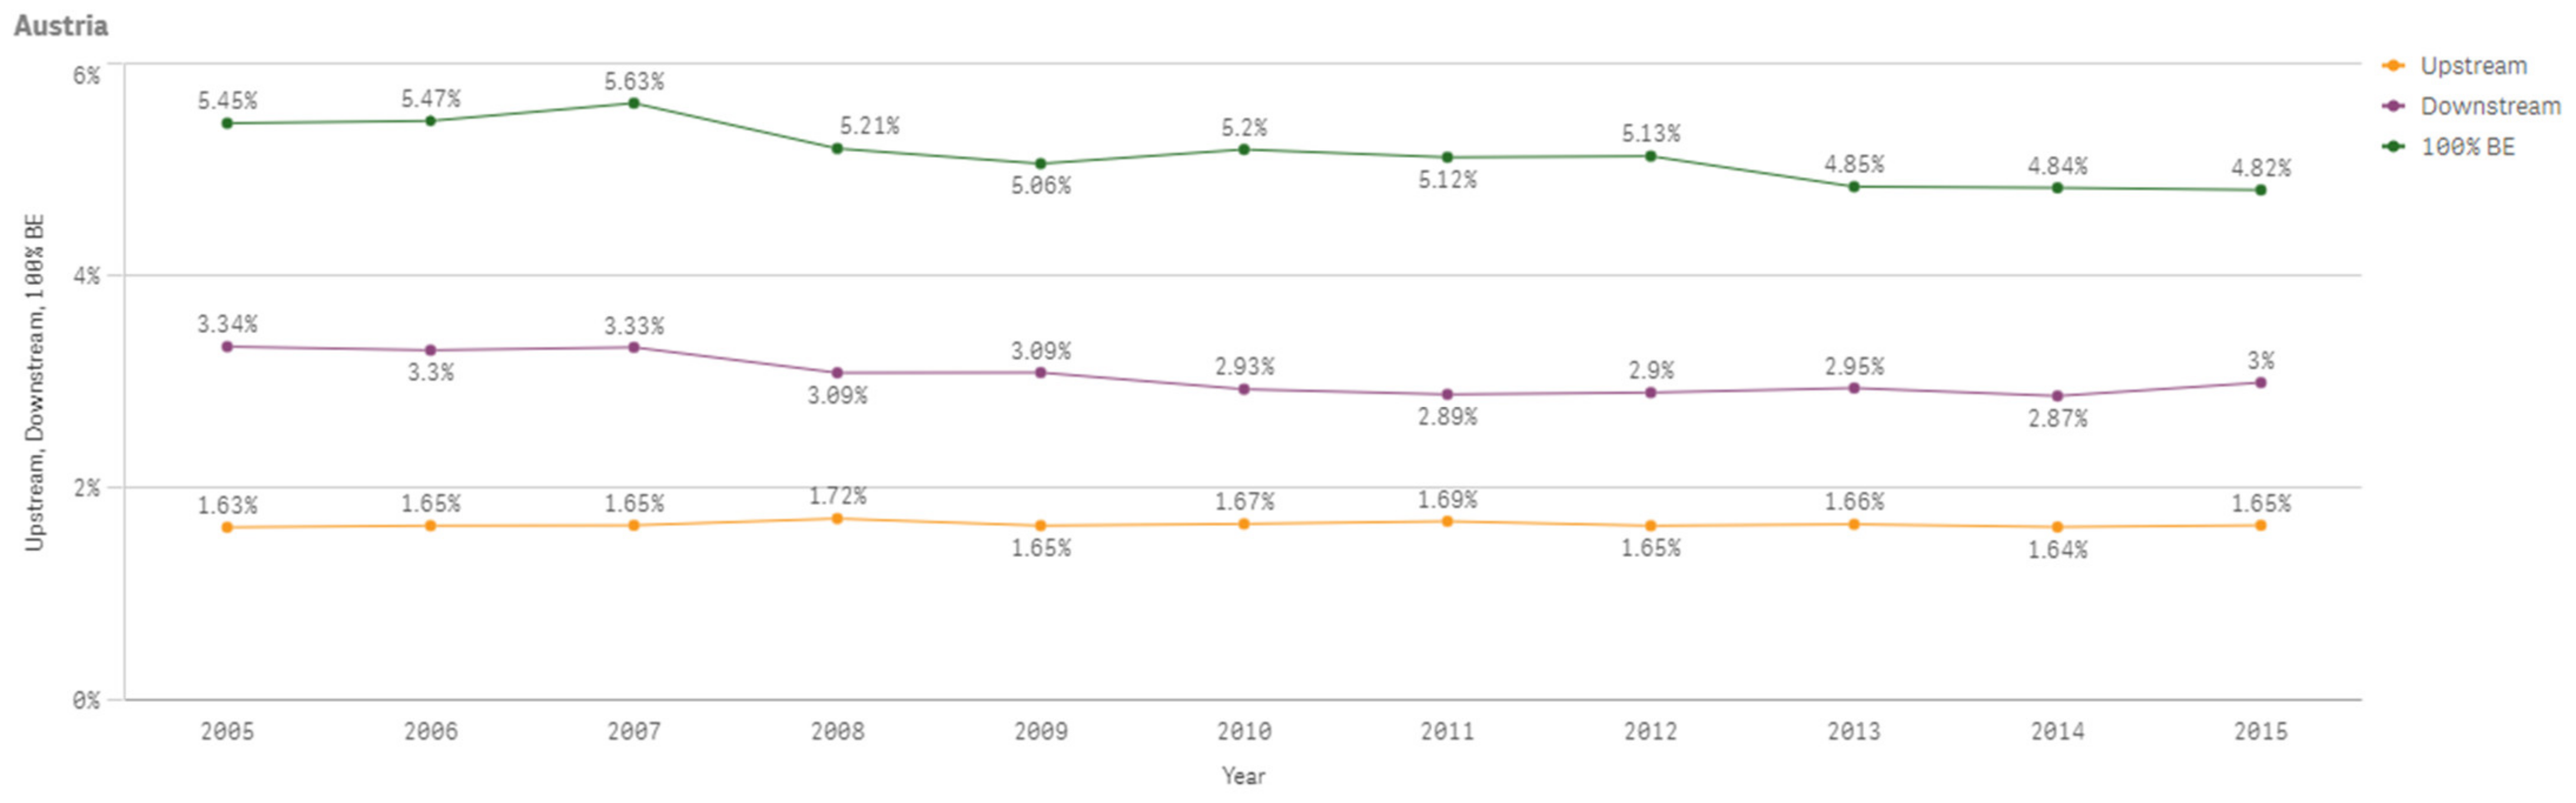
The following Figure A1 shows Austria’s 100% bioeconomy value added, downstream bioeconomy value added and upstream bioeconomy value added which are increasing overall between 2005 and 2015. Figure A2 shows the percentage changes of the same values compared to total value added of the economy.
Figure A1.
Austria 100% Bioeconomy Value Added, Downstream and Upstream Bioeconomy Value Added 2005–2015.
Figure A1.
Austria 100% Bioeconomy Value Added, Downstream and Upstream Bioeconomy Value Added 2005–2015.

Figure A2.
Austria 100% Bioeconomy Value Added, Downstream and Upstream Bioeconomy Value Added Shares 2005–2015.
Figure A2.
Austria 100% Bioeconomy Value Added, Downstream and Upstream Bioeconomy Value Added Shares 2005–2015.

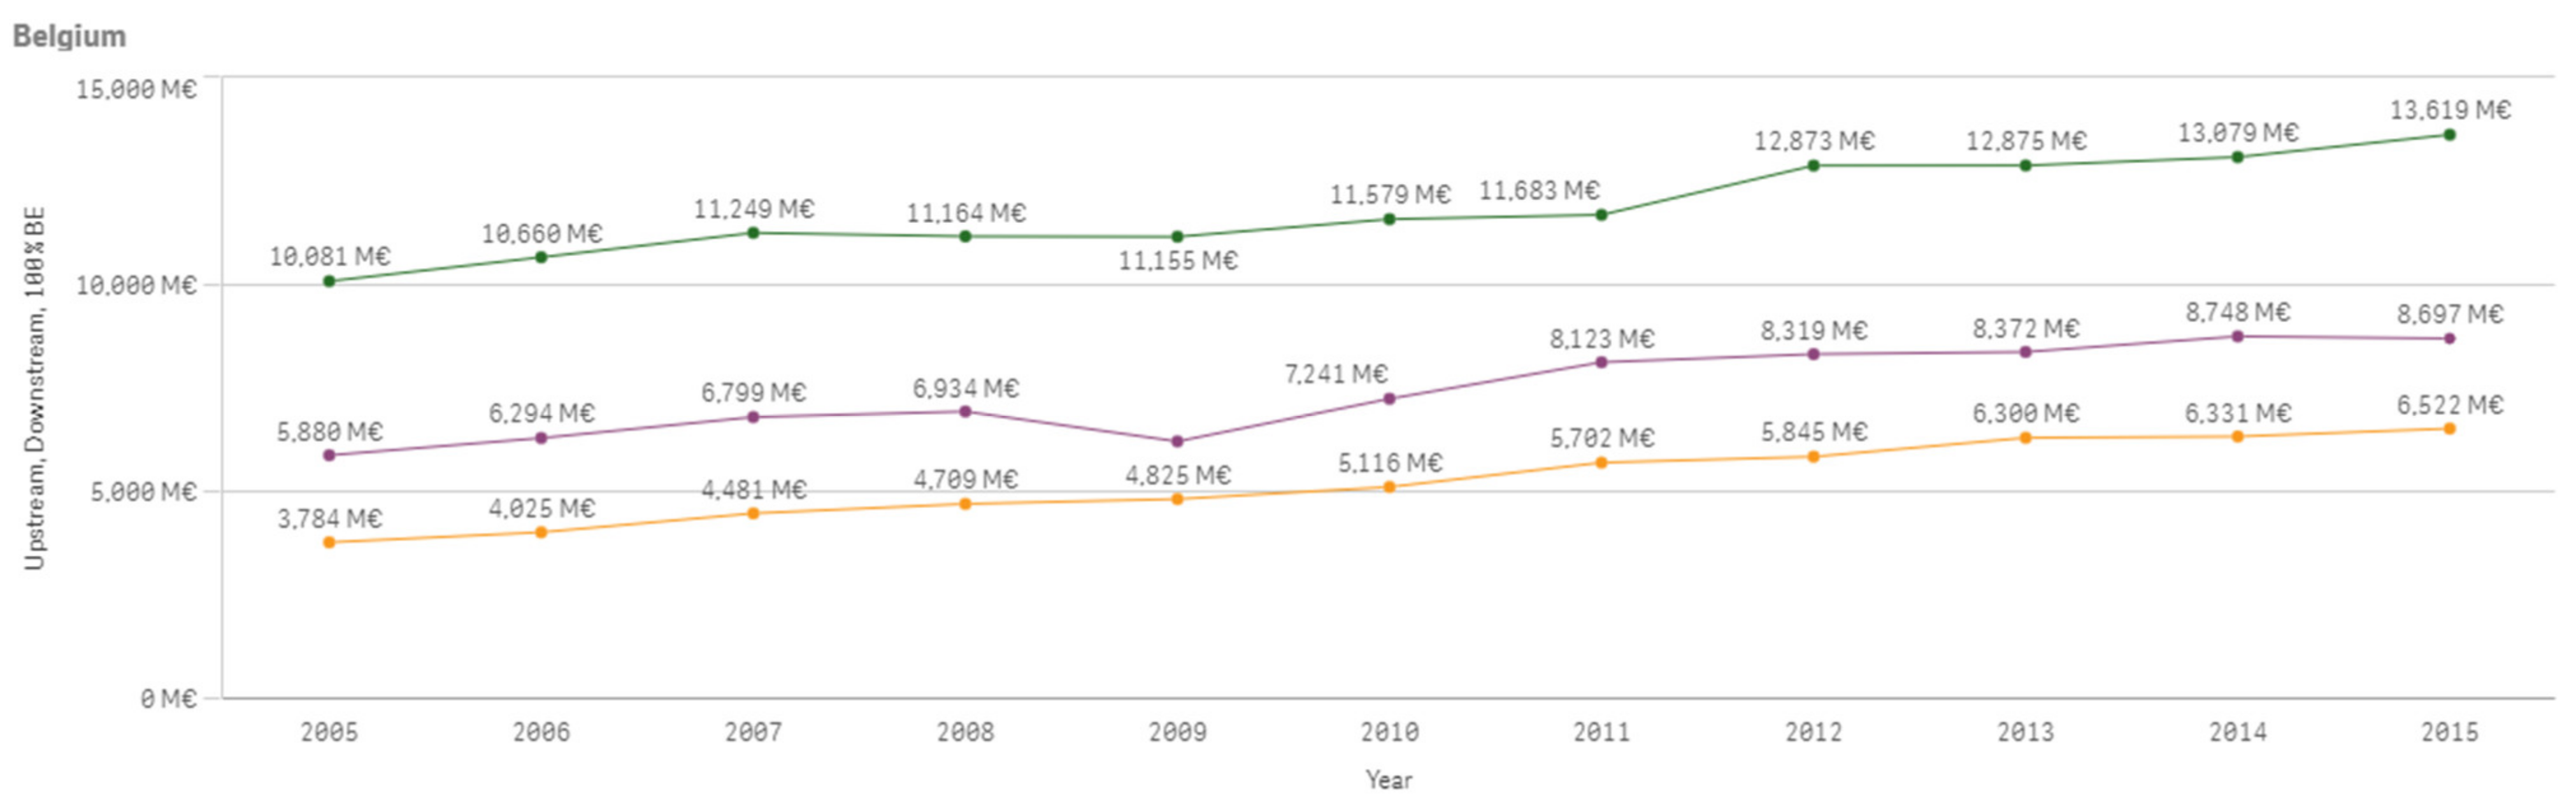
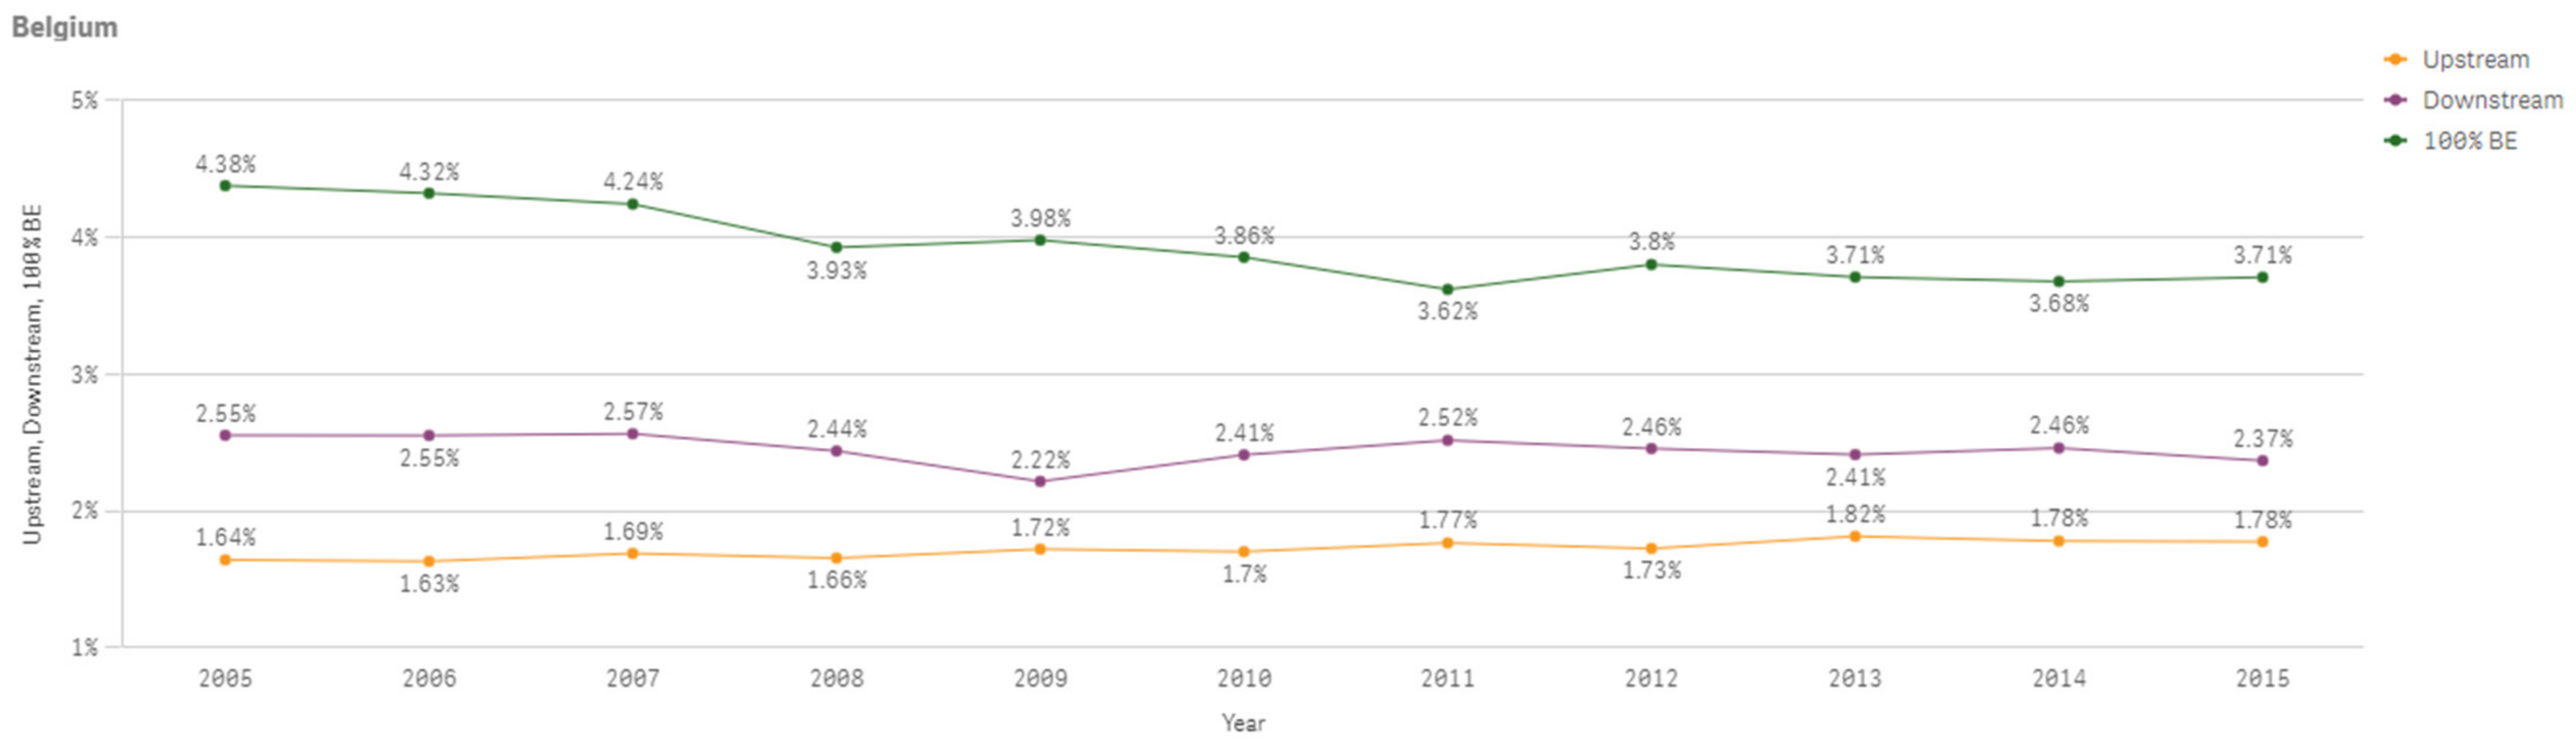
The following Figure A3 shows Belgium’s 100% bioeconomy value added, downstream bioeconomy value added and upstream bioeconomy value added which are increasing overall between 2005 and 2015. Figure A4 shows the percentage changes of the same values compared to total value added of the economy.
Figure A3.
Belgium 100% Bioeconomy Value Added, Downstream and Upstream Bioeconomy Value Added 2005–2015.
Figure A3.
Belgium 100% Bioeconomy Value Added, Downstream and Upstream Bioeconomy Value Added 2005–2015.

Figure A4.
Belgium 100% Bioeconomy Value Added, Downstream and Upstream Bioeconomy Value Added Shares 2005–2015.
Figure A4.
Belgium 100% Bioeconomy Value Added, Downstream and Upstream Bioeconomy Value Added Shares 2005–2015.

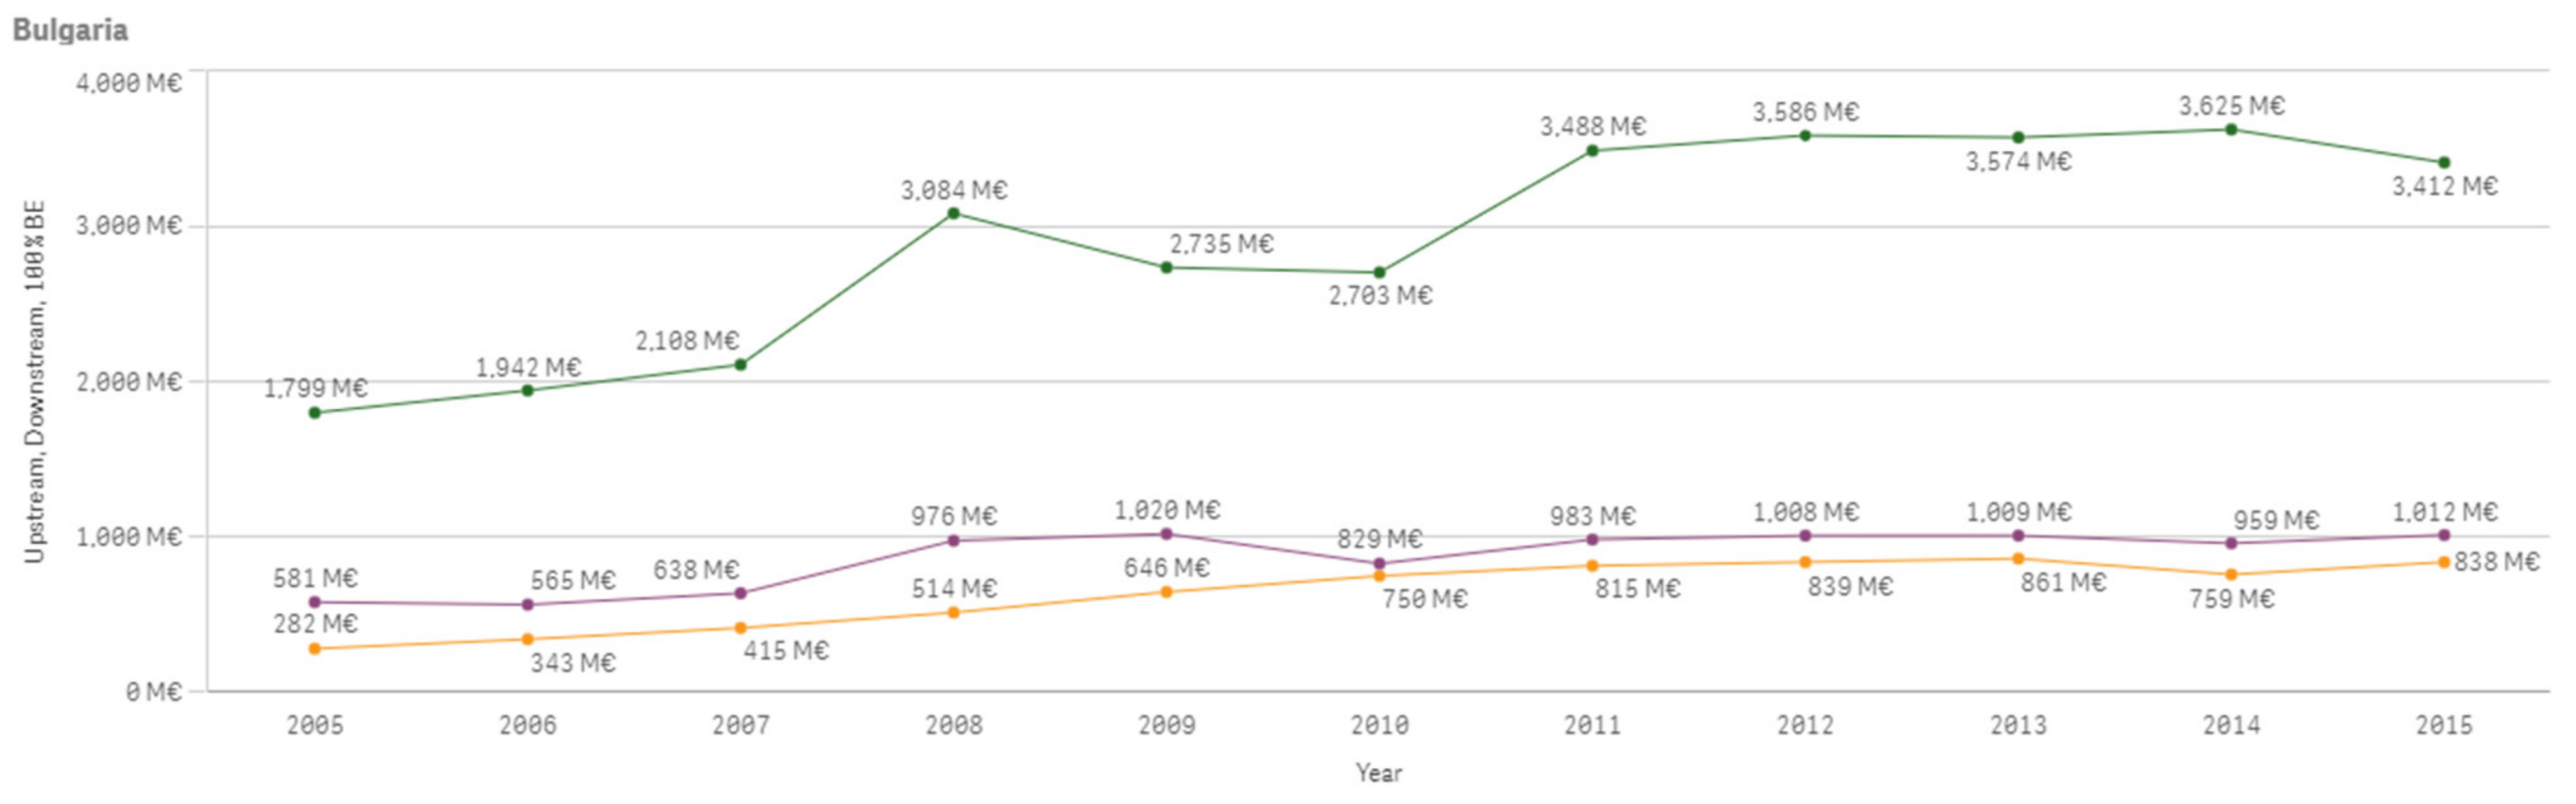
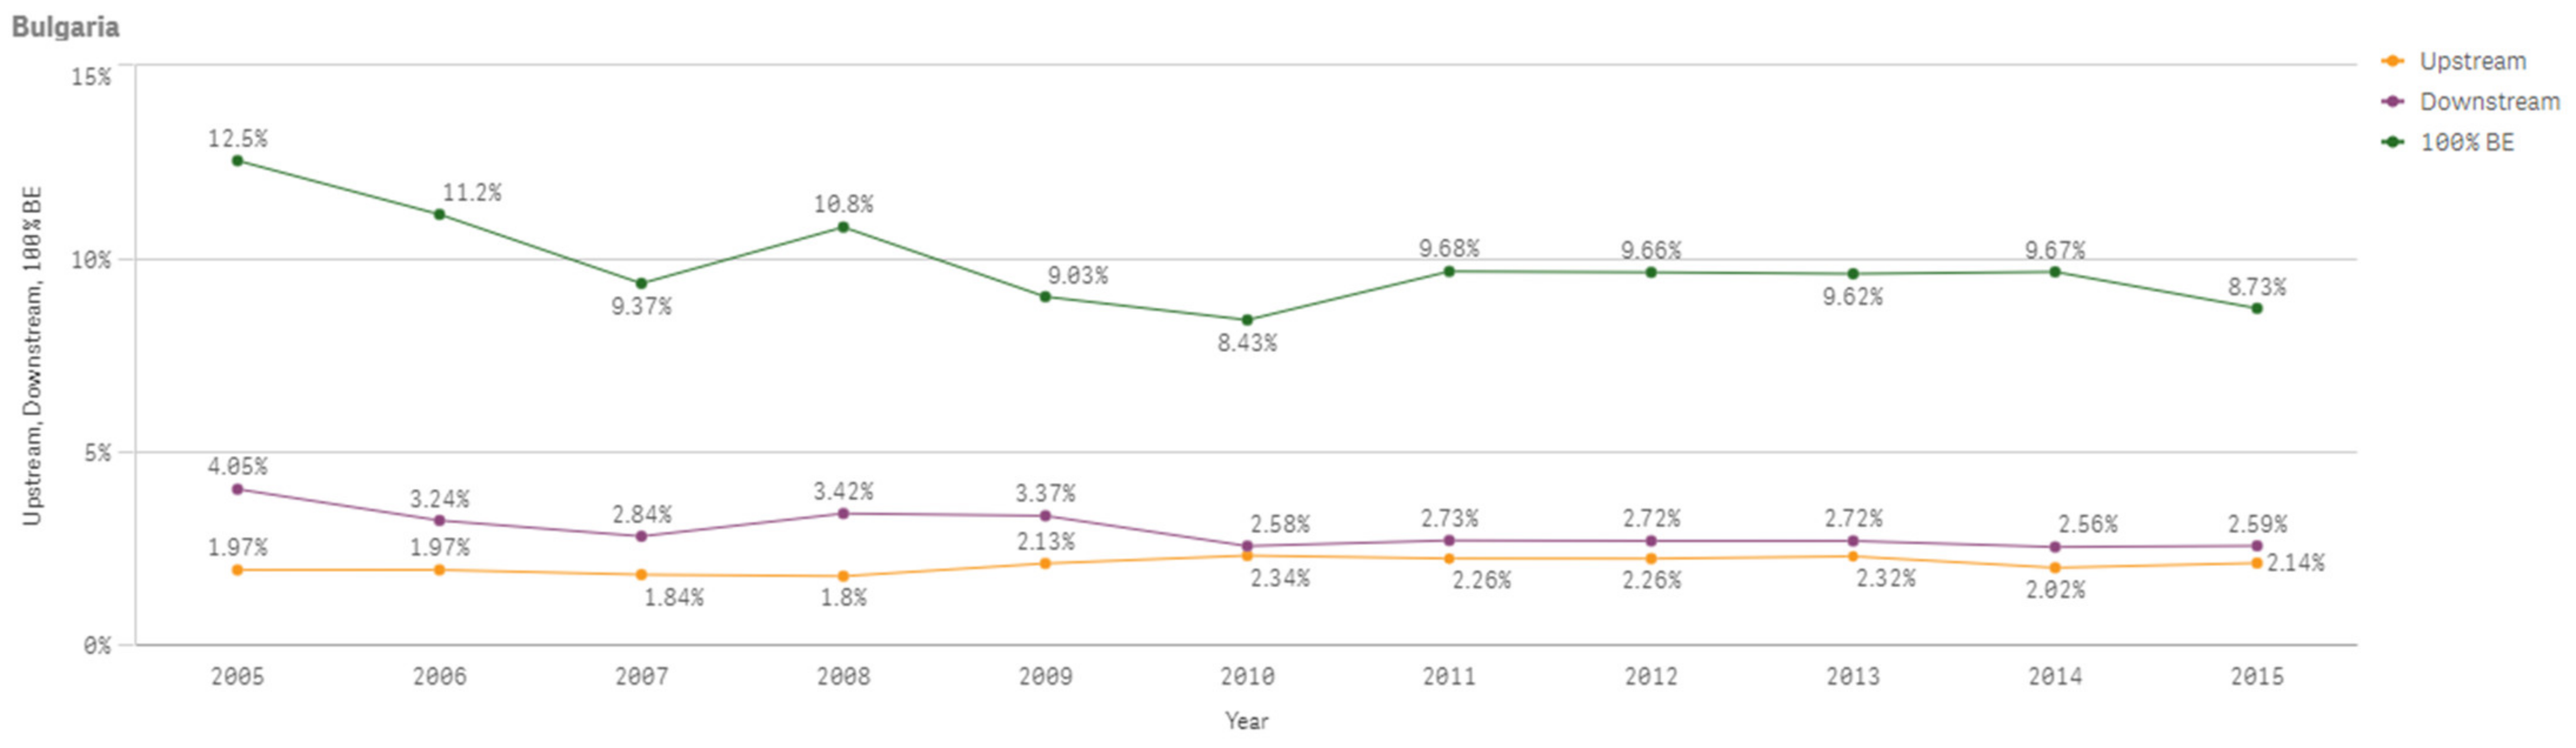
The following Figure A5 shows Bulgaria’s 100% bioeconomy value added, downstream bioeconomy value added and upstream bioeconomy value added which are increasing overall between 2005 and 2015. Figure A6 shows the percentage changes of the same values compared to total value added of the economy.
Figure A5.
Bulgaria 100% Bioeconomy Value Added, Downstream and Upstream Bioeconomy Value Added 2005–2015.
Figure A5.
Bulgaria 100% Bioeconomy Value Added, Downstream and Upstream Bioeconomy Value Added 2005–2015.

Figure A6.
Bulgaria 100% Bioeconomy Value Added, Downstream and Upstream Bioeconomy Value Added Shares 2005–2015.
Figure A6.
Bulgaria 100% Bioeconomy Value Added, Downstream and Upstream Bioeconomy Value Added Shares 2005–2015.

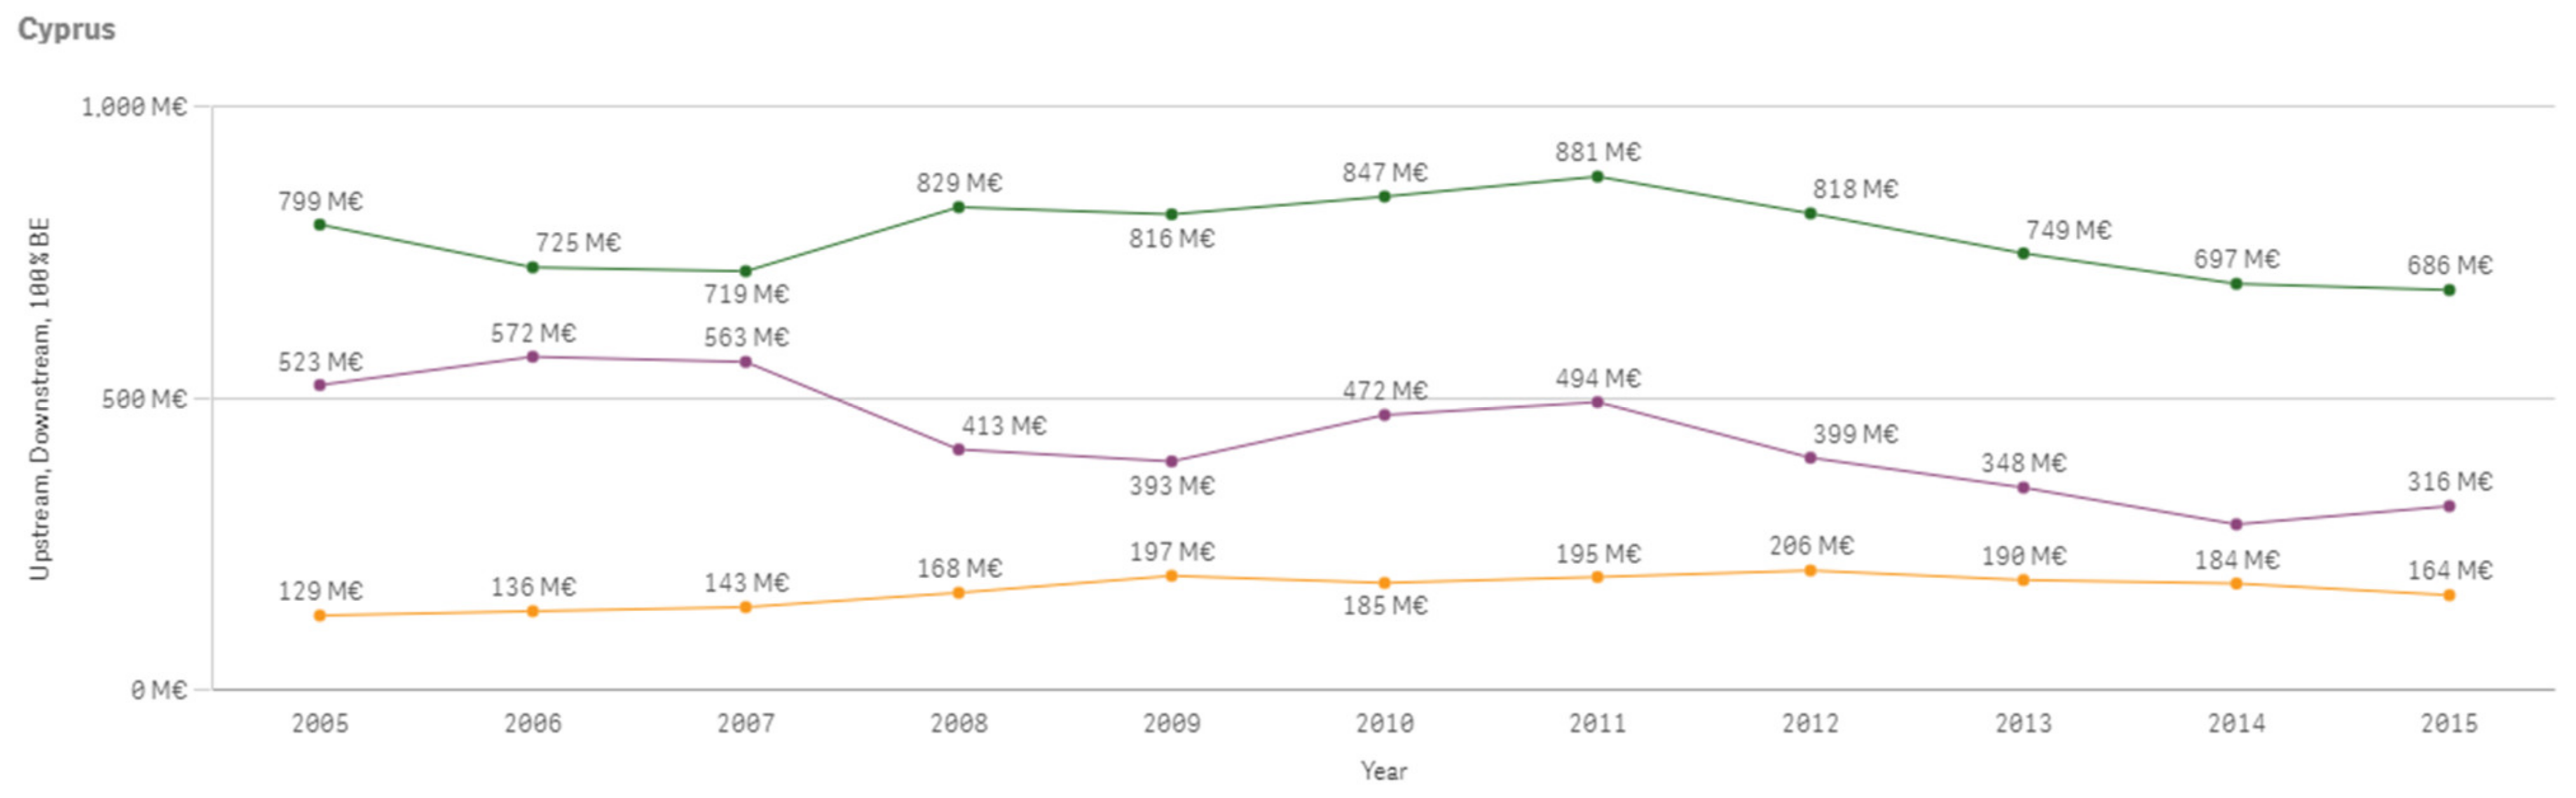
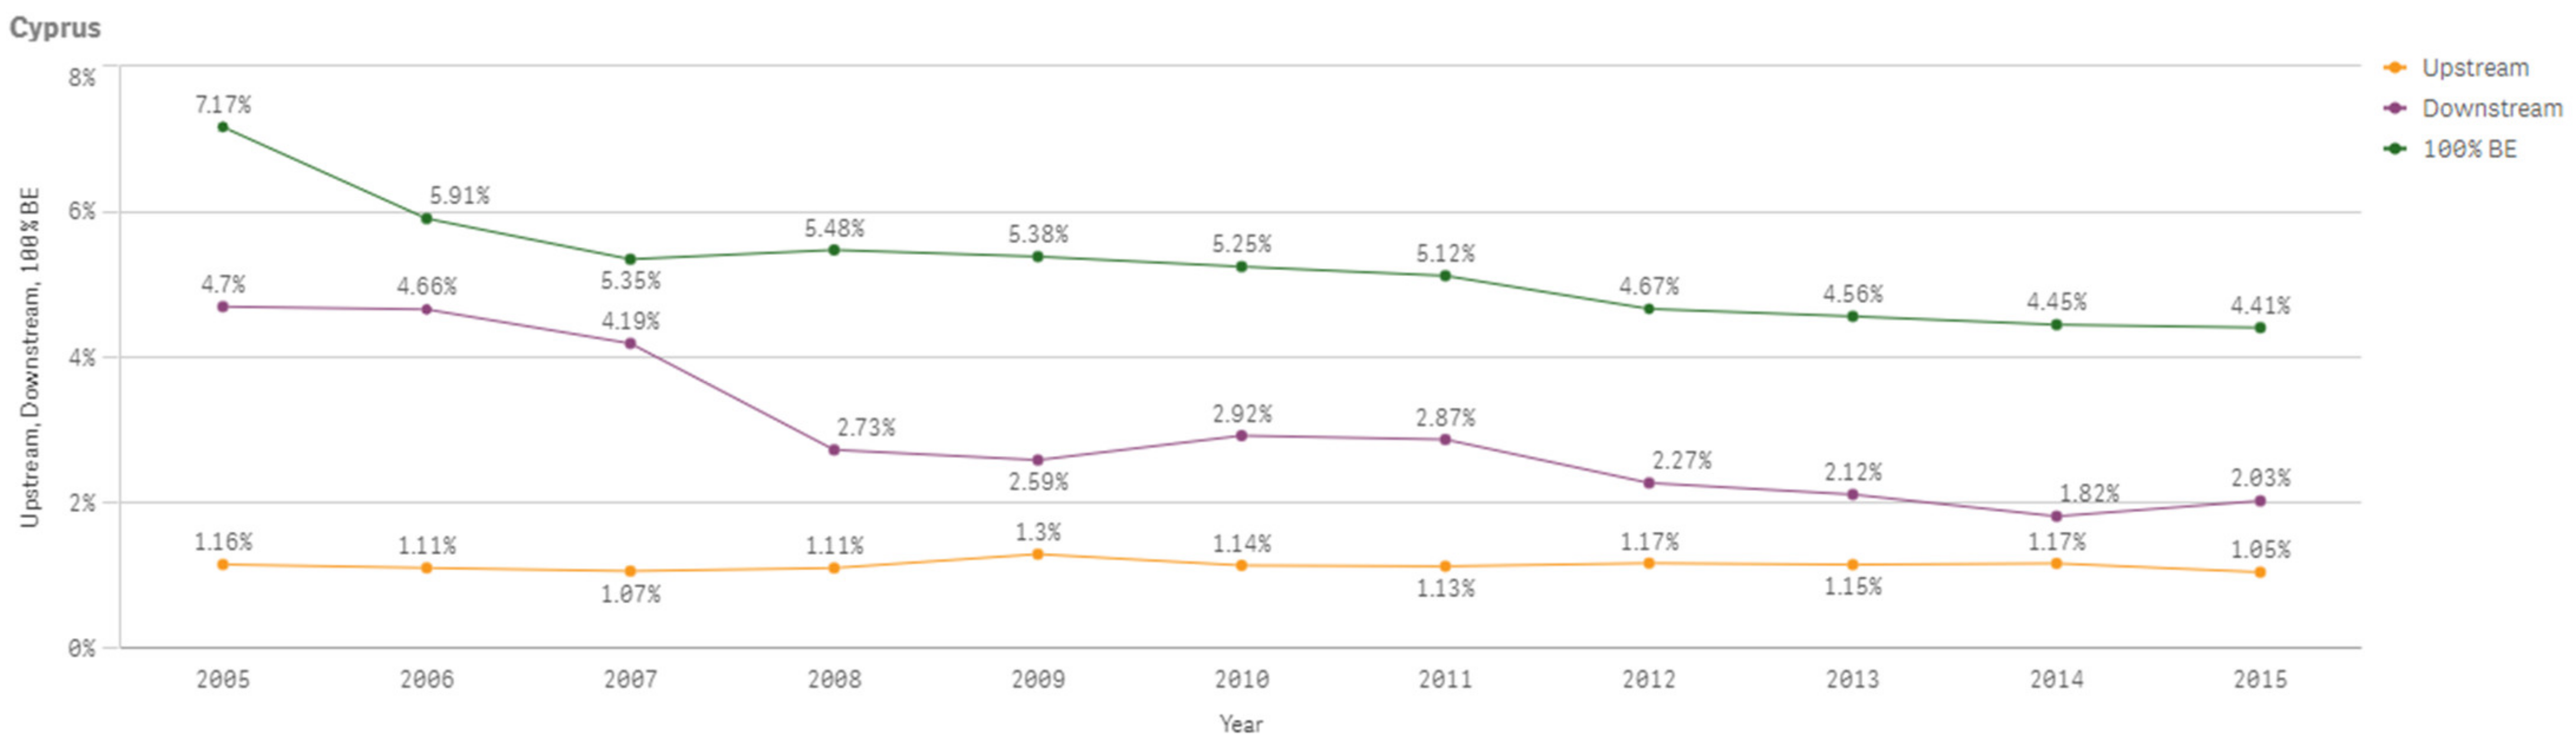
The following Figure A7 shows Cyprus’s 100% bioeconomy value added, downstream bioeconomy value added and upstream bioeconomy value added which are, respectively, decreasing, decreasing and increasing overall between 2005 and 2015. Figure A8 shows the percentage changes of the same values compared to total value added of the economy.
Figure A7.
Cyprus 100% Bioeconomy Value Added, Downstream and Upstream Bioeconomy Value Added 2005–2015.
Figure A7.
Cyprus 100% Bioeconomy Value Added, Downstream and Upstream Bioeconomy Value Added 2005–2015.

Figure A8.
Cyprus 100% Bioeconomy Value Added, Downstream and Upstream Bioeconomy Value Added Shares 2005–2015.
Figure A8.
Cyprus 100% Bioeconomy Value Added, Downstream and Upstream Bioeconomy Value Added Shares 2005–2015.

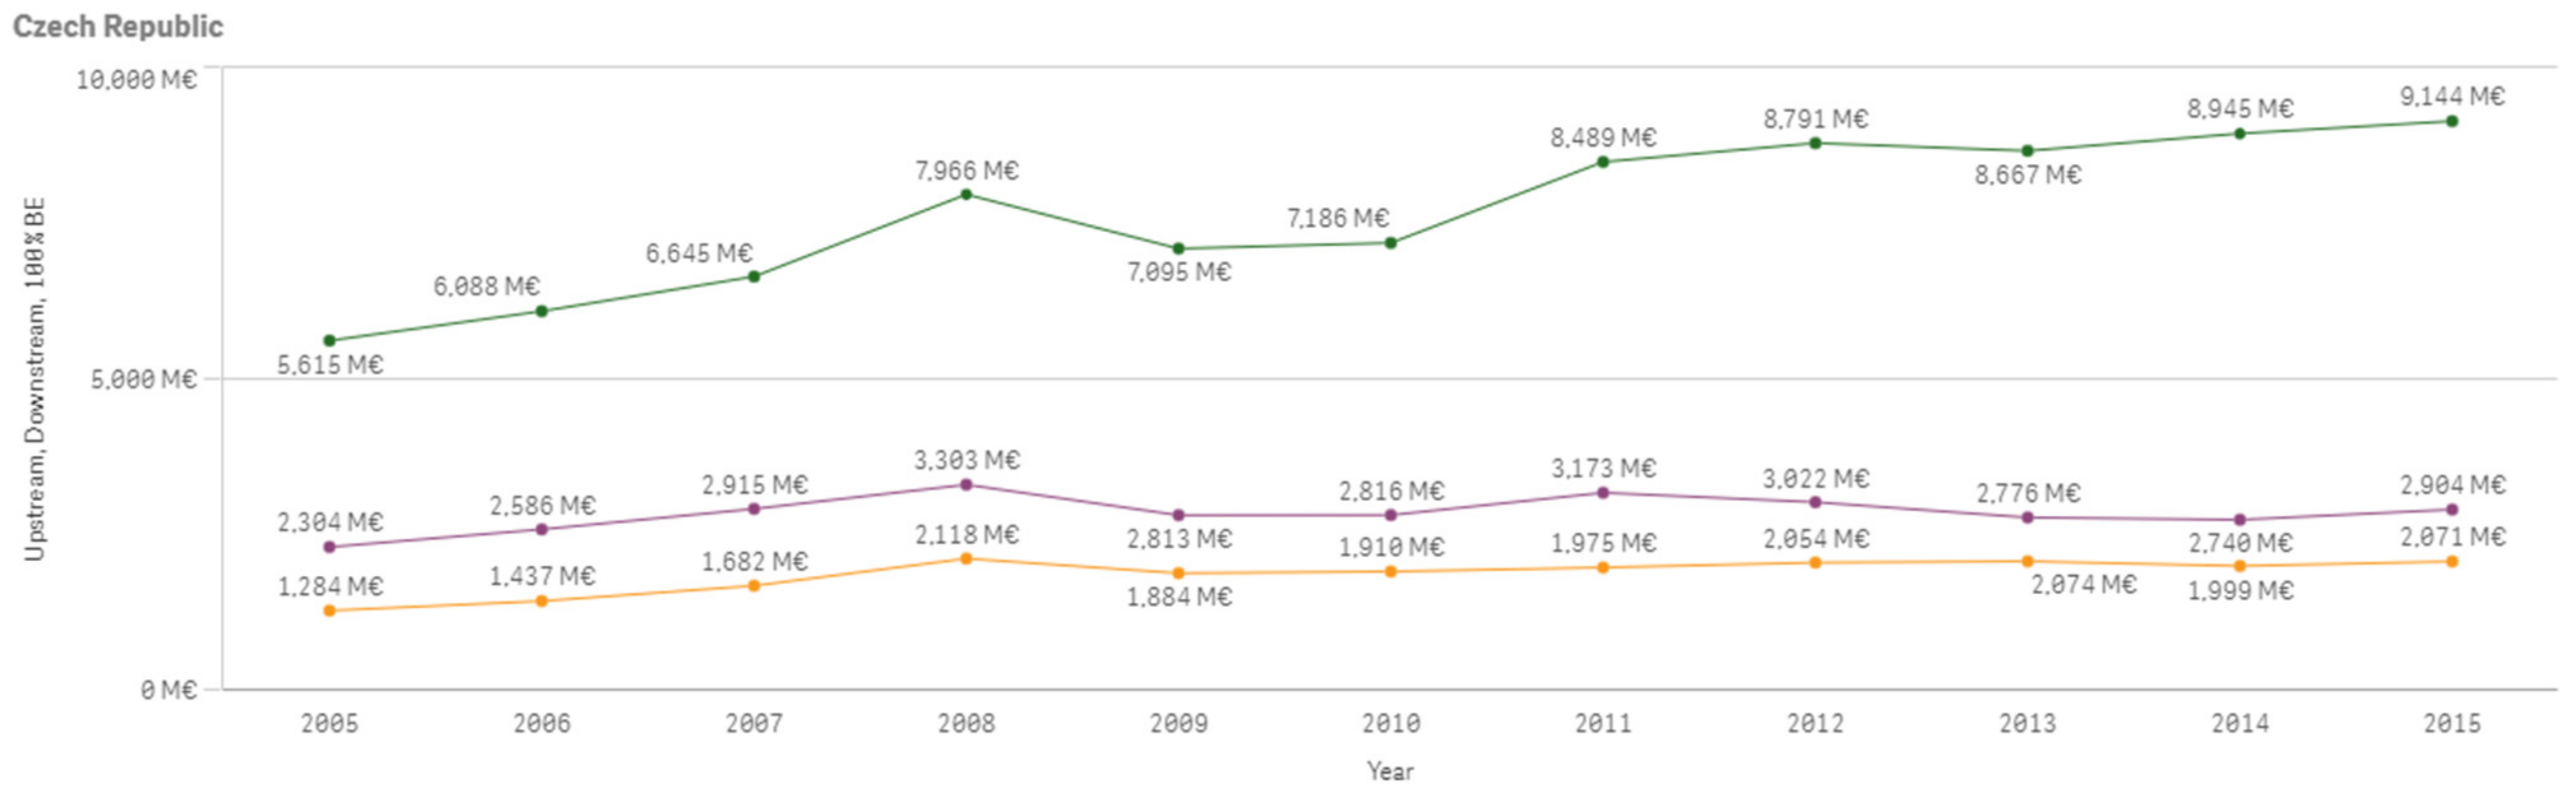
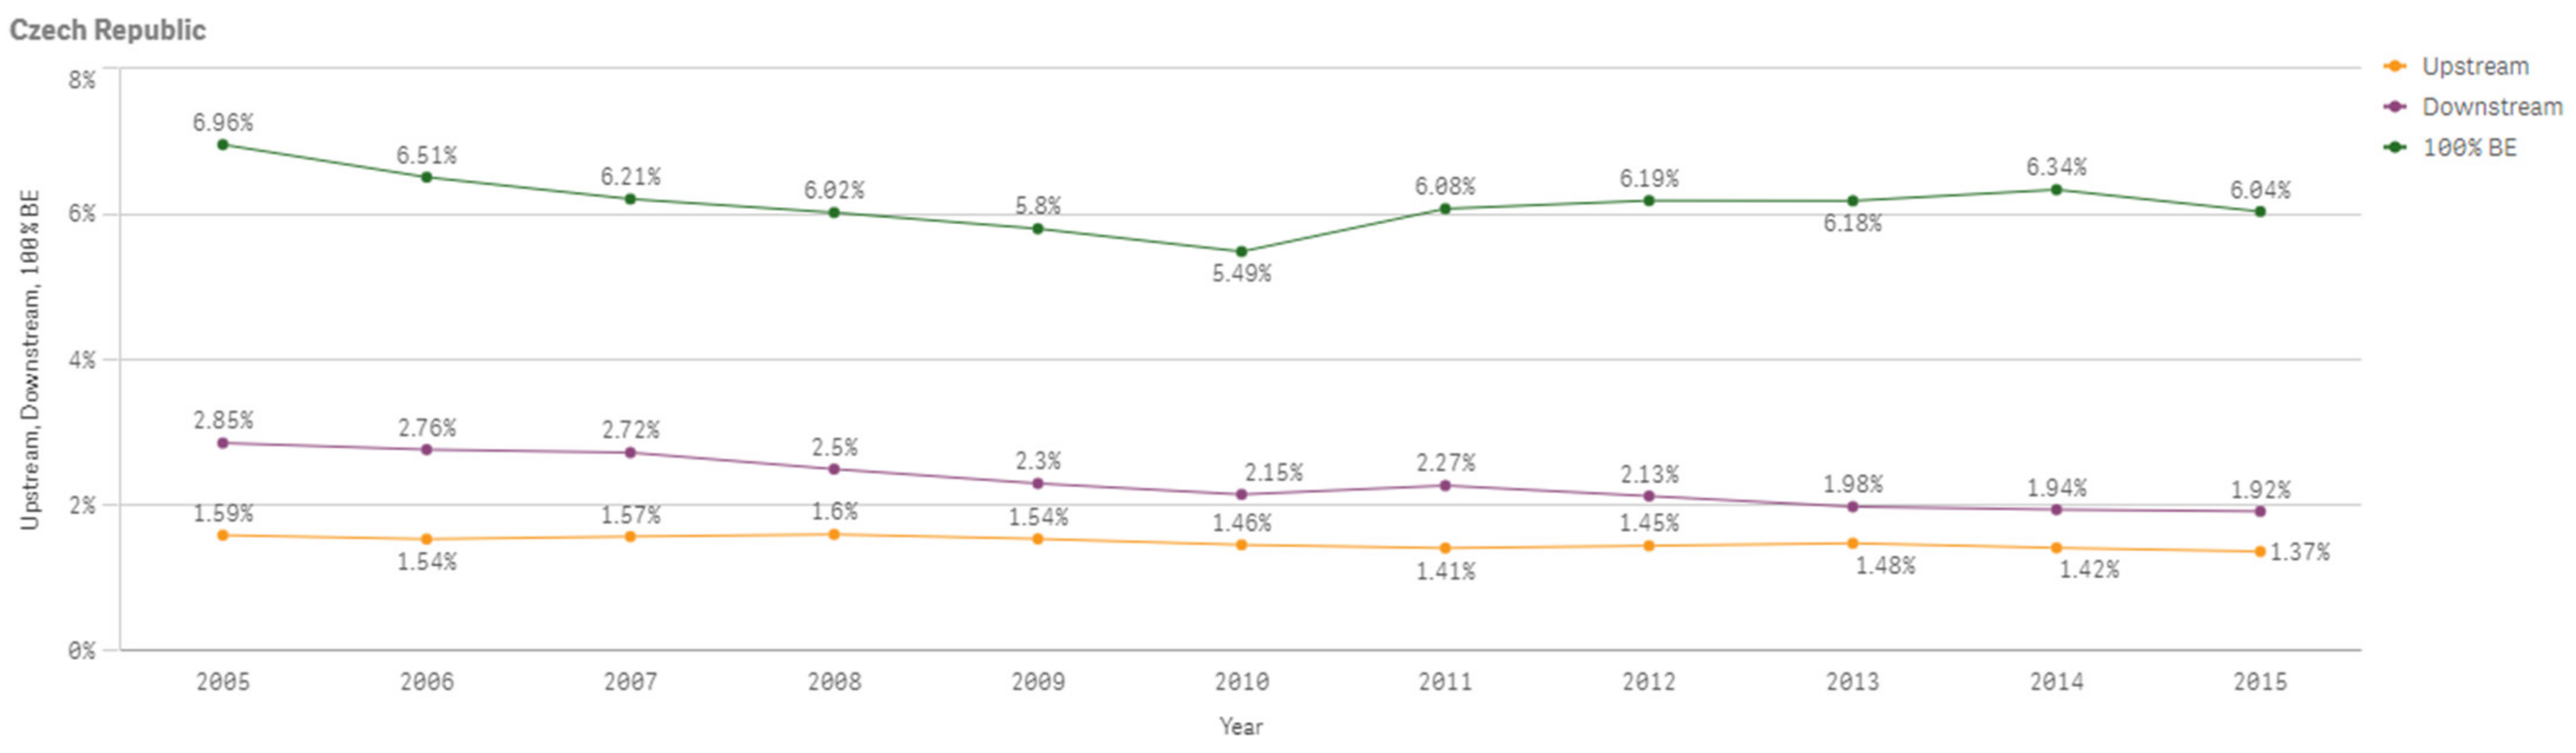
The following Figure A9 shows Czech Republic’s 100% bioeconomy value added, downstream bioeconomy value added and upstream bioeconomy value added which are increasing overall between 2005 and 2015. Figure A10 shows the percentage changes of the same values compared to total value added of the economy.
Figure A9.
Czech Republic 100% Bioeconomy Value Added, Downstream and Upstream Bioeconomy Value Added 2005–2015.
Figure A9.
Czech Republic 100% Bioeconomy Value Added, Downstream and Upstream Bioeconomy Value Added 2005–2015.

Figure A10.
Czech Republic 100% Bioeconomy Value Added, Downstream and Upstream Bioeconomy Value Added Shares 2005–2015.
Figure A10.
Czech Republic 100% Bioeconomy Value Added, Downstream and Upstream Bioeconomy Value Added Shares 2005–2015.

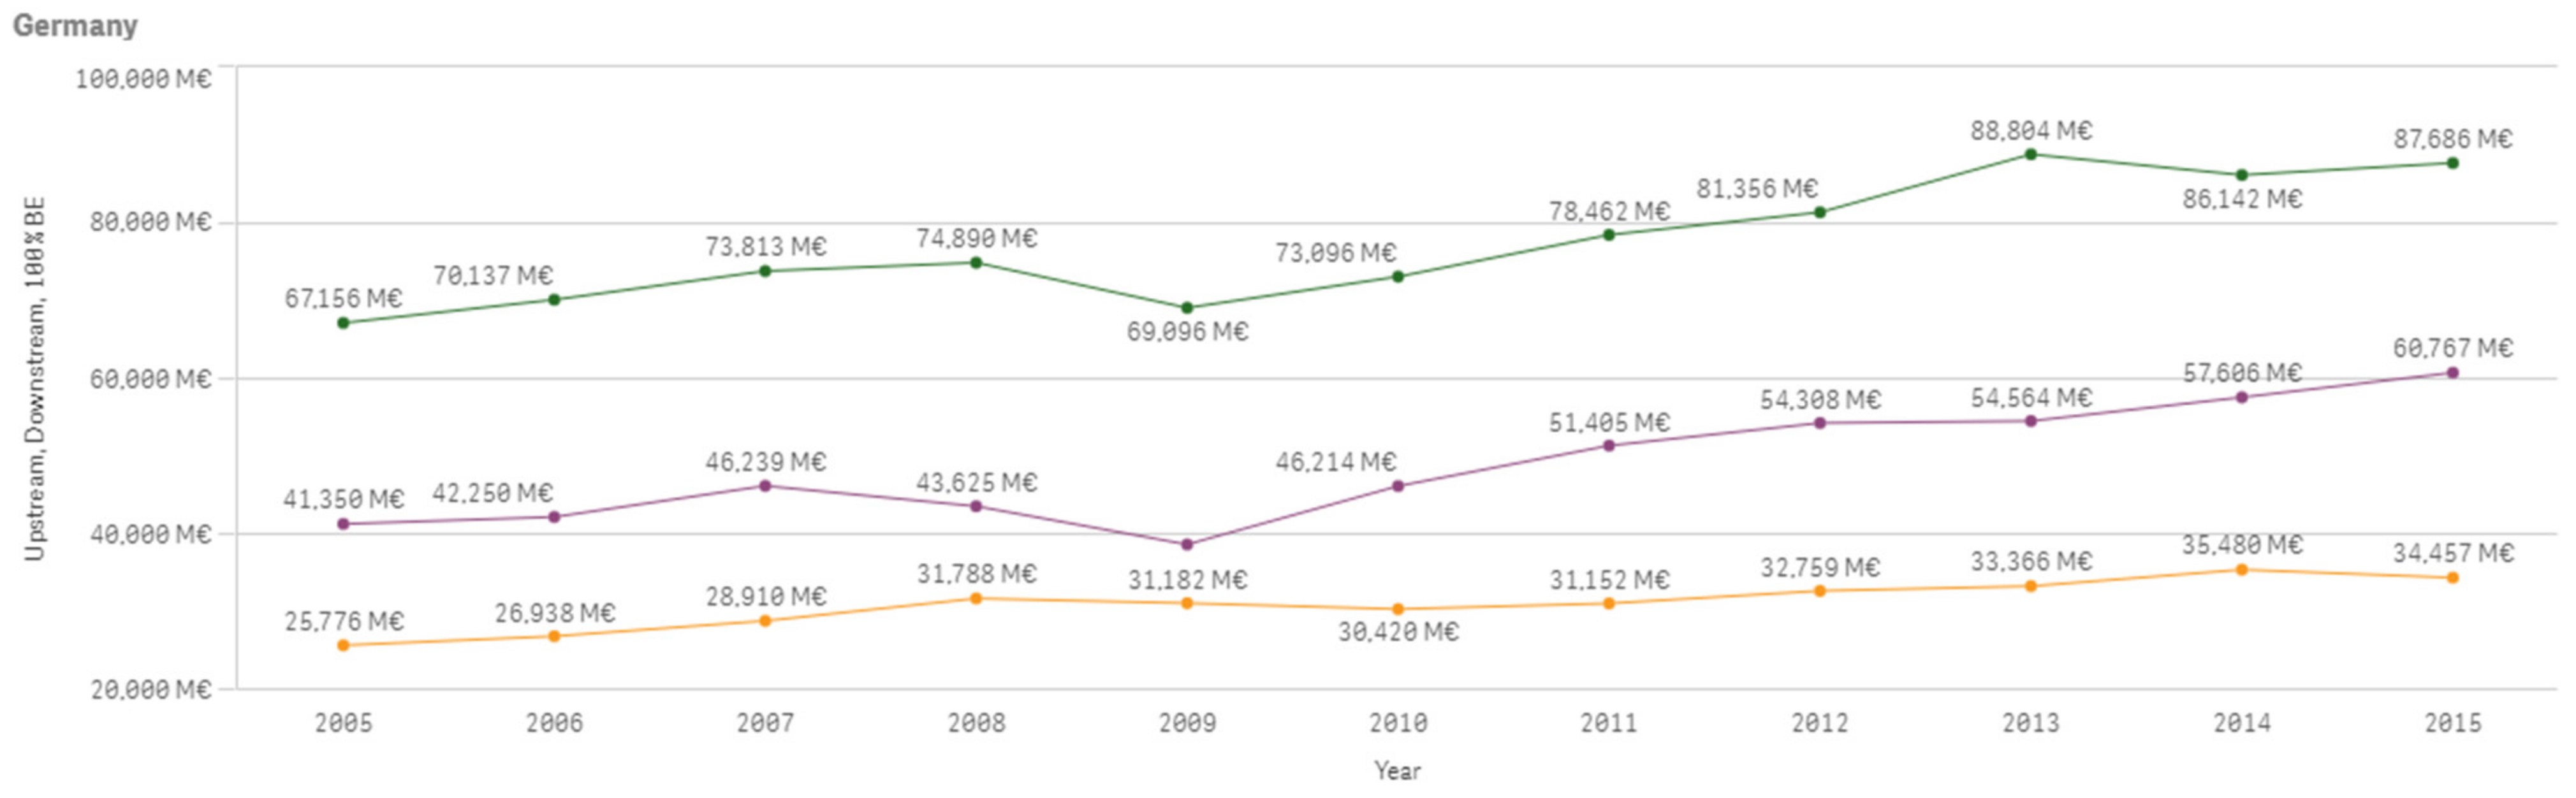
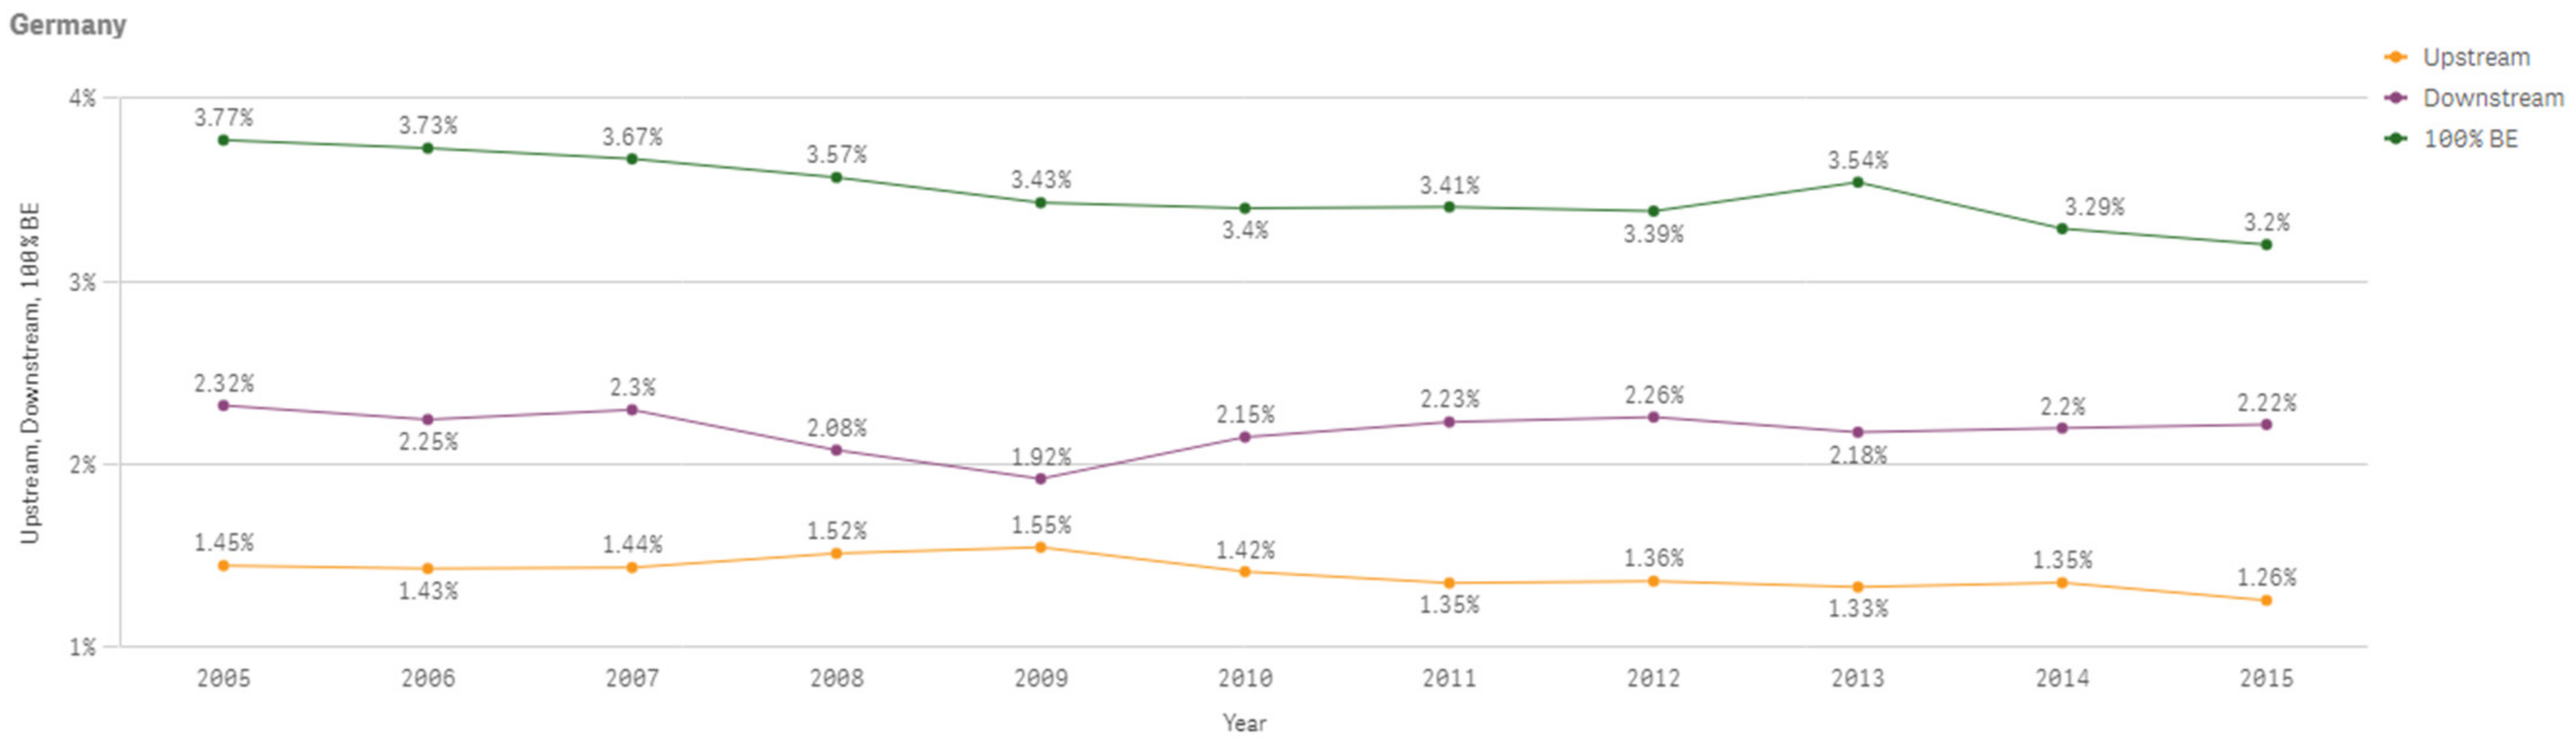
The following Figure A11 shows Germany’s 100% bioeconomy value added, downstream bioeconomy value added and upstream bioeconomy value added which are increasing overall between 2005 and 2015. Figure A12 shows the percentage changes of the same values compared to total value added of the economy.
Figure A11.
Germany 100% Bioeconomy Value Added, Downstream and Upstream Bioeconomy Value Added 2005–2015.
Figure A11.
Germany 100% Bioeconomy Value Added, Downstream and Upstream Bioeconomy Value Added 2005–2015.

Figure A12.
Germany 100% Bioeconomy Value Added, Downstream and Upstream Bioeconomy Value Added Shares 2005–2015.
Figure A12.
Germany 100% Bioeconomy Value Added, Downstream and Upstream Bioeconomy Value Added Shares 2005–2015.

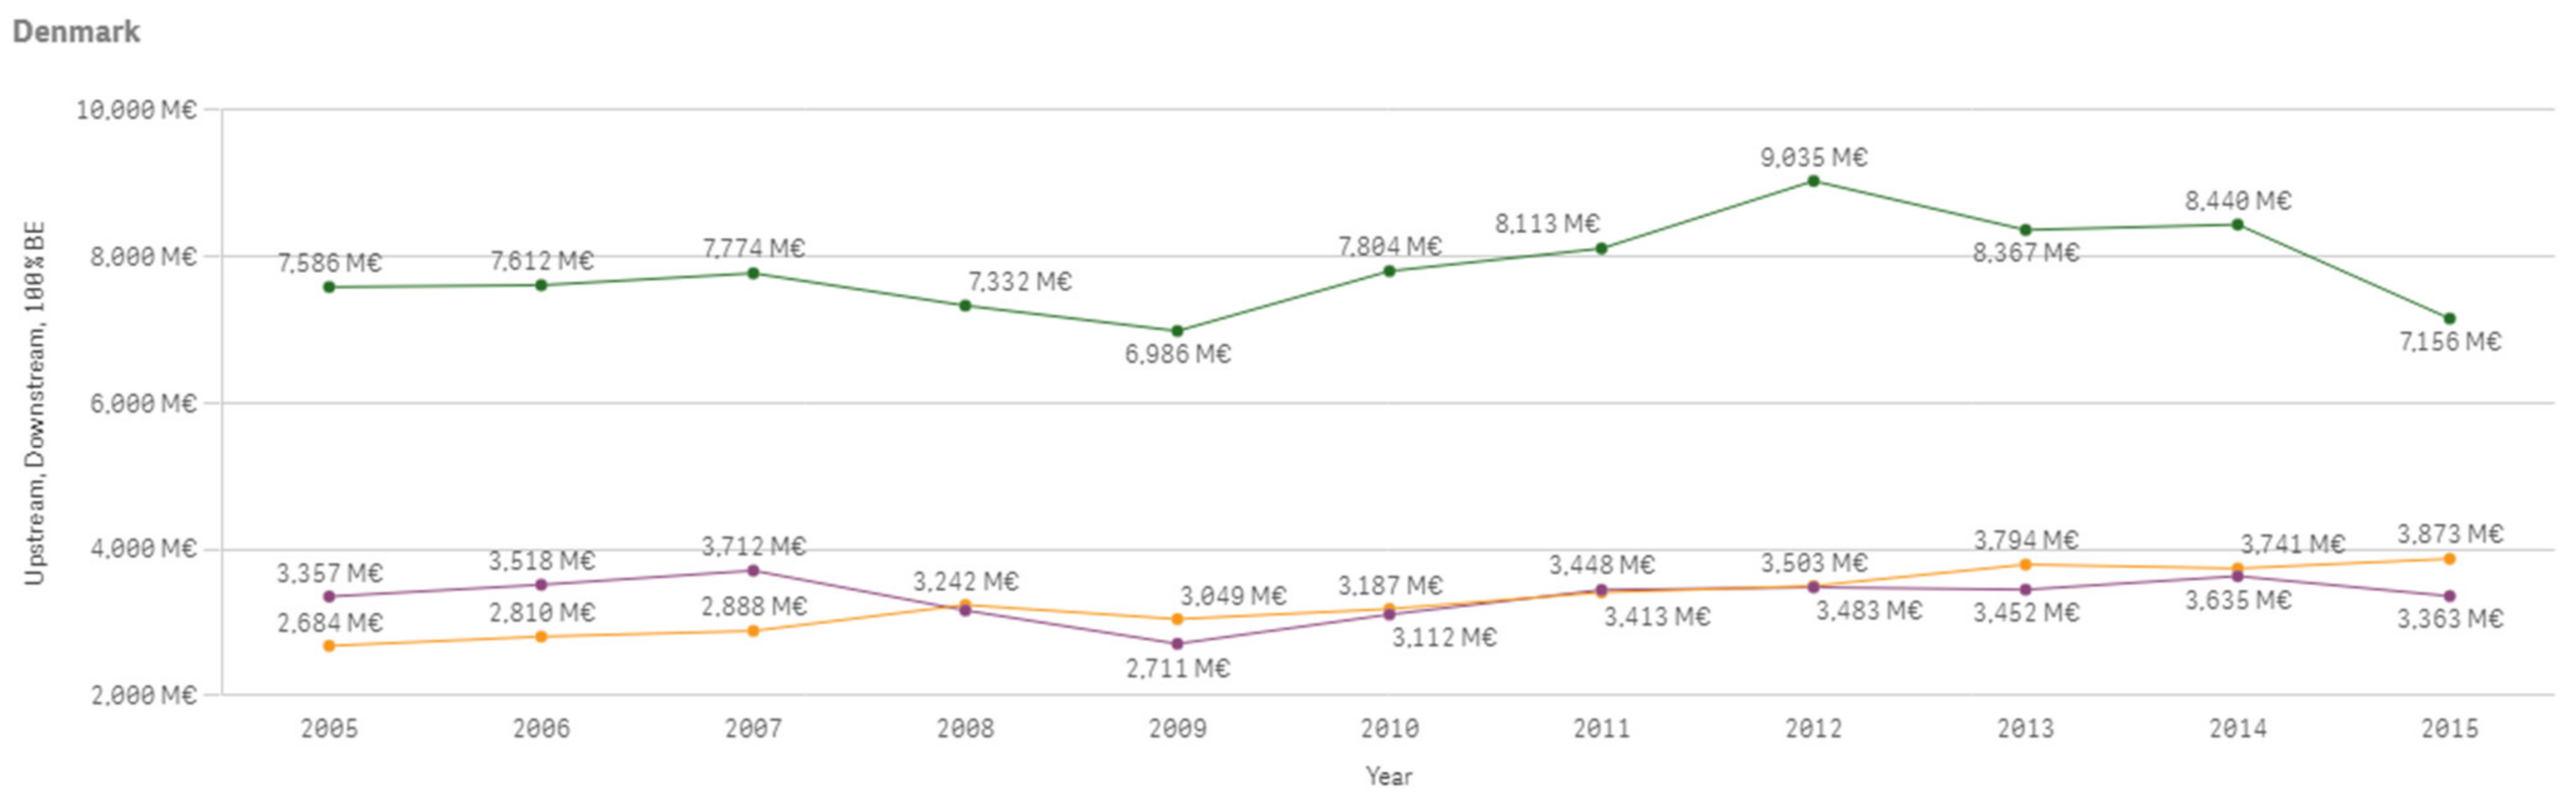
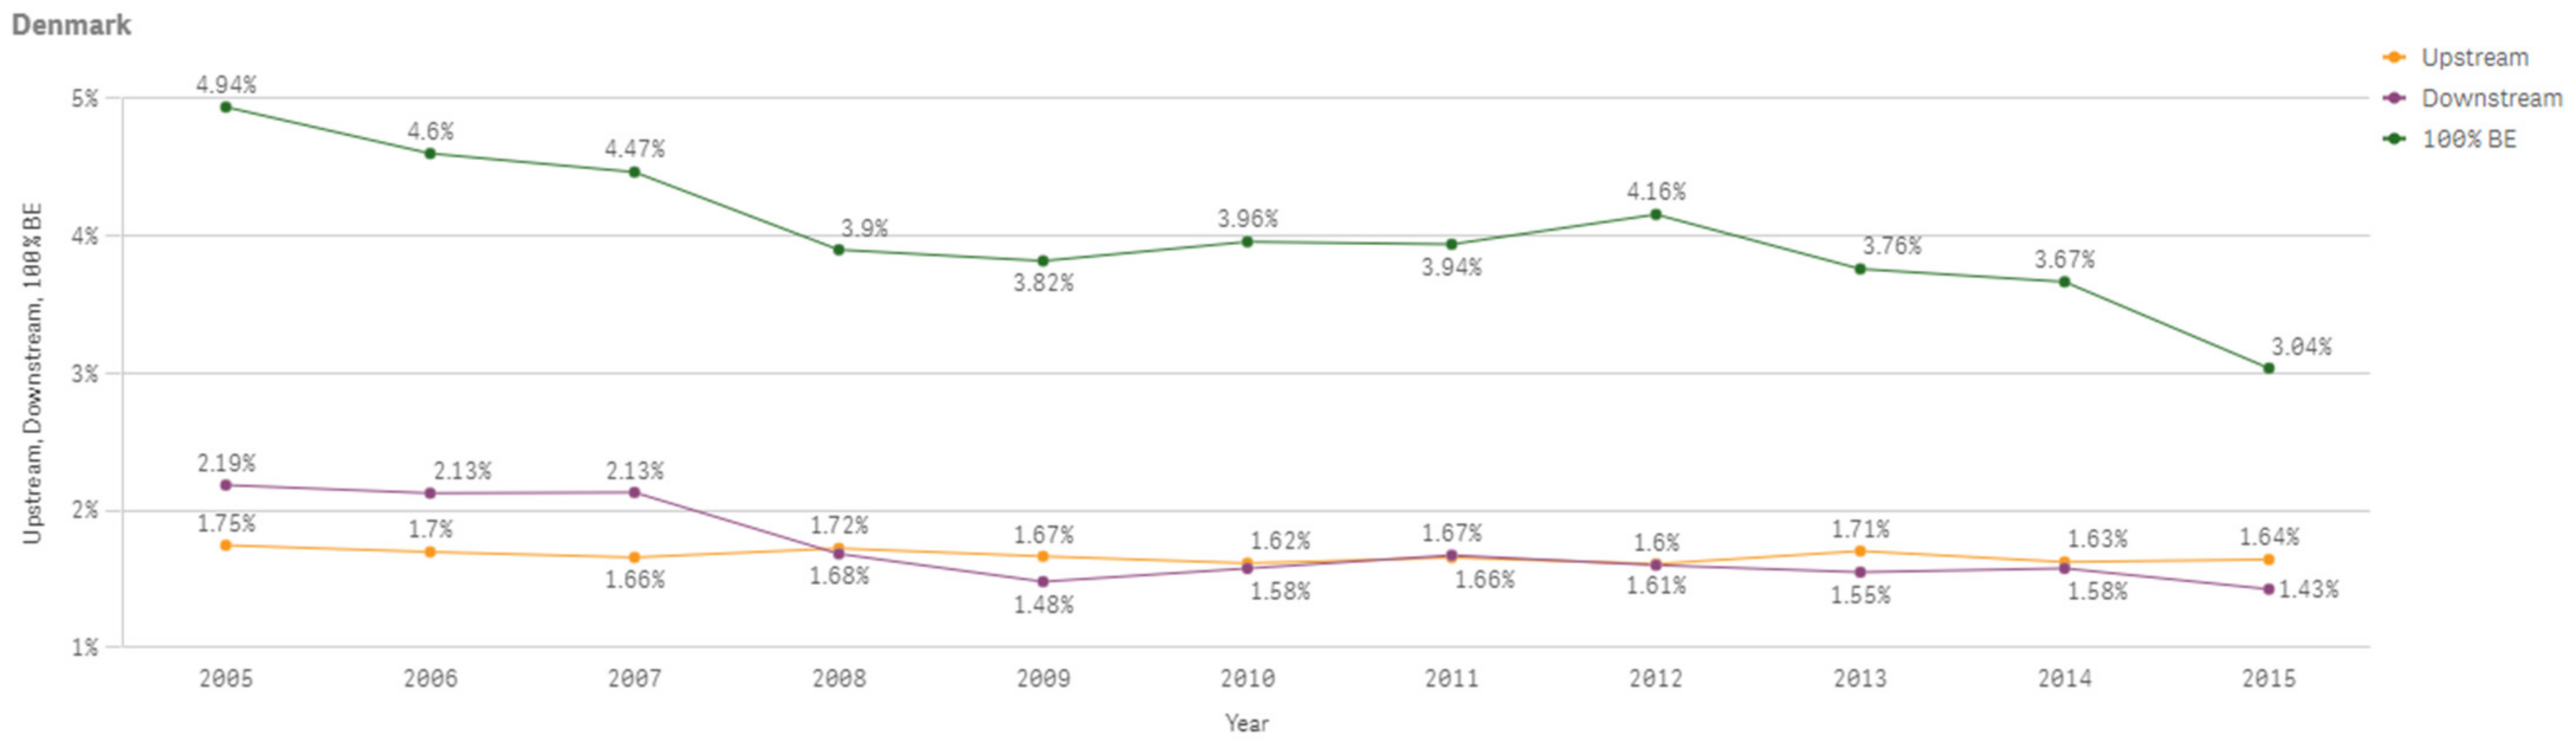
The following Figure A13 shows Denmark’s 100% bioeconomy value added, downstream bioeconomy value added and upstream bioeconomy value added which are, respectively, decreasing, increasing and increasing overall between 2005 and 2015. Figure A14 shows the percentage changes of the same values compared to total value added of the economy.
Figure A13.
Denmark 100% Bioeconomy Value Added, Downstream and Upstream Bioeconomy Value Added 2005–2015.
Figure A13.
Denmark 100% Bioeconomy Value Added, Downstream and Upstream Bioeconomy Value Added 2005–2015.

Figure A14.
Denmark 100% Bioeconomy Value Added, Downstream and Upstream Bioeconomy Value Added Shares 2005–2015.
Figure A14.
Denmark 100% Bioeconomy Value Added, Downstream and Upstream Bioeconomy Value Added Shares 2005–2015.

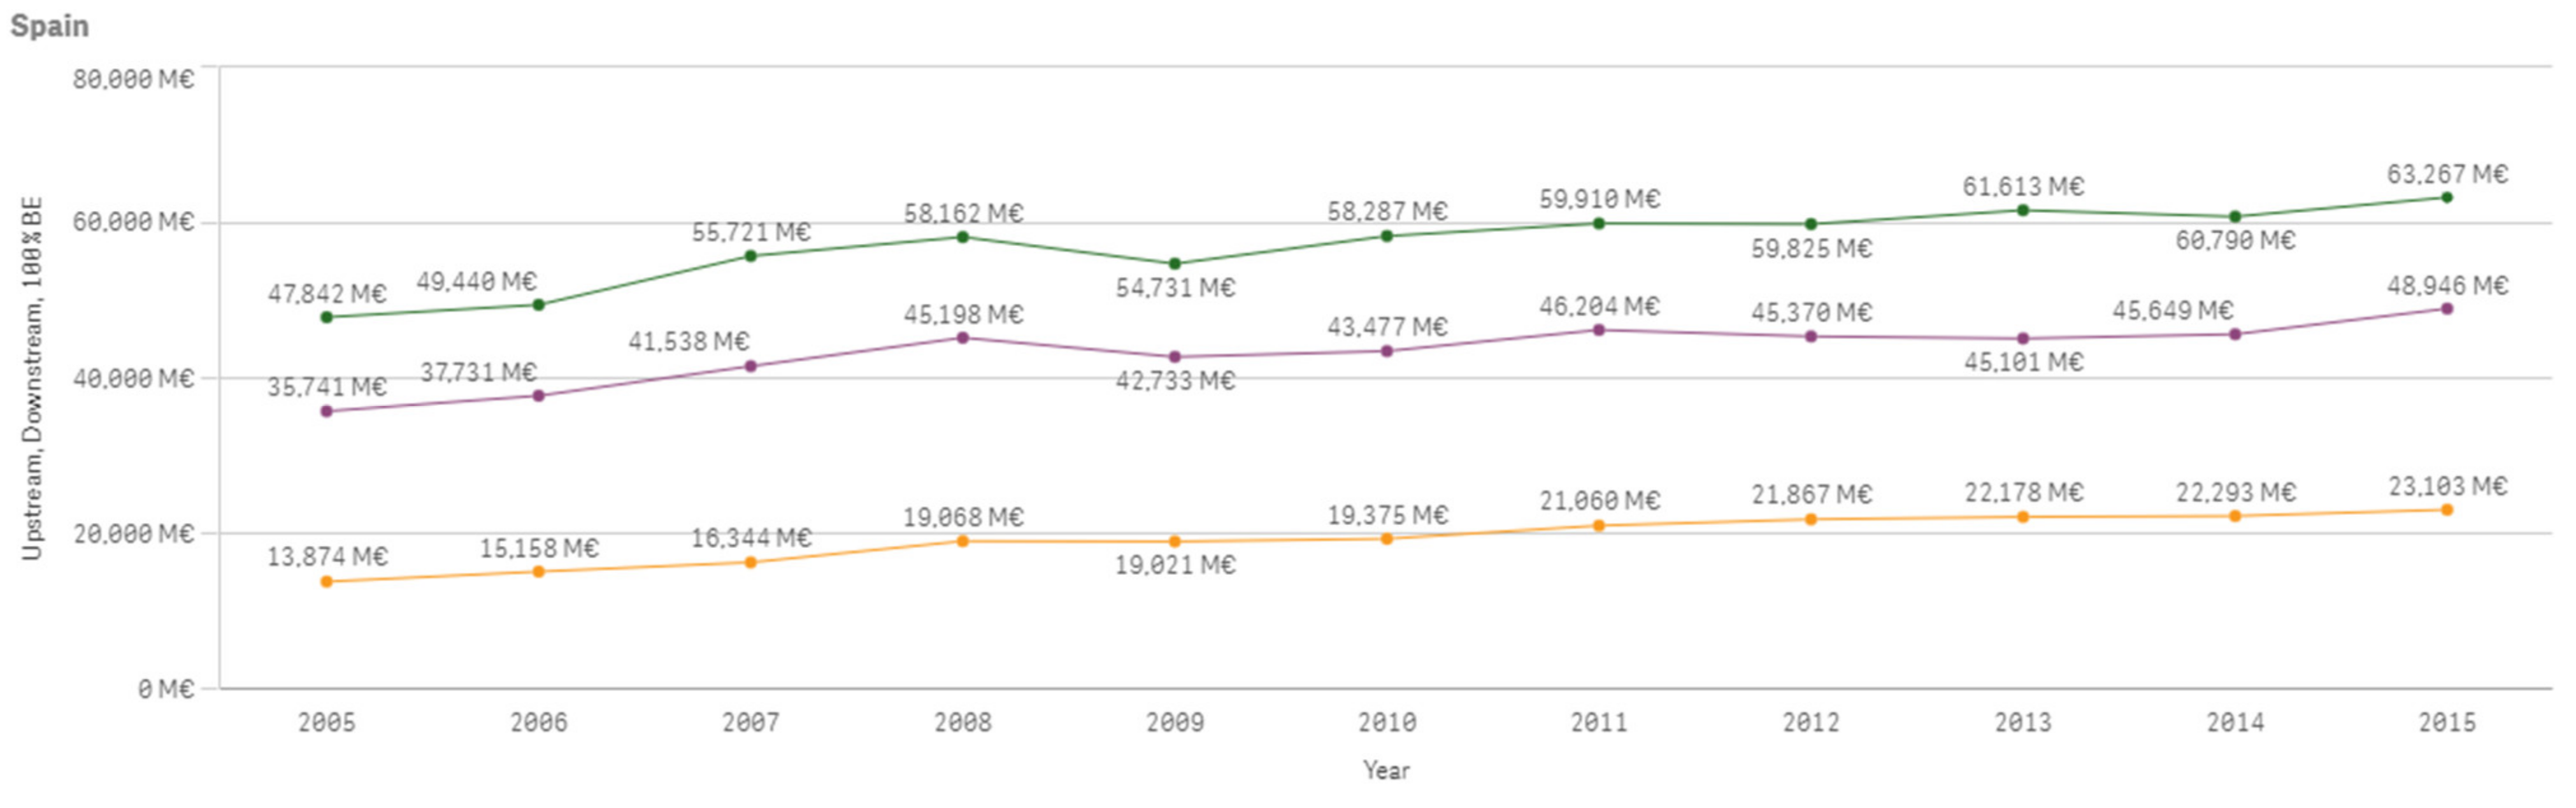
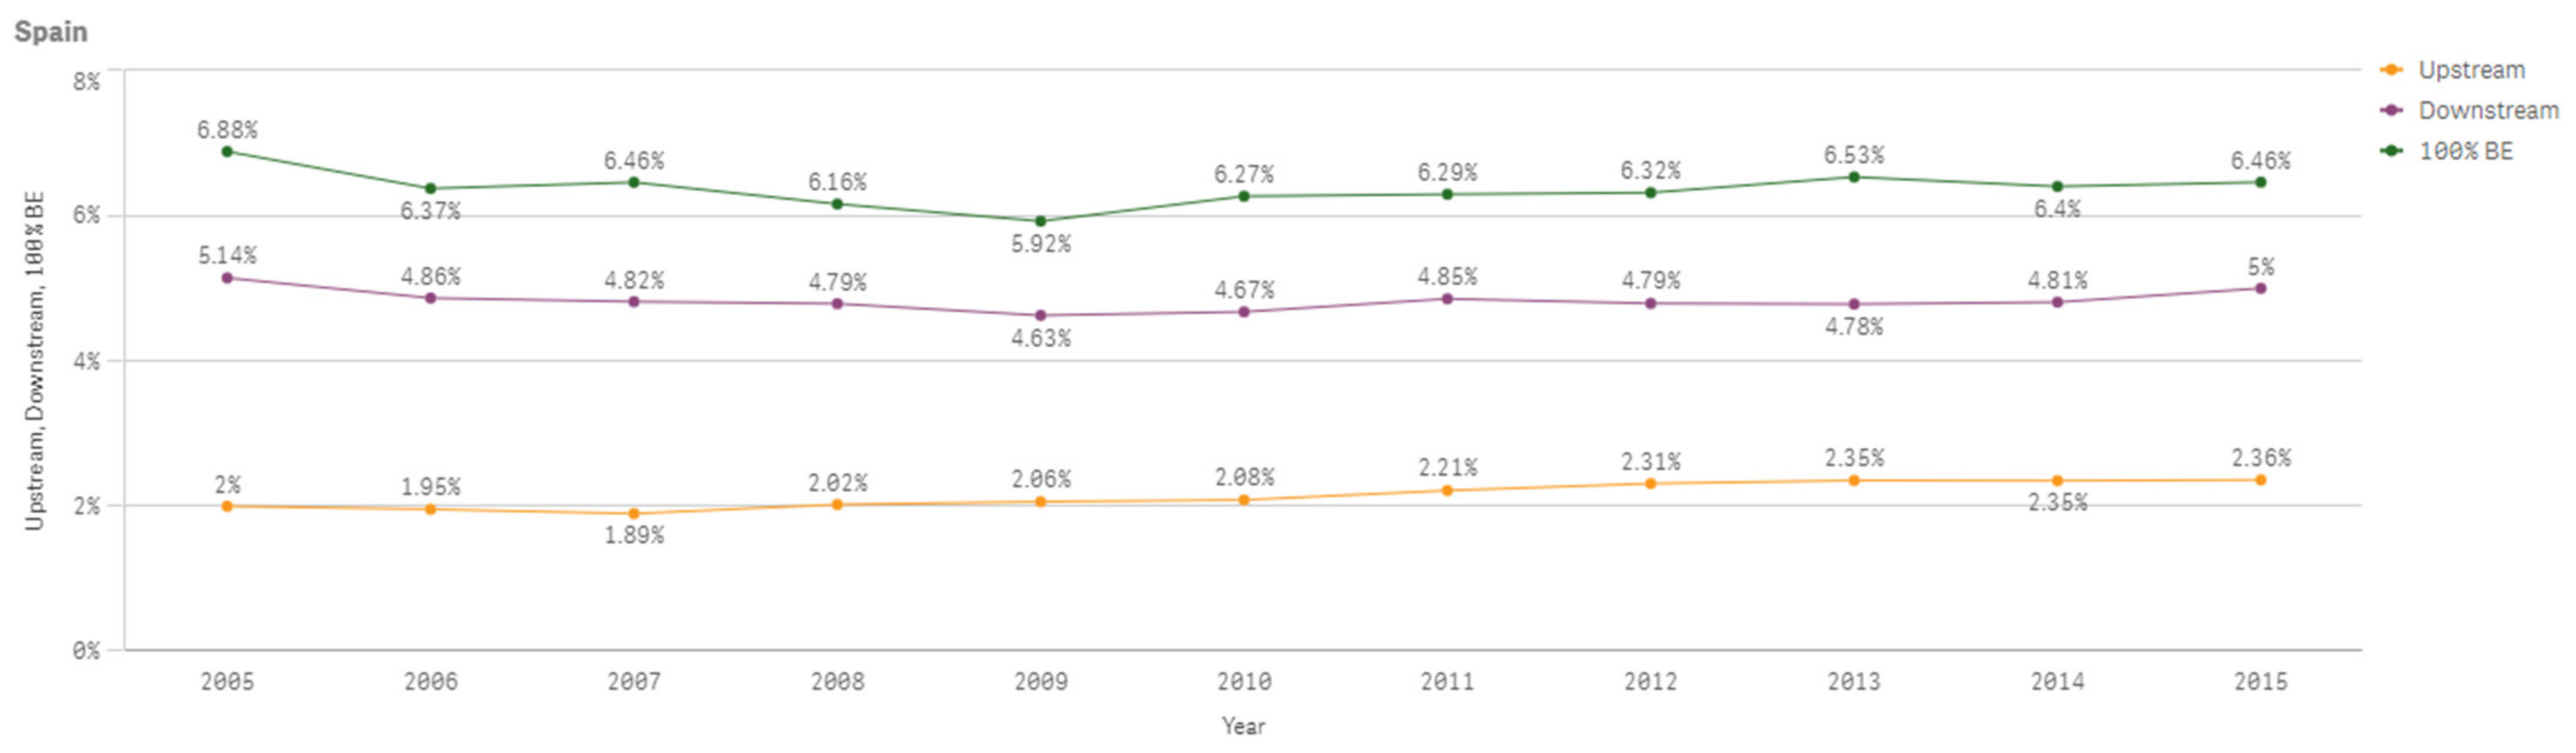
The following Figure A15 shows Spain’s 100% bioeconomy value added, downstream bioeconomy value added and upstream bioeconomy value added which are increasing overall between 2005 and 2015. Figure A16 shows the percentage changes of the same values compared to total value added of the economy.
Figure A15.
Spain 100% Bioeconomy Value Added, Downstream and Upstream Bioeconomy Value Added 2005–2015.
Figure A15.
Spain 100% Bioeconomy Value Added, Downstream and Upstream Bioeconomy Value Added 2005–2015.

Figure A16.
Spain 100% Bioeconomy Value Added, Downstream and Upstream Bioeconomy Value Added Shares 2005–2015.
Figure A16.
Spain 100% Bioeconomy Value Added, Downstream and Upstream Bioeconomy Value Added Shares 2005–2015.

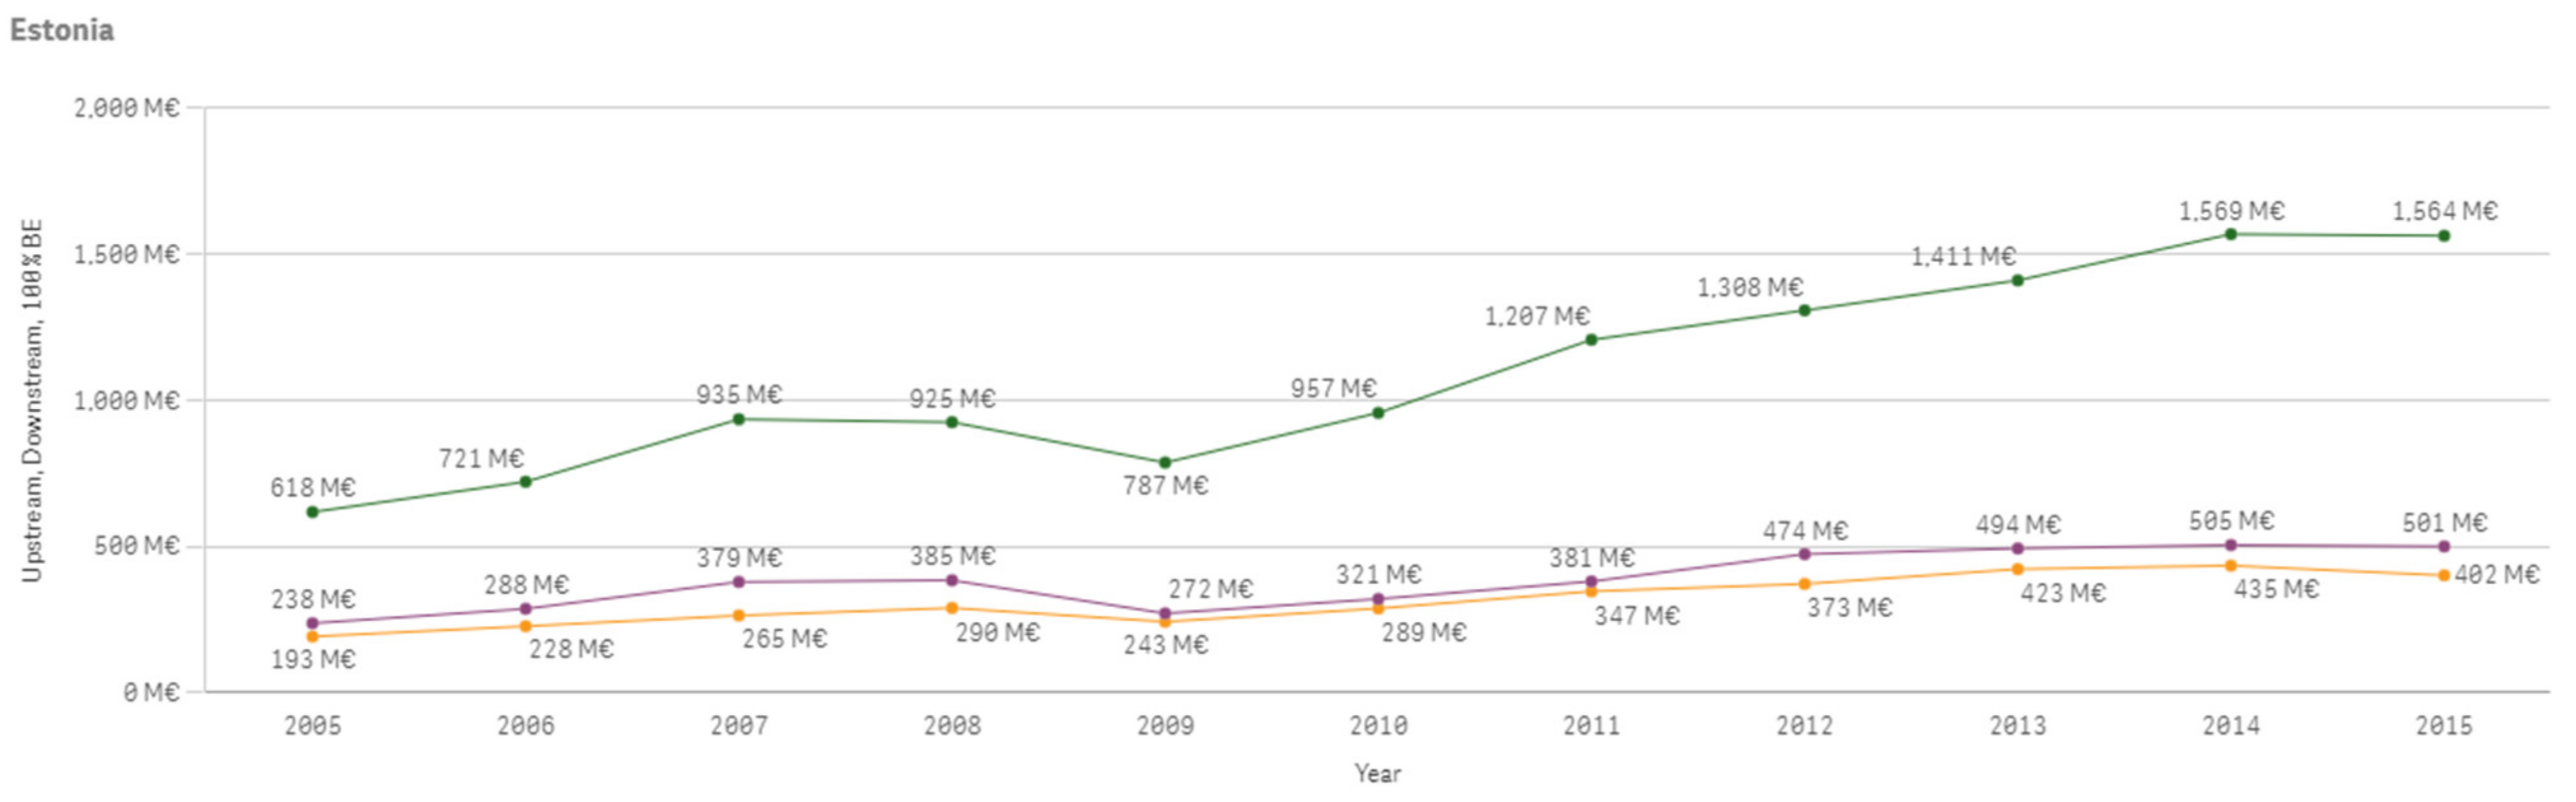
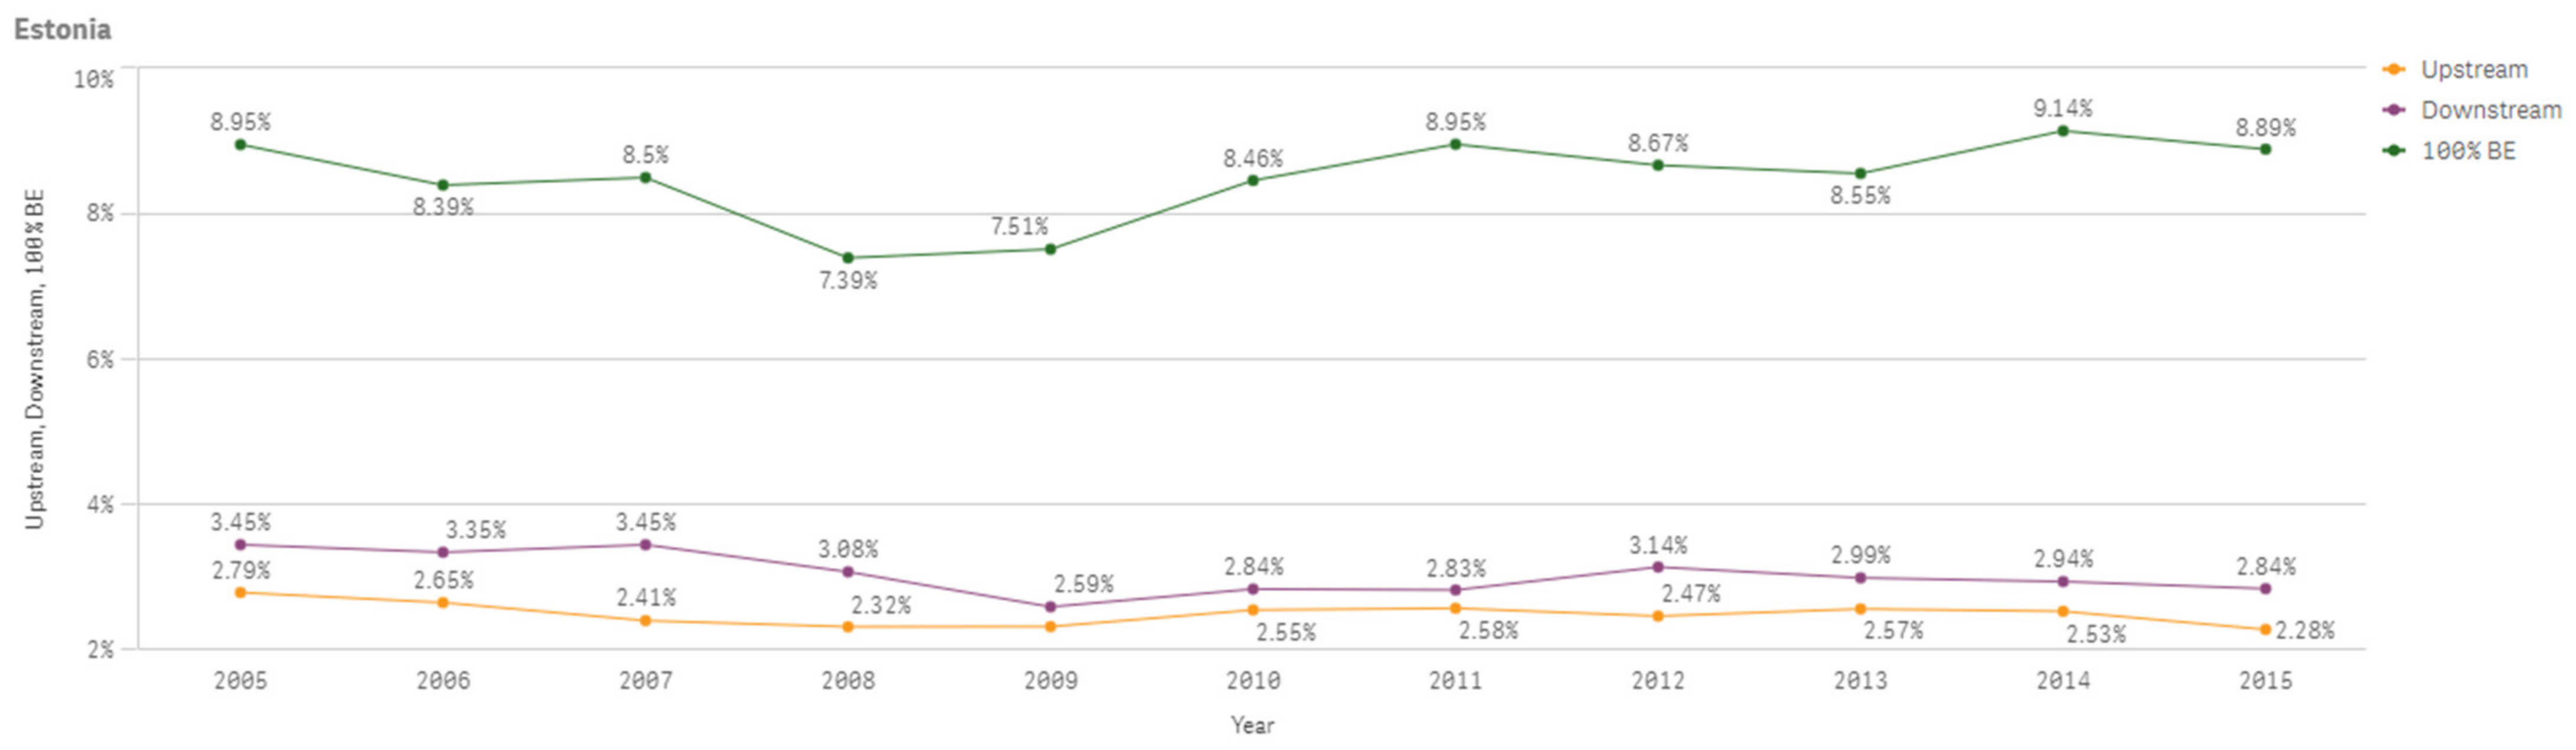
The following Figure A17 shows Estonia’s 100% bioeconomy value added, downstream bioeconomy value added and upstream bioeconomy value added which are increasing overall between 2005 and 2015. Figure A18 shows the percentage changes of the same values compared to total value added of the economy.
Figure A17.
Estonia 100% Bioeconomy Value Added, Downstream and Upstream Bioeconomy Value Added 2005–2015.
Figure A17.
Estonia 100% Bioeconomy Value Added, Downstream and Upstream Bioeconomy Value Added 2005–2015.

Figure A18.
Estonia 100% Bioeconomy Value Added, Downstream and Upstream Bioeconomy Value Added Shares 2005–2015.
Figure A18.
Estonia 100% Bioeconomy Value Added, Downstream and Upstream Bioeconomy Value Added Shares 2005–2015.

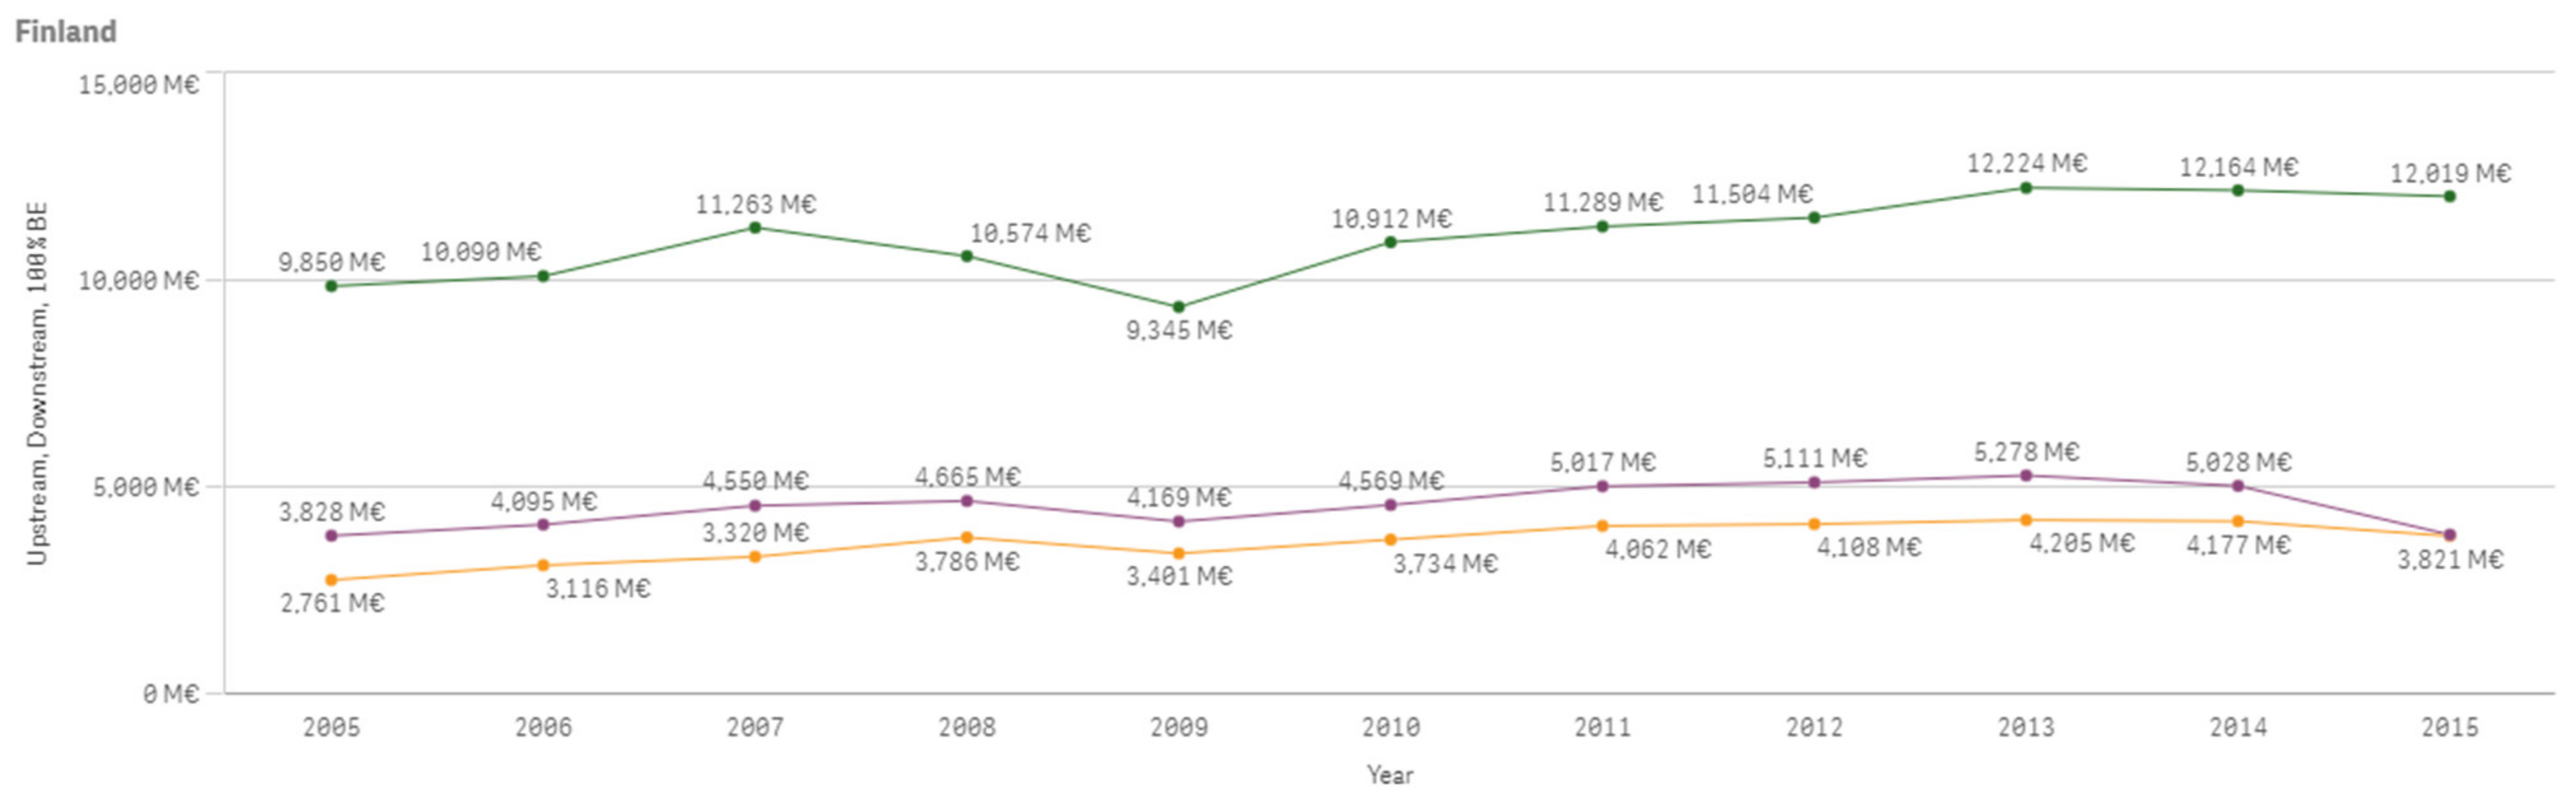
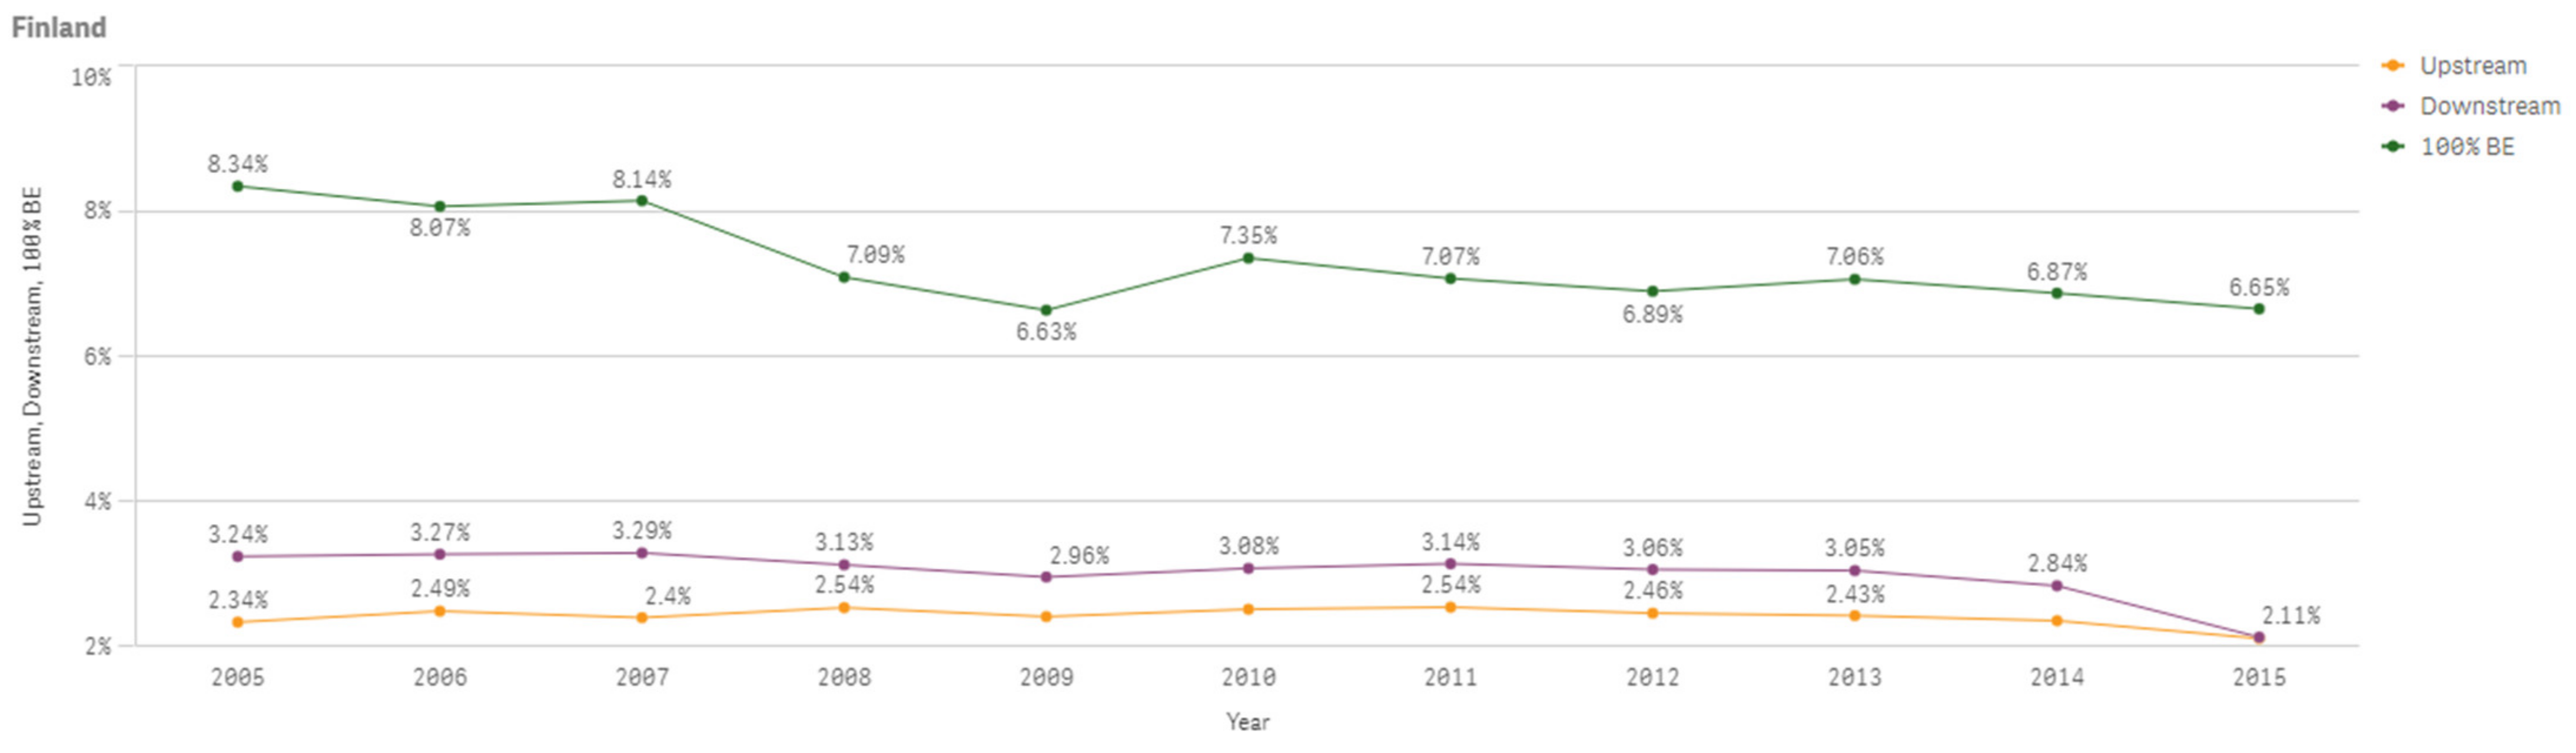
The following Figure A19 shows Finland’s 100% bioeconomy value added, downstream bioeconomy value added and upstream bioeconomy value added which are, respectively, increasing, decreasing and increasing overall between 2005 and 2015. Figure A20 shows the percentage changes of the same values compared to total value added of the economy.
Figure A19.
Finland 100% Bioeconomy Value Added, Downstream and Upstream Bioeconomy Value Added 2005–2015.
Figure A19.
Finland 100% Bioeconomy Value Added, Downstream and Upstream Bioeconomy Value Added 2005–2015.

Figure A20.
Finland 100% Bioeconomy Value Added, Downstream and Upstream Bioeconomy Value Added Shares 2005–2015.
Figure A20.
Finland 100% Bioeconomy Value Added, Downstream and Upstream Bioeconomy Value Added Shares 2005–2015.

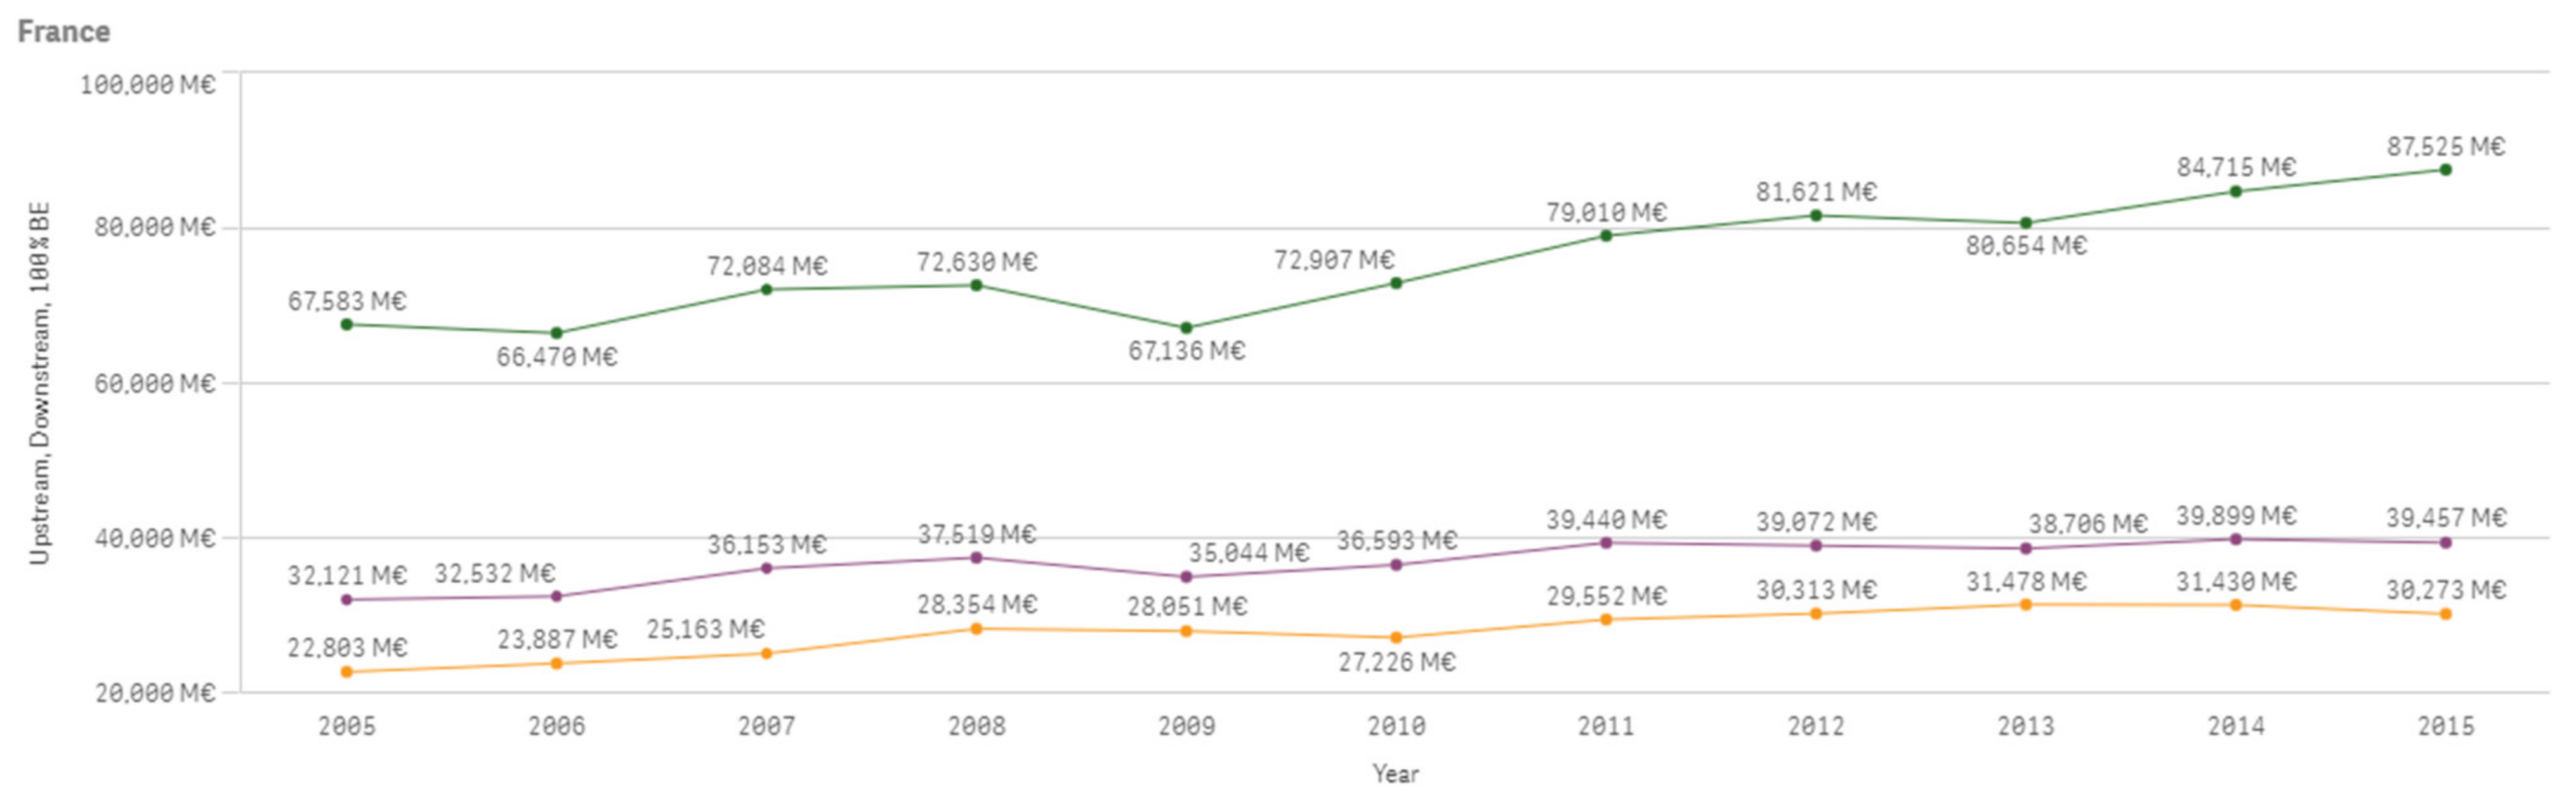
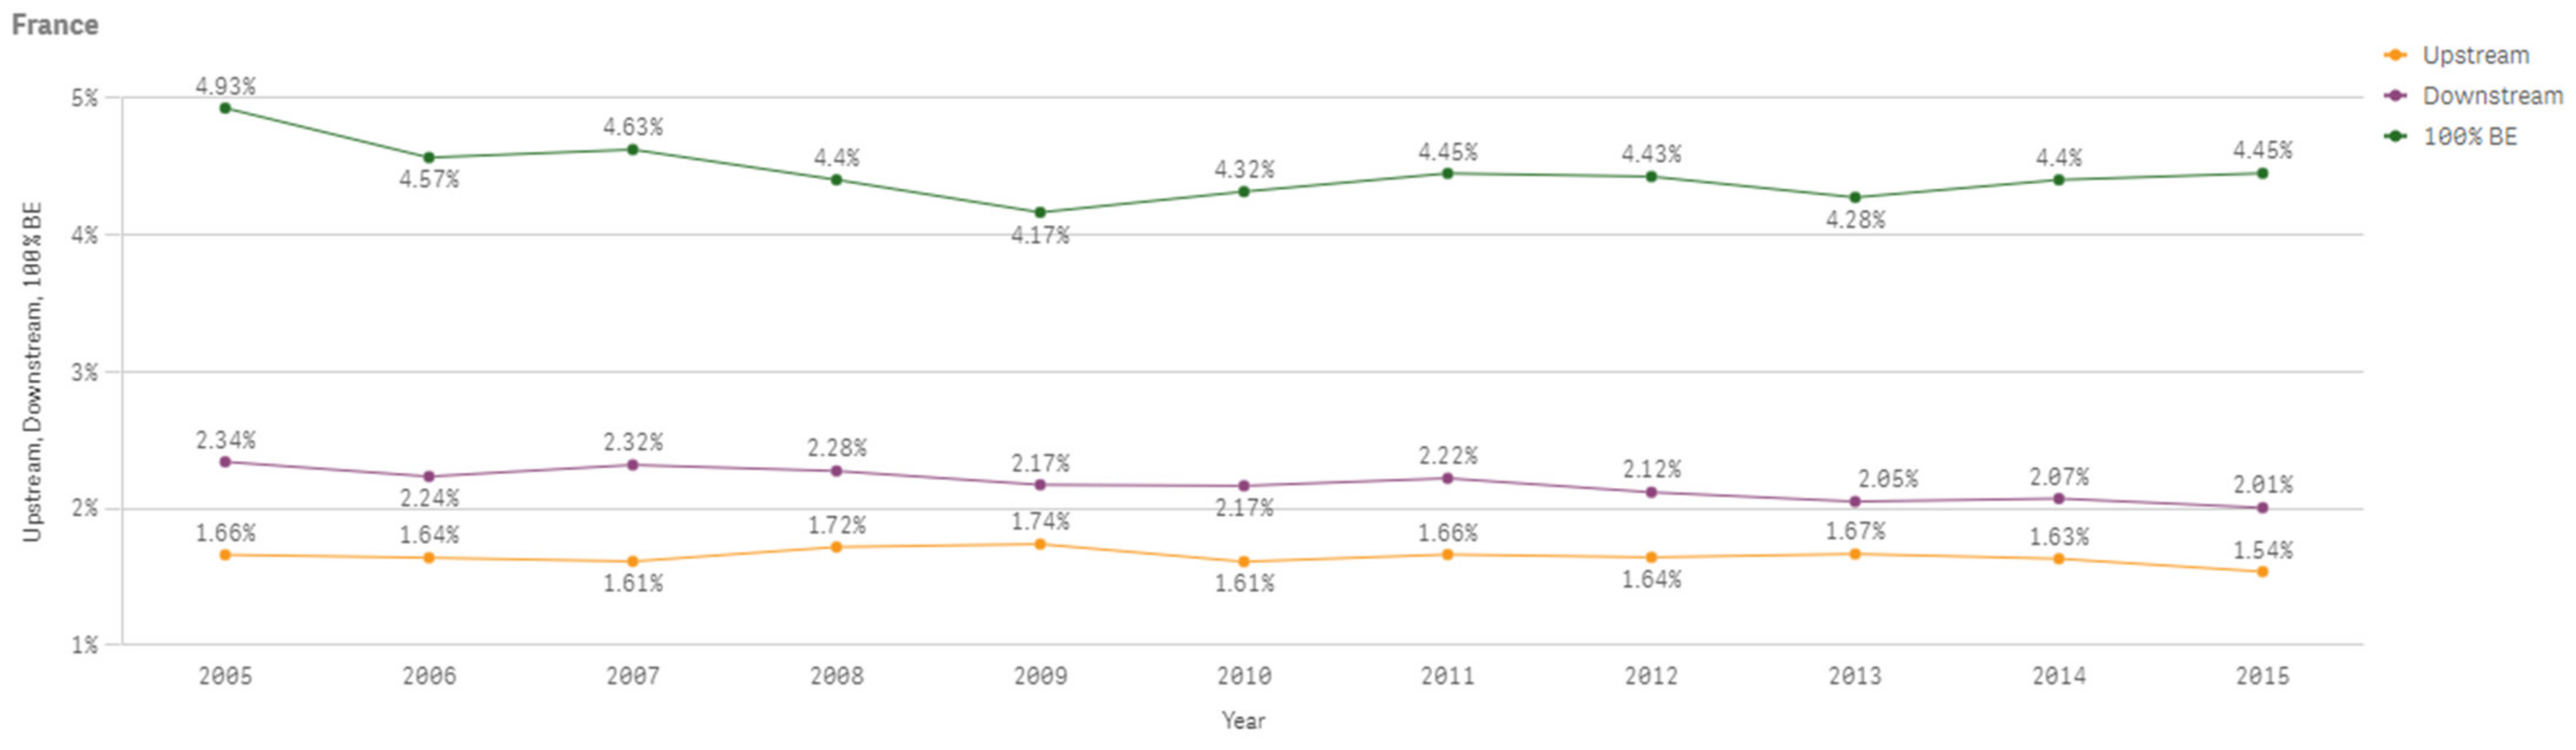
The following Figure A21 shows France’s 100% bioeconomy value added, downstream bioeconomy value added and upstream bioeconomy value added which are increasing between 2005 and 2015. Figure A22 shows the percentage changes of the same values compared to total value added of the economy.
Figure A21.
France 100% Bioeconomy Value Added, Downstream and Upstream Bioeconomy Value Added 2005–2015.
Figure A21.
France 100% Bioeconomy Value Added, Downstream and Upstream Bioeconomy Value Added 2005–2015.

Figure A22.
France 100% Bioeconomy Value Added, Downstream and Upstream Bioeconomy Value Added Shares 2005–2015.
Figure A22.
France 100% Bioeconomy Value Added, Downstream and Upstream Bioeconomy Value Added Shares 2005–2015.

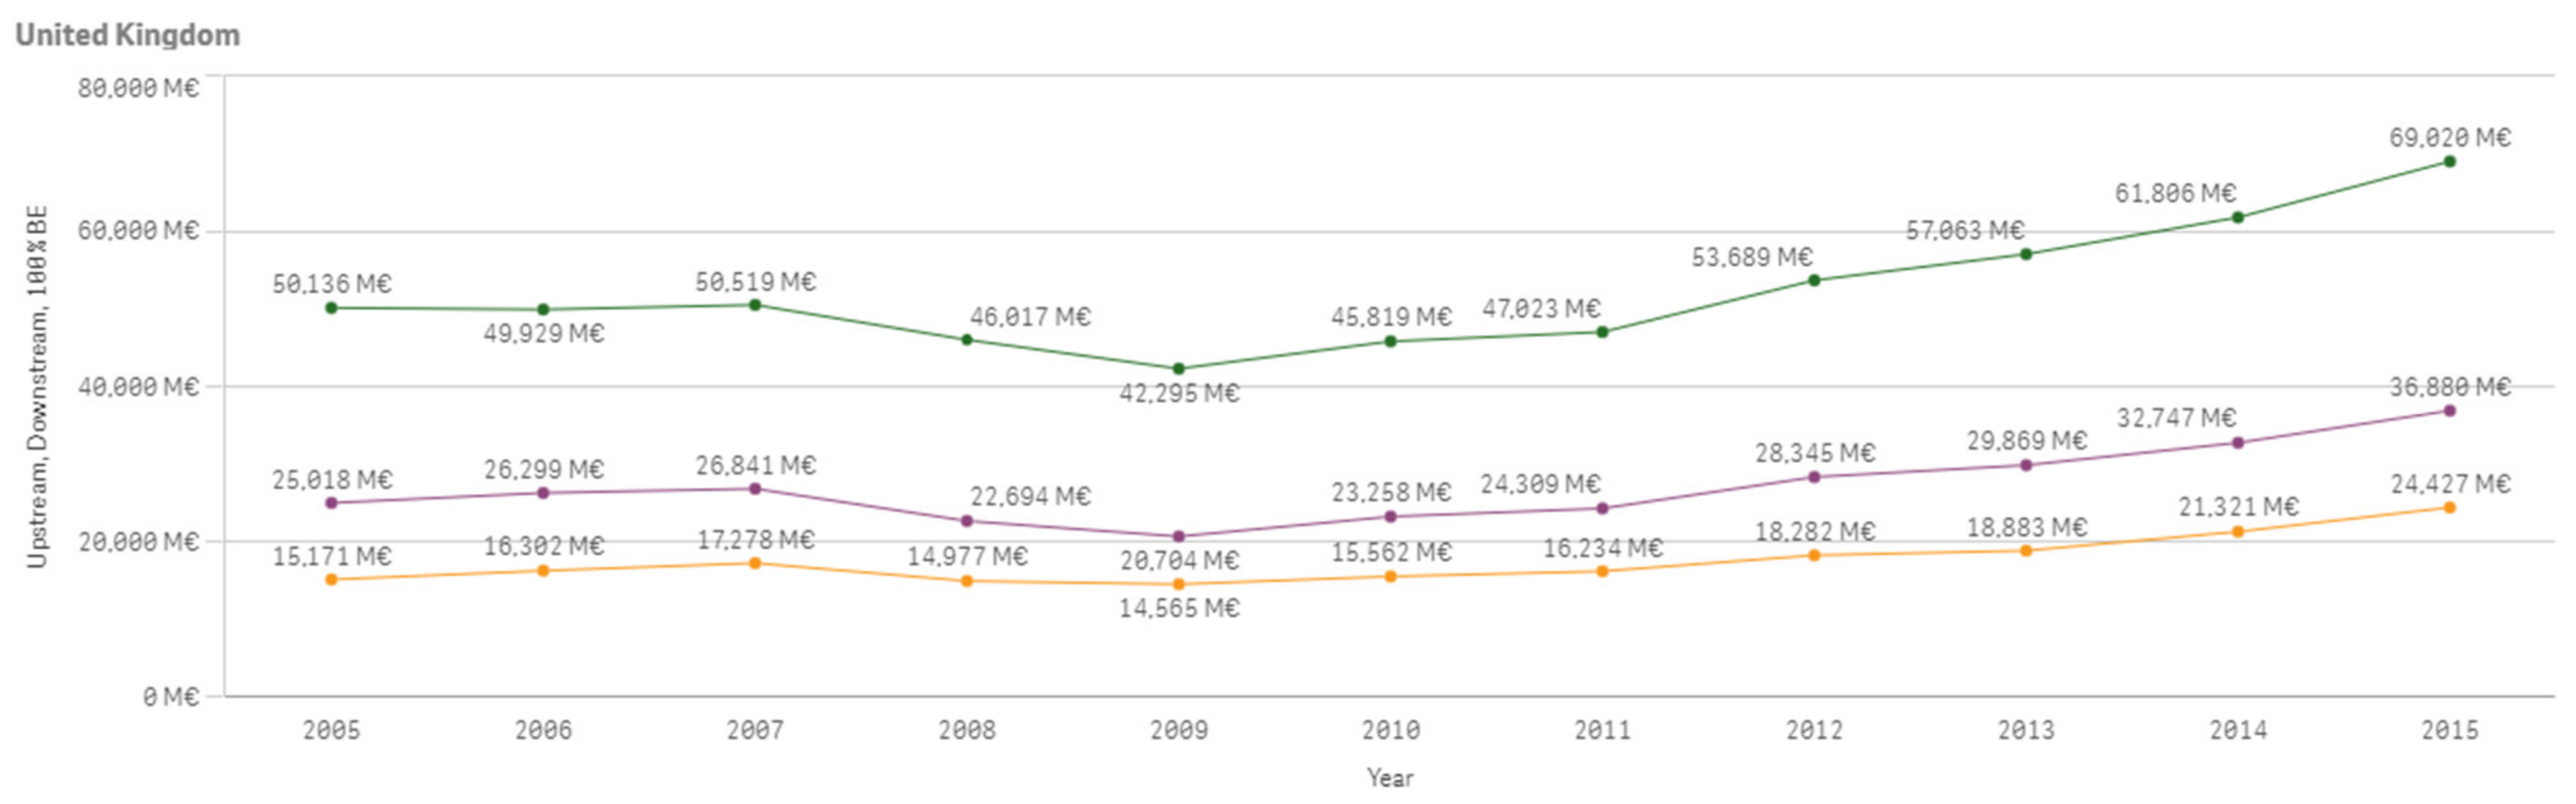
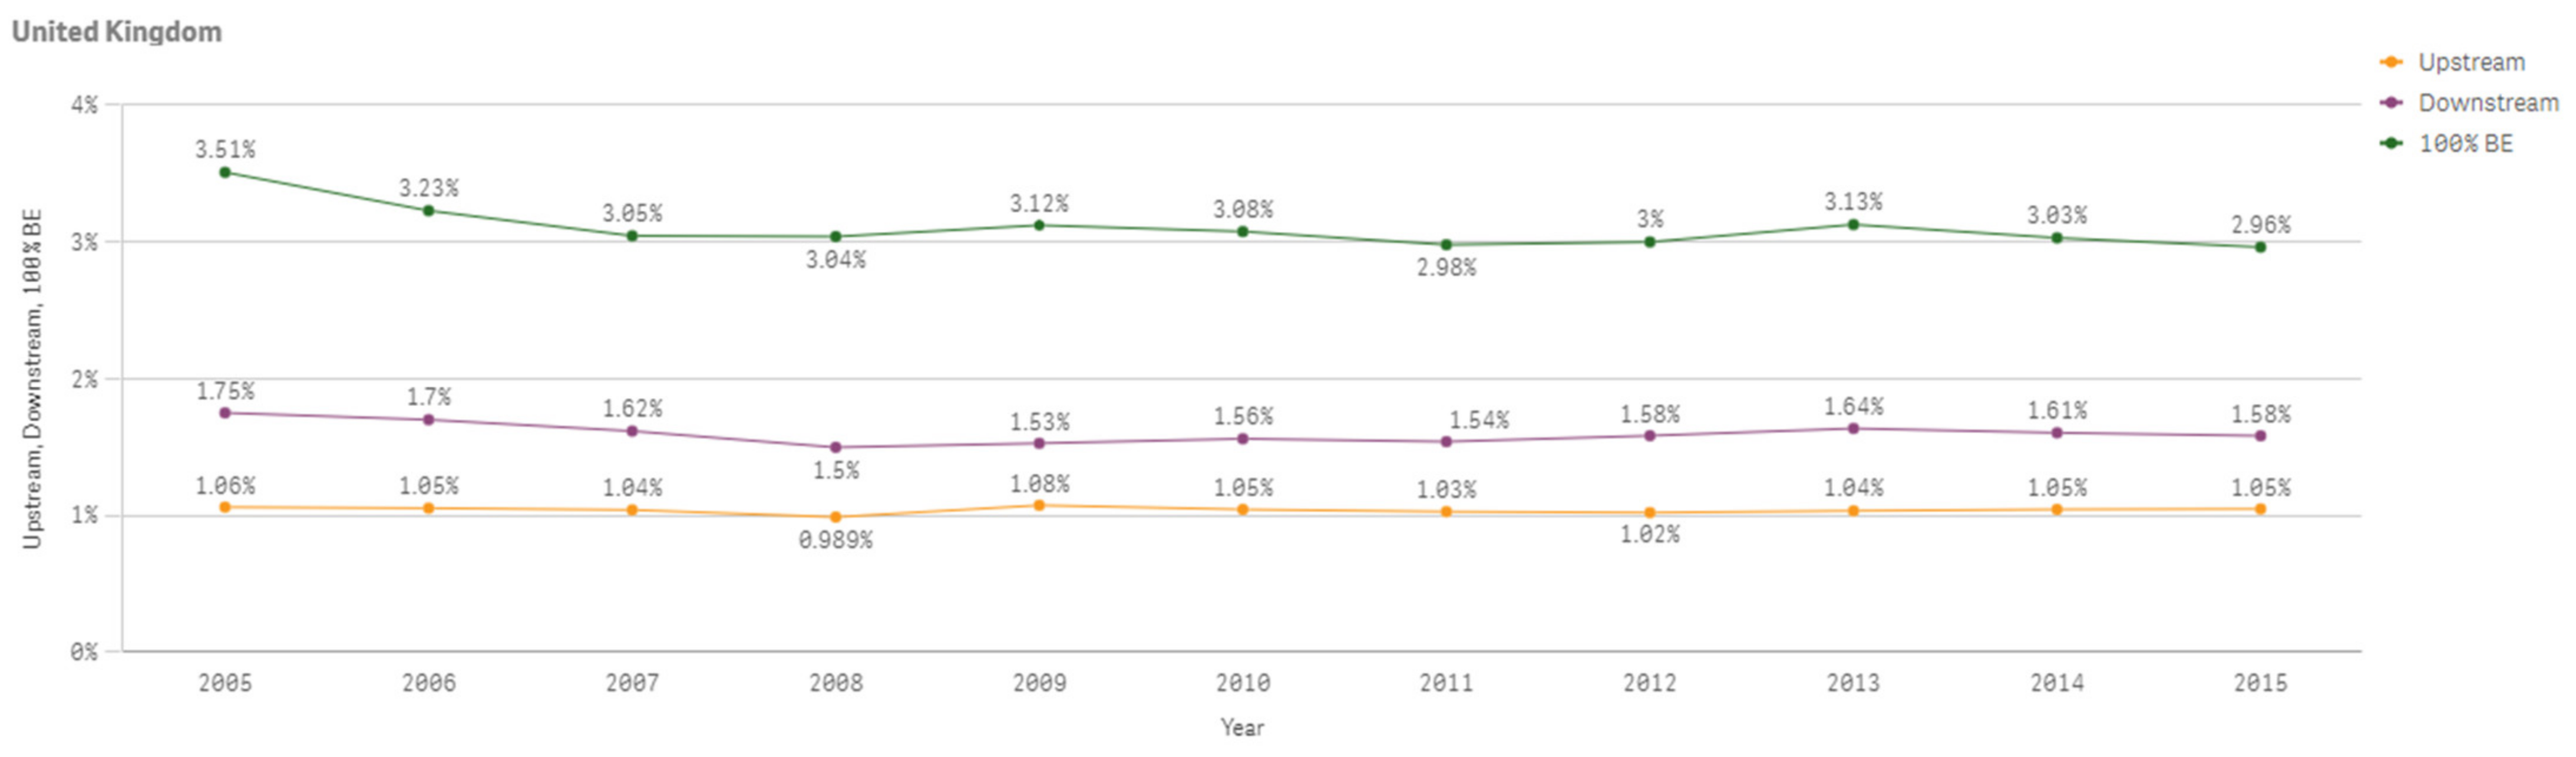
The following Figure A23 shows United Kingdom’s 100% bioeconomy value added, downstream bioeconomy value added and upstream bioeconomy value added which are increasing overall between 2005 and 2015. Figure A24 shows the percentage changes of the same values compared to total value added of the economy.
Figure A23.
United Kingdom 100% Bioeconomy Value Added, Downstream and Upstream Bioeconomy Value Added 2005–2015.
Figure A23.
United Kingdom 100% Bioeconomy Value Added, Downstream and Upstream Bioeconomy Value Added 2005–2015.

Figure A24.
United Kingdom 100% Bioeconomy Value Added, Downstream and Upstream Bioeconomy Value Added Shares 2005–2015.
Figure A24.
United Kingdom 100% Bioeconomy Value Added, Downstream and Upstream Bioeconomy Value Added Shares 2005–2015.

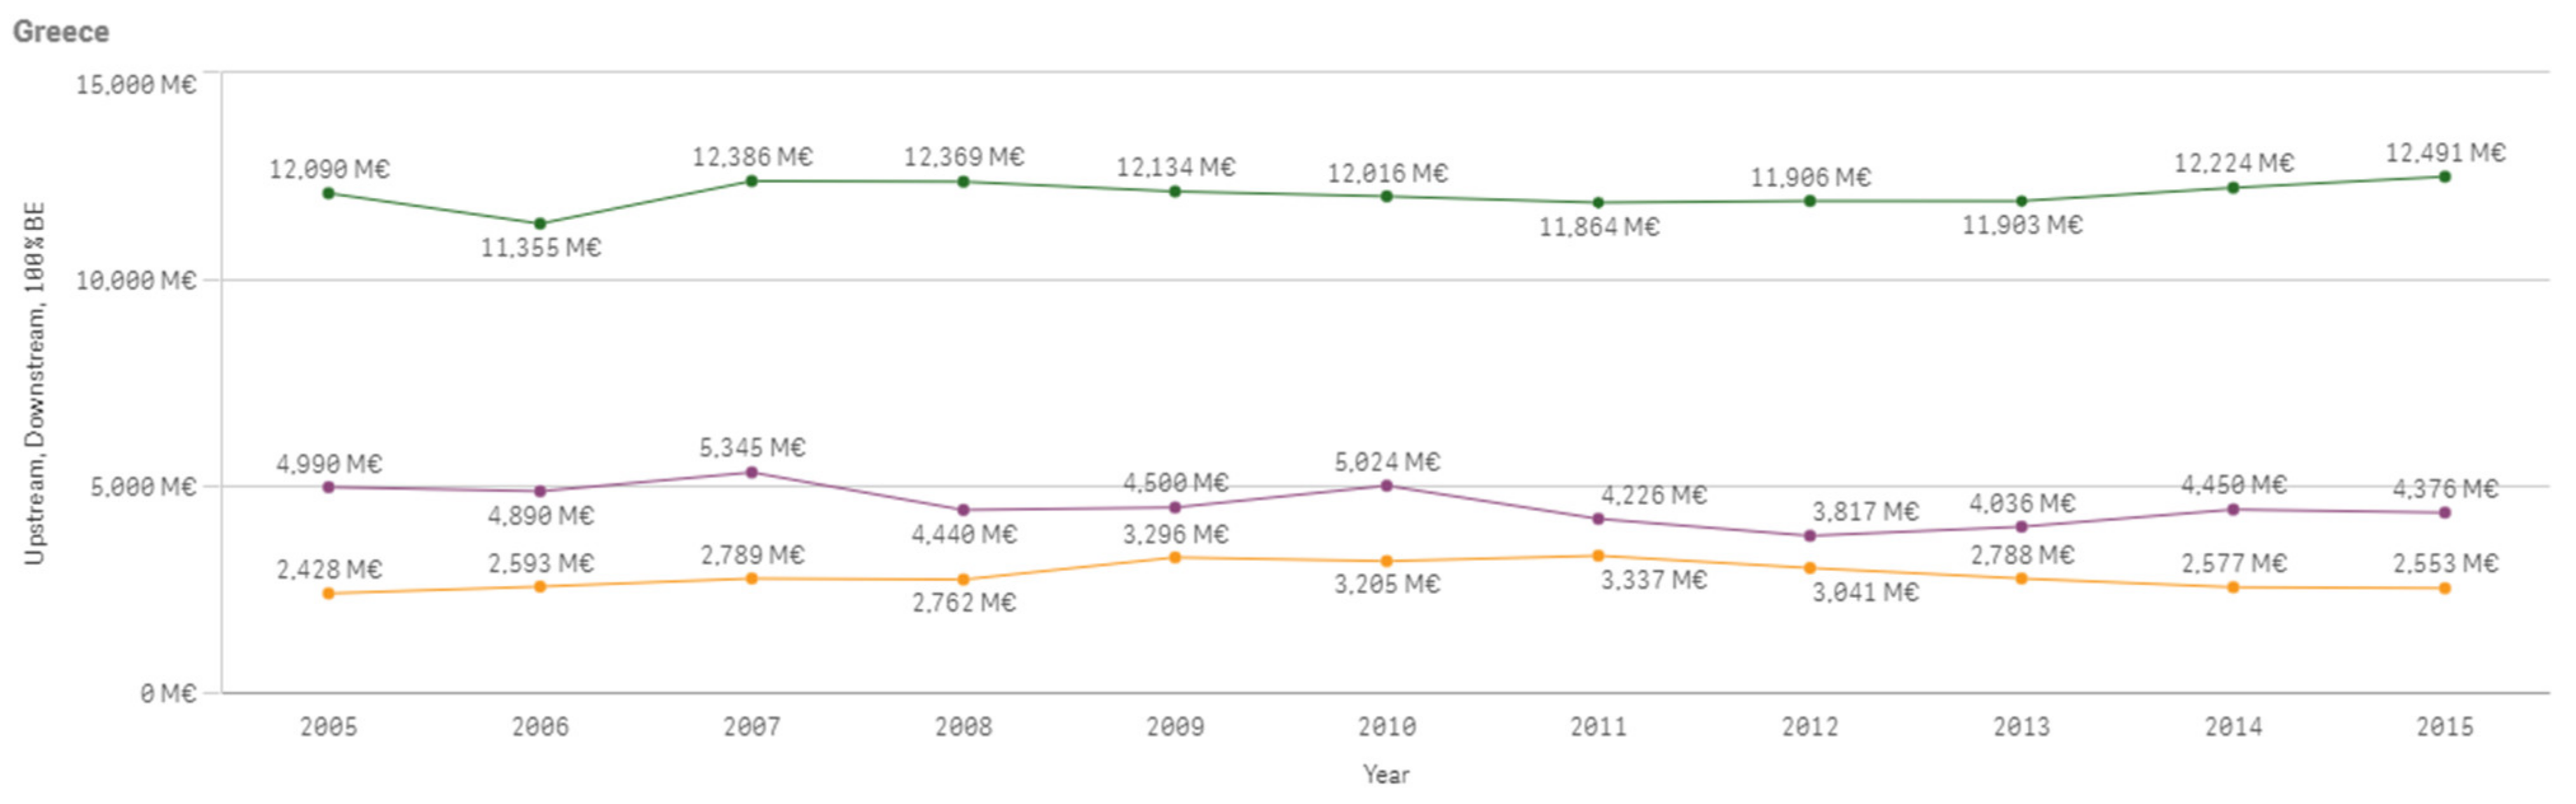
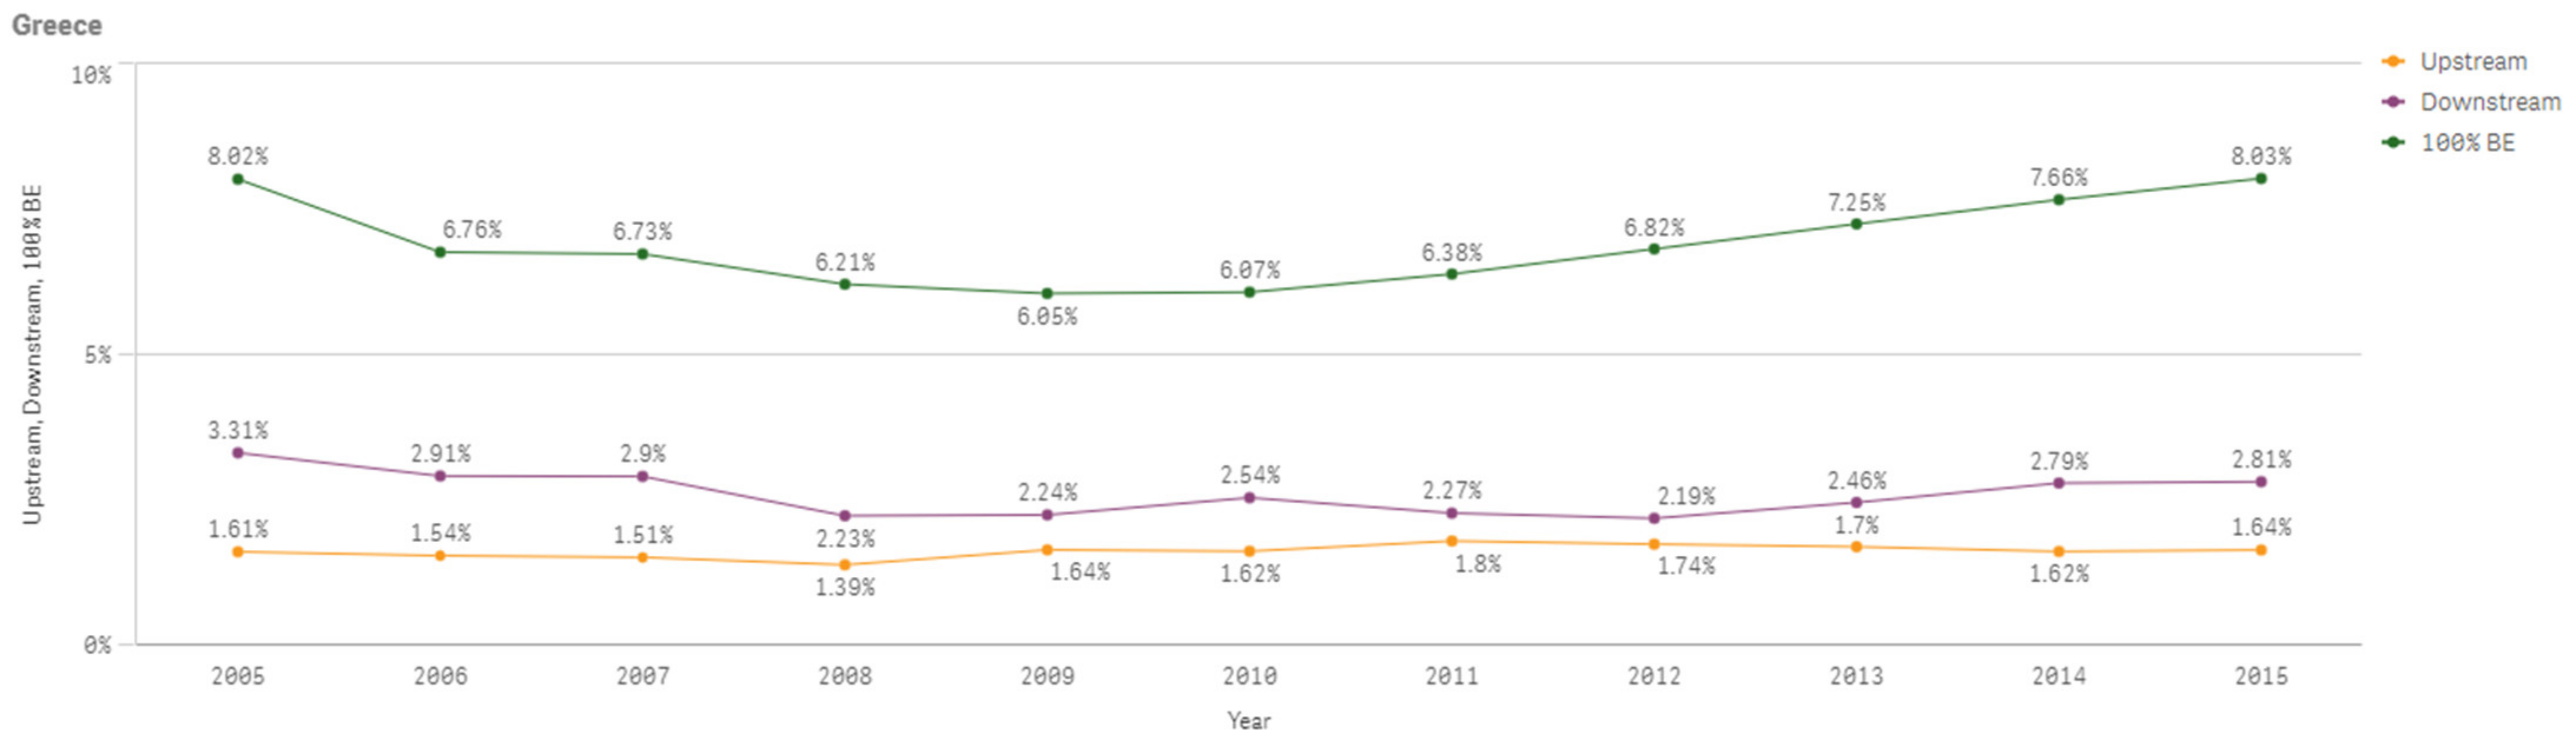
The following Figure A25 shows Greece’s 100% bioeconomy value added, downstream bioeconomy value added and upstream bioeconomy value added which are, respectively, increasing, decreasing and increasing overall between 2005 and 2015. Figure A26 shows the percentage changes of the same values compared to total value added of the economy.
Figure A25.
Greece 100% Bioeconomy Value Added, Downstream and Upstream Bioeconomy Value Added 2005–2015.
Figure A25.
Greece 100% Bioeconomy Value Added, Downstream and Upstream Bioeconomy Value Added 2005–2015.

Figure A26.
Greece 100% Bioeconomy Value Added, Downstream and Upstream Bioeconomy Value Added Shares 2005–2015.
Figure A26.
Greece 100% Bioeconomy Value Added, Downstream and Upstream Bioeconomy Value Added Shares 2005–2015.

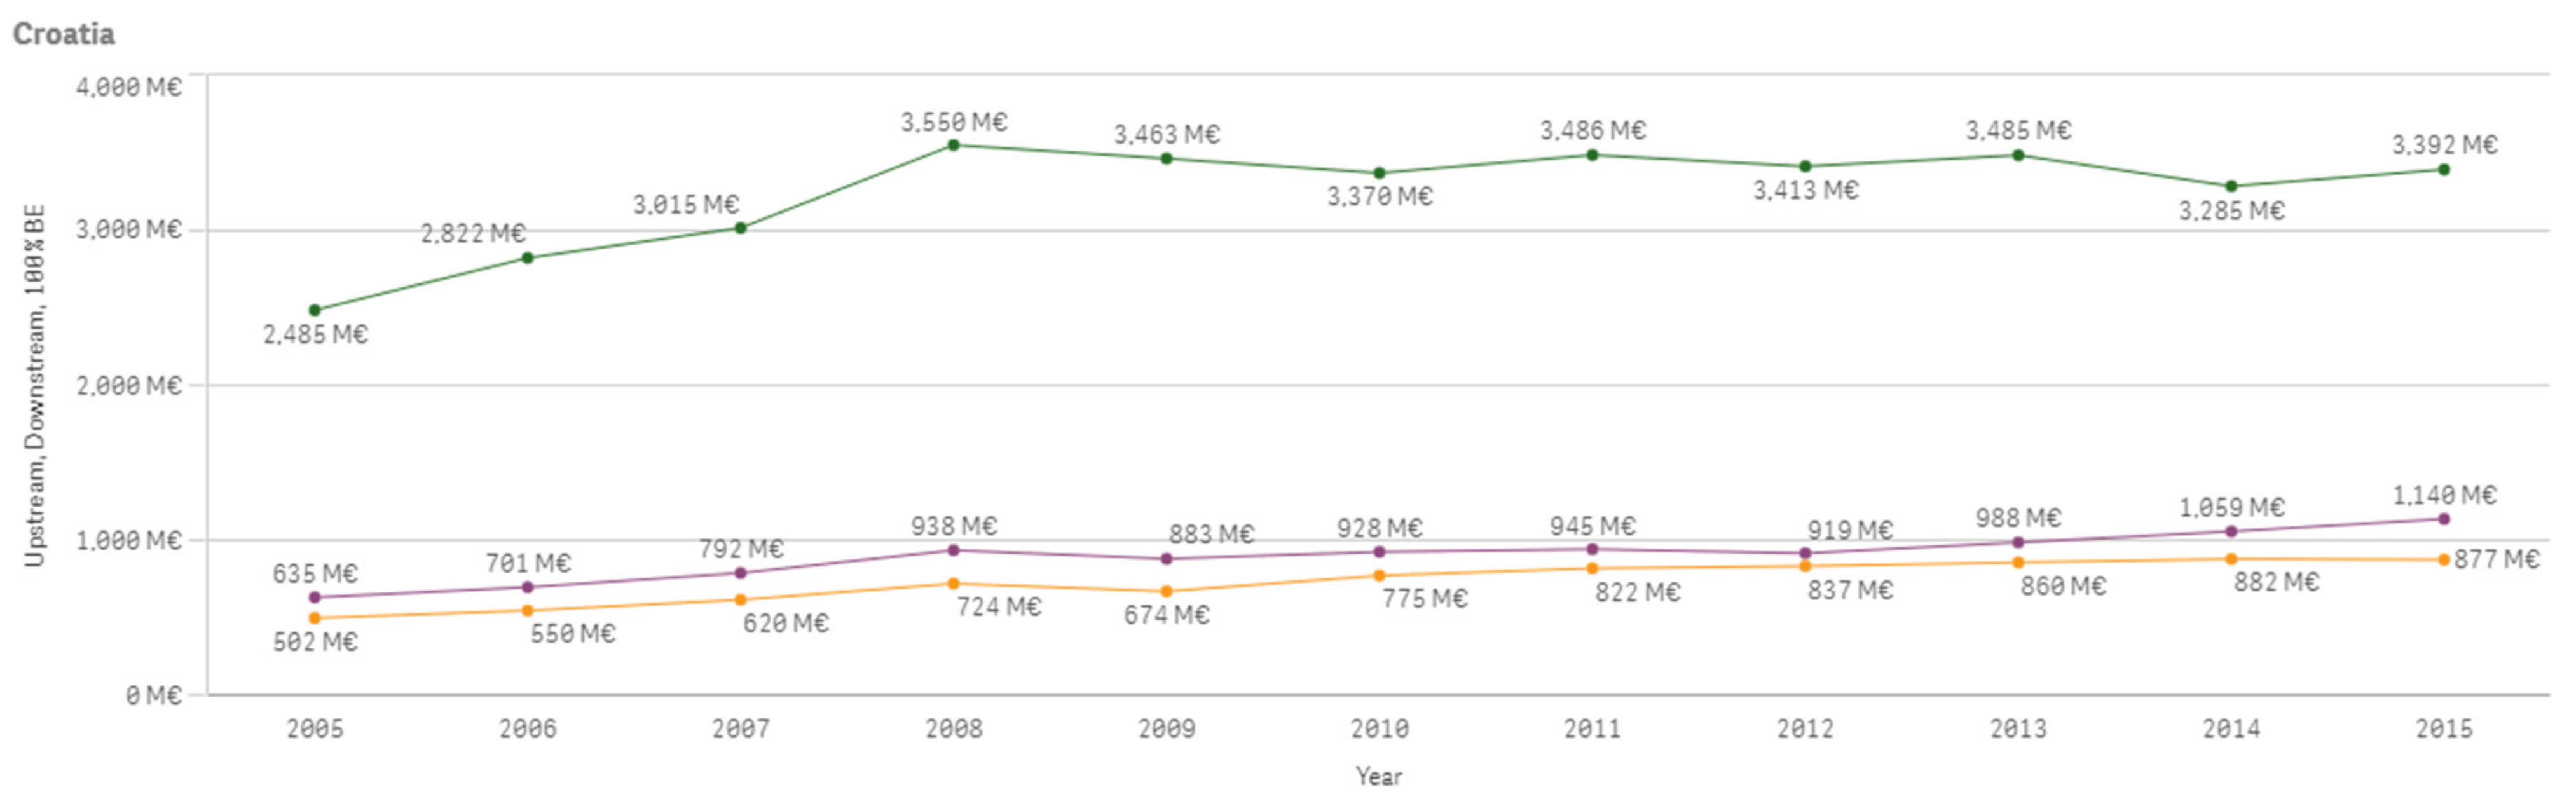
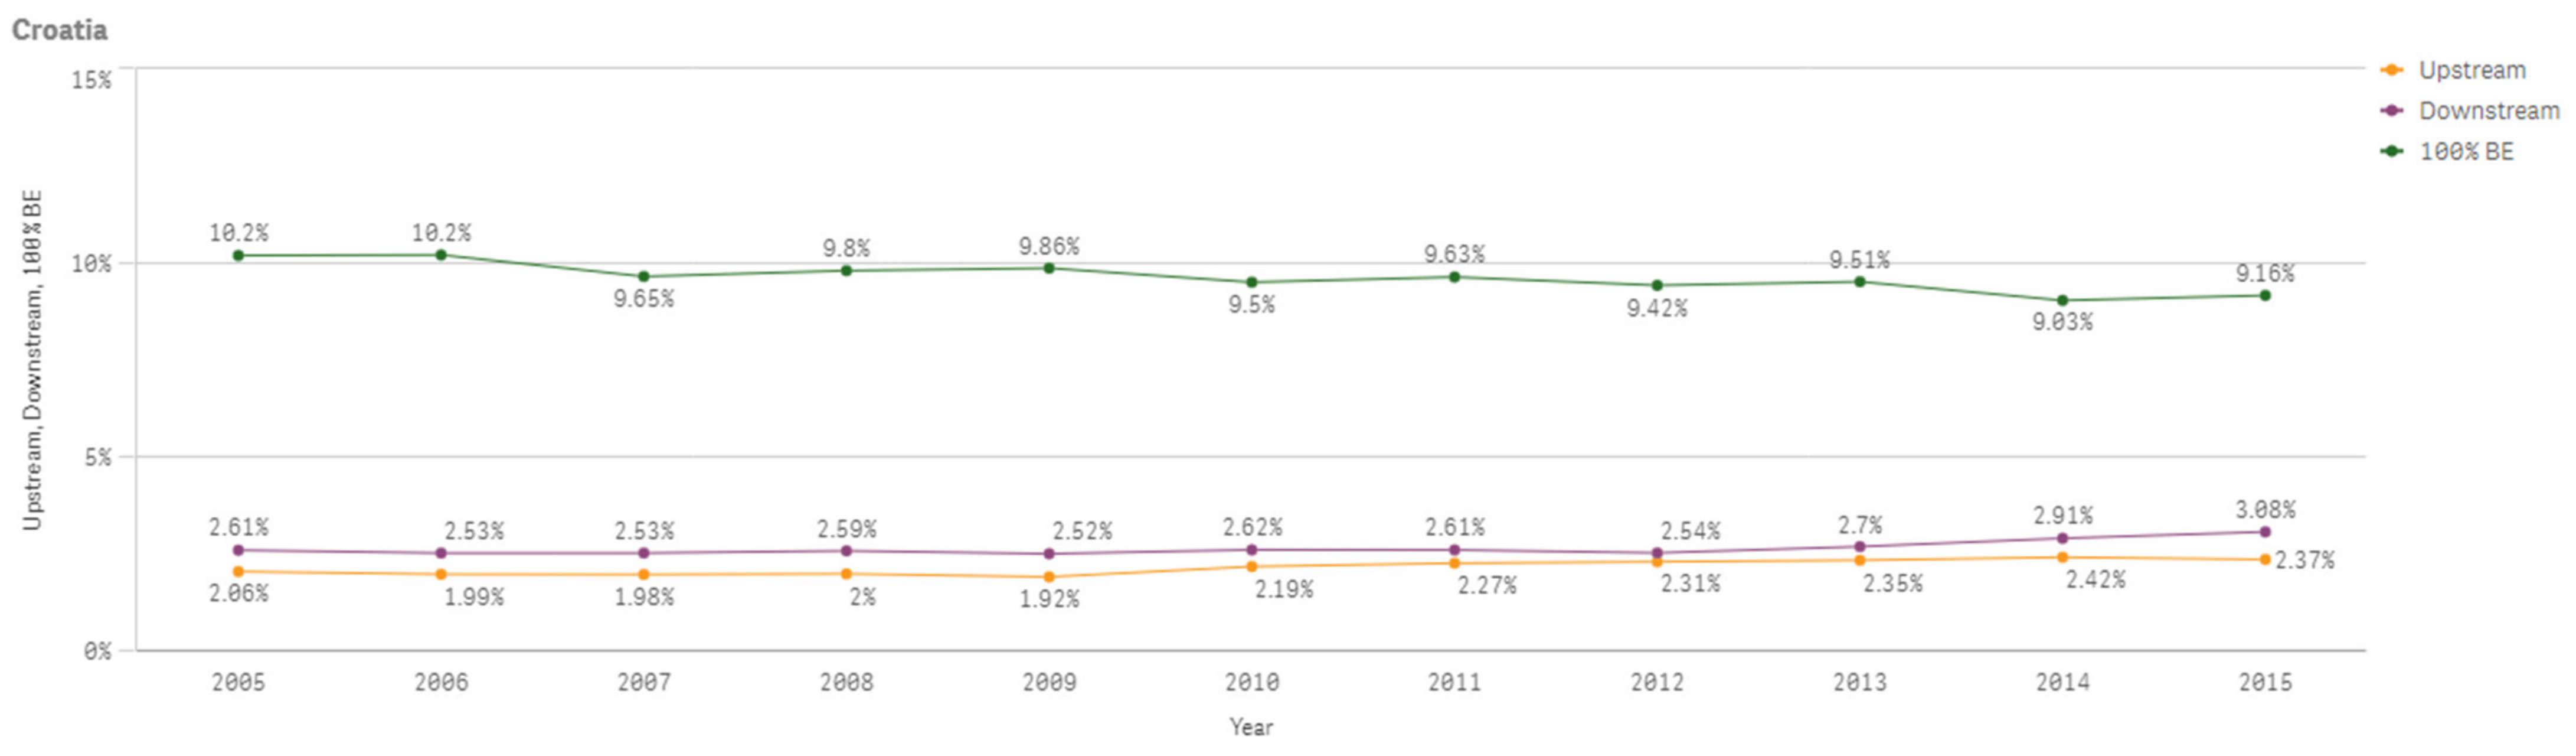
The following Figure A27 shows Croatia’s 100% bioeconomy value added, downstream bioeconomy value added and upstream bioeconomy value added which are increasing overall between 2005 and 2015. Figure A28 shows the percentage changes of the same values compared to total value added of the economy.
Figure A27.
Croatia 100% Bioeconomy Value Added, Downstream and Upstream Bioeconomy Value Added 2005–2015.
Figure A27.
Croatia 100% Bioeconomy Value Added, Downstream and Upstream Bioeconomy Value Added 2005–2015.

Figure A28.
Croatia 100% Bioeconomy Value Added, Downstream and Upstream Bioeconomy Value Added Shares 2005–2015.
Figure A28.
Croatia 100% Bioeconomy Value Added, Downstream and Upstream Bioeconomy Value Added Shares 2005–2015.

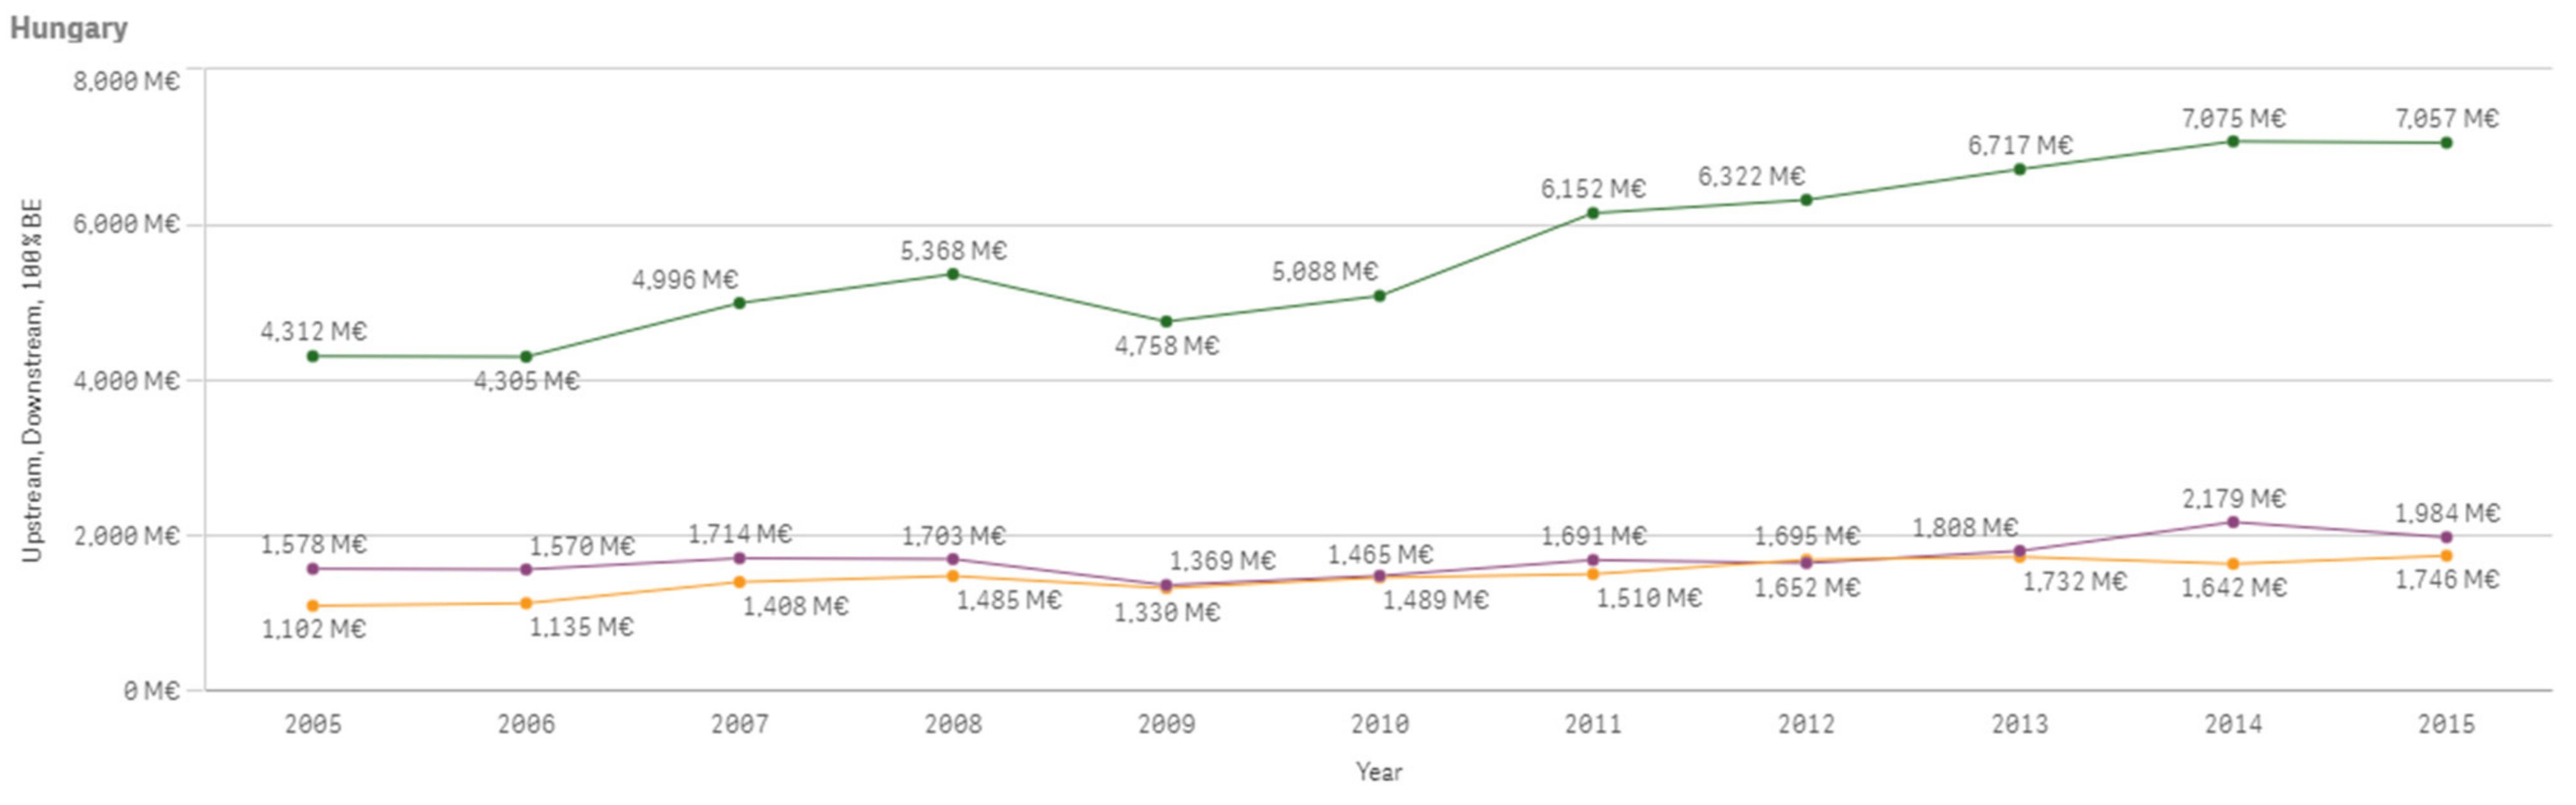
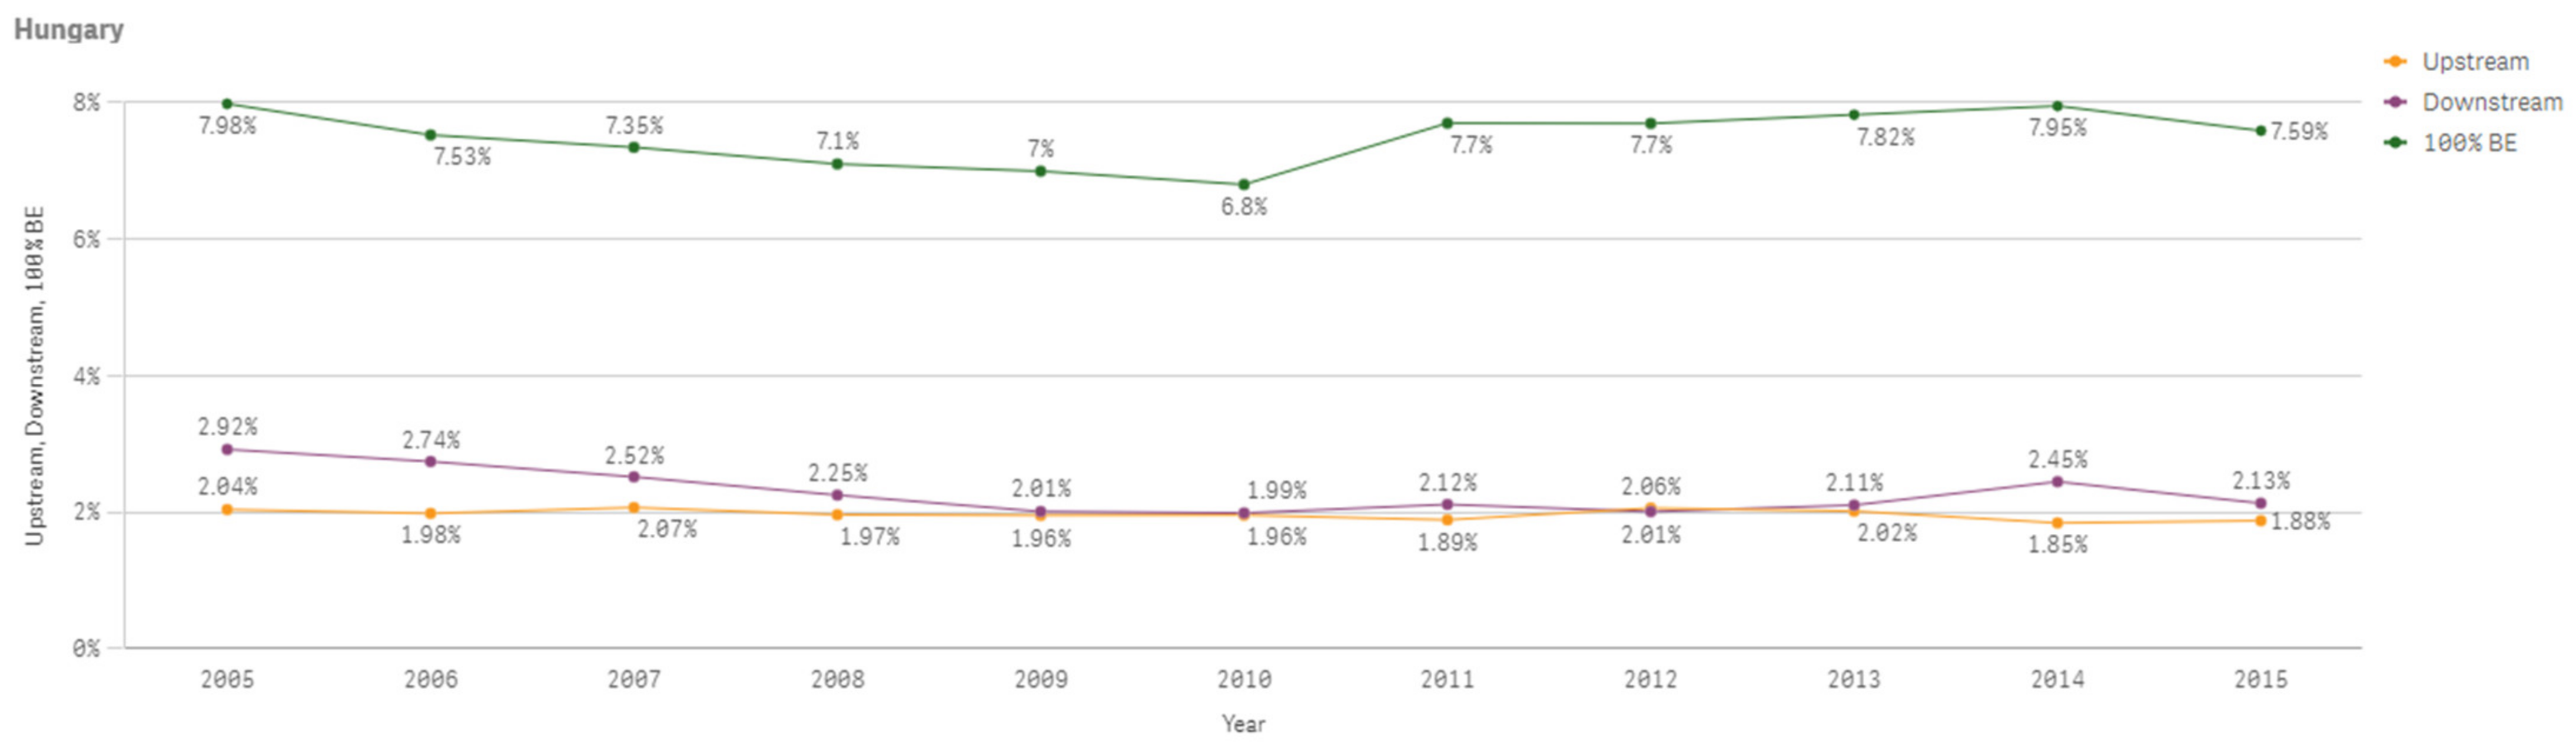
The following Figure A29 shows Hungary’s 100% bioeconomy value added, downstream bioeconomy value added and upstream bioeconomy value added which are increasing overall between 2005 and 2015. Figure A30 shows the percentage changes of the same values compared to total value added of the economy.
Figure A29.
Hungary 100% Bioeconomy Value Added, Downstream and Upstream Bioeconomy Value Added 2005–2015.
Figure A29.
Hungary 100% Bioeconomy Value Added, Downstream and Upstream Bioeconomy Value Added 2005–2015.

Figure A30.
Hungary 100% Bioeconomy Value Added, Downstream and Upstream Bioeconomy Value Added Shares 2005–2015.
Figure A30.
Hungary 100% Bioeconomy Value Added, Downstream and Upstream Bioeconomy Value Added Shares 2005–2015.

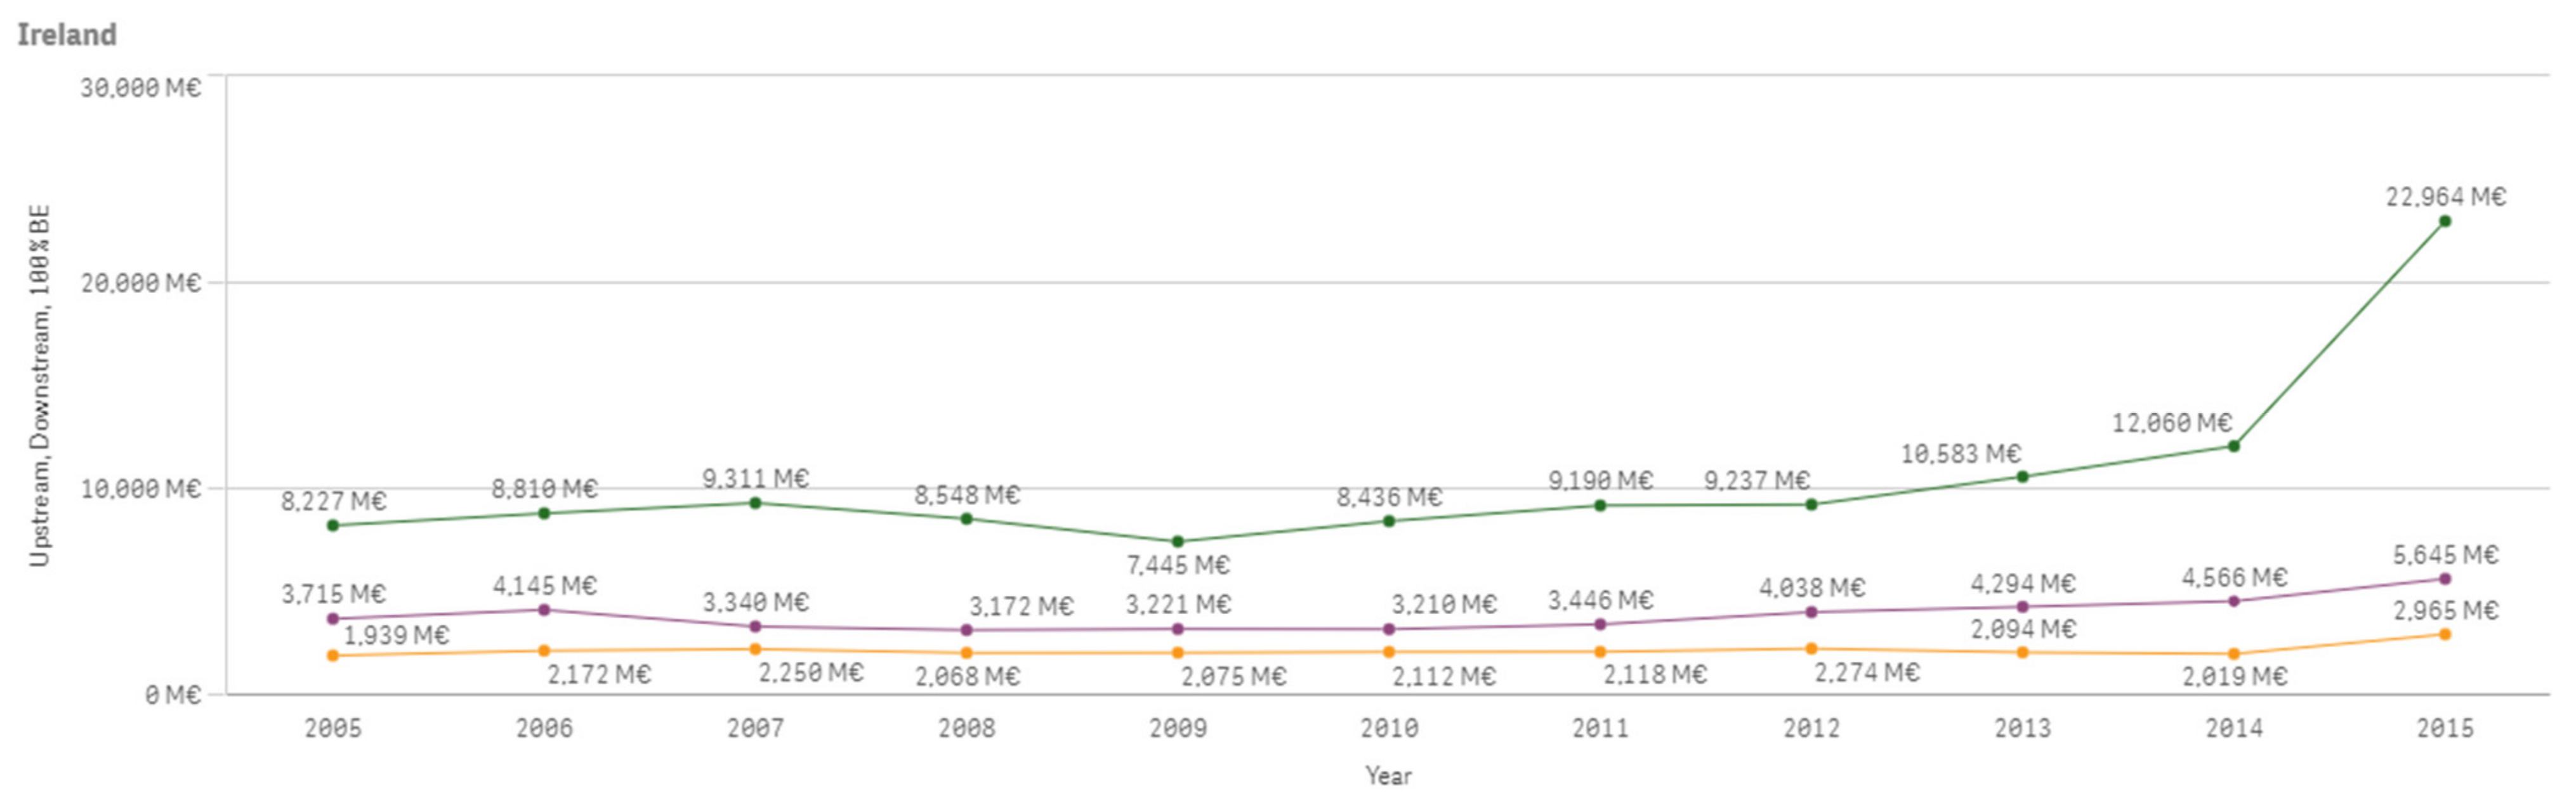
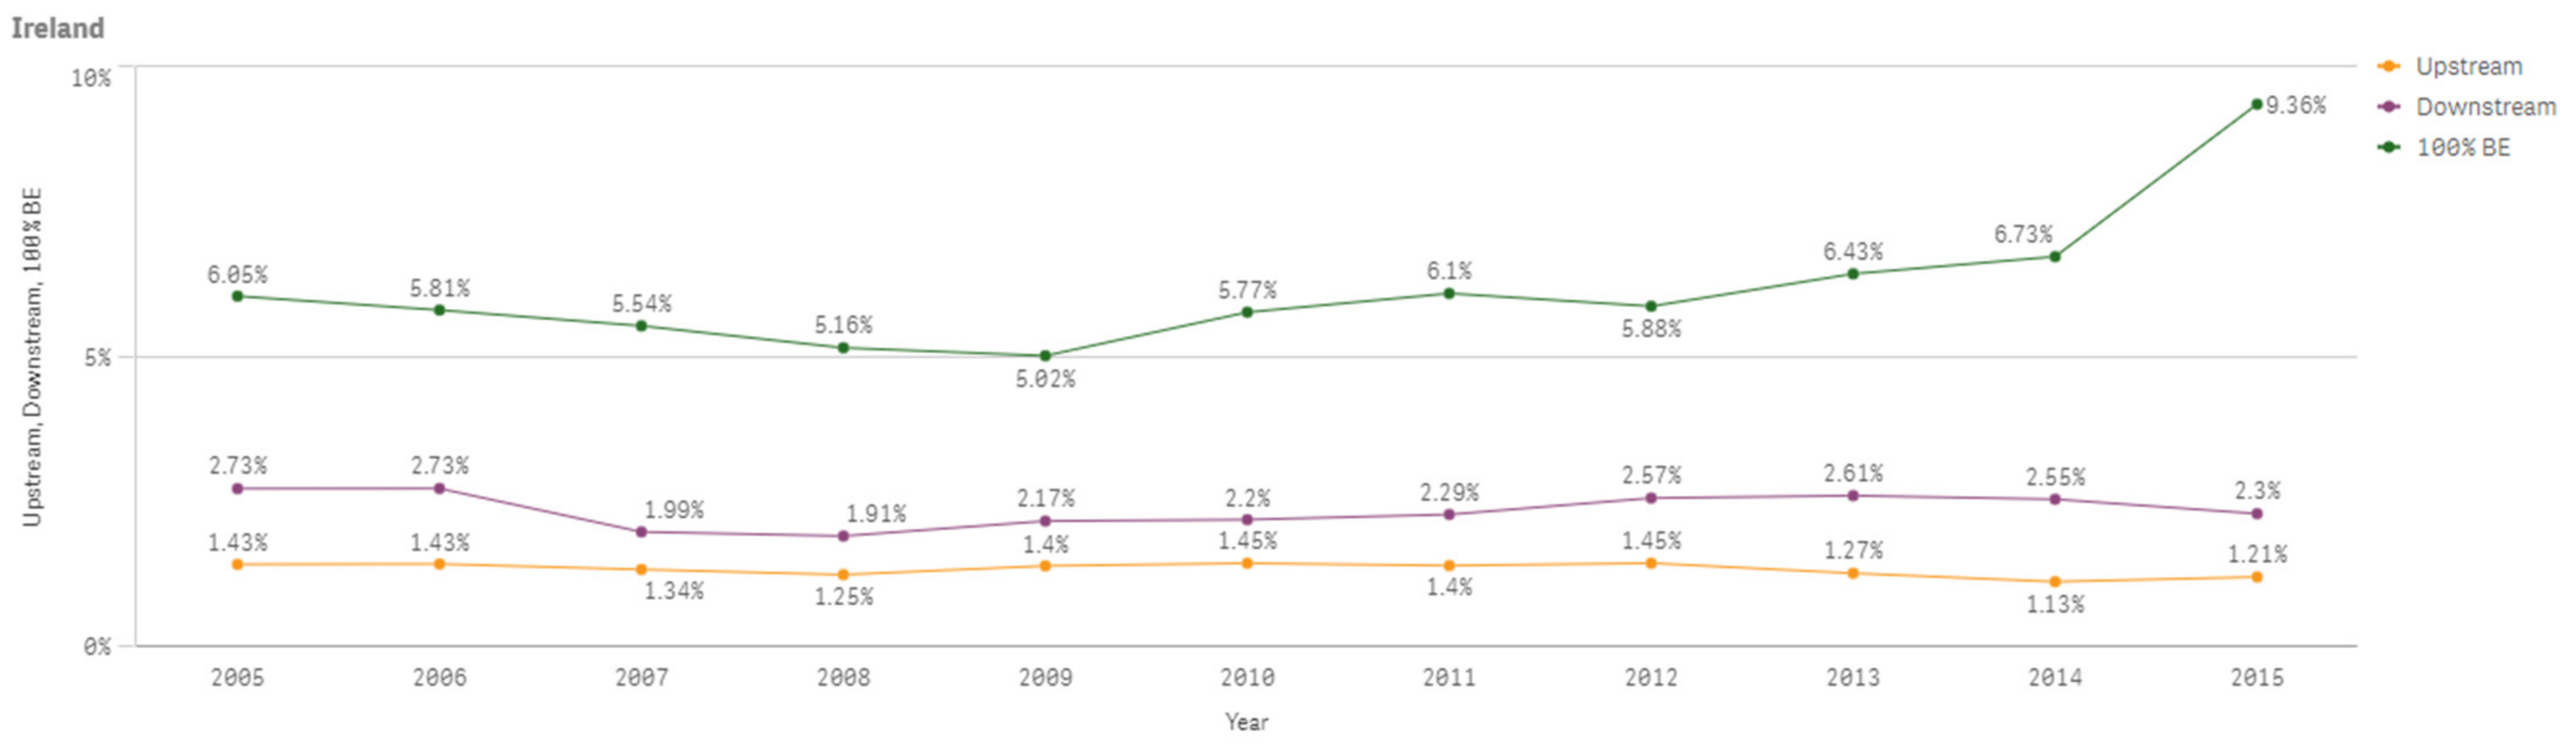
The following Figure A31 shows Ireland’s 100% bioeconomy value added, downstream bioeconomy value added and upstream bioeconomy value added which are increasing overall between 2005 and 2015. Figure A32 shows the percentage changes of the same values compared to total value added of the economy.
Figure A31.
Ireland 100% Bioeconomy Value Added, Downstream and Upstream Bioeconomy Value Added 2005–2015.
Figure A31.
Ireland 100% Bioeconomy Value Added, Downstream and Upstream Bioeconomy Value Added 2005–2015.

Figure A32.
Ireland 100% Bioeconomy Value Added, Downstream and Upstream Bioeconomy Value Added Shares 2005–2015.
Figure A32.
Ireland 100% Bioeconomy Value Added, Downstream and Upstream Bioeconomy Value Added Shares 2005–2015.

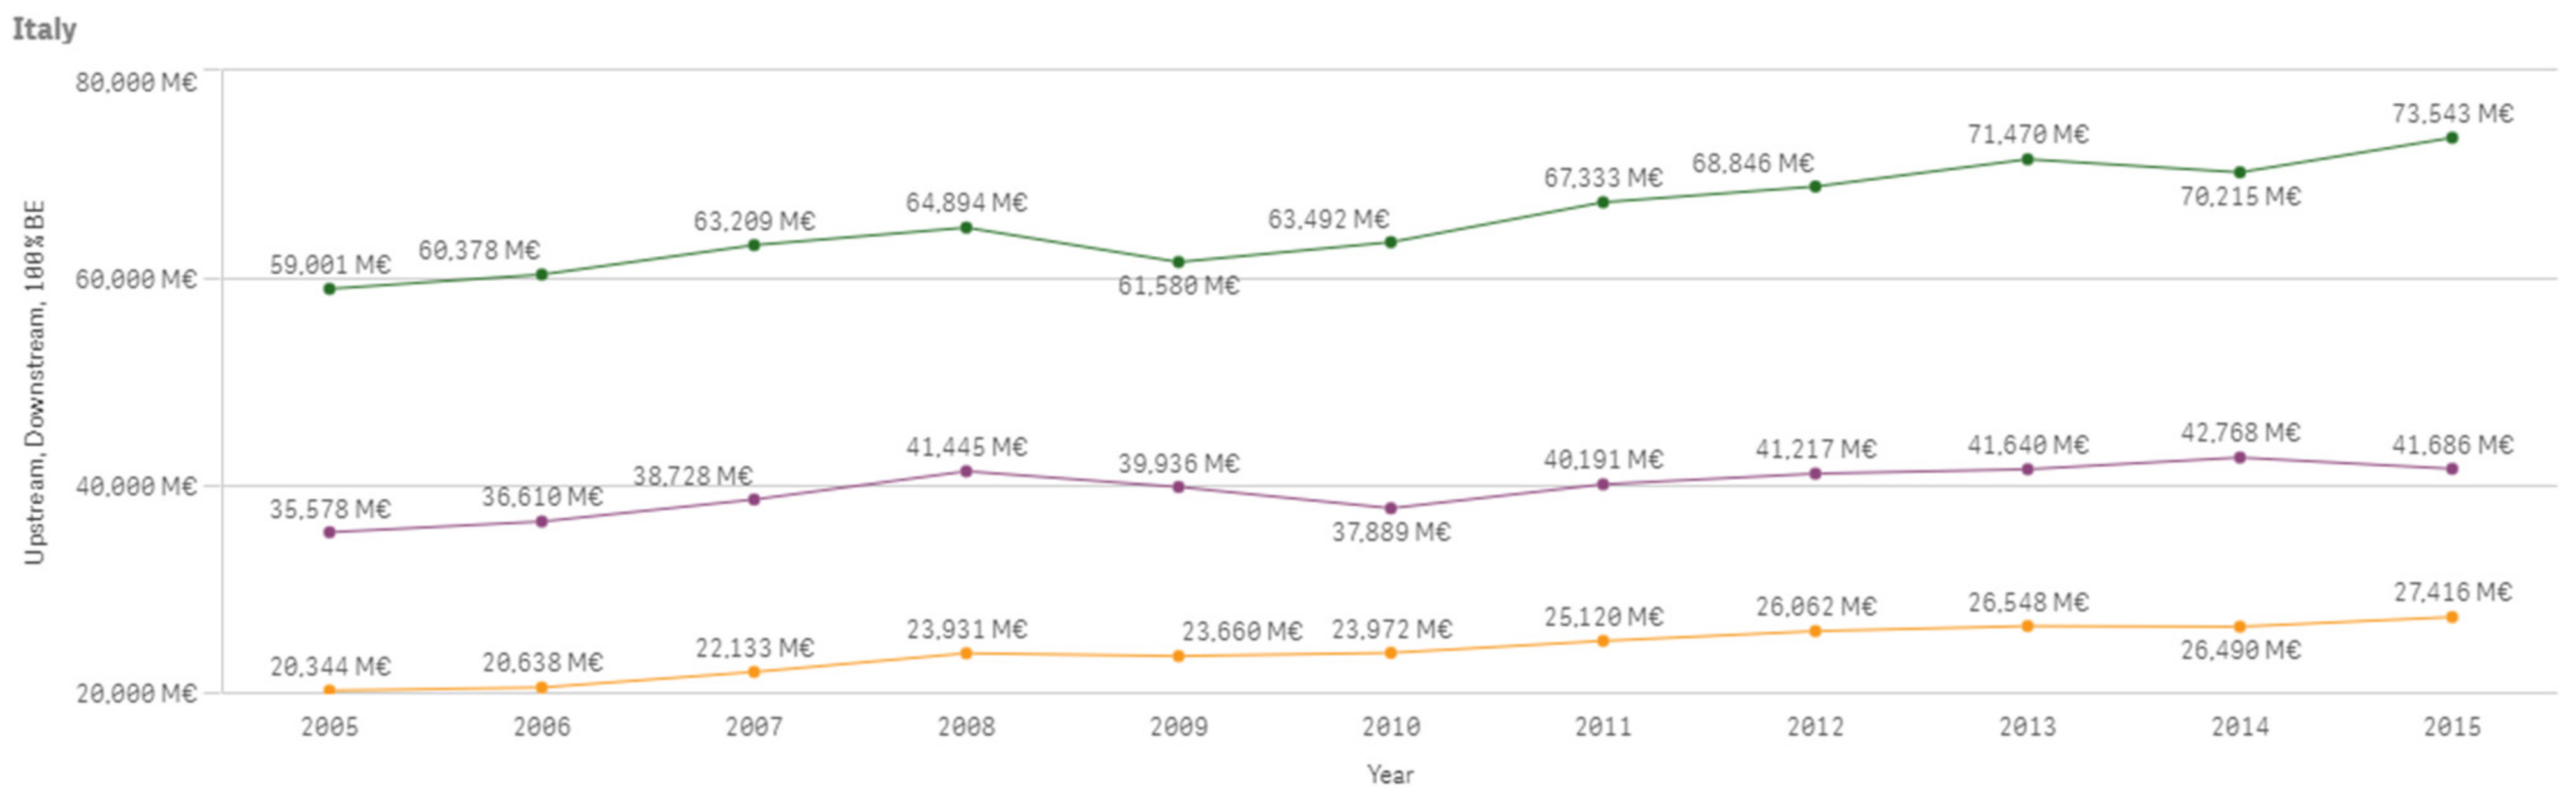
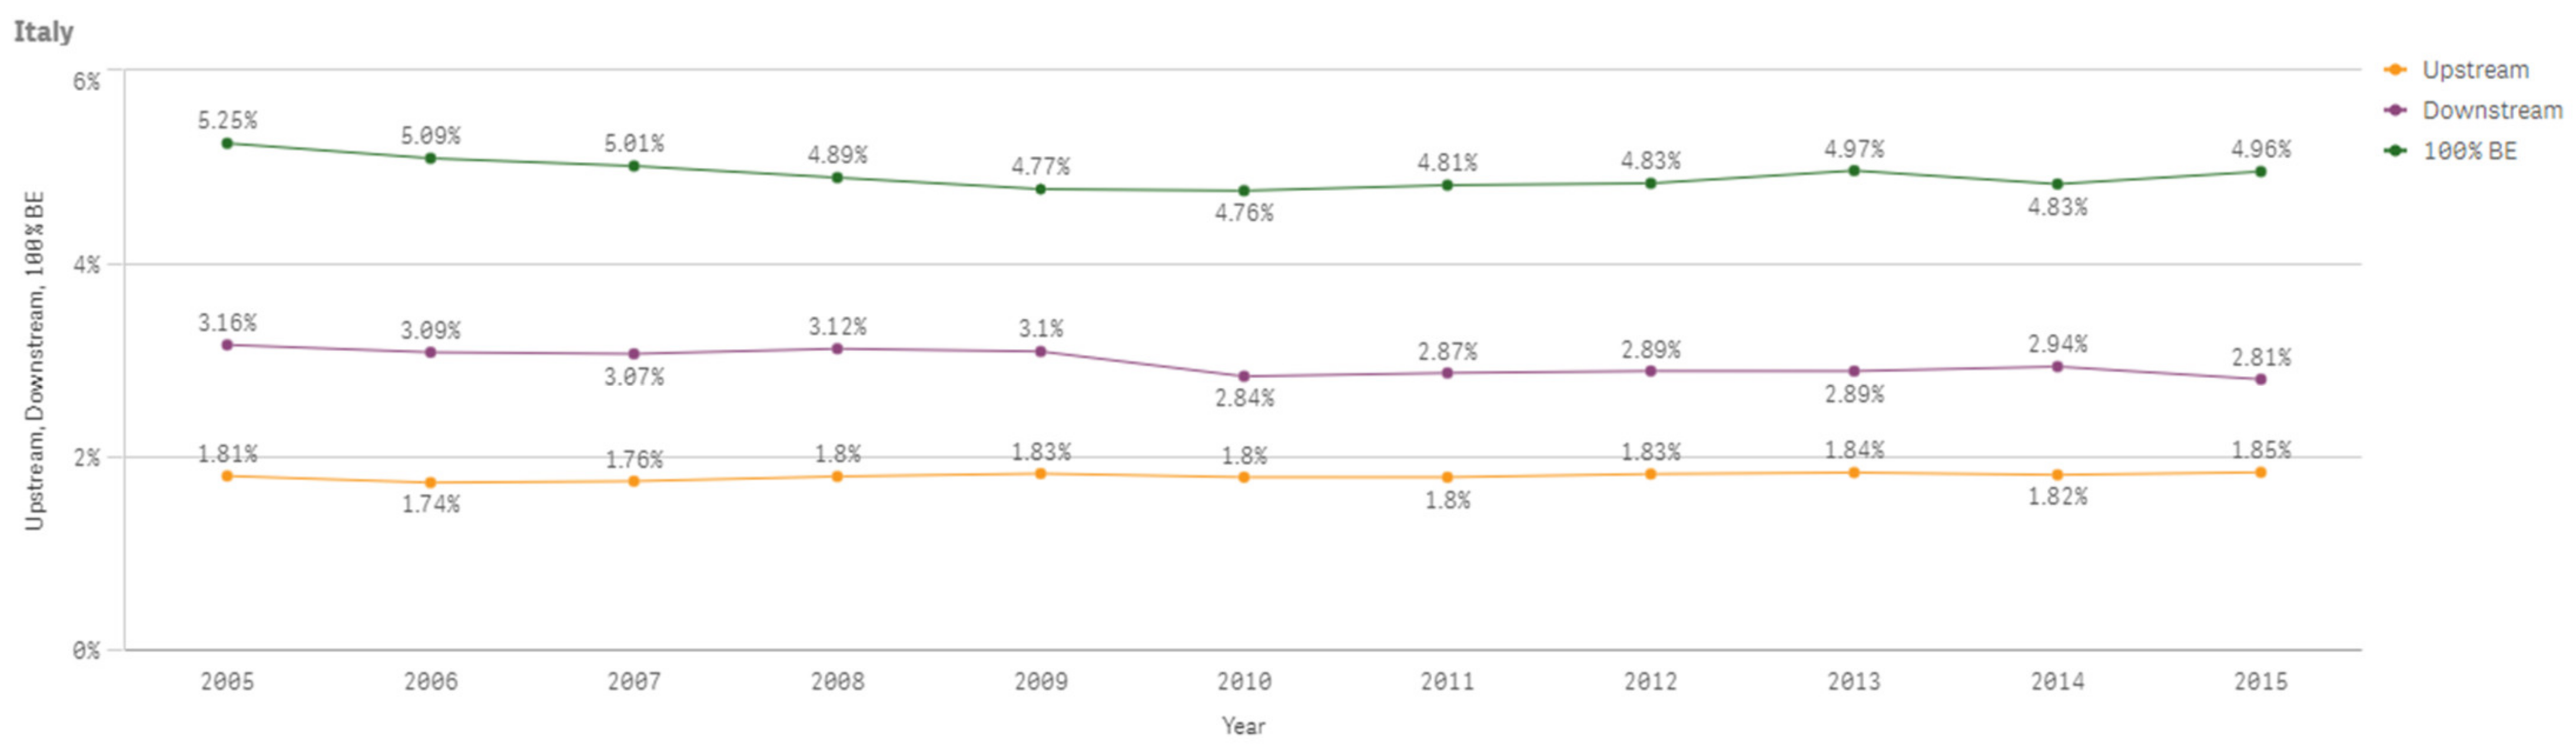
The following Figure A33 shows Italy’s 100% bioeconomy value added, downstream bioeconomy value added and upstream bioeconomy value added which are increasing overall between 2005 and 2015. Figure A34 shows the percentage changes of the same values compared to total value added of the economy.
Figure A33.
Italy 100% Bioeconomy Value Added, Downstream and Upstream Bioeconomy Value Added 2005–2015.
Figure A33.
Italy 100% Bioeconomy Value Added, Downstream and Upstream Bioeconomy Value Added 2005–2015.

Figure A34.
Italy Bioeconomy 100% Bioeconomy Value Added, Downstream and Upstream Bioeconomy Value Added Shares 2005–2015.
Figure A34.
Italy Bioeconomy 100% Bioeconomy Value Added, Downstream and Upstream Bioeconomy Value Added Shares 2005–2015.

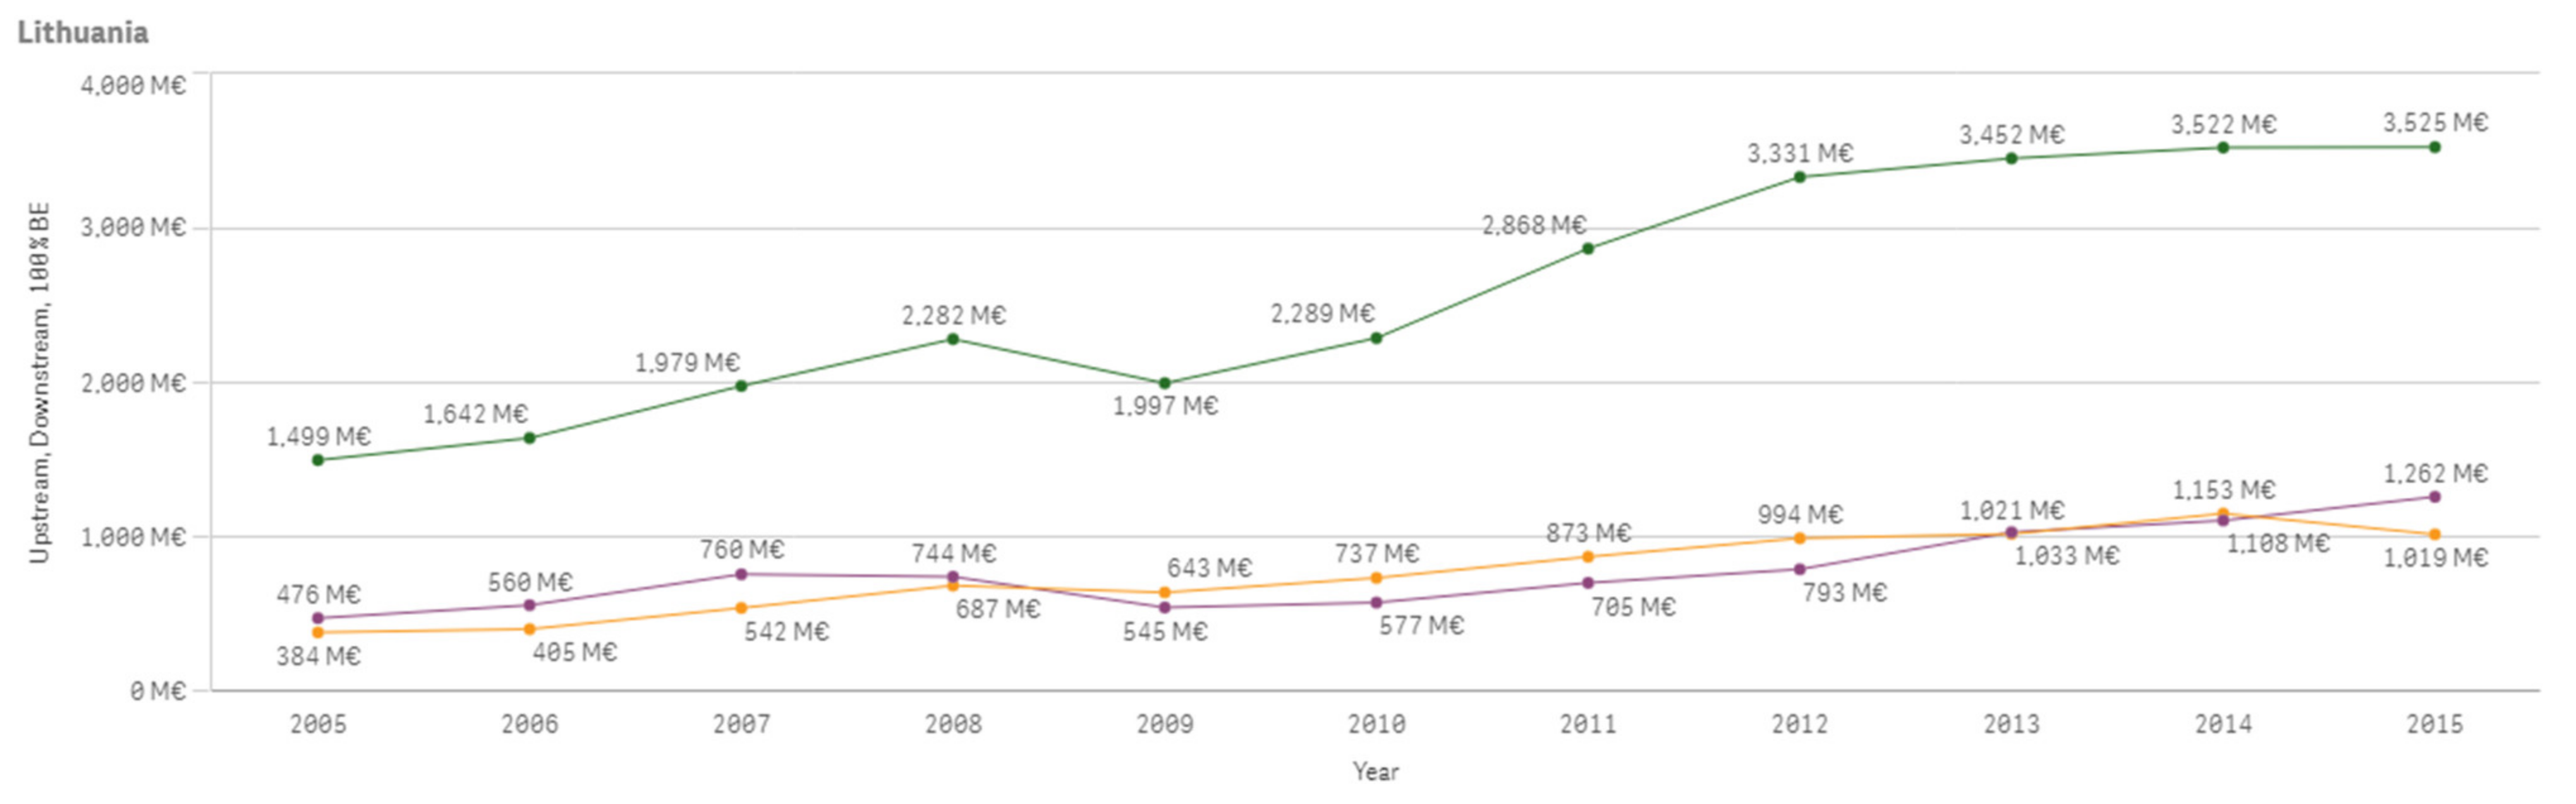
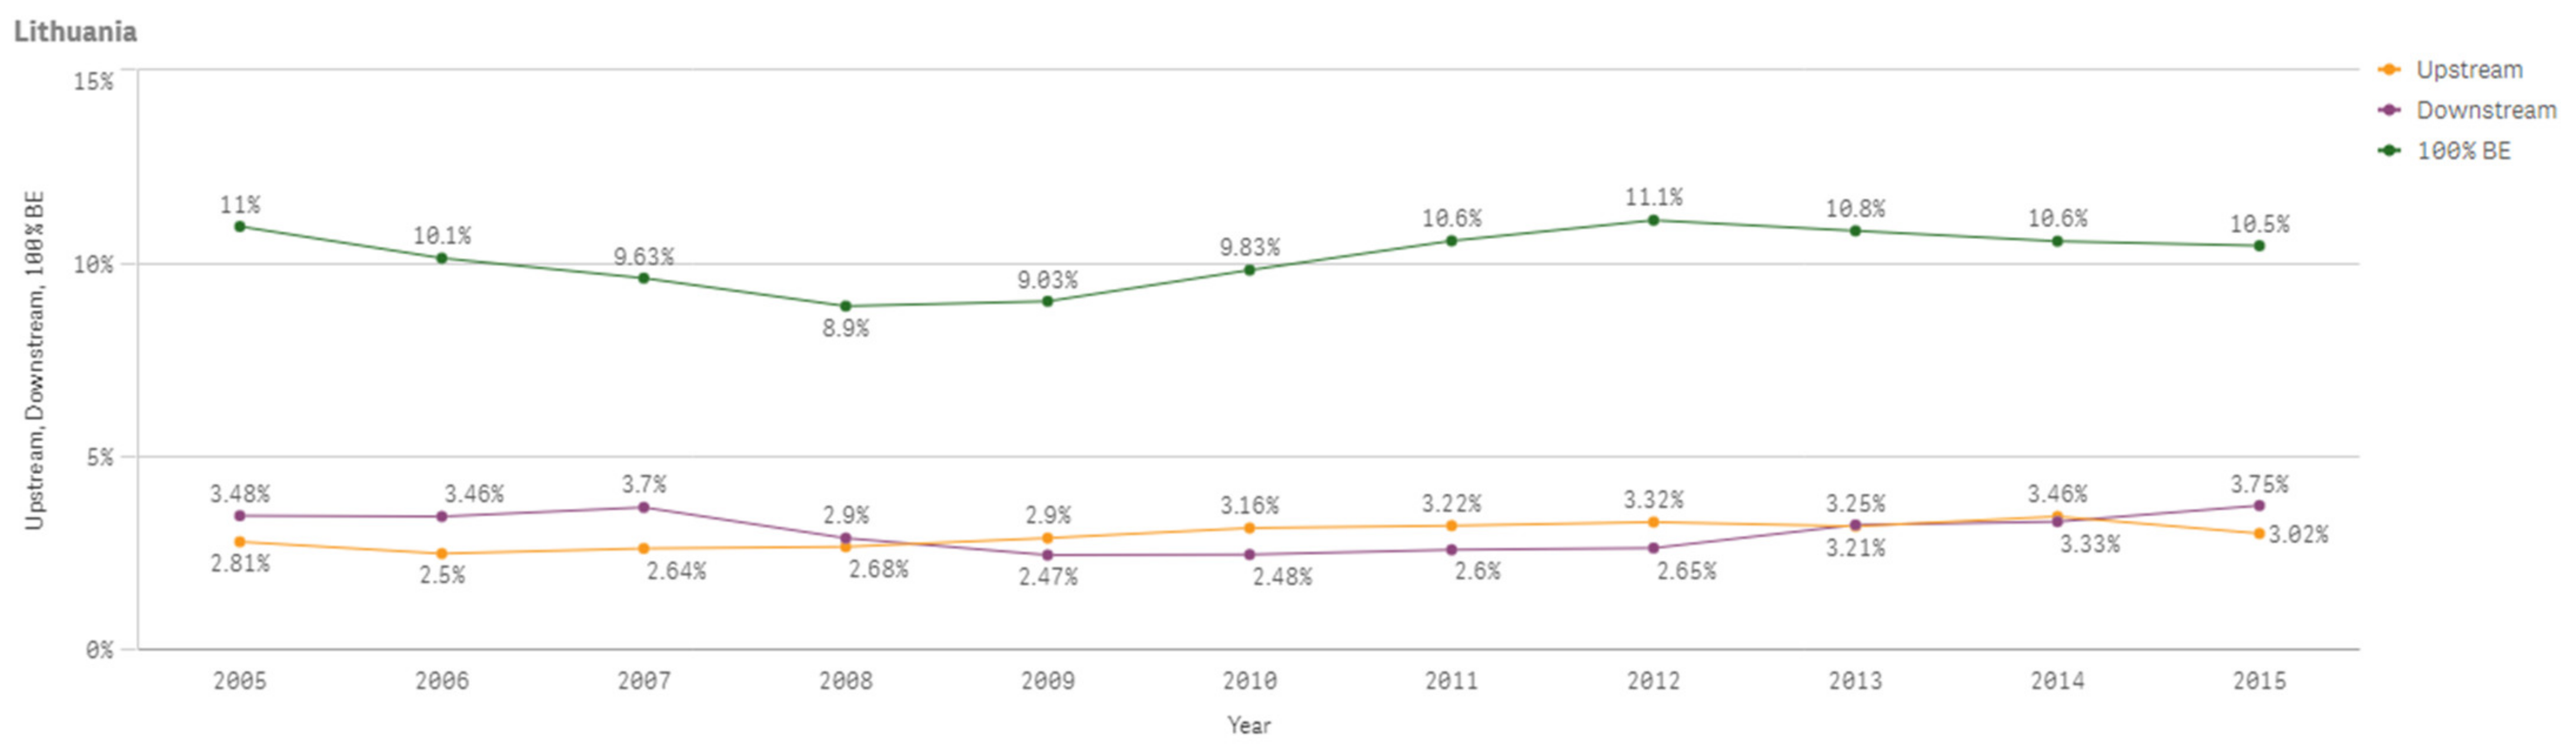
The following Figure A35 shows Lithuania’s 100% bioeconomy value added, downstream bioeconomy value added and upstream bioeconomy value added which are increasing overall between 2005 and 2015. Figure A36 shows the percentage changes of the same values compared to total value added of the economy.
Figure A35.
Lithuania 100% Bioeconomy Value Added, Downstream and Upstream Bioeconomy Value Added 2005–2015.
Figure A35.
Lithuania 100% Bioeconomy Value Added, Downstream and Upstream Bioeconomy Value Added 2005–2015.

Figure A36.
Lithuania 100% Bioeconomy Value Added, Downstream and Upstream Bioeconomy Value Added Shares 2005–2015.
Figure A36.
Lithuania 100% Bioeconomy Value Added, Downstream and Upstream Bioeconomy Value Added Shares 2005–2015.

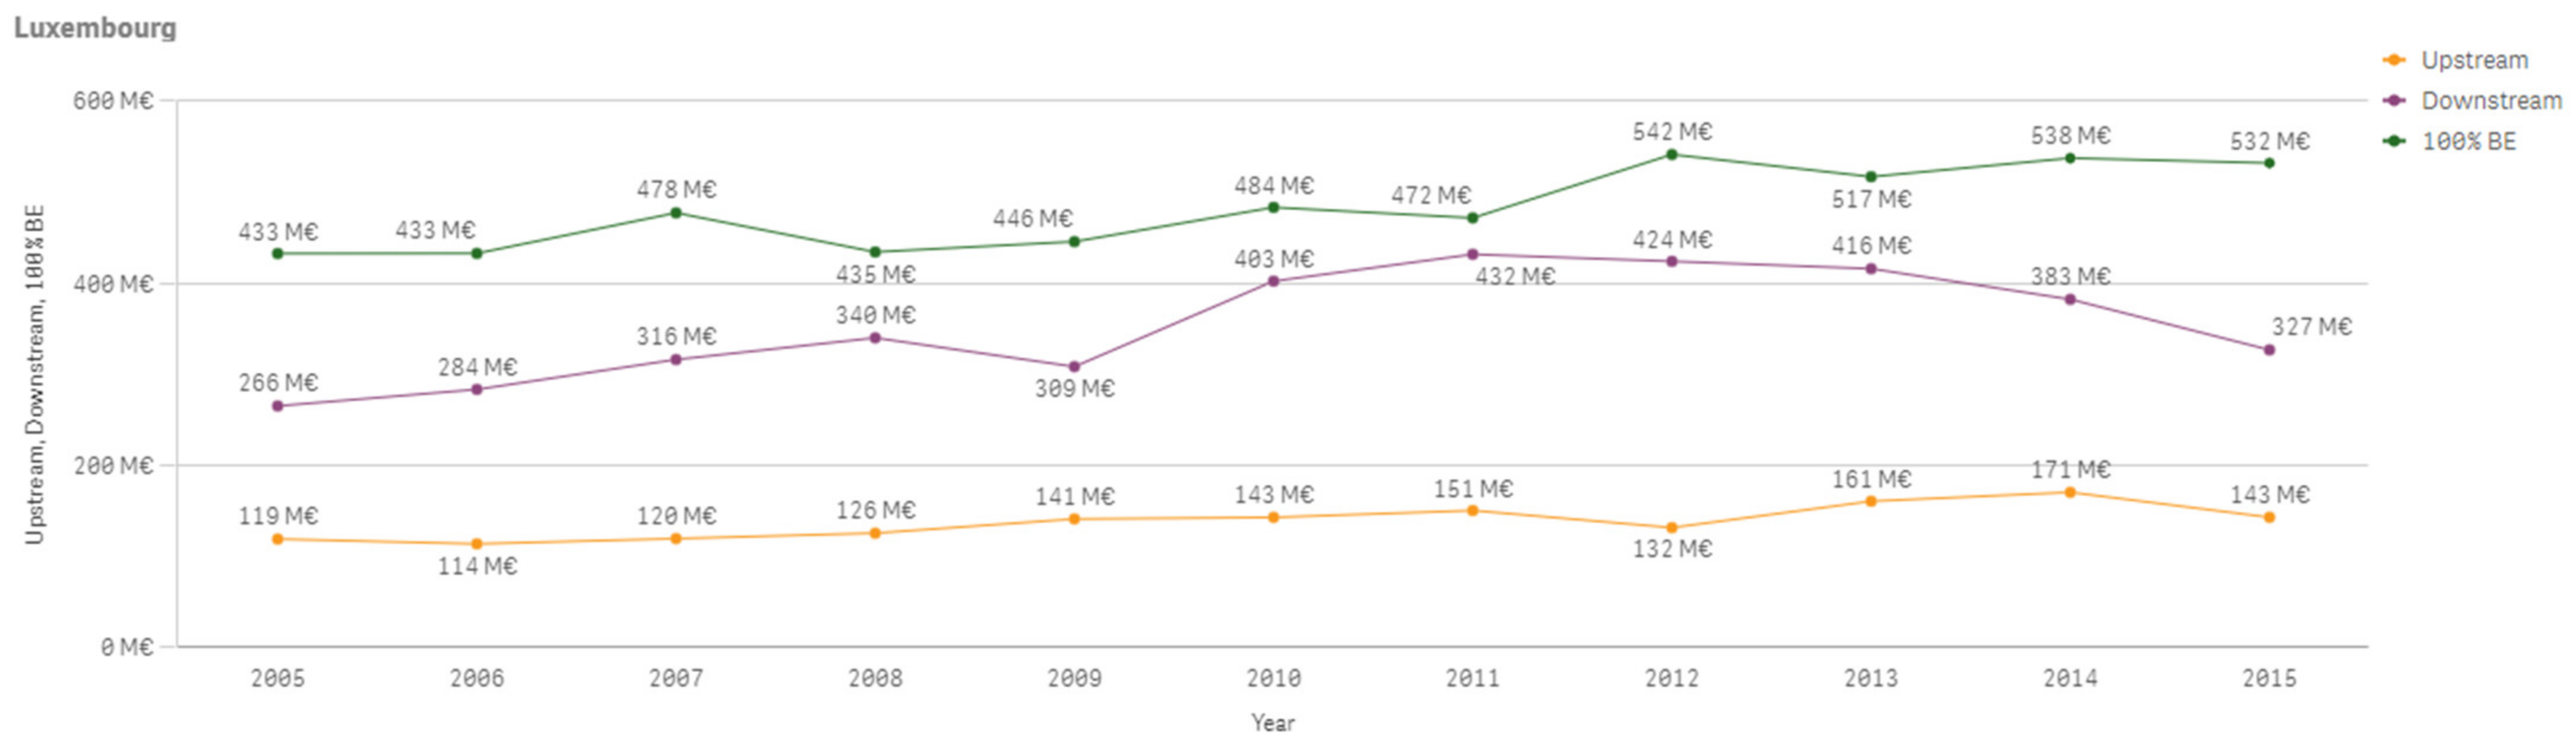
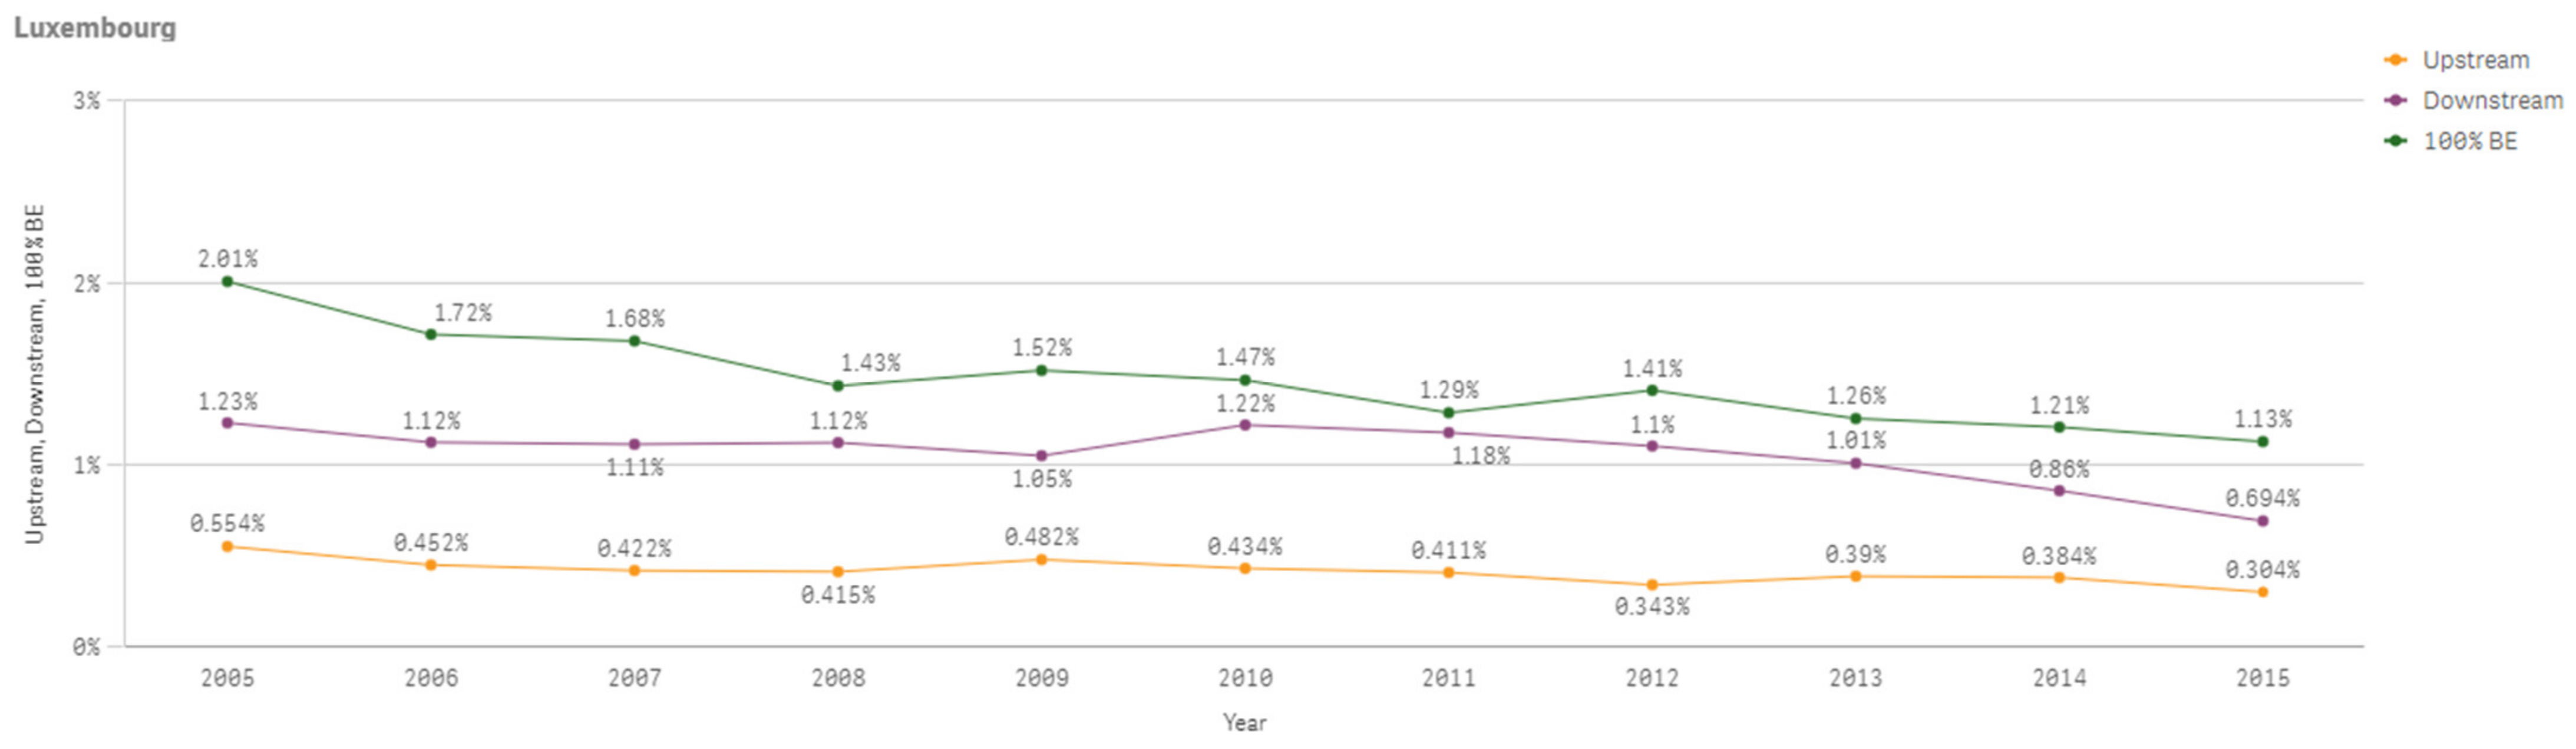
The following Figure A37 shows United Luxembourg’s 100% bioeconomy value added, downstream bioeconomy value added and upstream bioeconomy value added which are increasing overall between 2005 and 2015. Figure A38 shows the percentage changes of the same values compared to total value added of the economy.
Figure A37.
Luxembourg 100% Bioeconomy Value Added, Downstream and Upstream Bioeconomy Value Added 2005–2015.
Figure A37.
Luxembourg 100% Bioeconomy Value Added, Downstream and Upstream Bioeconomy Value Added 2005–2015.

Figure A38.
Luxembourg 100% Bioeconomy Value Added, Downstream and Upstream Bioeconomy Value Added Shares 2005–2015.
Figure A38.
Luxembourg 100% Bioeconomy Value Added, Downstream and Upstream Bioeconomy Value Added Shares 2005–2015.

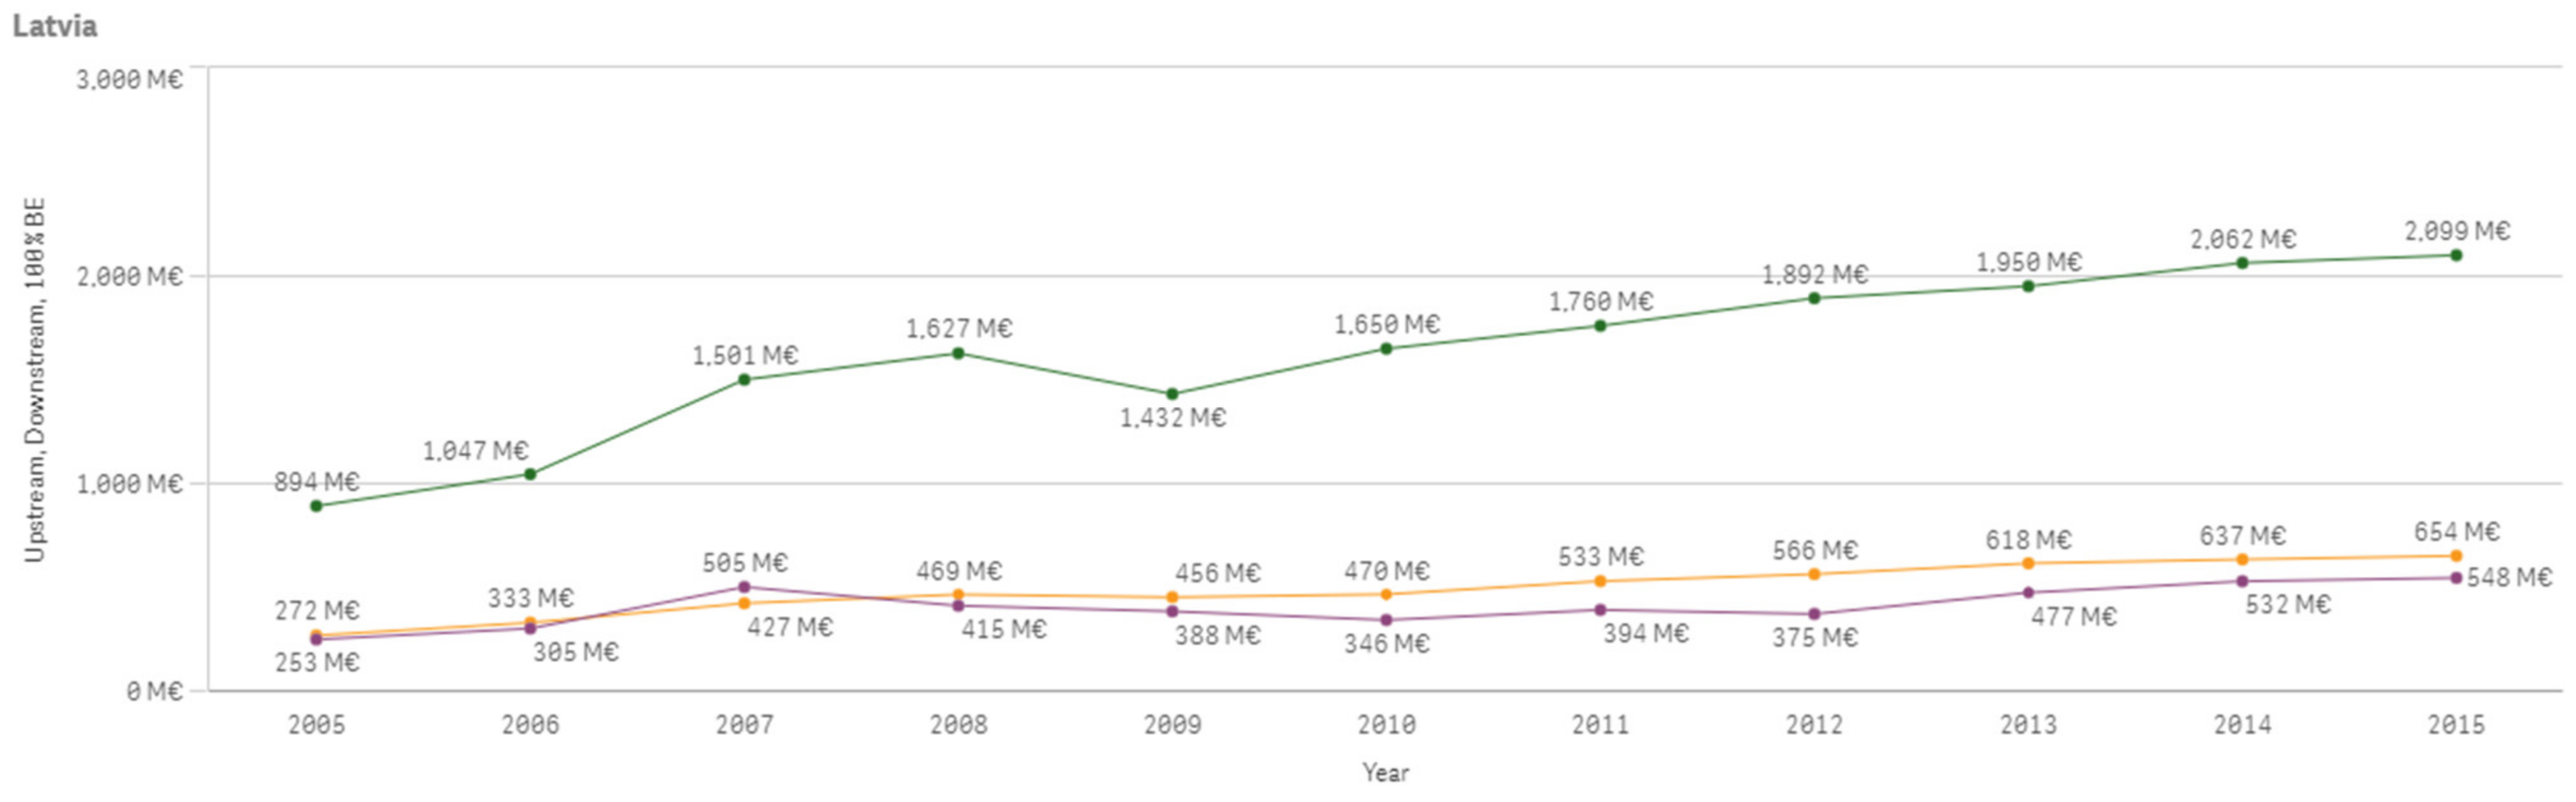
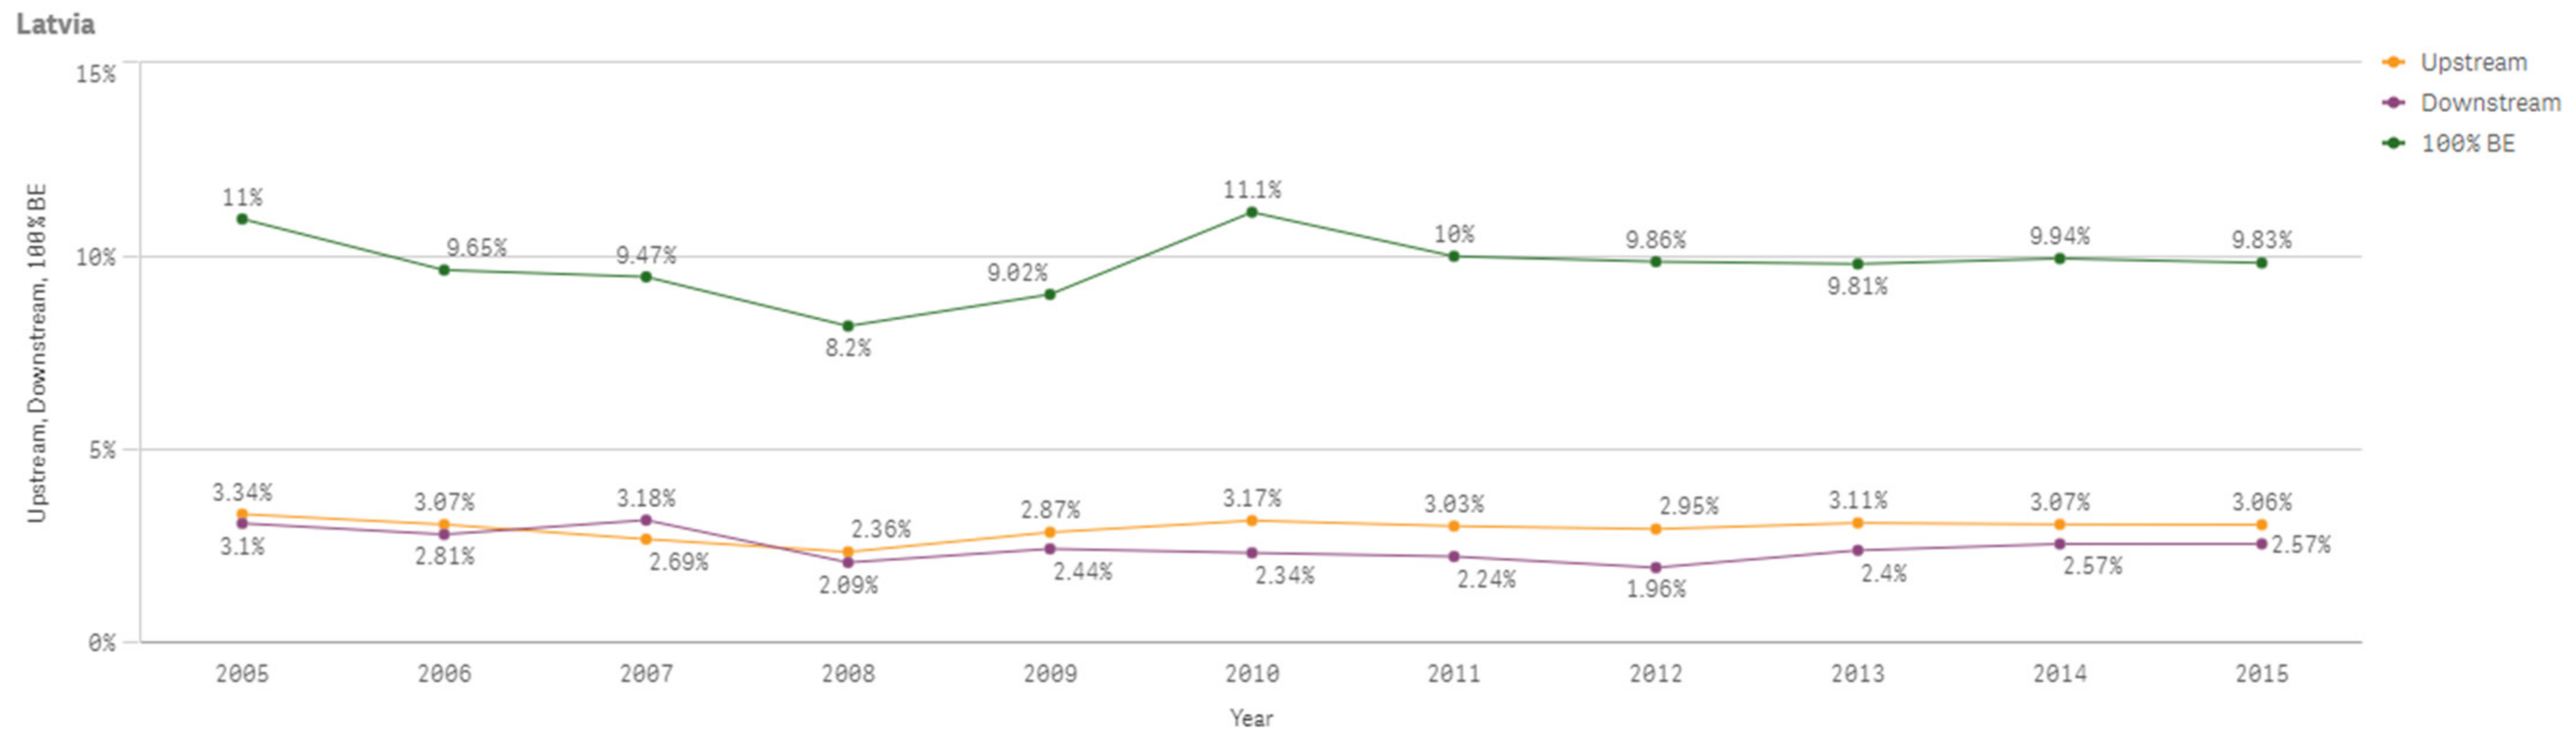
The following Figure A39 shows Latvia’s 100% bioeconomy value added, downstream bioeconomy value added and upstream bioeconomy value added which are increasing overall between 2005 and 2015. Figure A40 shows the percentage changes of the same values compared to total value added of the economy.
Figure A39.
Latvia 100% Bioeconomy Value Added, Downstream and Upstream Bioeconomy Value Added 2005–2015.
Figure A39.
Latvia 100% Bioeconomy Value Added, Downstream and Upstream Bioeconomy Value Added 2005–2015.

Figure A40.
Latvia Bioeconomy 100% Bioeconomy Value Added, Downstream and Upstream Bioeconomy Value Added Shares 2005–2015.
Figure A40.
Latvia Bioeconomy 100% Bioeconomy Value Added, Downstream and Upstream Bioeconomy Value Added Shares 2005–2015.

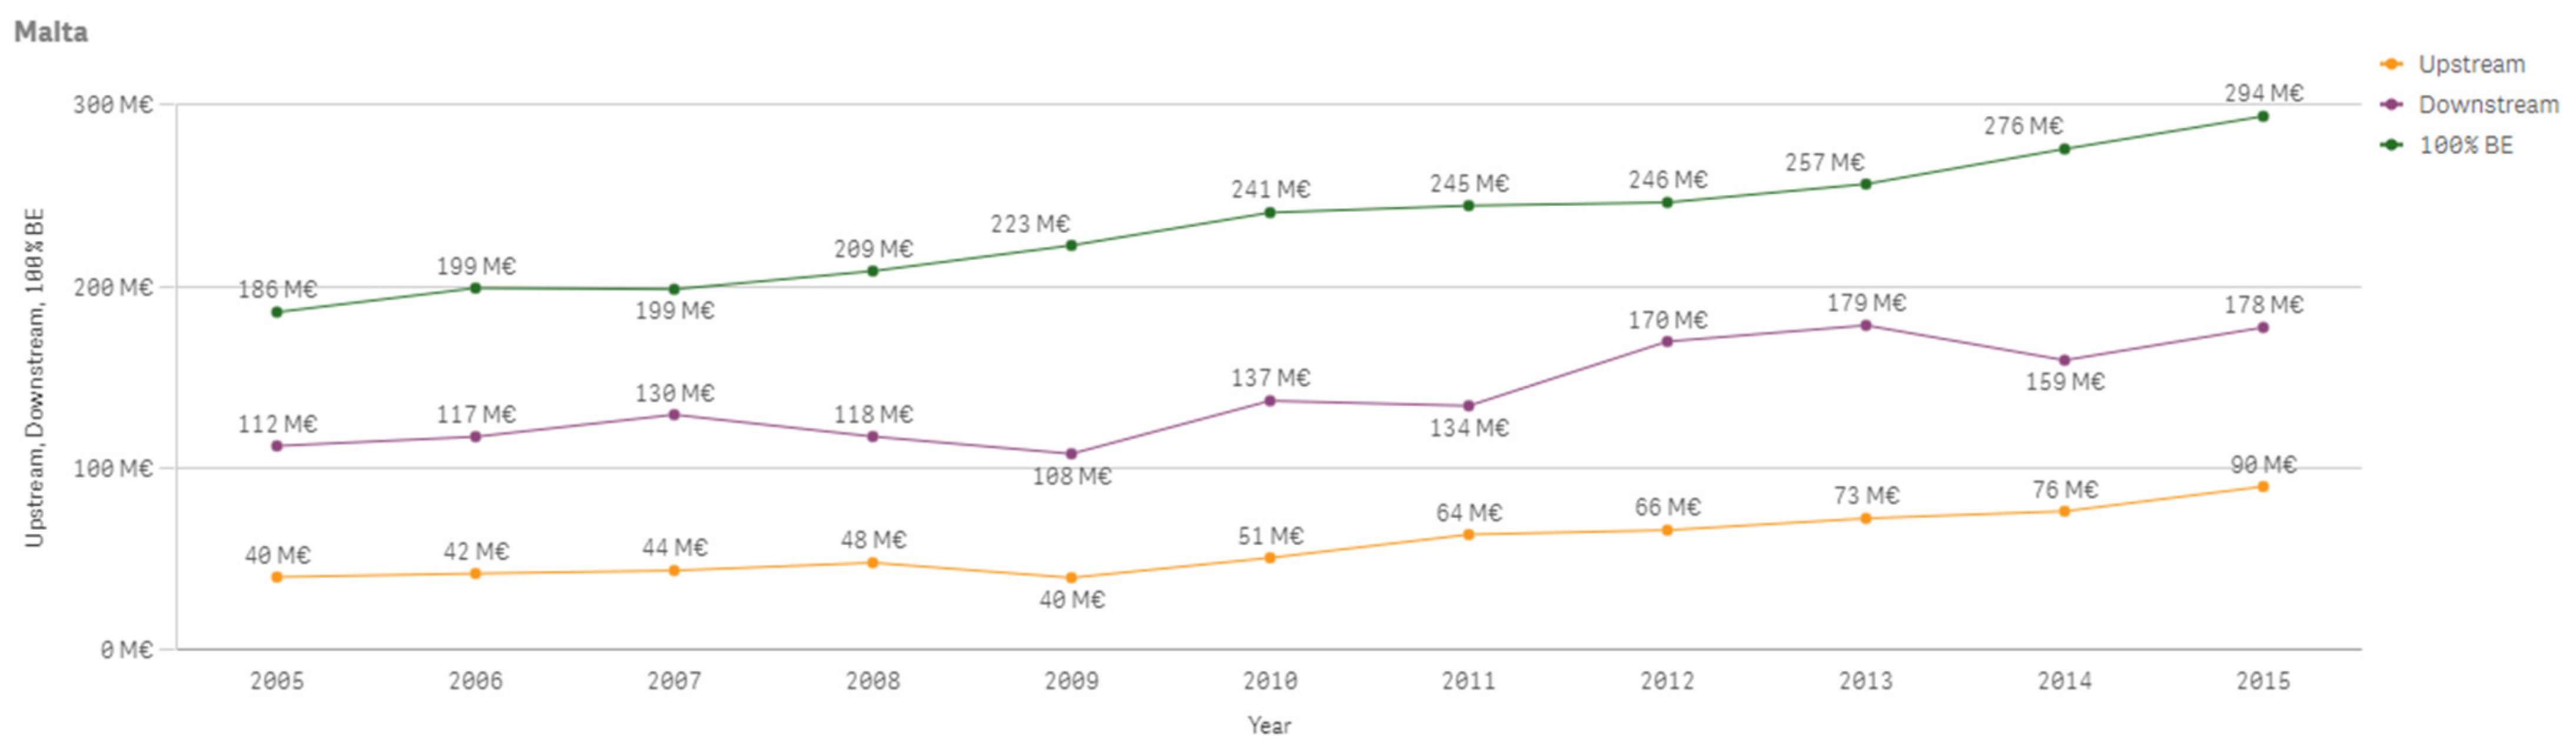
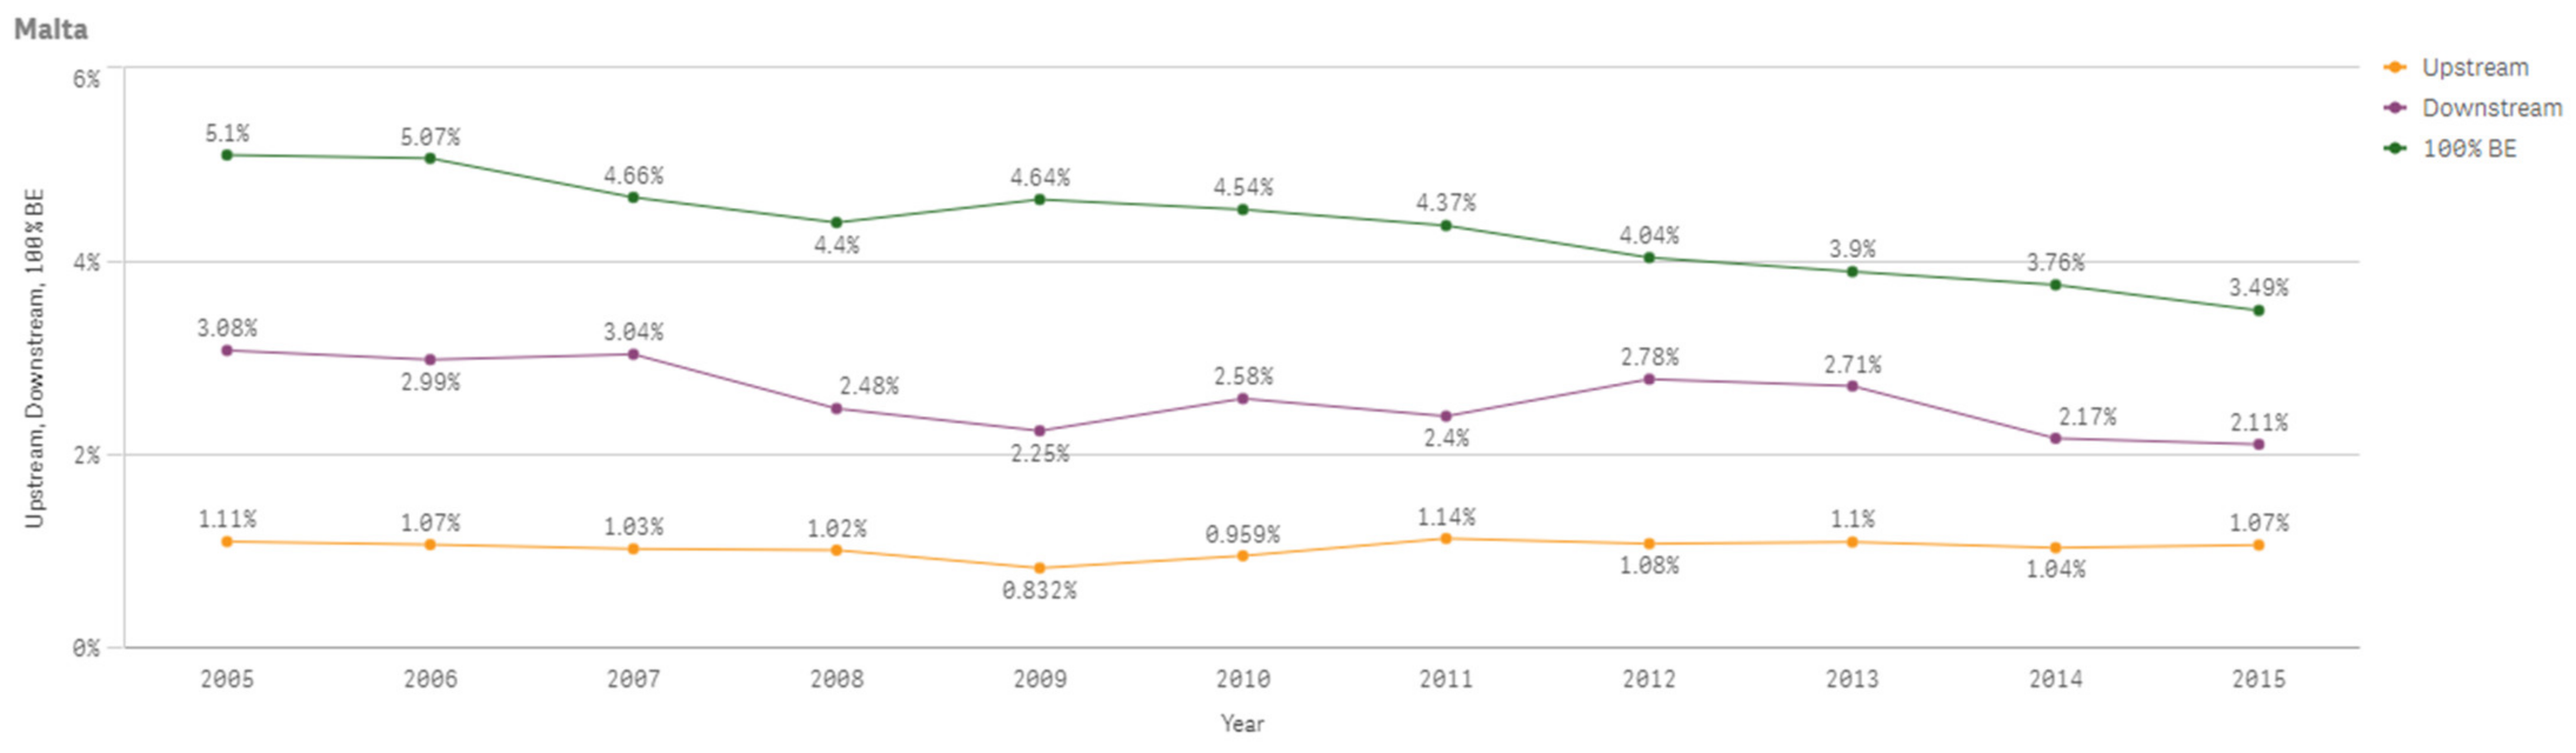
The following Figure A41 shows Malta’s 100% bioeconomy value added, downstream bioeconomy value added and upstream bioeconomy value added which are increasing overall between 2005 and 2015. Figure A42 shows the percentage changes of the same values compared to total value added of the economy.
Figure A41.
Malta 100% Bioeconomy Value Added, Downstream and Upstream Bioeconomy Value Added 2005–2015.
Figure A41.
Malta 100% Bioeconomy Value Added, Downstream and Upstream Bioeconomy Value Added 2005–2015.

Figure A42.
Malta Bioeconomy 100% Bioeconomy Value Added, Downstream and Upstream Bioeconomy Value Added Shares 2005–2015.
Figure A42.
Malta Bioeconomy 100% Bioeconomy Value Added, Downstream and Upstream Bioeconomy Value Added Shares 2005–2015.

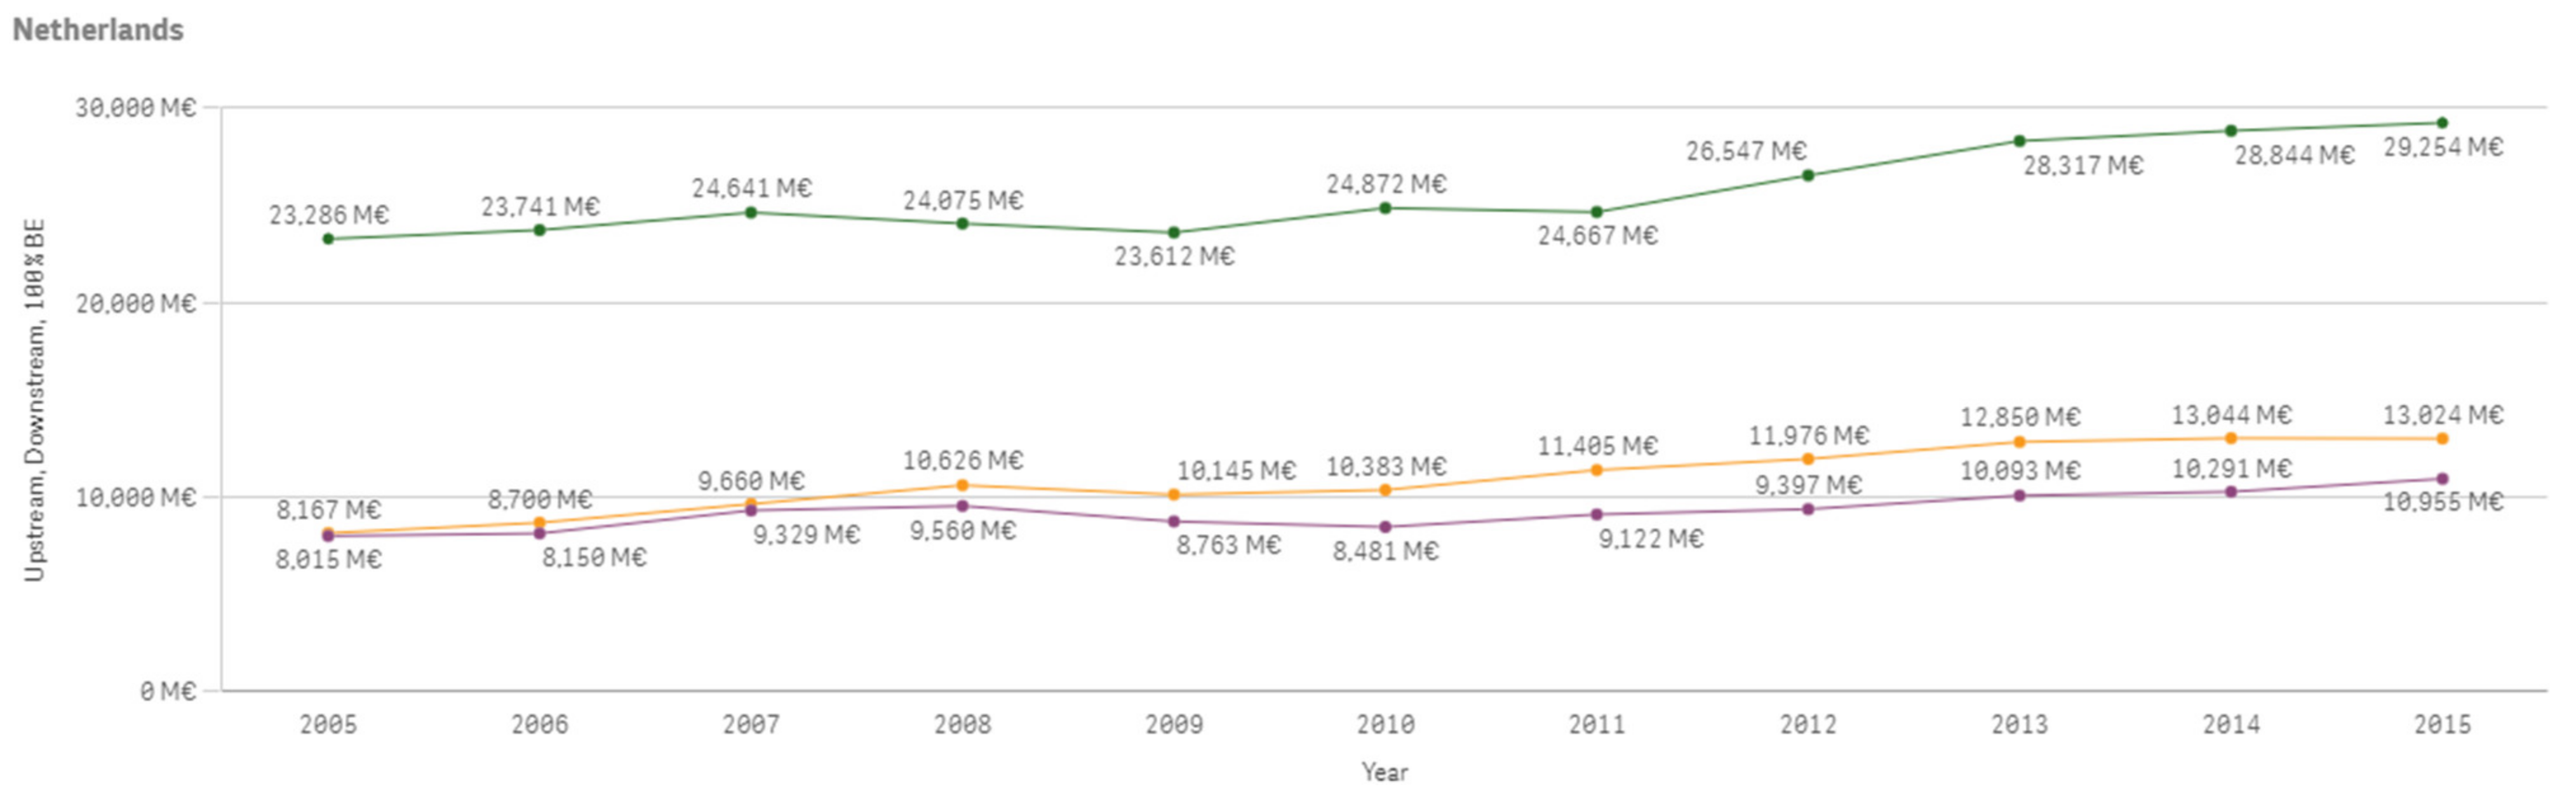
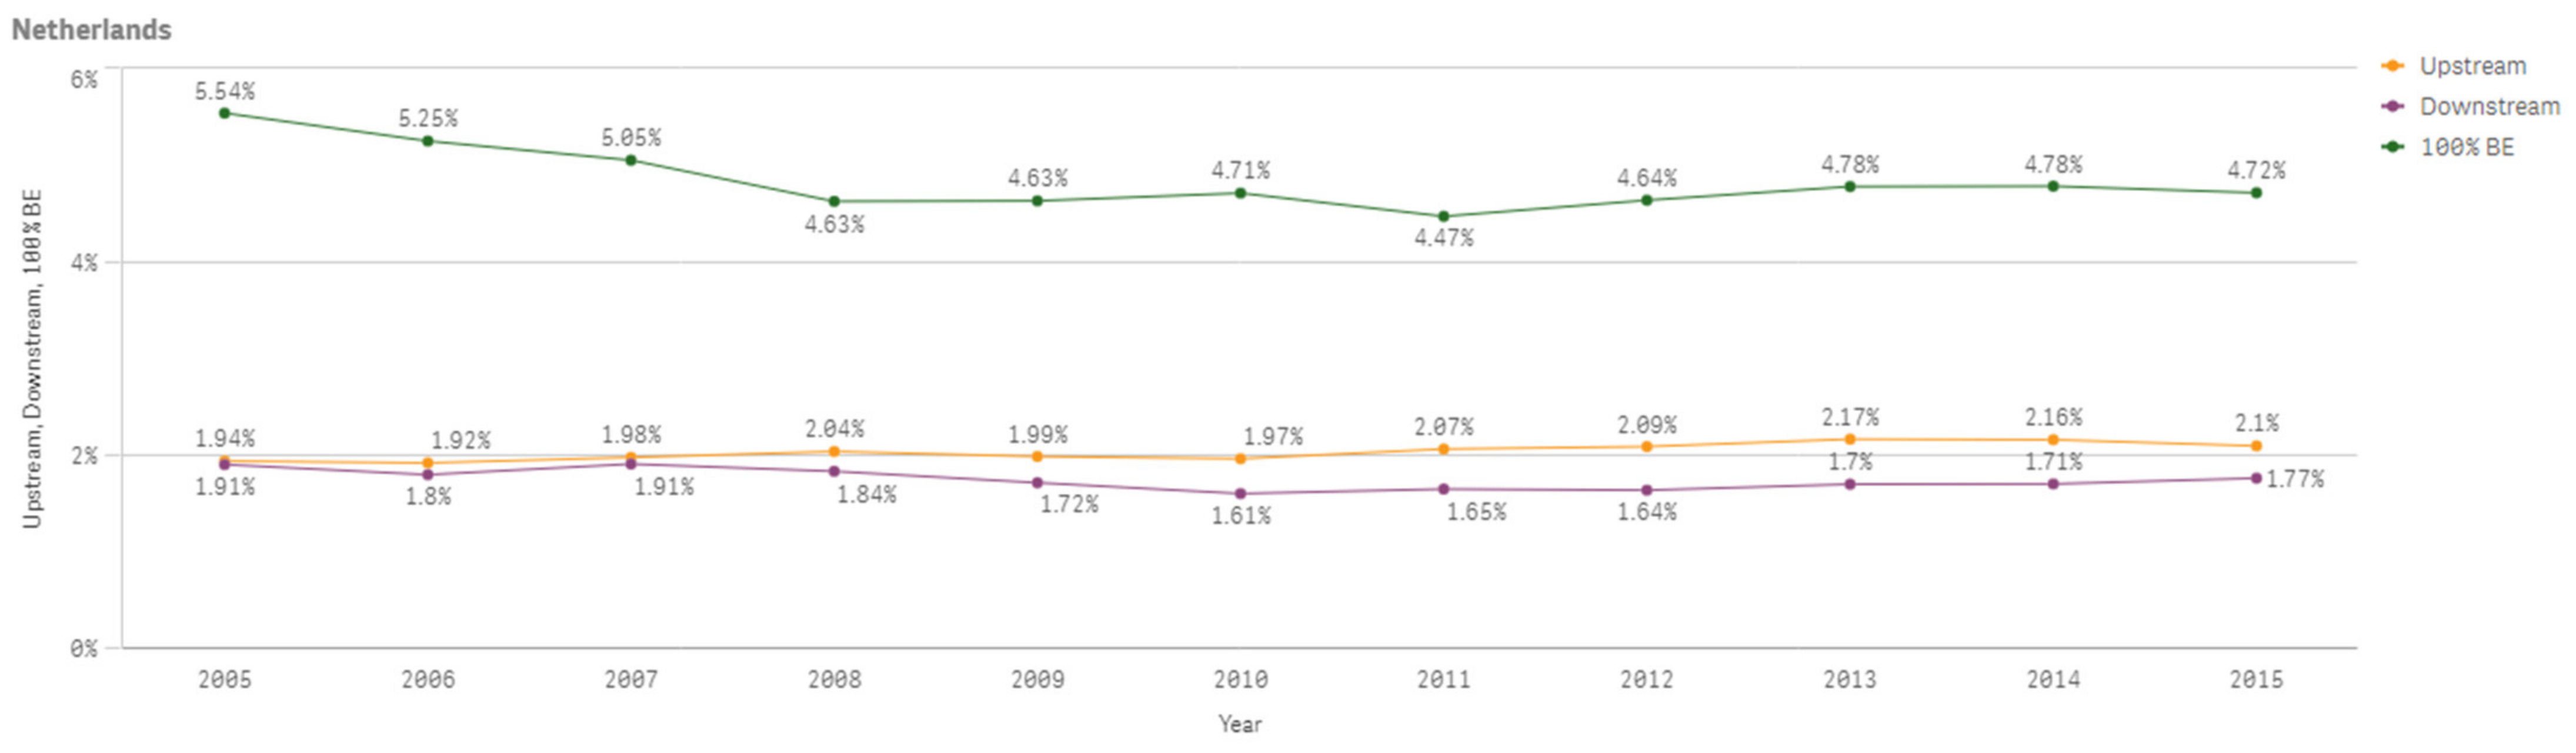
The following Figure A43 shows Netherland’s 100% bioeconomy value added, downstream bioeconomy value added and upstream bioeconomy value added which are increasing overall between 2005 and 2015. Figure A44 shows the percentage changes of the same values compared to total value added of the economy.
Figure A43.
Netherlands 100% Bioeconomy Value Added, Downstream and Upstream Bioeconomy Value Added 2005–2015.
Figure A43.
Netherlands 100% Bioeconomy Value Added, Downstream and Upstream Bioeconomy Value Added 2005–2015.

Figure A44.
Netherlands 100% Bioeconomy Value Added, Downstream and Upstream Bioeconomy Value Added Shares 2005–2015.
Figure A44.
Netherlands 100% Bioeconomy Value Added, Downstream and Upstream Bioeconomy Value Added Shares 2005–2015.

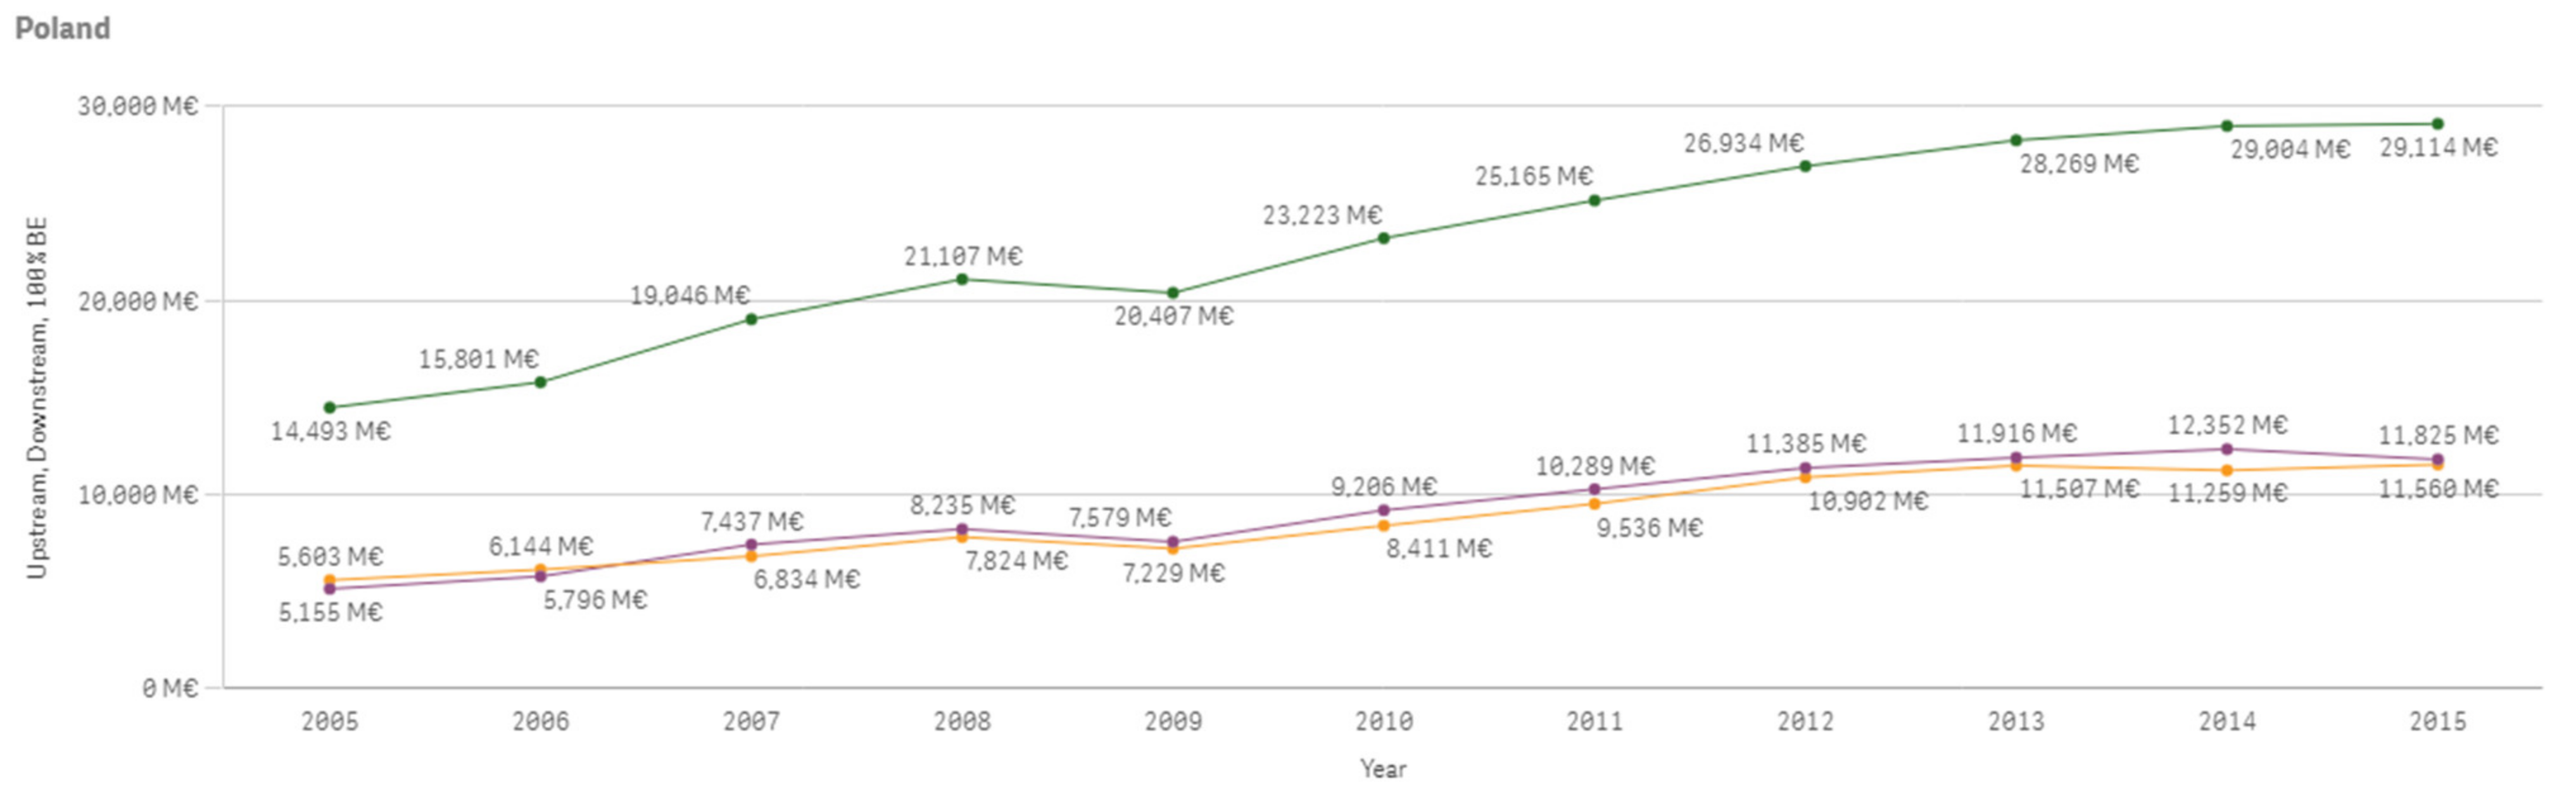
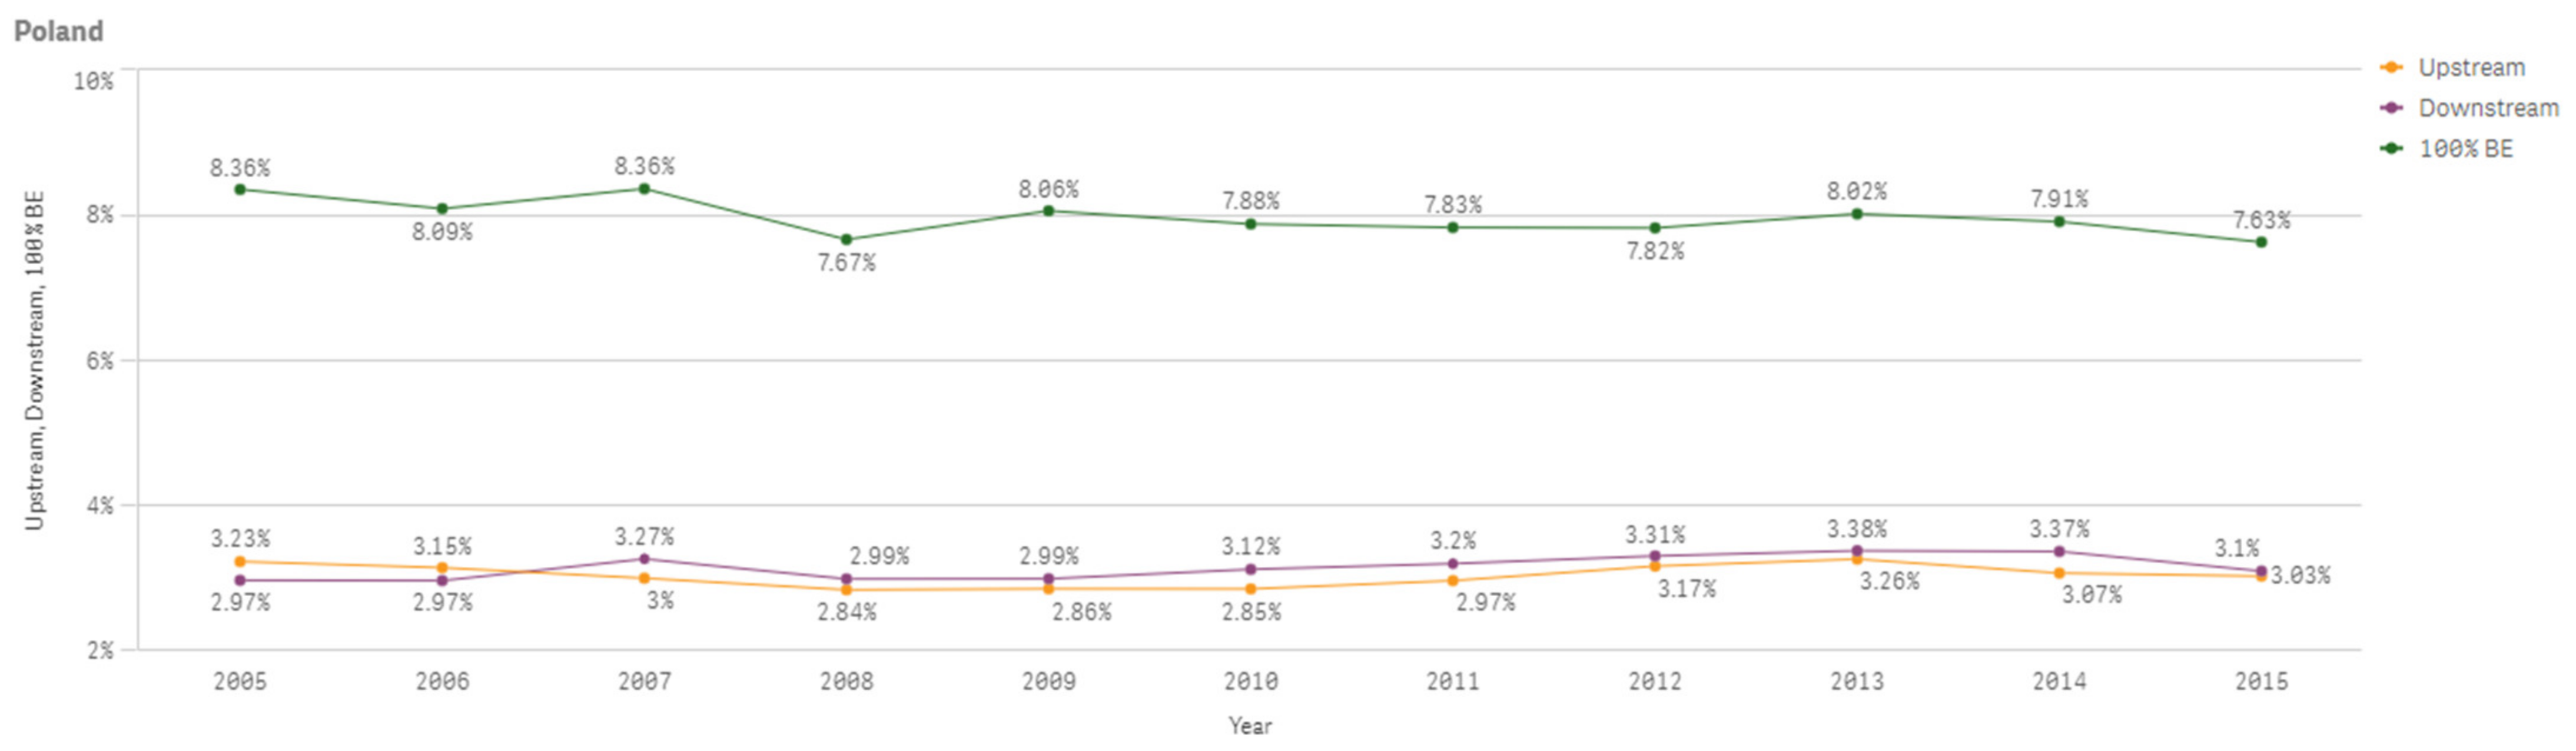
The following Figure A45 shows Poland’s 100% bioeconomy value added, downstream bioeconomy value added and upstream bioeconomy value added which are increasing overall between 2005 and 2015. Figure A46 shows the percentage changes of the same values compared to total value added of the economy.
Figure A45.
Poland 100% Bioeconomy Value Added, Downstream and Upstream Bioeconomy Value Added 2005–2015.
Figure A45.
Poland 100% Bioeconomy Value Added, Downstream and Upstream Bioeconomy Value Added 2005–2015.

Figure A46.
Poland 100% Bioeconomy Value Added, Downstream and Upstream Bioeconomy Value Added Shares 2005–2015.
Figure A46.
Poland 100% Bioeconomy Value Added, Downstream and Upstream Bioeconomy Value Added Shares 2005–2015.

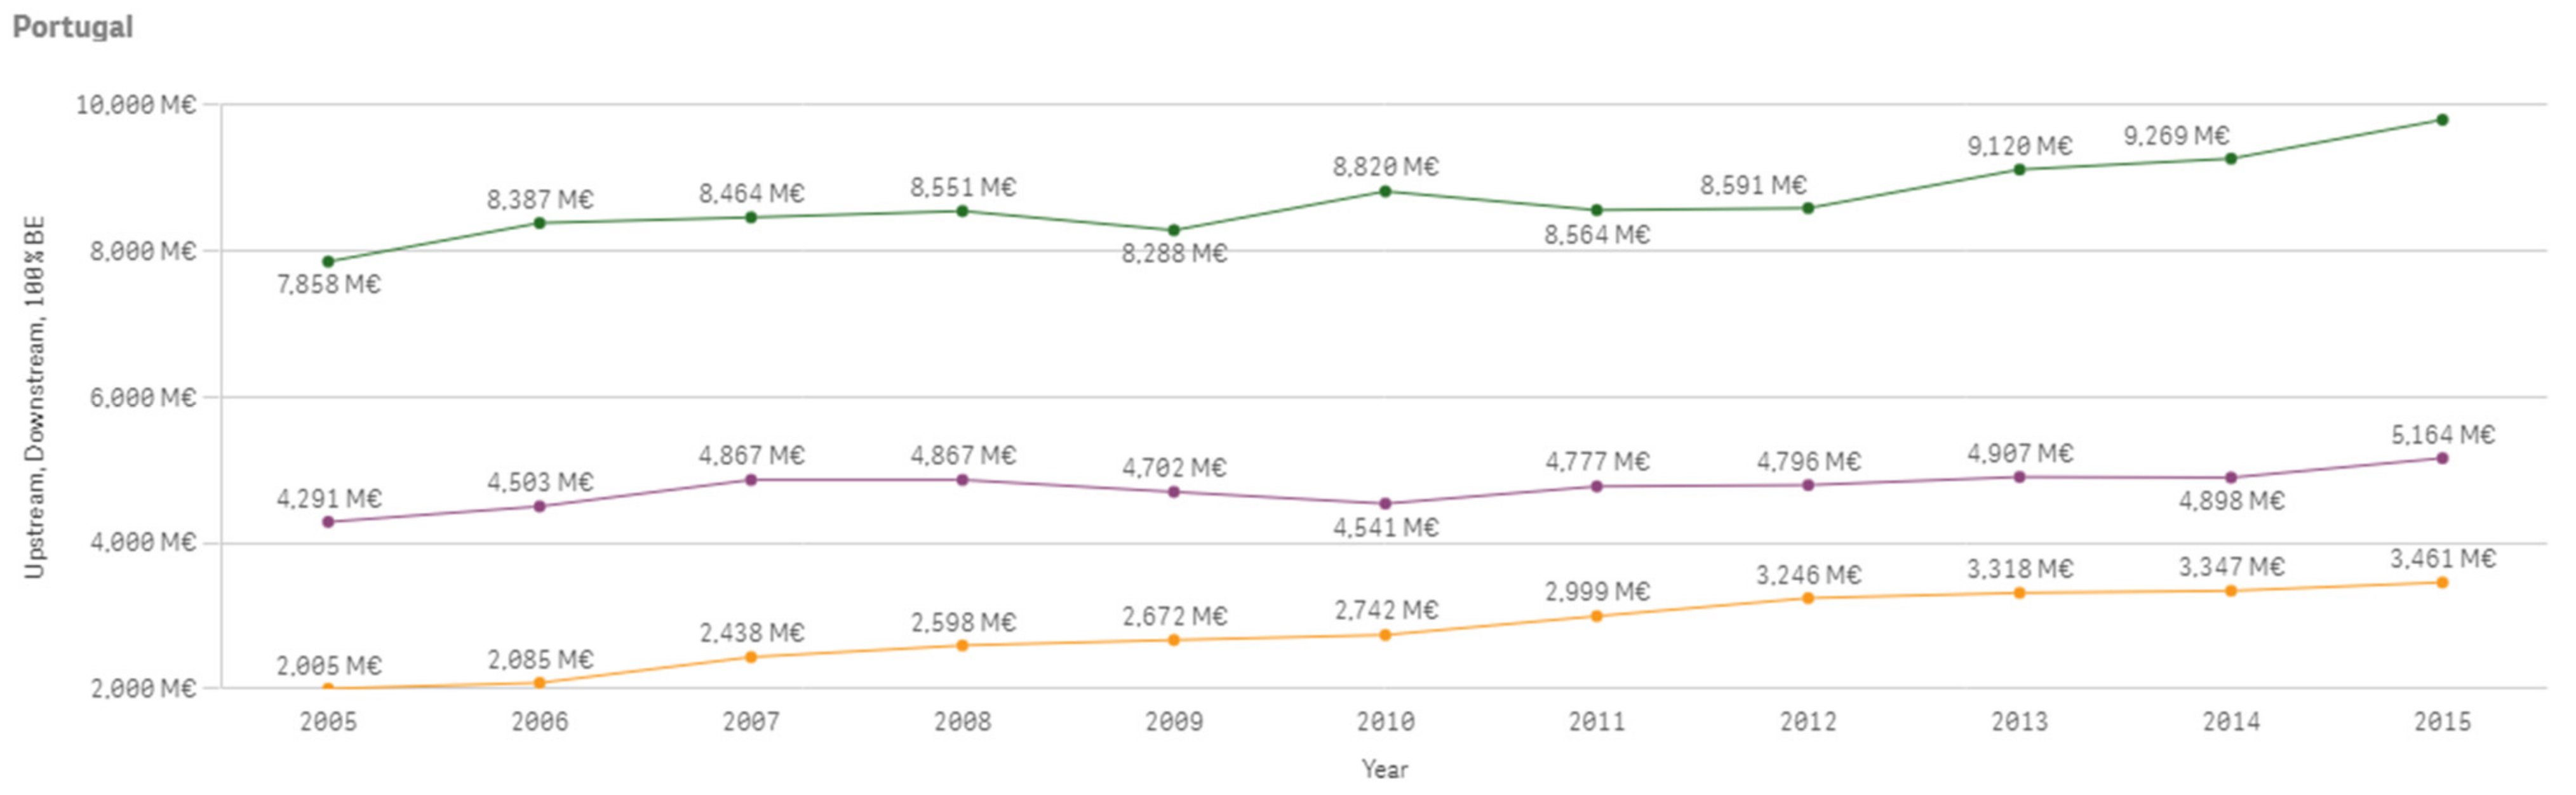
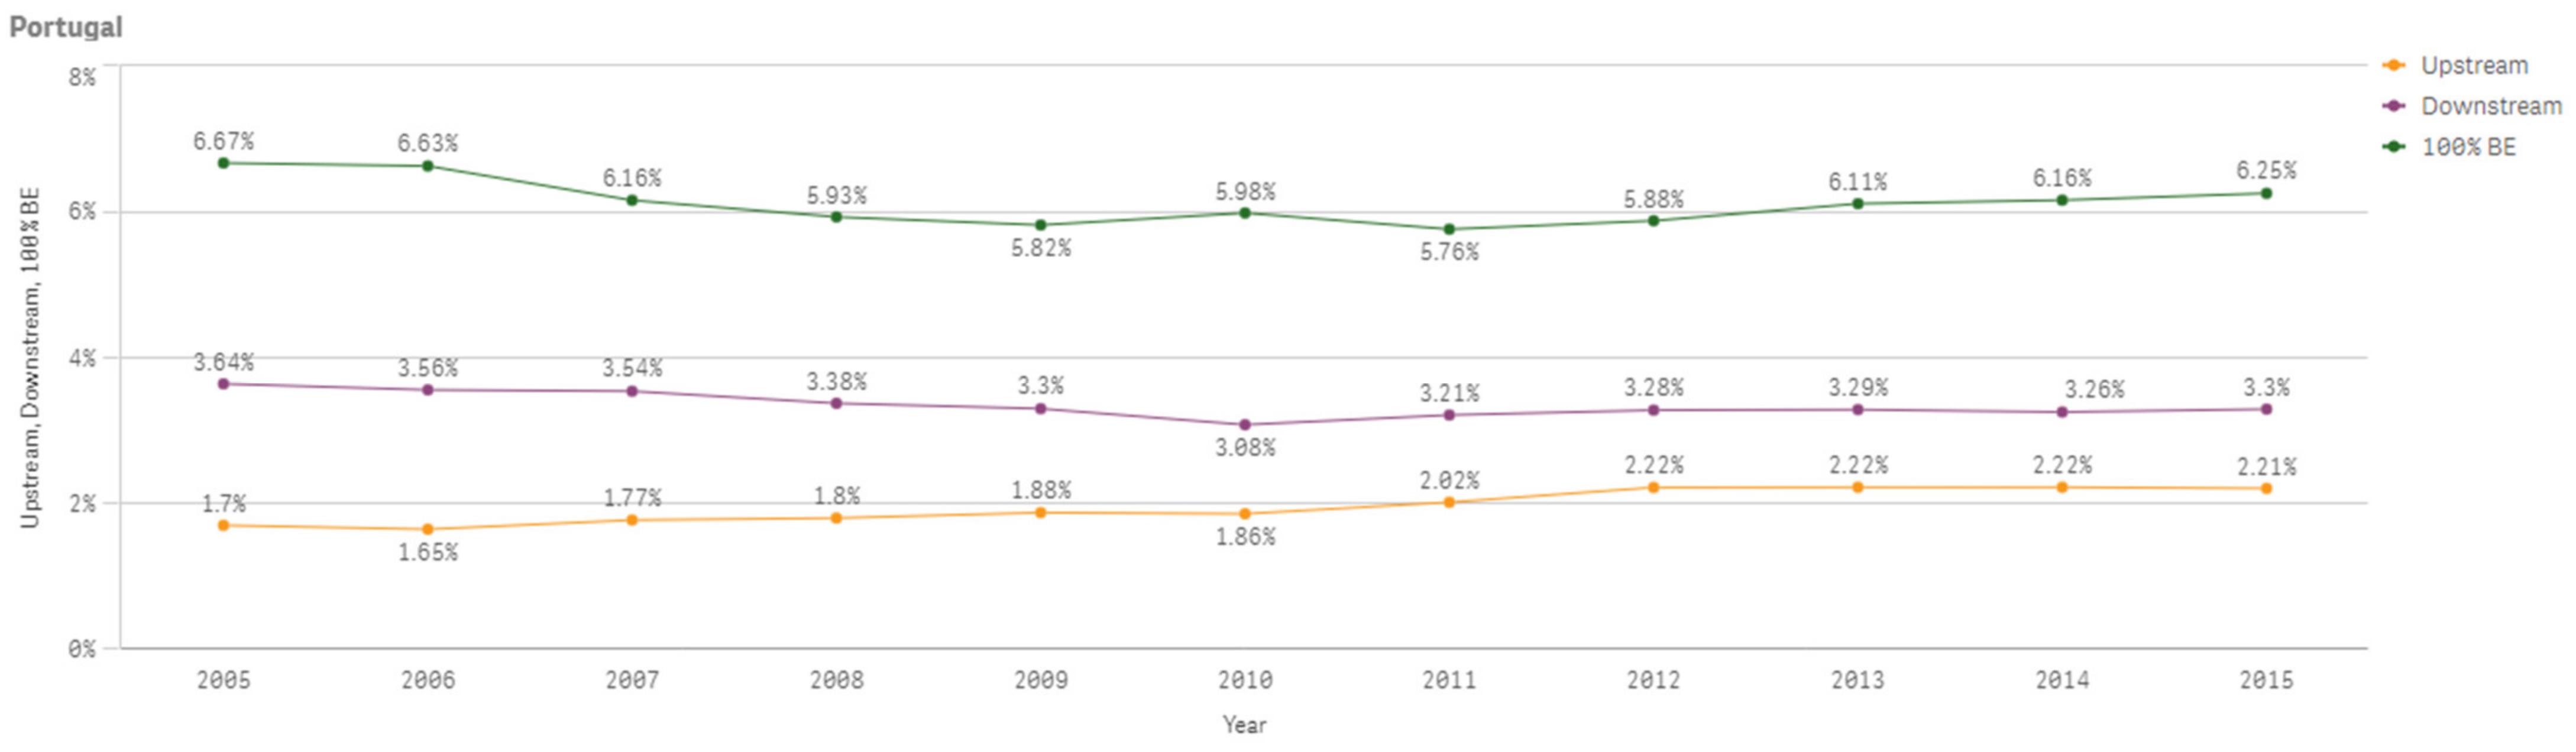
The following Figure A47 shows Portugal’s 100% bioeconomy value added, downstream bioeconomy value added and upstream bioeconomy value added which are increasing overall between 2005 and 2015. Figure A48 shows the percentage changes of the same values compared to total value added of the economy.
Figure A47.
Portugal 100% Bioeconomy Value Added, Downstream and Upstream Bioeconomy Value Added 2005–2015.
Figure A47.
Portugal 100% Bioeconomy Value Added, Downstream and Upstream Bioeconomy Value Added 2005–2015.

Figure A48.
Portugal 100% Bioeconomy Value Added, Downstream and Upstream Bioeconomy Value Added Shares 2005–2015.
Figure A48.
Portugal 100% Bioeconomy Value Added, Downstream and Upstream Bioeconomy Value Added Shares 2005–2015.

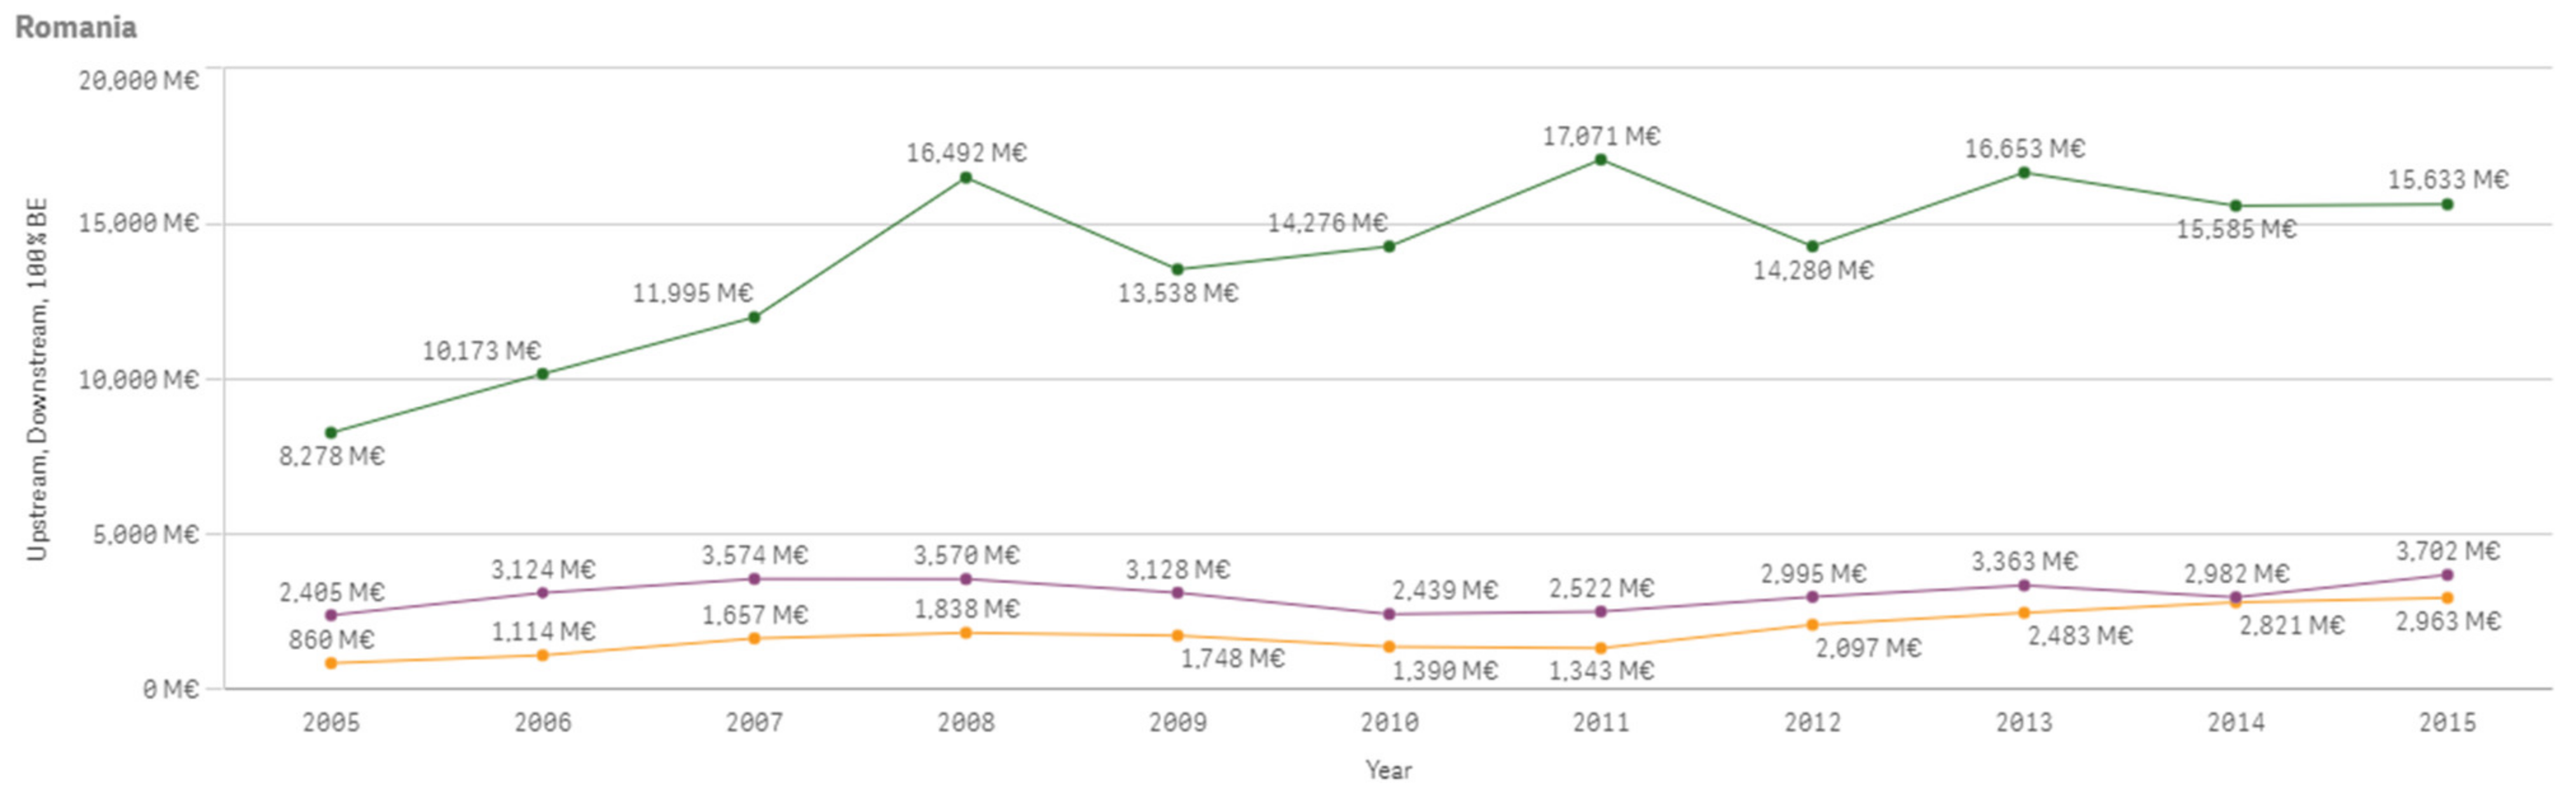
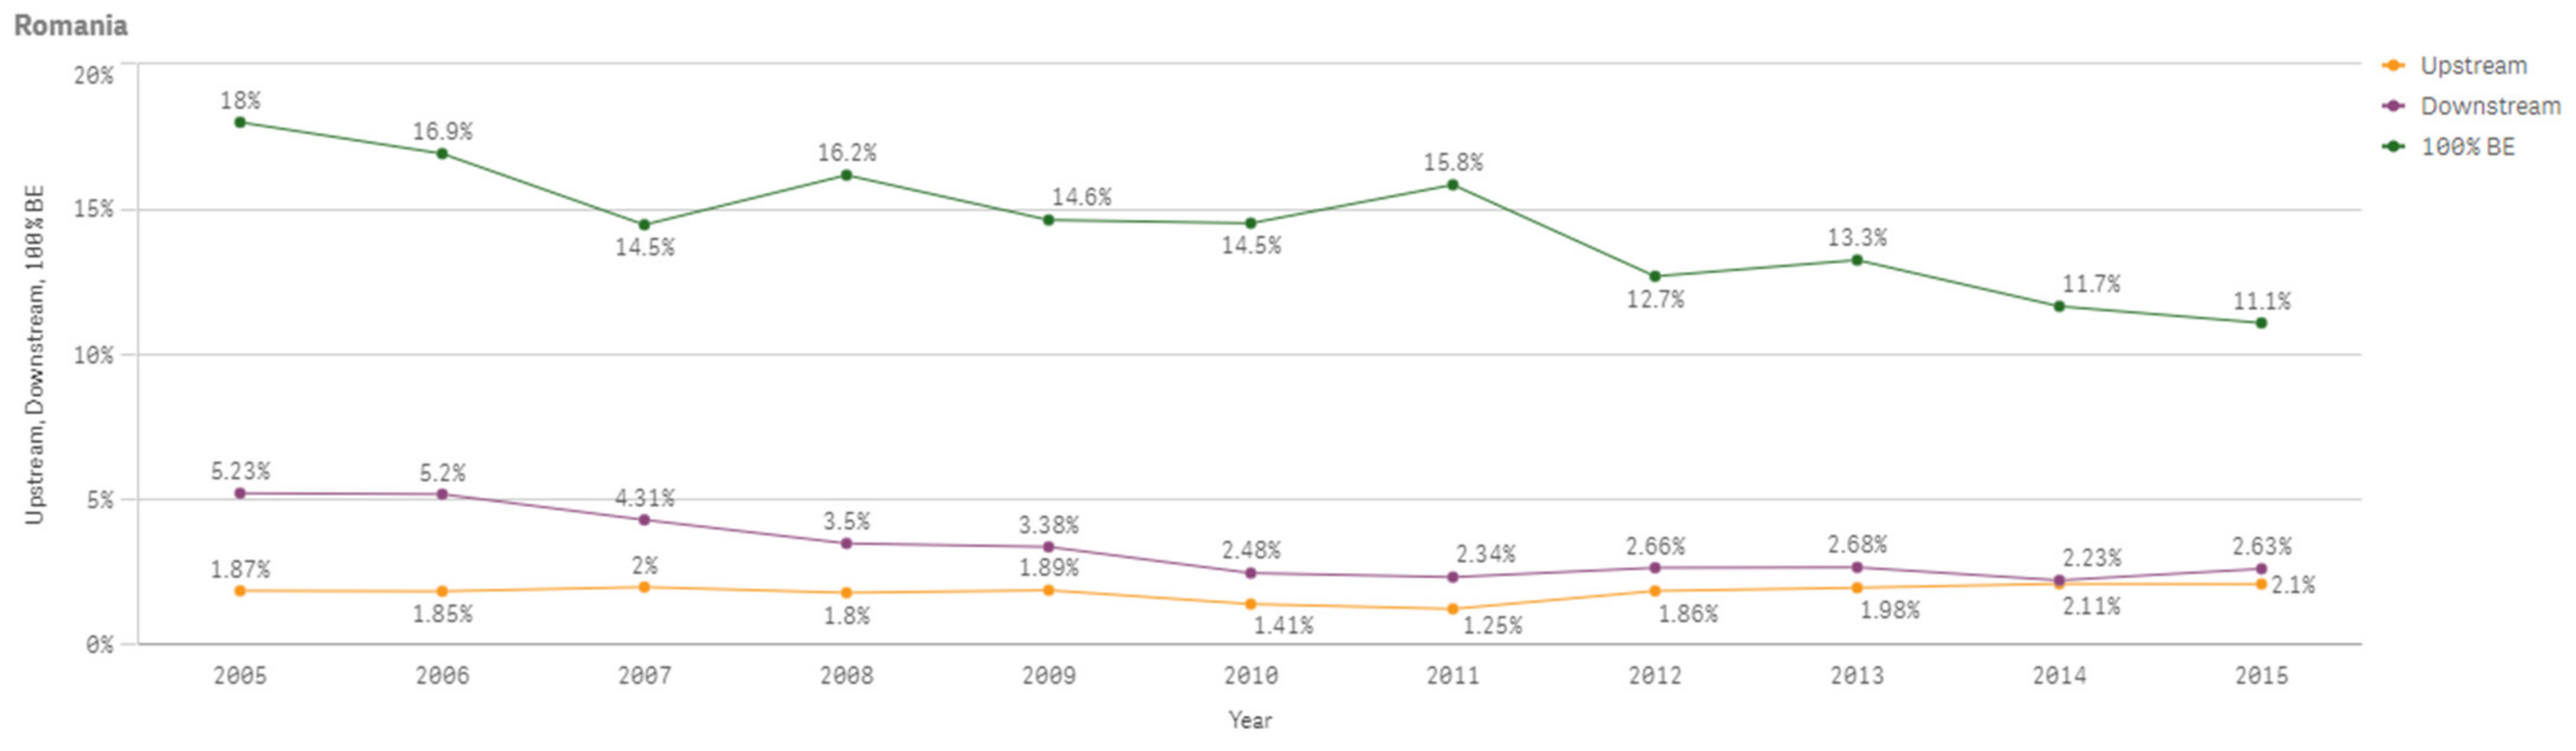
The following Figure A49 shows Romania’s 100% bioeconomy value added, downstream bioeconomy value added and upstream bioeconomy value added which are increasing overall between 2005 and 2015. Figure A50 shows the percentage changes of the same values compared to total value added of the economy.
Figure A49.
Romania 100% Bioeconomy Value Added, Downstream and Upstream Bioeconomy Value Added 2005–2015.
Figure A49.
Romania 100% Bioeconomy Value Added, Downstream and Upstream Bioeconomy Value Added 2005–2015.

Figure A50.
Romania 100% Bioeconomy Value Added, Downstream and Upstream Bioeconomy Value Added Shares 2005–2015.
Figure A50.
Romania 100% Bioeconomy Value Added, Downstream and Upstream Bioeconomy Value Added Shares 2005–2015.

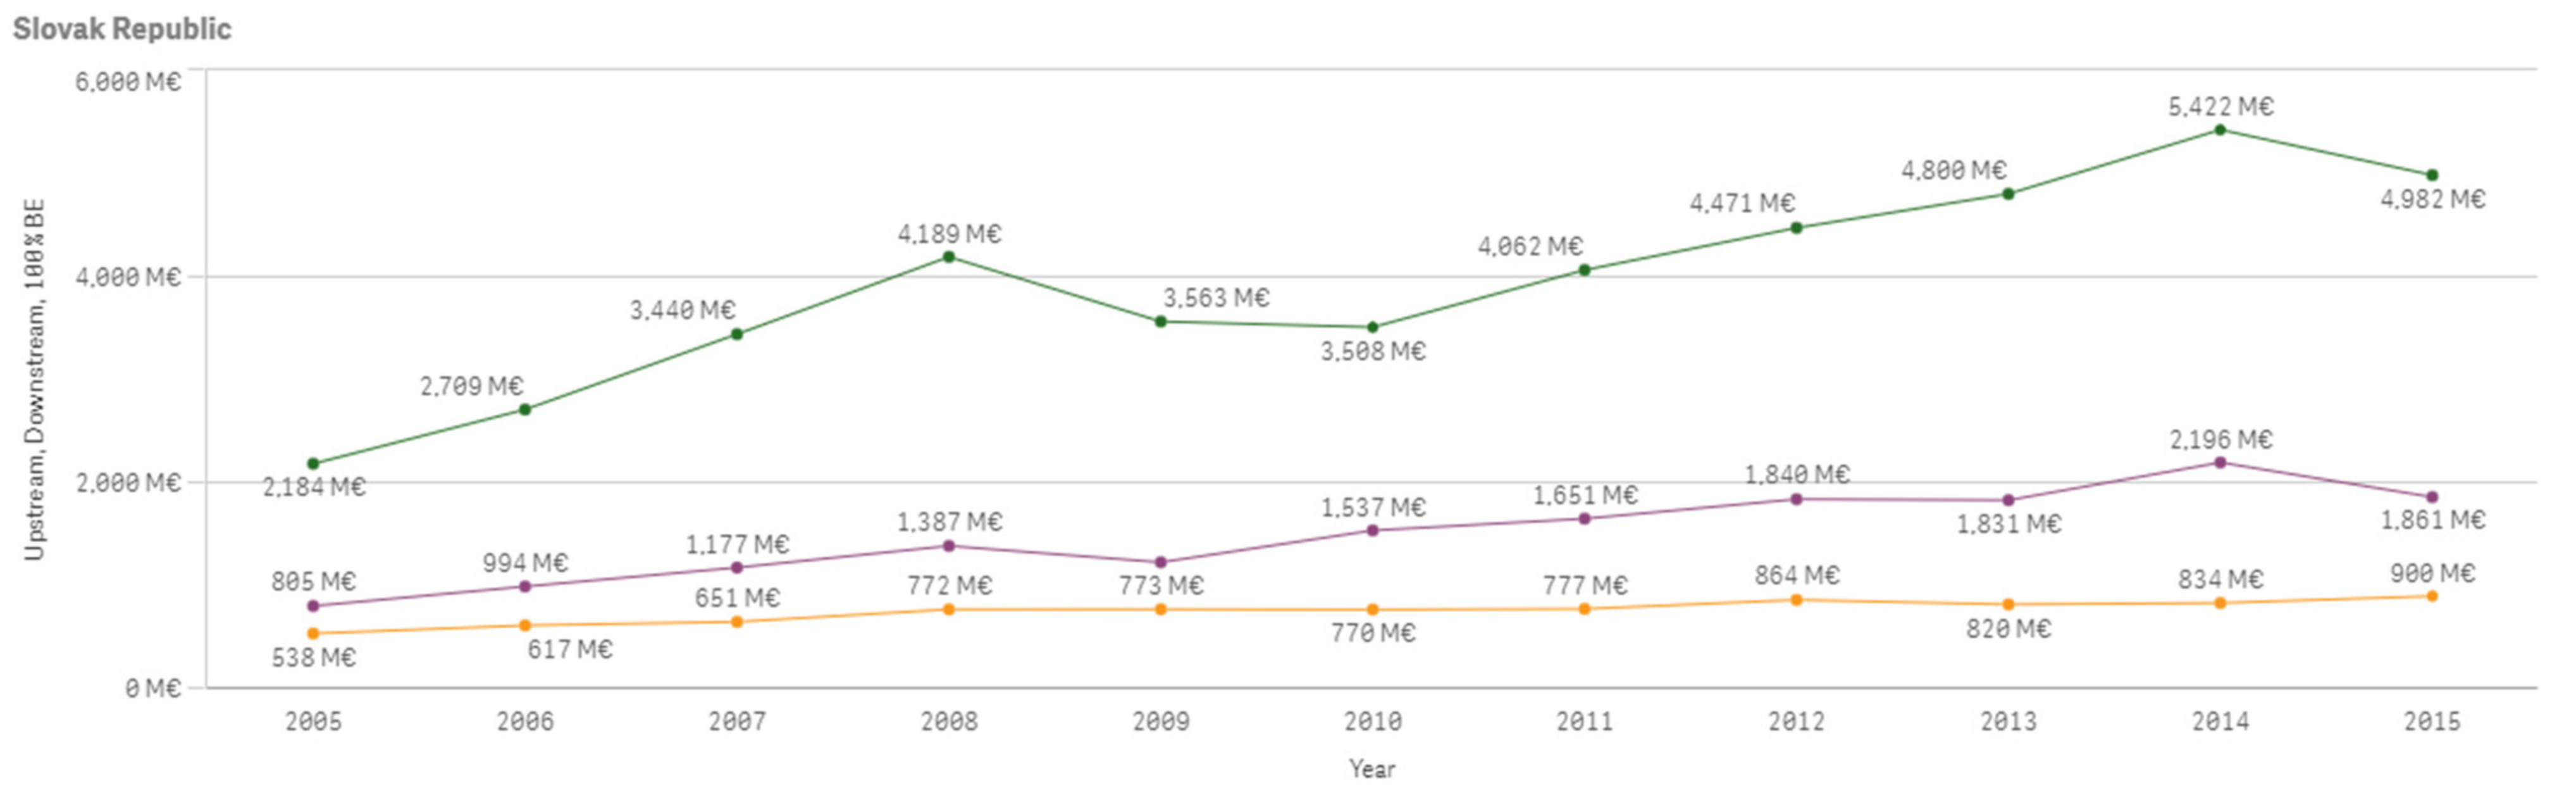
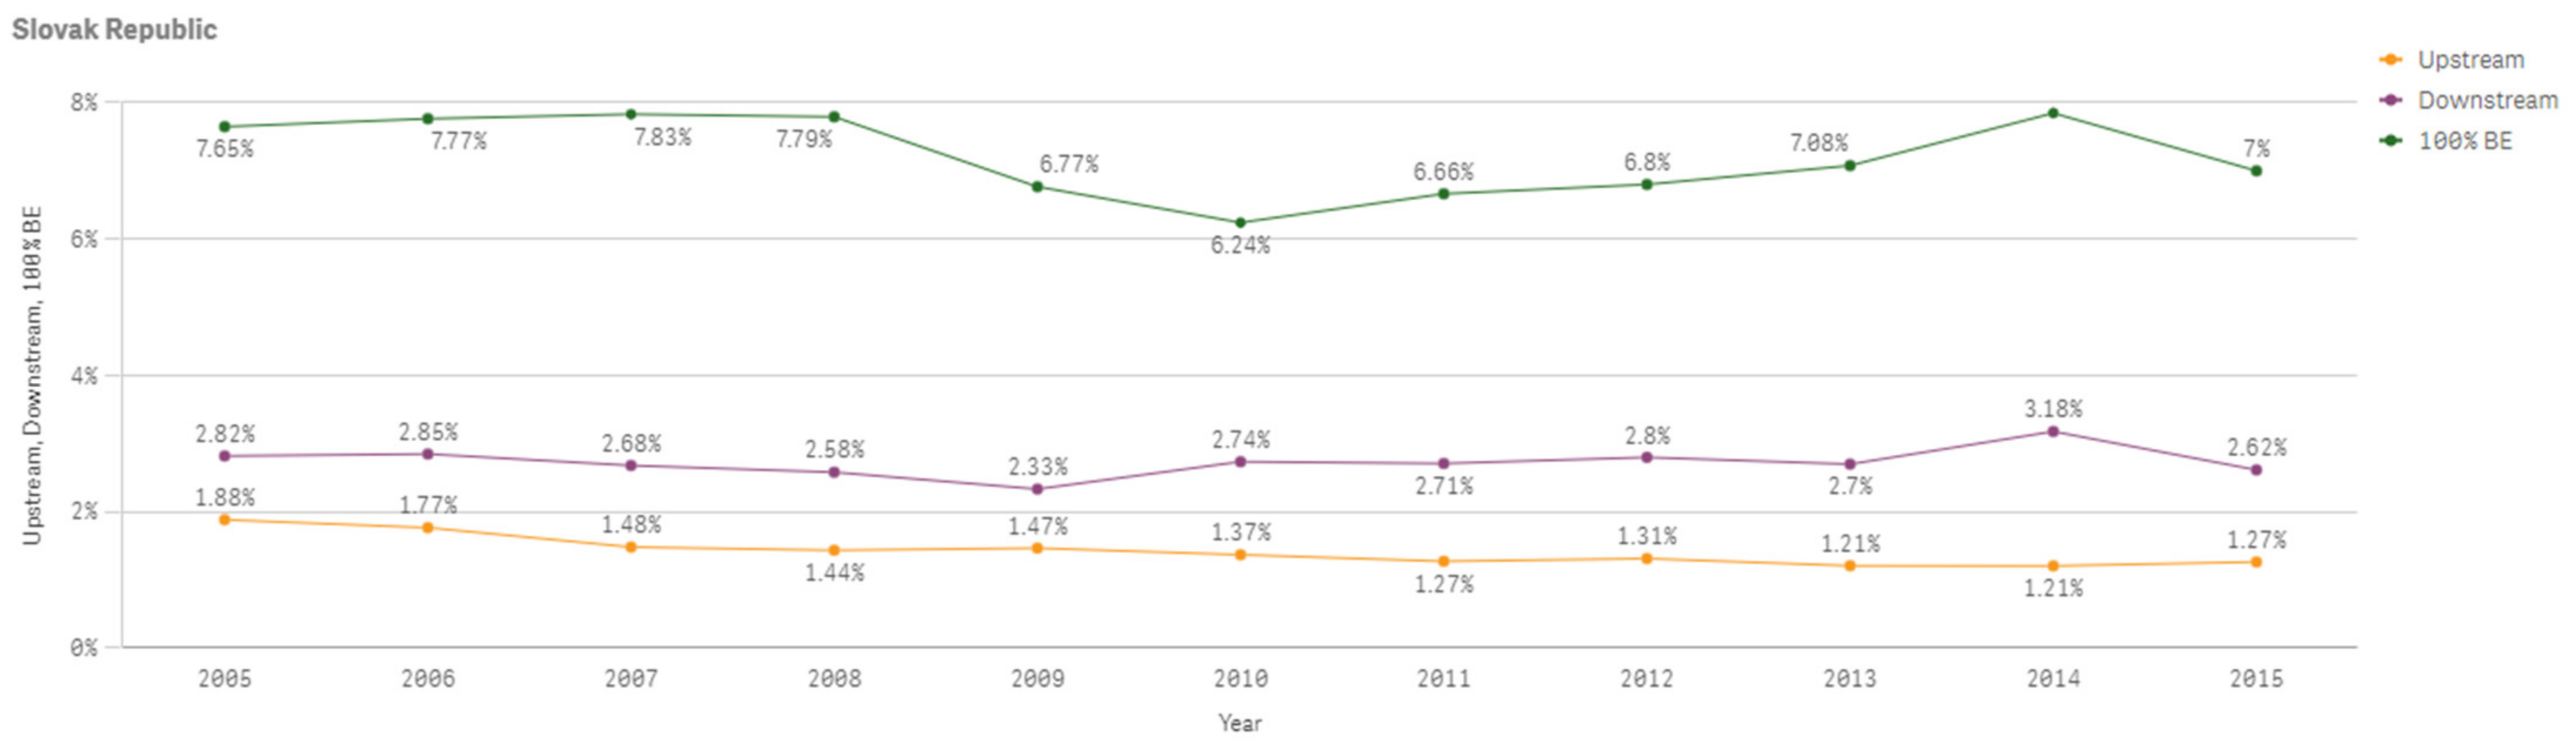
The following Figure A51 shows Slovak Republic’s 100% bioeconomy value added, downstream bioeconomy value added and upstream bioeconomy value added which are increasing overall between 2005 and 2015. Figure A52 shows the percentage changes of the same values compared to total value added of the economy.
Figure A51.
Slovak Republic 100% Bioeconomy Value Added, Downstream and Upstream Bioeconomy Value Added 2005–2015.
Figure A51.
Slovak Republic 100% Bioeconomy Value Added, Downstream and Upstream Bioeconomy Value Added 2005–2015.

Figure A52.
Slovak Republic 100% Bioeconomy Value Added, Downstream and Upstream Bioeconomy Value Added Shares 2005–2015.
Figure A52.
Slovak Republic 100% Bioeconomy Value Added, Downstream and Upstream Bioeconomy Value Added Shares 2005–2015.

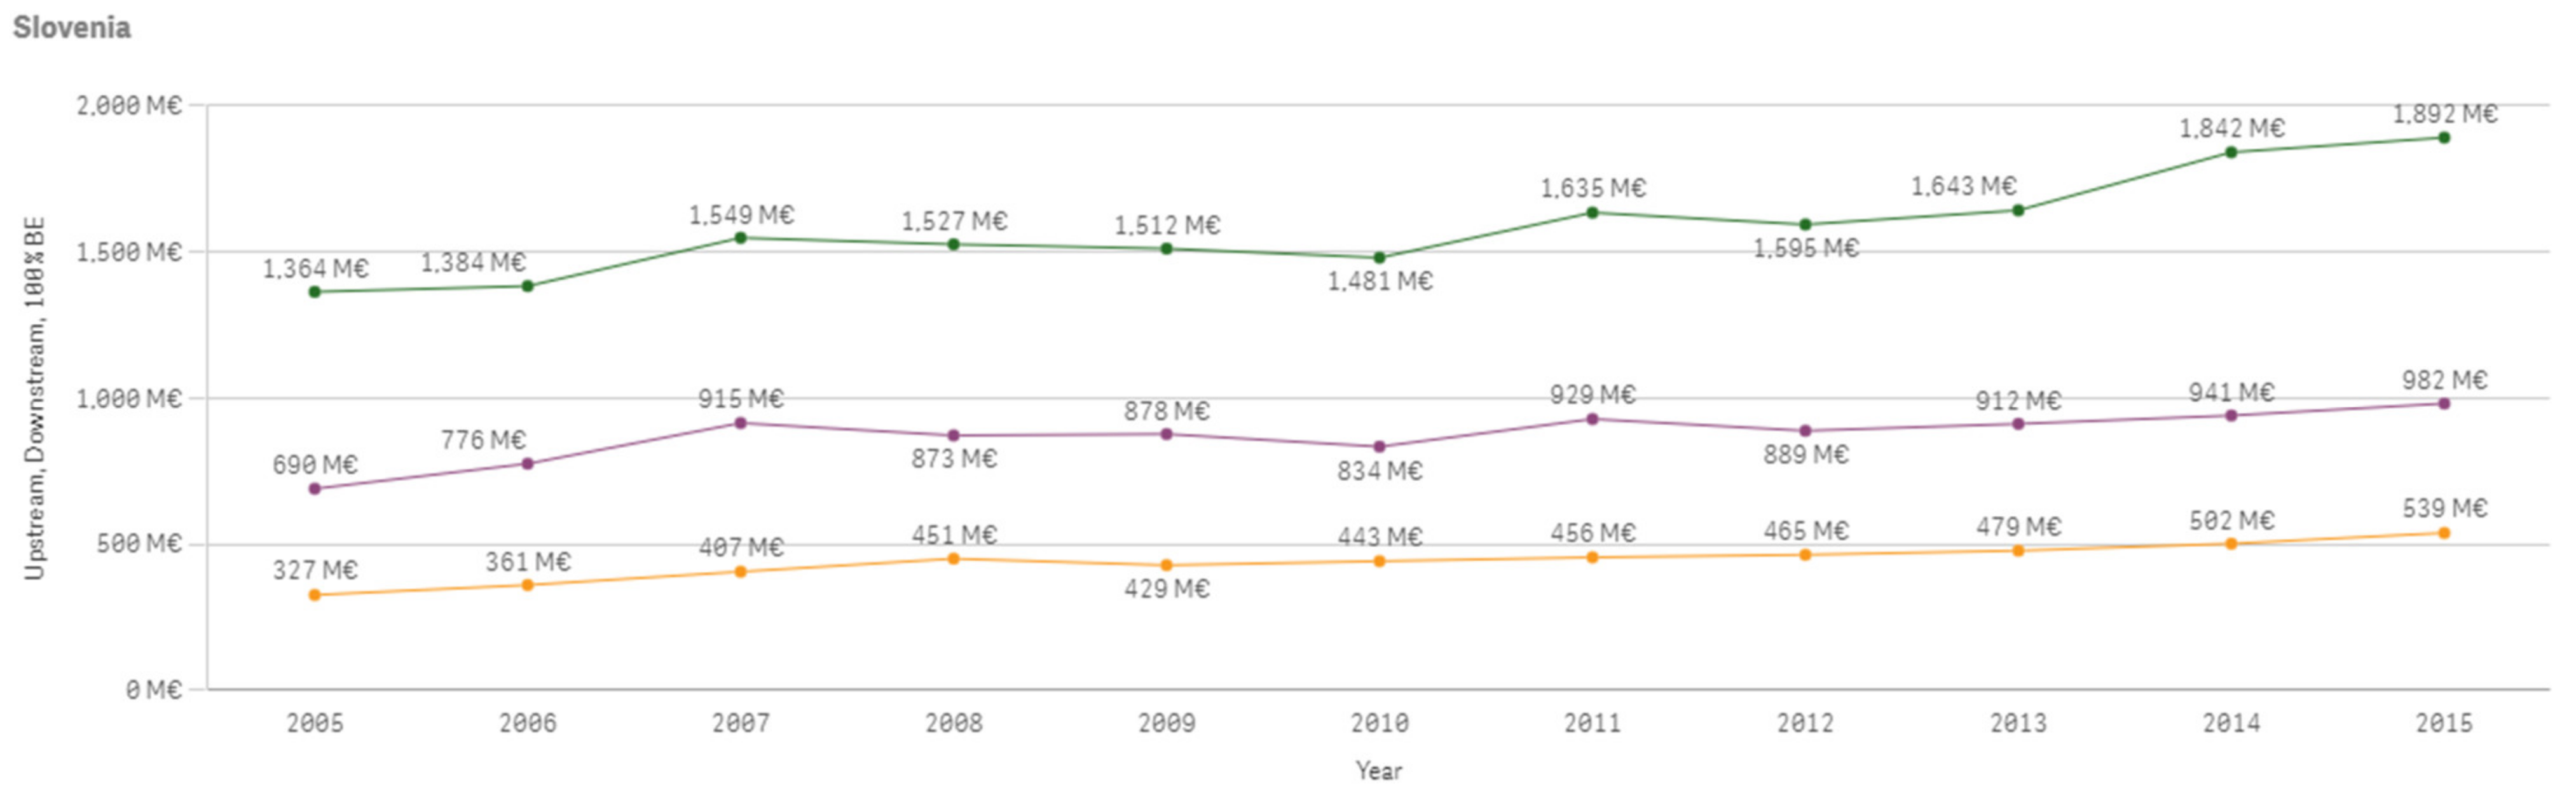
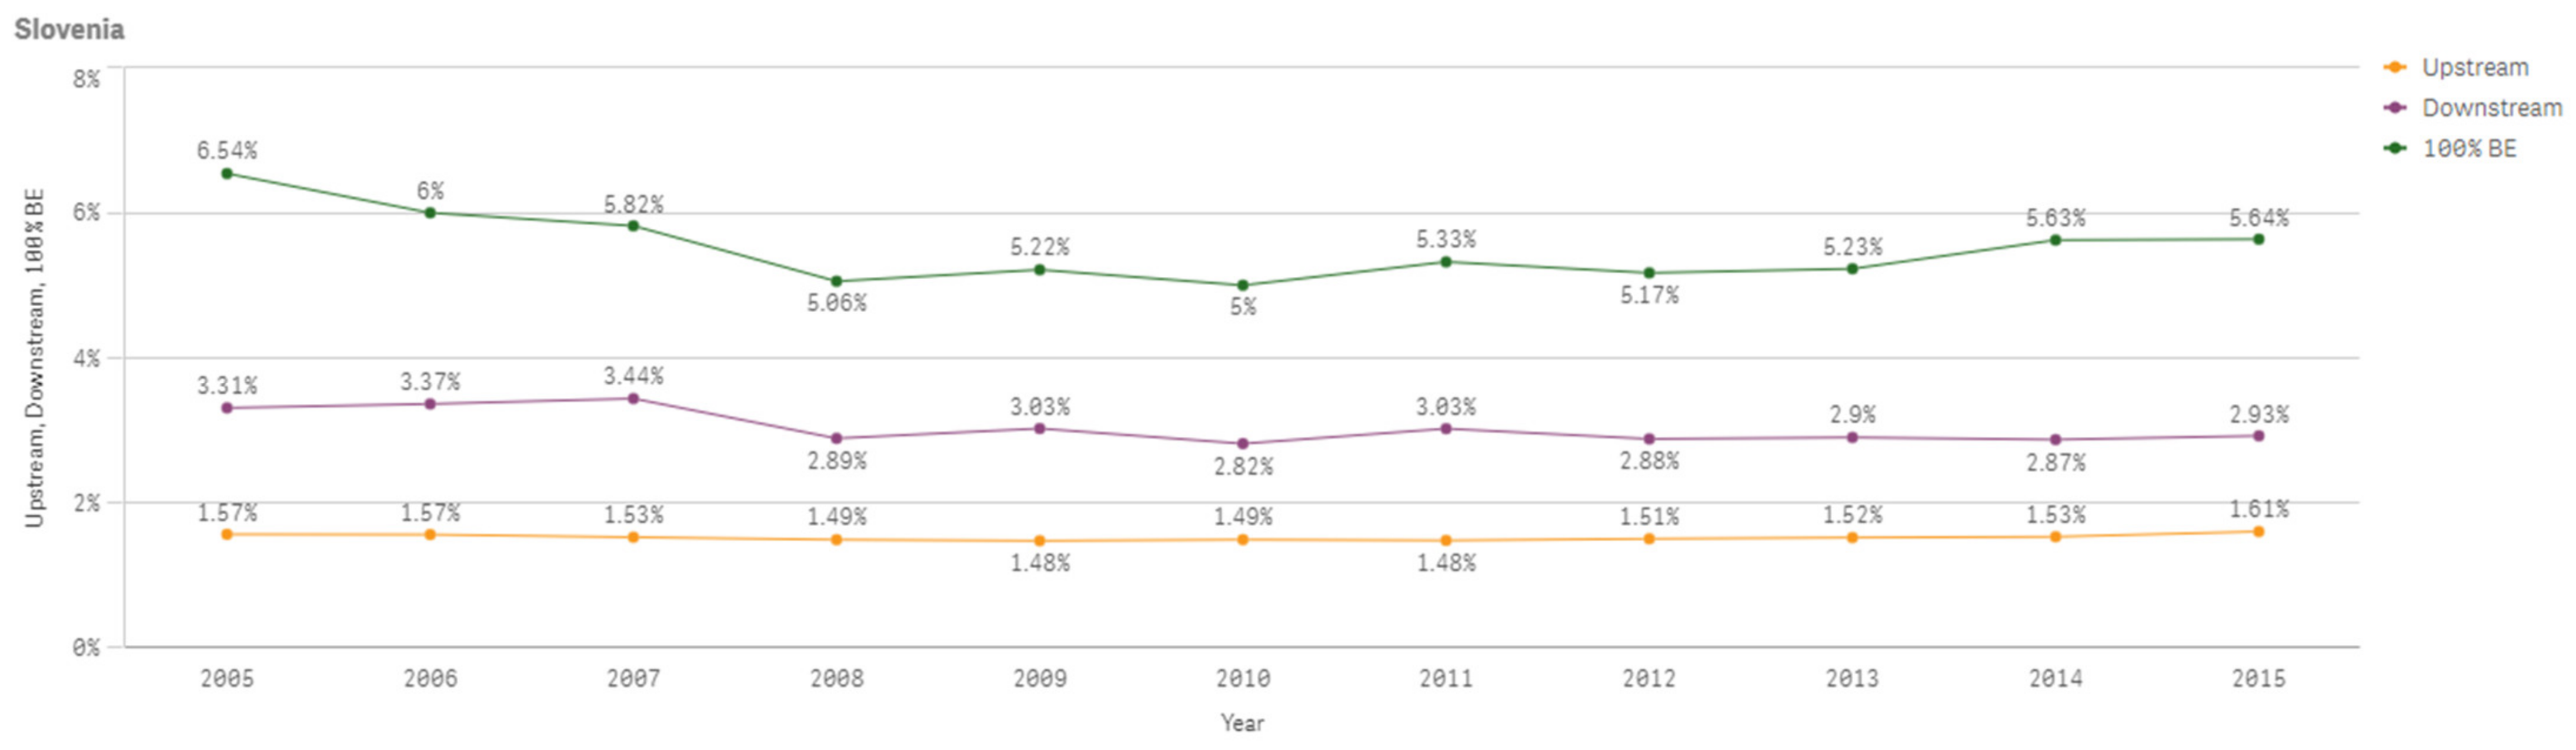
The following Figure A53 shows Slovenia’s 100% bioeconomy value added, downstream bioeconomy value added and upstream bioeconomy value added which are increasing overall between 2005 and 2015. Figure A54 shows the percentage changes of the same values compared to total value added of the economy.
Figure A53.
Slovenia 100% Bioeconomy Value Added, Downstream and Upstream Bioeconomy Value Added 2005–2015.
Figure A53.
Slovenia 100% Bioeconomy Value Added, Downstream and Upstream Bioeconomy Value Added 2005–2015.

Figure A54.
Slovenia 100% Bioeconomy Value Added, Downstream and Upstream Bioeconomy Value Added Shares 2005–2015.
Figure A54.
Slovenia 100% Bioeconomy Value Added, Downstream and Upstream Bioeconomy Value Added Shares 2005–2015.

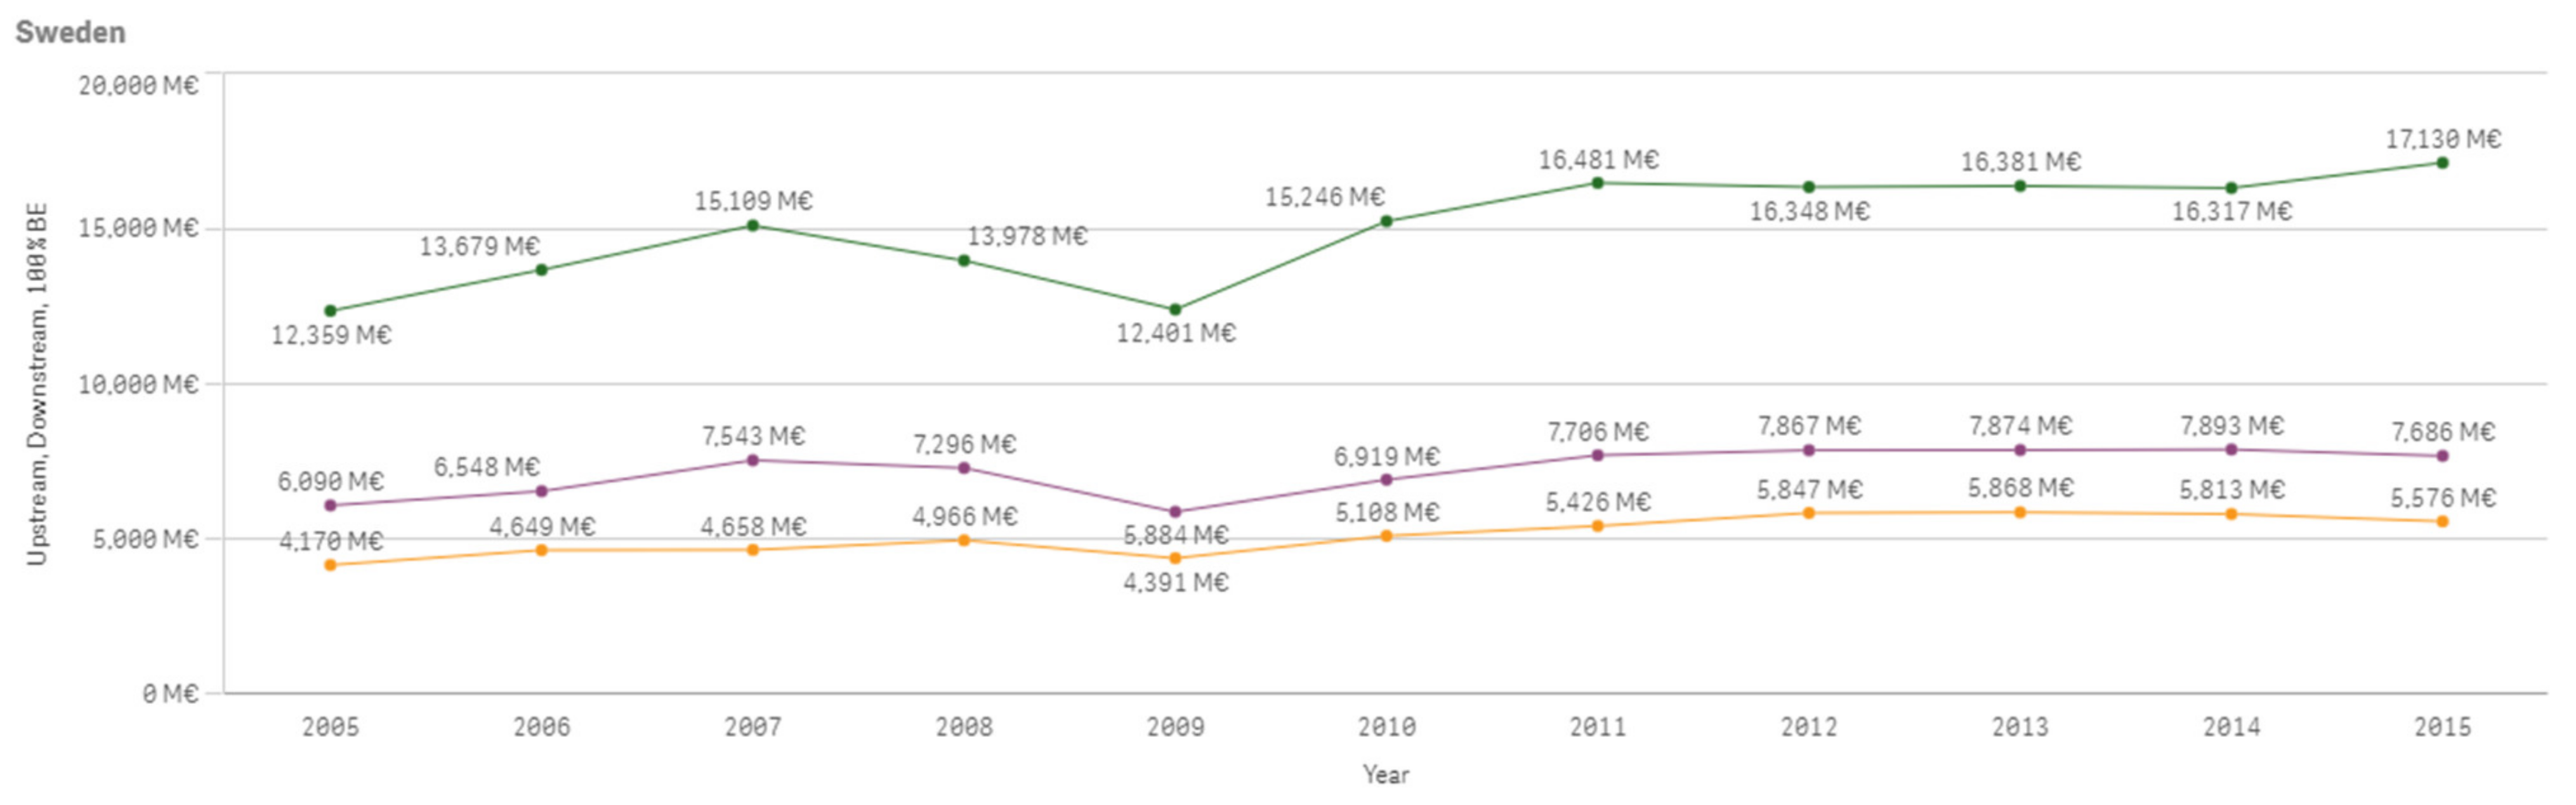
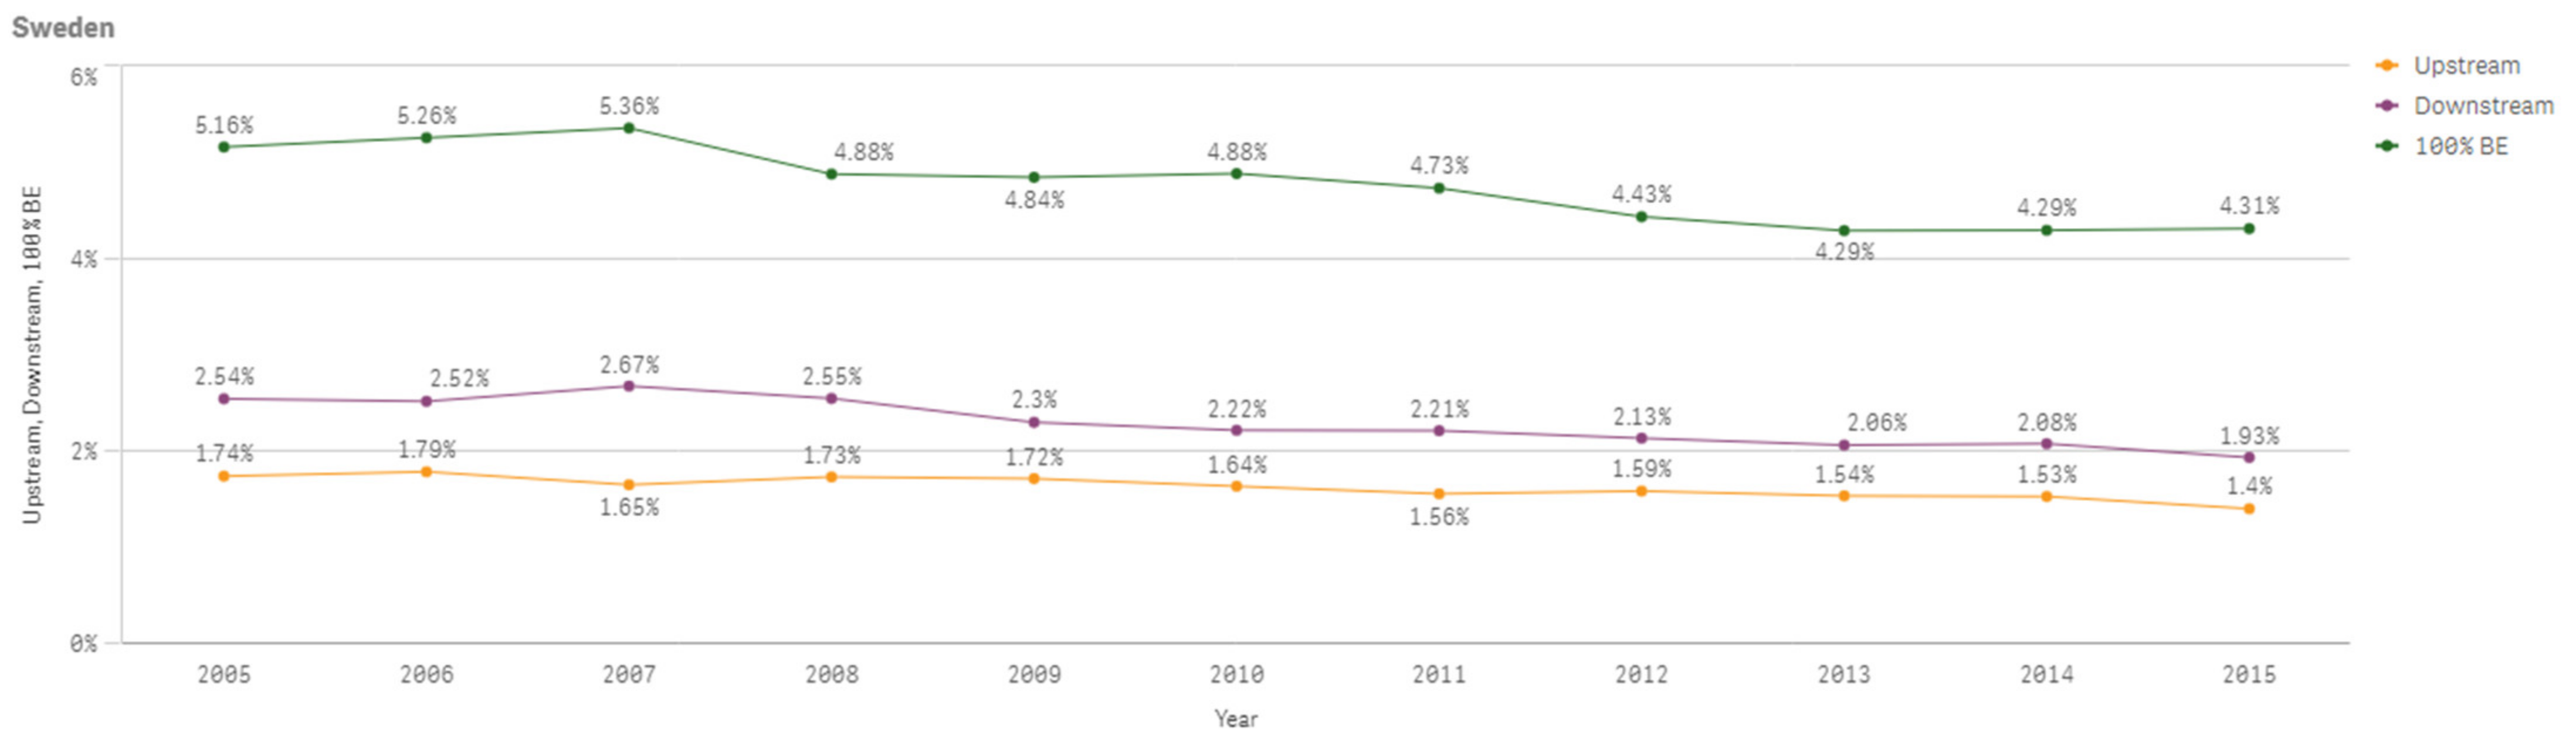
The following Figure A55 shows Sweden’s 100% bioeconomy value added, downstream bioeconomy value added and upstream bioeconomy value added which are increasing overall between 2005 and 2015. Figure A56 shows the percentage changes of the same values compared to total value added of the economy.
Figure A55.
Sweden 100% Bioeconomy Value Added, Downstream and Upstream Bioeconomy Value Added 2005–2015.
Figure A55.
Sweden 100% Bioeconomy Value Added, Downstream and Upstream Bioeconomy Value Added 2005–2015.

Figure A56.
Sweden 100% Bioeconomy Value Added, Downstream and Upstream Bioeconomy Value Added Shares 2005–2015.
Figure A56.
Sweden 100% Bioeconomy Value Added, Downstream and Upstream Bioeconomy Value Added Shares 2005–2015.

References
- European Commission. Horizon 2020—The Future Framework Programme for Research and Innovation. Available online: https://ec.europa.eu/commission/presscorner/detail/de/MEMO_15_5832 (accessed on 22 December 2020).
- Juncker, J.C. A New Start for Europe: My Agenda for Jobs, Growth, Fairness and Democratic Change. Available online: https://www.eesc.europa.eu/resources/docs/jean-claude-juncker---political-guidelines.pdf (accessed on 22 December 2020).
- Kardung, M.; Cingiz, K.; Costenoble, O.; Delahaye, R.; Heijman, W.; Lovri’c, M.; van Leeuwen, M.; M’Barek, R.; van Meijl, H.; Piotrowski, S.; et al. Development of the Circular Bioeconomy: Drivers and Indicators. Sustainability 2021, 13, 413. [Google Scholar] [CrossRef]
- Acemoglu, D.; Akcigit, U.; Hanley, D.; Kerr, W. Transition to clean technology. J. Polit. Econ. 2016, 124, 52–104. [Google Scholar] [CrossRef] [Green Version]
- Purnhagen, K.P.; Wesseler, J. Maximum vs minimum harmonization: What to expect from the institutional and legal battles in the EU on gene editing technologies. Pest Manag. Sci. 2019, 75, 2310–2315. [Google Scholar] [CrossRef] [PubMed] [Green Version]
- Purnhagen, K.; Wesseler, J. EU Regulation of New Plant Breeding Technologies and Their Possible Economic Implications for the EU and Beyond. Appl. Econ. Perspect. Policy 2020. [Google Scholar] [CrossRef]
- Giuntoli, J.; Robert, N.; Ronzon, T.; Sanchez Lopez, J.; Follador, M.; Girardi, I.; Barredo Cano, J.; Borzacchiello, M.; Sala, S.; M’Barek, R.; et al. Building a Monitoring System for the EU Bioeconomy; Publications Office of the European Union: Luxembourg, 2020. [Google Scholar] [CrossRef]
- Jorgenson, D.W. Production and welfare: Progress in economic measurement. J. Econ. Lit. 2018, 56, 867–919. [Google Scholar] [CrossRef]
- Heijman, W. How big is the bio-business? Notes on measuring the size of the Dutch bio-economy. NJAS Wagening. J. Life Sci. 2016, 77, 5–8. [Google Scholar] [CrossRef]
- Harthoorn, R. On the Integrity of Data and Methods in the Static Open Leontief Model. Ph.D. Thesis, University of Twente, Enschede, The Netherlands, 1989. [Google Scholar]
- Schumann, J. Input-Output-Analyse; Econometrics and Operations Research Series; Springer: Berlin/Heidelberg, Germany, 1968; Volume 10. [Google Scholar] [CrossRef]
- Peerlings, J. An Applied General Equilibrium Model for Dutch Agribusiness Policy Analysis. Ph.D. Thesis, Wageningen University, Wageningen, The Netherlands, 1993. [Google Scholar]
- Carlson, R. Estimating the biotech sector’s contribution to the US economy. Nat. Biotechnol. 2016, 34, 247–255. [Google Scholar] [CrossRef]
- Efken, J.; Dirksmeyer, W.; Kreins, P.; Knecht, M. Measuring the importance of the bioeconomy in Germany: Concept and illustration. NJAS Wagening. J. Life Sci. 2016, 77, 9–17. [Google Scholar] [CrossRef]
- Golden, J.S.; Handfield, R.B.; Daystar, J.; McConnell, T.E. An Economic Impact Analysis of the US Biobased Products Industry: A Report to the Congress of the United States of America. Ind. Biotechnol. 2015, 11, 201–209. [Google Scholar] [CrossRef]
- Nowicki, P.L.; Banse, M.A.H.; Bolck, C.H.; Bos, H.L.; Scott, E.L. Biobased Economy: State-of-the-Art Assessment; LEI: Den Haag, The Netherlands, 2008. [Google Scholar]
- Ronzon, T.; Piotrowski, S.; Tamosiunas, S.; Dammer, L.; Carus, M.; M’barek, R. Developments of Economic Growth and Employment in Bioeconomy Sectors across the EU. Sustainability 2020, 12, 4507. [Google Scholar] [CrossRef]
- Gurría, A.P.; González, H.H.; Ronzon, T.; Tamošiūnas, S.; López-Lozano, R.; García-Condado, S.; Ronchetti, G.; Guillén Garci, J.; Cazzaniga, N.; Jonsson, K.H.R.; et al. EU Biomass Flows. European Commission, Joint Research Centre (JRC) [Dataset]. 2017. Available online: http://data.europa.eu/89h/34178536-7fd1-4d5e-b0d4-116be8e4b124 (accessed on 22 January 2021).
- Rosegrant, M.W.; Ringler, C.; Zhu, T.; Tokgoz, S.; Bhandary, P. Water and food in the bioeconomy: Challenges and opportunities for development. Agric. Econ. (UK) 2013, 44, 139–150. [Google Scholar] [CrossRef]
- Vandermeulen, V.; Prins, W.; Nolte, S.; Van Huylenbroeck, G. How to measure the size of a bio-based economy: Evidence from Flanders. Biomass Bioenergy 2011, 35, 4368–4375. [Google Scholar] [CrossRef]
- Kuosmanen, T.; Kuosmanen, N.; El Meligi, A.; Ronzon, T.; Gurria Albusac, P.; Iost, S.; M’Barek, R. How Big is the Bioeconomy; Publications Office of the European Union: Luxembourg, 2020. [Google Scholar] [CrossRef]
- Wesseler, J.; Von Braun, J. Measuring the Bioeconomy: Economics and Policies. Annu. Rev. Resour. Econ. 2017, 9, 275–298. [Google Scholar] [CrossRef]
- Robert, N.; Giuntoli, J.; Araujo, R.; Avraamides, M.; Balzi, E.; Barredo, J.I.; Baruth, B.; Becker, W.; Borzacchiello, M.T.; Bulgheroni, C.; et al. Development of a bioeconomy monitoring framework for the European Union: An integrative and collaborative approach. New Biotechnol. 2020, 59, 10–19. [Google Scholar] [CrossRef] [PubMed]
- McCormick, K.; Kautto, N. The Bioeconomy in Europe: An Overview. Sustainability 2013, 5, 2589–2608. [Google Scholar] [CrossRef] [Green Version]
- Staffas, L.; Gustavsson, M.; McCormick, K. Strategies and policies for the bioeconomy and bio-based economy: An analysis of official national approaches. Sustainability 2013, 5, 2751–2769. [Google Scholar] [CrossRef] [Green Version]
- Schmid, O.; Padel, S.; Levidow, L. The bio-economy concept and knowledge base in a public goods and farmer perspective. Bio-Based Appl. Econ. 2012, 1, 47–63. [Google Scholar] [CrossRef]
- Scarlat, N.; Dallemand, J.F.; Monforti-Ferrario, F.; Nita, V. The role of biomass and bioenergy in a future bioeconomy: Policies and facts. Env. Dev. 2015, 15, 3–34. [Google Scholar] [CrossRef]
- OECD. Input-Output Tables; Organisation for Economic Co-operation and Development: Paris, France, 2018; Available online: http://oe.cd/i-o (accessed on 2 December 2020).
- EUROSTAT HICP Database. Available online: https://ec.europa.eu/eurostat/web/hicp/data/database (accessed on 2 December 2020).
- OECD, Exchange Rates (Indicator). Available online: https://doi.org/10.1787/037ed317-en (accessed on 3 December 2020).
- Wesseler, J. Opportunities (‘Costs) Matter—A Comment on Pimentel and Patzek “Ethanol Production Using Corn, Switchgrass, and Wood; Biodiesel Production Using Soybean and Sunflower”. Energy Pol. 2007, 35, 1414–1416. [Google Scholar] [CrossRef]
- Feleke, S.; Cole, S.M.; Sekabira, H.; Djouaka, R.; Manyong, V. Circular Bioeconomy Research for Development in Sub-Saharan Africa: Innovations, Gaps, and Actions. Sustainability 2021, 13, 1926. [Google Scholar] [CrossRef]
- Frisvold, G.B.; Moss, S.M.; Hodgson, A.; Maxon, M.E. Understanding the U.S. Bioeconomy: A New Definition and Landscape. Sustainability 2021, 13, 1627. [Google Scholar] [CrossRef]
- Arrow, K.J.; Dasgupta, P.; Goulder, L.H.; Mumford, K.J.; Oleson, K. Sustainability and the measurement of wealth. Env. Dev. Econ. 2012, 17, 317–353. [Google Scholar] [CrossRef] [Green Version]
- Jansen, S.; Foster, W.; Anríquez, G.; Ortega, J. Understanding Farm-Level Incentives within the Bioeconomy Framework: Prices, Product Quality, Losses, and Bio-Based Alternatives. Sustainability 2021, 13, 450. [Google Scholar] [CrossRef]
- Zilberman, D.; Gordon, B.; Hochman, G.; Wesseler, J. Economics of Sustainable Development and the Bioeconomy. Appl. Econ. Persp. Pol. 2018, 40, 22–37. [Google Scholar] [CrossRef] [Green Version]
Figure 1.
Spain Bioeconomy Shares between 2005 and 2015.

Figure 2.
Romania Bioeconomy Shares between 2005 and 2015.

Figure 3.
EU member states downstream value added, 2015.

Figure 4.
EU member states downstream value added share, 2015.

Figure 5.
EU member states upstream value added, 2015.

Figure 6.
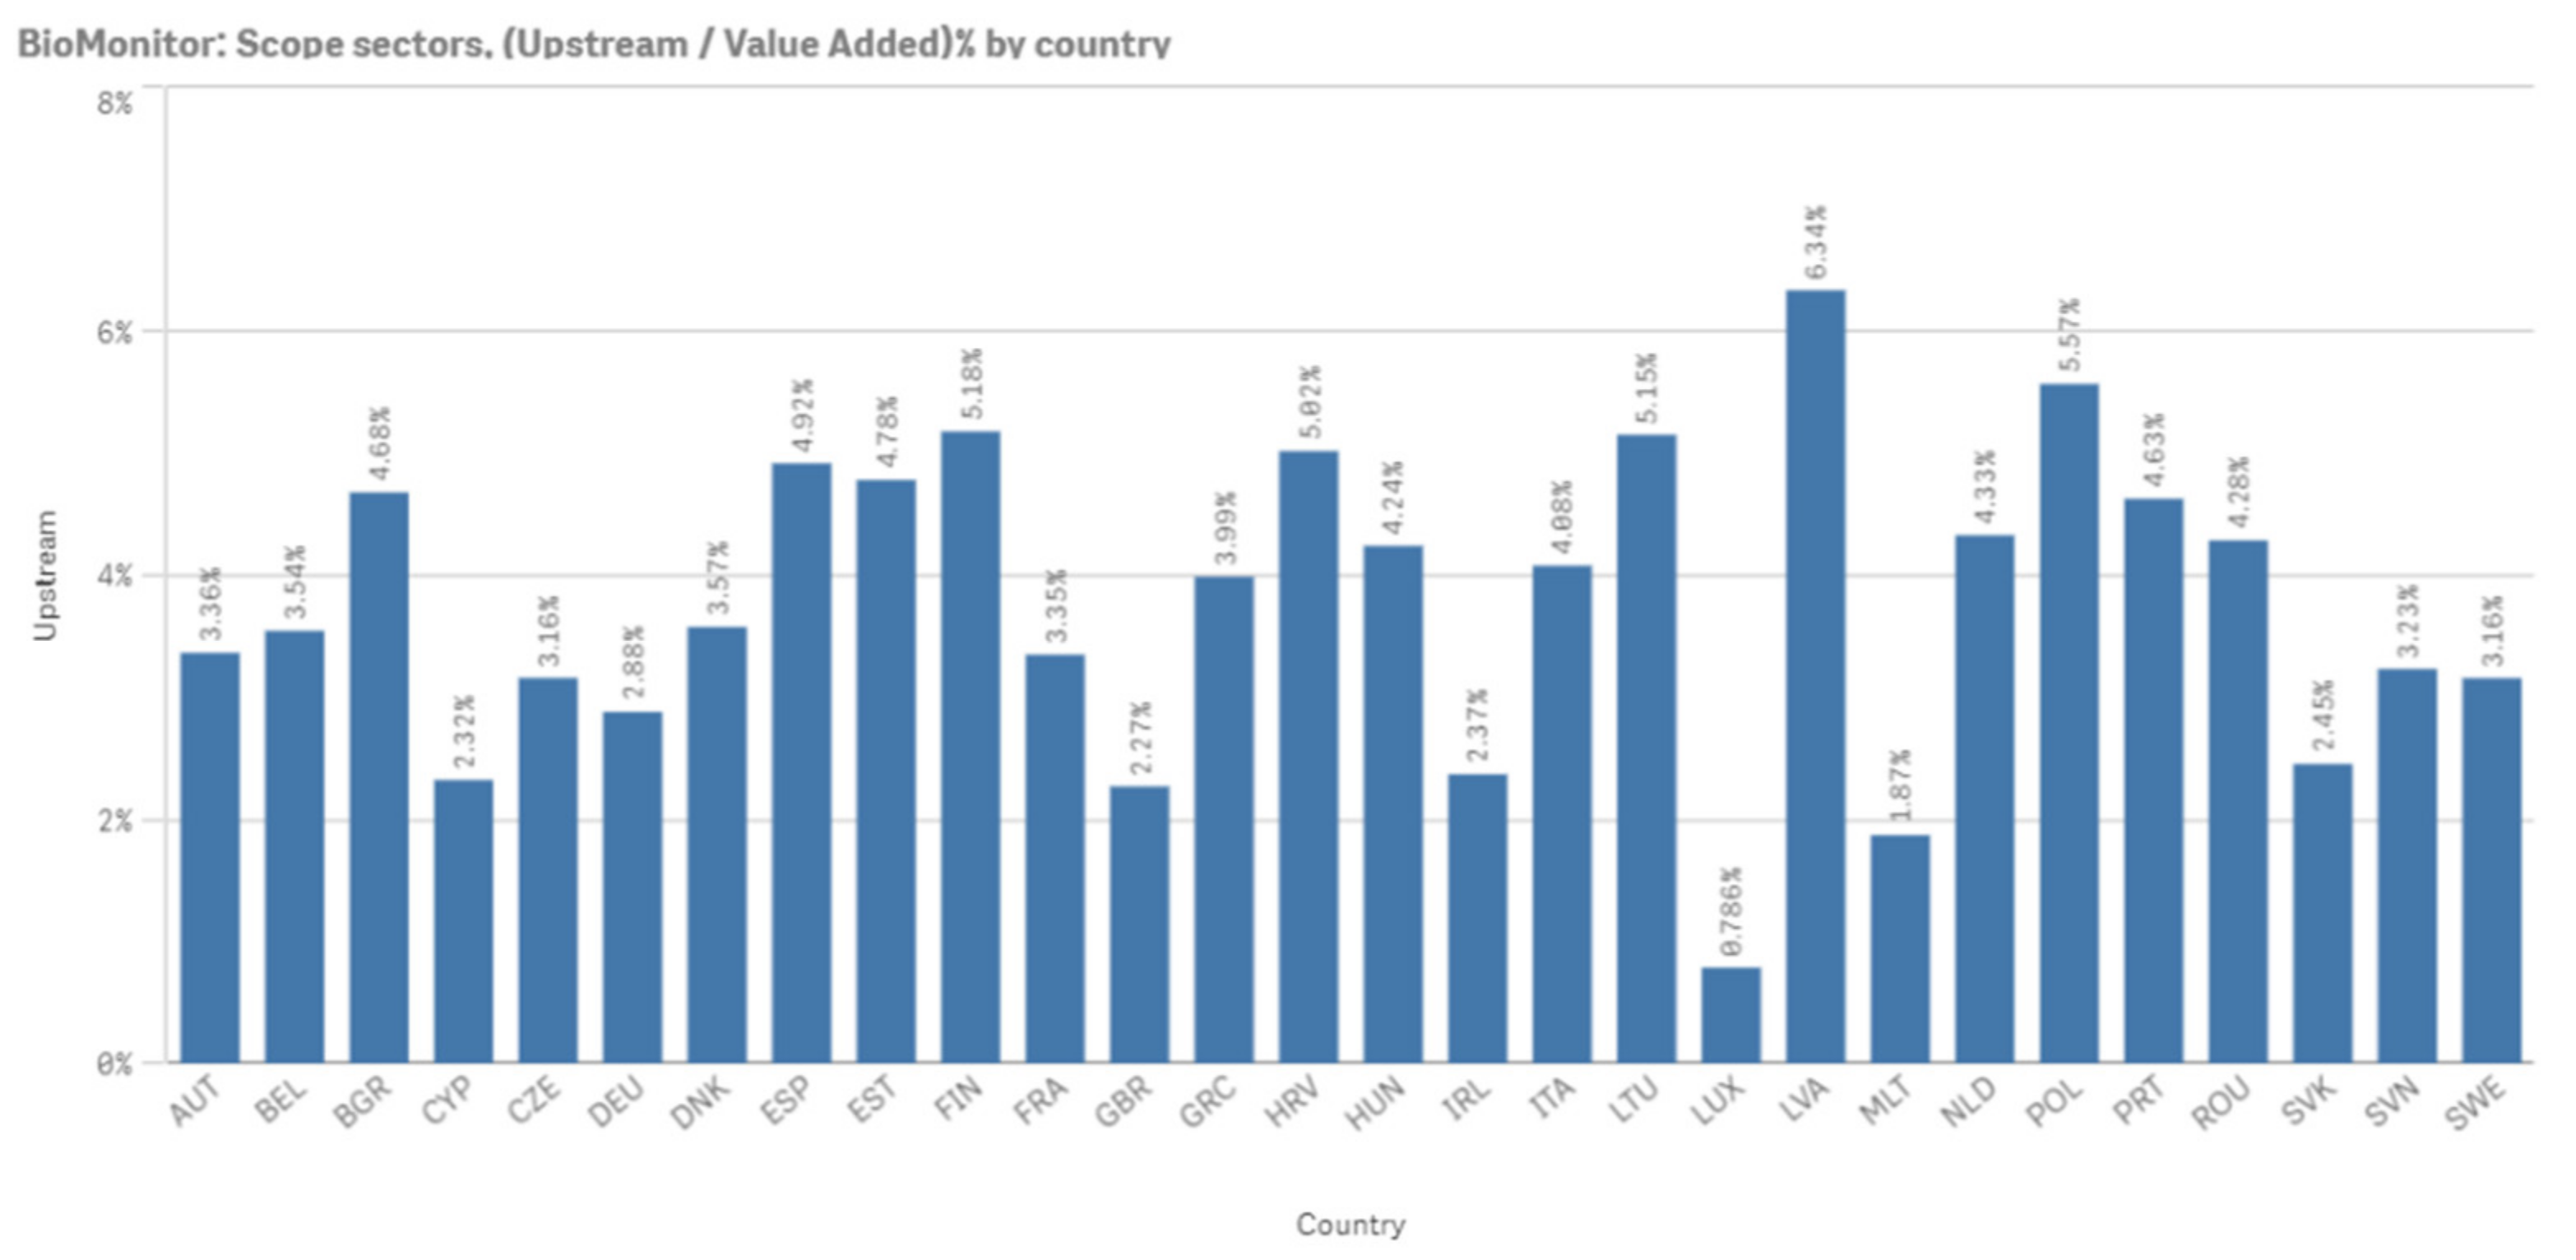
EU member states upstream value added share, 2015.

Figure 7.
EU member states agriculture, forestry and fishing value added, 2015.

Figure 8.
EU Bioeconomy value added components percentage distribution 2005.

Figure 9.
EU Bioeconomy value added components percentage distribution 2015.

Figure 10.
Netherlands downstream value added between 2005 and 2015.

Figure 11.
Netherlands upstream value added between 2005 and 2015.

Figure 12.
EU Member States Bioeconomy Shares in Value Added, 2015.

Figure 13.
Chemicals and pharmaceutical products industry bioeconomy shares in value added, 2005–2015.
Figure 13.
Chemicals and pharmaceutical products industry bioeconomy shares in value added, 2005–2015.

Figure 14.
EU Member States Bioeconomy shares 2005–2015.

Figure 15.
EU Member States Downstream Bioeconomy Value Added 2005–2015.

Figure 16.
EU Member States Upstream Bioeconomy Value Added 2005–2015.

Table 1.
Measurement of the Bioeconomy Literature Review Similar to Our Approach.
| Study | Region | Period | Measure | Methodology |
|---|---|---|---|---|
| Heijman (2016) [9] | Netherlands | 2008–2012 | Value added: 6.6–7.2% of NL GDP | Input–output model |
| Carlson (2016) [13] | United States | 2012 | Turnover: around 2% of US GDP, USD 324 billion. | Combines several sources of financial, consulting reports, surveys. |
| Efken et al. (2012) [14] | Germany | 2007 | Value added: 7.6% of Germany GDP | Input–output model |
| Golden et al. (2015) [15] | United States | 2013 | Value added: 2.2% of GDP | IMPLAN software |
| Nowicki et al. (2008) [16] | EU25 | 2005 | Turnover: EUR 453,741 | Excluding food and feed, data derived from PRODCOM |
| Ronzon et al. (2020) [17] | EU28 | 2008–2017 | Value added: food, beverages and tobacco provide 37%, agriculture provides 30% | The data from EUROSTAT and sector shares of biobased products derived by nova Institute. |
| Rosegrant et al. (2013) [19] | Global | 2050 | GDP growth increase from 3.2% to 3.6% | Combination of partial equilibrium multi commodity, country IMPACT model |
| Vandermeulen et al. (2011) [20] | Flanders, Belgium | 2010 | Value added: 1.8% of GDP | Industry surveys with a focus of biobased energy and products. |
| Kousmanen et al. (2020) [21] | EU28 | 2015 | Value added: EUR 1460.6 billion that is 11% of the GDP | A synthesis of input- and output-based approaches with an ex-post bioeconomy definition. |
Table 2.
Two industry Netherlands IO table.
| S1 | F | Final Demand | Exports | Total Output | |
|---|---|---|---|---|---|
| S1 | 4302.6 | 194.9 | 19,847.4 | 13,247.2 | 32,637.9 |
| F | 172.3 | 6315.1 | 77,865.2 | 669.1 | 93,290.8 |
| Imports | 8402.4 | 592.1 | |||
| Total Input | 20,207.9 | 61,716.8 | |||
| Value Added | 12,429.7 | 31,573.7 | |||
| Total Output | 32,637.6 | 93,290.5 |
Publisher’s Note: MDPI stays neutral with regard to jurisdictional claims in published maps and institutional affiliations. |
© 2021 by the authors. Licensee MDPI, Basel, Switzerland. This article is an open access article distributed under the terms and conditions of the Creative Commons Attribution (CC BY) license (http://creativecommons.org/licenses/by/4.0/).
Share and Cite
MDPI and ACS Style
Cingiz, K.; Gonzalez-Hermoso, H.; Heijman, W.; Wesseler, J.H.H. A Cross-Country Measurement of the EU Bioeconomy: An Input–Output Approach. Sustainability 2021, 13, 3033. https://doi.org/10.3390/su13063033
AMA Style
Cingiz K, Gonzalez-Hermoso H, Heijman W, Wesseler JHH. A Cross-Country Measurement of the EU Bioeconomy: An Input–Output Approach. Sustainability. 2021; 13(6):3033. https://doi.org/10.3390/su13063033
Chicago/Turabian StyleCingiz, Kutay, Hugo Gonzalez-Hermoso, Wim Heijman, and Justus H. H. Wesseler. 2021. "A Cross-Country Measurement of the EU Bioeconomy: An Input–Output Approach" Sustainability 13, no. 6: 3033. https://doi.org/10.3390/su13063033
Note that from the first issue of 2016, this journal uses article numbers instead of page numbers. See further details here.