
Sustainable Applications of Smart-Government Services: A Model to Understand Smart-Government Adoption

 ,
,  ,
,  ,
, 
Abstract
:1. Introduction
2. Related Studies on Smart-Government Adoption
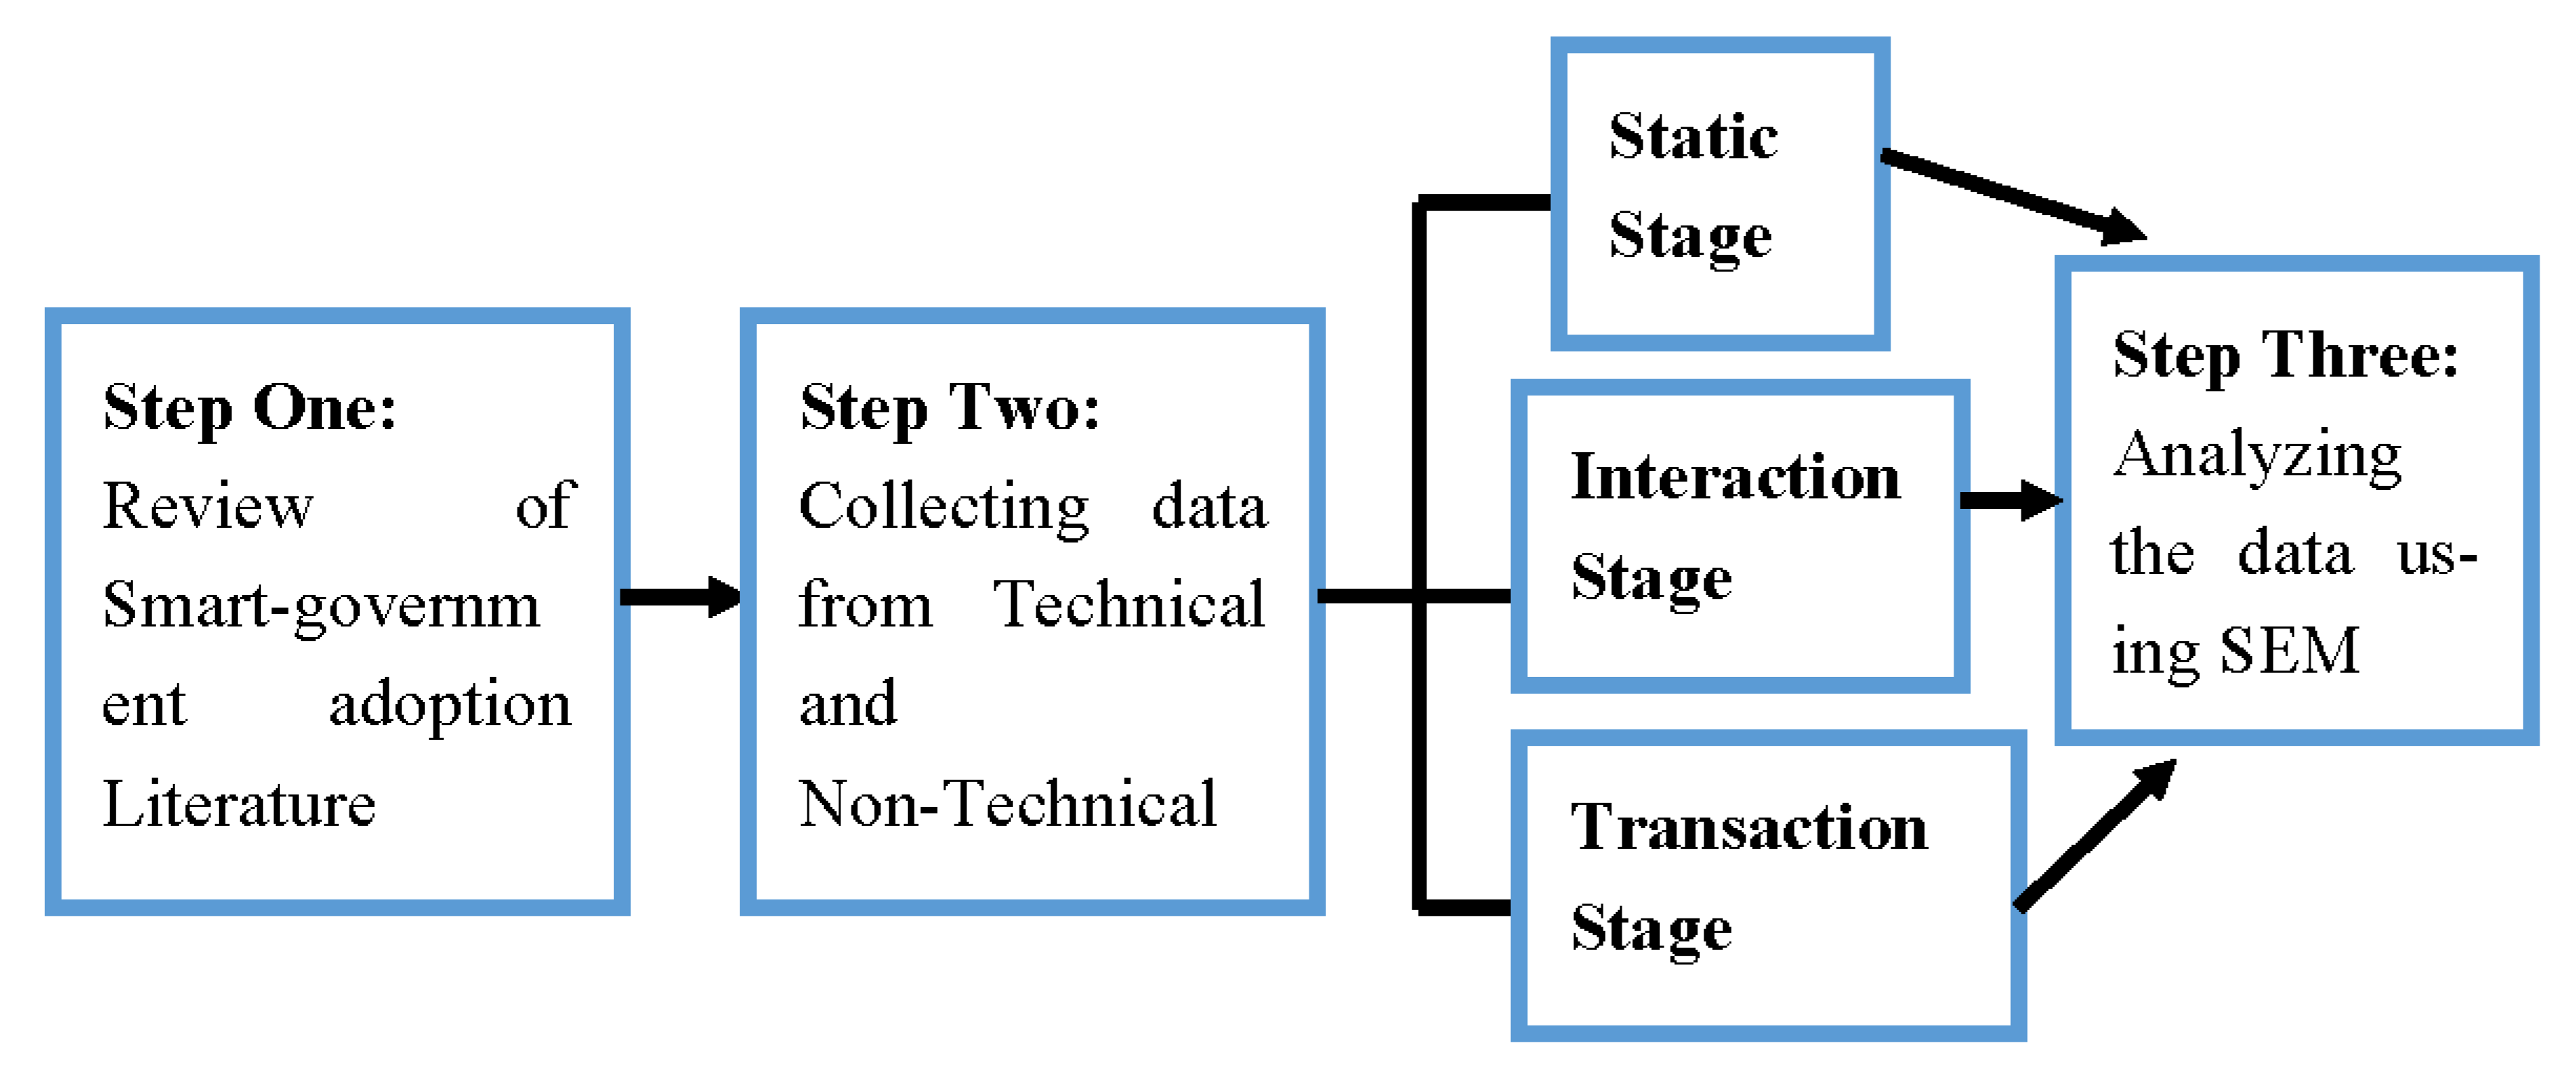
- Step One:
- Inclusion and Exclusion Criteria
- Step Two:
- Data Sources and Search Strategies
- Step Three:
- Data Coding and Analysis

| Literature | Research Purpose | Methodology | Proposed Factors | Sample | Country | Database | Contributions |
|---|---|---|---|---|---|---|---|
| Guenduez et al., [39] | The research aimed to investigate the critical success factors behind the adoption of smart-government services in Switzerland. | Interview and Workshops | 1. Organisational (structure and processes, capabilities, values, and human resources) 2. Institutional (political commitment, clear governance, legal agility, digital awareness, and IT infrastructure) 3. leadership/strategy factors | 10 experts | Switzerland | Google Scholar | The research identified the critical success factors that lead to enhancing the acceptance of smart-government services among users. The study will help the decision makers in understanding the critical aspects surrounding smart applications that may support the successful operation of smart-government services. |
| Almuraqab and Jasimuddin [40] | The study aimed to understand the main factors that influence UAE users’ adoption of smart-government services. | Empirical survey | 1. Awareness 2. Facilitating conditions 3. Social influence 4. Perceived cost 5. Perceived trust in government 6. Perceived trust in technology 7. Perceived risk 8. Perceived compatibility | - | UAE | Google Scholar | The research developed a new framework to capture the main factors that lead to the successful implementation of smart-government services. The study will help in understanding the main aspects surrounding smart applications that may support the successful operation of smart-government services. |
| Alonazi, Beloff, and White [41] | The research aimed to identify the key factors that affect users’ adoption of mobile government services in Saudi Arabia. | Questionnaire | 1. Perceived Ease of Use 2. Perceived Usefulness 3. Culture 4. Trust 5. Social Influence 6. Compatibility 7. Awareness 8. Service quality 9. System Quality 10. Perceived Mobility | 71 Users | Saudi Arabia | IEEE | The paper proposed a conceptual model to investigate the critical factors that influence the adoption of mobile government services. The study will help in understanding the main technical requirements surrounding mobile applications that may support the successful operation of mobile government services in Saudi Arabia. |
| Abu-Shanab and Haider [42] | The purposeof the study was to investigate the effect of perceived usefulness, social influence, perceived ease of use, perceived responsiveness, perceived compatibility and perceived cost of services on users’ adoption of mobile government in Jordan. | Questionnaire | 1. perceived usefulness 2. social influence 3. perceived ease of use 4. perceived responsiveness 5. perceived compatibility 6. perceived cost of services | 470 Citizens | Jordan | Indirect Science | This study used the TAM model to investigate factors, i.e., perceived usefulness, social influence, perceived ease of use, perceived responsiveness, perceived compatibility and perceived cost of services. These five factors are important, whereas the perceived cost of services was deemed to be insignificant. |
| Chohan and Hu [43] | The study proposed a model to determine the success factors that influence the adoption of smart-government services using IOT technology. | Quantitative method | 1. System quality 2. Service quality 3. Information quality 4. Perceived ease of use 5. Trust of government 6. Decision transparency 7. Service collaboration 8. Service effectiveness | Technical experts | Pakistan | IEEE | The research offers valuable insights regarding the public value creation of smart-government services and provides guidelines for technical IT members important for designing government services that are smarter, more transparent, and responsive to citizens. |
| Almaiah et al., [44] | The study aimed to understand the adoption factors of m-government services by employing GAM and UTAUT models. | Questionnaire | 1. Perceived Compatibility 2. Perceived Trust 3. Self-Efficacy 4. Perceived Information Quality 5. Availability of Resources 6. Perceived Awareness 7. Perceived Security 8. Performance Expectancy 9. Effort expectancy 10. Social Influence 11. Facilitating Conditions | Citizens | Jordan | Google Scholar | The research determined the key factors that affectthe liklihood of users adoptingm-government services in Jordan, and proposed an integrated model as a powerful tool that assists in the adoption process of m-government applications. |
| Elenezi et al., [45] | This paper aimed to investigate the main factors that may motivate or hinder employees to use e-government services in Kuwait. | Interviews | 1. User satisfaction 2. institutional values 3. information quality 4. strategic benefits | Employee | Kuwait | Google Scholar | The results found that main factors such as information quality, strategic benefits, and institutional values were observed to achieve better e-governmentservicebenefits. The study also revealed new aspects, such as (cost saving and customer satisfaction) and barriers (e.g.,nepotism and wasta) to improving organizational performance. |
| Sharma et al., [46] | The objective of the research was to identify the main factors that could influence the intention to use mobile government applications by extending the UTAUT model. | Quantitative method | 1. Facilitating conditions 2. social influence 3. performance expectancy 4. trust 5. information quality | Users | Oman | Elsevier | The results indicated that performance expectancy and trust are the key factors that affect user acceptance of mobile government applications. The results of this study have presented theoretical and practical contributions for decision-makers for ensuring the successful development ofmobile government applications. |
| Alshehri, Drew, and AlGhamdi [47] | To analyse the factors that influence the acceptance of e-government services in Saudi Arabia. | Quantitative method | 1. Facilitating conditions 2. social influence 3. performance expectancy | Users | Saudi Arabia | Google Scholar | The findings identified the factors that affect the acceptance of e-government services in KSA based on the UTAUT model. Moreover, as a result of this study, an amendedaUTAUT model was proposed. Such a model contributes to the discussion and development of adoption models for e-government services. |
| Kurfalı et al., [48] | The research aimed to understand the adoption factors of e-government services by employingtheUTAUT model. | Questionnaire | 1. Trust of Internet 2. Trust of government 3. Facilitating conditions 4. social influence 5. performance expectancy | Users | Turkey | Elsevier | The study determined the key factors that influence users in adopting e-government services in Turkey, and proposed an integrated model as a powerful tool that assists in the adoption process of e-government services. |
| Mutaqin and Sutoyo [49] | The study aimed to assess what factors influence the use of e-government services in Indonesia by extending the UTAUT model. | Questionnaire | 1. Facilitating conditions 2. social influence 3. performance expectancy | People | Indonesia | Google Scholar | The study identified the critical success factors that lead to enhancing the acceptance of e-government services among users. The study will help the decision makers in understanding the critical aspects surrounding smart applications that may support the successful operation of e-government services. |
| Li and Shang [50] | This study proposed a chain framework for e-government service adoption in China. | Survey | 1. system quality 2. reliability 3. security 4. accessibility 5. information quality 6. service capability 7. interactivity 8. responsiveness | Citizen users | China | Elsevier | The findings revealed that the adoption of e-government services has been affected by eight contributing factors: system quality, reliability, security, accessibility, information quality, service capability, interactivity, and responsiveness. |
| Zahid and Haji Din [51] | The research aimed to identify the key factors that affect users’ intention to use e- government services in Pakistan. | Questionnaire | 1. Perceived risk 2. Trust 3. Facilitating conditions 4. social influence 5. performance expectancy 6. Self-efficacy 7. Subjective norm | Employees public universities | Pakistan | MDPI | The paper proposed a new model to investigate the critical factors that influence the adoption of e-government services. The study will help in under-standing the main technical requirements sur-rounding mobile applications that may support the successful operation of e-government services in Pakistan. |
| Joshi and Islam [52] | The research aimed to understand the adoption factors of e-government services in developing countries. | Survey | 1. Awareness 2. Accessibility 3. Efficiency 4. Satisfaction | Users | Developing countries | MDPI | The research proposed a maturity model to understand the adoption factors of e-government services in developing countries. |
| Amanbek et al., [53] | The study investigated the critical factors that affect Kazakhstan’s e-government adoption. | Quantitative method Quantitative method | Republic of Kazakhstan | MDPI | The results indicated that awareness among citizens is the strongest factor that could lead to enhanced adoption of e-government services. The findings of this study could be used to help the designers and developers of the e-government system to enhance information content and maintain a more effective level of adoption among people. |
3. Research Methodology
3.1. Data Collection
3.2. Sample and Participants
3.3. Research Instrument Development
3.4. Pilot Test
3.5. Data Analysis
4. Results
4.1. Respondents’ Demographic Profile
4.2. Reliability Analysis
4.3. Convergent Validity and Discriminant Validity Analysis
4.4. Model-Fit Indices Assessment
4.5. Path Analysis of Causal Relationships
4.5.1. Path Analysis of Causal Relationships at Static Stage (SGA-S)
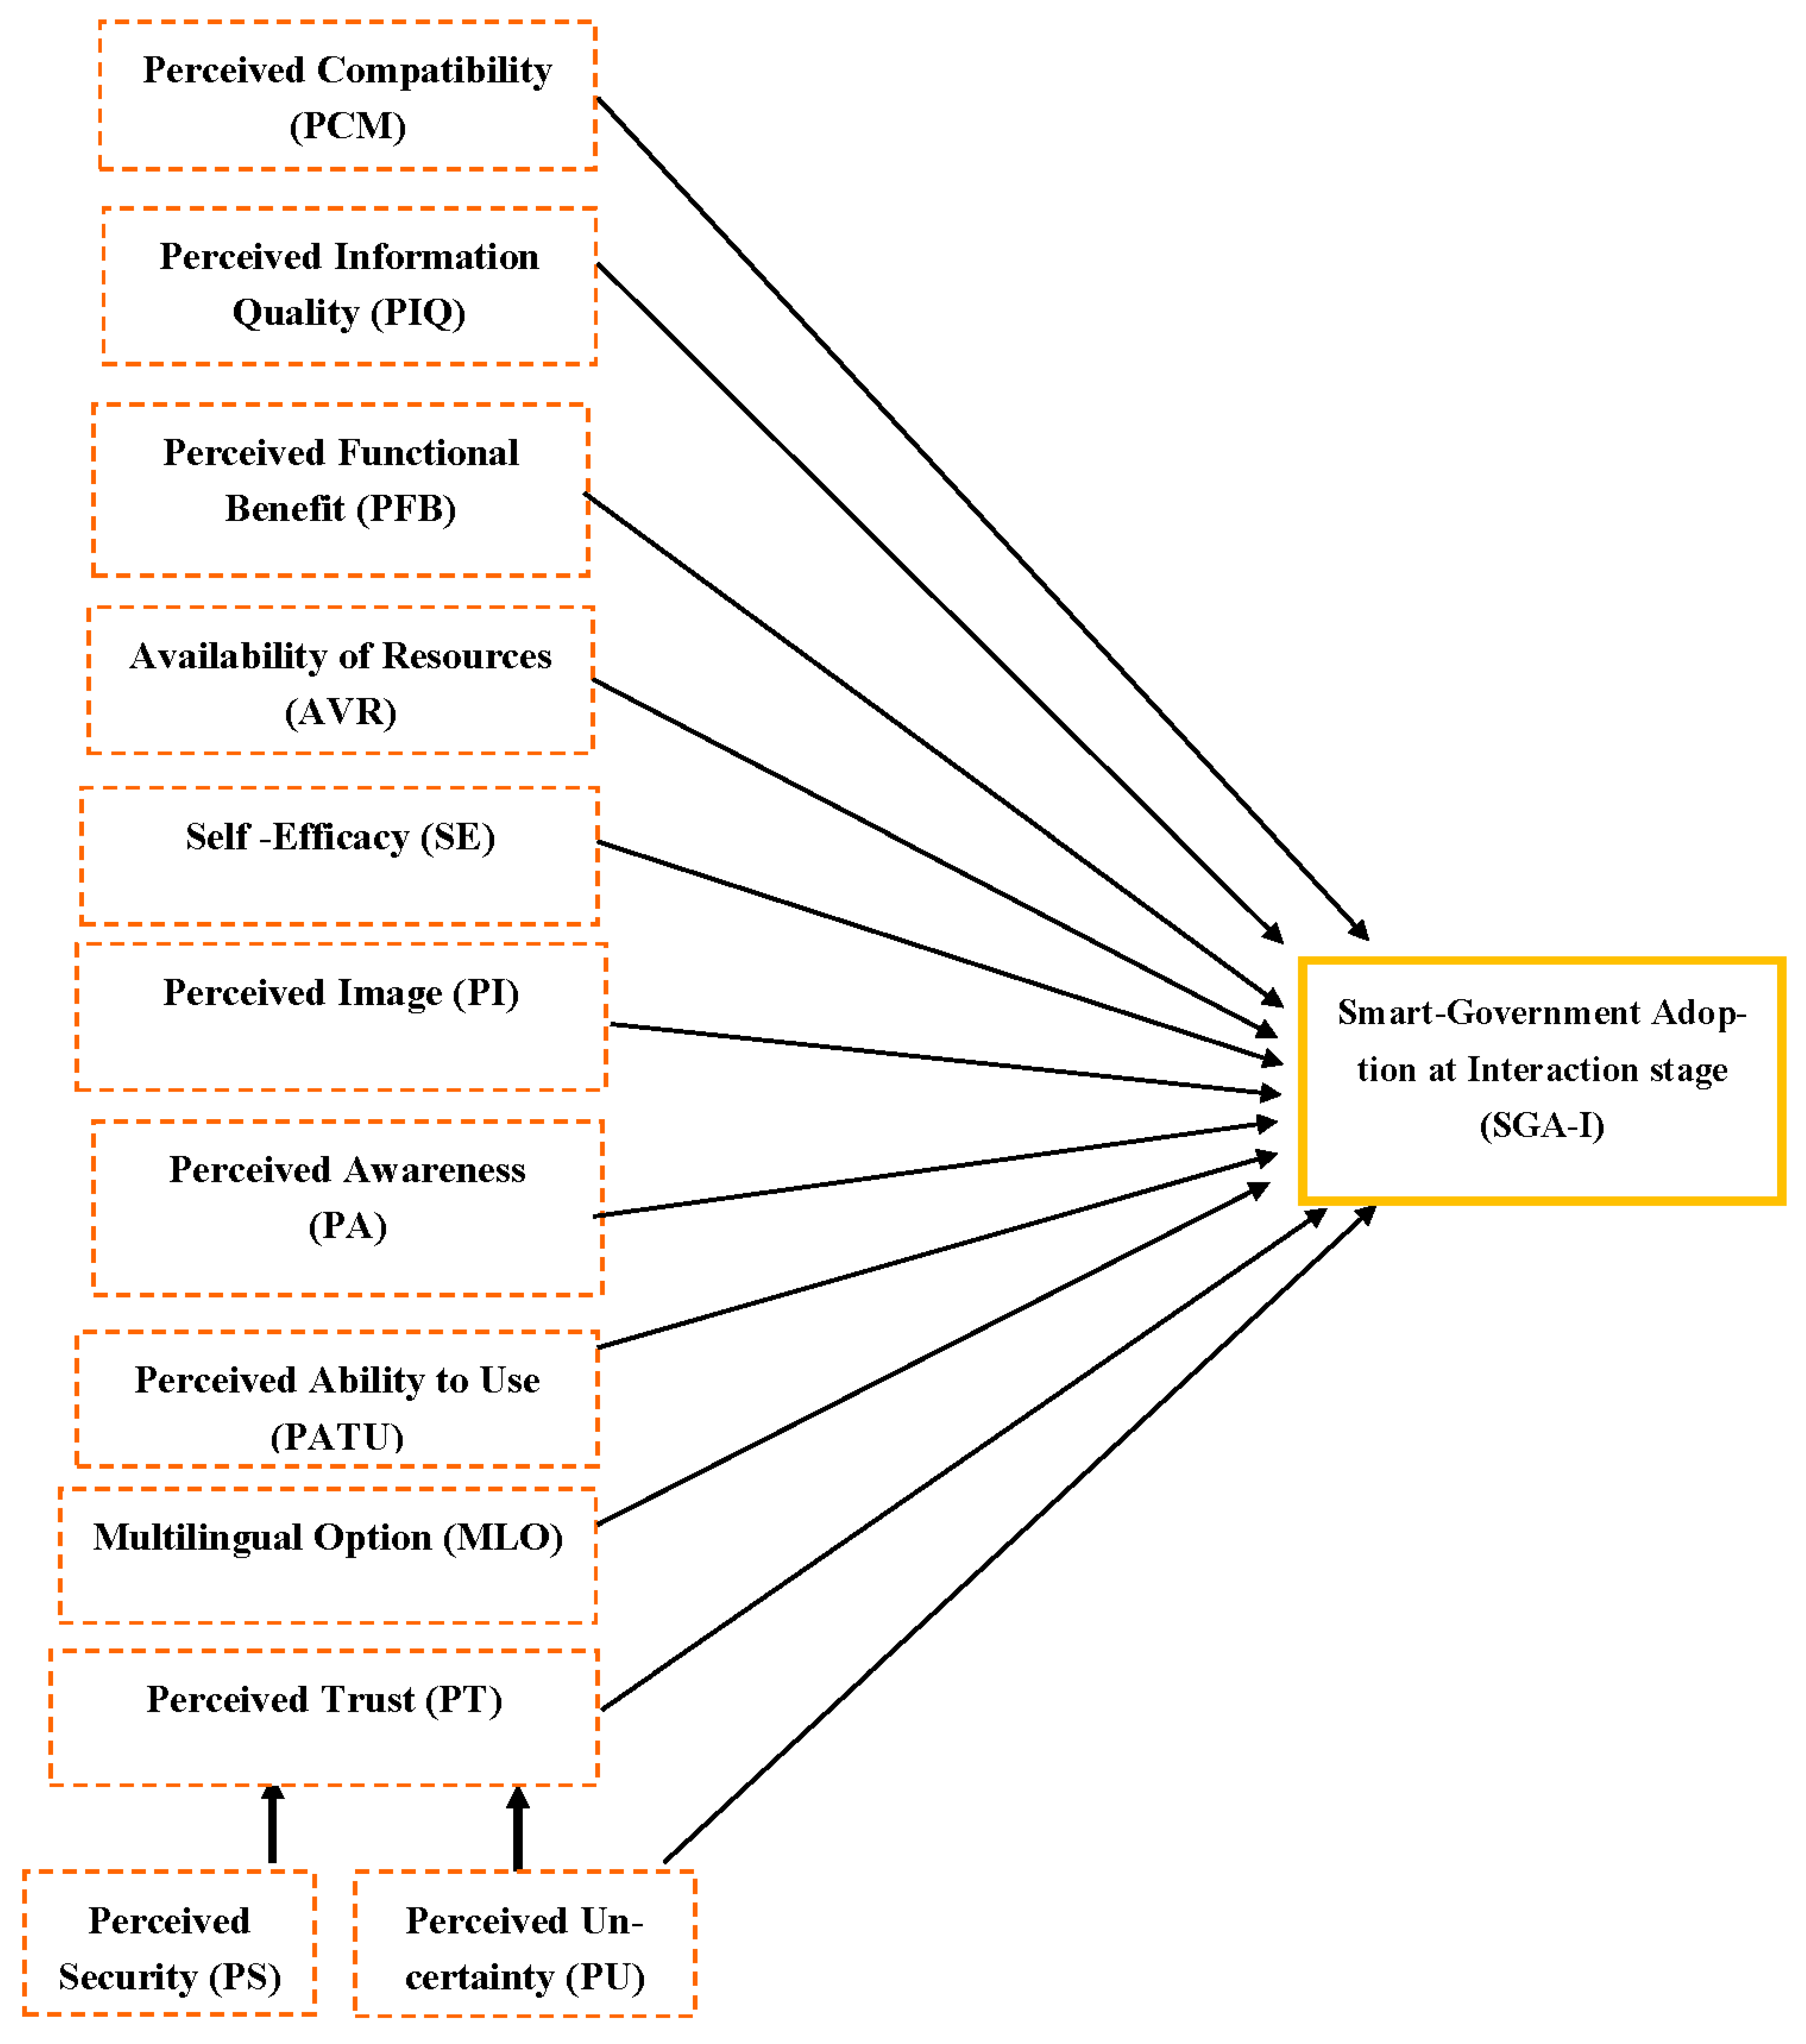
4.5.2. Path Analysis of Causal Relationships at Interaction Stage (SGA-I)
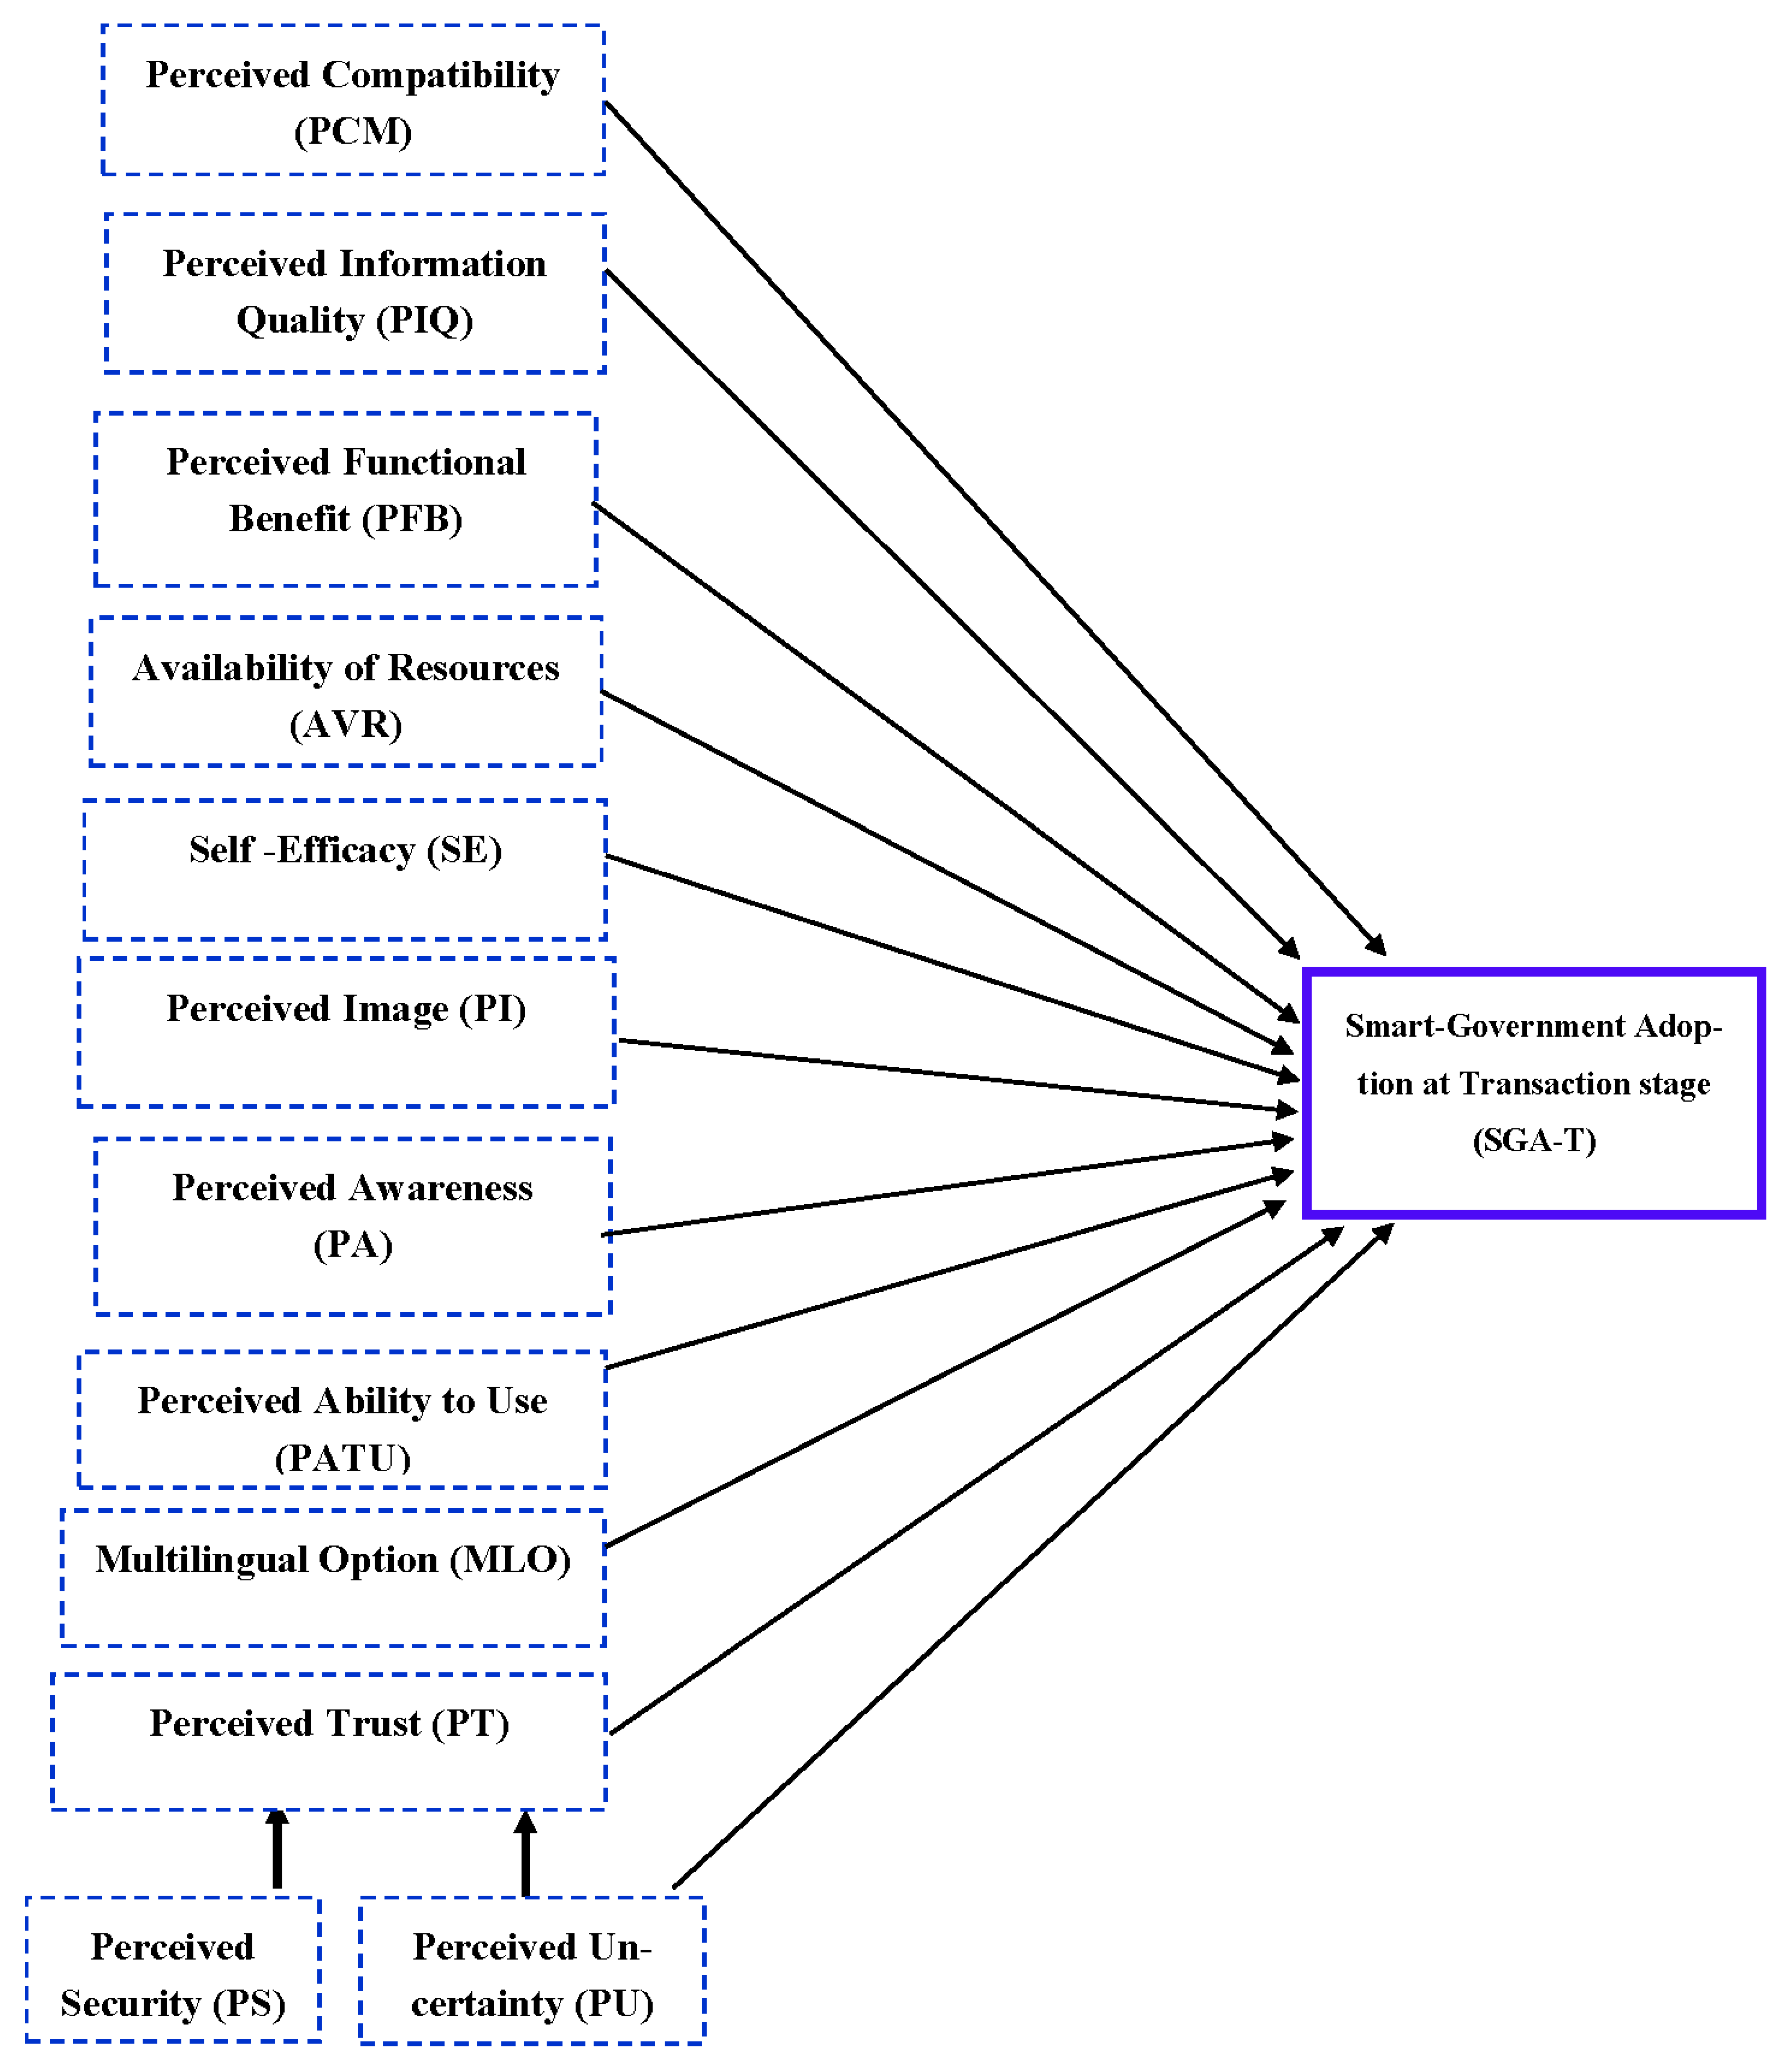
4.5.3. Path Analysis of Causal Relationships at Transaction Stage (SGA-T)
5. Discussion
6. Theoretical and Practical Implications
7. Conclusions
Author Contributions
Funding
Institutional Review Board Statement
Informed Consent Statement
Data Availability Statement
Conflicts of Interest
Abbreviations
| (SGA-S) | Smart-Government Adoption at Static stage |
| (SGA-I) | Smart-Government Adoption at Interaction stage |
| (SGA-T) | Smart-Government Adoption at Transaction stage |
| (GAM) | Government Adoption Model |
| TAM | Technology Acceptance Model |
| UTAUT | Unified Theory of Acceptance and Use of Technology |
| (PCM) | Perceived Compatibility |
| (PA) | Perceived Awareness |
| (SE) | Self-Efficacy |
| (PATU) | Perceived Ability to Use |
| (MLO) | Multilingual Option |
| (PIQ) | Perceived Information Quality |
| (AVR) | Availability of Resources |
| (PFB) | Perceived Functional Benefit |
| (PI) | Perceived Image |
| (PT) | Perceived Trust |
| (PSE) | Perceived Security |
| (PU) | Perceived Uncertainty |
Appendix A
| Construct | Items | Sources |
|---|---|---|
| Perceived Compatibility (PCM) | 1. Smart-government applications are appropriate for my needs. | Shareef et al. [11], Shareef et al. [14] |
| 2. Smart-government applications suit how I like to obtain information. | ||
| 3. I like to virtually interact with smart-government applications more than attending in person. | ||
| 4. Smart-government applications suit how I like to interact. | ||
| Perceived Awareness (PA) | 5. I have an awareness of smart-government applications. | Shareef et al. [14], Shareef et al. [12] |
| 6. I am aware of the benefits of using smart-government applications. | ||
| 7. I have been trained about the overall features of smart-government applications | ||
| 8. I havefound out about the overall features of smart-government applications through social media. | ||
| Self-Efficacy (SE) | 9. I have qualifications related to smart-government applications. | Shareef et al. [14], Shareef et al. [12] |
| 10. I have qualifications related to using or operating smart-government applications via the internet. | ||
| 11. I have the ability to use smart-government applications. | ||
| 12. I have confidence when using smart-government applications. | ||
| Perceived Information Quality (PIQ) | 13. Information on the smart-government applications is up-to-date. | Shareef et al. [11], Shareef et al. [14] |
| 14. Information on the smart-government applications is easy to understand. | ||
| 15. Smart-government applications provide all relevant information necessary to fulfil my needs. | ||
| 16. Smart-government applications provide accurate information about the services they offer. | ||
| 17. Smart-government applications provide the policies of the government related to the functions of the application. | ||
| 18. Smart-government applications provide links to related external information. | ||
| Availability of Resources (AVR) | 19. My smart internet connection is sufficient that I can use it anywhere. | Shareef et al. [12] |
| 20. The Internet connection on my smart phone is cheap. | ||
| 21. I always have access to the internet through my phone and can use it to use smart-government applications. | ||
| Perceived Ability to Use (PATU) | 22. Learning to interact with smart-government services application is not difficult for me. | Shareef et al. [14], Shareef et al. [12] |
| 23. It is not difficult to navigate smart-government services applications. | ||
| 24. Interactions with smart-government services application are easy to understand. | ||
| 25. I can perform other tasks while using smart-government services applications. | ||
| Perceived Security (PSE) | 26. Smart-government applications are safe to use for financial purposes. | Shareef et al. [14], Shareef et al. [12] |
| 27. Smart-government applications protect my banking information securely | ||
| 28. Smart-government applications do not share my personal information with other sites. | ||
| Perceived Image (PI) | 29. Citizens who use smart-government application have a high profile. | Shareef et al. [14], Shareef et al. [12] |
| 30. Citizens who use smart-government application have more prestige than those who do not. | ||
| 31. Interacting with smart-government application enhances social status. | ||
| Multilingual Option (MLO) | 32. Availability of preferred language option on a smart-government application helps to perform tasks better. | Shareef et al. [14], Shareef et al. [12] |
| 33. Availability of native language (mother language) option on a smart-government application makes tasks easier. | ||
| 34. Without my preferred language, I cannot understand my tasks on smart-government application. | ||
| Perceived Functional Benefit (PFB) | 35. It is important to be able to use smart-government applications from anywhere. | Shareef et al. [14], Shareef et al. [12] |
| 36. It is important to use the smart-government application at any time that is convenient for me. | ||
| 37. Using smart-government application improves the efficiency of my tasks. | ||
| Perceived Trust (PT) | 38. The smart-government application is on the whole reliable. | Shareef et al. [14], Shareef et al. [12] |
| 39. What I do through this smart-government application is guaranteed. | ||
| 40. The smart-government application is more reliable than physical government offices. | ||
| 41. The government takes full responsibility for any type of insecurity during interaction/transaction at the smart-government application. | ||
| 42. Legal and technological policies of the smart-government application adequately protect me from problems on the internet. | ||
| Perceived Uncertainty (PU) | 43. Interaction with a smart-government application is unmanageable due to the absence of direct personnel. | Shareef et al. [14], Shareef et al. [12] |
| 44. Interaction in the smart-government application as a virtual environment is uncomfortable. | ||
| 45. The outcome from the interaction with the smart-government application is uncertain due to the absence of direct personnel. |
| Constructs | Items | Stages Description |
|---|---|---|
| Smart-Government Adoption at Static stage (SGA-S) | 46. To view/access account-related information, I would like to use the smart-government application in future. | The decision to adopt and use a smart-government application to access and check important information such as passport information, dependent information, civil affairs, vehicle information, traffic violations, expatriate affairs, and postal information. |
| 47. To download forms for account-related functions as the user requires, I would like to use the smart-government application in future. | ||
| Smart-Government Adoption at Interaction stage (SGA-I) | 48. I use smart-government applications to contact and make queries via email. | The decision to adopt and use a smart-government application to interact with customer services for queries for different reasons, as the user requires. |
| 49. I would like to use smart-government applications in the future to contact/make query/email, | ||
| 50. I use smart-government applications for customer service. | ||
| 51. I want to use the smart-government application in the future for customer service. | ||
| Smart-Government Adoption at the Transaction stage (SGA-T) | 52. I use smart-government applications to pay bills, fees and taxes. | The decision to accept and use a smart-government application to pay bills, fees and taxes, as the user requires. |
| 53. I would like to use the smart-government application in future to pay bills, fees, and taxes. |
References
- Jshi, P.R.; Islam, S. E-government maturity model for sustainable E-government services from the perspective of developing countries. Sustainability 2018, 10, 1882. [Google Scholar] [CrossRef] [Green Version]
- Kurfalı, M.; Arifoğlu, A.; Tokdemir, G.; Paçin, Y. Adoption of e-government services in Turkey. Comput. Hum. Behav. 2017, 66, 168–178. [Google Scholar] [CrossRef]
- Li, Y.; Shang, H. Service quality, perceived value, and citizens’ continuous use intention regarding e-government: Empirical evidence from China. Inf. Manag. 2020, 57, 103197. [Google Scholar] [CrossRef]
- Muin, K.A.; Sutoyo, E. Analysis of Citizens Acceptance for e-Government Services in Bandung, Indonesia: The Use of the Unified Theory of Acceptance and Use of Technology (UTAUT) Model. Bull. Comput. Sci. Electr. Eng. 2020, 1, 19–25. [Google Scholar]
- Sharma, S.K.; Al-Badi, A.; Rana, N.P.; Al-Azizi, L. Mobile applications in government services (mG-App) from user’s perspectives: A predictive modelling approach. Gov. Inf. Q. 2018, 35, 557–568. [Google Scholar] [CrossRef] [Green Version]
- Zahid, H.; Din, B.H. Determinants of intention to adopt e-government services in Pakistan: An imperative for sustainable development. Resource 2019, 8, 128. [Google Scholar] [CrossRef] [Green Version]
- Abdelghaffar, H.; Magdy, Y. The adoption of mobile government services in developing countries: The case of Egypt. Int. J. Inf. Commun. Technol. Res. 2012, 2. [Google Scholar]
- Abdullah, F.; Ward, R. Developing a General Extended Technology Acceptance Model for E-Learning (GETAMEL) by analyzing commonly used external factors. Comput. Hum.Behav. 2016, 56, 238–256. [Google Scholar] [CrossRef]
- Abu-Shanab, E.A. E-government familiarity influence on Jordanians’ perceptions. Telemat. Inform. 2017, 34, 103–113. [Google Scholar] [CrossRef]
- Shareef, M.A.; Kumar, V.; Kumar, U.; Dwivedi, Y.K. e-Government Adoption Model (GAM): Differing service maturity levels. Gov. Inf. Q. 2011, 28, 17–35. [Google Scholar] [CrossRef]
- Shareef, M.A.; Kumar, V.; Dwivedi, Y.K.; Kumar, U. Service delivery through mobile-government (mGov): Driving factors and cultural impacts. Inf. Syst. Front. 2016, 18, 315–332. [Google Scholar] [CrossRef] [Green Version]
- Akhtar Shareef, M.; Kumar, V.; Kumar, U.; Dwivedi, Y. Factors affecting citizen adoption of transaction electronic government. J. Enterp. Inf. Manag. 2014, 27, 385–401. [Google Scholar] [CrossRef] [Green Version]
- Almaiah, M.A.; Althunibat, A.; Khawatreh, S. Mobile Government Adoption Model Based on Combining GAM and UTAUT to Explain Factors According to Adoption of Mobile Government Services. iJIM 2020, 14, 199. [Google Scholar] [CrossRef] [Green Version]
- Alenezi, H.; Tarhini, A.; Masa’deh, R.E.; Alalwan, A.; AlQirim, N. Factors Affecting the Adoption of e-Government in Kuwait: A Qualitative Study. Electron. J. E Gov. 2017, 15, 84. [Google Scholar]
- Ahmad, S.Z.; Khalid, K. The adoption of M-government services from the user’s perspectives: Empirical evidence from the United Arab Emirates. Int. J. Inf. Manag. 2017, 37, 367–379. [Google Scholar] [CrossRef]
- Almaiah, M.A.; Nasereddin, Y. Factors influencing the adoption of e-government services among Jordanian citizens. Electron. Gov. Int. J. 2020, 16, 236–259. [Google Scholar] [CrossRef]
- Al-Khouri, A.M.; Bal, J. Electronic government in the GCC countries. Int. J. Soc. Sci. 2007, 1, 83–98. [Google Scholar]
- AlMamary, Y.H.; Shamsuddin, A.; Aziati, N. Investigating the key factors influencing on management information systems adoption among telecommunication companies in Yemen: The conceptual framework development. Int. J. Energy Inf. Commun. 2015, 6, 59–68. [Google Scholar]
- Almarashdeh, I.; Alsmadi, M.K. How to make the museit? Citizens acceptance of M-government. Appl. Comput. Inform. 2017, 13, 194–199. [Google Scholar] [CrossRef]
- Al-maiah, M.A.; Al Khasawneh, A.; Althunibat, A. Exploring the critical challenges and factors influencing the E-learning system usage during COVID-19 pandemic. Educ. Inf. Technol. 2020, 25, 5261–5280. [Google Scholar] [CrossRef]
- Almaiah, M.A.; Jalil, M.A.; Man, M. Extending the TAM to examine the effects of quality features on mobile learning acceptance. J. Comput. Educ. 2016, 3, 453–485. [Google Scholar] [CrossRef]
- Almaiah, M.A.; Alismaiel, O.A. Examination of factors influencing the use of mobile learning system: An empirical study. Educ. Inf. Technol. 2019, 24, 885–909. [Google Scholar] [CrossRef]
- Alshehri, M.; Drew, S.; AlGhamdi, R. Analysis of citizens acceptance for e-government services: Applying the UTAUT model. arXiv 2013, arXiv:1304.3157. [Google Scholar]
- Bélanger, F.; Carter, L. Trust and risk in e-government adoption. J. Strateg. Inf. Syst. 2008, 17, 165–176. [Google Scholar] [CrossRef] [Green Version]
- Carter, L.; Bélanger, F. The utilization of e-government services: Citizen trust, innovation and acceptance factors. Inf. Syst. J. 2005, 15, 5–25. [Google Scholar] [CrossRef]
- Dahi, M.; Ezziane, Z. Measuring e-government adoption in Abu Dhabi with technology acceptance model (TAM). Int. J. Electr. Gov. 2015, 7, 206–231. [Google Scholar] [CrossRef]
- Davis, F.D. Perceived usefulness, perceived ease of use, and user acceptance of information technology. MIS Q. 1989, 319–340. [Google Scholar] [CrossRef] [Green Version]
- Davis, F.D.; Bagozzi, R.P.; Warshaw, P.R. User acceptance of computer echnology: A comparison of two theoretical models. Manag. Sci. 1989, 35, 982–1003. [Google Scholar] [CrossRef] [Green Version]
- Dwivedi, Y.K.; Weerakkody, V.; Janssen, M. Moving towards maturity: Challenges to successful-government implementation and diffusion. ACM SIGMIS Database Database Adv. Inf. Syst. 2012, 42, 11–22. [Google Scholar] [CrossRef]
- El-Kiki, T.; Lawrence, E. Mobile user satisfaction and usage analysis model of m-government services. In Proceedings of the EURO mGOV, Brighton, UK, 3–5 September 2006; pp. 91–102. [Google Scholar]
- Fishbein, M.; Jaccard, J.; Davidson, A.R.; Ajzen, I.; Loken, B. Predicting and understanding family planning behaviors. In Understanding Attitudes and Predicting Social Behavior; Prentice Hall: Upper Saddle River, NJ, USA, 1980. [Google Scholar]
- Kushchu, I.; Borucki, C. Impact of mobile technologies on government. In Proceedings of the European Conference on e-Government, Dublin, Ireland, 3–4 July 2004. [Google Scholar]
- Lallmahomed, M.Z.; Lallmahomed, N.; Lallmahomed, G.M. Factors influencing the adoption of e-Government services in Mauritius. Telemat. Inform. 2017, 34, 57–72. [Google Scholar] [CrossRef]
- Kitchenham, B.; Charters, S. Guidelines for performing systematic literature reviews in software engineering. Citeseer 2007, 20, 55–62. [Google Scholar]
- Liu, Y.; Li, H.; Kostakos, V.; Goncalves, J.; Hosio, S.; Hu, F. An empirical investigation of mobile government adoption in rural China: A case study in Zhejiang province. Gov. Inf. Q. 2014, 31, 432–442. [Google Scholar] [CrossRef]
- Mensah, I.K.; Mi, J. Computer Self-Efficacy and e-Government Service Adoption: The Moderating Role of Ageas a Demographic Factor. Int. J. Public Adm. 2019, 42, 158–167. [Google Scholar] [CrossRef]
- Ozkan, S.; Kanat, I.E. e-Government adoption model based on theory of planned behavior: Empirical validation. Gov. Inf. Q. 2011, 28, 503–513. [Google Scholar] [CrossRef]
- Prybutok, V.R.; Zhang, X.; Ryan, S.D. Evaluating leadership, IT quality, and net benefits in an e-government environment. Inf. Manag. 2008, 45, 143–152. [Google Scholar] [CrossRef]
- Rallis, S.; Chatzoudes, D.; Symeonidis, S.; Aggelidis, V.; Chatzoglou, P. Factors Affecting Intention to Use E-government Services: The Case of Non-adopters. In European, Mediterranean, and Middle Eastern Conference on Information Systems; Springer: Cham, Switzerland, 2018; pp. 302–315. [Google Scholar]
- Rana, N.P.; Dwivedi, Y.K.; Lal, B.; Williams, M.D.; Clement, M. Citizens’ adoption of an electronic government system: Towards a unified view. Inf. Syst. Front. 2017, 19, 549–568. [Google Scholar] [CrossRef] [Green Version]
- Rana, N.; Janssen, M.; Sahu, G.P.; Baabdullah, A.; Dwivedi, Y. Citizens’ Perception about M-Government Services: Results from an Exploratory Survey. In Proceedings of the 52nd Hawaii International Conference on System Sciences, Maui, HI, USA, 8–11 January 2019. [Google Scholar]
- Raaij, E.M.; Schepers, J.J. The acceptance and use of avirtual learning environment in China. Comput. Educ. 2008, 50, 838–852. [Google Scholar] [CrossRef]
- Rogers, E.M. Diffusion of Innovations: Modifications of a model for telecommunications. In Die Diffusion von Innovationen in der Telekommunikation; Springer: Berlin/Heidelberg, Germany, 1995; pp. 25–38. [Google Scholar]
- Sá, F.; Rocha, Á.; Cota, M.P. From the quality of traditional services to the quality of local-Government on line services: Aliteraturereview. Gov. Inf. Q. 2016, 33, 149–160. [Google Scholar] [CrossRef]
- Samaradiwakara, G.D.M.N.; Gunawardena, C.G. Comparison of existing technology acceptance theories and models to suggest a well improved theory/model. Int. Tech. Sci. J. 2014, 1, 21–36. [Google Scholar]
- Shareef, M.A.; Archer, N.; Dwivedi, Y.K. Examining adoption behavior of mobile government. J. Comput. Inf. Syst. 2012, 53, 39–49. [Google Scholar]
- Sheng, H.; Trimi, S. M-government: Technologies, applications and challenges. Electr. Gov. Int. J. 2008, 5, 1–18. [Google Scholar] [CrossRef]
- Siponen, M.; Mahmood, M.A.; Pahnila, S. Employees’ adherence to information security policies: An exploratory field study. Inf. Manag. 2014, 51, 217–224. [Google Scholar] [CrossRef]
- Svendsen, G.B.; Johnsen, J.A.K.; AlmåsSørensen, L.; Vittersø, J. Personality and technology acceptance: The influence of personality factors on the core constructs of the Technology Acceptance Model. Behav. Inf. Technol. 2013, 32, 323–334. [Google Scholar] [CrossRef]
- Surendran, P. Technology acceptance model: A survey of literature. Int. J. Bus. Soc. Res. 2012, 2, 175–178. [Google Scholar]
- Tavakoli, F.; Ghasemi, M.; Yaghoubi, N. A Survey of Technical Factors Affecting Mobile Government Implementation in the Public Service of Fars Province. J. Product. Dev. 2016, 2, 76–85. [Google Scholar]
- Venkatesh, V.; Zhang, X. Unified theory of acceptance and use of technology: US vs. China. J. Glob. Inf. Technol. Manag. 2010, 13, 5–27. [Google Scholar] [CrossRef]
- Venkatesh, V.; Morris, M.G.; Davis, G.B.; Davis, F.D. User acceptance of information technology: Toward a unified view. MIS Q. 2003, 20, 425–478. [Google Scholar] [CrossRef] [Green Version]
- Venkatesh, V. Determinants of perceived ease of use: Integrating control, intrinsic motivation, and emotion in to the technology acceptance model. Inf. Syst. Res. 2000, 11, 342–365. [Google Scholar] [CrossRef] [Green Version]
- Walldén, S.; Mäkinen, E.; Raisamo, R. A review on objective measurement of usage in technology acceptance studies. Univ. Access Inf. Soc. 2016, 15, 713–726. [Google Scholar] [CrossRef]
- Wang, C. Antecedents and consequences of perceived value in Mobile Government continuance use: An empirical research in China. Comput. Hum. Behav. 2014, 34, 140–147. [Google Scholar] [CrossRef]
- Wu, M.Y.; Chou, H.P.; Weng, Y.C.; Huang, Y.H. TAM-2 based study of website user behavior-using web2.0 websites as an example. WSEAS Transac. Bus. Econ. 2011, 4, 133–151. [Google Scholar]
- Pierce, P.; Ricciardi, F.; Zardini, A. Smart cities as organizational fields: A framework form appling sustainability-enabling configurations. Sustainability 2017, 9, 1506. [Google Scholar] [CrossRef] [Green Version]
- Almuraqab, N.A.S.; Jasimuddin, S.M. Factors that influence end-users’ adoption of smart government services in the UAE: A conceptual framework. Electron. J. Inf. Syst. Eval. 2017, 20, 11. [Google Scholar]
- Alonazi, M.; Beloff, N.; White, M. Developing a Model and Validating an Instrument for Measuring the Adoption and Utilisation of Mobile Government Services Adoption in Saudi Arabia. In Proceedings of the 2019 Federated Conference on Computer Science and Information Systems (FedCSIS), Leipzig, Germany, 1–4 September 2019; pp. 633–637. [Google Scholar]
- Guenduez, A.A.; Singler, S.; Tomczak, T.; Schedler, K.; Oberli, M. Smart government success factors. Yearb. Swiss Adm. Sci. 2018, 9, 96–110. [Google Scholar] [CrossRef] [Green Version]
- Chohan, S.R.; Hu, G. Success factors influencing citizens’ adoption of IoT service or chestration for public value creation in smart government. IEEE Access. 2020, 8, 208427–208448. [Google Scholar] [CrossRef]
- Amanbek, Y.; Balgayev, I.; Batyrkhanov, K.; Tan, M. Adoption of e-government in the Republic of Kazakhstan. J. Open Innov. Technol. Mark. Complex. 2020, 6, 46. [Google Scholar] [CrossRef]
- Al-maiah, M.A.; Alamri, M.M.; Al-Rahmi, W. Applying the UTAUT model to explain the students’ acceptance of mobile learning system in higher education. IEEE Access 2019, 7, 174673–174686. [Google Scholar] [CrossRef]
- Almaiah, M.A. Acceptance and usage of a mobile information system services in University of Jordan. Educ. Inf. Technol. 2018, 23, 1873–1895. [Google Scholar] [CrossRef]
- Almaiah, M.A.; Man, M. Empirical investigation to explore factors that achieve high quality of mobile learning system based on students’ perspectives. Eng. Sci. Technol. Int. J. 2016, 19, 1314–1320. [Google Scholar] [CrossRef] [Green Version]
- Almaiah, M.A.; AlMulhem, A. Analysis of the essential factors affecting of intention to use of mobile learning applications: A comparison between universities adopters and non-adopters. Educ. Inf. Technol. 2019, 24, 1433–1468. [Google Scholar] [CrossRef]
- Almaiah, M.A.; Alyoussef, I.Y. Analysis of the effect of course design, course content support, course assessment and instructor characteristics on the actual use of E-learning system. IEEE Access 2019, 7, 171907–171922. [Google Scholar] [CrossRef]
- Almaiah, M.A.; AlKhasawneh, A. Investigating the main determinants of mobile cloud computing adoption in university campus. Educ. Inf. Technol. 2020, 25, 3087–3107. [Google Scholar] [CrossRef]
- Almaiah, M.A.; Alamri, M.M.; Al-Rahmi, W.M. Analysis the effect of different factors on the development of Mobile learning applications at different stages of usage. IEEE Access 2019, 8, 16139–16154. [Google Scholar] [CrossRef]
- Almaiah, M.A.; Almulhem, A. A conceptual framework for determining the success factors of e-learning system implementation using Delphi technique. J. Theor. Appl. Inf. Technol. 2018, 96, 5962–5976. [Google Scholar]
- Alamri, M.M.; Almaiah, M.A.; Al-Rahmi, W.M. Social media applications affecting Students’ academic performance: Amodel developed for sustainability in higher education. Sustainability 2020, 12, 6471. [Google Scholar] [CrossRef]
- Almaiah, M.A.; Masita, M.; Jalil, A. Investigating Students’ Perceptions on Mobile Learning Services. Int. J. Interact. Mob. Technol. 2014, 8, 31–36. [Google Scholar] [CrossRef] [Green Version]
- Alamri, M.M.; Almaiah, M.A.; Al-Rahmi, W.M. The Role of Compatibility and Task-Technology Fit (TTF): On Social Networking Applications (SNAs) Usage as Sustainability in Higher Education. IEEE Access 2020, 8, 161668–161681. [Google Scholar] [CrossRef]
- Shawai, Y.G.; Almaiah, M.A. Malay language mobile learning system (MLMLS) using NFC technology. Int. J. Educ. Manag. Eng. 2018, 8, 1. [Google Scholar] [CrossRef]
- Alghazi, S.S.; Kamsin, A.; Almaiah, M.A.; Wong, S.Y.; Shuib, L. For Sustainable Application of Mobile Learning: An Extended UTAUT Model to Examine the Effect of Technical Factors on the Usage of Mobile Devices as a Learning Tool. Sustainability 2021, 13, 1856. [Google Scholar] [CrossRef]
- Almaiah, M.A.; Jalil, M.A.; Man, M. Preliminary study for exploring the major problems and activities of mobile learning system: A case study of Jordan. J. Theor. Appl. Inf. Technol. 2016, 93. Available online: http://www.jatit.org/volumes/ninetythree2.php (accessed on 22 January 2021).
- Alksasbeh, M.; Abuhelaleh, M.; Almaiah, M. Towards a model of quality features for mobile social networks apps in learning environments: An extended information system success model. iJIM 2019, 13. Available online: https://online-journals.org/index.php/i-jim/article/view/9791 (accessed on 22 January 2021). [CrossRef] [Green Version]
- AlAmri, M.M.; Almaiah, M.A. The Use of Mobile Gamification Technology for Sustainability Learning in Saudi Higher Education. Int. J. 2020, 9. [Google Scholar] [CrossRef]
- Almaiah, M.A.; Alamri, M.M. Proposing a new technical quality requirements for mobile learning applications. J. Theor. Appl. Inf. Technol. 2018, 96. Available online: http://www.jatit.org/volumes/Vol96No20/24Vol96No20.pdf (accessed on 22 January 2021).
- Al-Rahmi, W.M.; Alias, N.; Othman, M.S.; Marin, V.I.; Tur, G. A model of factors affecting learning performance through the use of social media in Malaysian higher education. Comput. Educ. 2018, 121, 59–72. [Google Scholar] [CrossRef]
- Al-Rahmi, W.M.; Yahaya, N.; Alturki, U.; Alrobai, A.; Aldraiweesh, A.A.; Omar Alsayed, A.; Kamin, Y.B. Social media–based collaborative learning: The effect on learning success with the moderating role of cyberstalking and cyberbullying. Interactive Learn. Environ. 2020, 20, 1–4. [Google Scholar] [CrossRef]


| Constructs | Conceptual Definitions | Hypotheses |
|---|---|---|
| Perceived Compatibility (PCM) | The degree to which a smart-government application is perceived as consistent with theneeds and perceptions of consumers. | Perceived compatibility (PCM) has a significant relation with the adoption of smart-government services |
| Perceived Awareness (PA) | The extent to which a user’s acquired knowledge and awareness can allow them to learn the characteristics of smart-government systems, and use their functions well, in addition toidentifying the advantages and disadvantages. | Perceived awareness (PA) has a significant relation with the adoption of smart-government services |
| Availability of Resources (AOR) | The availability or access to a smart device and the freedom a person has to use the internet. Other features include speed and cost. | Availability of resources (AOR) has a significant relation with Adoption of smart-governmentservices |
| Self-Efficacy (SE) | The extent of a users technical capability to use, interact and transact with a smart-government application based on prior knowledge, experience, and skill. | Self-Efficacy (SE) has a significant relation with adoption of smart-government services |
| Perceived Ability to Use (PATU) | The degree to which users perceive their competence, and how comfortable they feel using smart-government systems technologically, organisationally, and psychologically. Additionally, how these factors relate to the social needs, attitudes, and values of consumers. | Perceived ability to use (PATU) has a significant relation with the adoption of smart-government services |
| Multilingual Option (MLO) | Smart-government systems offer various languages to facilitate users when they are accessing services, and to allow them to interact and carry out transactions in their preferred language. | Multilingual option (MLO) has a significant relation with the adoption of smart-government services |
| Perceived Information Quality (PIQ) | Refers to how accurate and well organised the information provided is, and how understandable, and current the information is in relation to various services. | Perceived information quality (PIQ) has a significant relation with the adoption of smart-government services |
| Perceived Trust (PT) | A person’s level of confidence in the smart-government system’s ability to provide an efficient and reliable service. | Perceived trust (PT) has a significant relation with the adoption of smart-government services |
| Perceived Uncertainty (PU) | The level of perceived risk during transactions due to unforeseen situations in the virtual environment associated with smart-government systems. | Perceived uncertainty has a significant relation with perceived trust |
| Perceived Security (PS) | User perception of the level of data privacy, integrity, efficiency, and security for all electronic transactions via smart-government systems. | Perceived security has a significant relation with perceived trust |
| Perceived Functional Benefit (PFB) | The degree to which users perceive the overall functional benefits, including cost, time, efficiency, and effectiveness of using smart-government systems—instead of using traditional physical office functions. | Perceived functional benefit (PFB) has a significant relation with the adoption of smart-government services |
| Perceived Image (PI) | The degree to which users behaviourally and culturally perceive that the adoption of smart-government systems will enhance and improve their social standing or prestige. | Perceived image (PI) has a significant relation with the adoption of smart-government services |
| Inclusion Criteria | Exclusion Criteria |
|---|---|
| 1. The selected articles should include smart-government services. | 1. Exclude each study that did not focus on smart-government services. |
| 2. The selected articles that measure the adoption or acceptance of smart-government services. | 2. Exclude each study that did not focus on adoption or acceptance of smart-government services. |
| 3. The selected articles should include e-government or smart-government services. | 3. Exclude studies written in languages other than English. |
| 4. The selected articles should be published in journals. | |
| 5. The selected articles should be published between 2015 and 2021. |
| Stage | Non-Technical Background | Technical Background | Number of Participants | Number of Completed Questionnaires |
|---|---|---|---|---|
| Static Stage | 193 | 82 | 275 | 117 |
| Interaction Stage | 227 | 63 | 290 | 133 |
| Transaction Stage | 201 | 41 | 242 | 70 |
| KERRYPNX | Classification | Frequency | Percent |
|---|---|---|---|
| Gender | Male | 182 | 56.8 |
| Female | 138 | 43.2 | |
| Age | 22–32 | 110 | 34.3 |
| 32–42 | 132 | 41.2 | |
| Over 42 | 78 | 24.4 | |
| Level of study | Undergraduate | 225 | 70.3 |
| Postgraduate | 95 | 29.7 | |
| Sector | Public | 210 | 65.6 |
| Private | 110 | 34.4 | |
| Smart devices use | Never used | 0 | 0.0 |
| Several times weekly | 2 | 0.06 | |
| Several times | |||
| very day | 318 | 99.3 |
| Variables | Cronbach’s Alpha (α > 0.7) | Average Variance Extracted (AVE > 0.5) |
|---|---|---|
| Perceived Compatibility (PCM) | 0.91 | 0.74 |
| Perceived Awareness (PA) | 0.87 | 0.73 |
| Self-Efficacy (SE) | 0.86 | 0.70 |
| Perceived Ability to Use (PATU) | 0.92 | 0.77 |
| Multilingual Option (MLO) | 0.79 | 0.68 |
| Perceived Information Quality (PIQ) | 0.92 | 0.75 |
| Availability of Resources (AVR) | 0.89 | 0.72 |
| Perceived Functional Benefit (PFB) | 0.90 | 0.73 |
| Perceived Image (PI) | 0.77 | 0.65 |
| Perceived Trust (PT) | 0.92 | 0.76 |
| Perceived Security (PSE) | 0.86 | 0.71 |
| Perceived Uncertainty (PU) | 0.83 | 0.69 |
| Variables | PCM | PA | SE | PATU | MLO | PIQ | AVR | PFB | PI | PSE | PT | PU |
|---|---|---|---|---|---|---|---|---|---|---|---|---|
| Perceived Compatibility (PCM) | 0.89 | |||||||||||
| Perceived Awareness (PA) | 0.445 | 0.91 | ||||||||||
| Self-Efficacy (SE) | 0.482 | 0.377 | 0.87 | |||||||||
| Perceived Ability to Use (PATU) | 0.473 | 0.560 | 0.439 | 0.82 | ||||||||
| Multilingual Option (MLO) | 0.384 | 0.445 | 0.445 | 0.473 | 0.80 | |||||||
| Perceived Information Quality (PIQ) | 0.566 | 0.408 | 0.482 | 0.408 | 0.377 | 0.90 | ||||||
| Availability of Resources (AVR) | 0.338 | 0.502 | 0.473 | 0.445 | 0.560 | 0.377 | 0.86 | |||||
| Perceived Functional Benefit (PFB) | 0.408 | 0.384 | 0.408 | 0.408 | 0.445 | 0.560 | 0.482 | 0.81 | ||||
| Perceived Image (PI) | 0.502 | 0.566 | 0.502 | 0.502 | 0.482 | 0.473 | 0.473 | 0.502 | 0.88 | |||
| Perceived Security (PSE) | 0.463 | 0.338 | 0.533 | 0.445 | 0.473 | 0.377 | 0.772 | 0.384 | 0.502 | 0.85 | ||
| Perceived Trust (PT) | 0.560 | 0.482 | 0.455 | 0.502 | 0.408 | 0.445 | 0.566 | 0.301 | 0.475 | 0.408 | 0.088 | |
| Perceived Uncertainty (PU) | 0.473 | 0.473 | 0.459 | 0.291 | 0.502 | 0.408 | 0.338 | 0.345 | 0.421 | 0.502 | 0.560 | 0.092 |
| Fit Index | Recommended Values | Adoption Models | ||
|---|---|---|---|---|
| SGA-S | SGA-I | SGA-T | ||
| x2/d.f. | <5.00 | 4.25 | 4.01 | 4.76 |
| GFI | >0.90 | 0.932 | 0.921 | 0.974 |
| AGFI | >0.80 | 0.853 | 0.876 | 0.821 |
| RMSEA | <0.06 | 0.038 | 0.033 | 0.027 |
| SRMR | <0.08 | 0.069 | 0.072 | 0.053 |
| NFI | >0.90 | 0.954 | 0.932 | 0.987 |
| NNFI | >0.90 | 0.932 | 0.941 | 0.972 |
| CFI | >0.90 | 0.973 | 0.923 | 0.979 |
| IFI | >0.90 | 0.961 | 0.911 | 0.977 |
| Factors | Impact of Factors on Smart-Government Service Adoption across the Three Stages | ||
|---|---|---|---|
| Static Stage | Interaction Stage | Transaction Stage | |
| Perceived Compatibility (PCM) | Significant (√) | Significant (√) | Significant (√) |
| Perceived Awareness (PA) | Significant (√) | Significant (√) | Significant (√) |
| Availability of Resources (AOR) | Significant (√) | Not-Significant (×) | Not-Significant (×) |
| Self-Efficacy (SE) | Not-Significant (×) | Significant (√) | Not-Significant (×) |
| Perceived Ability to Use (PATU) | Significant (√) | Significant (√) | Not-Significant (×) |
| Multilingual Option (MLO) | Not-Significant (×) | Not-Significant (×) | Not-Significant (×) |
| Perceived Information Quality (PIQ) | Significant (√) | Significant (√) | Not-Significant (×) |
| Perceived Trust (PT) | Significant (√) | Not-Significant (×) | Significant (√) |
| Perceived Uncertainty (PU) | Not-Significant (×) | Significant (√) | Significant (√) |
| Perceived Security (PS) | Not-Significant (×) | Significant (√) | Significant (√) |
| Perceived Functional Benefit (PFB) | Significant (√) | Significant (√) | Significant (√) |
| Perceived Image (PI) | Not-Significant (×) | Not-Significant (×) | Not-Significant (×) |
| Value of R2 at three stages | R2 = 0.431 | R2 = 0.478 | R2 = 0.593 |
Publisher’s Note: MDPI stays neutral with regard to jurisdictional claims in published maps and institutional affiliations. |
© 2021 by the authors. Licensee MDPI, Basel, Switzerland. This article is an open access article distributed under the terms and conditions of the Creative Commons Attribution (CC BY) license (http://creativecommons.org/licenses/by/4.0/).
Share and Cite
Althunibat, A.; Binsawad, M.; Almaiah, M.A.; Almomani, O.; Alsaaidah, A.; Al-Rahmi, W.; Seliaman, M.E. Sustainable Applications of Smart-Government Services: A Model to Understand Smart-Government Adoption. Sustainability 2021, 13, 3028. https://doi.org/10.3390/su13063028
Althunibat A, Binsawad M, Almaiah MA, Almomani O, Alsaaidah A, Al-Rahmi W, Seliaman ME. Sustainable Applications of Smart-Government Services: A Model to Understand Smart-Government Adoption. Sustainability. 2021; 13(6):3028. https://doi.org/10.3390/su13063028
Chicago/Turabian StyleAlthunibat, Ahmad, Muhammad Binsawad, Mohammed Amin Almaiah, Omar Almomani, Adeeb Alsaaidah, Waleed Al-Rahmi, and Mohamed Elhassan Seliaman. 2021. "Sustainable Applications of Smart-Government Services: A Model to Understand Smart-Government Adoption" Sustainability 13, no. 6: 3028. https://doi.org/10.3390/su13063028