
Digital Storytelling in Cultural Heritage: Audience Engagement in the Interactive Documentary New Life


Faculty of Economic and Political Sciences, School of Journalism and Mass Communications, Aristotle University of Thessaloniki, 54636 Thessaloniki, Greece
*
Author to whom correspondence should be addressed.
Sustainability 2021, 13(3), 1193; https://doi.org/10.3390/su13031193
Submission received: 19 December 2020
/
Revised: 18 January 2021
/
Accepted: 20 January 2021
/
Published: 23 January 2021
(This article belongs to the Special Issue Cultural Heritage Storytelling, Engagement and Management in the Era of Big Data and the Semantic Web)
Abstract
:This paper casts light on cultural heritage storytelling in the context of interactive documentary, a hybrid media genre that employs a full range of multimedia tools to document reality, provide sustainability of the production and successful engagement of the audience. The main research hypotheses are enclosed in the statements: (a) the interactive documentary is considered a valuable tool for the sustainability of cultural heritage and (b) digital approaches to documentary storytelling can provide a sustainable form of viewing during the years. Using the Greek interactive documentary (i-doc) NEW LIFE (2013) as a case study, the users’ engagement is evaluated by analyzing items from a seven-year database of web metrics. Specifically, we explore the adopted ways of the interactive documentary users to engage with the storytelling, the depth to which they were involved along with the most popular sections/traffic sources and finally, the differences between the first launch period and latest years were investigated. We concluded that interactivity affordances of this genre enhance the social dimension of cultural, while the key factors for sustainability are mainly (a) constant promotion with transmedia approach; (b) data-driven evaluation and reform; and (c) a good story that gathers relevant niches, with specific interest to the story.
1. Introduction
Digitization has made a profound impact on the way we manage cultural heritage material, both online and on site. Concurrently, audio and video content transfer made possible the production of the most appealing stories to the audience [1,2,3,4,5]. As the technical resources that are available to the storytellers evolve, the forms of the narratives evolve too. Emerging media technologies, such as hypertexts and multimedia resources are incorporated in the narration adding new concepts and promoting engagement, thus creating new media cultures. In this digital era of streaming media, audiovisual content is consumed more than at any other era ever before [4], while online viewing has not displaced but has rather worked as a compliment to the traditional media viewing [5]. This fact has brought further potential not only for the producers but also for the audience, setting the field for more personalized content addressed to the fragmented online audience. Furthermore, the use of digital techniques introduces (e.g., through either interactive documentary, the application of digital communication techniques, or both) several new opportunities in the cultural heritage field which effectively engage the audience and create an impact.
The position taken in this article is that interactive documentary (i-doc from here on) can be used for sustaining cultural heritage in the new digital era. Documentaries bear a long history in playing an important role in cultural heritage documentation and preservation. As researchers admit every film is a documentary [6], and every documentary is a cultural document [7] that influences and drives cultural response. I-doc, a relatively new genre that converges traditional documentaries and digital media (e.g., social networks, social media and platforms, audiovisual platforms, new media, etc.) can be characterized as one of the most powerful tools to explain reality and present observations of culture and people [8]. The focus is made on the relationship between cultural heritage stories and their audience and the potential growth of engagement though interactive storytelling techniques. Their interactivity affordances enhance the social dimension of cultural projects, since the audiences may not just observe or watch but also engage with the story, which means that they can comment, express different points of view or share in social networks [9].
Given that there is too little audience analysis published on this new genre, our research wants to shed light on issues of engagement and sustainability of digital storytelling in cultural heritage, though a theoretically and empirically rich discussion. This can be useful both for filmmakers and for curators as well as policy makers of cultural heritage, who are interested in increasing the audiences’ engagement through digital storytelling practices. In this paper, we employ as a case study the i-doc NEW LIFE (2013), which is one of the first interactive documentaries created in Greece. The i-doc presents the “new life” that a group of refugees who left ancient Lampsakos (present name Lapseki) in Asia Minor, Turkey, after the Minor Asia Catastrophe occured in their settlement, in New Lampsakos, Greece. The story is enriched with oral history testimonies from residents of both villages in Greece and Turkey, on-field observation and documentation of their intangible cultural practices; while also unseen archive material is included, contributing to the preservation of collective historical memory of the community. In that frame, we examine the engagement of the audiences/users in an interactive documentary in the field of cultural heritage through data derived from the website’s Google analytics (GA) database, drawing upon a large 80-month dataset. To contribute to the scientific discourse on the subject, the following statements enclose the main hypotheses that were initially analyzed by the researchers: (a) the interactive documentary is considered a valuable tool for the sustainability of cultural heritage (H1); and (b) according to literature review, digital, interactive approaches to documentary storytelling can provide a sustainable form of viewing during the years, engaging online viewers of the streaming era (H2). These queries were used as the basis to further develop the objective of this study. The questions which were posed as specific research objectives were decided should serve two goals: (a) to measure the online audiences’ engagement with interactive storytelling, to search for patterns over media usage and to reflect its use in cultural heritage area (RO1); and (b) to examine in practice the existing knowledge and aspirations about interactive documentaries employing empirical ways of understanding provided by web analytics (e.g., GA) (RO2).
In the following sections and initially under the Literature Review section (Section 2), the significance of digital storytelling in cultural heritage is acknowledged, as it is considered a valuable tool in creating repositories of cultural material and specifically in the audiovisual form it may provide vivid representations thus sustaining customs. In the same section, the interactive documentary as a new genre for new-styled audience is presented both conceptually and technically. The web analytics and audience metrics are completing this part of the paper by defining the terms employed and underlining their importance as tools used to provide useful insights for the online presence. Subsequently, the research methodology is justified in the Materials and Methods section (Section 3) where the quantitative analysis employed in the research with data derived through web analytics from the website’s GA dashboard is thoroughly described. In addition, the Greek i-doc NEW LIFE project, which is used as the case study, is introduced step by step following all the procedures engaged during all the phases from the production to the dissemination. Afterwards, the findings of the research are presented and explained in the Results section (Section 4). Next, the findings are justified and explained further (Section 5), while finally the authors’ perceptions on the research are stated, the limitations are referred, and additional studies are suggested (Section 6).
2. Literature Review
2.1. Digital Storytelling in Cultura Heritage
Cultural heritage’s significance in sustaining the evolution of human and maintaining society cohesion is indisputable. Digital storytelling as a form of digital narrative may encompass many alternative ways and tools (i.e., interactive stories, multimedia presentations, web-based games, etc.) in the presentation of a story that nowadays is employed to attract and engage audiences in many areas in a revolutionary way [10], cultural heritage preservation included [11]. Innovative customizable web-based authoring tools and mobile applications are deployed in that field [12,13]. In the situations of tangible cultural heritage where museums or archeological sites are to be presented, many specialties from multidisciplinary fields, such as archeologists, museologists and creative designers (e.g., art directors, sound engineers, etc.) and communicators (e.g., advertisers, public relations professionals, etc.) must co-operate to result in the best narrative that the audiences will comprehend [13]. In some cases interactive elements, such as quizzes may be utilized to offer enhanced experience and further engagement or alternatively possible connections as branching points between the parts that will lead the users meaningfully to the next path [12].
Digital technology is a simple, though valuable, tool to archive and create repositories of cultural elements. Especially in the form of audiovisual narrative, it attempts to vividly perpetuate the customs, representations and artifacts as well as leave testimonies from one generation to another, thus strengthening the community ties; while through the interactive mode of an i-doc it aims at offering rich-media experiences. The cultural diversity of the world, as expressed through traditions and events is in peril by the rapid pace of contemporary life, technological and economic development and globalization [14]. As Lenzerini [15] (p. 103) argues “the cultural variety of humanity is progressively and dangerously tending towards uniformity”, therefore the need for the large and younger public to experience cultural heritage in a new more engaging way in a modernized context is crucial.
The driving force for that engagement would be, along with the narrative tools that present the characters through the plot of the story, which is created over the division into basic units, the perceived authenticity that the i-doc may present. Furthermore, the access that is provided through interactive mechanisms, which younger people (e.g., people of Generation Z) are familiar with and fragmented narrative that complies with the attention span of that cohort [4,5,16,17,18,19,20], may prove to be valuable tools in conveying the story in an entertaining way. Young audiences are accustomed to receiving information by pieces and they do not present patience in watching long videos [21], therefore they must be approached in alternative structures that give them the opportunity to choose how deep they want to get into the story [22].
2.2. Interactive Documentaries: A New Genre for a New-Styled Audience
The i-doc is a relatively new genre that applies to the basic characteristics of the online audience, mentioned above; it involves taking action and making choices in the viewing process, fragmentation and personalization [21,23]. These features emerge from the new media technologies that include hypertext, remediation, modulation, and interactivity and which at the end constitute a combination of cinema and digital technologies [24]. Castells [8] defines interactive documentaries (i-docs from here on) as “interactive online/offline applications, carried out with the intention to represent reality with their own mechanisms, which we will call navigation and interaction modalities, depending on the degree of participation under consideration”. Aston and Gaudenzi [25] have employed a broad definition which does not relate interactive documentaries only to interactive platforms but also recognizes the interactivity as a part of the production process. According to them “any project that starts with the intention to document the real and that uses digital interactive technology to realize this intention can be considered an interactive documentary” [25].
I-docs are stand-alone websites, whose narrative is web-customized. They are not to be confused with cross-media project platforms, where the website serves as an accompanying database and not as the first viewing platform. It is difficult to establish specific categorization since the core of this hybrid genre is a complex and constantly changing way of expression [26]. The categorization based on four different interactivity modes to present the modern landscape of i-docs is considered in this study [25]. The first one is conversational genre, in which docu-games belong, where the viewer has the illusion of being in conversation with the computer. Another one is the experiential mode that creates experiences blurring the virtual and the physical space (i.e., 360° Virtual Reality (VR) or 3D documentaries). Nowadays, one of the most used genres of i-doc employs a hypertext mode of interactivity, where i-doc works similarly with the interactivity logic of DVDs and Blue Ray discs (i.e., “click here, go there”). In this kind of documentary, the viewer moves in any exploratory way in a closed video archive. One other contemporarily highly used genre applies a participative mode where the audience collaborates with the producers, to create an open database, which is constantly evolving. The users are asked to contribute with footage, answer questions or provide help, such as translation. This is the kind of documentary that in the early days of the genre was named “database documentary” [27,28].
The last years, shifts have occurred in the characteristics of the new audience. Technological affordances of new media have highlighted and created new modes of viewing. There has been a switch from passive audience to active media users, who are looking for content that they are interested in, creating many fragmented and autonomous niches [29]. Modern audience studies employ the term “media user”, an individualistic term, opposed to the collective term “audience” [30]. The change does not only involve the end-user; important changes to the distribution, exhibition and promotion of media content have arisen as well [17,31,32]. Online users discover their content through platform algorithms [33] or through their personal bubble in social networks [5,16,18]. Moreover, audience activity cannot be questioned since it is now exposed [34] through web analytics. In the new era, the screen is not only considered as a medium of projecting reality, as “another window to the world”, but also serves as an interactive surface, in which the viewer is also a user (aka “viewser”). The convergent new media does not project a “singular text” on the screens [35] and, furthermore, at the other end of the communicational channel there is not a homogenous audience but different users who have different engagement experiences with the projected content.
Nowadays, i-docs exploit the new digital technologies and present stories that document reality either in linear or nonlinear participatory ways [21]. Therefore, the result is a collaborative project, where the outcome arises from the contribution of the creator, the medium and the user. The kind of interactivity is varied for each i-doc, depending on the platform affordances, the templates’ designs or the producers’ choices. However, the significant element that every i-doc requires is the physical action from viewers, asking them to have an energetic role in order to “watch” the story [36]. The concept of choice is a fundamental key for audience engagement. As far as i-doc is concerned, selections are given to the audience, providing them the opportunity to be in control of the narration which is no longer guided by the producers. Audiences can choose what they want to watch, along with the ability to determine the time and place to do it [37].
The development of an engaged audience which will not get distracted and abandon the viewing is also one of the biggest challenges for i-docs. The proliferation of content on the Web has led to an easily distracted audience and producers fight for its attention. Long-form stories lose popularity compared to shorter videos which deliver bits of information that can be rapidly consumed. Especially, regarding younger generations this can prove to be a real problem; Generation Z has only 8 s of attention span and as years go by it gets even shorter [38]. Nevertheless, the i-doc demands the user’s attention and engagement in order for the story to be unfolded. The viewer cannot be passive; otherwise, the documentary will never be watched. The audience can drop out at every click since active decisions should be taken at every step. Traditional documentaries do not present such dilemmas since once the decision to enter the cinema hall to watch a linear documentary is made; there is rarely abandonment before the end [21].
Wilson [39] defines interactivity as the ability to act in order to influence the flow of events or to modify their form. The traditional documentary genre may have a low degree of interactivity [39] but the sense of narrative is very strong [40]. On the other hand, i-docs do not present such great narrative efficiency, but they involve the viewer differently in the story: they make him/her “work” in order for the story to be revealed. Depending on the perspective, interactivity may imply diverse actions or features. Regarding the narration, interactivity could be connected to co-authorship and non-linearity, while regarding the audience, engagement and involvement in discussions could be more appropriate. Finally, through the perspective of “users”, interactivity may imply new paths for accessing the content [41].
Although traditional documentaries offer a few interactive components as well (e.g., DVD choices), in the case of interactive documentaries there are more powerful features [8]. However, how much interactivity is needed? Some critical views argue that as the interactivity gets more enhanced, the producer reduces its power to convince, which increases the risk that the viewer will not be engaged by the storyline [42]. Almeida and Alvelos [43] state that the coherence of the narrative is more important than its interactivity. Indeed, the dynamic producer–audience relation is not always clear and its features may not be exploited. This echoes the young audience’s reluctance to use interactive features in data-driven, informative stories [4,23]. The creation of a new author–audience relationship through the fragmentation of the story is not always clear, thus the features of i-doc are in danger of not being fully understood by the user [44].
2.3. Web Analytics and Audience Metrics
The evolution of internet technologies over the past decades has considerably changed the media landscape not only by providing new ways of audience interaction, but also by providing new ways of measuring the audience. Besides, the measurability of digital media has been deemed as one of its greatest benefits in comparison to old media. As online channels of information have become extremely significant nowadays, the interest in monitoring users’ website usage and online activities has intensified [45,46]. In this context, web analytics can help website owners understand how their audience find, consume and interact with online information by providing web metrics that refer to any quantitative and aggregated measure of preferences, passive viewing or consumption of content by internet users [47,48].
In general, the term web analytics can be defined as “the measurement, collection, analysis and reporting of Internet data for the purposes of understanding and optimizing Web usage” [49] according to the formerly known as Web Analytics Association, and from 2012 onwards as Digital Analytics Association. These measurement tools can provide information regarding both the audience exposure and audience behavior such as the number of page views and the most popular pages, new or daily visitors and where they come from, the visit depth and what other links they are clicking, the geographic distribution of visitors, the average visit time on site and plenty of other data. The above can be compared over time providing useful insights for website improvements or decisions about campaign effectiveness [50,51].
Identifying who uses a website and how it is used has been of interest since 1990 when Tim Berners-Lee developed the first web browser [52] and similarly, the use of web analytics dates back to the 1990s when the first tools were developed [53]. Web analytics tools can be differentiated in many ways. Firstly, they can be classified based on their data collection method, either page tagging (e.g., GA) or transaction-web server log file analysis (e.g., AWStats). Secondly, they can be grouped considering the access of their functions. Specifically, such tools can be provided as software as a service (SaaS) through a cloud service provider (CSP) or as software installed in-house. Other ways refer to web site access devices (mobile or non-mobile web analytics) as well as the time lag between data collection and the availability of services (i.e., real-time or not) [54]. Finally, onsite web analytic tools measure the actual visitor traffic arriving on a website, the onsite journey (engagements and interactions) and the website’s performance in general. In contrast, offsite tools can measure the size of a potential website audience, the visibility (share of voice) and the buzz (i.e., comments, sentiment) that is happening on the Internet [51].
Internet technologies together with the field of web analytics are constantly evolving and the range of tools and services available on the market is extensive and diverse [47,48,51,53]. Thus, many organizations employ multiple tools in order to gain useful insights for their online presence. Undeniably, GA is considered globally as the most popular web analytics package and a leading tool for sales, marketing and advertising reasons [50,55,56]. This Google service provides many built-in reports, charts and tables and it is attractive to users because of its free availability, tremendous features and ease of use [56,57]. It is preferred by many professionals or different sectors such as e-commerce, e-tourism, libraries, news industry and media websites [46,58,59,60] in order to measure a web site’s performance, analyze user behaviors and gather technical information. Today, the evolution of the audience should be taken into account seriously in audience measurement and understanding why something is happening on a website constitutes a valuable management skill [50]. The use of web analytics enables owners to see a website from the perspective of its users [61]. In the case of cultural heritage, web analytics—what Manovich would define as cultural analytics—allow us to think of contemporary culture in new ways and helps us to question concepts and methods for studying culture that we take for granted [62].
3. Materials and Methods
This research lies within the field of quantitative research, since it applies a quantitative analysis using data derived through web analytics from the website’s GA dashboard. Based on the objectives of the study, as presented in the introduction section, the research questions are:
RQ1: How did the users of the i-doc NEW LIFE engage with the storytelling according to web metrics and quantitative evaluation?
RQ2: To what depth did the viewers engage with the i-doc and which were the most popular sections/traffic sources?
RQ3: What are the differences between the first period that the i-doc was launched and latest years?
Web analytics are considered the cornerstone of audience evaluation in the new era. Monitoring dashboards is a new way of understanding audience behavior and exploring new viewing and usage practices. In most cases, GA are used to estimate the amount of “exposure” a project received and the extent to which it captured the attention of audiences [63]. However, in general, there is a lack of available empirical data since production companies rarely reveal these data [41]. The raw data were gathered from the behavior, audience and acquisition reports of GA over the course of seven years (from 4 April 2013 to 5 December 2019), before performing our own analysis.
The selection of the metrics was based on the literature [49,64,65,66] and the suitability of the metric to achieve the purpose of the study. More specifically, to understand the way the audience has engaged with the site we used (a) five GA metrics (quantitative variables): (i) page views (the number of pages viewed), (ii) number of sessions (visits), (iii) sessions’ duration (sec), (iv) pages per session and (v) bounce rate; as well as (b) four dimensions (categorical variables): (i) traffic sources, (ii) social networks, (iii) landing pages and (iv) page depth (Table 1). According to Google, a dimension is a descriptive attribute or characteristic of an object that can be given different values [67]. Descriptive statistics were employed for the analysis of data.
Our data are unsampled (GA employs sampling as a calculation method only for big sites with more than 500,000 sessions), based on 100% of the sessions. We depended on standard reports of GA with aggregated data and we avoided user-level and event-level data associated with cookies, user-identifiers (e.g., User-ID) and advertising identifiers (e.g., DoubleClick cookies, Android’s Advertising ID, Apple’s Identifier for Advertisers) because the validity of their processing was a controversial and sensitive subject before General Data Protection Regulation (GDPR) implementation in 2018.
The Case Study of GREEK i-doc NEW LIFE
The NEW LIFE i-doc at Lampsakos.Com was launched in 2013 and was followed, later, by a narrative feature-length version on the same topic. Both interactive and traditional linear version communicates ethnography and recreates immaterial elements, such as historical events, social values, traditions, ceremonies and living expressions, therefore it is associated with intangible cultural heritage which is particularly difficult to preserve [68,69]. Through documenting, an attempt is made to provide a sense of continuity of the NEW LIFE that was established in another place while protecting and retaining the identity of the society that moved and therefore salvage the traces of the past.
This project employs hypertext and participative modes of interactivity [25] to gain user’s engagement with the story. It employs the most used and less interactive form which does not present a story direction, giving viewers the freedom of choosing their own narrative path. Furthermore, 40 short videos through hyperlinks from YouTube (which are unlisted) of maximum duration 5 min, which stand alone as short stories, are included within four larger thematics (galleries). In the comment section of each video the users are able to express their thoughts. Although the story is developed within a pre-arranged set of short videos, viewers are called to discover the story constructing their own storytelling roads. Without specific end or start the viewer holds the choice to explore the videos in their own way. Users may click on keywords and locate relevant content according to what has triggered their interest, such as more pieces of interviews or more videos on the same topic.
The four galleries are organized in chronological order following the milestones of the history of this refugee community:
- Videos of ancient Lampsakos, the everyday life of Greek and Turkish people of the community in the Ottoman period and the gradual social tension before the Asia Minor Catastrophe;
- The Greek’s flee from Asia Minor, the new settlement in Greece, the struggle to build a new life;
- The life of Turkish residents after Greek villagers left, and
- The last gallery includes archive data, online books about the community, credits, news section and call to contribution.
The interactive genre was chosen from the producers, as an experimental effort to reach younger audiences. Furthermore, they dealt with organizing and distributing an extended amount of historical data for the community (photo archives, media archives, testimonials, books, interviews, data, etc.) that constituted of all unseen data or data that have never been available on the Web before. The database-documentary typology [27] was preferred in order to contribute to the collective historical memory, without expressing opinion, letting the viewer form their own interpretation. Of course, this could not be totally avoided, since in every documentary or i-doc, the producers’ opinions are reflected in their choices which are present via editing and structuring of the documentary [21].
The project is built in a way that more than one visit should be included to cover the NEW LIFE story which delves into more than one thematic. Moreover, the 40 videos (as mentioned above) are in total 5 h long and it would have been very difficult for a user to binge watch them all in one visit. Audience engagement is encouraged in several ways: either starting a conversation and expressing a point of view for every issue or contributing by publishing the viewers’ own raw footage or archive material about the history of the community. They can also share each video on their social networks, social media and platforms encouraging discussion with their bubble. The producers asked the viewers to contribute to the story as well, posting their own content, user-generated, or archived data.
One of the major challenges of this i-doc was to be functional for the users. The interactive documentary was an unknown term in Greece at that period, so the structure and presentation of the story was adopted so as to be as familiar as possible for the online user. The selected content management system (CMS) was Wordpress; a free and open-source software. The template of the website was carefully constructed to be user-friendly and quite simple. Particular attention was paid for a full-screen template, in order for the viewers to have the familiar “lean back” experience [21], like watching it on their TV screen. As mentioned above, videos were uploaded to YouTube as unlisted, and then embedded on the website to ensure quick streaming and better user experience. Furthermore, YouTube was chosen because it provided the opportunity to enable settings such as automatic start of the video or recommendations for relevant content within a gallery.
Search engine optimization (SEO) techniques, which are techniques designed to achieve better positioning in the organic (i.e., unpaid) results of search engines [70], were applied to the website so as to be more easily discovered by users. Besides, documentary is an informative genre and according to relevant studies a large percentage of readers get informed through search engines [71,72,73]. Additionally, the website was added to free directories and social media accounts were created following the then suggested techniques [74,75,76]; both were important for the visibility of the site on the Web as part of the promotion [74].
It is worth highlighting that the i-doc itself, was created in a participatory mode, since a crowd-funding campaign was employed to cover the expenses of production. More than 100 people had responded, giving money in order that their cultural heritage be documented. This has changed the typical producer–viewer roles from the beginning, since the funders, as co-authors of the documentary had the privilege to be the first to acquire visibility. A database consisted of 1000 fans had already been formed before the launch of the i-doc. That campaign has helped them to gain visibility since there were already 1100 members in the i-doc Facebook group (members of the group have been reduced over the years, since the account has not been very active) while the promotional trailer for the crowd-funding campaign was watched by 2000 people during the first week. Even before the documentary was launched, a large audience had already been established waiting for it.
Additionally, to support the i-doc an outreach campaign was undertaken online media posts (e.g., through various relevant social media pages and groups) such as digital publications, brochures, leaflets and posters as well as interviews on online media; mainly focused on Greece. The producers also applied campaign methods for traditional documentaries to make it known to generations that do not have easy access to the Internet. For example, presentations of the project at relevant events took place, like the Refugee Memorial Event in Nea Lampsakos (14 September 2012), where audiovisual material was screened. Furthermore, leaflets and posters were distributed in print form as well as press conferences. As a result, following every dissemination event, Facebook group members (mentioned above) as well as the views of the website were increasing gradually.
The linear, feature-length version of the i-doc which was created afterwards also further assisted the reach of the website. After every screening, either on documentary festivals or on TV, visitors reach was increased. The traditional documentary bearing the same name NEW LIFE had a successful route since it has been screened in four festivals, documentary and cultural ones (October 2013 and February 2014, December 2013 and July 2017) and it was aired for two years (2015 and 2016) by the first documentary channel in Greece, the Cosmote History Channel, of the leading Cosmote TV streaming platform, as well. Traditional documentaries’ performances are easily evaluated, typically based on screenings, festivals awards, number of viewers and TV ratings. This does not apply to i-docs, which are always online, they can be watched during several visits and their impact is valued following a different logic [21]. A specific story may have greater impact on small, niche audiences.
4. Results
In order to address the research questions outlined above, the current research focuses on web analytics data that were drawn between April 2013 and December 2019 from the i-doc website. This period includes the launch of the i-doc NEW LIFE and 80 weeks onwards. At this point, we should mention that the i-doc was first uploaded in beta version/format to test its functionality form in April 2013, while at the end of July 2013 it made its debut to the media and people.
Regarding the RQ1 proposed in this study, data revealed that the i-doc had, in total, 12,115 sessions and 40,465 page views in an 80-month period. The bounce rate was 61.03% and the average session duration 03.29 min. On average 3.34 pages per session were viewed. As expected, the peak of the viewership occurred during the first year after the launch of the i-doc with the highest score being in August 2013 with 948 sessions and 5444 page views in one month (Figure 1).
Since the release of the i-doc more people were gradually using the website. The best performance was noticed from July to November of 2013. During these five months almost ⅕ of the total viewership of the seven years (14,541 page views and 2094 sessions) had occurred. Furthermore, during these months, there were sessions with high interest in the content since viewers watched almost five pages per session. Website usage wound down after the first year. As shown in Figure 1, certain peaks were noticed around the dates of the linear documentary screenings. It is worth noticing that the engagement of the audience with the i-doc has remained the same ever since. The page views/session has been stabilized around 3 min, even though the sessions gradually reduced.
In our case, the page views and session metrics provided data on how effective the site content was at keeping viewers on the site and engaged. In the below figure (Figure 2) it is observed that the longer the session duration is, the higher the page views are. We did not take into consideration sessions 0–10 s since most of them came from spam traffic sources. The most common pattern of viewing was sessions that lasted 181–600 s each (3–10 min), followed by sessions that lasted 601–1800 s (10–30 min). In 381 sessions, the viewer’s attention was kept for longer than 1801 s (30 min).
To respond to RQ2, we chose to study the GA’s default dimension of landing pages, page depth, traffic sources in tandem with the above web metrics. These descriptive data are very useful for an interactive documentary that encourages participation and updating, because they indicate the type of content the producers should boost more or the section of the story that could be enriched and improved.
According to data presented in Figure 3 the vast majority of traffic came from search engines (e.g., Google and Yahoo!) as the organic traffic was about 47 percent overall. Furthermore, direct traffic was the second largest source (27 percent of incoming sessions) followed by social networks (mainly from Facebook), as well as referral traffic channels (Figure 3). It is worth noting that the first two rankings remained unchanged each year and the organic traffic was steadily the largest director to the website. The above results are anticipated, considering the significant impact of search engines on distribution and dissemination of online information.
Furthermore, analytics on referral traffic (sessions that came from a link on another site) show that news websites, like lifo.gr and news247.gr where interviews of the producers were posted, are among the eight most popular sources for the i-doc (Figure 3). Viewers that came from these sources have developed a strong engagement pattern. Online readers who visited the website after certain news posts triggered their interest, had long and engaged sessions. Data has also shown that sessions reached from referral source had the minimum bounce rate of all sources (33.33% compared to the highest, 88%, from direct sources). This complies with prior studies which have shown that relevant content is a key factor for a web documentary with high engagement [23]. The story is the main reason for a greater commitment, according to i-doc users [44].
Moreover, web analytics data indicated that out of the 12,115 sessions, a high percentage was generated by social traffic (Table 2). Within the explored date range, the main source of social network traffic was, by far, Facebook (94.32%). This is anticipated because mainly Facebook and consequently Twitter were favored by producers, as the social networks that most i-docs which were launched in these years employed to get in touch with their audiences [77]. Facebook, in particular, was used even before the launch of the documentary. Facebook sessions present 3.5 pages watched on average, which is analogous to the average values of the website (3.34 pages/session). YouTube visitors are few but stand out for the remarkable engagement level: long average session duration and more than 5 pages per session.
As data revealed what kept viewers’ attention the longest was the first page of the website, where an introductory video was shown (Table 3). More specifically, most visitors landed on the homepage of the documentary (5898 sessions). These were the most highly engaged sessions that kept the user’s attention for 280.24 s on average. Furthermore, the second landing page was the gallery “Dive in the Past” (voutia-sto-parelthon) with notably less sessions (395) and the third one was “New Life in New Lampsakos”. All entrance pages were related to the Greek village Lampsakos, which makes sense since the language used in the i-doc was Greek. It is worth noting that the gallery about the Turkish village “New Life in Lapseki” (nea-zoi-sto-lapseki) which contains testimonials in Turkish language with Greek subtitles scored extremely low in bounce rate (only 40%) while it had good engagement rates as far as pages/session and session duration are concerned.
Apart from the three galleries, the list of the top ten landing pages includes seven videos, the ones that have been frequently posted in the i-doc’s Facebook group. The bounce rate in videos was higher than the bounce rate in galleries.
Subsequently, an analysis on the most visited pages of the i-doc was performed. Web analytics exposed the ten most browsed galleries which were all Greek culture related (Table 4).
Likewise, most of the top ten landing pages were included in the top ten listed popular pages (Table 4). The bounce rate was high, even after the introductory video. However, an encouraging outcome was revealed from further analysis; page view metrics demonstrated that the i-doc NEW LIFE had 40,645 page views, of which 29,565 were unique. This means that almost ¼ of the total page views came from returning sessions. These data are in agreement with relevant report of the StoryCode, one of the few related researches that are available. This open-source community has studied web analytics of five relevant web projects which revealed that on average they had 75% new vs. 25% returning visits [78].
Page depth reveals a different dimension of engagement. As we see in Figure 4, most of the sessions held only one level of page depth, which means that the users/viewers watched one video and then left the site. This is the category where the maximum page views belongs as well. Furthermore, 320 sessions were the most engaged ones including more than 20 pages per session. Results of further analysis indicated that 260 of the 320 sessions occurred in the first 40 weeks which drove us to RQ3.
To answer the RQ3 we partitioned the data processing into two periods. The first one starts from the launching of the i-doc on the 5 April 2013 and ends on the 4 August 2016. This was the 40-month period that most of the promoting events took place and the traditional linear documentary had a parallel route as well, giving a boost to the website. After August 2016, the linear documentary had stopped screenings in streaming platform Cosmote TV. The second 40-month period which starts on the 5 August 2016 and lasts until the 5 December 2019 includes the “quiet” period in the documentary’s life where all promoting procedures had ceased but the i–doc was still online. To this scope four GA metrics were used: (a) sessions; (b) page views; (c) session duration and (d) bounce rate (Table 5).
Almost 2/3 of the total sessions in the i-doc took place in the first 40 weeks. Whereas the page views were noticeably reduced in the second period; the users’ behavior remained the same as we can see in the following figures (Figure 5 and Figure 6).
Data in Figure 5 reveal that sessions in the first period were higher than the second but what demonstrated high decrease is the number of pages that were viewed in every session. On the other hand, in Figure 6, it seems that the users who were mostly interested in the content of the i-doc visited the website when it was launched.
Indicative Results
In 2016, Google had to change the way GA operated. Their main goal was to start tracking the same user across different devices (e.g., laptop, smartphone, tablet, etc). Thus, during the second period that was investigated, we had the opportunity to examine two more audience-related variables: (a) precise data for new (first time users) vs. returning users and (b) devices the users preferred. In short, users’ data demonstrated that the desktop is by far the most preferred device for viewing (65.42%), followed by mobile phone (30.02%) and tablet (4.56%). This complies with data of previous studies that documentary as an informative genre favors this type of viewing—not on the move, but more often at home [5,18,23]. Furthermore, the i-doc lacked responsiveness to mobile phones which is another reason for these results. Additionally, it was reported that the session duration was doubled for returning visitors compared to new ones (about 110 s for new visitors and 240 s for returning ones). The percentage of those who return to the site is high: an indication that the advantage of web-docs being available for viewing whenever the user wants is something that the viewers make use of.
5. Discussion
This paper casts light on the audience behavior in an i-doc and the role that this new genre can play on using digitized cultural heritage material. That project which was launched on the Internet seven years ago provided a unique opportunity for evaluating the audience’s behavior from 2013 onwards and look for patterns over media usage.
Regarding the engagement of the viewers with the storytelling (RQ1), our analysis demonstrated in total 12,115 sessions and 40,465 page views in an 80-month period (Figure 1). The bounce rate was 61.03% and the average session duration was 03.29 min. The most engaged sessions lasted more than 30 min whereas the majority of the sessions lasted between 3 and 10 min. On average, 3.34 pages per session were viewed. These data are similar to relevant analysis about other i-docs which is quite satisfying for a local-level production. Although audience data about i-docs are rarely published by production companies, we have collected a few relevant researches that enabled us to get a broader, comparative point of view. Data that was retrieved from an audience research of the Slovenian interactive documentary iOtok [39] showed that the bounce rate for all pages was 53%, with average session duration of 3 min, 47 s, and an average of 1.9 pages viewed per session. Furthermore, according to a statement by a former executive of Canadian media fund (Anaphora), which supports the biggest interactive documentary production worldwide from the National Film Board (NFB) of Canada, the average session lengths are between 2–3 min, whereas the most successful web docs keep the viewer on-line for 10 min. Indeed, the web analytics from the multi-prized interactive documentary “Out of my Window” (also awarded a Digital Emmy in 2011) revealed that most sessions lasted 10–12 min. If the users’ attention was kept for more than 12 min then these sessions could reach up to 45 min duration [79]. Another documentary of ARTE (https://www.arte.tv/en) with global success, Gaza Sderot (2008), had average session duration about 8 min [79]. Using descriptive variables (dimensions) in tandem with web metrics, we explored to what depth the viewers engaged with the i-doc and which were the most popular sections/traffic sources (RQ2) for the given period. Most of the sessions displayed only one level of page depth, which means that they saw one video and then left the site. The main landing page—the entrance to the website—was the homepage, followed by entrance pages all related to Greek village’s history. Of course, this was anticipated since the producers’ target groups were mainly Greek people and the i-doc has not been translated in other languages. What triggered our attention was a gallery that contains testimonials in Turkish language with Greek subtitles that had notably low bounce rate (only 40%) and good engagement rates as far as pages/session and session duration are concerned. These data pointed out that given the high interest, this section of the story could have been enriched and also the i-doc could have expanded its target-group, translating all video stories in the Turkish language. Apparently, the most important factor in determining the kind of storytelling people engage with is the way this triggers their interest. This is in accordance with previous researches which note that the type of storytelling is not as decisive as the story itself [4,16,21,23,44]. Whether it is enhanced with digital techniques (e.g., through Search Engine Optimization SEO, social media, social networks, etc. [20,74]), or not, a good story is the key to the success of each documentary (traditional or not). Its content and relevance to the viewer’s interests emerges as a very significant viewing factor, which is also confirmed by our further analysis on traffic sources. It was noticed that sessions that occurred from media posts referrals were long and engaged and had the lowest bounce rate of all sources (33.33% compared to the highest, 88%, from direct sources). Online readers, who visited the website because certain posts have triggered their interest, had long and engaged sessions, as well.
Sessions that were initiated from the homepage of the documentary were the most highly engaged sessions that kept the user’s attention almost a minute longer than the total average. However, what is interesting here is that the bounce rate was also high. This may indicate the weakness/inability of this i-doc to develop a strong narrative or stimulate the viewers for more page views. Users were landing on a gallery or video, watching its content and then immediately exited from the website, without browsing further for more content. Indeed, the interactive capacities of an i-doc may provide multiple pathways through the story, but risks may be encountered such as the difficulty in understanding a non-standard navigation system, the possibility of losing attention during the navigation or the hazard of no return after visiting an external link [44]. The presence of an explaining button or a recommendation system that would give direction through a narrative path may have decreased the bounce rate, guiding the viewer to discover more. Furthermore, as far as the content is concerned, the presence of a cliffhanger at the end of the story could also have helped to lure the viewer to continue.
A good example is the i-doc Prison Valley of ARTE which had global success and reach about 10,000 viewers per month [79]. Several interactive techniques have been launched to keep the viewers’ attention and avoid the bounce rate [79]. For example, the user could start browsing by logging in through either Facebook or Twitter [74,79]. Later on, the producers send a motivation message to their accounts, encouraging those who did not stay long to reconnect [79]. Furthermore, at the end a question popped up to the viewers “What do you fear most?”, 60% of them answered, engaging with the producer [79].
As far as traffic sources are concerned, web analytics revealed that most of the traffic came mainly from search engines. Furthermore, direct traffic was the second largest source. The predominance of search engines is expected. Today, major search engines are deemed as the most common and trusted tool to retrieve information from the Internet, a primary method used for navigation and one of the most common online activities for hundreds of millions of users worldwide [80,81,82,83]. Studies have shown that internet traffic depends largely on them and therefore, web search is one of the best sources for every website [82,83,84,85]. Given the informative nature of documentary genre, the results are in agreement with prior studies that have shown that a large percentage of readers get informed through search engines [71,72,73]. As reading habits change because of the dynamic nature of the web, many people around the world prefer to access media content or news through channels such as search engines, news aggregators and social media that take on the info mediation process [86]. In this context, the implementation of SEO practices to this newly created website as part of its promotion and mainly digital marketing strategies seemed to be fruitful in order to boost the website’s online presence and drive more traffic to it. The results and traffic analysis affirm the role of SEO in today’s digital media landscape and that it can be applied to different types of websites (a documentary website in this case) for various search purposes [87]. It might be thought that documentary producers cannot ignore the power of web search traffic (mainly Google traffic) and should pay close attention to search engines and SEO when promoting content, especially content developed for the Internet. Given that the media industry has entirely entered the digital age, the effective use of SEO seems to be an important element for attracting more viewers online.
In addition, GA have shown that social media has also been an important source of traffic. Our analysis demonstrated that the sessions from Facebook, which were the most (94.32%), had analogous viewing duration to the website’s average, while the YouTube visitors although they were few had impressive engagement level (long average session duration and more than 5 pages per session). At this point, we should mention that from 2013 until today (2020), the use and social media and social networks themselves have changed in the form as well as the interaction they cause [20], while new technical promotions were created due to constant technological changes [74], and social media optimization (SMO) and social media analytics (SMA) (e.g., Facebook analytics, etc.) now exist [20,74]. All of these are now useful tools for both the promotion and the sustainability of cultural heritage from and through the Internet.
To answer the RQ3 we explored the differences between the first period that the documentary was launched and the latest years. As was expected, the viewership scored less and less as years passed by while the peak was noticed in the first five months (almost ⅕ of the total viewership of the 7 years). The core of engagement appeared in this period since the viewers watched almost five pages per session, quite a bit more than the 3.34 total average. Moreover, 260 of the 320 sessions that lasted more than 45 min occurred in these first 40 weeks.
Accordingly, it seems that digital projects need a transmedia approach, which employs both conventional and interactive online promotional techniques in order to reach the public. Digital technologies along with the Internet perform a significant role in the easy dissemination of the content to a varied audience which can be engaged and therefore create a participatory culture. However, offline activities, such as live events and analogue initiatives contribute highly to the audience’s perception of being emotionally connected as a part of the documentary and experience its immersion [88].
Our findings also throw light on some of the users’ metrics, since, after August 2016, GA’s indicative results of this month and onwards demonstrate that the desktop was the most preferred device for viewing (65.42%). This also gave us the opportunity to have a clearer view about the returning visitors, since the new data from this given period revealed that the percentage of those who returned to the site was high and those who returned viewed twice as much content as the new visitors (about 110 s for new visitors and 240 s for returning ones). This was an encouraging finding which addresses the previous queries about the bounce rate and asserts that the viewing pattern of database-documentary was what the producers were aiming at. It also proves in practice the aspirations of literature that database i-docs encouraged the viewers’ freedom and gives them the choice to come back without feeling that they left halfway through the story or that they need to start again from the beginning. In documentaries with pre-fixed narrative paths this cannot be done. Although the average session duration of NEW LIFE was 3.29 min, the overall viewing engagement was in practice much more, since the returning viewers/users have a long-term viewing pattern, which cannot be compared with that of the traditional documentary.
Based on the relevant literature review, we assumed that the interactive documentary genre is a sustainable digital storytelling form that can be used for documentation of cultural heritage (H1), engaging the new-styled viewers of the streaming era (H2). We conclude that the key factors for a sustainable digital storytelling are (a) constant promotion with transmedia approach; (b) data-driven evaluation and reform and (c) a good story targeted to the right audience.
6. Conclusions
Back in 2013, when the NEW LIFE film was launched, interactive documentaries were still in their infancy. As the latest buzz in documentary production worldwide, they were heralded as the future, with interactivity being the red line that separated traditional from digital storytelling. In Greece, multiplatform media production was gradually gaining attention and terms such as interactive documentary or transmedia projects were evolving as a new vocabulary. Seven years later, the genre of interactive documentary is still considered in flux, employing different technologies and affordances of web platforms. Moreover, the expansion of mobile devices’ use and the proliferation of audiovisual consumption have changed the audience’s practices and preferences. Web analytics helped us not only to test our hypothesis but also to question the assumptions about the strengths and weaknesses of interactive documentary. There were theoretical and practical implications of this study that are discussed in this section.
Our analysis has demonstrated that i-docs engage the online audience in different ways, according to the interactivity modes that they employ. While we agree that the database documentary with hypertextual and participative modes of engagement offers great freedom to the viewer, we acknowledge that this type of database-documentary may not be appropriate when a certain story needs to be told. What is emphasized as an advantage in i-docs literature (the viewers’ choice to take unexpected journeys and discover for themselves the unfolded story) is not always welcome by the audiences. The interactivity might be confusing and we should also bear in mind the viewer’s need for more lean-back, passive viewing patterns. In this case, to ensure that the storytelling power will not be missed, producers have to provide a clear narration path, either pre-fixed or just recommended.
The basis of every documentary is a good story but in the case of i-docs when there is no clear narrative path to follow and no one is guiding them, whether they will continue or not, depends absolutely on their interest in the content. The sustainability of digital storytelling relies heavily on this parameter. Thus, it is very important when we develop digital storytelling to exactly know the audience we are addressing and where to find it. This gives the documentary filmmaker the opportunity to deal in depth with very specialized topics and approach fragmented audiences that mass media fail to allure. The traces the online users leave may provide elements that content creators can make use of to acquire information about their audiences. Thus, targeted stories through engaging content may be produced to reach the relevant audience.
Specifically, producers of interactive documentaries should bear in mind that the documentaries they built need promotion, as much as any website needs. Apart from a new form of storytelling, new forms of promotion should be created also, to find and approach the online audience. The 70 min linear documentary helped the promotion of the online documentary and vice versa. The non-linear documentary arisen after the viewing of the linear version, meaning that people were looking into the web for additional information. An effective approach to engage with more audiences would have been to have offline events, which can enforce the audience building. A transmedia approach also makes economic sense since the product may target and finally attract different audiences in the different forms (e.g., text, verbal, iconic or even narrational structure) and platforms that it is present in; thus, creating different groups of consumers [89,90].
It is our belief that i-docs do have a certain life cycle, although they are constantly available to the viewers on the Web. As the years go by the consumption decreases. It is important, though, to be constantly supported by offsite techniques (e.g., social media advertising, content updates, etc. [20,74,75,76,79]) as well as traditional documentaries, in order to be able to continue being watched. So, the assumption that i-docs have no expiration date is disputed. On the other hand, an i-doc which is incorporated in a larger network with a constantly updated user database (i.e., in a relevant cultural organization’s website or a news site) could overcome this challenge.
To conclude, the success of this documentary genre cannot be measured with traditional standards. Typically, i-docs have a small audience but this does not mean they have less impact. Their success lies on the fact that they gather relevant audiences, with specific interest in the story rather than random, mass audiences. Furthermore, the viewing experience is different since most of the viewers have multiple viewing experiences which means they are engaged more, in a long-term relationship with the story. I-docs can be a useful tool for organizations experimenting with digital storytelling, since it combines several kinds of materials (photos, videos, audio, graphics, etc.) and its interactivity affordances enhance the social dimension of cultural projects. It is also a great way to diffuse this material on younger audiences which are more familiar with digital culture [21,23], increasing their engagement with cultural heritage.
As with every research, this one comes with limitations as well. Beside the large baseline on web metrics we had available, which offered us mainly quantitative and some elements of qualitative data about audience behavior, we lacked knowledge about motivations and gratifications of audiences’ usage. Conclusions made about audiences based on web analytics should be deemed working hypotheses until a more experimental approach can be taken. Besides, Web analytics tools are most helpful when used together with other methods to validate findings and develop interpretations by discovering potentially significant patterns in Internet use.
Extensions of this work could focus on comparing these data with more audience analytics of similar i-docs. We would then have the opportunity to generalize the results and set a group of guidelines, which will be used as a starting point for filmmakers, audience scholars and cultural organizations. Furthermore, more relevant researches, would have given us the opportunity to perform comparative analysis with other i-docs. Future studies may enable us to determine not only who, where and when they see the i-doc, but also to understand how they see it. Finally, future extension of this work could explore web metrics that were not covered by this case study as well as traffic data for longer periods. The change in GA’s calculating system after 2016 did not give us the opportunity to analyze in depth the “user” metric throughout the seven years. Nevertheless, through indicative analysis we obtained promising indicators that can be explored in a secondary analysis with a different time frame.
Author Contributions
Conceptualization, A.P.; methodology, A.P., D.G., C.N. and R.K.; software, D.G., M.M. and R.K.; validation, D.G., C.N. and M.M.; formal analysis, A.P., D.G. and M.M.; investigation, A.P., D.G., C.N. and M.M.; resources, A.P., D.G., C.N. and M.M.; data curation, D.G., M.M. and R.K.; writing—original draft preparation, A.P., D.G. and M.M.; writing—review and editing, A.P., D.G., C.N. and M.M.; visualization, A.P., D.G., M.M. and R.Κ. All authors have read and agreed to the published version of the manuscript.
Funding
This research received no external funding.
Institutional Review Board Statement
Not applicable.
Informed Consent Statement
Informed consent was obtained from all subjects involved in the study.
Data Availability Statement
The data is not publicly accessible since they are derived from or related to the dashboard of the i-doc’s website. Access was provided to the producers in a research and time limited framework.
Acknowledgments
Τhe authors would like to thank the production team of the i-doc and George Kalliris who supervised the project.
Conflicts of Interest
The authors declare no conflict of interest.
References
- Kalinov, K. Transmedia narratives: Definition and social transformations in the consumption of media content in the globalized world. Проблеминапостмодерността 2017, 7, 60–68. [Google Scholar]
- Kotsakis, R.; Dimoulas, C.; Kalliris, G.; Veglis, A. Emotional Prediction and Content Profile Estimation in Evaluating Audiovisual Mediated Communication. Int. J. Monit. Surveill. Technol. Res. (IJMSTR) 2014, 2, 62–80. [Google Scholar] [CrossRef] [Green Version]
- Kalliris, G.; Matsiola, M.; Dimoulas, C.; Veglis, A. Emotional Aspects and Quality of Experience for Multifactor Evaluation of Audiovisual Content. Int. J. Monit. Surveill. Technol. Res. (IJMSTR) 2014, 2, 40–61. [Google Scholar] [CrossRef] [Green Version]
- Podara, A.; Matsiola, M.; Maniou, T.A.; Kalliris, G. News usage patterns of young adults in the era of interactive journalism. Strategy Dev. Rev. 2019, 9, 61–83. [Google Scholar] [CrossRef]
- Podara, A.; Matsiola, M.; Nicolaou, C.; Maniou, T.A.; Kalliris, G. Transformation of television viewing practices in Greece: Generation Z and audiovisual content. J. Digit. Media Policy 2020. [Google Scholar] [CrossRef]
- Nichols, B. Documentary film and the modernist avant-garde. Crit. Inq. 2001, 27, 580–610. [Google Scholar] [CrossRef]
- Galloway, D.; McAlpine, K.B.; Harris, P. From Michael Moore to JFK reloaded: Towards a working model of interactive documentary. J. Media Pract. 2007, 8, 325–339. [Google Scholar] [CrossRef]
- Gifreu-Castells, A. The Interactive Documentary. Definition Proposal and Basic Features of the New Emerging Genre. In Proceedings of the Mcluhan Galaxy Conference on Understanding Media, Today, Barcelona, Spain, 23–25 May 2011; Ciastellardi, M., de Almeida, C.M., Scolari, C.A., Eds.; Collection Sehen, Editorial Universidad Oberta de Catalunya: Barcelna, Spain, 2011; pp. 367–378, ISBN 9788493880217. [Google Scholar]
- Nash, K. What is interactivity for? The social dimension of web-documentary participation. Continuum 2014, 28, 383–395. [Google Scholar] [CrossRef]
- Chatzara, E.; Kotsakis, R.; Tsipas, N.; Vrysis, L.; Dimoulas, C. Machine-Assisted Learning in Highly-Interdisciplinary Media Fields: A Multimedia Guide on Modern Art. Educ. Sci. 2019, 9, 198. [Google Scholar] [CrossRef] [Green Version]
- Psomadaki, O.I.; Dimoulas, C.A.; Kalliris, G.M.; Paschalidis, G. Digital storytelling and audience engagement in cultural heritage management: A collaborative model based on the Digital City of Thessaloniki. J. Cult. Herit. 2019, 36, 12–22. [Google Scholar] [CrossRef]
- Lombardo, V.; Damiano, R. Storytelling on mobile devices for cultural heritage. New Rev. Hypermedia Multimed. 2012, 18, 11–35. [Google Scholar] [CrossRef] [Green Version]
- Vrettakis, E.; Kourtis, V.; Katifori, A.; Karvounis, M.; Lougiakis, C.; Ioannidis, Y. Narralive–Creating and experiencing mobile digital storytelling in cultural heritage. Digit. Appl. Archaeol. Cult. Herit. 2019, 15, e00114. [Google Scholar] [CrossRef] [Green Version]
- Alivizatou, M. Intangible heritage and erasure: Rethinking cultural preservation and contemporary museum practice. Int. J. Cult. Prop. 2011, 18, 37–60. [Google Scholar] [CrossRef] [Green Version]
- Lenzerini, F. Intangible cultural heritage: The living culture of peoples. Eur. J. Int. Law 2011, 22, 101–120. [Google Scholar] [CrossRef]
- Nicolaou, C.; Kalliris, G. Audiovisual Media Communications in Adult Education: The case of Cyprus and Greece of Adults as Adult Learners. Eur. J. Investig. Health Psychol. Educ. 2020, 10, 967–994. [Google Scholar] [CrossRef]
- Nicolaou, C.; Podara, A.; Karypidou, C. Audiovisual media in education and Generation Z: Application of audiovisual media theory in education with an emphasis on radio. In Proceedings of the 6th International Scientific Conference on Communication, Information, Awareness and Education in Late Modernity, Hreaklion, Crete, Greece, 10–12 July 2020. [Google Scholar]
- Podara, A.; Matsiola, M.; Nicolaou, C.; Maniou, T.A.; Kalliris, G. Audiovisual consumption practices in post-crisis Greece: An empirical research approach to Generation Z. In Proceedings of the International Conference on Filmic and Media Narratives of the Crisis: Contemporary Representations, Athens, Greece, 7–8 November 2019. [Google Scholar]
- Matsiola, M.; Spiliopoulos, P.; Kotsakis, R.; Nicolaou, C.; Podara, A. Technology-enhanced learning in audiovisual education: The case of radio journalism course design. Educ. Sci. 2019, 9, 62. [Google Scholar] [CrossRef] [Green Version]
- Nicolaou, C.; Karypidou, C. Generations and Social Media: The case of Cyprus and Greece. In Proceedings of the 7th International Scientific Conference, Hreaklion, Crete, Greece, 9–11 July 2021. (accepted; in press). [Google Scholar]
- Podara, A.; Maniou, T.A.; Kalliris, G. News forms of TV viewing: Web documentary as interactivity tool. In 50 Years Greek TV.; Vamvakas, V., Paschalidis, G., Eds.; Epikentro: Thessaloniki, Greece, 2018; pp. 455–470. ISBN 9789604588435. [Google Scholar]
- Rizvic, S.; Boskovic, D.; Okanovic, V.; Sljivo, S.; Zukic, M. Interactive digital storytelling: Bringing cultural heritage in a classroom. J. Comput. Educ. 2019, 6, 143–166. [Google Scholar] [CrossRef]
- Podara, A.; Matsiola, Μ.; Maniou, T.H.; Kalliris, G. Transformations of television consumption practices: An analysis on documentary viewing among post millennials. Particip. J. Audience Recept. Stud. 2019, 16, 68–87. [Google Scholar]
- Kim, N.; Kim, S. Interactive Documentary on Perspective of New Media. Int. J. Multimed. Ubiquitous Eng. 2014, 9, 117–128. [Google Scholar] [CrossRef]
- Aston, J.; Gaudenzi, S. Interactive documentary: Setting the field. Stud. Doc. Film 2012, 6, 125–139. [Google Scholar] [CrossRef]
- Gifreu-Castells, A. Mapping trends in interactive non-fiction through the lenses of interactive documentary. In International Conference on Interactive Digital Storytelling. ICIDS 2014; Mitchell, A., Fernández-Vara, C., Thue, D., Eds.; Springer: Cham, Switzerland, 2014; Volume 8832, pp. 156–163. ISBN 9783319123363. [Google Scholar] [CrossRef]
- Cohen, H. Database Documentary: From Authorship to Authoring in Remediated/Remixed Documentary. Cult. Unbound: J. Curr. Cult. Res. 2012, 4, 327–346. [Google Scholar] [CrossRef] [Green Version]
- Manovich, L. The Language of New Media; The MIT Press: Cambridge, MA, USA, 2002; ISBN 9780262632553. [Google Scholar]
- Napoli, P.M. Audience evolution and the future of audience research. Int. J. Media Manag. 2012, 14, 79–97. [Google Scholar] [CrossRef]
- Livingstone, S. Active audiences? The debate progresses but is far from resolved. Commun. Theory 2015, 25, 439–446. [Google Scholar] [CrossRef] [Green Version]
- Matsiola, M.; Dimoulas, C.; Kalliris, G.; Veglis, A. Augmenting user interaction experience through embedded multimodal media agents in social networks. In Social Media and the Transformation of Interaction in Society; Sahlin, P.J., Ed.; Idea Group Publishing: Hershey, PA, USA, 2015; pp. 188–209. [Google Scholar]
- Nicolaou, C.; Matsiola, M.; Kalliris, G. Technology-Enhanced Learning and Teaching Methodologies through Audiovisual Media. Educ. Sci. 2019, 9, 196. [Google Scholar] [CrossRef] [Green Version]
- Podara, A.; Matsiola, M.; Kotsakis, R.; Maniou, T.A..; Kalliris, G. Generation Z’s screen culture: Understanding younger users’ behaviour in the television streaming age–The case of post-crisis Greece. Crit. Stud. Telev. 2021. (under review). [Google Scholar]
- Livingstone, S. The Challenge of Changing Audiences: Or, what is the Audience Researcher to Do in the Age of the Internet? Eur. J. Commun. 2004, 19, 75–86. [Google Scholar] [CrossRef] [Green Version]
- Livingstone, S. The participation paradigm in audience research. Commun. Rev. 2013, 16, 21–30. [Google Scholar] [CrossRef] [Green Version]
- Gaudenzi, S. The Living Documentary: From Representing Reality to Co-creating Reality in Digital Interactive Documentary. Unpublished Doctoral Thesis, Goldsmiths, University of London, London, UK, 2013. Available online: http://research.gold.ac.uk/7997/ (accessed on 6 December 2020).
- Booth, P. Intermediality in Film and Internet: Donnie Darko and Issues of Narrative Substantiality. J. Narrat. Theory 2008, 38, 398–415. [Google Scholar] [CrossRef]
- Gausby, A. Attention Spans: Consumer Insights. Microsoft Canada: Canada, 2015. Available online: https://dl.motamem.org/microsoft-attention-spans-research-report.pdf (accessed on 6 December 2020).
- Wilson, S. The Athetics and Practice of Designing Interactive Computer Events. 1993. Available online: http://userwww.sfsu.edu/swilson/papers/interactive2.html (accessed on 6 December 2020).
- Ursu, M.F.; Zsombori, V.; Wyver, J.; Conrad, L.; Kegel, I.C.; Williams, D.L. Interactive documentaries: A Golden Age. Comput. Entertain. 2009, 7. [Google Scholar] [CrossRef]
- Ducasse, J.; Kljun, M.; Pucihar, K.Č. Interactive Web Documentaries: A Case Study of Audience Reception and User Engagement on iOtok. Int. J. Hum. Comput. Interact. 2020, 36, 1558–1584. [Google Scholar] [CrossRef]
- Forceville, C. Interactive documentary and its limited opportunities to persuade. Discourse Context Media 2017, 20, 218–226. [Google Scholar] [CrossRef]
- Almeida, A.; Alvelos, H. An interactive documentary manifesto. In Joint International Conference on Interactive Digital Storytelling; Springer: Berlin/Heidelberg, Germany, 2010; pp. 123–128. [Google Scholar]
- Vázquez-Herrero, J.; López-García, X. When media allow the user to interact, play and share: Recent perspectives on interactive documentary. New Rev. Hypermedia Multimed. 2019, 25, 245–267. [Google Scholar] [CrossRef]
- Hausmann, V.; Williams, S.; Schubert, P. Developing a Framework for Web Analytics. In Proceedings of the 25th Bled eConference eDependability: Reliable and Trustworthy eStructures, eProcesses, eOperations and eServices for the Future, Bled, Slovenia, 17–20 June 2012; Paper 11. pp. 127–140. Available online: https://aisel.aisnet.org/bled2012/11 (accessed on 6 December 2020).
- Giomelakis, D.; Sidiropoulos, E.; Gilou, S.; Veglis, A. The utilization of web analytics in online Greek journalism. J. Stud. 2019, 20, 609–630. [Google Scholar] [CrossRef]
- Krall, J. Using Social Metrics to Evaluate the Impact of Online Healthcare Communications. J. Commun. Healthc. 2009, 2, 387–394. [Google Scholar] [CrossRef]
- Zamith, R. Quantified Audiences in News Production: A synthesis and research agenda. Digit. J. 2018, 6, 418–435. [Google Scholar] [CrossRef]
- Web Analytics Association. Web Analytics Definitions. Web Analytics Association: Wakefield, MA, USA, 2008. Available online: https://www.slideshare.net/leonaressi/waa-web-analytics-definitions (accessed on 6 December 2020).
- Kent, M.L.; Carr, B.J.; Husted, R.A.; Pop, R.A. Learning Web Analytics: A Tool for Strategic Communication. Public Relat. Rev. 2011, 37, 536–543. [Google Scholar] [CrossRef]
- Clifton, B. Advanced Web Metrics with Google Analytics, 3rd ed.; John Wiley & Sons: Indianapolis, IN, USA, 2012; ISBN 9781118168448. [Google Scholar]
- Berners-Lee, T. Weaving the Web: The Past, Present and Future of the World. Wide Web by Its Inventor; Orion Business Publishing: London, UK, 1999; ISBN 9780752820903. [Google Scholar]
- Chaffey, D.; Patron, M. From web analytics to digital marketing optimization: Increasing the commercial value of digital analytics. J. DirectData Digit. Mark. Pract. 2012, 14, 30–45. [Google Scholar] [CrossRef] [Green Version]
- Nakatani, K.; Ta-Tao, C. A web analytics tool selection method: An analytical hierarchy process approach. Internet Res. 2011, 21, 171–186. [Google Scholar] [CrossRef]
- Stanhope, J.; Frankland, D.; Dickson, M. The Forrester Wave™: Web Analytics, Q4 2011; Forrester Research: Cambridge, MA, USA, 2011; Available online: https://www.forrester.com/report/The+Forrester+Wave+Web+Analytics+Q4+2011/-/E-RES59453 (accessed on 6 December 2020).
- Marek, K. Chapter 1: Web Analytics Overview. Libr. Technol. Rep. 2011, 47, 5–10. Available online: https://journals.ala.org/index.php/ltr/article/view/4233/4827 (accessed on 6 December 2020).
- Fang, W. Using Google Analytics for Improving Library Website Content and Design: A Case Study. Libr. Philos. Pract. 2007, 9, 1–17. [Google Scholar] [CrossRef]
- Hasan, L.; Morris, A.; Probets, S. Using Google Analytics to Evaluate the Usability of E-Commerce Sites. In Human Centered Design. HCD 2009. Lecture Notes in Computer Science; Kurosu, M., Ed.; Springer: Berlin/Heidelberg, Germany, 2009; Volume 5619, ISBN 9783642028052. [Google Scholar] [CrossRef] [Green Version]
- Plaza, B. Google Analytics for measuring website performance. Tour. Manag. 2011, 32, 477–481. [Google Scholar] [CrossRef]
- Yang, L.; Perrin, M.J. Tutorials on Google Analytics: How to Craft a Web Analytics Report for a Library Web Site. J. Web Librariansh. 2014, 8, 404–417. [Google Scholar] [CrossRef]
- Spiliopoulou, M. Web Usage Mining for Web Site Evaluation. Commun. ACM 2000, 43, 127–134. [Google Scholar] [CrossRef]
- Manovich, L. Cultural Analytics; The MIT Press: Cambridge, MA, USA, 2020; ISBN 9780262037105. [Google Scholar]
- Flynn, S.P. Evaluating Interactive Documentaries: Audience, Impact and Innovation in Public Interest Media. Unpublished Doctoral Thesis, Massachusetts Institute of Technology, Cambridge, MA, USA, 2015. Available online: http://dspace.mit.edu/handle/1721.1/7582 (accessed on 6 December 2020).
- Turner, S.J. Website Statistics 2.0: Using Google Analytics to Measure Library Website Effectiveness. Tech. Serv. Q. 2010, 27, 261–278. [Google Scholar] [CrossRef]
- Beasley, M. Practical Web Analytics for User Experience: How Analytics Can Help You Understand Your Users; Morgan Kaufmann: Burlington, MA, USA, 2013; ISBN 9780124046191. [Google Scholar]
- Fagan, J.C. The Suitability of Web Analytics Key Performance Indicators in the Academic Library Environment. J. Acad. Librariansh. 2014, 40, 25–34. [Google Scholar] [CrossRef] [Green Version]
- Dimension. Available online: https://support.google.com/analytics/answer/6086074 (accessed on 6 December 2020).
- Dimoulas, C.A.; Kalliris, G.M.; Chatzara, E.G.; Tsipas, N.K.; Papanikolaou, G.V. Audiovisual production, restoration-archiving and content management methods to preserve local tradition and folkloric heritage. J. Cult. Herit. 2014, 15, 234–241. [Google Scholar] [CrossRef]
- Idris, M.Z.; Mustaffa, N.B.; Yusoff, S.O.S. Preservation of intangible cultural heritage using advance digital technology: Issues and challenges. Harmon. J. Arts Res. Educ. 2016, 16, 1–13. [Google Scholar] [CrossRef]
- Giomelakis, D.; Karypidou, C.; Veglis, A. SEO inside Newsrooms: Reports from the Field. Future Internet 2019, 11, 261. [Google Scholar]
- American Press Institute. Available online: http://www.americanpressinstitute.org/publications/reports/surveyresearch/how-americans-get-news/ (accessed on 7 December 2020).
- Newman, N.; Fletcher, R.; Kalogeropoulos, A.; Levy, D.A.L.; Nielsen, R.K. Reuters Institute Digital News Report 2017; Reuters Institute for the Study of Journalism: Oxford, UK, 2017; ISBN 9781907384318. Available online: http://www.digitalnewsreport.org/survey/2017/ (accessed on 7 December 2020).
- Newman, N.; Fletcher, R.; Kalogeropoulos, A.; Levy, D.A.L.; Nielsen, R.K. Reuters Institute Digital News Report 2018; Reuters Institute for the Study of Journalism: Oxford, UK, 2018; ISBN 9781907384486. Available online: http://www.digitalnewsreport.org/survey/2018/ (accessed on 7 December 2020).
- Sarridis, I.; Nicolaou, C. Social media: (Correct) Professional use. In Proceedings of the 2nd Student Conference of the Department of Applied Informatics—University of Macedonia on Modern Entrepreneurship & Informatics Technologies, Thessaloniki, Greece, 2 December 2015. [Google Scholar]
- Nicolaou, C. Public Relations and New Technologies. Unpublished CIPR Professional PR Diploma Thesis, Chartered Institute of Public Relations, London, UK, 2011. [Google Scholar]
- Nicolaou, C.A. Public Relations: Future and New Technologies. Unpublished Bachelor’s Thesis, University of Nicosia, Nicosia, Cyprus, 2011. [Google Scholar]
- Herrero, J.V.; García, X.L. The Use of Social Networks in Interactive Documentary. In New Advances in Information Systems and Technologies. Advances in Intelligent Systems and Computing; Rocha, Á., Correia, A., Adeli, H., Reis, L., Mendonça Teixeira, M., Eds.; Springer: Cham, Switzerland, 2016; Volume 445, pp. 413–420. ISBN 9783319313061. [Google Scholar] [CrossRef]
- Epstein, M.; Knowlton, M. The Promise and Realities of Creating Immersive Media Projects–Best Practices: A StoryCode Report. Filmmaker Magazine. 2015. Available online: https://filmmakermagazine.com/93498-the-promise-and-realities-of-creating-immersive-media-projects-best-practices-a-storycode-report/ (accessed on 6 December 2020).
- Lietaert, M. Webdocs: A Survival Guide for Online Film-Makers; Lulu.com: Morrisville, NA, USA, 2011. [Google Scholar]
- Purcell, K. Search and Email Still Top the List of Most Popular Online Activities. Available online: http://www.pewinternet.org/2011/08/09/search-and-email-still-top-the-list-of-most-popular-online-activities/ (accessed on 7 December 2020).
- Purcell, K.; Brenner, J.; Rainie, L. Search Engine Use 2012. Available online: http://www.pewinternet.org/2012/03/09/search-engine-use-2012/ (accessed on 7 December 2020).
- Murga, G. Amazon Takes 49 Percent of Consumers’ First Product Search, But Search Engines Rebound. Available online: https://www.upwave.com/blog/amazon-takes-49-percent-of-consumers-first-product-search-but-search-engines-rebound/ (accessed on 7 December 2020).
- Schwartz, E. Search Engines Still Dominate over Social Media, even for Millennials: New Research Suggests When Information Gathering Really Matters, Users Turn to Search Engines. Available online: https://searchengineland.com/search-engines-still-dominate-over-social-media-even-for-millennials-308135 (accessed on 7 December 2020).
- Safran, N. Natural Web Site Traffic Accounts for Nearly Half of All Traffic [Data]. Available online: http://www.conductor.com/blog/2013/06/web-traffic-natural-search-data/ (accessed on 7 December 2020).
- Giomelakis, D.; Veglis, A. Investigating Search Engine Optimization Factors in Media Websites: The case of Greece. Digit. J. 2016, 4, 379–400. [Google Scholar] [CrossRef]
- Smyrnaios, N.; Rebillard, F. How infomediation platforms took over the news: A longitudinal perspective. Political Econ. Commun. 2019, 7, 30–50. [Google Scholar]
- Enge, E.; Spencer, S.; Stricchiola, J.C. The Art of SEO: Mastering Search Engine Optimization, 3rd ed.; O’Reilly Media: Sebastopol, CA, USA, 2015; ISBN 9781491948965. [Google Scholar]
- Freeman, M.; Gambarato, R.R. The Routledge Companion to Transmedia Studies; Routledge: Abingdon-on-Thames, UK, 2019; ISBN 9780367580506. [Google Scholar]
- Jenkins, H. Transmedia Storytelling 101. 2007. Available online: http://henryjenkins.org/2007/03/transmedia_storytelling_101.html (accessed on 7 December 2020).
- Scolari, C.A. Transmedia storytelling: Implicit consumers, narrative worlds, and branding in contemporary media production. Int. J. Commun. 2009, 3, 586–606. [Google Scholar]
Figure 1.
Audience engagement for 80 months period (April 2013 to December 2019).

Figure 2.
Page views per session.

Figure 3.
Traffic sources.

Figure 4.
Page depth.

Figure 5.
Comparison between sessions and page views.

Figure 6.
Average session duration in two periods.


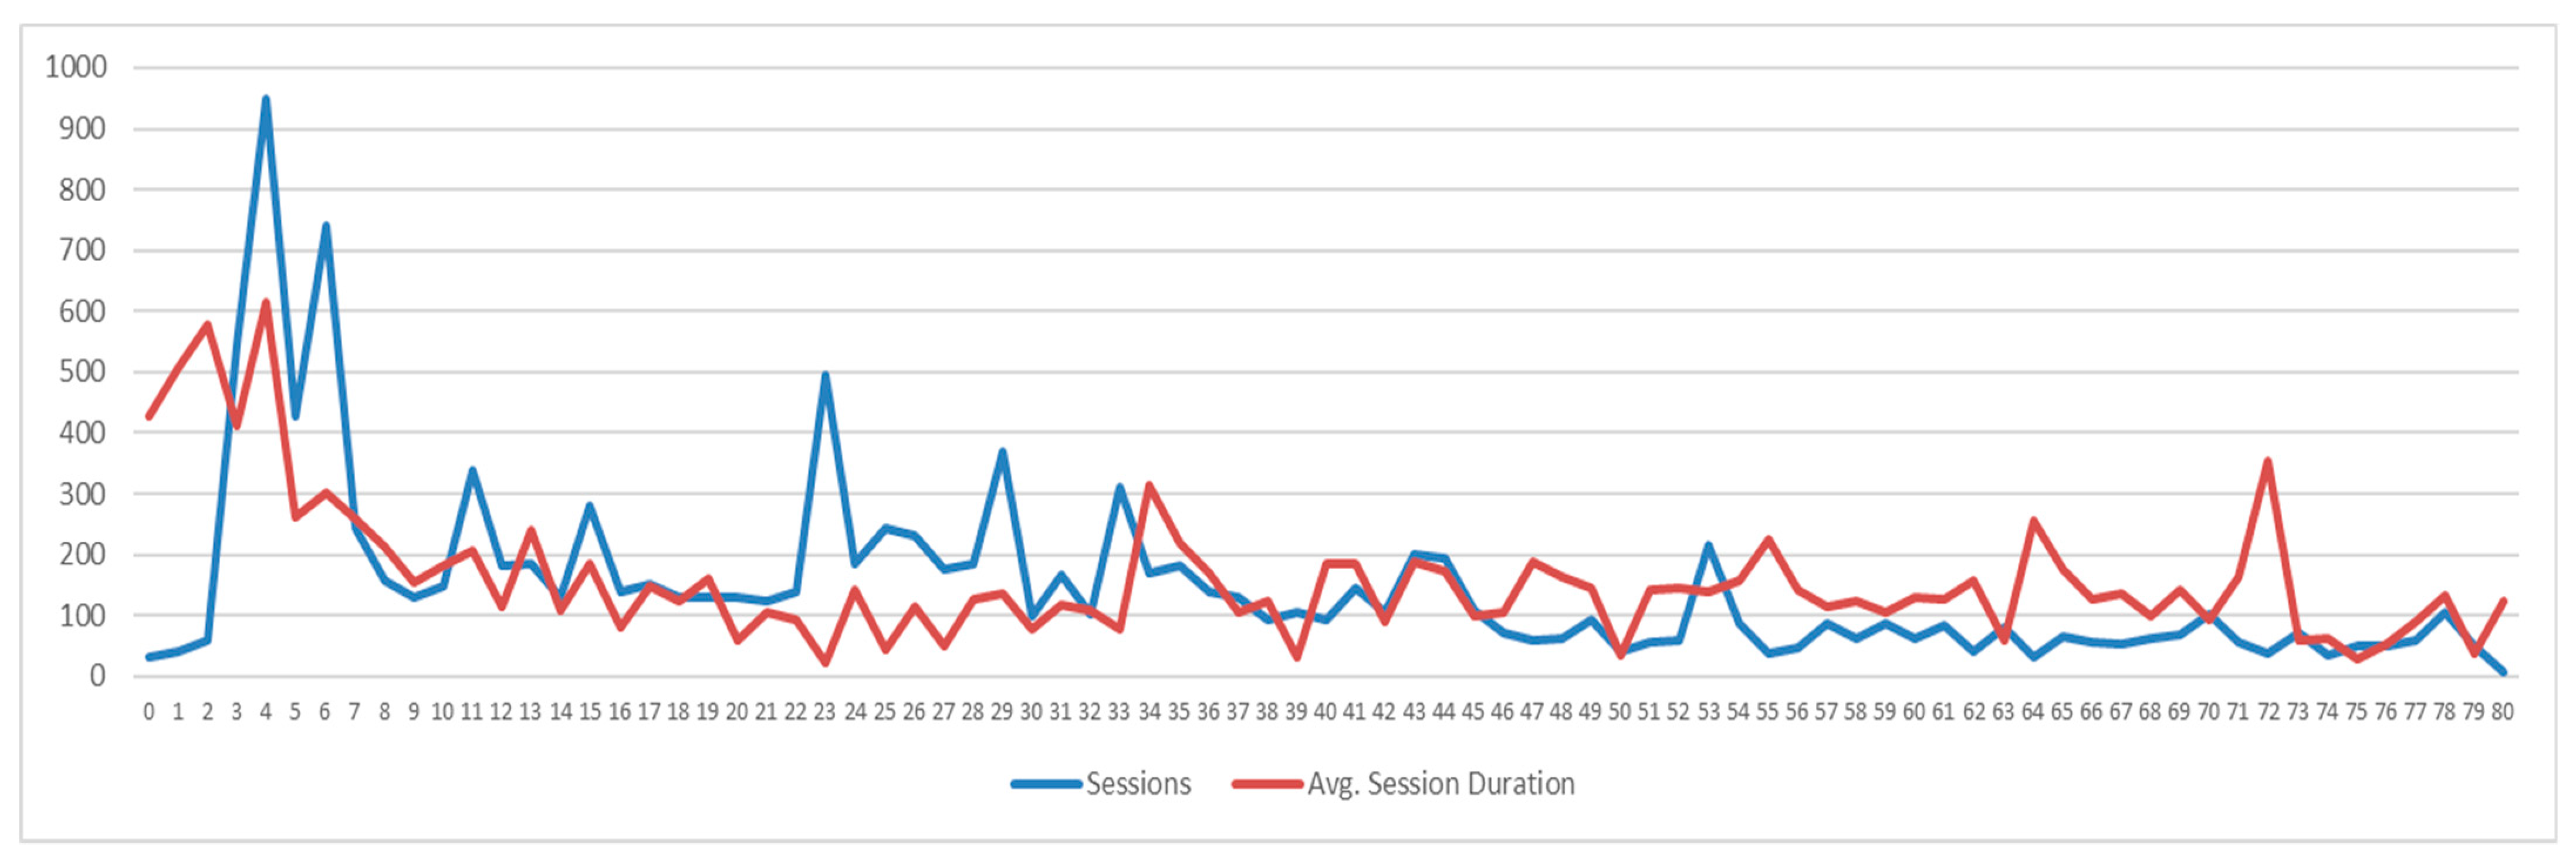
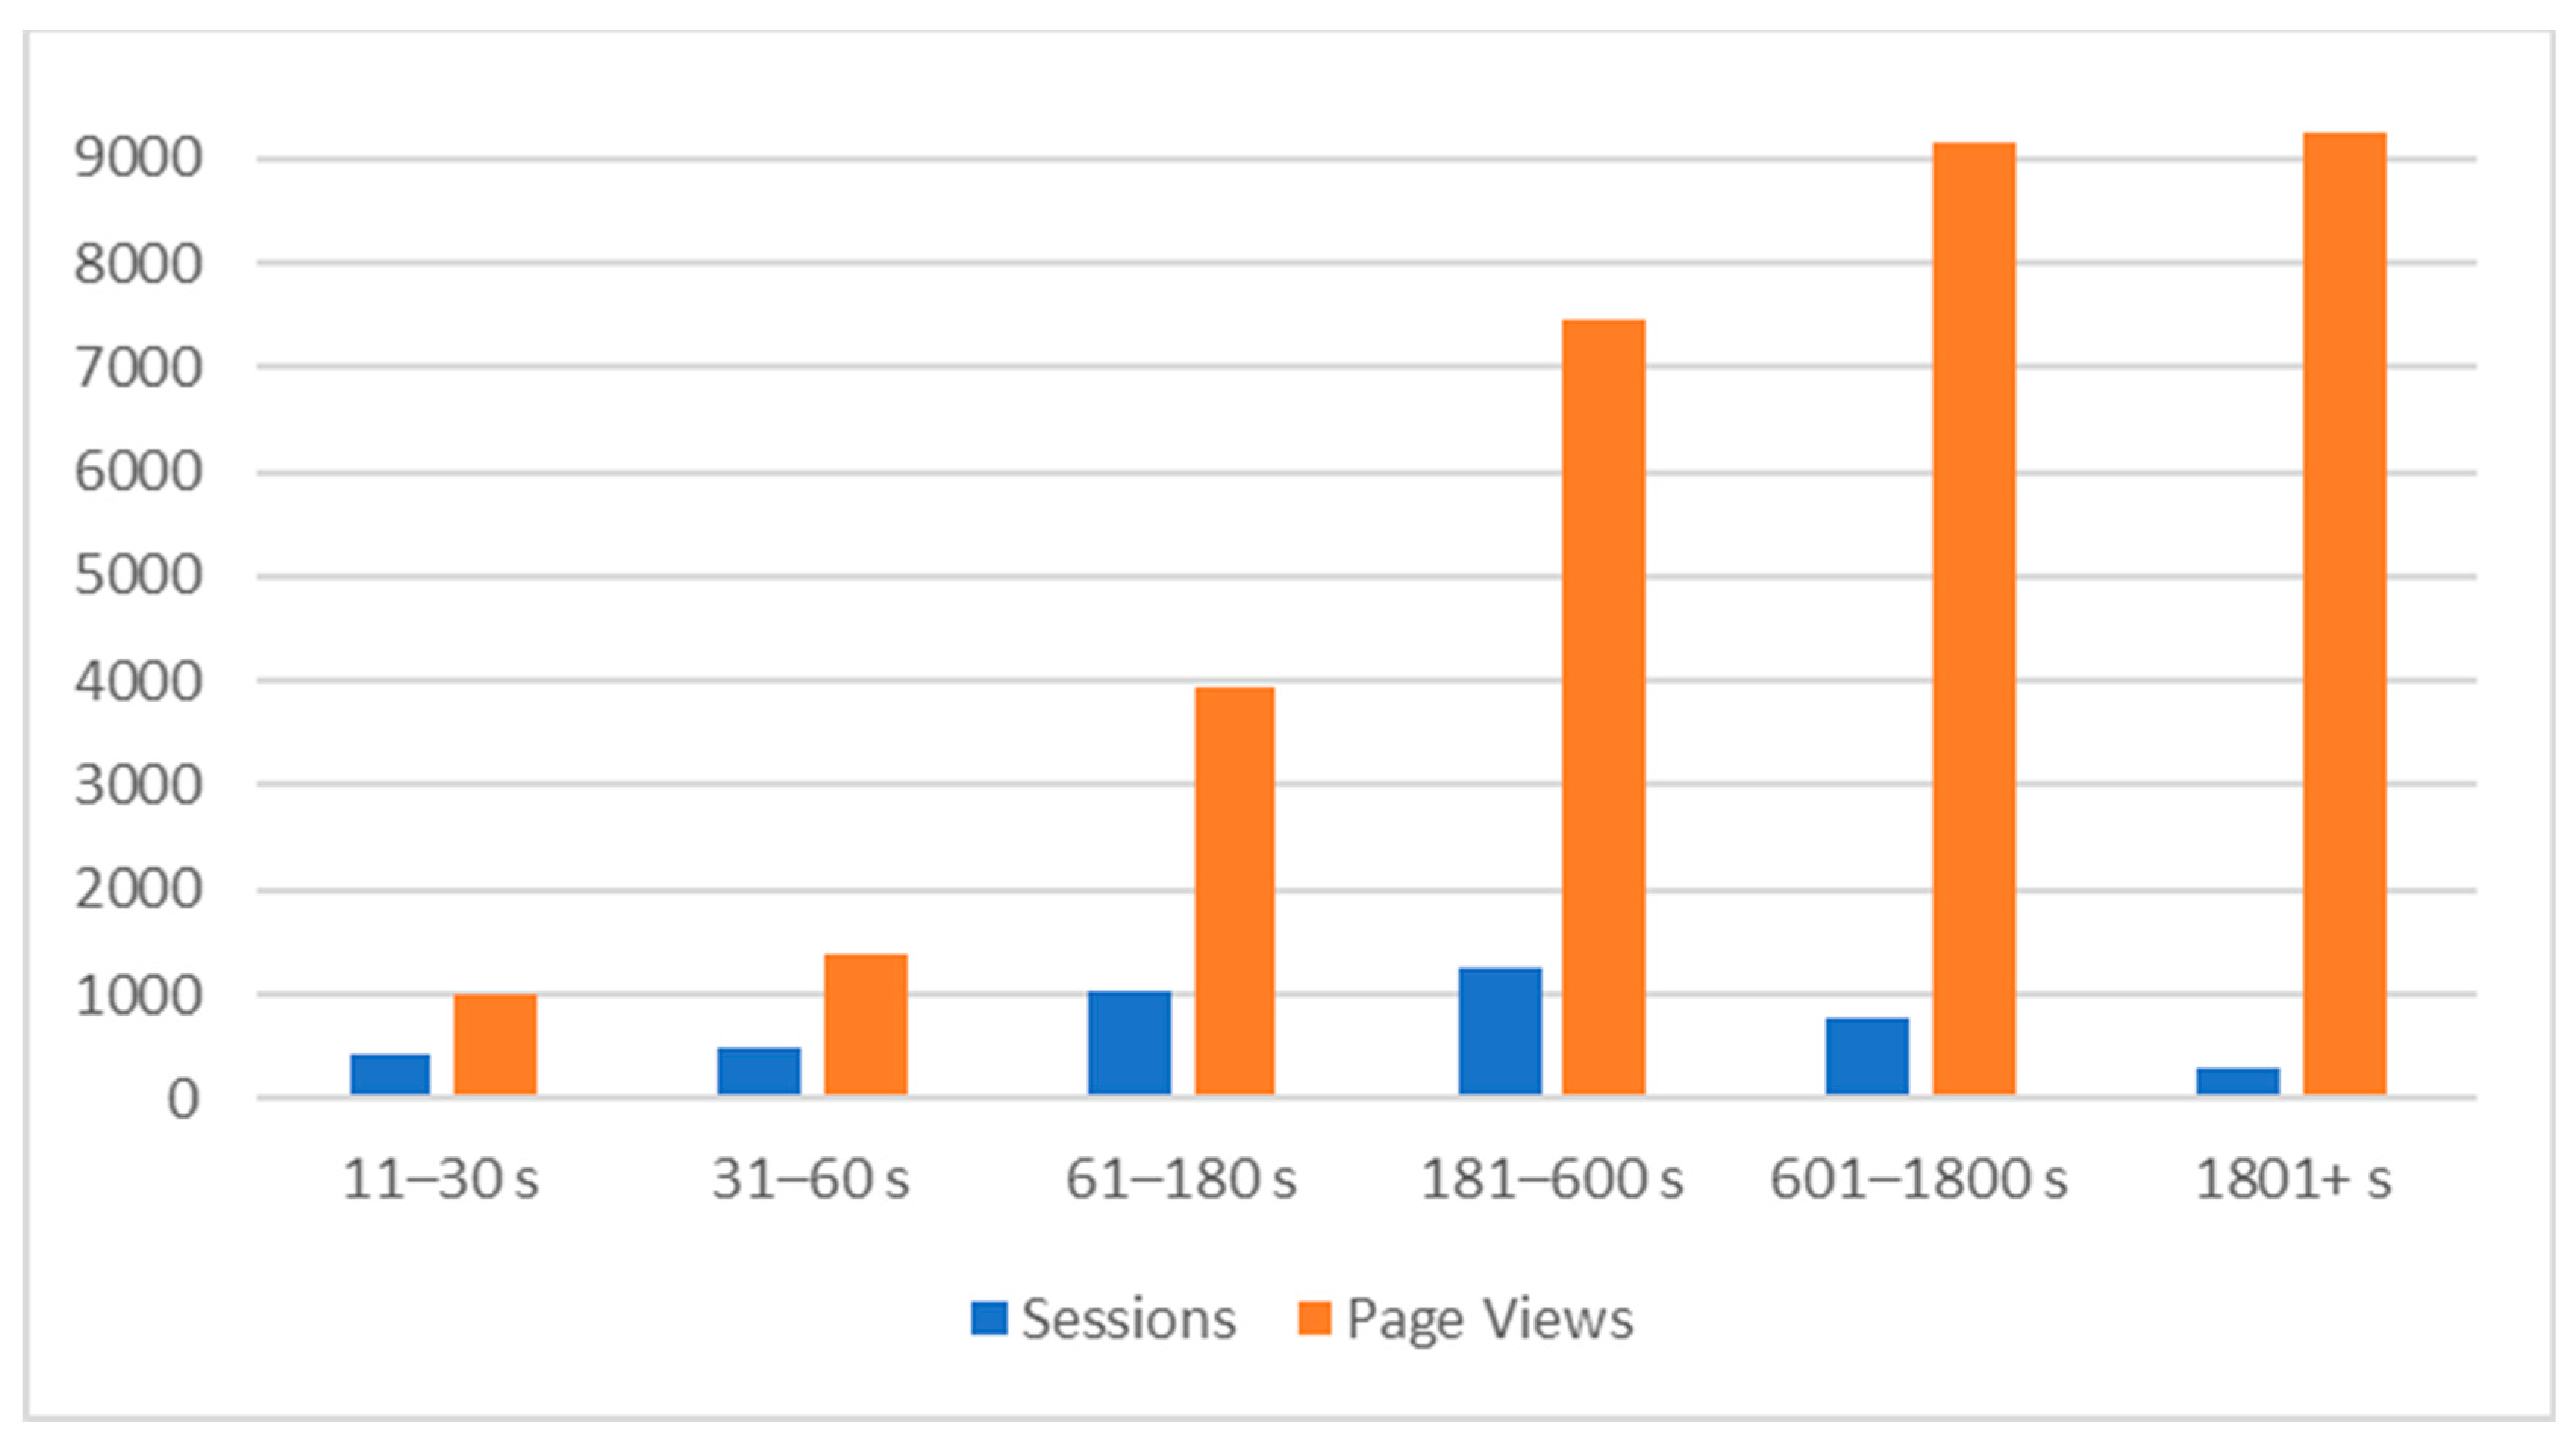
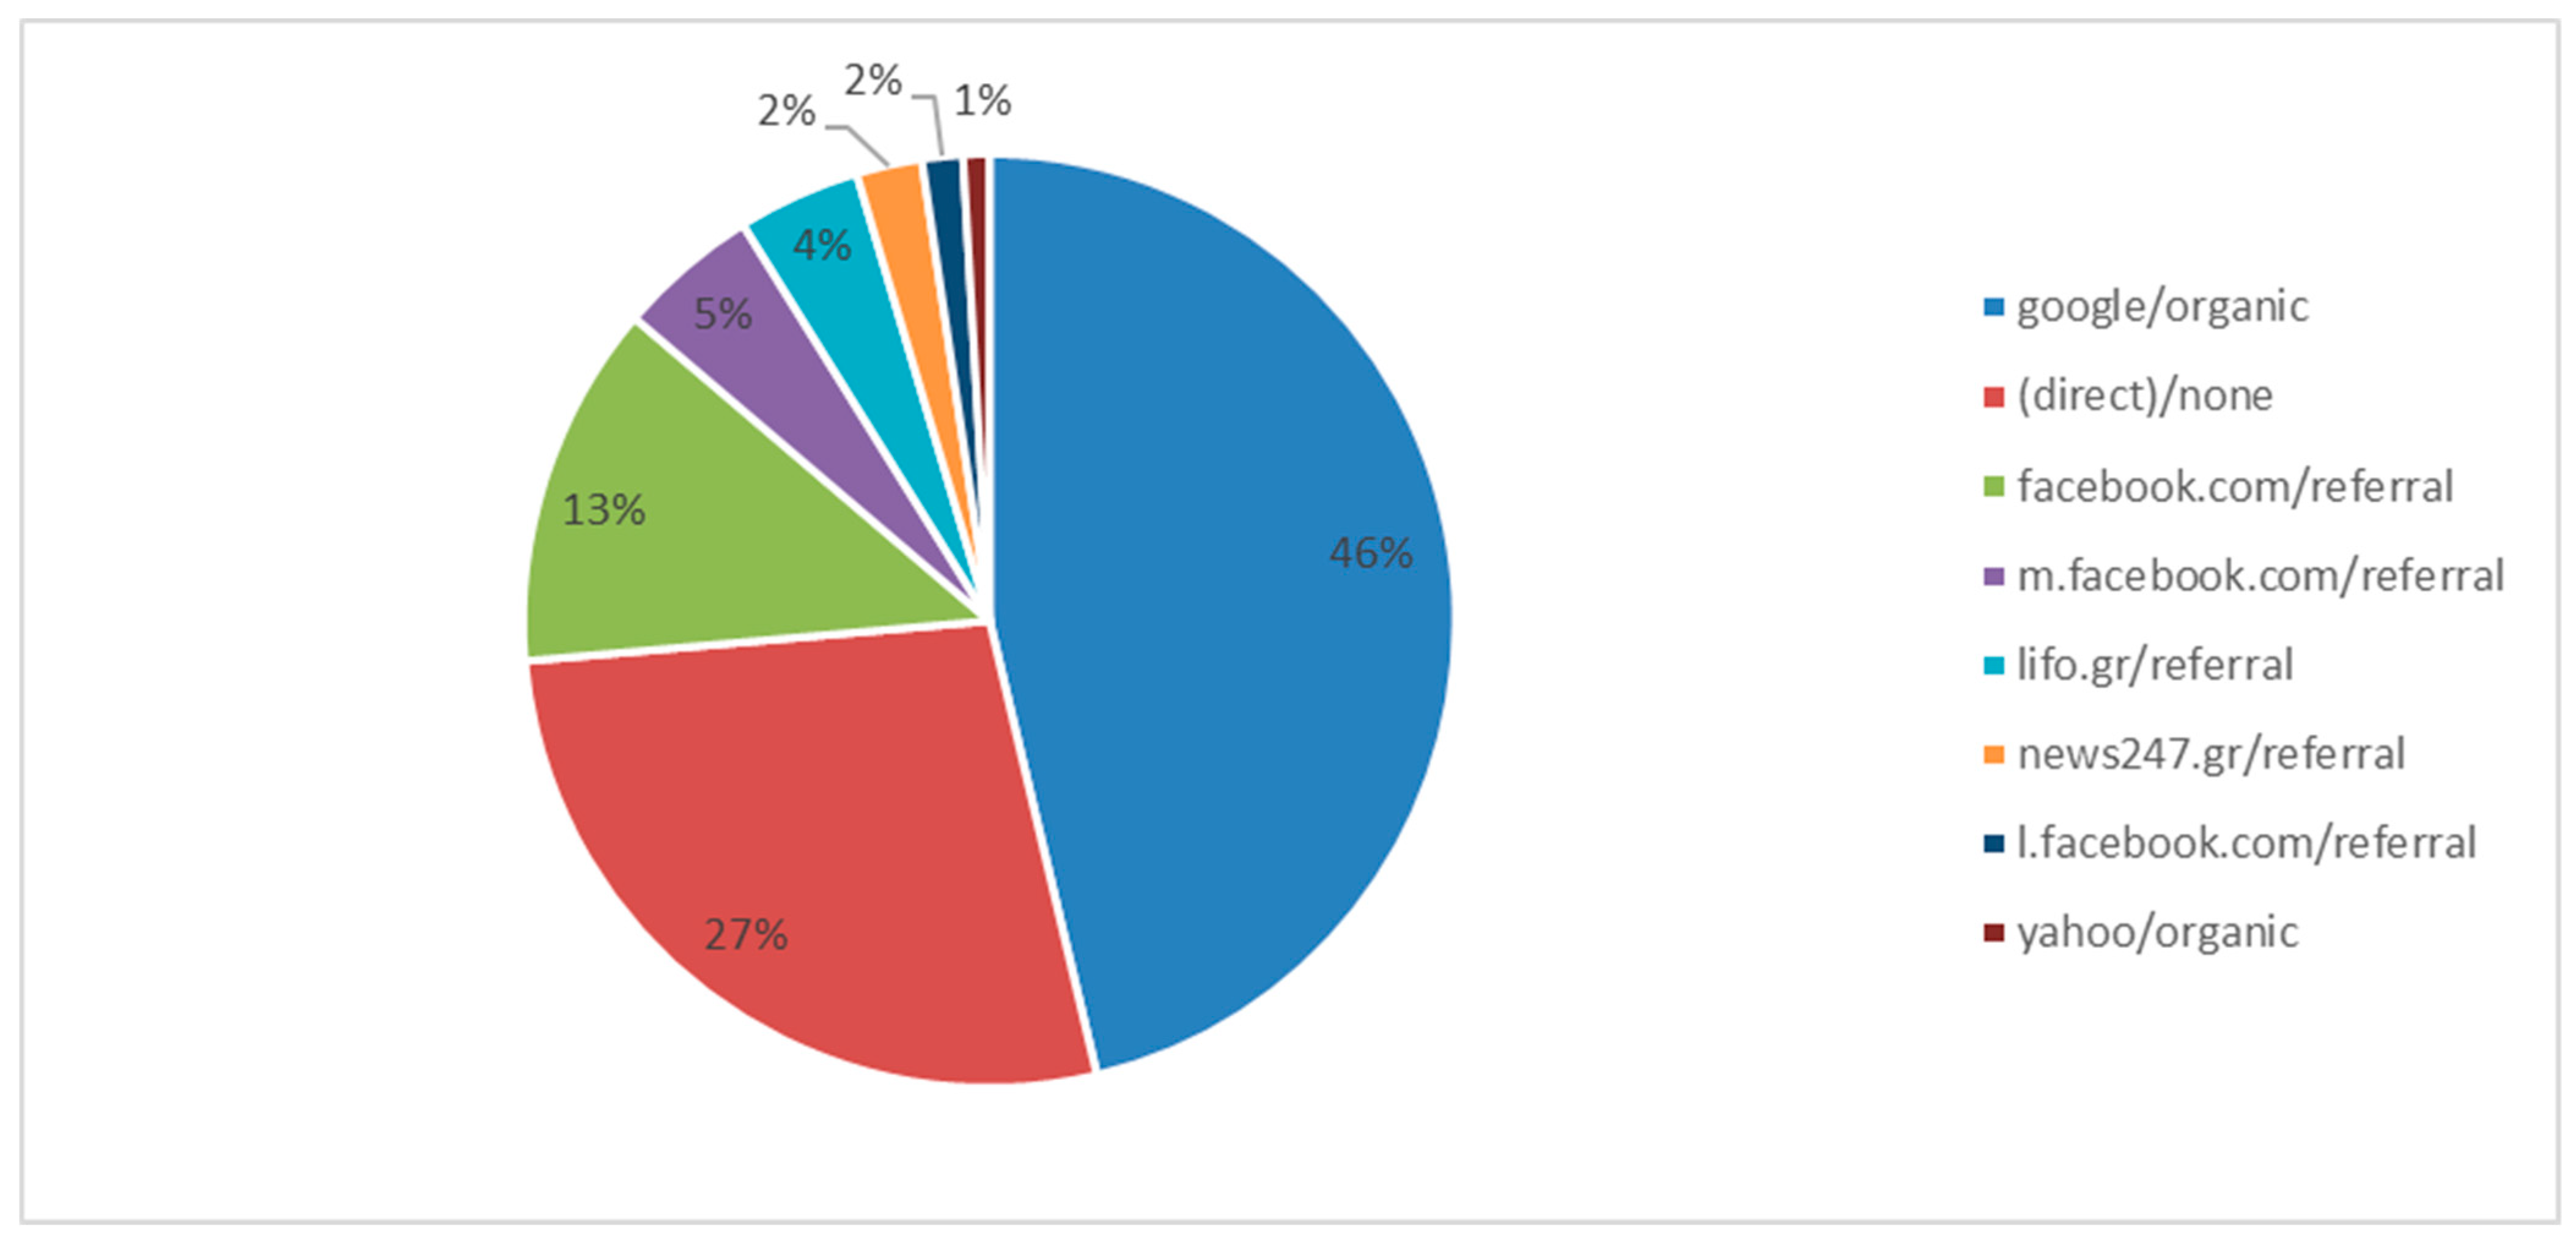
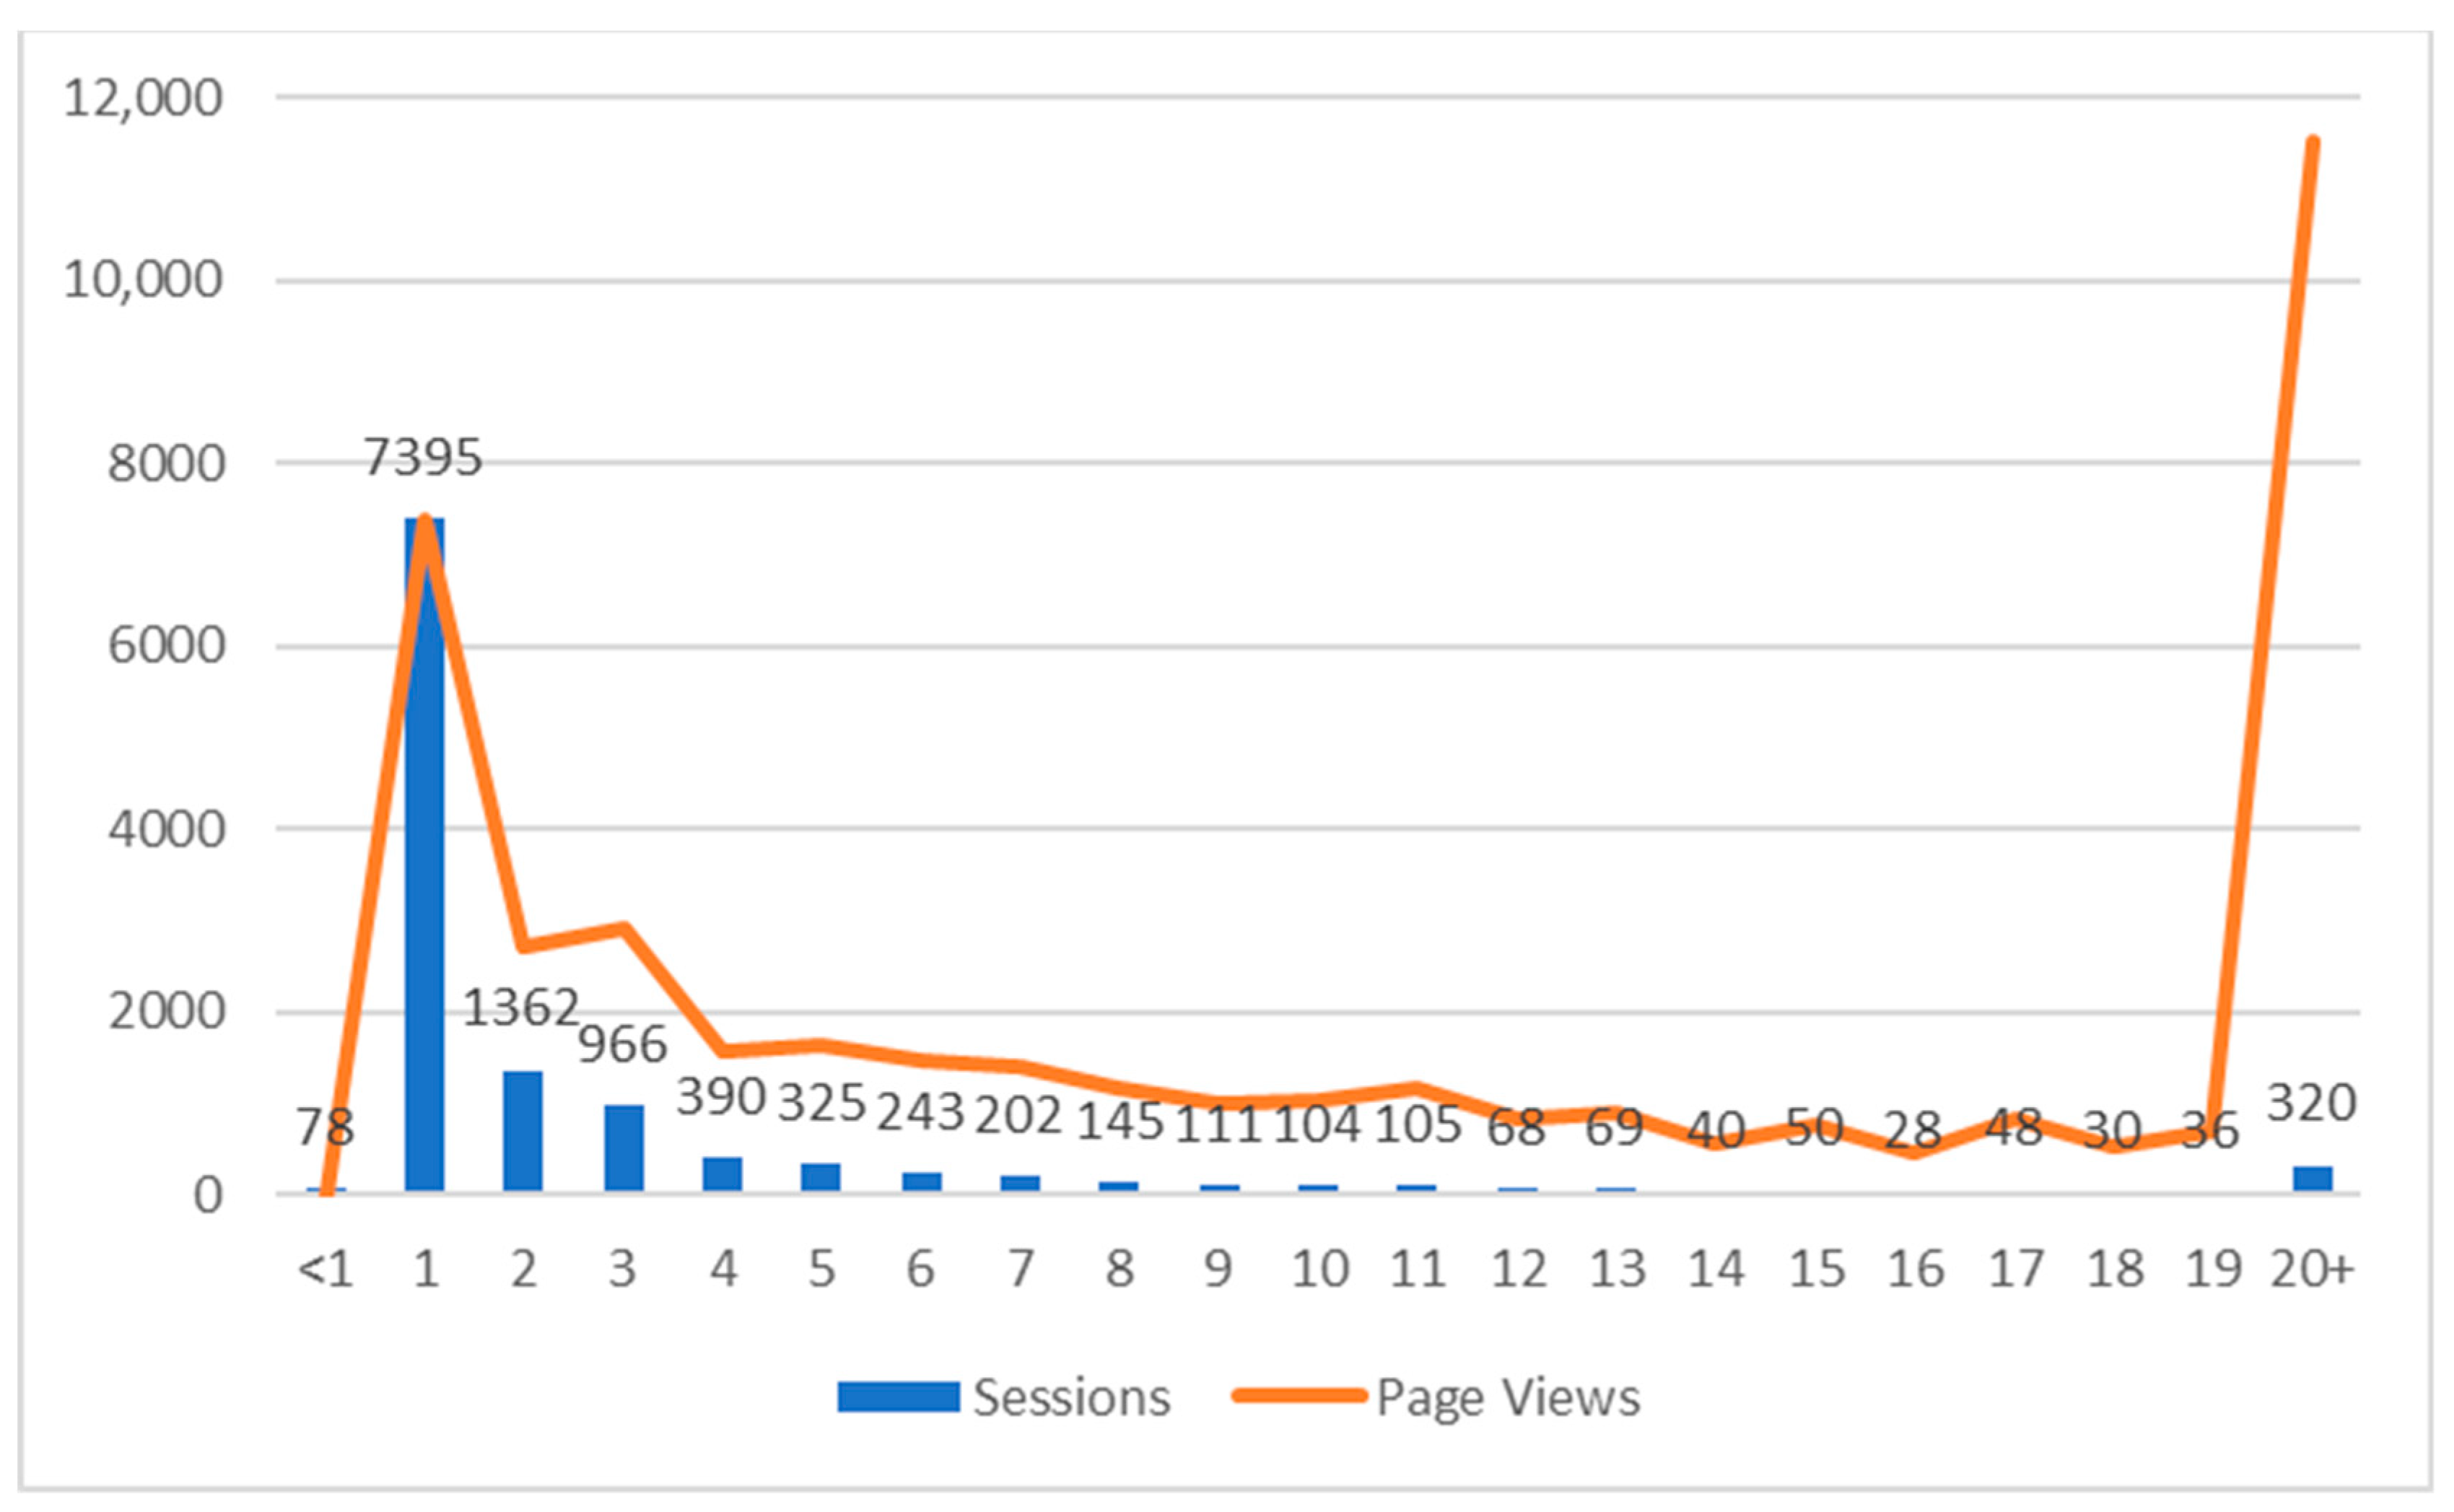
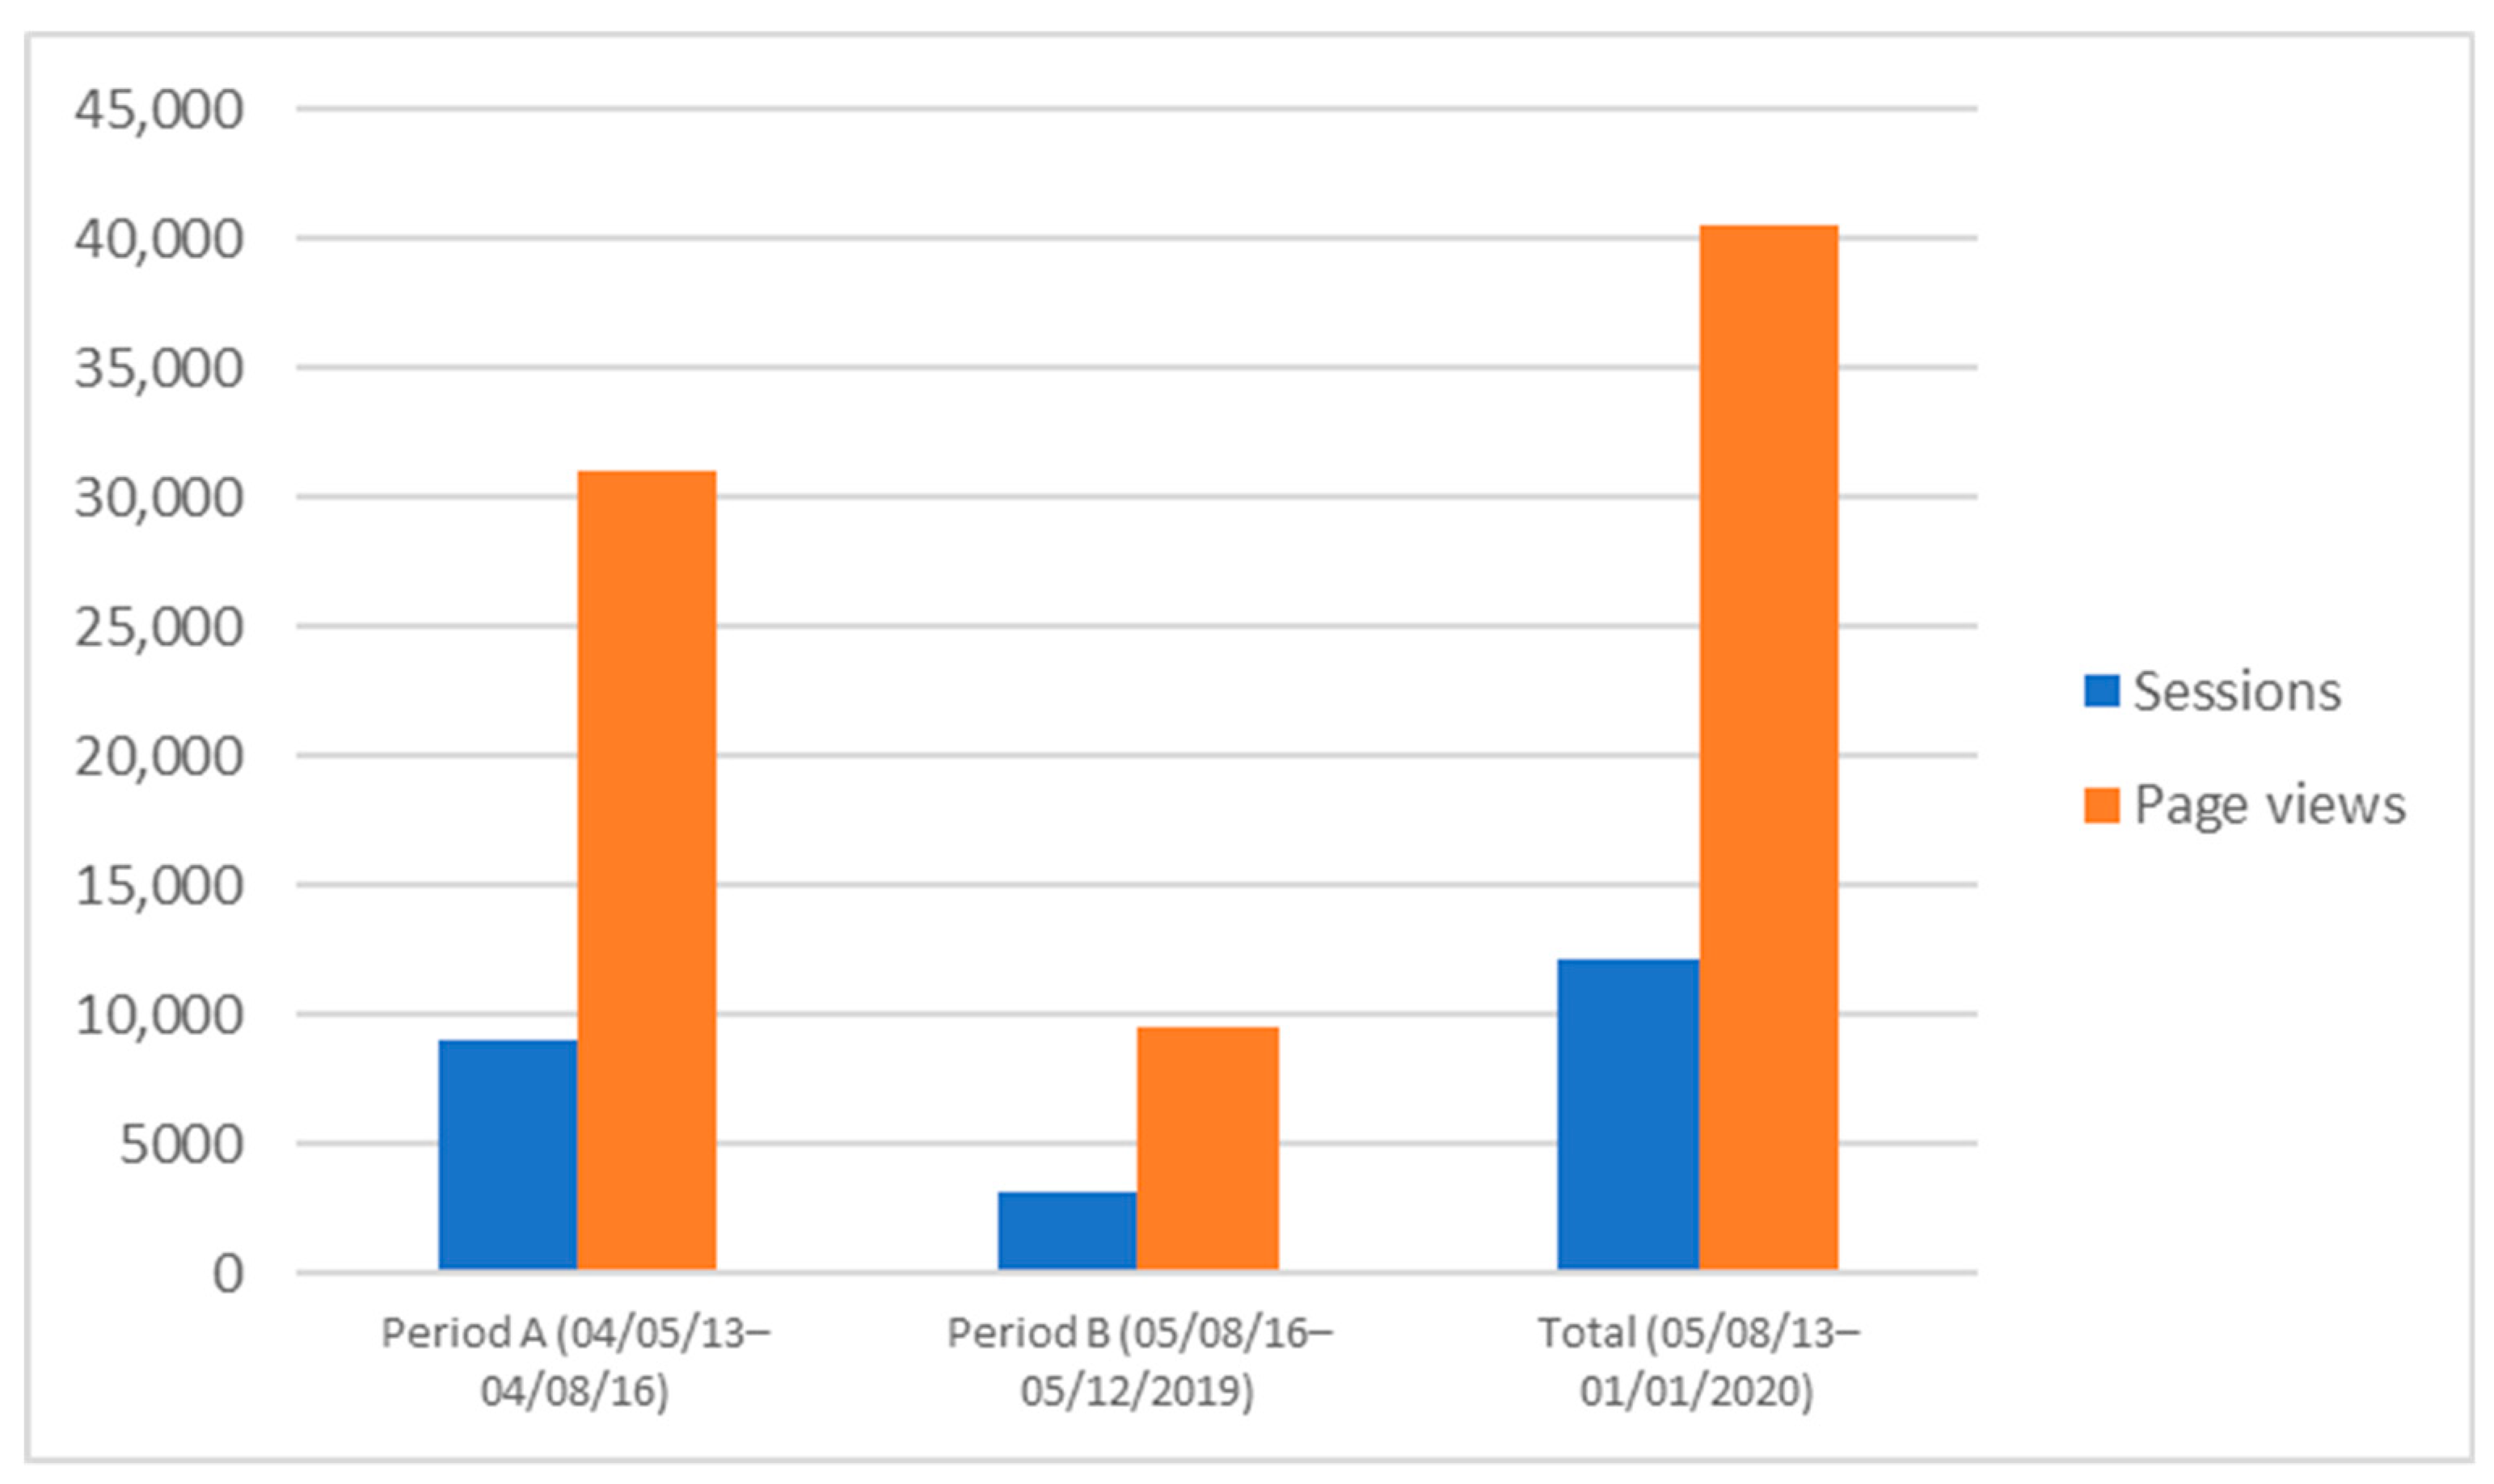
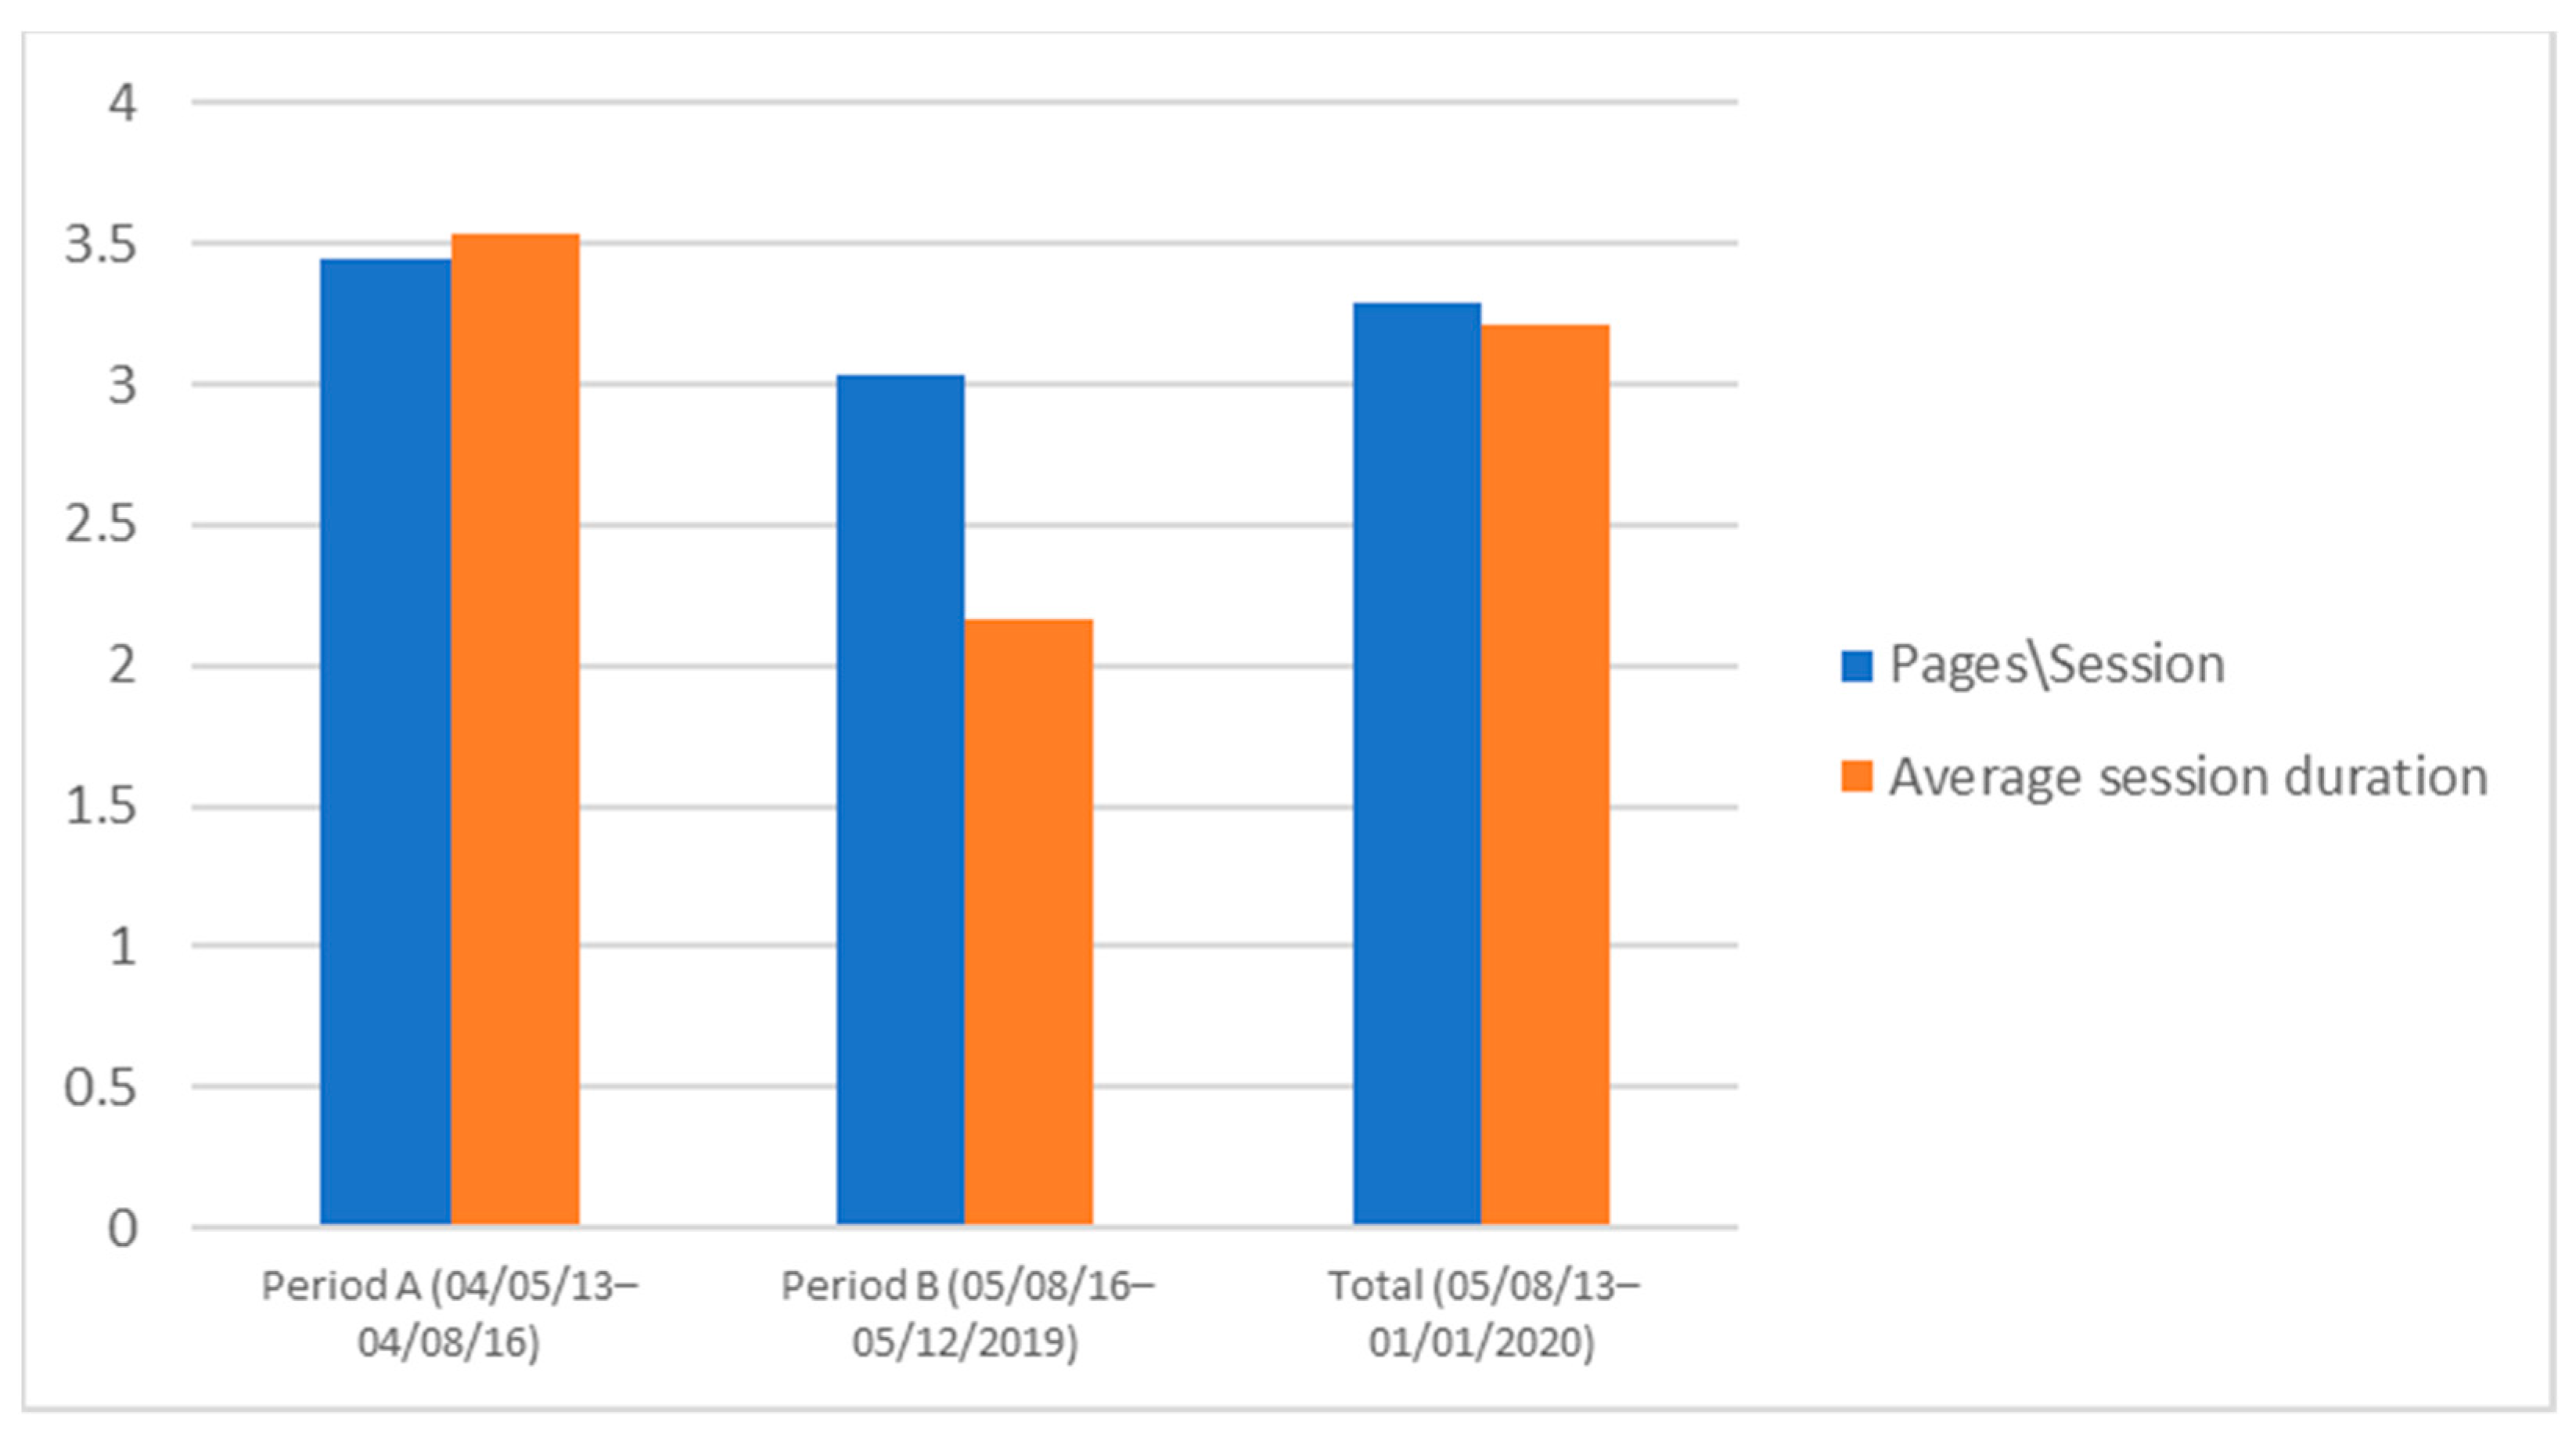
Table 1.
Dimensions and web metrics under study.
| Dimensions and Web Metrics | Description |
|---|---|
| Page views | Instances when a page on your website is loaded or reloaded in a browser |
| Sessions | The periods of time a user is actively engaged with the website |
| Bounce rate | The percentage of single-page sessions (users viewed only a single page without interacting further) |
| Landing Page | The pages through which visitors entered a website |
| Page Depth | The number of pages visited by users during a session |
| Traffic sources | The origin of website’s traffic (e.g., a search engine or another site) |
| Organic traffic/Social Network traffic | Traffic from search engines (without paid advertisements)/traffic from social networks |
| Direct traffic/Referral traffic | Visitors came directly to the website (e.g., typing URL or clicking on a bookmark)/Traffic from users clicking a link from another site |
Table 2.
Social network referrals.
| Social Network | Sessions | Page Views | Average Session Duration | Page/Session |
|---|---|---|---|---|
| 1819 | 6361 | 199.14 | 3.50 | |
| 58 | 93 | 21.60 | 1.60 | |
| 32 | 63 | 323.22 | 1.97 | |
| Blogger | 30 | 51 | 174.10 | 1.70 |
| YouTube | 14 | 73 | 259.21 | 5.21 |
| 12 | 23 | 86.00 | 1.92 | |
| Tumblr | 8 | 47 | 99.50 | 5.88 |
| Vimeo | 4 | 20 | 349.75 | 5.00 |
| WordPress | 3 | 8 | 69.33 | 2.67 |
Table 3.
Loading pages.
| Landing Page | Sessions | % New Sessions | Bounce Rate | Pages/Session | Average Session Duration |
|---|---|---|---|---|---|
| 5898 | 79.82% | 58.88% | 3.89 | 280.24 | |
| voutia-sto-parelthon | 395 | 77.47% | 60.00% | 3.47 | 205.20 |
| i-palia-zoi | 358 | 86.59% | 47.21% | 4.64 | 236.40 |
| nea-zoi-sti-nea-lampsako | 304 | 77.96% | 58.22% | 3.56 | 197.42 |
| nea_lampsakos | 299 | 86.62% | 66.89% | 3.28 | 174.56 |
| gallery/antimetopoi-me-ton-ratsismo | 228 | 87.28% | 81.14% | 1.83 | 69.33 |
| creative team | 193 | 87.56% | 77.72% | 1.96 | 81.41 |
| nea-zoi-sto-lapseki | 175 | 85.14% | 40.00% | 4.55 | 179.08 |
| user/lampsakosDOC | 155 | 94.84% | 78.71% | 1.38 | 65.72 |
| gallery/Nea Lampsakos’ customs | 138 | 89.13% | 78.26% | 1.64 | 86.14 |
Table 4.
Most popular pages.
| Page | Page Views | Unique Page Views | Bounce Rate |
|---|---|---|---|
| / | 8405 | 6326 | 58.13% |
| introduction | 1826 | 1324 | 55.56% |
| i-palia-zoi | 1476 | 955 | 47.21% |
| egkatastasi | 1263 | 756 | 59.70% |
| voutia-sto-parelthon | 1138 | 766 | 60.00% |
| ancient-lampsacus | 1119 | 722 | 44.80% |
| nea-zoi-sti-nea-lampsako | 1095 | 641 | 58.22% |
| nea_lampsakos | 933 | 709 | 66.89% |
| memories of the Greeks | 707 | 422 | 52.63% |
| gallery/antimetopoi-me-ton-ratsismo | 656 | 517 | 81.14% |
Table 5.
Comparison between two periods of usage.
| Periods | Sessions | Page Views | Pages/Session | Average Session Duration | Bounce Rate |
|---|---|---|---|---|---|
| Period A (05/05/13–04/08/16) | 8991 | 31,011 | 3.45 | 3.54 | 61.78 |
| Period B (05/08/16–05/12/2019) | 3124 | 9454 | 3.03 | 2.16 | 58.90 |
| Total (05/05/13–01/01/2020) | 12,115 | 40,465 | 3.29 | 3.21 | 61.16 |
Publisher’s Note: MDPI stays neutral with regard to jurisdictional claims in published maps and institutional affiliations. |
© 2021 by the authors. Licensee MDPI, Basel, Switzerland. This article is an open access article distributed under the terms and conditions of the Creative Commons Attribution (CC BY) license (http://creativecommons.org/licenses/by/4.0/).
Share and Cite
MDPI and ACS Style
Podara, A.; Giomelakis, D.; Nicolaou, C.; Matsiola, M.; Kotsakis, R. Digital Storytelling in Cultural Heritage: Audience Engagement in the Interactive Documentary New Life. Sustainability 2021, 13, 1193. https://doi.org/10.3390/su13031193
AMA Style
Podara A, Giomelakis D, Nicolaou C, Matsiola M, Kotsakis R. Digital Storytelling in Cultural Heritage: Audience Engagement in the Interactive Documentary New Life. Sustainability. 2021; 13(3):1193. https://doi.org/10.3390/su13031193
Chicago/Turabian StylePodara, Anna, Dimitrios Giomelakis, Constantinos Nicolaou, Maria Matsiola, and Rigas Kotsakis. 2021. "Digital Storytelling in Cultural Heritage: Audience Engagement in the Interactive Documentary New Life" Sustainability 13, no. 3: 1193. https://doi.org/10.3390/su13031193
Note that from the first issue of 2016, this journal uses article numbers instead of page numbers. See further details here.