Differentiation in Healthcare Financing in EU Countries


1
Institute of Economics and Finance, Warsaw University of Life Sciences, 02-787 Warsaw, Poland
2
Management Institute, Warsaw University of Life Sciences, 02-787 Warsaw, Poland
*
Author to whom correspondence should be addressed.
Sustainability 2021, 13(1), 251; https://doi.org/10.3390/su13010251
Submission received: 1 November 2020
/
Revised: 6 December 2020
/
Accepted: 18 December 2020
/
Published: 29 December 2020
(This article belongs to the Special Issue Sustainability of Public Policy and Health Economics)
Abstract
:The main aim of this work was to identify and present the situation and changes in the level of expenditure on healthcare in the European Union in the years 2013–2017. This involved an analysis of the available literature on healthcare financing, data from the EUROSTAT database. For this work, the comparative method was used, dynamics indicators were used, the Gini concentration coefficient was calculated, and the degree of concentration was presented using the Lorenz curve. Pearson’s linear correlation coefficients were also used. A descriptive, tabular and graphic method was used to present the test results that were obtained. A high concentration of expenditure on healthcare was found in the EU countries with the largest population and that are the most economically developed. These results also relate to these expenses on a per capita basis. The main factor differentiating the level of healthcare financing was the level of economic development. This regularity was confirmed in the statement of expenditure per capita, the relationship between this expenditure and the value of GDP and the results obtained when calculating the correlation between expenditure and economic development. In addition to the economic situation, an important factor determining the amount of expenditure on healthcare was the percentage of the country’s population that are older people.
1. Introduction
Health is of great importance to individual people and to society [1,2]. Healthcare is one of the most important ways to reduce the incidence of ill health and illness [3]. The availability of healthcare determines people’s quality of life [4]. The term health protection refers to all activities that directly or indirectly affect the prevention, maintenance and improvement of the state of health of the population [5,6]. The concept of healthcare includes services provided as part of traditional health services (such as hospital services), but also includes activities in other sectors of the economy, such as: social care, palliative care, protection and shaping the natural environment, health behaviors (physical activity, proper nutrition or avoiding stimulants), creating good living conditions for the population, etc. [7,8]. The healthcare system includes healthcare (healing medicine), management of health activities, sources of financing expenditure on healthcare, as well as health and protection (public health activities) [9,10,11].
Healthcare expenditure is very high in many countries. For example, it currently accounts for 17% of GDP in the US and is expected to increase by up to 33% by 2050 [12,13,14]. There are various models for financing healthcare. In Great Britain, healthcare has been the domain of the state, and healthcare expenditure on this has accounted for as much as 17% of all government expenditure [15,16]. Healthcare has become one of the most important elements of expenditure, investment and employment in a developed economy. There is a strong connection between healthcare expenditure and the economic well-being of a country and its citizens [17,18,19,20,21]. Public private partnerships are used in many countries, including in the healthcare sector. As a result of these partnerships, expenditure on the important social goal of providing a good healthcare system can be increased [22]. In economically developed countries, the main problem in healthcare is soft budget constraints, which contribute to the indebtedness of national and local governments. In post-socialist countries, the main problem involving healthcare is the lack of neutrality of private and public entities operating in the sector [23,24,25,26].
The healthcare system in the European Union, including in each member state, operates under specific political, economic and institutional conditions. Legal acts issued at various levels, such as the Constitution, international agreements, regulations, directives and EU decisions as well as national and local laws and regulations, are of great importance to the sector [27,28,29,30,31].
Financing healthcare means accumulating funds for this purpose and ensuring proper distribution methods exist for these funds, thereby enabling spending in a way that meets the health needs of society. There are four commonly used models for financing healthcare. The National Health System was created using the Beveridge model. The source of its financing is taxes, and the state is responsible for health protection. Only basic medical services are provided by this system, therefore making voluntary health insurance available is necessary to obtain other types of medical services. The model comes from Great Britain and is also used in Denmark, Portugal, Spain, Greece, Sweden and Finland [32,33,34]. Under the Bismarck model, the source of financing is insurance premiums paid by the employee and the employer to independent health insurance funds. Special purpose funds are created, and public authorities are still responsible for the organization of insurance coverage. Health services are provided by public and private medical units that are financed based on signed contracts. Wealthy people do not participate in this insurance system, so they are directed to private entities in the case of illness. This model is used in Germany, Austria, Belgium, the Netherlands and France [35,36,37]. The residual model involves releasing the state from the obligation to provide citizens with access to health services. Subsidies from public funds are small, and the primary source of healthcare financing is private insurers operating under the supervision of medical organizations. Society is responsible for its own health. Publicly funded assistance programs are only available for people without an income or with a low income. This model is found in the USA [38,39]. Under the Semašek model, the state assumes full responsibility for the health of the society. As a result, the only source of financing under this model is the state budget. All healthcare facilities are public and there is no healthcare private sector. Citizens have free access to the full package of health services. This model was used in socialist countries, as well as in Poland until 1998 [40,41,42,43]. Regardless of the model employed, there is no limit to the demand for healthcare services. There is also no national healthcare system in which the level of expenditure is sufficient to meet all healthcare requirements [44,45]. Research into health expenditure in EU countries has been carried out by many researchers. Kerem et al. [46] stated that in the EU, there was no homogenization of healthcare expenditure and health policy. Economic growth did not affect any EU healthcare standardization trends.
Hitiris [47] stated that healthcare expenditure depends primarily on a country’s level of economic development and the structure of its population, while only convergence in economic performance and the standards of living can lead to a convergence of health expenditure standards. Krakowińska [48] compared expenditure on healthcare in Poland and other European countries. She found that there is a close correlation between GDP per capita and health expenditure. Skrzypczak and Rogoś [49] stated that healthcare spending in EU countries usually grew faster than economic growth measured by GDP. Wasiak and Szeląg [50] proved that the increase in expenditure on health services has been caused by demographic changes in the European Union countries. Due to the aging of societies, countries will be forced to allocate more funds for health purposes. Leśniowska-Gontarz [51] pointed out that the increase in spending on healthcare could become an impulse for developing the private healthcare sector. Concerning a larger number of countries, this subject from outside Europe was dealt with by many authors. Results by Hitiris and Posnett [52] confirm the importance of GDP as a determinant of health spending, with an estimated income elasticity at or around unity, and suggest that OECD countries should not be regarded as a single, homogeneous group. According to Zweifel et al. [53], the limited impact of age on healthcare expenditure suggests that population aging may contribute much less to the healthcare sector’s future growth than claimed by most observers. Payne et al. [54] found that reduced mortality and low growth in the costs associated with dying could reduce forecasted healthcare expenditures, but high growth in expenditures for those not close to death and nonhospital services could create new economic pressures on healthcare systems. Baltagi and Moscone [55] suggest that healthcare is a necessity rather than a luxury, with an elasticity much smaller than that estimated in previous studies. De Meijer et al. [56] found that population aging reinforces medical technology’s influence on health expenditure growth and vice versa. Khan and Mahumud [57] have researched 9 South-East Asian regional countries. They found that a one percentage point increase in GDP per capita increased private healthcare expenditure by 1.128%, while public expenditure increased by only 0.412%. Fazaeli et al.’s [58] research verifies that healthcare is not a luxury good and income has a robust relationship to health expenditures in OPEC countries. Baltagi et al. [59] investigate the long-run economic relationship between healthcare expenditure and income in the world using data on 167 countries over the period 1995–2012, collected from the World Bank data set. It was concluded that the size of income elasticity depends on different countries’ positions in the global income distribution, with poorer countries showing higher elasticity. Apergis et al. [60] investigate the long-run dynamics between healthcare expenditure and environmental pollution across four global income groups. The analysis uses data from 178 countries, spanning the period 1995–2017. It was found that a 1% increase in national income increased health expenditure by 7.2% in the full sample, and 9.3%, 8.6%, 6.8%, and 2.9% for low, low-middle, upper-middle, and high-income groups, respectively, while a 1% increase in CO2 emissions increased health expenditure by 2.5% in the full sample, and 2.9%, 1.2%, 2.3% and 2.6% across these four income groups.
Sustainable development is about achieving multiple goals. One of them is to improve the health of the population [61]. Such actions must take into account the economic and social aspects. The social aspect includes health protection. Public health in the context of sustainable development is a team of health-related factors that impact the person (unit) and its surroundings [62,63,64,65]. In the case of healthcare, it is essential to reduce inequalities in access to health services. All societies devote considerable resources to maintaining and improving health. Such activities are integral to the sustainable development strategy [66,67,68,69]. Therefore, healthcare expenditure and appropriate use are essential [70]. The research problem of the subject matter is not new. There have already been researched health expenditures and their relationship to the level of economic development of countries. However, there was no current research on this problem, especially concerning EU countries.
The article aimed to recognize and present the current situation and changes in healthcare expenditure in the European Union countries. The specific objectives were to determine the level of concentration of expenditure on healthcare in EU countries, their directions, the level of this type of expenditure per person, their importance in GDP, and the relationship with the economic situation. The hypothesis was put forward according to which expenditure on healthcare in the European Union was strongly concentrated in several EU countries.
The article consists of an introduction, which presents the importance of financing healthcare, mainly from an economic and social perspective. The next part describes the research methods used in the article. The research results relate to the economic aspects of health protection. In part devoted to the discussion, the obtained research results were confronted with other scientists’ research results. The final part of the article contains a summary. The research hypotheses were also verified.
2. Materials and Methods
All EU Member States were selected for research as of 31 December 2017 (28 countries). The research period concerned the years 2013–2017. Sources of materials were literature on the subject and Eurostat data. The analysis and presentation of materials, descriptive, tabular, graphic methods, dynamics indices with a constant and variable basis, Gini concentration coefficient, concentration analysis using the Lorenz curve, and Pearson linear correlation coefficient were used.
The first stage of the research presents the share of individual countries in health expenditure in the EU. The aim was to show the existing differences and inequalities between countries in this aspect. Next, the Gini concentration coefficient was calculated. Thanks to that, it was possible to determine the concentration level of healthcare expenditure in the EU countries. It was measured based on the value of health expenditure in EU countries. If such expenditures concerned only one country, the coefficient would be 1. If they are spread over more countries, the coefficient becomes lower. The closer to 0, the more even the distribution of healthcare expenditures among EU countries is. The Lorenz curve is a graphical representation of the concentration of health spending in EU countries.
The Gini coefficient is a statistical measure of economic inequality in a population. It measures the unevenness (concentration) of the distribution of a random variable. The coefficient can be represented by the formula [71]:
where:
- n—number of observations,
- —value of the “i-th” observation,
- —the average value of all observations, i.e.,
The Lorenz curve is a graphical representation of the distribution of income inequality or wealth inequality. It determines the degree of concentration of a one-dimensional random variable distribution [72]. With sorted observations yi, which are non-negative values , , the Lorenz curve is a polyline which apexes , for h = 0, 1, …, n, have the following coordinates:
The Gini coefficient is the area between the Lorenz curve and the unit square’s diagonal multiplied by 2.
In the third stage of the research, expenditure on healthcare per capita was presented. Countries differed in population size. Such a reference for expenditure per capita enabled a better comparison of countries. Another important indicator was the share of health expenditure in GDP. The use of both indicators made it possible to determine the level of healthcare support in individual countries, both based on society’s welfare and the importance of this sector in the national economy.
In the fourth stage of the research, the dynamics indicators for total healthcare expenditure and per capita were calculated. As a result, data on the directions and strength of healthcare spending changes in individual EU countries were obtained. The dynamics indicators with a fixed base and a variable base were used. The dynamics indicators with a fixed base are determined as follows [73]:
where: —the level of the phenomenon in a certain period, —the level of the phenomenon during the reference period.
The dynamics indicators based on a variable basis are defined as follows [73]:
where: —the level of the phenomenon in a certain period, —the level of the phenomenon in the previous period.
In the fifth stage, the relationship between the value of healthcare expenditure in EU countries and the economy’s parameters was examined. The parameters were chosen intentionally based on the review of the literature [46,48,49]. The parameters highlight the most important aspects related to the economy of the country. Thanks to this research, it was determined which parameters are essential and their strength regarding healthcare expenditure. Expenditure on healthcare is presented in total and per capita.
Pearson’s linear correlation coefficient is a measure of the strength of a straight-line relationship between two measurable features. It is represented by the equation [74]:
where:
- C(X,Y)—covariance between the X and Y features,
- —X feature variance,
- —Y feature variance,
- —X feature’s standard deviation,
- —Y feature’s standard deviation.
The linear correlation coefficient is considered as the normalized covariance. Correlation takes values in the range (−1, 1).
In the final stage of the research, a regression analysis was performed. For this purpose, multiple least squares regression was used. All variables used in the study of the Pearson correlation coefficient were used for the analysis. Thanks to this, it was possible to build models and determine which variables and to what extent affect healthcare expenditure. Two models were built, i.e., for the total expenditure and per capita. As a result, it was found whether differences were depending on the way health expenditure is presented. The multivariable regression function can be written as follows [75]:
where:
Y = α0 + α1X1 + α2X2 + … + αkXk + ξ
- Y—dependent variable,
- Xi—independent variables (i = 1, 2, …, k),
- ξ—random variable,
- α0—intercept of regression function,
- αi—structural parameters of the model (i = 1, 2, …, k).
3. Results
Expenditures for healthcare from all public and private institutions have been steadily increasing. In 2013, EUR 1353 billion was spent across the EU-28, and EUR 1481 billion in 2017, an increase of 11.7%. It seems logical that countries with the largest human populations and a high level of economic development spend most on healthcare. The top five countries were the most populous EU countries (Table 1). The next places were, however, occupied by less populated but significantly developed countries. The smallest and poorest countries were at the end of the list. It can be seen that the changes in the structure in individual years were small. In years 2013–2017, the largest expenditure increases were recorded in the smallest countries (in terms of population), such as Malta (50%), Estonia (33%), Latvia (31%), and Lithuania (27%), but also larger (but poorer) countries, like Romania (30%) and Bulgaria (by 27%). Healthcare expenditure decreased only in Greece.
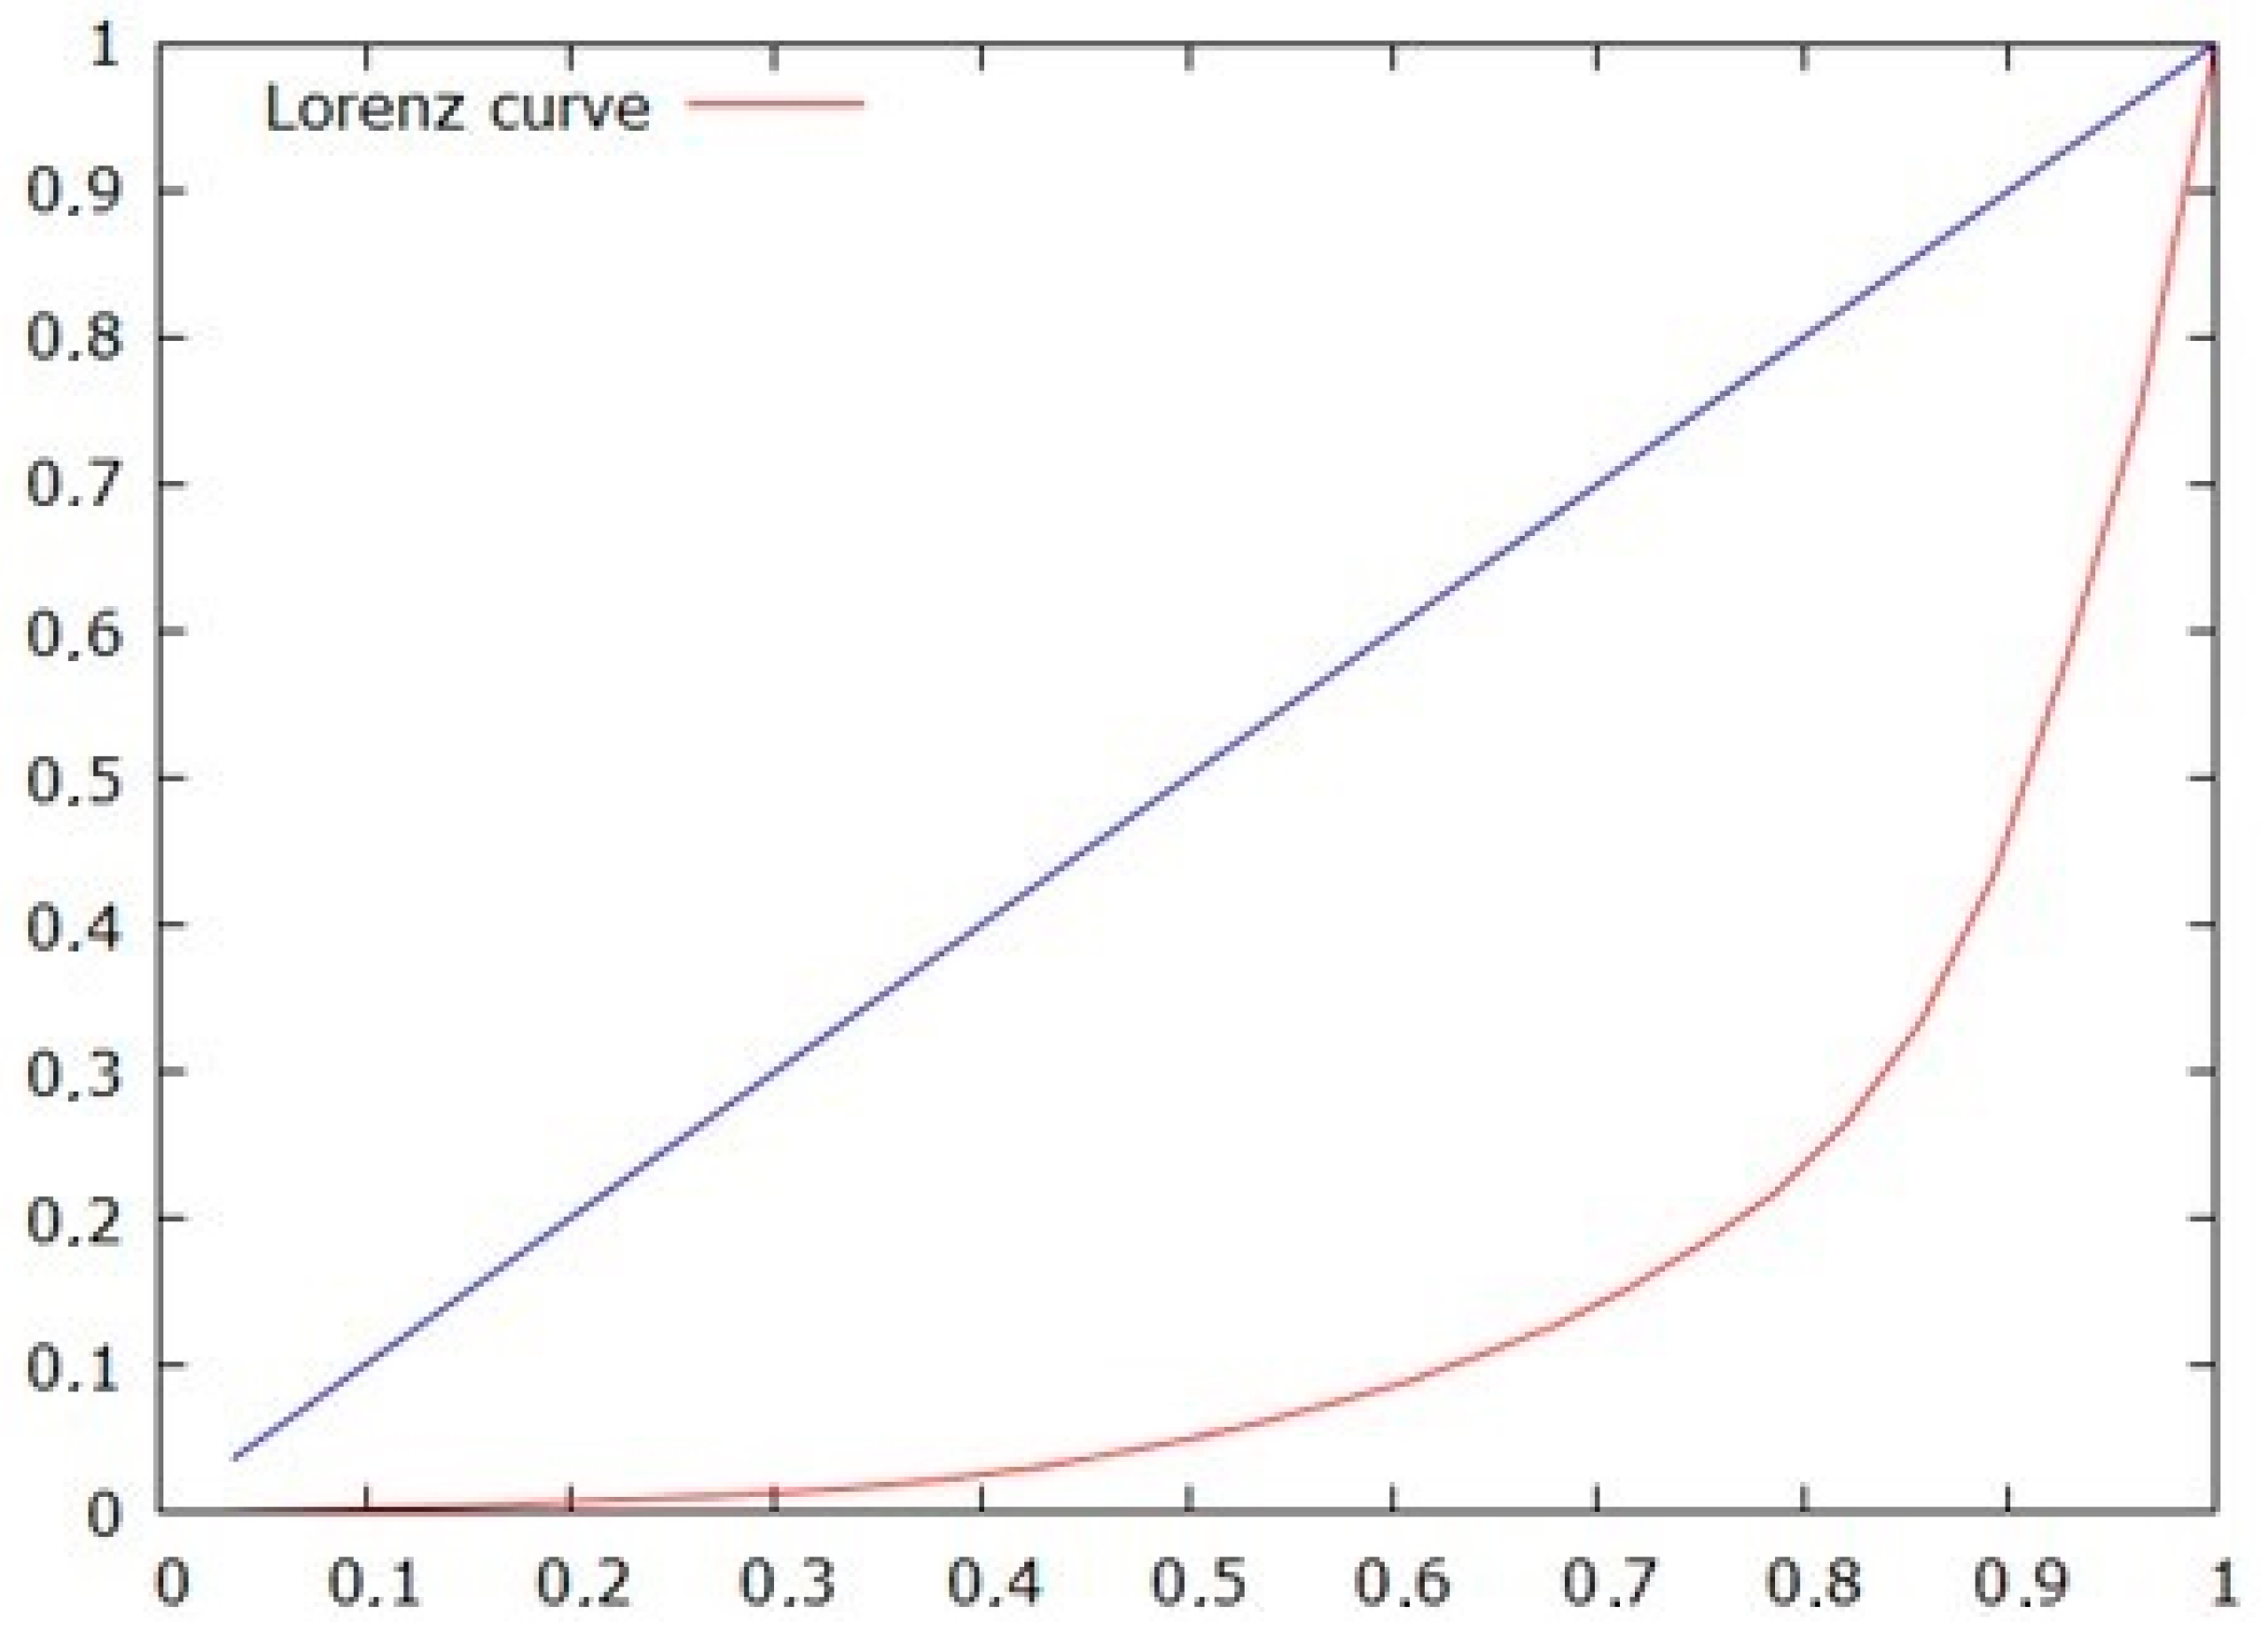
The Gini coefficient was used to determine the concentration of healthcare expenditure in EU countries. This coefficient is a correct and commonly used measure of inequality because it satisfies all axioms postulated in this field [76]. It assumes values in the range of 0 to 1. A result close to 1 means a very high concentration in one place of production, while close to 0 indicates the dispersion of business. The data concerned 2017 and covered all EU countries. The Gini coefficient calculated from the sample for healthcare expenditure was 0.71, and the estimated coefficient for the population was 0.73. There is a very high healthcare expenditure concentration, mainly in countries with the largest population and the most economically developed.
Additionally, the diversity was presented using the Lorenz concentration curve [77] and (Figure 1). In 2013, the Gini coefficients for healthcare expenditure were identical. The level of concentration of these expenses has not changed. Healthcare financing in absolute numbers without reference to the population can be misleading. Another aspect is taking into account the capabilities of individual countries and their economies.
The presentation of healthcare expenditure per capita shows an accurate scale of support. This time, the top three countries were the wealthiest countries with smaller populations, such as Sweden, Denmark, and Luxembourg, who spent over EUR 5000 in 2017 per inhabitant (Table 2). Germany was only in the fourth position, with 4.4 thousand. Euro per capita in 2017. In general, the EU leaders were the most economically developed in the ranking, while at the bottom, all countries from Central and Eastern Europe were admitted to the EU during the recent enlargements. In seven countries, the level of healthcare expenditure per capita in 2017 did not exceed EUR 1000. Therefore, the disparities between Western and Eastern Europe were substantial. In 2013–2017, healthcare expenditure per EU citizen increased from 2674 to 2973 euros or 10%.
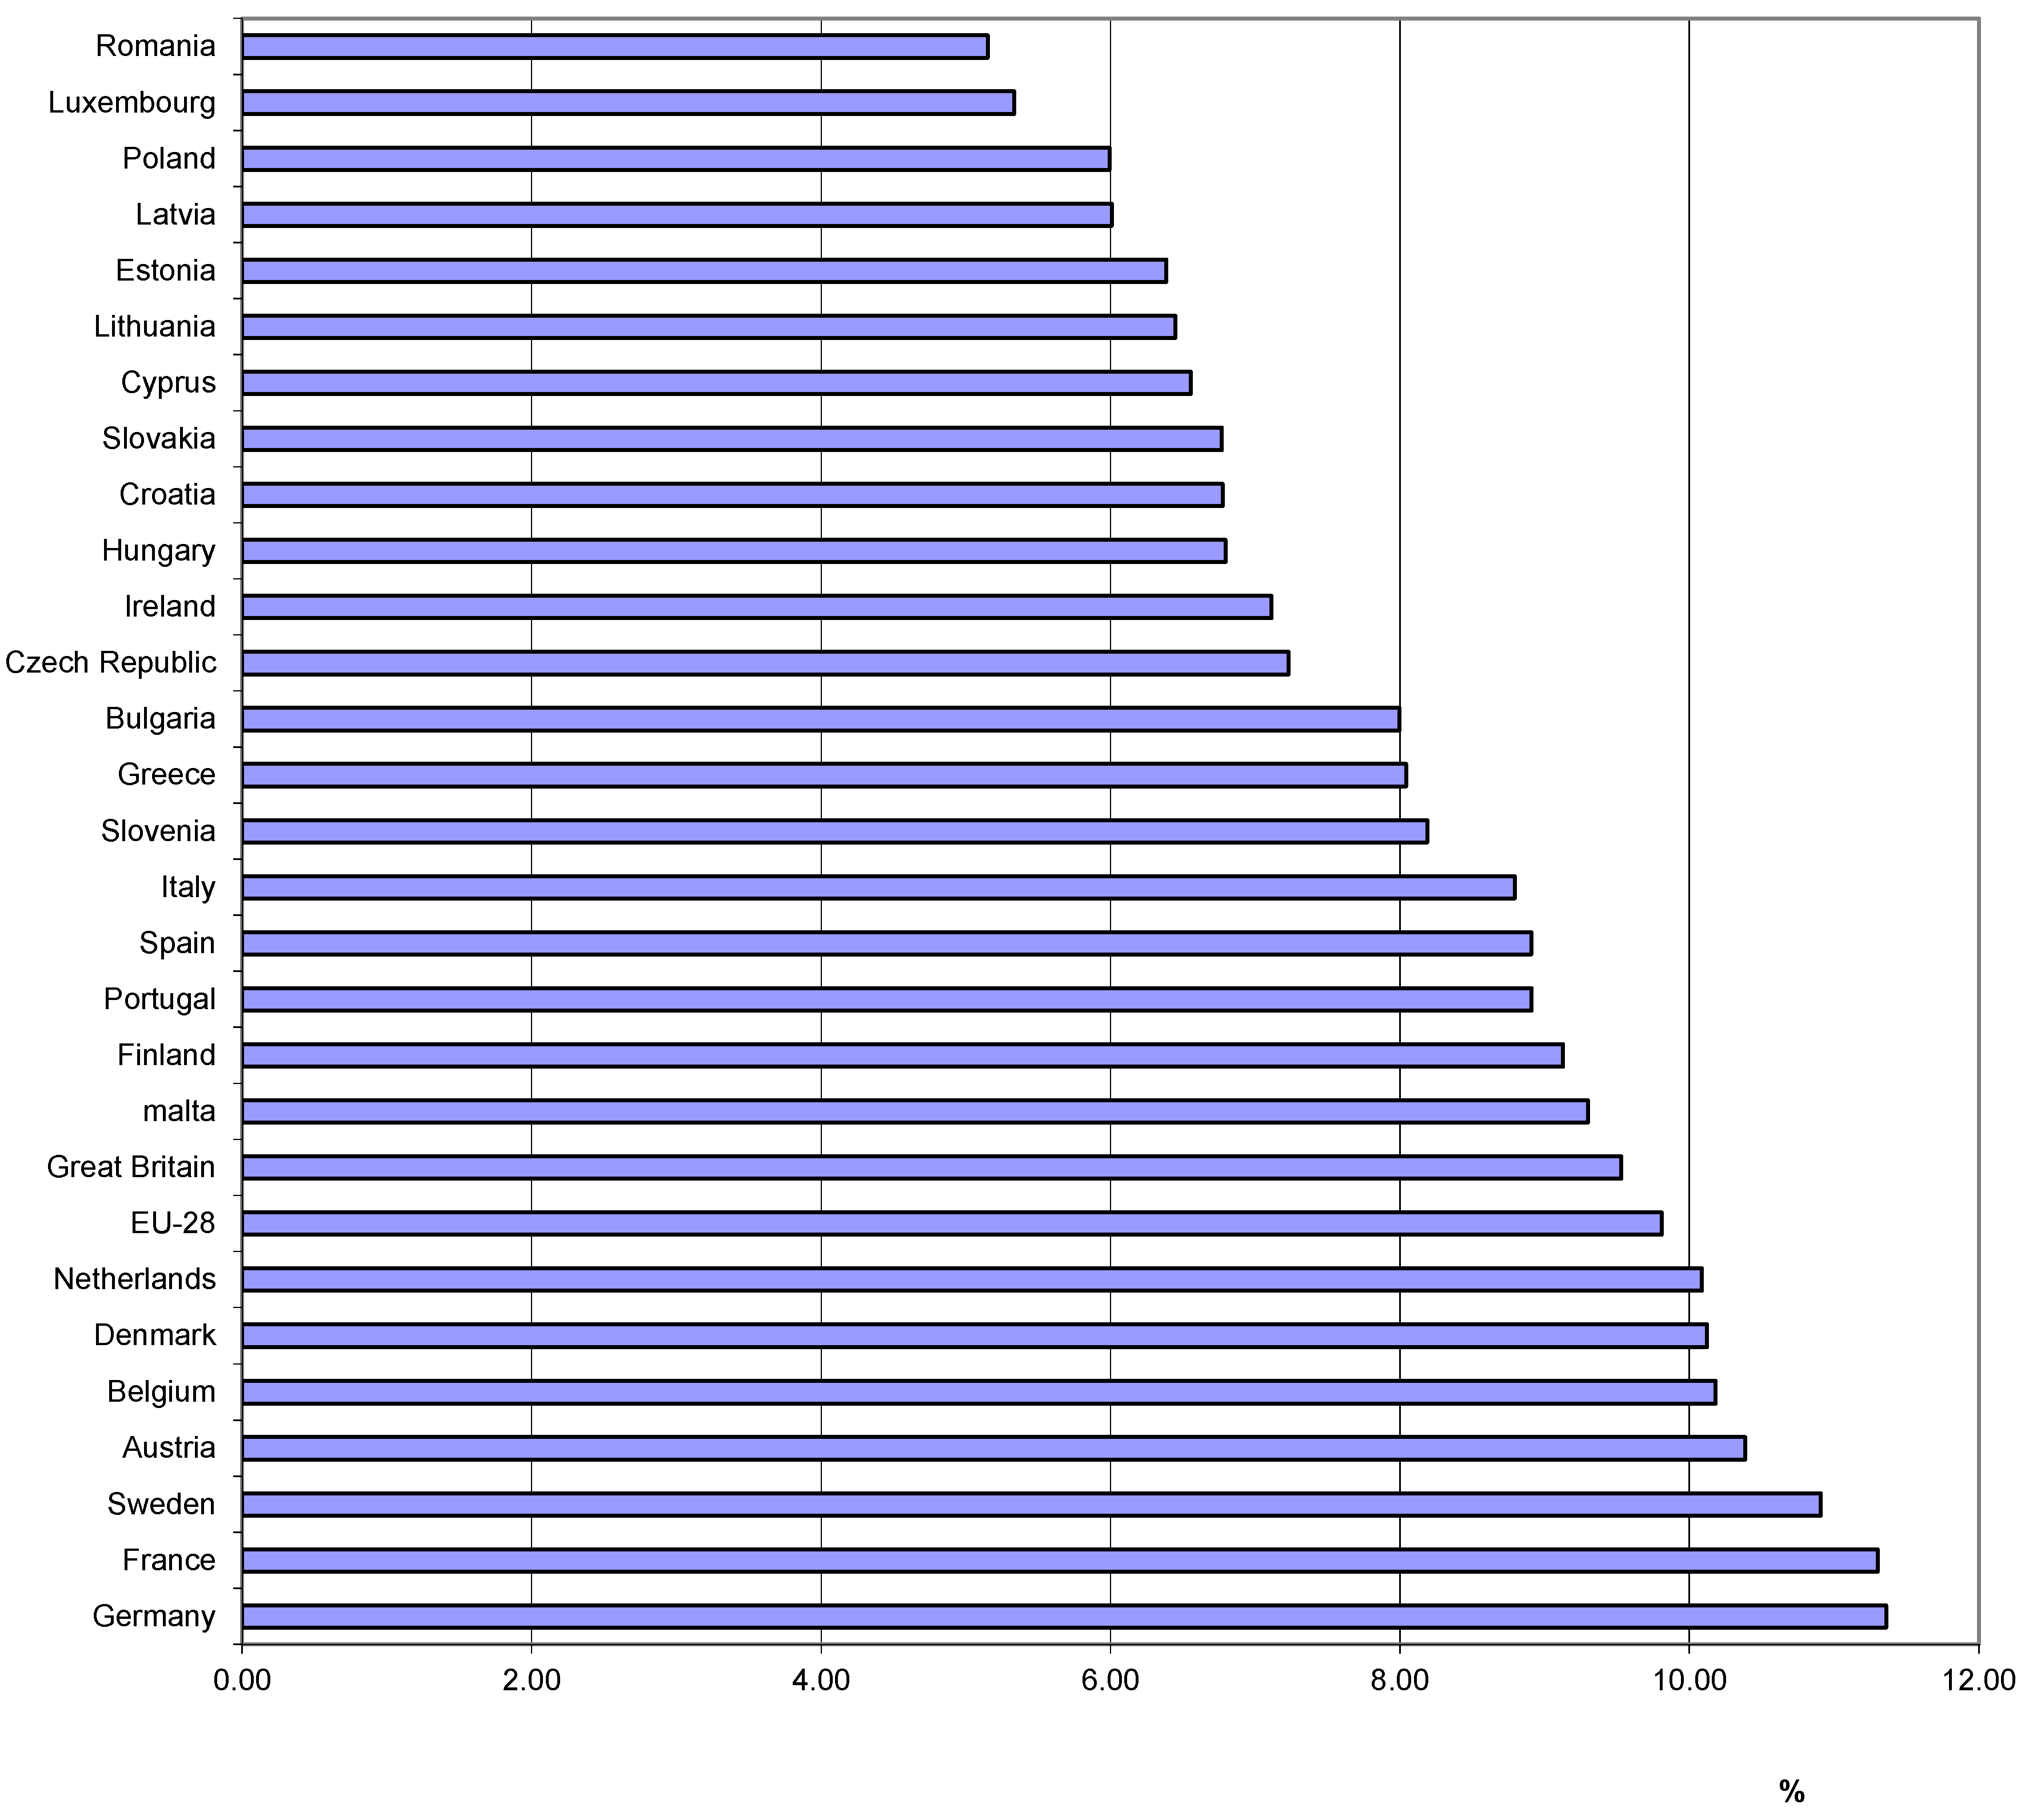
The share of healthcare expenditure in GDP is another important indicator. Regularities were similar to those for the total expenditure and per capita, but some exceptions to the rule (Figure 2). Again, the highest results were achieved in Western European countries with the largest populations and the most economically developed and the oldest societies. On average, in the EU in 2017, 9.81% of GDP was spent on healthcare. The first seven countries reached 10–11% of GDP. In turn, the lowest share was in Romania and interestingly in Luxembourg (5% each). The smallest share was also achieved in all countries of Central and Eastern Europe with relatively young societies. In the case of this indicator, the disparities between individual countries were not very large. Each country tried to support health protection, depending on the level of economic development.
Dynamics indicators were used to determine changes in the expenditure level on healthcare in total and per capita. They were calculated for each year, assuming that the result was compared to the previous year. In the second option, the calculations cover the entire period. At that time, expenditure was compared from 2017 to 2013 (Table 3). It can be seen that expenditure on healthcare usually increased systematically every year. The exceptions were 2014 (declines were recorded in the Czech Republic, Greece, Cyprus, and Slovakia), 2016 (declines only in Great Britain), and 2017 (in Great Britain and Greece). The decrease in healthcare expenditure was recorded only in Greece. In the case of dynamics indicators for healthcare expenditure per capita, regularities were similar to those for total expenditure. As a rule, the indicators were at a similar level. Possible changes in the size of the population of countries could have caused more enormous differences.
To determine the relationship between the value of expenditure on healthcare in EU countries and the basic parameters of the economy, Pearson’s linear correlation coefficients were calculated [78] (Table 4). p = 0.05 was used as the limit of significance. Correlation coefficients were calculated for EU countries in individual years and the entire period 2013–2017. The study tried to check the correlation, which does not indicate that a given factor affects another, but a strong or weak relationship between them.
Significant and substantial positive relations between the expenditure on healthcare and the value of GDP and the value of exports and imports of goods and services were found. Changes in this type of expenditure were very strongly linked to the situation in the economy. In the case of the economic parameter per capita (GDP per capita), no significant relationships were found with the value of healthcare expenditure. Expenses for health protection per inhabitant have also been compared with economic parameters. The strength of the relationship was average. Only when comparing parameters related to one inhabitant, a very high positive correlation was achieved.
Subsequently, multiple regression models using the least-squares method for total healthcare expenditure and per capita for the entire EU were developed. For the model’s construction, the same parameters for Pearson’s linear correlation coefficients were explanatory variables. Explanatory variables used for the study:
- X1—GDP value (billions of euros),
- X2—value of GDP per capita (euro),
- X3—export of goods and services (billions of euros),
- X4—import of good and services (billions of euros).
Models cover the situation across the EU. Aggregated data were used, i.e., total expenditure on healthcare in the EU and per capita. Two models were prepared. In the case of individual dependent variables, various explanatory variables entered the models. The models with the highest significance level were selected. The p-value for all dependent variables was less than 0.05. This means the significance of individual parameters and the importance of the model. Model estimation parameters, such as the residual standard error, were also low. Table 5 and Table 6 show verification of the regression model’s level of fit for healthcare expenditure. The results are as follows.
For total healthcare expenditure:
Y = −37,180.4 + 0.112143 X1 − 7.63131 X3 + 7.26564 X4
For per capita spending on healthcare:
Y = 542.55 + 0.000157 X1
The dependencies were confirmed with the correlation. Expenditure on the protection of health depended mainly on the value of GDP. Wealthier countries with a higher GDP value allocated substantial spending on healthcare, while poorer countries are not. The model also includes parameters determining a given economy’s situation, such as the value of exports and imports. These parameters are evidence of the economic situation [79,80]. On the other hand, expenditure on healthcare per capita depended only on the value of GDP. Large, economically developed countries in the EU generally allocated more money to healthcare. In turn, small, economically undeveloped countries usually spent less on health protection.
4. Discussion
The healthcare system affects the entire society. Its processes and activities cause externalities. The health budgets of most European countries are too low [69,81]. Expenditure on health protection should be higher, as they constitute an element influencing social development [82,83,84]. There are socioeconomic inequalities in health protection in Europe, as already proven in research from the 1980s [85]. The European Union encouraged action in many countries, creating a framework and principles for combating health inequalities. However, these measures mainly addressed inequalities based on gender, education, and population income [86,87,88]. Each EU country has a healthcare system that is adapted to its socioeconomic situation [89].
In Strzelecka studies [90], concerning health systems’ financing, the best was rated Sweden and Germany, and the worst Greece and Italy. The division between regions was visible. In the northern and western regions of Europe, funding for health protection was higher than in the southern or eastern regions. Rutkowska-Podołowska et al. [91] found that policymakers in Europe are focusing on reducing healthcare spending without drastically reducing the scope of public health services. Such regularities also appeared in other studies [92,93,94,95]. Based on the authors’ analyses, it can be concluded that these activities were ineffective because healthcare expenditure was systematically growing in almost all EU countries. Particularly in Eastern European countries, efforts were made to achieve health protection standards in Western European countries. It was, therefore, necessary to increase expenses for this purpose [96,97]. A study by Luengo-Fernandez et al. [98] presents an analysis of the costs associated with strokes in European countries. Healthcare costs for stroke have been found to increase with the aging of the population. In this case, it is necessary to allocate more financial resources to healthcare.
Previous studies have shown that GDP is the most important factor influencing healthcare spending [99,100,101,102,103,104,105,106,107,108]. It was an economic factor. Studies by Keegan et al. [109] found that public health expenditure is insensitive to the downturn in times of economic recession. Only in the event of a large economic recession has there been a considerable reduction in public health expenditure. In the private sector, these dependencies were more visible, and the reduction of healthcare spending took place even with a slight deterioration of the country’s economic situation. Other parameters were also indicated, but their impact was less significant. They mentioned among age dependency ratio and epidemiological needs, advancements in medical technology, health system characteristics, out-of-pocket health expenditures, population disease pattern, health insurance system, number of physicians, number of prescribed drugs per person, number of hospitals, crude birth rate, literacy rate and life expectancy at birth. These were factors related to the demographic situation and the condition of the health service in a given country [110,111,112,113,114,115].
Research by other authors found that healthcare expenditure depends on the level of development of a given society. Additionally, these countries are following the same path. Features of economically developed countries include aging of the population, technological progress, and high health insurance levels. Only the convergence of countries’ economic development and living standards can lead to a convergence of health spending. Such regularities were found, among others, in research by Hitiris [47], Barros [116], Nixon [117], Hitiris and Nixon [118], Narayan [119], Panopoulou and Pantelidis [120]; Lau et al. [121], Pekkurnaz [122]. These regularities are not always accurately reproduced. There are periods when there is structural reform of the health service. Then, expenditure on healthcare may differ from the general model. The presented research explains why there are such large differences between EU countries regarding healthcare expenditure. These are the different levels of economic development and society, which directly translates into healthcare spending. When these differences are eliminated, the healthcare expenditure per capita should be at a similar level, or at least the differences will not be so meaningful.
5. Conclusions
Expenditure on healthcare in the EU countries has been steadily growing. However, there were disproportions between individual countries. The most money for healthcare was spent in countries with the largest population and economically most developed. In turn, the smallest funds were allocated in countries with the smallest human populations and with the lowest incomes. A very high level of concentration of these expenses was recorded in several Western European countries. In the years 2013–2017, there were virtually no changes.
The total level of expenditure on healthcare can be misleading, so it is better to show these expenses per capita. The wealthiest countries with small populations found themselves in the top three. In this case, the essential factor was the level of economic development. There were considerable disproportions between western and eastern Europe.
The importance of healthcare expenditure in the economy was presented using the share of this expenditure in GDP. The disparities between countries were less significant, but the division into more and less prosperous Europe was still visible. It means that each country treated the protection of residents’ health as an essential aspect of financial policy and adapted such expenses to the economy’s condition. The calculated correlation coefficients showed a substantial positive relationship between the value of healthcare expenditure in individual EU countries and the economy’s parameters. One should also compare absolute values in pairs. Other comparisons should relate to indicators relating to results per capita. The results will then confirm the tremendous relationship between expenditure on healthcare and its economic situation.
The research also confirmed that the level of GDP had an enormous impact on healthcare spending. Based on the literature review, it can be concluded that the similarity in the economic development of countries results from their similarity in the level of healthcare financing. In the EU, countries are still quite diversified in economic terms, so there were significant differences in the level of financing healthcare expenditure.
Based on the conducted research, it can be concluded that with the economic development, the level of expenditure on healthcare and their share in GDP generally increases. Thus, economic factors have an enormous impact on the financing of healthcare. Of course, other factors, such as an aging population, also need to be considered. Determining the impact of individual factors on health protection requires in-depth research.
The obstacle in conducting the research was the access to complete data for the analysis for all EU countries. The analysis covered the years 2013–2017. For this period, complete and comparable data for all EU countries were available. Before 2013, the data did not cover all countries. No information was available for 2018 and 2019 at the time of data collection. The short duration of the studies may affect the interpretation of the results obtained. The performed analysis may be deepened in the coming years. Then, with a more extended period, the interpretation of the results will contain fewer errors.
Author Contributions
Conceptualization, T.R., A.P., M.R.; data curation, T.R., A.P.; formal analysis, T.R., A.P.; methodology, T.R., A.P.; resources, T.R., A.P.; visualization, M.R., T.R., A.P.; writing—original draft, T.R., A.P., M.R.; writing—review and editing, T.R., A.P., M.R.; supervision, T.R., A.P., M.R.; funding acquisition, T.R., A.P., M.R. All authors have read and agreed to the published version of the manuscript.
Funding
This research received no external funding.
Institutional Review Board Statement
Not applicable.
Informed Consent Statement
Not applicable.
Data Availability Statement
The data presented in this study are available on request from the corresponding author.
Conflicts of Interest
The authors declare no conflict of interest.
References
- Porter, M.E.; Teisberg, E.O. Redefining Health Care; Harvard Business School Press: Boston, MA, USA, 2006. [Google Scholar]
- Porter, M.E. What is value in health care. N. Engl. J. Med. 2010, 363, 2477–2481. [Google Scholar] [CrossRef]
- Abelin, T.; Brzezinski, Z.J.; Carstairs, V.D.L. Measurement in Health Promotion and Protection; WHO Regional Office for Europe: København, Denmark, 1987; p. 5. [Google Scholar]
- Morris, S.; Devlin, N.J.; Parkin, D.; Nojszewska, E.; Próchniak, M.; Ciżkowicz, P. Ekonomia w Ochronie Zdrowia; Oficyna Wolters Kluwer Business: Warszawa, Poland, 2011; p. 13. [Google Scholar]
- Ulman, P.; Wałęga, A.; Wałęga, G. Is Health Status a Determinant of The Economic Activity? Some Evidence from Poland. Acta Univ. Lodziensis. Folia Oeconomica 2017, 2, 328. [Google Scholar] [CrossRef]
- Gwatkin, D.R.; Wagstaff, A.; Yazbeck, A.S. (Eds.) Reaching the Poor with Health, Nutrition, and Population Services; World Bank: Washington, DC, USA, 2005. [Google Scholar]
- Rudawska, I. Opieka Zdrowotna Aspekty Rynkowe i Marketingowe; Wydawnictwo Naukowe PWN: Warszawa, Poland, 2007; pp. 13–15. [Google Scholar]
- Gröne, O.; Garcia-Barbero, M. Integrated care: A position paper of the WHO European Office for Integrated Health Care Services. Int. J. Integr. Care 2001, 1, e21. [Google Scholar] [CrossRef] [Green Version]
- Derecz, M. Samorząd Terytorialny w Systemie Ochrony Zdrowia; Municipium SA: Warszawa, Poland, 2005; pp. 37–40. [Google Scholar]
- Bevan, G.; Hood, C. What’s measured is what matters: Targets and gaming in the English public health care system. Public Adm. 2006, 84, 517–538. [Google Scholar] [CrossRef]
- Li, L.; Fu, H. China’s health care system reform: Progress and prospects. Int. J. Health Plan. Manag. 2017, 32, 240–253. [Google Scholar]
- Jones, D.W.; Hall, J.E. Seventh report of the Joint National Committee on Prevention, Detection, Evaluation, and Treatment of High Blood Pressure and evidence from new hypertension trials. Hypertension 2004, 43, 1–3. [Google Scholar] [CrossRef] [PubMed] [Green Version]
- PGPG. Per Capita Healthcare Costs—International Comparison. Retrieved from Peter G. Peterson Foundation Chart Pack. Available online: http://www.pgpf.org/chart-archive/0006_health-care-oecd (accessed on 30 June 2020).
- OECD Health Statistics. Organisation for Economic Cooperation and Development. Available online: http://www.oecd.org/els/health-systems/health-data.htm (accessed on 30 June 2020).
- Chote, R.; Emmerson, C.; Frayne, C.; Love, S. Challenges for the 2004 Spending Review. The Institute for Fiscal Studies. Brief. Note 2004, 50, 1–11. [Google Scholar]
- Harding, A.J.; Pritchard, C. UK and twenty comparable countries GDP-expenditure-on-health 1980–2013: The historic and continued low priority of UK health-related expenditure. Int. J. Health Policy Manag. 2016, 5, 519. [Google Scholar] [CrossRef] [PubMed]
- Reinhardt, U.E.; Hussey, P.S.; Anderson, G.F. Cross-national comparisons of health systems using OECD data, 1999. Health Aff. 2002, 21, 169–181. [Google Scholar]
- Anderson, G.F.; Frogner, B.K.; Reinhardt, U.E. Health spending in OECD countries in 2004: An update. Health Aff. 2007, 26, 1481–1489. [Google Scholar] [CrossRef] [Green Version]
- Hall, R.E.; Jones, C.I. The value of life and the rise in health spending. Q. J. Econ. 2007, 122, 39–72. [Google Scholar] [CrossRef]
- Baltagi, B.H.; Lagravinese, R.; Moscone, F.; Tosetti, E. Health care expenditure and income: A global perspective. Health Econ. 2017, 26, 863–874. [Google Scholar] [CrossRef] [PubMed] [Green Version]
- Rana, R.H.; Alam, K.; Gow, J. Health expenditure and gross domestic product: Causality analysis by income level. Int. J. Health Econ. Manag. 2020, 20, 55–77. [Google Scholar] [CrossRef] [PubMed]
- Nojszewska, E. System Ochrony Zdrowia w Polsce; Wolters Kluwer Business: Warsaw, Poland, 2011; p. 15. [Google Scholar]
- Babczuk, A. Miękkie ograniczenia budżetowe jako przesłanka niewypłacalności jednostek samorządu terytorialnego. Finans. Komunal. 2008, 3, 5–15. [Google Scholar]
- Zioło, M. Miękkie i twarde ograniczenia budżetowe a problem zadłużenia i wsparcia finansowego dla podmiotów sektora subnational government. Zesz. Nauk. Wyższej Szkoły Bank. Pozn. 2011, 36, 161–172. [Google Scholar]
- Culyer, A.J.; Newhouse, J.P.; Pauly, M.V.; McGuire, T.G.; Barros, P.P. (Eds.) Handbook of Health Economics; Elsevier: Amsterdam, The Netherlands, 2000. [Google Scholar]
- Mills, A. Health care systems in low-and middle-income countries. N. Engl. J. Med. 2014, 370, 552–557. [Google Scholar] [CrossRef] [Green Version]
- Wrona, B. Działalność regulacyjna państwa w sferze finansowania ochrony zdrowia. Zesz. Nauk. Pol. Tow. Ekon. 2011, 11, 379–395. [Google Scholar]
- Hady, J.; Leśniowska, M. Finansowanie polskiego systemu opieki zdrowotnej na tle wybranych krajów Unii Europejskiej. Rozpr. Ubezpieczeniowe 2011, 1, 97–111. [Google Scholar]
- van de Gronden, J.W.; Szyszczak, E.; Neergaard, U.; Krajewski, M. (Eds.) Health Care and EU Law; Springer Science & Business Media: Berlin, Germany, 2011. [Google Scholar]
- Van de Gronden, J.W. Financing health care in EU law: Do the European state aid rules write out an effective prescription for integrating competition law with health care? CompLRev 2009, 6, 5–29. [Google Scholar]
- Mazzucco, W.; Pastorino, R.; Lagerberg, T.; Colotto, M.; d’Andrea, E.; Marotta, C.; Boccia, S. Current state of genomic policies in healthcare among EU member states: Results of a survey of chief medical officers. Eur. J. Public Health 2017, 27, 931–937. [Google Scholar]
- Grosios, K.; Gahan, P.B.; Burbidge, J. Overview of healthcare in the UK. EPMA J. 2010, 1, 529–534. [Google Scholar] [CrossRef] [PubMed] [Green Version]
- Grosios, K.; Gahan, P.B.; Burbidge, J. Healthcare in the UK–predictive, preventive and personalised medicine perspective at the beginning of the twenty-first century. In Healthcare Overview 2012; Springer: Dordrecht, The Netherlands, 2012; pp. 31–44. [Google Scholar]
- Van Der Zee, J.; Kroneman, M.W. Bismarck or Beveridge: A beauty contest between dinosaurs. BMC Health Serv. Res. 2007, 7, 1–11. [Google Scholar]
- Sawicki, P.T.; Bastian, H. German health care: A bit of Bismarck plus more science. BMJ 2008, 337, a1997. [Google Scholar] [CrossRef] [PubMed] [Green Version]
- Reibling, N.; Ariaans, M.; Wendt, C. Worlds of healthcare: A healthcare system typology of OECD countries. Health Policy 2019, 123, 611–620. [Google Scholar] [CrossRef] [PubMed]
- Mossé, P. Steering from bismarck to beveridge: The french experience. Rev. Bras. Promoç. Saúde 2018, 31. [Google Scholar] [CrossRef]
- Rosenbaum, S. The Patient Protection and Affordable Care Act: Implications for public health policy and practice. Public Health Rep. 2011, 126, 130–135. [Google Scholar] [CrossRef] [Green Version]
- Askin, E.; Moore, N. The Health Care Handbook: A Clear and Concise Guide to the United States Health Care System; Washington University: St. Louis, MI, USA, 2014. [Google Scholar]
- Kos, M. Introduction to healthcare systems. In The Pharmacist Guide to Implementing Pharmaceutical Care; Springer: Berlin, Germany, 2019; pp. 437–441. [Google Scholar]
- Rumpf, D.; Suklan, J.; Vogda, G.; ŠTOK, Z.M. The Influence of Quality Management on the Excellence of Slovenian Physicians’ Practice in Public Healthcare. Wseas Trans. Bus. Econ. 2016, 13, 474–482. [Google Scholar]
- Krajewski-Siuda, K.; Romaniuk, P. Zdrowie Publiczne: Stan Obecny, Reformy Ostatnich 20 lat, Model Docelowy; Fundacja Instytut Sobieskiego: Warszawa, Poland, 2011; pp. 37–39. [Google Scholar]
- Jończyk, J. Trudna modernizacja opieki zdrowotnej w Niemczech i w Zjednoczonym Królestwie (UK). Praca Zabezp. Społeczne 2006, 3, 2–8. [Google Scholar]
- Hennes, J.; Kieselbach, F.; Klädtke, R.; Wirsching, K.; Zucchinali, R. A cross comparative analysis of the US, German, and Italian healthcare system. In Globalization and Public Policy; Springer: Cham, Switzerland, 2015; pp. 93–119. [Google Scholar]
- Lister, J.; Labonté, R. 8 Globalization and Health Systems Change. In Globalization and Health: Pathways, Evidence and Policy; Routledge: Abingdon, UK, 2009. [Google Scholar]
- Kerem, K.; Puss, T.; Viies, M.; Maldre, R. Health and Convergence of Health Care Expenditure in EU. Int. Bus. Econ. Res. J. 2008, 7, 29–43. [Google Scholar] [CrossRef]
- Hitiris, T. Health care expenditure and integration in the countries of the European Union. Appl. Econ. 1997, 29, 1–6. [Google Scholar] [CrossRef]
- Krakowińska, E. Analiza wydatków na ochronę zdrowia w Polsce i w wybranych krajach Unii Europejskiej. Studia Mater. 2006, 1, 37–49. [Google Scholar]
- Skrzypczak, Z.; Rogoś, E. Nakłady na Ochronę Zdrowia a Kondycja Zdrowotna Społeczeństwa w Krajach Unii Europejskiej; Studia Europejskie/Centrum Europejskie Uniwersytetu Warszawskiego: Warsaw, Poland, 2007; Volume 2, pp. 167–197. [Google Scholar]
- Wasiak, A.; Szeląg, P. Wydatki na ochronę zdrowia w Polsce na tle krajów Unii Europejskiej w latach 2007–2011. Finans. Prawo Finans. 2015, 2, 67–85. [Google Scholar]
- Leśniowska-Gontarz, M. Wzrost wydatków na ochronę zdrowia a perspektywa rozwoju prywatnego sektora opieki zdrowotnej, Prace Naukowe Akademii im. Jana Długosza w Częstochowie. Pragmata Oikonomias 2017, 1, 37–51. [Google Scholar] [CrossRef]
- Hitiris, T.; Posnett, J. The determinants and effects of health expenditure in developed countries. J. Health Econ. 1992, 11, 173–181. [Google Scholar] [CrossRef]
- Zweifel, P.; Felder, S.; Meiers, M. Ageing of population and health care expenditure: A red herring? Health Econ. 1999, 8, 485–496. [Google Scholar] [CrossRef]
- Payne, G.; Laporte, A.; Deber, R.; Coyte, P.C. Counting backward to health care’s future: Using time-to-death modeling to identify changes in end-of-life morbidity and the impact of aging on health care expenditures. Milbank Q. 2007, 85, 213–257. [Google Scholar] [CrossRef] [Green Version]
- Baltagi, B.H.; Moscone, F. Health care expenditure and income in the OECD reconsidered: Evidence from panel data. Econ. Model. 2010, 27, 804–811. [Google Scholar] [CrossRef] [Green Version]
- de Meijer, C.; Wouterse, B.; Polder, J.; Koopmanschap, M. The effect of population aging on health expenditure growth: A critical review. Eur. J. Ageing 2013, 10, 353–361. [Google Scholar] [CrossRef] [Green Version]
- Khan, J.A.; Mahumud, R.A. Is healthcare a ‘Necessity’or ‘Luxury’? An empirical evidence from public and private sector analyses of South-East Asian countries? Health Econ. Rev. 2015, 5, 3. [Google Scholar] [CrossRef] [Green Version]
- Fazaeli, A.A.; Ghaderi, H.; Salehi, M.; Fazaeli, A.R. Health care expenditure and GDP in oil exporting countries: Evidence from OPEC data, 1995–2012. Glob. J. Health Sci. 2016, 8, 93. [Google Scholar] [CrossRef] [Green Version]
- Baltagi, B.H.; Moscone, F.; Santos, R. Spatial health econometrics. Health Econ. 2018, 294, 13. [Google Scholar]
- Apergis, N.; Bhattacharya, M.; Hadhri, W. Health care expenditure and environmental pollution: A cross-country comparison across different income groups. Environ. Sci. Pollut. Res. 2020, 27, 8142–8156. [Google Scholar] [CrossRef] [PubMed]
- Pearce, D.; Markandya, A.; Barbier, E. Blueprint for a Green Economy; Routledge: London, UK, 1989. [Google Scholar]
- Ciegis, R.; Ramanauskiene, J.; Martinkus, B. The Concept of Sustainable Development and its Use for Sustainability Scenarios. Eng. Econ. 2009, 62, 28. [Google Scholar]
- Kieny, M.P.; Bekedam, H.; Dovlo, D.; Fitzgerald, J.; Habicht, J.; Harrison, G.; Siddiqi, S. Strengthening health systems for universal health coverage and sustainable development. Bull. World Health Organ. 2017, 95, 537. [Google Scholar] [CrossRef] [PubMed]
- World Health Organization. A Vision for Primary Health Care in the 21st Century: Towards Universal Health Coverage and the Sustainable Development Goals; No. WHO/HIS/SDS/2018.15; World Health Organization: Geneva, Switzerland, 2018. [Google Scholar]
- Hone, T.; Macinko, J.; Millett, C. Revisiting Alma-Ata: What is the role of primary health care in achieving the Sustainable Development Goals? Lancet 2018, 392, 1461–1472. [Google Scholar] [CrossRef]
- Adshead, F.; Thorpe, A.; Rutter, J. Sustainable development and public health: A national perspective. Public Health 2006, 120, 1102–1105. [Google Scholar] [CrossRef]
- Seke, K.; Petrovic, N.; Jeremic, V.; Vukmirovic, J.; Kilibarda, B.; Martic, M. Sustainable development and public health: Rating European countries. BMC Public Health 2013, 13, 77. [Google Scholar] [CrossRef] [Green Version]
- Mackay, R.; Wolbring, G. Sustainable consumption of healthcare: Linking sustainable consumption with sustainable healthcare and health consumer discourses. In Proceedings of the 3rd World Sustainability Forum, Basel, Switzerland, 27−30 November 2013; pp. 1–30. [Google Scholar]
- Moyano-Santiago, M.Á.; Rivera-Lirio, J.M. Sustainability of the public health service in Spain: An approach to governance. Int. Arch. Med. 2015, 8. [Google Scholar] [CrossRef] [Green Version]
- DiMatteo, L. The sustainability of public health expenditures: Evidence from the Canadian federation. Eur. J. Health Econ. 2010, 11, 569–584. [Google Scholar] [CrossRef]
- Dixon, P.M.; Weiner, J.; Mitchell-Olds, T.; Woodley, R. Erratum to ‘Bootstrapping the Gini Coefficient of Inequality. Ecology 1988, 69, 1307. [Google Scholar] [CrossRef]
- Dagum, C. The Generation and Distribution of Income, the Lorenz Curve and the Gini Ratio. Econ. Appliquée 1980, 33, 327–367. [Google Scholar]
- Starzyńska, W. Statystyka Praktyczna; Wydawnictwo Naukowe PWN: Warsaw, Poland, 2002; p. 102. [Google Scholar]
- Jajuga, K.; Walesiak, M. Remarks on the Dependence Measures and the Distance Measures. In Klasyfikacja i Analiza Danych—Teoria i Zastosowania; Walesiak, M., Jajuga, K., Eds.; Prace Naukowe Akademii Ekonomicznej we Wrocławiu nr 1022; AE: Wroclaw, Poland, 2004; pp. 348–354. [Google Scholar]
- Cohen, J.; Cohen, P.; West, S.G.; Aiken, L.S. Applied Multiple Regression/Correlation Analysis for the Behavioral Sciences; Routledge: Abingdon, UK, 2013. [Google Scholar]
- Atkinson, A.B. The Economics of Inequality; Clarendon Press: Oxford, UK, 1983; pp. 46–59. [Google Scholar]
- Lorenz, M.O. Methods of Measuring the Concentration of Wealth. Publ. Am. Stat. Assoc. 1905, 9, 209–219. [Google Scholar] [CrossRef]
- Stanisławek, J. Podstawy Statystyki; Oficyna Wydawnicza Politechniki Warszawskiej: Warszawa, Poland, 2010. [Google Scholar]
- Skarżyński, M. Wpływ kryzysu gospodarczego na bezpieczeństwo zdrowia publicznego w UE. Prz. Politol. 2013, 1, 105–117. [Google Scholar] [CrossRef]
- Ifanti, A.A.; Argyriou, A.A.; Kalofonou, F.H.; Kalofonos, H.P. Financial crisis and austerity measures in Greece: Their impact on health promotion policies and public health care. Health Policy 2013, 113, 8–12. [Google Scholar] [CrossRef] [PubMed]
- Adshead, F.; Rao, M. Sustainable development—A national perspective. In Progress in Sustainable Development Research; Nova Publishers: New York, NY, USA, 2008. [Google Scholar]
- Hozarmoghadam, N.; Sahabi, B.; Ahmadi, A.M.; Mahmoudi, V. Classification of health indicators affecting human development index: A cross-country study. J. Res. Health 2017, 7, 1030–1038. [Google Scholar]
- McKeever, R. Measuring Human Development in the United States. Soc. Sci. J. 2017, 2, 1–20. [Google Scholar]
- Dumuid, D.; Maher, C.; Lewis, L.K.; Stanford, T.E.; Fernández, J.A.M.; Ratcliffe, J.; Hu, G. Human development index, children’s health-related quality of life and movement behaviors: A compositional data analysis. Qual. Life Res. 2018, 27, 1473–1482. [Google Scholar] [CrossRef]
- Viruell-Fuentes, E.A.; Miranda, P.Y.; Abdulrahim, S. More than culture: Structural racism, intersectionality theory, and immigrant health. Soc. Sci. Med. 2012, 75, 2099–2106. [Google Scholar] [CrossRef]
- Hernández-Quevedo, C.; Masseria, C.; Mossialos, E. Analysing the Socioeconomic Determinants of Health in Europe: New Evidence from the Eu-Silc. Eurostat Methodologies and Working Papers; European Union: Luxembourg, 2010. [Google Scholar]
- Hunter, D.J.; Popay, J.; Tannahill, C.; Whitehead, M.; Elson, T. Learning lessons from the past: Shaping a different future. Marmot Rev. Work. Comm. 2009, 3, 1–11. [Google Scholar]
- Marmot, M.; Allen, J.J. Social Determinants of Health Equity. Am. J. Public Health 2014, 104, S517–S519. [Google Scholar] [CrossRef]
- Strzelecka, A. The Analysis of Public Health Care Expenditure in the Selected EU Countries as the Basis of the Decision Making Process in the Common Health Policy. In Proceedings of the 3rd International Conference on European Integration, Galati, Romania, 20–21 May 2016; pp. 908–917. [Google Scholar]
- Strzelecka, A. Tendencies of Public Health Care Expenditure-Assistance in Health Care Management in Eu Regions. In Proceedings of the Economic and Social Development: Book of Proceedings, Belgrade, Serbia, 23–24 May 2019; pp. 9–19. [Google Scholar]
- Rutkowska-Podołowska, M.; Popławski, Ł.; Zaleska-Tsitini, M. Health care policy in Poland and in selected European Union countries: Attempts at reducing fast increasing medical care costs. Zesz. Nauk. Małopolskiej Wyższej Szkoły Ekon. Tarn. 2011, 2, 131–139. [Google Scholar]
- Rechel, B. Funding for public health in Europe in decline? Health Policy 2019, 123, 21–26. [Google Scholar] [CrossRef] [PubMed]
- Signorelli, C.; Odone, A.; Oradini-Alacreu, A.; Pelissero, G. Universal Health Coverage in Italy: Lights and shades of the Italian National Health Service which celebrated its 40th anniversary. Health Policy 2020, 124, 69–74. [Google Scholar] [CrossRef] [PubMed]
- La Torre, G.; Federici, A. How to not detonate the bomb: The case of the Italian National Health Service. Public Health 2017, 153, 178–180. [Google Scholar] [CrossRef]
- Atella, V.; Belotti, F.; Bojke, C.; Castelli, A.; Grašič, K.; Kopinska, J.; Mortari, A.P.; Street, A. How health policy shapes healthcare sector productivity? Evidence from Italy and UK. Health Policy 2019, 123, 27–36. [Google Scholar] [CrossRef]
- Kolwitz, M. The Polish healthcare system: Perspectives and possibilities for adoption of healthcare systems from other countries of the European Union. Ann. Acad. Med. Stetin. 2010, 56, 131–143. [Google Scholar]
- Kosycarz, E.A.; Nowakowska, B.A.; Mikołajczyk, M.M. Evaluating opportunities for successful public–private partnership in the healthcare sector in Poland. J. Public Health 2019, 27, 1–9. [Google Scholar] [CrossRef] [Green Version]
- Luengo-Fernandez, R.; Violato, M.; Candio, P.; Leal, J. Economic burden of stroke across Europe: A population-based cost analysis. Eur. Stroke J. 2020, 5, 17–25. [Google Scholar] [CrossRef]
- Grossman, M. On the concept of health capital and the demand for health. J. Political Econ. 1972, 80, 223–255. [Google Scholar] [CrossRef] [Green Version]
- Newhouse, J.P. Medical-care expenditure: A cross-national survey. J. Hum. Resour. 1977, 12, 115–125. [Google Scholar] [CrossRef]
- Schieber, G.J.; Poullier, J.P. International health care spending. Health Aff. 1986, 5, 111–122. [Google Scholar] [CrossRef] [PubMed] [Green Version]
- Hartwig, J. What drives health care expenditure?—Baumol’s model of ‘unbalanced growth’revisited. J. Health Econ. 2008, 27, 603–623. [Google Scholar] [CrossRef] [PubMed] [Green Version]
- Sülkü, S.N.; Caner, A. Health care expenditures and gross domestic product: The Turkish case. Eur. J. Health Econ. 2011, 12, 29–38. [Google Scholar] [CrossRef] [PubMed]
- Dupas, P.; Miguel, E. Impacts and determinants of health levels in low-income countries. In Handbook of Economic Field Experiments; North-Holland: Haarlem, The Netherlands, 2017; pp. 3–93. [Google Scholar]
- van den Heuvel, W.J.; Olaroiu, M. How important are health care expenditures for life expectancy? A comparative, European analysis. J. Am. Med. Dir. Assoc. 2017, 18, 276.e9–276.e12. [Google Scholar] [CrossRef]
- Spiteri, J.; von Brockdorff, P. Economic development and health outcomes: Evidence from cardiovascular disease mortality in Europe. Soc. Sci. Med. 2019, 224, 37–44. [Google Scholar] [CrossRef]
- Stepovic, M. GDP Growth and Health Care Expenditures Worldwide. Open Pharm. Health Econ. J. 2019, 7, 9–18. [Google Scholar] [CrossRef] [Green Version]
- Yetim, B.; İlgün, G.; Çilhoroz, Y.; Demirci, Ş.; Konca, M. The socioeconomic determinants of health expenditure in OECD: An examination on panel data. Int. J. Healthc. Manag. 2020, 7, 1–5. [Google Scholar] [CrossRef]
- Keegan, C.; Thomas, S.; Normand, C.; Portela, C. Measuring recession severity and its impact on healthcare expenditure. Int. J. Health Care Financ. Econ. 2013, 13, 139–155. [Google Scholar] [CrossRef]
- Nguyen, L.; Häkkinen, U.; Pekurinen, M.; Rosenqvist, G.; Mikkola, H. Determinants of Health Care Expenditure in a Decentralized Health Care System; National Institute for Health and Welfare: Helsinki, Finland, 2009; pp. 1–27. [Google Scholar]
- Ke, X.; Saksena, P.; Holly, A. The Determinants of Health Expenditure: A Country-Level Panel Data Analysis; World Health Organization: Geneva, Switzerland, 2011; Volume 26, pp. 1–28. [Google Scholar]
- Han, K.; Cho, M.; Chun, K. Determinants of health care expenditures and the contribution of associated factors: 16 cities and provinces in Korea, 2003–2010. J. Prev. Med. Public Health 2013, 46, 300. [Google Scholar] [CrossRef]
- Samadi, A.; Rad, E.H. Determinants of healthcare expenditure in Economic Cooperation Organization (ECO) countries: Evidence from panel cointegration tests. Int. J. Health Policy Manag. 2013, 1, 63. [Google Scholar] [CrossRef]
- Rezaei, S.; Fallah, R.; Karyani, A.K.; Daroudi, R.; Zandiyan, H.; Hajizadeh, M. Determinants of healthcare expenditures in Iran: Evidence from a time series analysis. Med. J. Islamic Repub. Iran 2016, 30, 313. [Google Scholar]
- Zhou, L.; Ampon-Wireko, S.; Antwi, H.A.; Xu, X.; Salman, M.; Antwi, M.O.; Afua, T.M.N. An empirical study on the determinants of health care expenses in emerging economies. BMC Health Serv. Res. 2020, 20, 1–16. [Google Scholar] [CrossRef] [PubMed]
- Barros, P.P. The black box of health care expenditure growth determinants. Health Econ. 1998, 7, 533–544. [Google Scholar] [CrossRef] [Green Version]
- Nixon, J. Convergence Analysis of Health Care Expenditure in the EU Countries Using Two Approaches. The University of York Discussion Papers in Economics No. 1999/03. 1999. Available online: https://www.york.ac.uk/media/economics/documents/discussionpapers/1999/9903.pdf (accessed on 3 October 2020).
- Hitiris, T.; Nixon, J. Convergence of health care expenditure in the EU countries. Appl. Econ. Lett. 2001, 8, 223–228. [Google Scholar] [CrossRef]
- Narayan, P.K. Do health expenditures ‘catch-up’? Evidence from OECD countries. Health Econ. 2007, 16, 993–1008. [Google Scholar] [CrossRef]
- Panopoulou, E.; Pantelidis, T. Convergence in per capita health expenditures and health outcomes in the OECD countries. Appl. Econ. 2012, 44, 3909–3920. [Google Scholar] [CrossRef]
- Lau, C.K.M.; Fung, K.W.T.; Pugalis, L. Is health care expenditure across Europe converging? Findings from the application of a nonlinear panel unit root test. Eurasian Bus. Rev. 2014, 4, 137–156. [Google Scholar] [CrossRef]
- Pekkurnaz, D. Convergence of Health Expenditure in OECD Countries: Evidence from a Nonlinear Asymmetric Heterogeneous Panel Unit Root Test. J. Rev. Glob. Econ. 2015, 4, 76–86. [Google Scholar] [CrossRef] [Green Version]
Figure 1.
Lorenz concentration curve for healthcare expenditure in EU countries in 2017. Source: Own study based on Eurostat.
Figure 1.
Lorenz concentration curve for healthcare expenditure in EU countries in 2017. Source: Own study based on Eurostat.

Figure 2.
The share of healthcare expenditure in GDP in EU countries in 2017. Source: Own study based on Eurostat.
Figure 2.
The share of healthcare expenditure in GDP in EU countries in 2017. Source: Own study based on Eurostat.


Table 1.
Share of individual countries in healthcare expenditure in the EU in 2013–2017.
| Countries | Share of Countries in Healthcare Expenditure in Years (%) | ||||
|---|---|---|---|---|---|
| 2013 | 2014 | 2015 | 2016 | 2017 | |
| Germany | 22.83 | 22.98 | 23.04 | 23.75 | 24.38 |
| France | 17.89 | 17.75 | 17.17 | 17.32 | 17.18 |
| Great Britain | 14.97 | 15.92 | 17.24 | 15.74 | 14.90 |
| Italy | 10.62 | 10.43 | 10.12 | 10.13 | 10.10 |
| Spain | 6.84 | 6.68 | 6.71 | 6.78 | 6.85 |
| Netherlands | 5.17 | 5.06 | 4.86 | 4.93 | 4.92 |
| Sweden | 3.57 | 3.44 | 3.37 | 3.43 | 3.46 |
| Belgium | 3.01 | 2.97 | 2.88 | 2.95 | 3.00 |
| Austria | 2.46 | 2.46 | 2.43 | 2.51 | 2.54 |
| Denmark | 1.94 | 1.93 | 1.90 | 1.94 | 1.96 |
| Poland | 1.86 | 1.83 | 1.86 | 1.87 | 1.85 |
| Ireland | 1.37 | 1.34 | 1.31 | 1.36 | 1.40 |
| Finland | 1.43 | 1.39 | 1.39 | 1.38 | 1.36 |
| Portugal | 1.14 | 1.11 | 1.10 | 1.14 | 1.15 |
| Greece | 1.12 | 1.01 | 0.98 | 0.99 | 0.96 |
| Czech Republic | 0.91 | 0.86 | 0.83 | 0.85 | 0.92 |
| Romania | 0.55 | 0.54 | 0.54 | 0.57 | 0.64 |
| Hungary | 0.55 | 0.53 | 0.53 | 0.55 | 0.56 |
| Slovakia | 0.41 | 0.37 | 0.37 | 0.38 | 0.38 |
| Bulgaria | 0.24 | 0.26 | 0.25 | 0.27 | 0.28 |
| Slovenia | 0.22 | 0.23 | 0.23 | 0.23 | 0.23 |
| Croatia | 0.21 | 0.21 | 0.21 | 0.21 | 0.22 |
| Luxembourg | 0.19 | 0.20 | 0.19 | 0.20 | 0.20 |
| Lithuania | 0.16 | 0.16 | 0.17 | 0.17 | 0.18 |
| Latvia | 0.09 | 0.09 | 0.09 | 0.11 | 0.11 |
| Estonia | 0.08 | 0.09 | 0.09 | 0.10 | 0.10 |
| Cyprus | 0.09 | 0.09 | 0.08 | 0.08 | 0.09 |
| Malta | 0.05 | 0.06 | 0.06 | 0.06 | 0.07 |
Source: Own study based on Eurostat.
Table 2.
Expenditures for healthcare per capita in EU countries in 2013–2017.
| Countries | Expenditures in Years (euro) | ||||
|---|---|---|---|---|---|
| 2013 | 2014 | 2015 | 2016 | 2017 | |
| Sweden | 5039 | 4972 | 5044 | 5123 | 5206 |
| Denmark | 4686 | 4790 | 4913 | 5014 | 5134 |
| Luxembourg | 4855 | 4975 | 4961 | 5009 | 5083 |
| Germany | 3831 | 3977 | 4138 | 4271 | 4459 |
| Ireland | 4002 | 4047 | 4095 | 4242 | 4395 |
| Austria | 3929 | 4042 | 4130 | 4248 | 4371 |
| Netherlands | 4160 | 4208 | 4205 | 4284 | 4346 |
| Belgium | 3646 | 3717 | 3749 | 3861 | 3992 |
| France | 3681 | 3751 | 3786 | 3844 | 3883 |
| Finland | 3554 | 3571 | 3718 | 3707 | 3742 |
| Great Britain | 3158 | 3455 | 3886 | 3553 | 3409 |
| Italy | 2385 | 2404 | 2445 | 2475 | 2523 |
| Malta | 1643 | 1830 | 1999 | 2076 | 2250 |
| Spain | 1985 | 2015 | 2121 | 2159 | 2221 |
| Slovenia | 1456 | 1552 | 1604 | 1660 | 1704 |
| Portugal | 1480 | 1501 | 1557 | 1632 | 1695 |
| Cyprus | 1452 | 1400 | 1425 | 1474 | 1528 |
| Greece | 1386 | 1304 | 1325 | 1356 | 1348 |
| Czech Republic | 1171 | 1139 | 1157 | 1193 | 1309 |
| Estonia | 863 | 933 | 1003 | 1072 | 1153 |
| Slovakia | 1031 | 970 | 999 | 1043 | 1052 |
| Lithuania | 726 | 773 | 834 | 900 | 963 |
| Hungary | 748 | 759 | 785 | 828 | 872 |
| Latvia | 612 | 647 | 702 | 794 | 829 |
| Croatia | 671 | 686 | 720 | 763 | 805 |
| Poland | 662 | 676 | 718 | 731 | 737 |
| Bulgaria | 453 | 504 | 518 | 556 | 591 |
| Romania | 374 | 380 | 400 | 432 | 494 |
| EU-28 | 2674 | 2760 | 2881 | 2899 | 2953 |
Source: Own study based on Eurostat.
Table 3.
Dynamics indicators for parameters related to healthcare expenditure in EU countries.
| Countries | Dynamics Indicators in 2013–2017 | |||||||||
|---|---|---|---|---|---|---|---|---|---|---|
| Total Expenditures | Expenditure per Capita | |||||||||
| Previous Year = 100 | 2013 = 100 | Previous Year = 100 | 2013 = 100 | |||||||
| 2014 | 2015 | 2016 | 2017 | 2013–2017 | 2014 | 2015 | 2016 | 2017 | 2013–2017 | |
| Malta | 114 | 112 | 106 | 111 | 150 | 111 | 109 | 104 | 108 | 137 |
| Estonia | 108 | 107 | 107 | 108 | 133 | 108 | 107 | 107 | 108 | 134 |
| Latvia | 105 | 108 | 112 | 103 | 131 | 106 | 108 | 113 | 104 | 135 |
| Romania | 101 | 105 | 107 | 114 | 130 | 102 | 105 | 108 | 114 | 132 |
| Bulgaria | 111 | 102 | 107 | 106 | 127 | 111 | 103 | 107 | 106 | 130 |
| Lithuania | 106 | 107 | 106 | 106 | 127 | 106 | 108 | 108 | 107 | 133 |
| Germany | 104 | 105 | 104 | 105 | 119 | 104 | 104 | 103 | 104 | 116 |
| Slovenia | 107 | 103 | 104 | 103 | 117 | 107 | 103 | 104 | 103 | 117 |
| Croatia | 102 | 104 | 105 | 104 | 116 | 102 | 105 | 106 | 106 | 120 |
| Austria | 104 | 103 | 104 | 104 | 115 | 103 | 102 | 103 | 103 | 111 |
| Hungary | 101 | 103 | 105 | 105 | 115 | 102 | 103 | 105 | 105 | 117 |
| Luxembourg | 105 | 102 | 103 | 104 | 115 | 102 | 100 | 101 | 101 | 105 |
| Ireland | 102 | 102 | 105 | 105 | 114 | 101 | 101 | 104 | 104 | 110 |
| Portugal | 101 | 103 | 104 | 104 | 113 | 101 | 104 | 105 | 104 | 115 |
| Czech Republic | 97 | 102 | 103 | 110 | 113 | 97 | 102 | 103 | 110 | 112 |
| Denmark | 103 | 103 | 103 | 103 | 112 | 102 | 103 | 102 | 102 | 110 |
| Spain | 101 | 105 | 102 | 103 | 112 | 102 | 105 | 102 | 103 | 112 |
| EU-28 | 104 | 105 | 101 | 102 | 112 | 103 | 104 | 101 | 102 | 110 |
| Belgium | 102 | 101 | 104 | 104 | 112 | 102 | 101 | 103 | 103 | 109 |
| Poland | 102 | 106 | 102 | 101 | 111 | 102 | 106 | 102 | 101 | 111 |
| Great Britain | 110 | 113 | 92 | 97 | 111 | 109 | 112 | 91 | 96 | 108 |
| Sweden | 100 | 103 | 103 | 103 | 108 | 99 | 101 | 102 | 102 | 103 |
| France | 103 | 101 | 102 | 101 | 107 | 102 | 101 | 102 | 101 | 105 |
| Finland | 101 | 104 | 100 | 101 | 107 | 101 | 104 | 100 | 101 | 105 |
| Netherlands | 102 | 100 | 102 | 102 | 107 | 101 | 100 | 102 | 101 | 104 |
| Italy | 102 | 102 | 101 | 102 | 106 | 101 | 102 | 101 | 102 | 106 |
| Cyprus | 95 | 101 | 104 | 105 | 105 | 96 | 102 | 103 | 104 | 105 |
| Slovakia | 94 | 103 | 105 | 101 | 102 | 94 | 103 | 104 | 101 | 102 |
| Greece | 93 | 101 | 102 | 99 | 95 | 94 | 102 | 102 | 99 | 97 |
Source: Own study based on Eurostat.
Table 4.
Pearson’s linear correlation coefficients between the value of healthcare expenditure and economy parameters.
Table 4.
Pearson’s linear correlation coefficients between the value of healthcare expenditure and economy parameters.
| Parameters | Pearson’s Linear Correlation Coefficients for Years | |||||||||||
|---|---|---|---|---|---|---|---|---|---|---|---|---|
| 2013 | 2014 | 2015 | 2016 | 2017 | 2013–2017 | |||||||
| Correlation coefficients between the value of healthcare expenditure | ||||||||||||
| r | p-value | r | p-value | r | p-value | r | p-value | r | p-value | r | p-value | |
| GDP value | 0.994 | 0.001 | 0.994 | 0.001 | 0.994 | 0.001 | 0.993 | 0.001 | 0.993 | 0.001 | 0.994 | 0.001 |
| value of GDP per capita | 0.229 | 0.242 | 0.230 | 0.239 | 0.225 | 0.249 | 0.202 | 0.302 | 0.187 | 0.341 | 0.215 | 0.011 |
| export value | 0.949 | 0.001 | 0.946 | 0.001 | 0.940 | 0.001 | 0.944 | 0.001 | 0.945 | 0.001 | 0.944 | 0.001 |
| import value | 0.966 | 0.001 | 0.966 | 0.001 | 0.965 | 0.001 | 0.964 | 0.001 | 0.964 | 0.001 | 0.963 | 0.001 |
| Correlation coefficients between the value of healthcare expenditure per capita | ||||||||||||
| r | p-value | r | p-value | r | p-value | r | p-value | r | p-value | r | p-value | |
| GDP value | 0.381 | 0.045 | 0.395 | 0.037 | 0.419 | 0.027 | 0.403 | 0.034 | 0.395 | 0.038 | 0.400 | 0.001 |
| value of GDP per capita | 0.905 | 0.001 | 0.899 | 0.001 | 0.893 | 0.001 | 0.888 | 0.001 | 0.884 | 0.001 | 0.893 | 0.001 |
| export value | 0.470 | 0.012 | 0.483 | 0.009 | 0.505 | 0.006 | 0.495 | 0.007 | 0.492 | 0.008 | 0.491 | 0.001 |
| import value | 0.466 | 0.012 | 0.484 | 0.009 | 0.509 | 0.006 | 0.500 | 0.007 | 0.491 | 0.008 | 0.492 | 0.001 |
Source: Own study based on Eurostat.
Table 5.
Verification of the level of fit of the regression model for total healthcare expenditure.
| Parameters | Coefficient | Std. Error | t-Ratio | p-Value |
|---|---|---|---|---|
| const | −37,180.4 | 3680.11 | −10.10 | 0.0628 |
| X1 | 0.112143 | 0.000401447 | 27.3 | 0.0023 |
| X3 | −7.63131 | 0.147743 | −51.65 | 0.0123 |
| X4 | 7.26564 | 0.144113 | 50.42 | 0.0126 |
| Mean dependent var | 1,442,939 | S.D. dependent var | 64,301.69 | |
| Sum squared resid | 12,833.36 | S.E. of regression | 113.2844 | |
| R-squared | 0.999999 | Adjusted R-squared | 0.999997 | |
| F(5, 9) | 429,578.8 | p-value(F) | 0.001122 | |
| Log-likelihood | −26.72061 | Akaike criterion | 61.44121 | |
| Schwarz criterion | 59.87896 | Hannan–Quinn | 57.24829 |
Table 6.
Verification the level of fit of the regression model for per capita spending on healthcare.
Table 6.
Verification the level of fit of the regression model for per capita spending on healthcare.
| Parameters | Coefficient | Std. Error | t-Ratio | p-Value |
|---|---|---|---|---|
| const | 542.554 | 83.2008 | 6.521 | 0.0073 |
| X1 | 0.000156986 | 0.000005696 | 27.56 | 0.0001 |
| Mean dependent var | 2833.369 | S.D. dependent var | 113.8891 | |
| Sum squared resid | 204.1051 | S.E. of regression | 8.248335 | |
| R-squared | 0.996066 | Adjusted R-squared | 0.994755 | |
| F(5, 9) | 759.5911 | p-value(F) | 0.000105 | |
| Log-likelihood | −16.36769 | Akaike criterion | 36.73537 | |
| Schwarz criterion | 35.95425 | Hannan–Quinn | 34.63891 |
Publisher’s Note: MDPI stays neutral with regard to jurisdictional claims in published maps and institutional affiliations. |
© 2020 by the authors. Licensee MDPI, Basel, Switzerland. This article is an open access article distributed under the terms and conditions of the Creative Commons Attribution (CC BY) license (http://creativecommons.org/licenses/by/4.0/).
Share and Cite
MDPI and ACS Style
Rokicki, T.; Perkowska, A.; Ratajczak, M. Differentiation in Healthcare Financing in EU Countries. Sustainability 2021, 13, 251. https://doi.org/10.3390/su13010251
AMA Style
Rokicki T, Perkowska A, Ratajczak M. Differentiation in Healthcare Financing in EU Countries. Sustainability. 2021; 13(1):251. https://doi.org/10.3390/su13010251
Chicago/Turabian StyleRokicki, Tomasz, Aleksandra Perkowska, and Marcin Ratajczak. 2021. "Differentiation in Healthcare Financing in EU Countries" Sustainability 13, no. 1: 251. https://doi.org/10.3390/su13010251
Note that from the first issue of 2016, this journal uses article numbers instead of page numbers. See further details here.