Variability of Seismic Loading over the Surface of a Concrete Slab in Interaction with the Subsoil


1
Department of Geotechnics and Underground Engineering, Faculty of Civil Engineering, VSB-Technical University of Ostrava, Ludvika Podeste 1875/17, 708 00 Ostrava-Poruba, Czech Republic
2
Department of Telecommunications, Faculty of Electrical Engineering and Computer Science, VSB-Technical University of Ostrava, 17. Listopadu 15, 708 33 Ostrava-Poruba, Czech Republic
*
Authors to whom correspondence should be addressed.
Sustainability 2020, 12(22), 9530; https://doi.org/10.3390/su12229530
Submission received: 22 September 2020
/
Revised: 9 November 2020
/
Accepted: 13 November 2020
/
Published: 16 November 2020
(This article belongs to the Special Issue Sustainable Construction and Building Materials for Environment)
Abstract
:This article is aimed at the analysis of the behavior of a fiber-reinforced concrete slab in contact with subsoil during dynamic loading in close proximity. The properties of such slabs are important for evaluating their dynamic response, though the properties of the subsoil environment through which the vibrations propagate must also be taken into account. The analysis itself was performed on the basis of the results obtained from experimental measurements during seismic excitation with a calibrated impact. There were three concrete slabs tested, with varying amounts of fiber. The standard Vistec seismic instrumentation was used for measuring the dynamic response. The results of the experiment were processed in both the amplitude and frequency domains, and a graphic comparison in the waveform and frequency fields was made. The results acquired from this experimental research may support a more objective approach during the evaluation of dynamic impacts ranging from anthropogenic impacts to building structures.
1. Introduction
Anthropogenic vibrations are generated in the surroundings of roads as well as train and tram lines [1,2,3]. These vibrations also occur in the vicinity of construction works [4,5,6,7,8]. From the source of the anthropogenic dynamic load, vibrations are transmitted through the rock mass and the foundation structure of the building to the superstructure. The most endangered by these vibrations are buildings on shallow raft foundations (these are the focus of the experimental study presented in this article) or on strip footings. Structures on deep foundations (piles) or footing foundations are much more resistant to vibrations [9,10]. In terms of load, when the given limit values are exceeded, these vibrations have a negative impact on the construction elements of the building themselves, which can lead to their damage. Vibrations also have negative impacts on inhabitants. Even vibrations that do not reach the limit values in the structures or do not exceed hygienic standards can have a very negative effect on, for example, sensitive devices or technology within the structure. Monitoring and limiting these vibrations can help to achieve the sustainable development of cities and the life within them.
Over the surface, the dynamic response of horizontal structural elements due to these vibrations (values of the oscillations’ velocity amplitude, the oscillations’ acceleration amplitude, and the frequency) can vary considerably [11]. Very often, these values are also considerably higher in different places, as opposed to the place of reference where the measurements are made according to standards.
Concrete slabs, as horizontal structural elements of buildings, are usually either simple (exceptionally) or reinforced. Fiber is one of the possible ways of reinforcing these concrete slabs. Fiber-reinforced concrete is a structural composite building material. It has a basic structure of plain concrete supplemented with fibers, which stiffen the structure of the composite and thus improve some of its properties (e.g., tensile strength and flexural tensile strength). The fibers can be composed of various materials, with various shapes and sizes. The use of fiber-reinforced concrete as an innovative material goes hand in hand with sustainable development in civil engineering [12,13].
The primary motivation for the experimental study presented in this article was an earlier experiment conducted on a reinforced concrete slab [14]. Surroundings were loaded with harmonic oscillations and the results showed a large variation of maximum amplitude values on the surface of a concrete slab. In contrast, in the frequency domain, a significant agreement was found between the dynamic response at the measuring stations and the source of oscillation. This publication presents a similar experiment (physical model) of the dynamic responses of a fiber-reinforced concrete slab with different percentages of fibers in interaction with the subsoil by using calibrated strike instead harmonic dynamic loading. The results of the experimental measurements are presented here in graphical form in both the amplitude and frequency domains.
The experiments and results presented in this article are part of extensive and long-term experimental and numerical research dealing with the interaction of the surface foundation with the subsoil, being conducted at the Faculty of Civil Engineering, VSB–TUO, across several work stations, as part of the research project GA16-08937S-State of stress and strain of fiber-reinforced composites in interaction with the soil environment [15,16,17,18,19,20].
2. Materials and Methods
The Gaia 2T or Gaia 3 seismic stations and ViGeo2 sensors (Vistec, Prague, Czech Republic) were utilized for the measurement of the dynamic response of the concrete slab. The Gaia station is an autonomous three-channel seismic station with a dynamic range of 138 dBp-p, synchronized with the help of GPS. It records data on a CompactFlash disk and has the ability to send text messages. It is intended for terrain measurements, that is, for short or long seismic experiments. It allows the direct connection of most active and passive sensors. SeisTools is a program used for setting parameters and checking activities. The station has three analog input channels. The signal from the sensor is fed via the “SENSOR” connector on the input of the differential amplifier, which converts the balanced input signal to unbalanced. The inputs are equipped with two-stage overvoltage protection. The time base is derived from a highly stable, temperature-compensated 20 MHz oscillator with a maximum error of 1 ppm in the temperature range of to +85 C. Each station is further calibrated at temperatures of 5, 25, and 45 C to achieve typical stability below 0.2 ppm in the range of 0 to 50 C. The oscillator is tuned every second, depending on the internal temperature. In order to achieve long-term high accuracy, the oscillator is synchronized with the GPS receiver. The GPS receiver is external, connected to the station using the RS 422 serial line. The length of the line between the receiver and the station can be up to 1 km. Communication with the GPS receiver is conducted using the Motorola binary format. The measured data are stored on CompactFlash (CF) disks. Disks with up to 2 GB storage can be used. The data storage is file-oriented, making it possible to work directly with the data after the disks are connected to the computer. There are three storage modes available. In the continuous mode, data are stored in files of a set length (e.g., 1 h), in the running mode, in the third mode, the recording is done in time slots. It is possible to enter up to one hundred recording time intervals. The data are stored in a directory which bears the name of the station and in the subdirectory of the current year. The measured data are also available in real time via a serial line. The station uses its own data format for this data output. The station has a total of three serial lines for communicating with the environment. Two RS 232 serial lines for connecting a computer and setting station parameters, real-time data transfers, firmware upgrades, and the connection of expansion modules; the third is used to connect a GSM modem and one RS 422 serial line for connecting a GPS receiver and, unlike the standard RS 422 serial line, is extended by a PPS signal and GPS power supply. The station’s power supply is adapted to the requirement of using common 12 V batteries and the need to supply the sensor from the station. The Gaia device contains a 2 Ah battery and an external charger. The second power option is to connect an external source. The station automatically switches between the internal and external sources of power supply depending on the voltage.
ViGeo2 is an active, three-component, short-period, speed seismometer for field and station use. The seismometer contains three mechanical oscillating systems (sensors) with a natural frequency of 2 Hz and a frequency range from 2 to 200 Hz.
SWIP (Seismic Waves Interpretation Program) was used to process the seismic data of both amplitude and frequency. It is supplied by Vistec Praha as the standard for all manufactured Gaia apparatuses. In the SWIP program, it is not possible to recalculate the values of the oscillation amplitudes per physical unit of velocity (mm s) in the amplitude domain. Therefore, in the waveform images, the vertical axes are plotted in quantization levels (cnt). For the conversion relationship for the ViGeo2 sensors we use: 1 cnt = 2975 × 10 mm s (more [21]).
A 10 kg drop weight falling from a height of 0.7 m onto a 5 kg circular slab with a contact surface diameter of 0.3 m was used as the source of the calibrated impact. The induced force pulse was 7.1 kN and the duration of the shock was 17 ms.
The presented experiment, conducted on the construction STAND in the premises of the Faculty of Civil Engineering, VSB–TUO (GPS coordinates 49.8454036N, 18.1543550E) focused on the dynamic behavior of three fiber-reinforced concrete slabs in contact with the subsoil. The basic dimensions of the slabs were m with a thickness of 0.15 m in C25/30 concrete. DRAMIX 3D 65/60 BG fibers (diameter 0.9 mm, length 60 mm and tensile strength 1160 MPa) were added to the concrete in the amount of 25 kg/m (for the slab marked G05), 50 kg/m (for the slab marked G06), and 75 kg/m (for the slab marked G07). See [15] for the specific parameters of the concrete composition and the results of the laboratory tests of concrete samples for individual slabs. The subsoil consisted of a 1.2 m thick homogenized layer of F4 clay without reaching the groundwater level [15]. The subsoil parameters, including the results of the field and laboratory tests, are given in Table 1. A static load plate test in-situ was used for the determination of the modulus, values of cohesion and friction angle were evaluated using a shear box test in the laboratory of soil mechanics (more [15]).
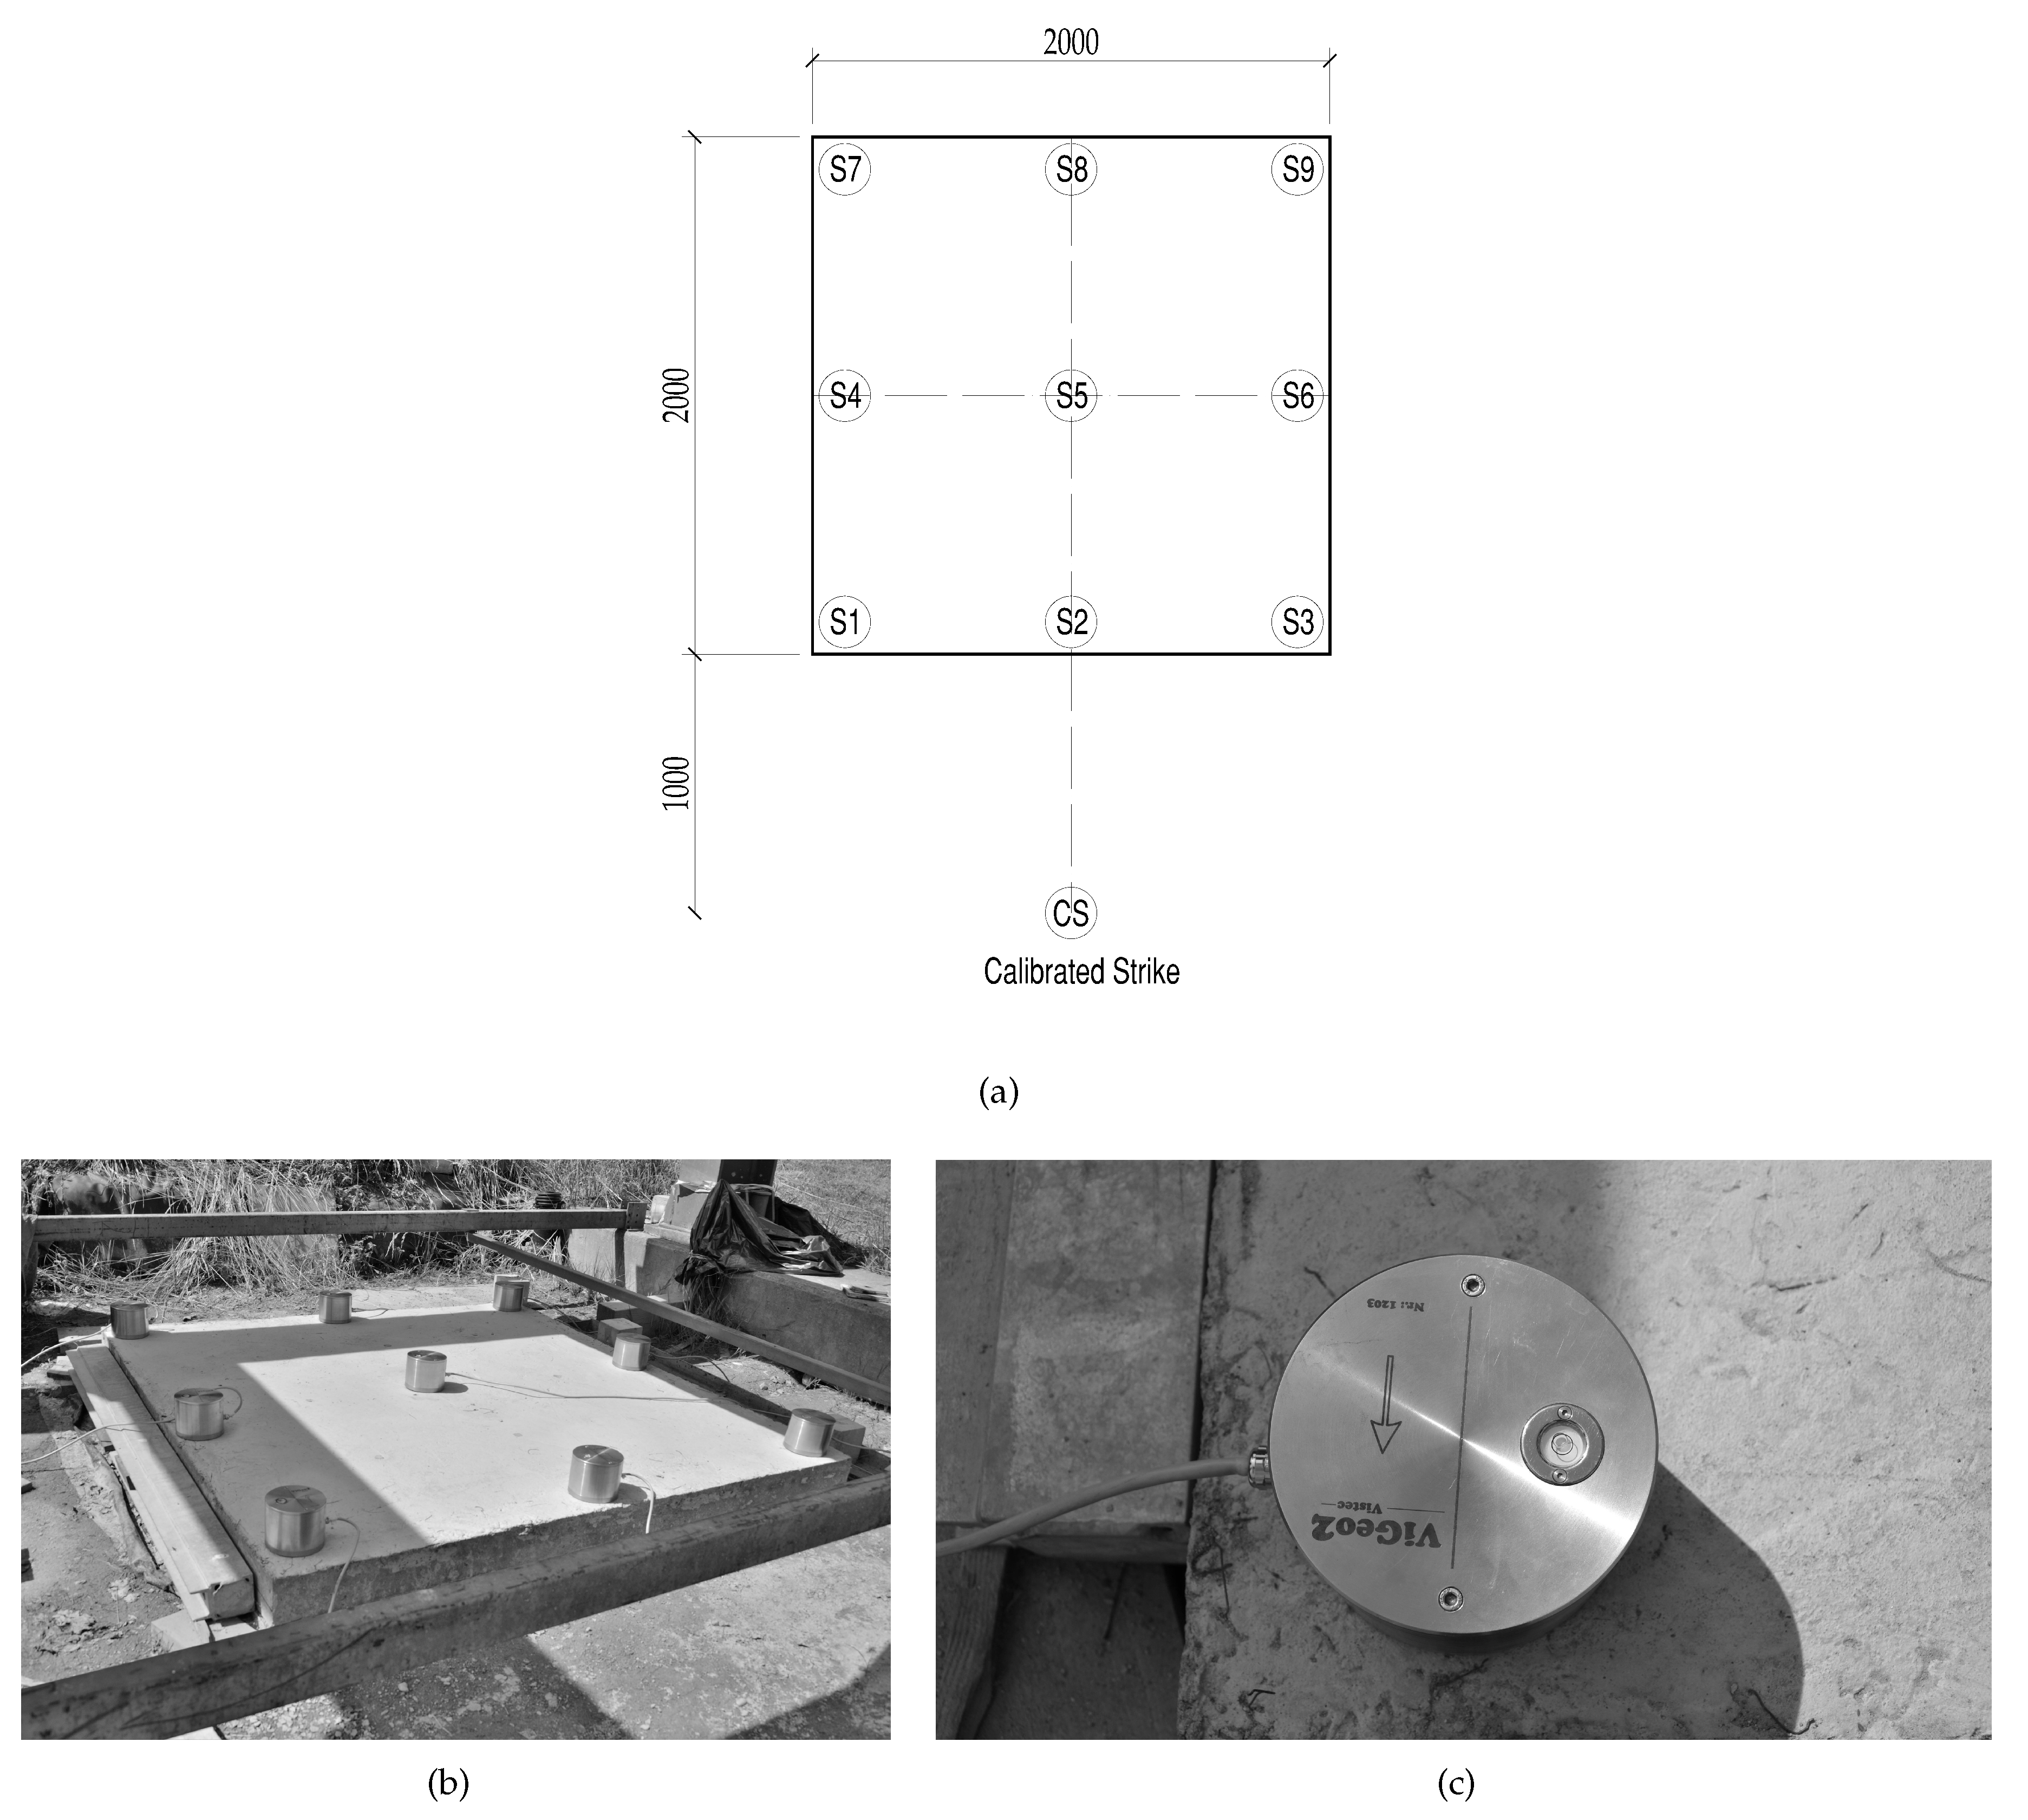
The actual experimental seismic measurement was performed one day before the loading experiment [15]. Nine seismic sensors were set up on the base slab and a dynamic load in the form of a calibrated impact was placed at a distance of one meter from the edge of the slab. Figure 1a is an arrangement diagram of the individual sensors of the slab surface, Figure 1b shows an in-situ experiment, and Figure 1c shows the placement of one of the nine sensors on a fiber-reinforced concrete slab (it is also possible to see the individual fibers of the scattered reinforcement in the concrete). Fifty load shocks were performed for each of the three slabs, that is, the results of the experiment are based on one hundred and fifty recorded seismic events.
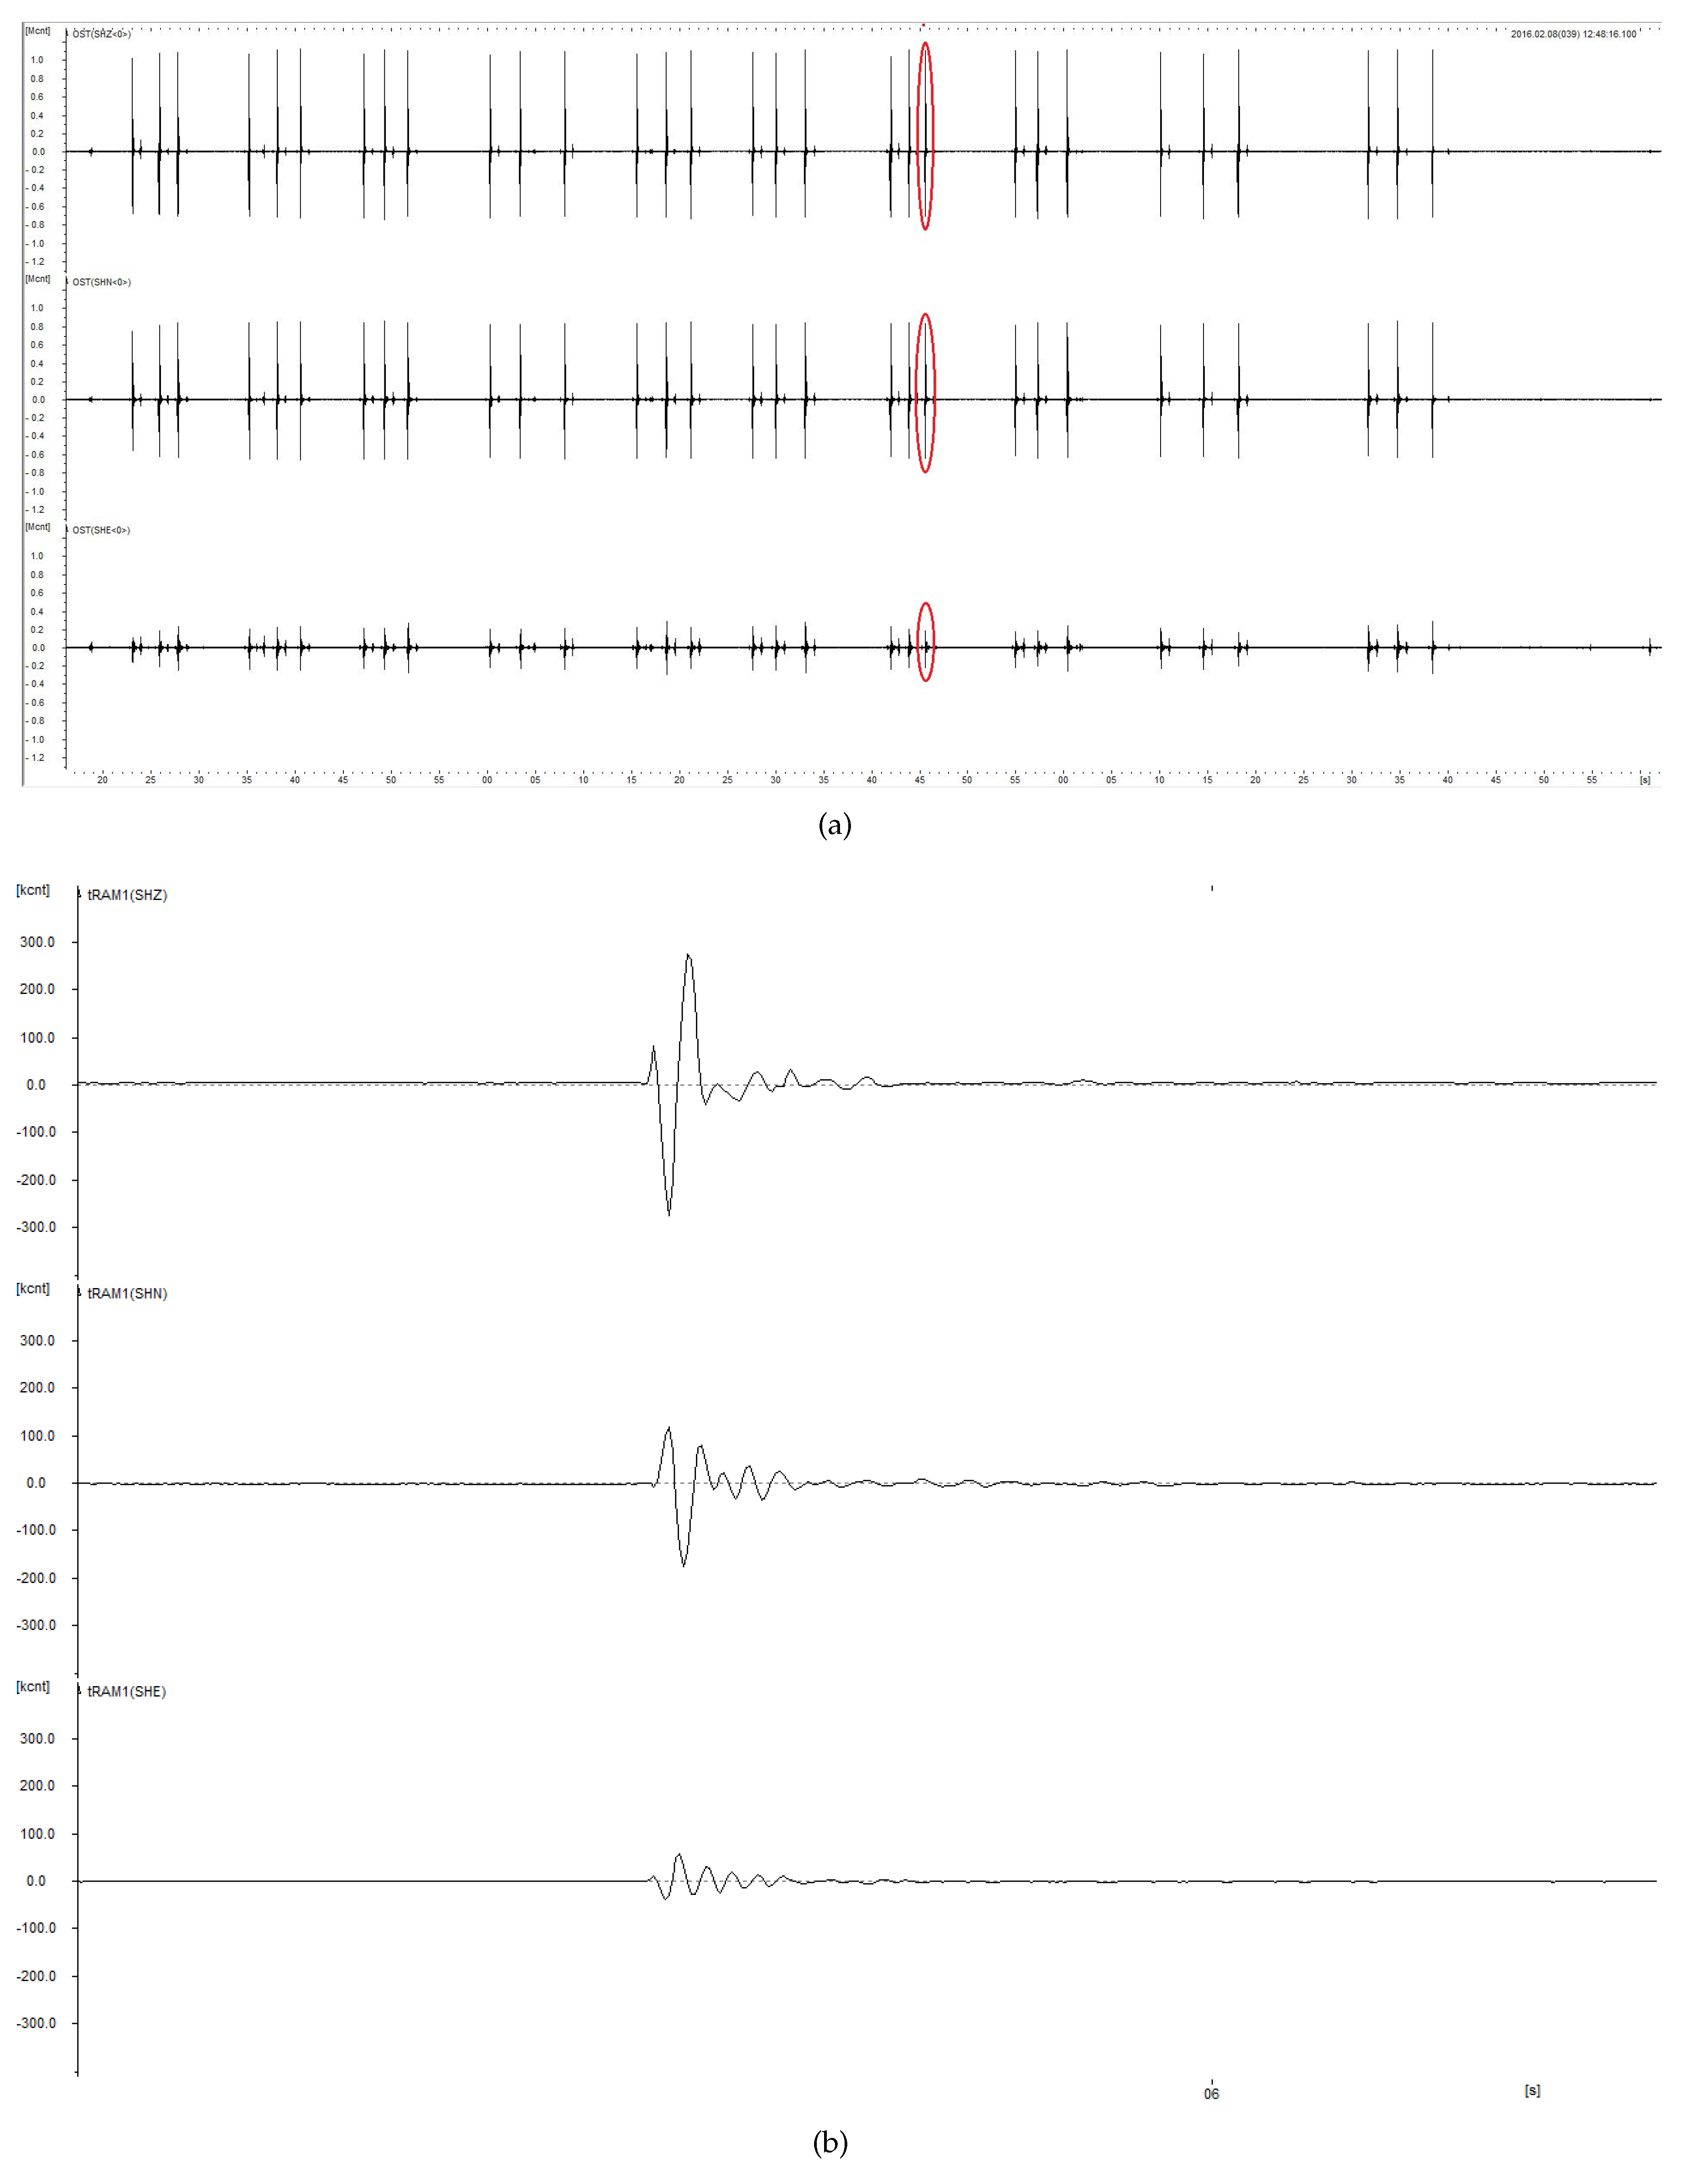
An example of a time record of the dynamic response of the G05 slab obtained from the S1 sensor (the first thirty shocks) is shown in Figure 2a, Figure 2b shows one strike in detail. On the vertical axis is the amplitude, and the horizontal axis is time. The record shows the vertical axis (SHZ), the horizontal radial axis (SHN), and the horizontal transverse axis (SHE) from top to bottom. Figure 3 shows an example of a spectrum processed for one particular strike (in this case the twenty-first) from the shown record (see Figure 2).
3. Results
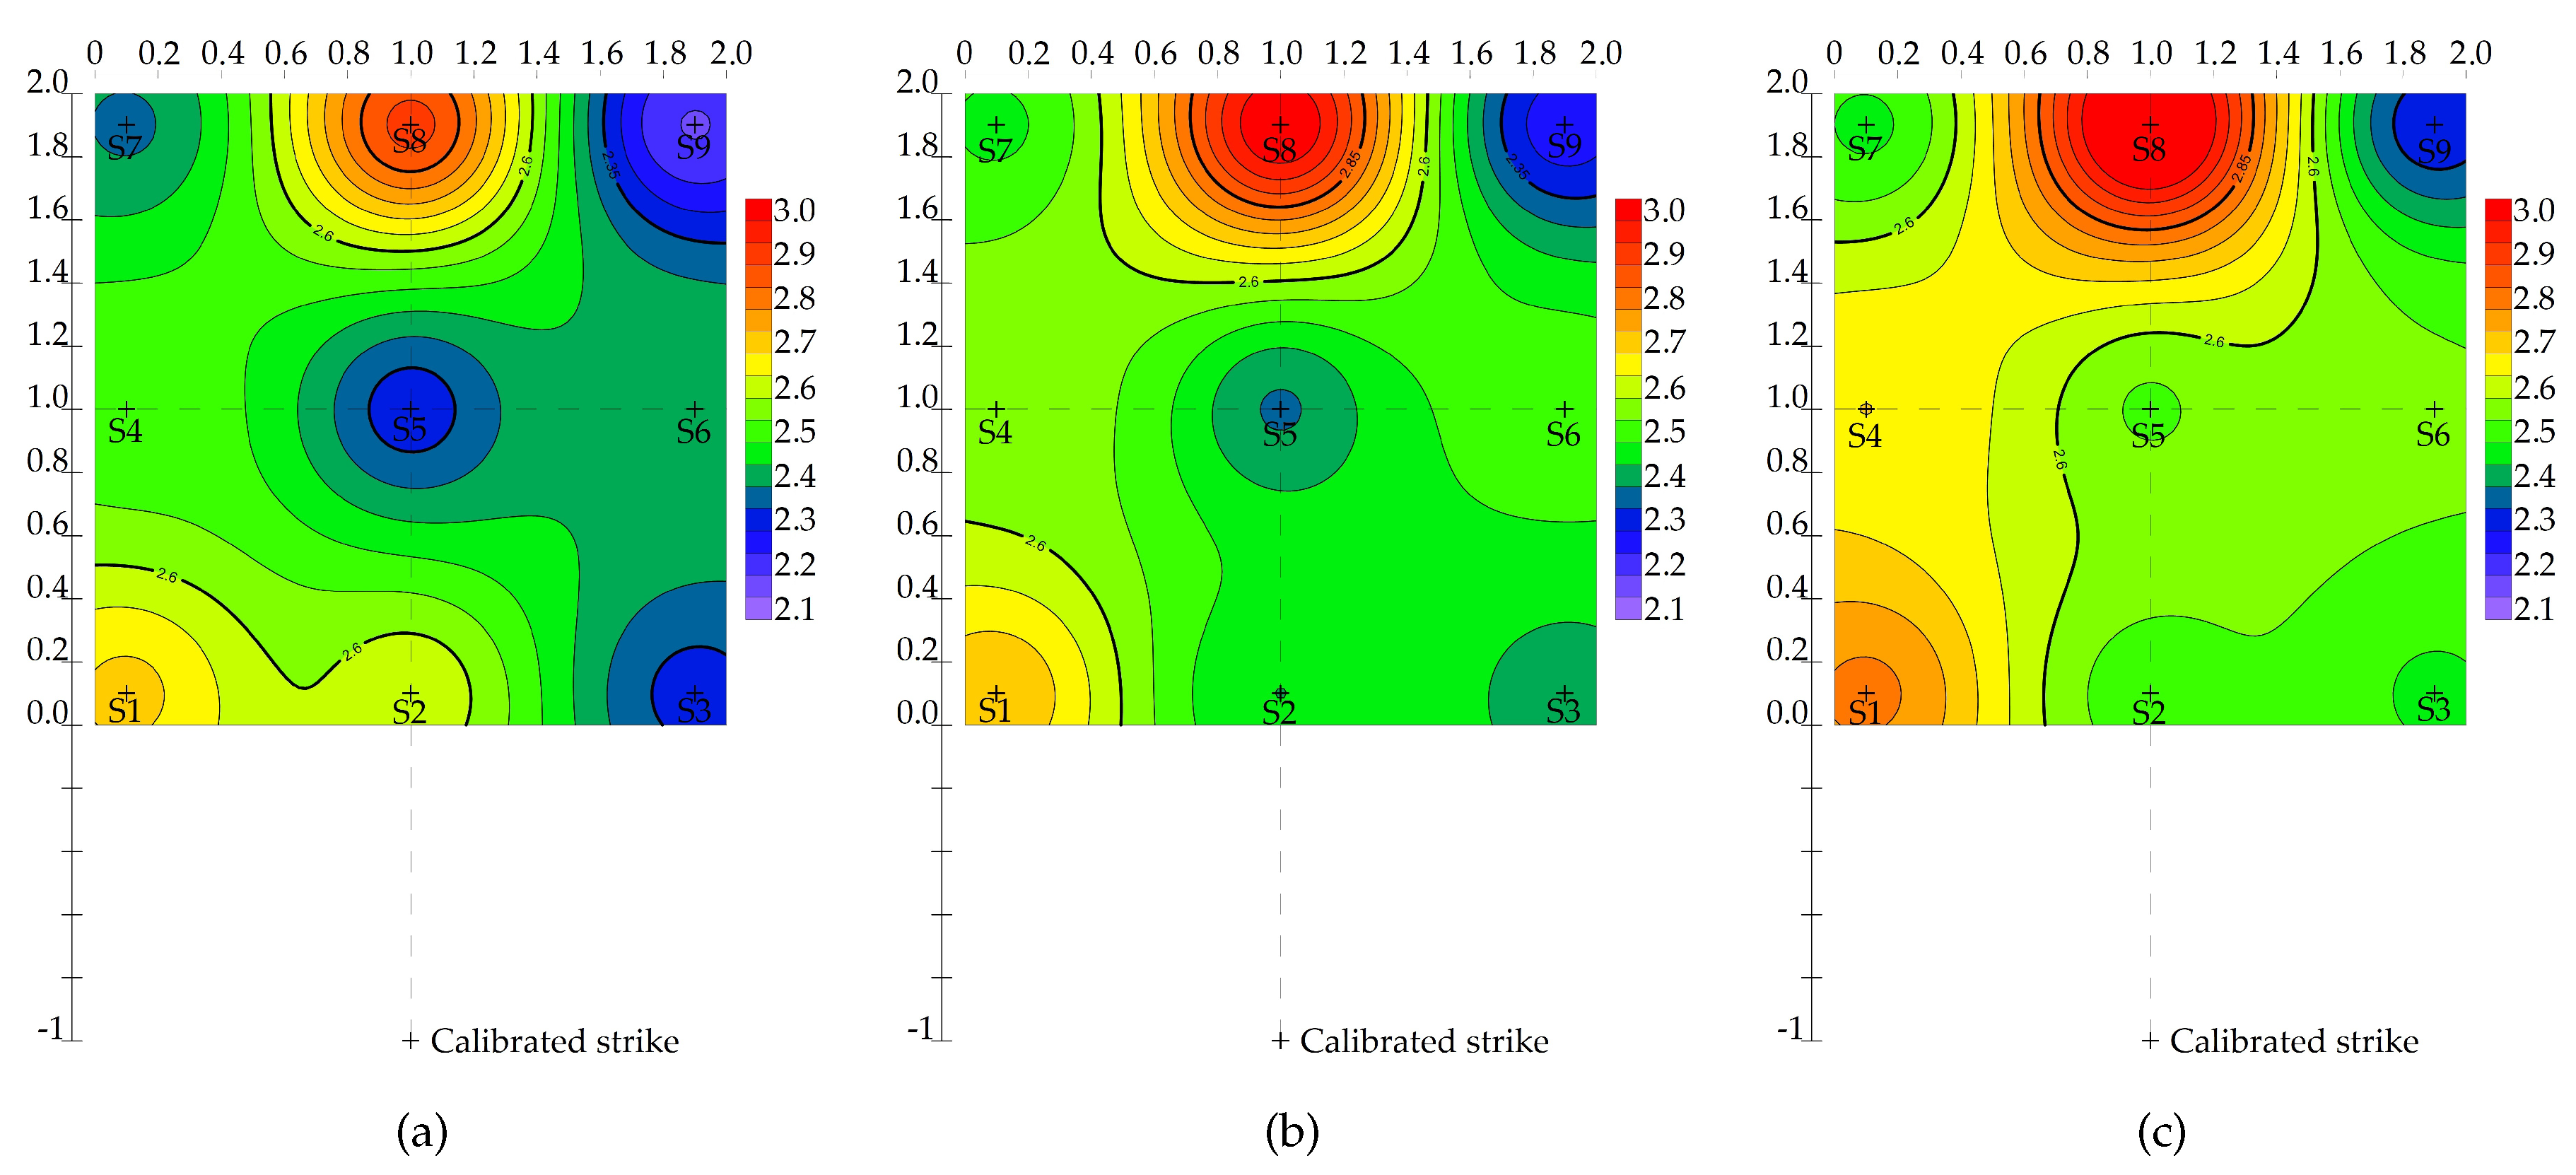
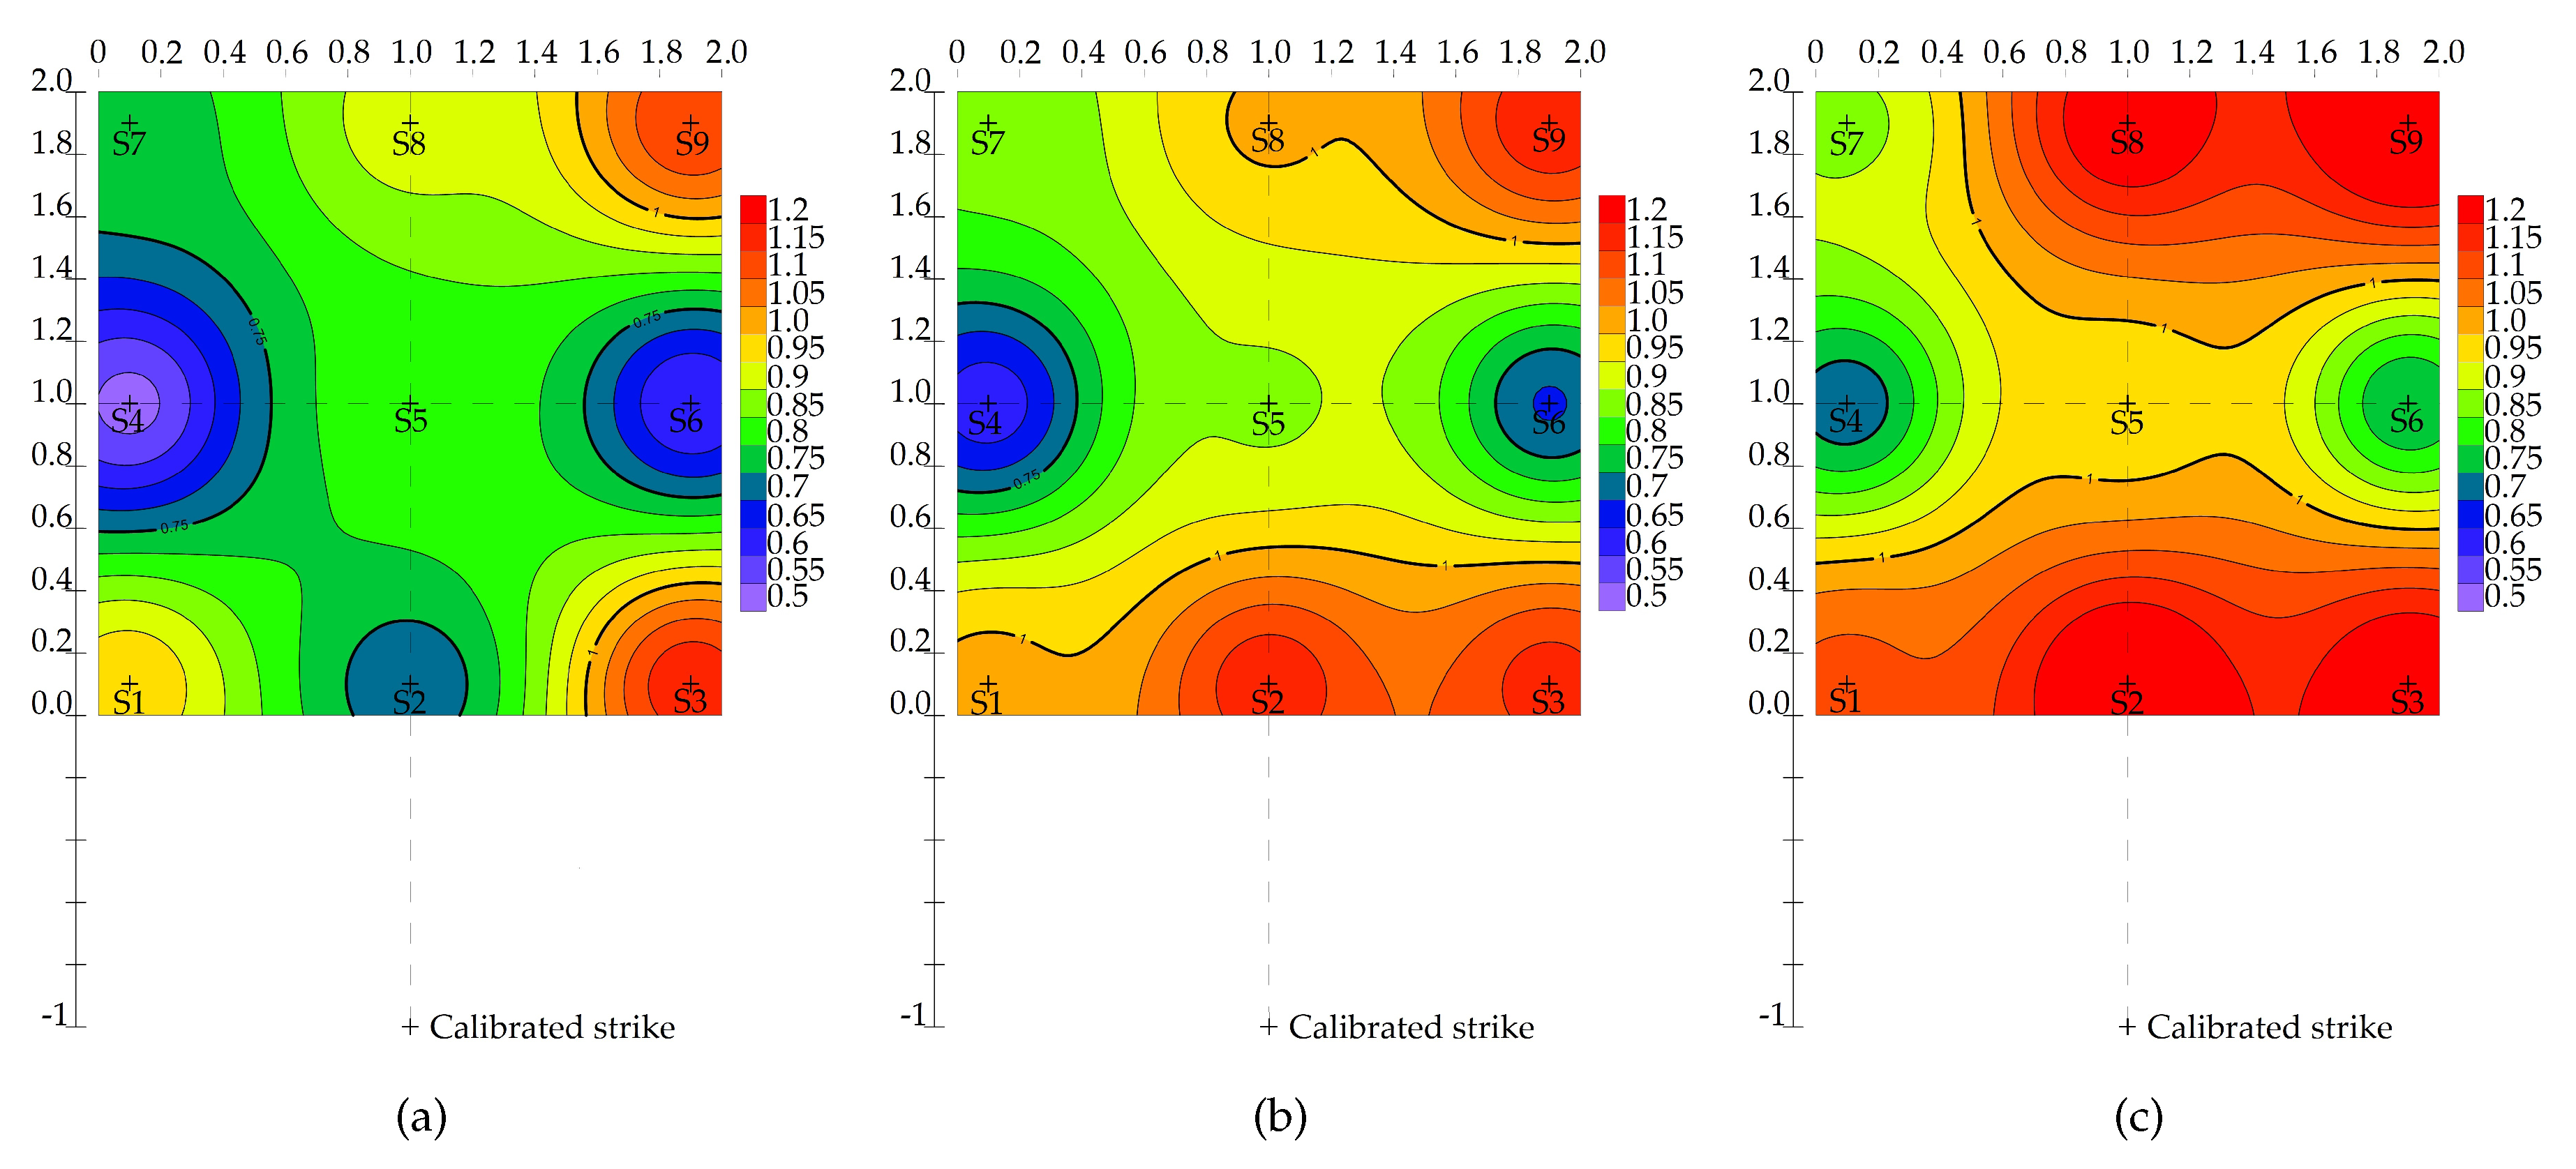
All the data from the three slabs G05, G06, and G07, nine sensors S1–S9, and fifty-five impacts were evaluated in both the amplitude and frequency domains. Wave and frequency fields were generated from the medians of the measured values using the Voxler3 program. The IDW inverse distance method was used to interpolate the intermediate data.
The values in the amplitude domain ranged from 1.4 mm s to 4.2 mm s for all three slabs for the vertical direction, from 2.1 mm s to 3.0 mm s for the horizontal radial direction, and from 0.5 mm s to 1.2 mm s for the horizontal transverse direction. The wave fields in Figure 4 (vertical direction), Figure 5 (horizontal radial direction), and Figure 6 (horizontal transverse direction) show considerable variability in the distribution of vibrations over the slab surface, but it is possible to trace common trends in all slabs for each direction. For the vertical direction, it is the frontal distribution of the maximum amplitudes of the oscillation velocity which significantly attenuate with increasing distance from the source of dynamic load. In the horizontal radial direction, on the other hand, the maxima were recorded at the greatest distance from the source, and only in the middle of the slabs. The results from the horizontal radial direction then show the maxima in both the front and rear of the slabs, with higher maxima being recorded in the right part. In general, the amplitudes of the oscillation velocities increased gradually from slab G05 to slab G07, that is, the dynamic response increased with a higher percentage of fiber in the concrete and thus a higher stiffness of the slab.
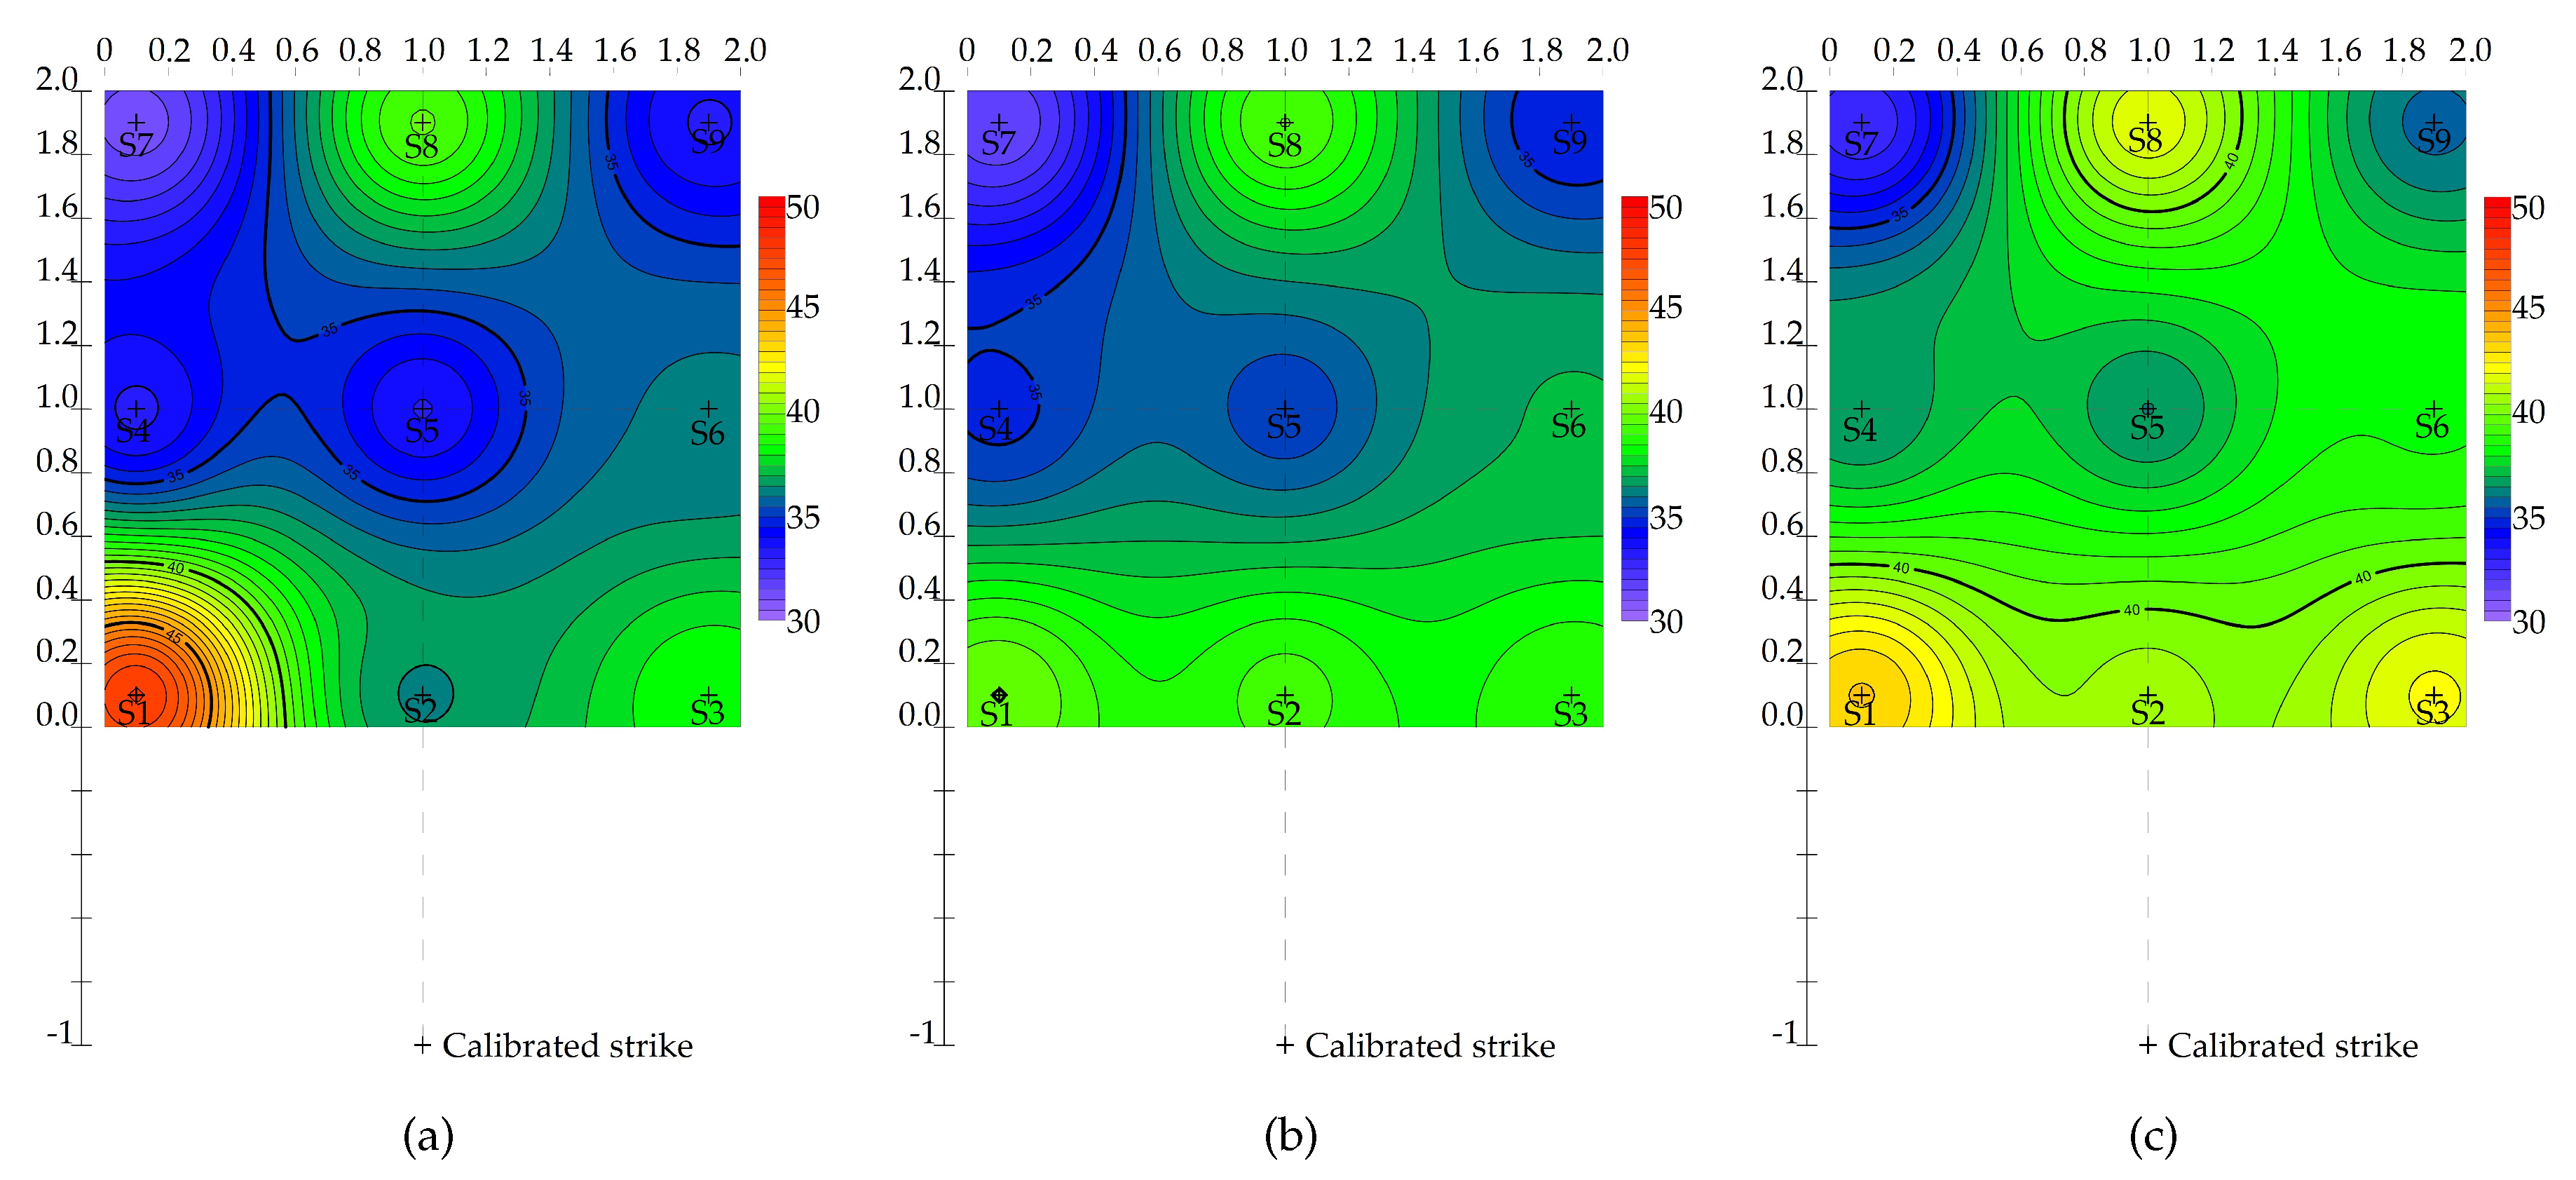
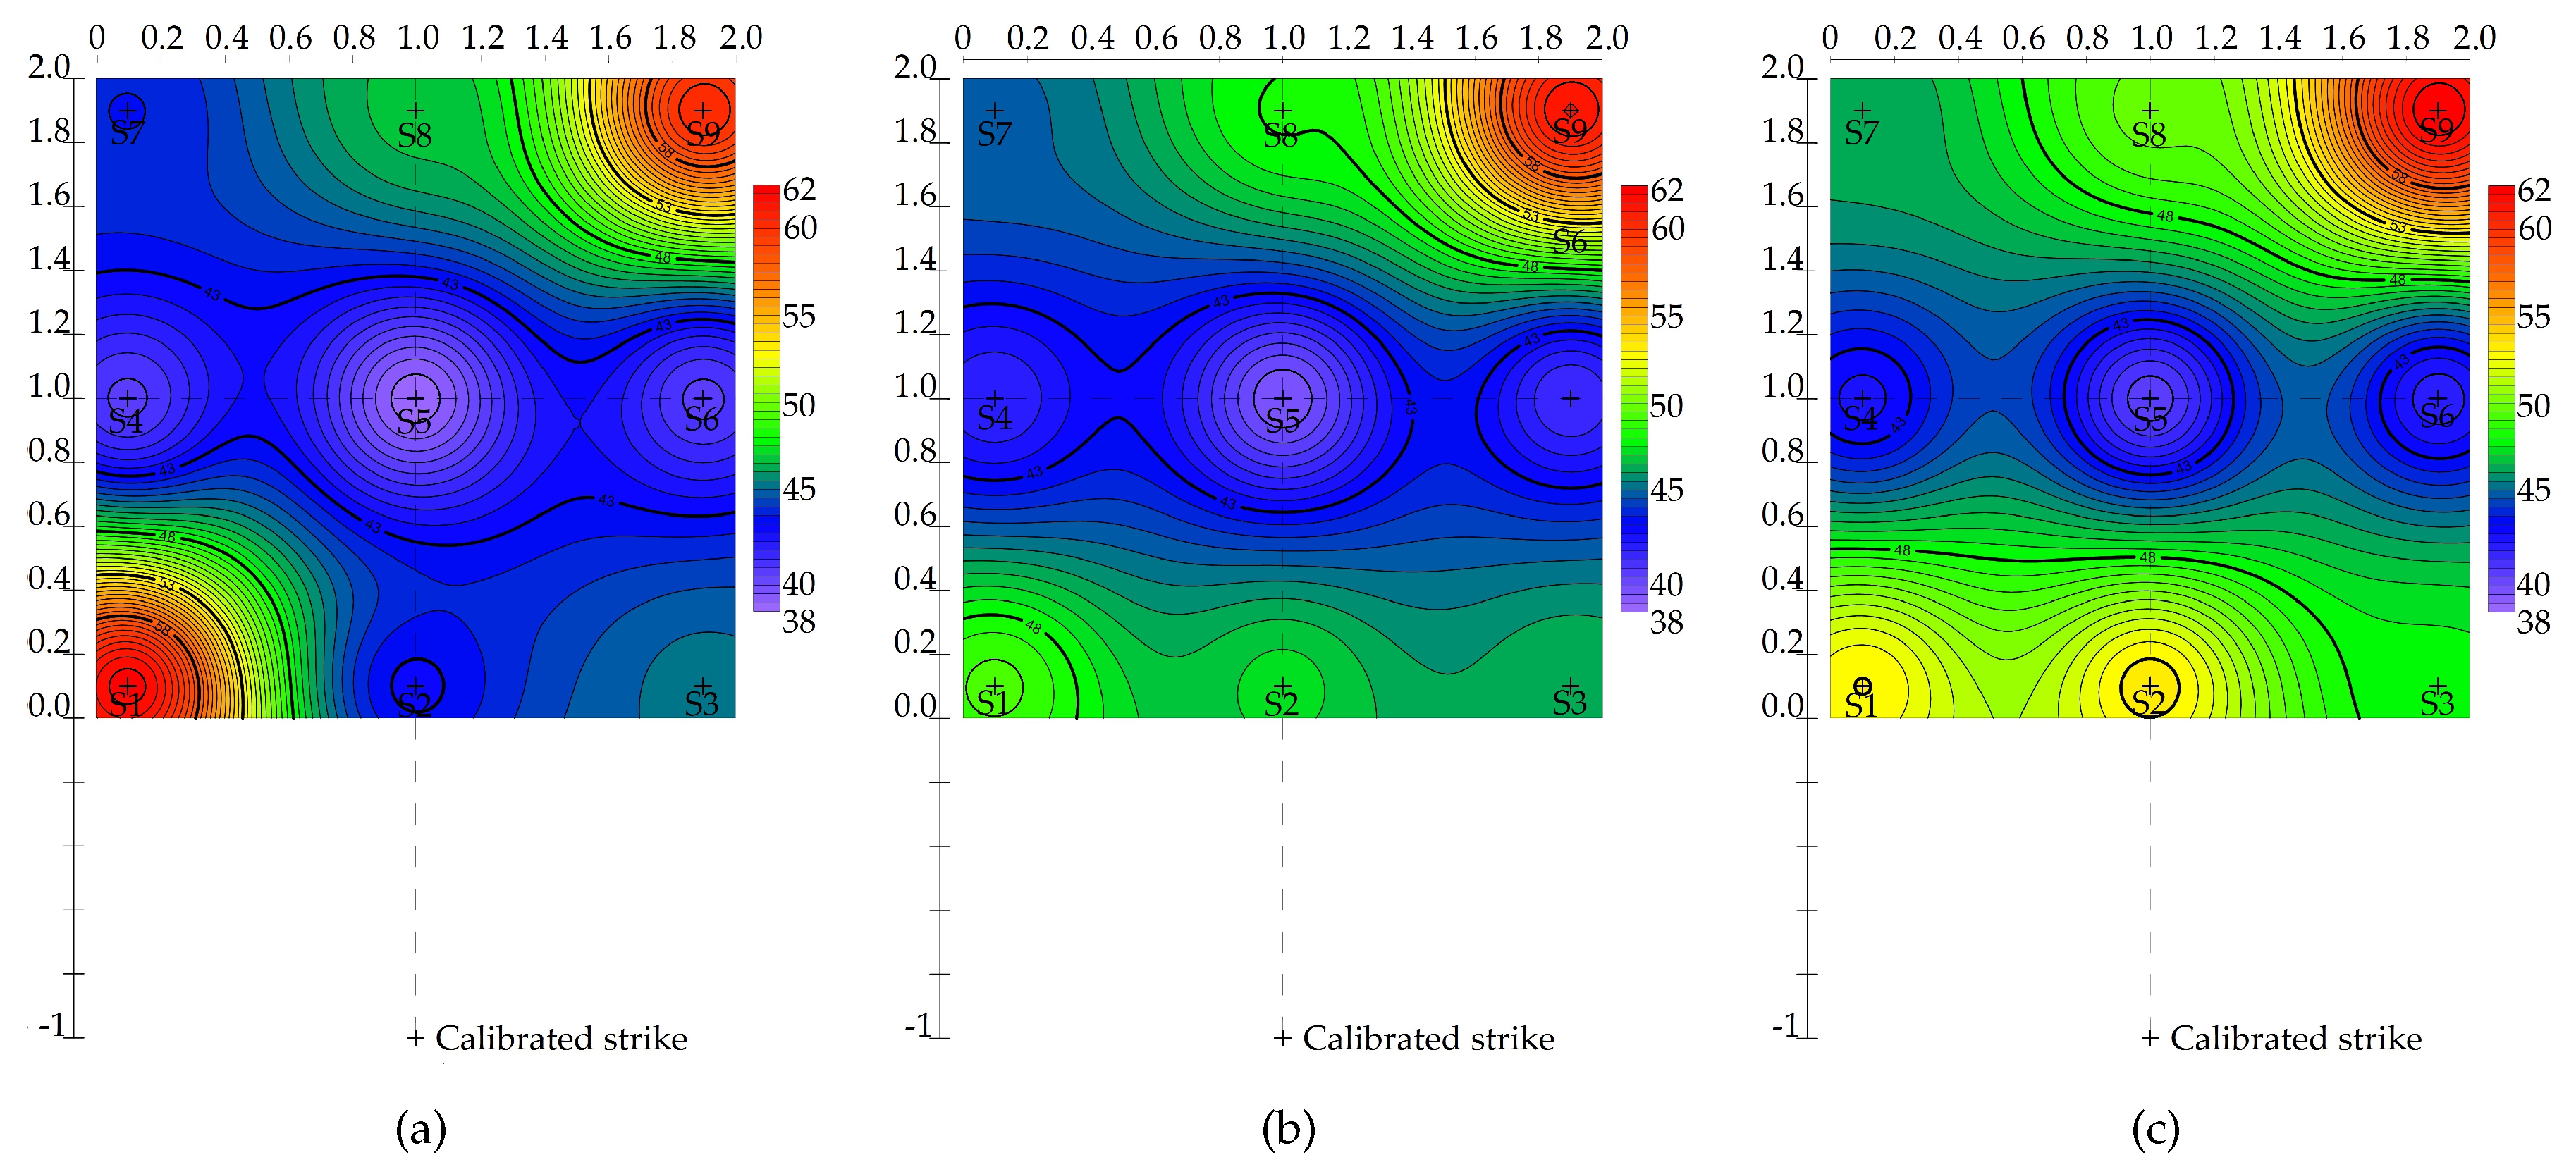
In the frequency domain, frequencies from 40 to 56 Hz were captured on the vertical axis for all three slabs, from 30 to 50 Hz in the horizontal radial axis, and from 38 to 62 Hz in the horizontal transverse frequency axis. The frequency fields in Figure 7 (vertical direction), Figure 8 (horizontal radial direction), and Figure 9 (horizontal transverse direction) again show considerable variability in the distribution of vibrations over the slab surface, especially in both horizontal directions, but common trends can once again be identified for all slabs for the individual directions. In the vertical direction, it is again a partial frontal distribution from higher frequencies to lower frequencies with increasing distance from the dynamic load. In the horizontal radial direction for the G05 slab, the highest frequencies can be traced in the lower-left corner, and this trend is also partially evident for slabs G06 and G07. The highest variability was found in the horizontal transverse direction, with the highest recorded frequencies in the lower-left and upper-right corners of the G05 slab, but this trend was no longer there for slabs G06 and G07, and the highest frequencies were only recorded in the upper-right corner. Generally, higher frequencies were recorded in the slab G07 than in slabs G05 and G06.
4. Discussion
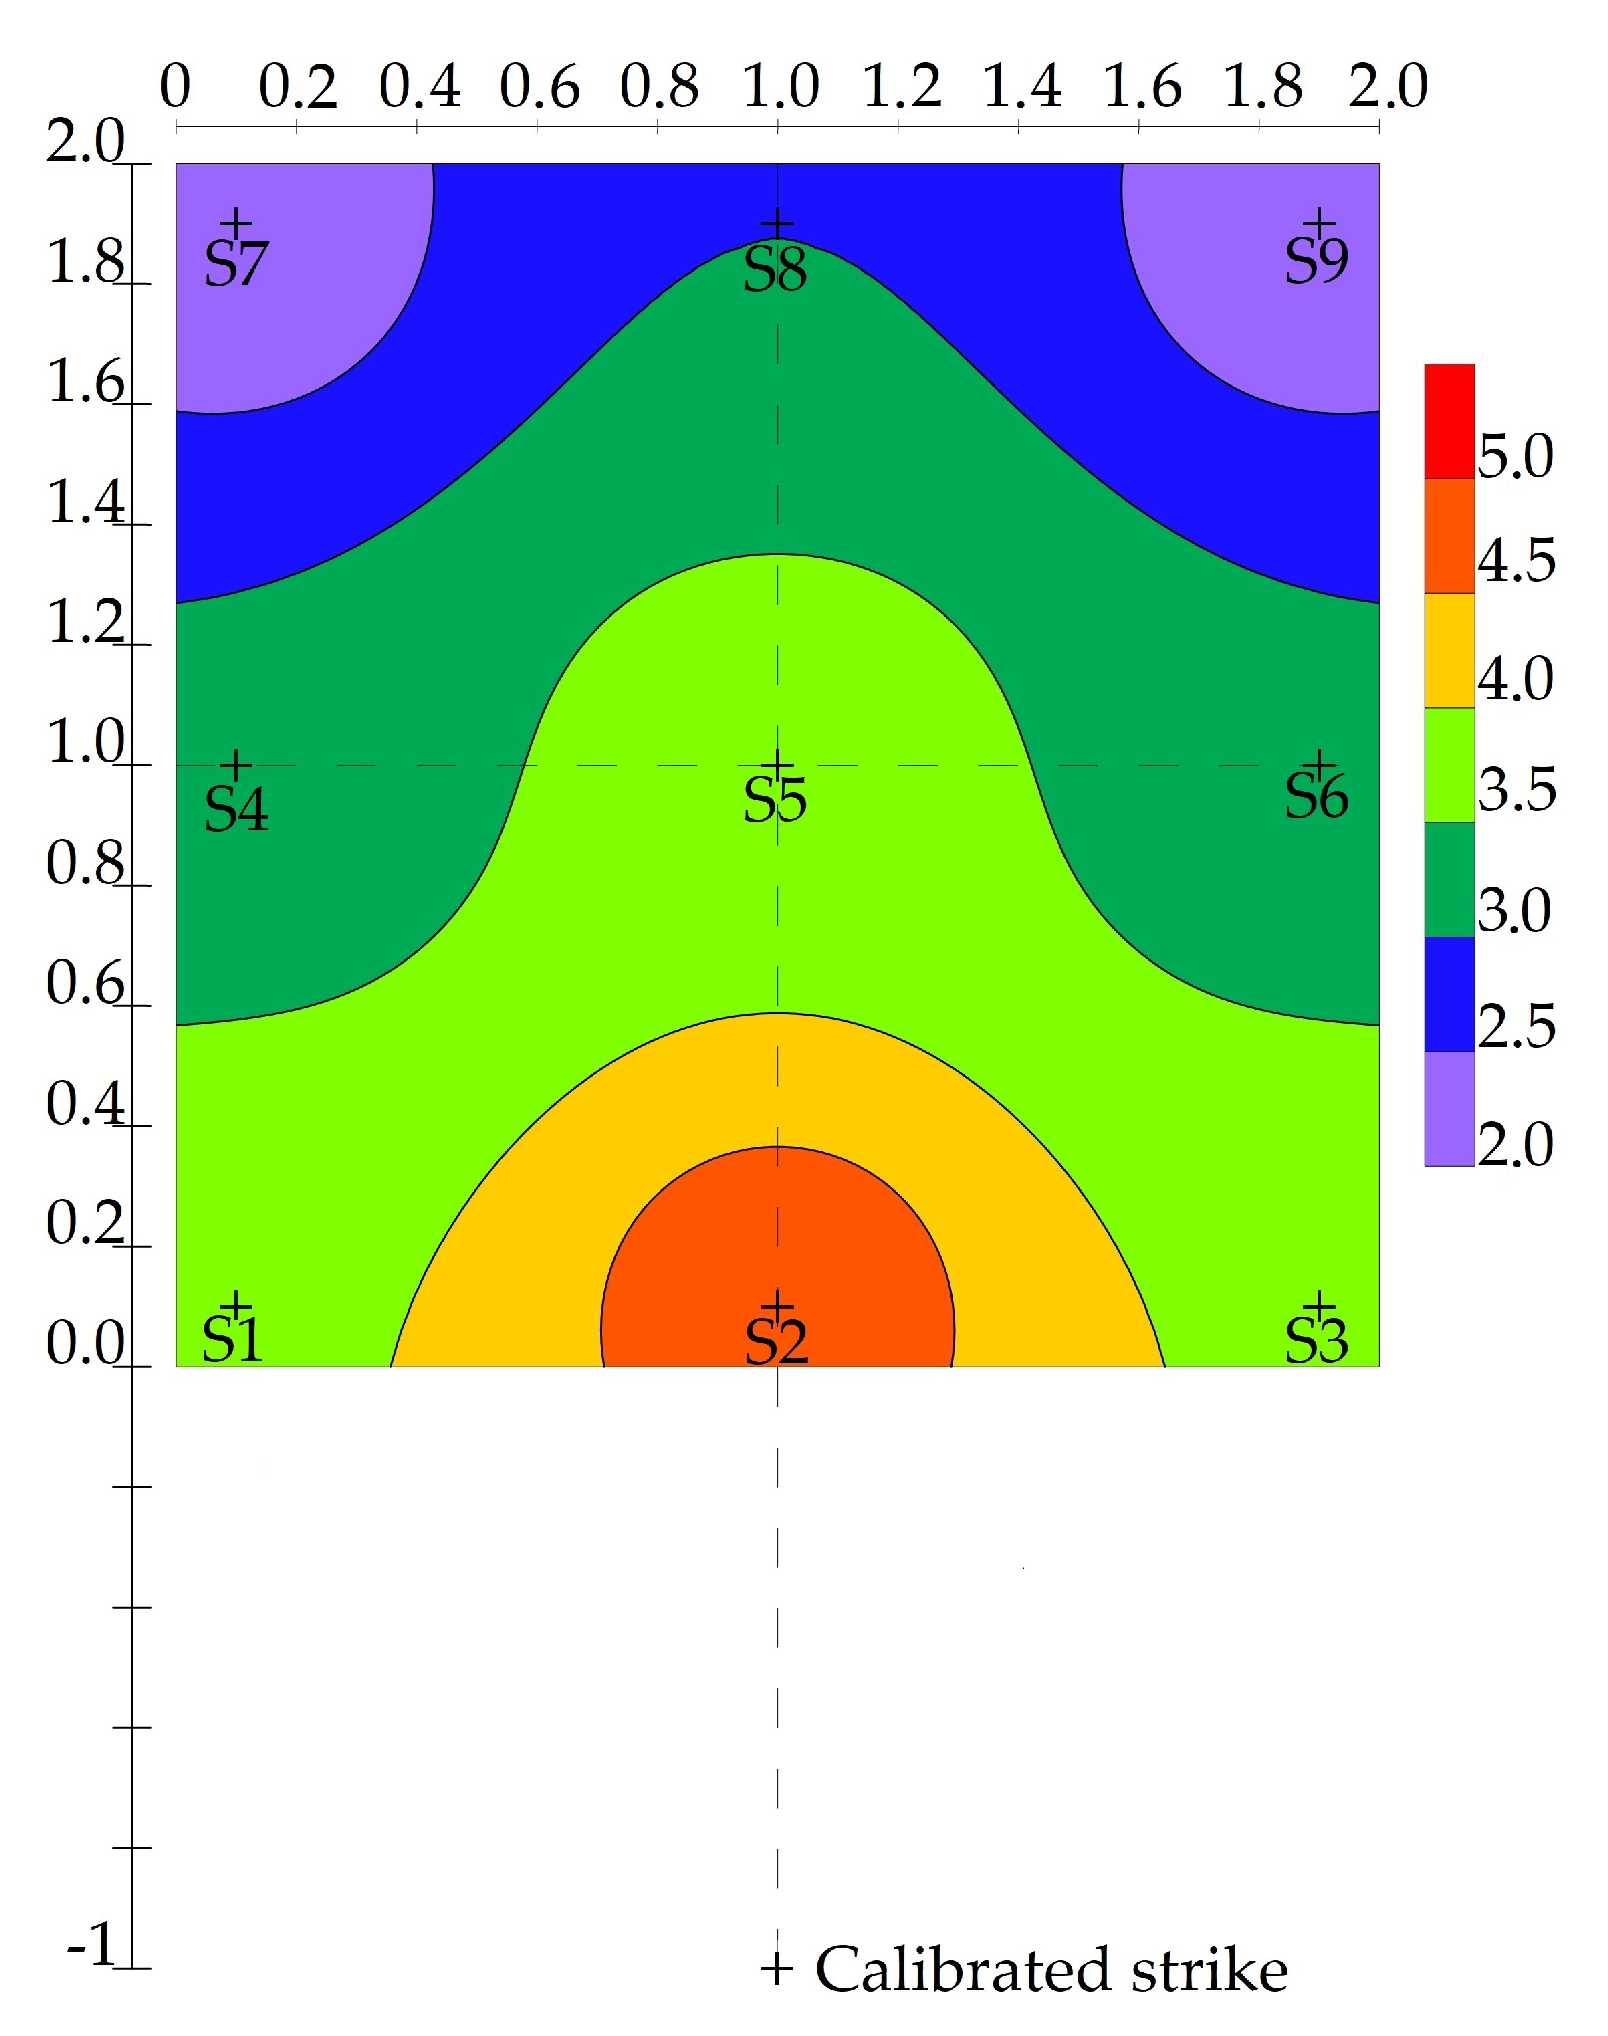
The mutual interaction of a concrete slab with the subsoil and the propagation of vibrations through the subsoil environment into such a slab is a very complex problem, which depends on a large number of factors, including the properties and composition of the subsoil environment as well as the properties of the building structure itself. The presented experiment can be considered to be a simplified physical model, where the foundation structure is simulated by a subtler slab with a small square floor plan. Likewise, the dynamic load in the form of a calibrated impact represents a significant simplification compared to a real seismic load, such as passing traffic or shallow blasting work. Finally, the subsoil environment, which has a marked effect on the propagation of vibrations, can be considered almost ideal in our physical model, as it was homogenized and without groundwater. With such a simplified physical model, it would also be possible to expect ideal results of the vibration distribution over the surface of the concrete slab (Figure 10).
However, as demonstrated in Figure 4, Figure 5 and Figure 6 showing the distribution of the amplitudes of the oscillation velocity in the area, with Figure 7, Figure 8 and Figure 9 showing the frequency field, even in such a simplified experiment, the results varied significantly.
In the experiment presented here, the vibrations were measured at points with nine seismometers. The quality and significance of the obtained wave and frequency fields could be improved by using a larger number of sensors or, for example, a large number of glued strain gauges or the use of distributed fiber optic technology, which would make it possible to obtain a real image of the distribution of vibrations over the entire area.
Even though the seismic sensors installed on the monitored slab were not propped up on supports (i.e., their entire lower surface was in contact with the slab), the sensor itself could have resonated during the measurement, which may have slightly affected the results.
As mentioned above, the entire experiment was simplified by the absence of groundwater. However, since the experiments were performed on three slabs over a period of several months (June, September, and October), there was a different humidity of the whole quasi-homogenized subsoil system and this different humidity could also have slightly affected the measurement results.
The very interesting results that were obtained in this experiment motivated further research. Extensive seismic measurements are currently underway on a large brownfield building in close proximity to a tram junction in the city of Ostrava (Czech Republic) for a detailed analysis of unwanted vibrations in the area of this building [22]. In addition to standard seismic instrumentation, a monitoring method using fiber optic technologies is being used to monitor the dynamic load of this large building and is being developed at the workstations of the author’s team [23,24,25]. The results of this research will, among other things, help with the revitalization of the dilapidated brownfields, which will support the development and sustainability of a typically post-industrial city such as Ostrava.
5. Conclusions
This article presents an experimental study of the distribution of vibrations over the surface of a concrete slab reinforced with steel fibers. Three slabs were used for the experiment, and they were primarily used for the load test within the long-term research carried out at the author’s workplace [15].
From the experimental measurements, an extensive set of seismic data was statistically processed in both the amplitude and frequency domains, where a calibrated stroke was used as the dynamic load. The obtained results are presented in the article in graphical form in the form of wave and frequency fields in three mutually perpendicular directions.
The results of the presented experiment generally show that even with a very simplified physical model, considerable variability in the distribution of vibrations in the surface could be seen on a concrete slab of small dimensions, both in the amplitude and frequency domains. In the same way, significant variation could be observed when comparing the three slabs, which had reinforcement in the form of steel fibers in the range from 25 kg/m to 75 kg/m. Even with regard to the amount of reinforcement, a certain trend can be read from the results, with higher values of oscillation speed being registered with an increasing percentage of steel fibers.
Author Contributions
M.S. proposed the measuring idea and edited the manuscript. M.S., M.P., J.N., and M.F. developed, tested, and validated the data. M.S., M.P., and J.N. wrote the manuscript. M.S. critically evaluated the quality of the research data and experimental methods used to generate/acquire them as well as the soundness/validity of the scientific and engineering techniques, wrote the manuscript, and performed its final edits. All authors have read and agreed to the published version of the manuscript.
Funding
The paper has been funded with the support of conceptual development of science, research and innovation in 2020, assigned to VSB–Technical University of Ostrava, The Ministry of Education, Youth and Sports in the Czech Republic. Work is partially supported by Grant of SGS No. SP2020/166, VSB–Technical University of Ostrava, Czech Republic.
Conflicts of Interest
The authors declare no conflict of interest.
References
- Connolly, D.P.; Marecki, G.P.; Kouroussis, G.; Thalassinakis, I.; Woodward, P.K. The growth of railway ground vibration problems—A review. Sci. Total Environ. 2016, 568, 1276–1282. [Google Scholar] [CrossRef] [PubMed]
- Xu, R.; Li, X.; Yang, W.; Rabiei, M.; Yan, C.; Xue, S. Field Measurement and Research on Environmental Vibration due to Subway Systems: A Case Study in Eastern China. Sustainability 2019, 11, 6835. [Google Scholar] [CrossRef] [Green Version]
- Zou, C.; Wang, Y.; Moore, J.A.; Sanayei, M. Train-induced field vibration measurements of ground and over-track buildings. Sci. Total Environ. 2017, 575, 1339–1351. [Google Scholar] [CrossRef] [PubMed]
- Athanasopoulos, G.; Pelekis, P. Ground vibrations from sheetpile driving in urban environment: Measurements, analysis and effects on buildings and occupants. Soil Dyn. Earthq. Eng. 2000, 19, 371–387. [Google Scholar] [CrossRef]
- Czech, K.; Gosk, W. Analysis of the Vibration Propagation Induced by Pulling out of Sheet Pile Wall in a Close Neighbourhood of Existing Buildings. Procedia Eng. 2016, 143, 1460–1467. [Google Scholar] [CrossRef] [Green Version]
- Xiao, Y.J.; Chen, F.Q.; Lin, L.Q. Study of ground vibration and vibration isolation due to sleeve of cast-in-place piles installed by vibratory driving. Yantu Lixue/Rock Soil Mech. 2017, 38, 705–713. [Google Scholar] [CrossRef]
- Vavrina, L.; Windeln, D. Beispiel einer erschütterungsarmen Tiefgründung mit Fertigrammpfählen aus Stahlbeton. Bautechnik 2017, 94, 661–666. [Google Scholar] [CrossRef]
- Hwang, J.H.; Tu, T.Y. Ground vibration during gravel pile construction. J. Mar. Sci. Technol. 2002, 10, 36–46. [Google Scholar] [CrossRef]
- Cheng, Z.; Shi, Z.; Palermo, A.; Xiang, H.; Guo, W.; Marzani, A. Seismic vibrations attenuation via damped layered periodic foundations. Eng. Struct. 2020, 211, 110427. [Google Scholar] [CrossRef]
- Kim, D.S.; Lee, J.S. Propagation and attenuation characteristics of various ground vibrations. Soil Dyn. Earthq. Eng. 2000, 19, 115–126. [Google Scholar] [CrossRef]
- Kouroussis, G.; Parys, L.V.; Conti, C.; Verlinden, O. Using three-dimensional finite element analysis in time domain to model railway-induced ground vibrations. Adv. Eng. Softw. 2014, 70, 63–76. [Google Scholar] [CrossRef]
- Brandt, A. Fibre reinforced cement-based (FRC) composites after over 40 years of development in building and civil engineering. Compos. Struct. 2008, 86, 3–9. [Google Scholar] [CrossRef]
- Sorelli, L.; Meda, A.; Plizzari, G. Steel fiber concrete slabs on ground: A structural matter. ACI Struct. J. 2006, 103, 551–558. [Google Scholar]
- Stolarik, M.; Hrubesova, E.; Pinka, M. Dynamic response of the experimental foundation slab-seismic measurement and analysis. Int. Multidiscip. Sci. GeoConf.: SGEM 2015, 2, 261. [Google Scholar]
- Hrubesova, E.; Mohyla, M.; Lahuta, H.; Bui, T.; Nguyen, P. Experimental Analysis of Stresses in Subsoil below a Rectangular Fiber Concrete Slab †. Sustainability 2018, 10, 2216. [Google Scholar] [CrossRef] [Green Version]
- Čajka, R.; Marcalikova, Z.; Kozielova, M.; Mateckova, P.; Sucharda, O. Experiments on Fiber Concrete Foundation Slabs in Interaction with the Subsoil. Sustainability 2020, 12, 3939. [Google Scholar] [CrossRef]
- Čajka, R.; Navrátil, J. Numerical Solution of Prestressed Foundation—Subsoil Interaction Using FEM. Key Eng. Mater. 2020, 832, 81–88. [Google Scholar] [CrossRef]
- Sucharda, O.; Smirakova, M.; Vaskova, J.; Mateckova, P.; Kubosek, J.; Cajka, R. Punching Shear Failure of Concrete Ground Supported Slab. Int. J. Concr. Struct. Mater. 2018, 12. [Google Scholar] [CrossRef]
- Sucharda, O.; Bilek, V.; Smirakova, M.; Kubosek, J.; Cajka, R. Comparative Evaluation of Mechanical Properties of Fibre-Reinforced Concrete and Approach to Modelling of Bearing Capacity Ground Slab. Period. Polytech. Civ. Eng. 2017, 61, 972–986. [Google Scholar] [CrossRef] [Green Version]
- Čajka, R. Tests of fiber reinforced concrete composite slabs on the subsoil with horizontal load. Int. J. Geomate 2020, 18, 143–150. [Google Scholar] [CrossRef]
- Wiszniowski, J.; Wiejacz, P. Program SWIP; Institute of Geophysics, Polish Academy of Sciences: Warszaw, Poland, 2003; p. 36. [Google Scholar]
- Stolarik, M.; Pinka, M.; Nedoma, J. Ground-Borne Vibration Due to Construction Works with Respect to Brownfield Areas. Appl. Sci. 2019, 9, 3766. [Google Scholar] [CrossRef] [Green Version]
- Nedoma, J.; Stolarik, M.; Kepak, S.; Pinka, M.; Martinek, R.; Frnda, J.; Fridrich, M. Alternative Approaches to Measurement of Ground Vibrations Due to the Vibratory Roller: A Pilot Study. Sensors 2019, 19, 5420. [Google Scholar] [CrossRef] [PubMed] [Green Version]
- Nedoma, J.; Stolarik, M.; Fajkus, M.; Pinka, M.; Hejduk, S. Use of Fiber-Optic Sensors for the Detection of the Rail Vehicles and Monitoring of the Rock Mass Dynamic Response Due to Railway Rolling Stock for the Civil Engineering Needs. Appl. Sci. 2019, 9, 134. [Google Scholar] [CrossRef] [Green Version]
- Kepak, S.; Stolarik, M.; Nedoma, J.; Martinek, R.; Kolarik, J.; Pinka, M. Alternative Approaches to Vibration Measurement Due to the Blasting Operation: A Pilot Study. Sensors 2019, 19, 4084. [Google Scholar] [CrossRef] [PubMed] [Green Version]
Figure 1.
A measurement situation: (a) diagram; (b) overall situation in situ; (c) seismometer ViGeo2.
Figure 1.
A measurement situation: (a) diagram; (b) overall situation in situ; (c) seismometer ViGeo2.

Figure 2.
The waveform image from the calibrated strike-sensor S1, slab G05: (a) the first thirty strikes; (b) one strike.
Figure 2.
The waveform image from the calibrated strike-sensor S1, slab G05: (a) the first thirty strikes; (b) one strike.

Figure 3.
The frequency spectra from the calibrated strike-sensor S1, slab G05, strike no. 21.

Figure 4.
Wave fields—vertical direction: (a) slab G05; (b) slab G06; (c) slab G07.

Figure 5.
Wave fields—horizontal radial direction: (a) slab G05; (b) slab G06; (c) slab G07.

Figure 6.
Wave fields—horizontal transversal direction: (a) slab G05; (b) slab G06; (c) slab G07.

Figure 7.
Frequency fields—vertical direction: (a) slab G05; (b) slab G06; (c) slab G07.

Figure 8.
Frequency fields—horizontal radial direction: (a) slab G05; (b) slab G06; (c) slab G07.

Figure 9.
Frequency fields—horizontal transversal direction: (a) slab G05; (b) slab G06; (c) slab G07.
Figure 9.
Frequency fields—horizontal transversal direction: (a) slab G05; (b) slab G06; (c) slab G07.

Figure 10.
Ideal distribution of vibrations over the concrete slab surface.


Table 1.
Parameters of quasi-homogenized subsoil during experimental measurements under tested slabs G05, G06, and G07.
Table 1.
Parameters of quasi-homogenized subsoil during experimental measurements under tested slabs G05, G06, and G07.
| Unit Weight | Elastic Modulus | Poisson’s Ratio | Cohesion | Friction Angle | |
|---|---|---|---|---|---|
| kN/m | MPa | kPa | Degree | ||
| Homogenized subsoil | 19 | 12.9 | 0.35 | 9.3 | 19.3 |
Publisher’s Note: MDPI stays neutral with regard to jurisdictional claims in published maps and institutional affiliations. |
© 2020 by the authors. Licensee MDPI, Basel, Switzerland. This article is an open access article distributed under the terms and conditions of the Creative Commons Attribution (CC BY) license (http://creativecommons.org/licenses/by/4.0/).
Share and Cite
MDPI and ACS Style
Stolarik, M.; Pinka, M.; Nedoma, J.; Fridrich, M. Variability of Seismic Loading over the Surface of a Concrete Slab in Interaction with the Subsoil. Sustainability 2020, 12, 9530. https://doi.org/10.3390/su12229530
AMA Style
Stolarik M, Pinka M, Nedoma J, Fridrich M. Variability of Seismic Loading over the Surface of a Concrete Slab in Interaction with the Subsoil. Sustainability. 2020; 12(22):9530. https://doi.org/10.3390/su12229530
Chicago/Turabian StyleStolarik, Martin, Miroslav Pinka, Jan Nedoma, and Michael Fridrich. 2020. "Variability of Seismic Loading over the Surface of a Concrete Slab in Interaction with the Subsoil" Sustainability 12, no. 22: 9530. https://doi.org/10.3390/su12229530
Note that from the first issue of 2016, this journal uses article numbers instead of page numbers. See further details here.