Article

An Integrated Approach to Optimal Charging Scheduling of Electric Vehicles Integrated with Improved Medium-Voltage Network Reconfiguration for Power Loss Minimization

1
Department of Electrical Engineering, Mirpur University of Science and Technology, (MUST), Allama Iqbal Road, Mirpur 10250, Pakistan
2
Department of Electrical and Electronic Engineering, College of Engineering, University of Jeddah, Jeddah 21589, Saudi Arabia
3
Electronic Engineering Department, Quaid e Awam University of Engineering Science and Technology, Nawabshah 67480, Pakistan
4
School of Engineering, Deakin University, Waurn Ponds, VIC 3216, Australia
5
Power Electronics and Renewable Energy Research Laboratory (PEARL), Department of Electrical Engineering, University of Malaya, Kuala Lumpur 50603, Malaysia
6
School of Software and Electrical Engineering, Swinburne University of Technology, Hawthorn, Melbourne, VIC 3122, Australia
7
Center of Research Excellence in Renewable Energy and Power Systems, King Abdulaziz University, Jeddah 21589, Saudi Arabia
*
Author to whom correspondence should be addressed.
Sustainability 2020, 12(21), 9211; https://doi.org/10.3390/su12219211
Submission received: 22 September 2020 / Revised: 27 October 2020 / Accepted: 30 October 2020 / Published: 5 November 2020

Abstract

:
The uncoordinated integration of electric vehicles (EVs) severely deteriorates the operational performance of a distribution network. To optimize distribution network performance in an EV charging environment, this paper presents a two-stage optimization approach, which integrates coordinated EV charging with network reconfiguration. A formulation to minimize system power loss is presented, and an optimal solution is obtained using a binary particle swarm optimization algorithm. The proposed approach is tested on a modified IEEE 33-bus medium-voltage node test system, coupled with a low voltage distribution network. Results of the coordinated and uncoordinated EV charging are compared with those of the developed integrated approach, and the operational performance of the system is studied. The results show that the integration of network reconfiguration with coordinated EV charging significantly decreases network power losses and fairly improves voltage profile. Thus, the proposed strategy can lead to improved operational performance of the system while dealing with the growing penetration of EVs in the network.

1. Introduction

The power system network is arguably the largest infrastructure made by humans on earth. Such a network consists of generation, transmission, and distribution systems [1]. The transmission system is mostly used to transfer electrical energy from a power-generating plant to its distribution systems, to which multiple different rating loads are connected [2]. The conventional power system is divided into many national-level power system networks, wherein mostly electricity generation is produced by exhausting fossil fuels (e.g., coal, petroleum, natural gas, oil shales, bitumen, tar sands, heavy oils and others, to power distribution loads). Therefore, the burning of these fossil fuels for electricity generation, industrial consumption, automotive industries, and other transportation sectors, produces greenhouse gases (GHG) and CO2 emissions [3,4].
Recently, to meet global energy demand and supply, utility providers are shifting from traditional electricity generation for use in automotive industries and transportation networks towards more sustainable and renewable energy resources (RES), including nuclear energy, solar energy, wind energy, tidal wave, biomass energy, and others. Increasing global environmental problems, high oil prices, and technological advancements all drive the transition towards eco-friendly and more economical mobility networks [5,6]. As a result, electric vehicles (EVs), hybrid EVs (HEVs), and plug-in EVs (PEVs) have emerged as the most attractive options for mobility [7].
In the current study, we refer to PEVs as “EVs”; these are grid-connected vehicles that take their charging energy from the electric grid. The charging activity can be performed either at home or at a public charging station [8]. Compared to conventional household domestic loads, the EV charging loads are relatively large. In brief, the modern power system networks is highly populated with the integration of grid-connected renewable energy (RE) systems, energy storage systems (ESS), flexible AC transmission systems (FACTS), and high-voltage direct current (HVDC) [9], among others.
In the modern world, the increased integration of EV loads and mobile connection to power grids has increased the energy demand characteristics of the power network to the highest peak demand level, which requires a modern self-attention grid. Furthermore, a worst-case scenario may occur when hundreds of EV fleet customers returning to their homes plug in their EVs to the electric grid and charge their vehicles at the same peak demand hours as the conventional load [10]. The unequal distribution of nonlinear loads, the random behavior of EVs, and the large integration of Photovoltaics(PVs) and wind energy sources produce congestion; complexity and physical limitations; as well as energy loss, power quality, and grid reliability issues due to the thermal constraints of the transformers and the transmission and distribution lines. Therefore, the uncontrolled charging of EVs can lead to overloading of the distribution network, voltage violation, power loss increment, and poor management of the network [11,12]. Multi-utilities companies like electric utility, gas utility and water utility operations also have serious concerns about the grid objectives and system performance parameters. Therefore, devising a smart management system of EV charging can sufficiently satisfy customers’ charging demand without compromising grid objectives. The smart scheduling strategies under a centralized control framework gives authority to the distribution network operator to make charging decisions by considering both the grid and customer interests. The development of smart and modern grids provides an excellent platform upon which to implement centralized scheduling strategies [13]. Furthermore, the smart load management of EV load leads to high-technology applications and economic freedom to improve the significant importance of the demand-side management (DSM) of the customers [14].
The impacts of EV charging and their scheduling strategies have been discussed in several literature studies. For example, one study [15] implemented a smart scheduling of EVs based on the minimum load deviation of substation transformers using a genetic algorithm (GA) method of optimization algorithm. The strategy has effectively reduced load stress on the system by accommodating EVs in valleys to give smooth load profiles. Similarly, researchers [16] performed a planning-level study to accommodate clusters of EVs in a distribution network. The scheduling task is implemented by using GA with the objective of minimizing system cost and emission. In similar studies [17,18], the authors managed to charge the EV activities at the maximum utilization of renewable energy sources and tested linear programming to implement the complex scheduling task. In another work [19], the authors proposed the direct control of EV load management with the objectives of minimizing energy cost and maximizing the energy delivered to the EV batteries; however, that work did not consider practical domestic network constraints. Furthermore, past studies [20,21] proposed an optimal charging scheduling of EVs to reduce the network power loss. They formulated a scheduling problem assuming a fixed state of charge (SOC). However, their proposed systems are in conflict with the practical scenario.
Aside from smart charging scheduling strategies, the growing penetration of EVs in a distribution network has raised awareness regarding the importance of integrating grid strategies, such as network reconfiguration, in order to achieve an improved network performance. In an automated distribution network containing EV charging load, network reconfiguration technique can be utilized to improve the system’s operational performance. The literature provides details on smart charging scheduling schemes considering various objectives. However, the sequential integration of grid strategy, i.e., network reconfiguration with coordinated charging strategy has yet to be addressed. Network reconfiguration is one of the important techniques used in power systems to improve network reliability.
In this paper, a sequential integration approach is presented, which integrates the network reconfiguration with coordinated EV charging. The aim of integrating the reconfiguration strategy is to minimize distribution network losses and improve voltage profile. The EV charging scheduling and network reconfiguration problems are both solved by employing the Binary particle swam optimization (BPSO) algorithm. During the network reconfiguration process, the network radiality constraint is taken into account. The proposed approach is tested on a modified IEEE 33-bus system, and the results show that the sequential integration of network reconfiguration after the scheduled charging load of EVs further reduces network losses and improves system voltage profile compared to the case when only the smart charging is considered. Thus, the proposed approach can help the utilities companies integrate the network strategies with the smart scheduling of EVs to improve their system performance.
The rest of the paper is structured as follows. Section 2 formulates the problem of interest and details the system constraints. Section 3 describes the proposed two-stage methodology to obtain an optimal solution. The results are discussed in Section 4, and Section 5 concludes the paper.

2. Problem Formulation

The uncoordinated charging of EVs leads to distribution network overloading and power loss increment. High power losses reduce system efficiency, which in turn, affects its economic operation. As a solution to this problem, a smart charging scheduling scheme can manage the charging load of EVs without system overloading and power loss increment. To fulfil the customers’ charging demand and network constraints, this paper analyzes a smart charging scheduling scheme. The advance scheme is sequentially integrated with the domestic network reconfiguration and then implemented to improve the network performance during the high penetration of EV charging. However, both scheduling task and network reconfiguration are complex optimization problems that involve many constraints. Each task is modeled on common objective function of power loss minimization and is defined in Equation (1)
M i n ( f c ) = M i n t = 1 T = 24 i = 1 n b | I i | 2 k i R i
where fc is the loss function, t is a one-hour time interval over the time period (T = 24 h), Ii is the current in the branch i, nb is the total number of branches, and ki is the variable that represents the topology status of the branches (0 = open, 1 = closed). This topology is determined during the network reconfiguration process. EVs act as the charging load on the network; their random connection with the network increases the Ii flowing in the ith branch, which may result in the overloading of the line, thus causing high line losses. To limit this current, a smart selection of the EVs is required, which minimizes objection function states in Expression (1). The formulated objective is subject to various constraints. In the EV charging environment, the total load demand of a system includes the EV charging load and the residential load. At any instant of time ( t ), this total load demand should not exceed the maximum demand level of a system to avoid overloading the system. Expressions (2) and (3) show that the constraint can limit the dispatch of uneconomical units to meet the extra demand and save the operational cost of the system.
j = 1 m P j l o a d ( t ) P M a x . d e m a n d
P j l o a d ( t ) = P j Re s e i d e n t i a l ( t ) + P j E V ( t )
In Expressions (2) and (3) above, PMax demand is the peak residential load demand throughout a day. However, if a random charging is performed during this interval, this will violate the constraint with increased system losses. In addition, Pj load(t) is the total power consumption at the bus j for the time interval (t), Pj Re sidential(t) is the residential load demand at the bus j for time step (t), and PjEV(t) is the EV load demand at the bus j in a time interval (t). To ensure power, the quality of the system voltage magnitude at each node must be within the permissible ranges determined by the utilities companies. In this paper, the upper voltage limit of 10% (1.10 per unit) and lower voltage limit of 6% (0.94 per unit) are tested [22].
V min V j V max
In Expression (4) above, Vmin and Vmax are the minimum and maximum allowable voltages, respectively, and Vj is the voltage at the node j. Similarly, at every scheduling step of SOC consideration, it is very important to determine the EV energy demand. This constraint is very helpful for the health and safety of the battery. Here, the SOC constraint with upper and lower limits is defined in Expression (5) as
S O C k , min S O C k S O C k , max
where SOCk,min is the minimum state of charge of Kth EV, which is assumed as 20% of rated capacity. In addition, SOCk,max is the maximum charging capacity of Kth EV, and SOCk is the current state of charge of Kth EV when it connects with the system. In the scheduling process, it is assumed that once a particular EV is selected for the charging, it will not disconnect from the system until it attains its required SOC. The distribution network operates with radial configuration due to its simple and economical design. Radial configuration is typically used as a constraint for network reconfiguration. Network reconfiguration provides a new topology of the network by altering the closed/open status of the switches. However, the network should not lose its radial topology when switches change their status. Radial network configuration is used as a constraint while implementing network reconfiguration in the second stage of the research and is handled by all spanning trees algorithms [23].

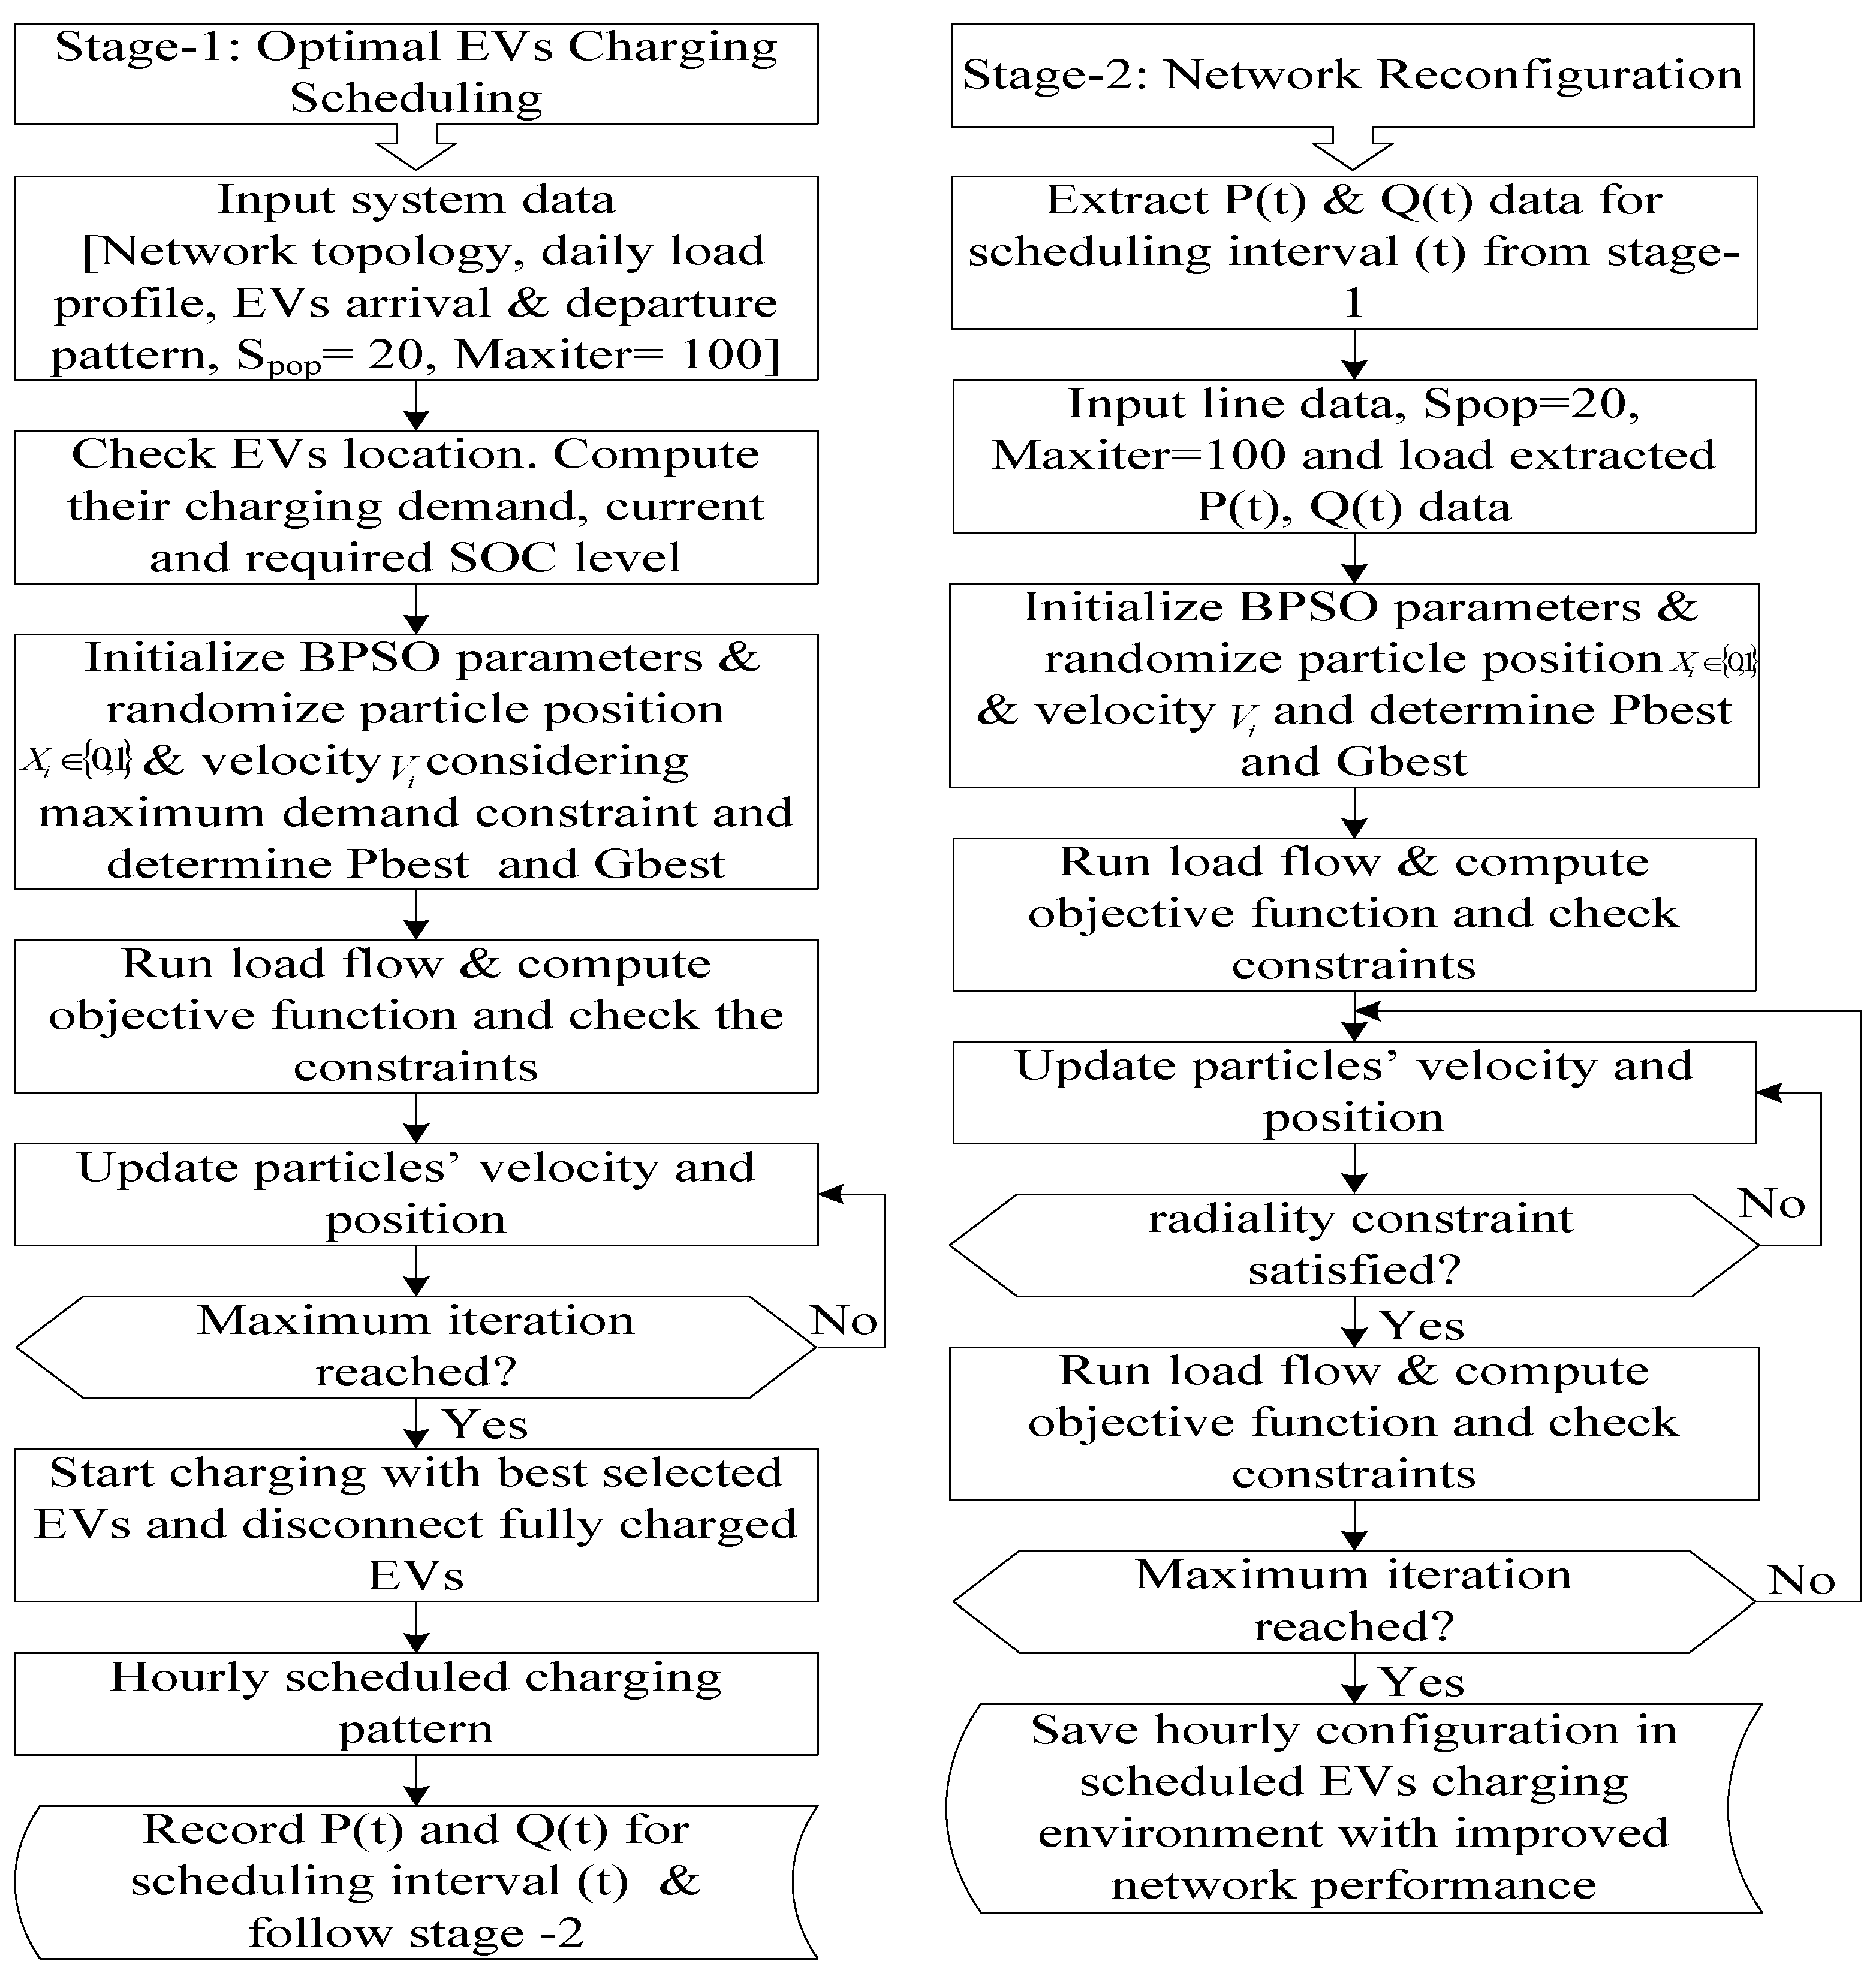
3. Proposed Algorithm for Optimal Charging Scheduling Integrated with Network Reconfiguration

In order to achieve an optimal EV charging scheduling with an improved network performance, this work has been carried out sequentially into two stages, as shown in Figure 1. Stage 1 deals with the coordinated charging scheduling of EVs in a low voltage distribution network based on minimum power loss. Therefore, in Stage 2 of the scheduled EVs charging environment, the network reconfiguration is then integrated with the scheduling task to improve network performance.

3.1. Optimal EV Charging Scheduling

Figure 1 (Stage 1) shows the proposed algorithm for one scheduling interval to coordinate charging activities by considering typical EV mobility patterns. Uncertainties in the EV mobility patterns are one of the core challenges in developing an optimal charging schedule. To model a more practical charging schedule, EV mobility pattern should be thoroughly considered. A detailed EV mobility pattern has been explored in a past work [15]. The random extraction of arrival and departure patterns corresponding to residential areas can be found in Figure 2. Moreover, the scheduling algorithm also considers the typical 24-h demand patterns and peak load demands of each hour monitored from the main substation transformer, as shown in Figure 3.
There are 24 scheduling intervals, and each one is independent from the others. In every interval, EV availability is determined from the mobility data. The scheduling algorithm without violating system boundaries updates in every time step t = 1 h and accommodates the maximum possible EVs in the network, thus obtaining the minimum network power losses. Once an EV reaches its SOCmax, it is no longer a part of the scheduling algorithm. At the end of every time step, optimal hourly scheduled load data are obtained, which reflect the minimum network power loss. Once the Stage 1 task is completed, then hourly load data, which consist of conventional and scheduled charging load of EVs, are then fed to a later stage of network reconfiguration. In this stage, the same BPSO algorithm is used, and an hourly optimal network configuration is determined in the presence of the scheduled EVs charging load, thereby reducing network losses and improving network performance. The radiality, which is the main constraint of this stage, ensures the unidirectional power flow of the system. This stage determines the optimal combinations of network switches that should be opened so that power flowing through the branches follows the shortest possible path, thus generating minimum power loss. The solution process of network reconfiguration is illustrated in the second stage of Figure 1, in which each stage is implemented with the BPSO algorithm and is detailed in the following section.

3.2. BPSO Algorithm

This section analyzes a suitable algorithm for solving problems involving non-convex and non-linear solution spaces, such as EV charging scheduling. An appropriate algorithm should be able to provide quality solution in the minimum possible time while satisfying a number of constraints. Particle swarm optimization (PSO) is considered suitable here as it has been proven to be a robust optimization algorithm for complex, non-linear, and near to real-time scheduling tasks [24]. The BPSO algorithm has been used as an optimization tool to solve both the scheduling problem and network reconfiguration. The BPSO algorithm is the binary version of the PSO introduced by Kennedy and Eberhart in 1997 for binary nature problems [25]. In BPSO, each particle i corresponds to its position Xi and velocity Vi in a d-dimensional search space. The position of a particle Xi is represented as a vector in a binary space (i.e., Xi { 0 , 1 } ) , whereas the particle’s velocity is a vector in the continuous solution space.
V i ( k + 1 ) = ω × V i k + C 1 × r a n d 1 × ( P b e s t , i k X i k ) + C 2 × r a n d 2 × ( G b e s t , i k X i k )
In Equation (6), Vi(K+1) is the particle’s velocity in the range Vmax = 4; Vmin = −4. In addition, Pbest,ik is the personal/local best position of particle i up to iteration number k, Pbest,ik is the global best position among all Pbest,ik up to iteration number k, ω is the inertia weight linearly varied from 0.9 to 0.4, C1 and C2 are the acceleration factors in the range of 2.0–2.05, and r a n d 1   and   r a n d 2 are the random numbers in the range of (0, 1). Unlike the conventional PSO, in the BPSO algorithm the position of a particle represents a bit and its mutation from zero to one or one to zero is carried out with transformation function (i.e., sigmoid function), which is expressed as
S i g ( V i ( k + 1 ) ) = 1 1 + e V i ( k + 1 )
The position ( X i ) of a particle ( i ) is mutated as either 1 or 0, as defined in Equation (8).
X i ( k + 1 ) = { 1       i f   r a n d ( ) < S i g ( V i ( k + 1 ) ) 0       i f   r a n d ( ) S i g ( V i ( k + 1 ) )
The sigmoid function transforms the velocity into probability to mutate the particle position to either one or zero. If the particle’s velocity is closer to its boundaries, i.e., (−4, 4), then the likelihood of position mutation is very low. For a particle velocity that is exactly zero, the probability of bit mutation increases to 50%.

4. Results and Discussion

4.1. Modified IEEE 33-Node Medium-Voltage Network

The proposed algorithm is tested on a modified IEEE 33-node medium-voltage network (Figure 4) supplied by three mega volt ampere (MVA) substation transformers with 0.0477 Ω reactance, coupled with a low-voltage residential network supported by a 100-kVA distribution transformer with 0.0654 Ω reactance, as shown in Figure 4. The test system comprises 32 branches and 33 buses. The 32 branches are normally closed through switches, which are called sectionalizing switches. In addition, there are five extra switches that are normally opened, which are known as tie line switches. The minimum and maximum voltage limits are set at ±6%. The nodes (2, 3, 8, 12, 16, 18, 22, 24, 32, and 33) are penetrated with EVs. The line and load data of the test system are appended in Table 1. EV charging can be done with different charging levels (i.e., Levels 1, 2, or 3). However, the current study focuses on Level 1 charging, i.e., single phase (230 V, 16 A, 3.7 kW) due to its minimum cost. A 16-kWh Nissan LEAF EV model with a charger rating of 3.3 kW has been considered for this charging level. However, the depth of discharge of the EV’s battery is considered 80%. Here, three cases, including (i) uncoordinated EV charging, (ii) coordinated EV charging, and (iii) coordinated EV charging with network reconfiguration, are investigated. In addition, two EV penetration levels are assumed: EV penetration level I corresponds to 60 EVs and level II represents 80 EVs.

4.2. Uncoordinated EV Charging

An uncoordinated way of charging refers to a random charging approach without taking system constraints into account. Based on the typical EV arrival pattern shown in Figure 2, the EVs are involved in the charging process as soon as they arrive at home. This random way of EV charging overloads the system, increases system power loss, and causes voltage violation. The impacts of uncoordinated charging of EVs on the system loading, voltage violation, and power loss are highlighted in Figure 5, Figure 6 and Figure 7, respectively. The simulation results of this uncoordinated charging case are presented in Table 2. Figure 5 shows that the random or uncoordinated charging activities during peak hours caused system overloading by 10% and 7% of peak demand with penetration levels II and I, respectively. Meeting these new peak demands requires additional generation from the system, which will increase the cost and seriously affect system performance.
The voltage deviation at the worst node over a 24-h scheduling period is shown in Figure 6. As can be seen, the minimum voltage at the weakest node without EV penetration is 0.946 per unit. In all simulated cases of Stage 1, node 18′ (i.e., the farthest node in the system) is identified as the weakest bus with the maximum voltage drop throughout a day. For different EV penetrations, voltage violated the lower limit; the values are recorded as 0.932 and 0.931 per unit for penetration levels I and II, respectively. With each penetration level, the voltage drops below the lower regulatory limit of the utility (i.e., 0.94 per unit). The system power loss for uncoordinated EV charging is shown in Figure 7. As can be seen, the maximum power loss for level I penetration is about 103 kW at 20:00, and this is further increased to 104 kW for level II penetration. According to the power loss profile, aside from the uncoordinated approach, penetration level also affects the system power losses. Penetration level II has greater charging load compared to level I; thus, the uncoordinated integration of high charging load has considerably increased network power loss.

4.3. Coordinated EV Charging

The deteriorating impacts of uncoordinated charging are overcome by the proposed coordinated charging implemented with a BPSO algorithm. The coordinated charging strategy can smartly manage the charging load of EV to achieve grid objective, i.e., minimum power loss without violating system constraints. The simulation results of the smart charging scenario on the network performance are presented in Table 2, and its impacts are highlighted in Figure 8, Figure 9 and Figure 10. Figure 8 shows the smart management of the charging load of EVs with level II penetration. From the mobility pattern, we can see that the EV customers start arriving in their homes from 16:00 p.m. onward. However, the smart charging algorithm does not allow EVs to connect with the system until 18:59 p.m. due to the peak demand of conventional load. Instead, the strategy smartly accommodates EVs in the off-peak times so that the total demand of the system does not violate the threshold level of peak demand to obtain a flattened load profile, as shown in Figure 8. In each scheduling interval, the charging load of EVs is accommodated without exceeding maximum demand level, thus avoiding system overloading.
The impact of a coordinated charging scenario, which satisfies the charging demand of EV customers on the voltage profile of the worst node 18′, is shown in Figure 9. The minimum voltage with and without EV penetration is recorded as 0.94 per unit and 0.95 per unit, respectively. The results show that the voltage remained within the regulatory limits and none of the customers experienced power quality issues.
The power loss profile of a 24-h schedule for coordinated charging is shown in Figure 10. With the proposed approach, the maximum recorded power losses are about 98 and 99 kW with penetration levels I and II, respectively. Figure 10 also shows that there is a considerable reduction in network power loss with coordinated charging compared to uncoordinated charging. In terms of energy savings, the coordinated charging strategy saved 0.02 Mwh energy at the end of the day compared to uncoordinated charging. Thus, the adoption of a coordinated charging strategy can reduce the economic burden on the utilities companies.

4.4. Coordinated EV Charging with Network Reconfiguration

In an EV charging environment, the integration of network strategy (i.e., network reconfiguration) can significantly affect the network operational performance, as highlighted in Figure 11 and Figure 12. In this case, an optimal hourly network configuration is determined using hourly scheduled load data from the coordinated EV charging case. Figure 11 shows a comparison of the corresponding minimum voltages recorded in each hour at the weakest nodes (i.e., nodes 18′ and 33′) before and after reconfiguration. The minimum recorded voltage for the coordinated case without the implementation of network reconfiguration is 0.94 per unit. After the execution of network reconfiguration strategy, the minimum value at the weakest bus is 0.97 per unit. The results show a considerable improvement in voltage profile with the optimal network reconfiguration. In terms of energy savings, incorporation of network reconfiguration strategy saved 0.69 Mwh energy at the end of the day compared to the coordinated charging only.
The power loss profile obtained by implementing network reconfiguration with coordinated charging is shown in Figure 12. In this case, an average power loss reduction of 31% is recorded in each scheduling interval compared to the coordinate charging without network reconfiguration. The significant reduction in power loss can be attributed to the incorporation of network reconfiguration, which determines the best topology of the network by changing the status of the operating switches. There are two kinds of operating switches in the network: (i) tie line switches that are normally open and (ii) sectionalizing switches that are normally closed. The given network consists of 37 branches, of which 32 branches are normally closed through sectionalizing switches and 5 branches are normally opened through tie switches. Keeping in view the radiality constraint, the BPSO algorithm can determine the best possible combinations of these switches, thus achieving minimum power loss of the network. The best combinations of switches that reduced the power loss by up to 31% are S7, S9, S14, S28, and S31. Before network reconfiguration, these switches were closed. The BPSO algorithm determined that these switches must be opened so that power flow can follow the shortest possible path, ultimately resulting in minimum power loss.
Taking these findings into consideration, an improved network in EV charging environment is obtained. A comparison of the results of the coordinated charging with and without network reconfiguration is tabulated in Table 2. The switching operation is recorded in different time slots over a complete scheduling period, which changes network topology to balance the load and minimize network power loss.

5. Conclusions

In the future, the growing penetration of EV fleets in the distribution network can challenge the operational performance of a network system. Therefore, this paper presents an integrated approach of coordinated EV charging assimilated with network reconfiguration for achieving optimal system performance. A formulation to minimize system power loss is presented, and the optimal solution is obtained using the BPSO algorithm. The proposed algorithm has been tested on a modified IEEE 33-node medium-voltage network, coupled with low voltage distribution. Simulation results showed that, compared to the coordinated charging, the proposed strategy resulted in 31% energy savings with an improved voltage quality in each scheduling interval. Thus, an improved network performance is obtained, which contributes to the more efficient and economic operation of the system. Moreover, the integration of network reconfiguration has fairly improved the voltage; thus, more EVs can be accommodated, resulting in higher customer satisfaction.

Author Contributions

Data curation, A.A.; idea, formal analysis, writing, W.U.K.T.; idea, methodology, writing, M.U.; investigation, mathematical, computational, K.A.M.; review and editing, B.H.; project administration, A.M.; computing resources, or other analysis tools, and S.M.; supervision. All authors have read and agreed to the published version of the manuscript.

Funding

The authors would like to thank Ministry of Higher Education, Malaysia under Large Research Grant Scheme (LRGS): LR008-2019 (LRGS/1/2019/UKM/01/6/3), University of Malaya, Malaysia for providing financial support under the research grant Impact Oriented Interdisciplinary Research Grant (IIRG): IIRG011A-2019, and Ministry of International Trade and Industry (MITI), Malaysia through MIDF under High Value Added and Complex Product Development and Market Program: GA016-2019.

Conflicts of Interest

The authors declare no conflict of interest.

References

  1. Chen, Z.; Li, Z.; Guo, C.; Wang, J.; Ding, Y. Fully distributed robust reserve scheduling for coupled transmission and distribution systems. IEEE Trans. Power Syst. 2020. [Google Scholar] [CrossRef]
  2. Rafi, F.H.M.; Hossain, M.; Rahman, M.S.; Taghizadeh, S. An overview of unbalance compensation techniques using power electronic converters for active distribution systems with renewable generation. Renew. Sustain. Energy Rev. 2020, 125, 109812. [Google Scholar] [CrossRef]
  3. Yoro, K.O.; Daramola, M.O. CO2 emission sources, greenhouse gases, and the global warming effect. In Advances in Carbon Capture; Elsevier: Amsterdam, The Netherlands, 2020; pp. 3–28. [Google Scholar]
  4. Zheng, Y.; He, X.; Wang, H.; Wang, M.; Zhang, S.; Ma, D.; Wang, B.; Wu, Y. Well-to-wheels greenhouse gas and air pollutant emissions from battery electric vehicles in China. Mitig. Adapt. Strateg. Glob. Chang. 2020, 25, 355–370. [Google Scholar] [CrossRef]
  5. Tashviri, M.H.; Ghaffarzadeh, N. Method for EV charging in stochastic smart microgrid operation with fuel cell and renewable energy source (RES) units. IET Electr. Syst. Transp. 2020. [Google Scholar] [CrossRef]
  6. Tareen, W.U.K.; Aamir, M.; Mekhilef, S.; Nakaoka, M.; Seyedmahmoudian, M.; Horan, B.; Memon, M.A.; Baig, N.A. Mitigation of Power Quality Issues Due to High Penetration of Renewable Energy Sources in Electric Grid Systems Using Three-Phase APF/STATCOM Technologies: A Review. Energies 2018, 11, 1491. [Google Scholar] [CrossRef] [Green Version]
  7. Browne, D.; O’Mahony, M.; Caulfield, B. How should barriers to alternative fuels and vehicles be classified and potential policies to promote innovative technologies be evaluated? J. Clean. Prod. 2012, 35, 140–151. [Google Scholar] [CrossRef]
  8. Mancini, E.; Longo, M.; Yaici, W.; Zaninelli, D. Assessment of the Impact of Electric Vehicles on the Design and Effectiveness of Electric Distribution Grid with Distributed Generation. Appl. Sci. 2020, 10, 5125. [Google Scholar] [CrossRef]
  9. Tareen, W.U.; Mekhilef, S.; Seyedmahmoudian, M.; Horan, B. Active power filter (APF) for mitigation of power quality issues in grid integration of wind and photovoltaic energy conversion system. Renew. Sustain. Energy Rev. 2017, 70, 635–655. [Google Scholar] [CrossRef]
  10. Szinai, J.K.; Sheppard, C.J.; Abhyankar, N.; Gopal, A.R. Reduced grid operating costs and renewable energy curtailment with electric vehicle charge management. Energy Policy 2020, 136, 111051. [Google Scholar] [CrossRef]
  11. Einaddin, A.H.; Yazdankhah, A.S. A novel approach for multi-objective optimal scheduling of large-scale EV fleets in a smart distribution grid considering realistic and stochastic modeling framework. Int. J. Electr. Power Energy Syst. 2020, 117, 105617. [Google Scholar] [CrossRef]
  12. Kumar, R.; Saxena, D. Impact of Plug-In Electric Vehicles on Faulted Distribution System. Arab. J. Sci. Eng. 2020, 45, 1599–1614. [Google Scholar] [CrossRef]
  13. Dileep, G. A survey on smart grid technologies and applications. Renew. Energy 2020, 146, 2589–2625. [Google Scholar] [CrossRef]
  14. Rawat, T.; Niazi, K.R.; Gupta, N.; Sharma, S. Impact assessment of electric vehicle charging/discharging strategies on the operation management of grid accessible and remote microgrids. Int. J. Energy Res. 2019, 43, 9034–9048. [Google Scholar] [CrossRef]
  15. Alonso, M.; Amaris, H.; Germain, J.G.; Galan, J.M. Optimal charging scheduling of electric vehicles in smart grids by heuristic algorithms. Energies 2014, 7, 2449–2475. [Google Scholar] [CrossRef]
  16. Shaaban, M.F.; El-Saadany, E. Accommodating high penetrations of PEVs and renewable DG considering uncertainties in distribution systems. IEEE Trans. Power Syst. 2013, 29, 259–270. [Google Scholar] [CrossRef]
  17. Pantoš, M. Stochastic optimal charging of electric-drive vehicles with renewable energy. Energy 2011, 36, 6567–6576. [Google Scholar] [CrossRef]
  18. Noorollahi, Y.; Aligholian, A.; Golshanfard, A. Stochastic energy modeling with consideration of electrical vehicles and renewable energy resources-A review. J. Energy Manag. Technol. 2020, 4, 13–26. [Google Scholar]
  19. Sanchez-Martin, P.; Sanchez, G.; Morales-España, G. Direct load control decision model for aggregated EV charging points. IEEE Trans. Power Syst. 2012, 27, 1577–1584. [Google Scholar] [CrossRef]
  20. Deilami, S.; Masoum, A.S.; Moses, P.S.; Masoum, M.A. Real-time coordination of plug-in electric vehicle charging in smart grids to minimize power losses and improve voltage profile. IEEE Trans. Smart Grid 2011, 2, 456–467. [Google Scholar] [CrossRef]
  21. Olatunde, O.; Hassan, M.Y.; Abdullah, M.P.; Rahman, H.A. Hybrid photovoltaic/small-hydropower microgrid in smart distribution network with grid isolated electric vehicle charging system. J. Energy Storage 2020, 31, 101673. [Google Scholar] [CrossRef]
  22. Davidson, S. Technical and regulatory failures driving higher electricity prices in Western Australia-case study. In WEC2019: World Engineers Convention 2019; Engineers Australia: Melbourne, Australia, 2019; p. 1439. [Google Scholar]
  23. Jakus, D.; Čađenović, R.; Vasilj, J.; Sarajčev, P. Optimal Reconfiguration of Distribution Networks Using Hybrid Heuristic-Genetic Algorithm. Energies 2020, 13, 544. [Google Scholar] [CrossRef] [Green Version]
  24. Rahman, I.; Vasant, P.; Singh, B.S.M.; Abdullah-Al-Wadud, M. Hybrid particle swarm and gravitational search optimization techniques for charging plug-in hybrid electric vehicles. In Sustainable Infrastructure: Breakthroughs in Research and Practice; IGI Global: Hershey, PA, USA, 2020; pp. 195–228. [Google Scholar]
  25. Zhang, Z.; Wang, J.; Zhong, H.; Ma, H. Optimal scheduling model for smart home energy management system based on the fusion algorithm of harmony search algorithm and particle swarm optimization algorithm. Sci. Technol. Built Environ. 2020, 26, 42–51. [Google Scholar] [CrossRef]
Figure 1. Proposed algorithm flow chart.
Sustainability 12 09211 g001
Figure 2. Electric vehicle (EV) mobility pattern.
Sustainability 12 09211 g002
Figure 3. Daily load profile.
Sustainability 12 09211 g003
Figure 4. IEEE 33-node medium-voltage network coupled with a low-voltage network.
Sustainability 12 09211 g004
Figure 5. Impact of uncoordinated EV charging on system loading.
Sustainability 12 09211 g005
Figure 6. Impact of uncoordinated EV charging on voltage profile.
Sustainability 12 09211 g006
Figure 7. Impact of uncoordinated EV charging on system power loss.
Sustainability 12 09211 g007
Figure 8. Impact of coordinated EV charging on system load demand.
Sustainability 12 09211 g008
Figure 9. Impact of coordinated EV charging on voltage profile.
Sustainability 12 09211 g009
Figure 10. Impact of coordinated EV charging on system power loss.
Sustainability 12 09211 g010
Figure 11. A comparison of voltage variation with and without network reconfiguration.
Sustainability 12 09211 g011
Figure 12. Comparison of system power loss with and without network reconfiguration.
Sustainability 12 09211 g012
Table 1. Modified IEEE 33-bus system data.
S.NO.From NodeTo NodeSwitchR (Ω)X (Ω)P (kW)P.F
112S10.09220.0470400.9
223S20.49300.251245
334S30.36600.186460
445S40.38110.194130
556S50.81900.707060
667S60.18720.6188100
778S71.71140.2351100
889S81.03000.740060
9910S91.04400.740060
101011S100.19660.065140
111112S110.37440.129860
121213S121.46801.154930
131314S130.54160.712960
141415S140.59100.526060
151516S150.74600.746260
161617S161.28901.288960
171718S170.73200.732045
18219S180.16400.164045
191920S191.50421.504245
202021S200.40950.409545
212122S210.70890.708945
22323S220.45120.451245
232324S230.89800.8980100
242425S240.89600.8959100
25626S250.20310.203130
262627S270.28420.284230.
272728S281.05891.058930
282829S290.80430.804360
292930S300.50740.5074100
303031S310.97450.974582.5
313132S320.31050.3105100
323233S330.34110.341130
Tie Switches (Normally open to maintain the radial topology of the network)
S. No.From NodeTo NodeTie Switches
1821S33
2915S34
31222S35
41833S36
52529S37
Table 2. Impact of different scenarios of EV charging on system performance.
ParametersUncoordinated
Charging
Coordinated Charging without Network ReconfigurationCoordinated Charging with Network Reconfiguration
V r e f
( p . u )
V i
( p . u )
Δ V
( % )
V r e f
( p . u )
V i
( p . u )
Δ V
( % )
V r e f
( p . u )
Δ V
( % )
Δ V
( % )
Minimum Voltage Deviation (%)
Δ V m i n = V r e f V i , m a x V r e f × 100 %
10.96410.96410.973
Maximum Voltage deviation (%)
Δ V m a x = V r e f V i , m i n V r e f × 100 %
10.93710.94610.955
Current loading (p.u) I s ,   m i n 0.860.860.85
Current loading (p.u) I s , m a x 1.031.000.99
Power loss (kW) P   l o s s , m i n 757551
Power loss (kW) P l o s s , m a x 1049968
Energy loss (MWh)2.222.201.51
Open SwitchesS33, S34, S35, S36, S37S33, S34, S35, S36, S37S7, S9, S14, S28, S31
Publisher’s Note: MDPI stays neutral with regard to jurisdictional claims in published maps and institutional affiliations.

