Ageing and Cooling of Hot-Mix-Asphalt during Hauling and Paving—A Laboratory and Site Study


1
Faculty of Engineering, Università degli Studi eCampus, 22060 Novedrate, Italy
2
Department of Construction, Civil Engineering and Architecture, Università Politecnica delle Marche, 60131 Ancona, Italy
3
Ufficio Geologia e Prove Materiali, Autonomous Province of Bolzano, 39053 Cardano, Italy
*
Author to whom correspondence should be addressed.
Sustainability 2020, 12(20), 8612; https://doi.org/10.3390/su12208612
Submission received: 12 August 2020
/
Revised: 12 October 2020
/
Accepted: 15 October 2020
/
Published: 17 October 2020
(This article belongs to the Special Issue Sustainable Pavement Engineering and Road Materials)
Abstract
:In road construction, it can happen that, for different reasons, the time between hot-mix asphalt (HMA) production and paving is extended to some hours. This can be reflected in several problems such as mix cooling and temperature segregation, but also in an extremely severe bitumen ageing due to its prolonged exposure to high temperatures. This paper deals with the investigation of these phenomena both in the laboratory and on site. In particular, the first part of the research aimed at observing the influence of the conditioning time, when the loose HMA is kept in the oven at a high temperature, on the mix properties. The second part focused on the ageing/cooling that happens on site during HMA hauling, as a function of time and type of truck. Temperatures were monitored using a thermal camera and different probes, and gyratory compactor specimens were produced by sampling some HMA from the trucks every 1 h for 3 h. The results showed that HMA stiffness rises if the time when the loose mix stays in the laboratory oven before compaction increases. However, on site, the HMA volumetric and mechanical properties do not change with hauling time up to 3 h, probably because the external material in the truck bed protects the HMA core from the access of oxygen, hindering bitumen oxidation and loss of volatiles. The temperature monitoring highlighted that temperature segregation, after 3 h hauling, can be higher than 30 °C but it can be reduced using insulated truck beds.
Keywords:
hot-mix asphalt; ageing; cooling; temperature segregation; hauling; insulated truck; re-heating1. Introduction
(HMA) is a composite material used extensively worldwide for the construction of pavements and it consists of aggregates and bitumen. The nature of the components and the production procedure of HMA, as well as the construction techniques and the environmental conditions during hauling and paving, influence the volumetric and mechanical properties of flexible layers and, hence, the pavement service life [1,2].
One of the factors that mainly affect HMA performance is bitumen ageing. At a chemical level, two mechanisms mainly govern the ageing process of bitumen: oxidation reaction and loss of volatiles [3,4,5]. The oxidation reaction refers to the introduction of oxygen-rich functional groups on the asphaltene molecules, determining the generation of strong intermolecular interactions and the formation of asphaltene clusters [6,7,8]. The loss of volatiles entails the decrease in the bitumen aromatic content, which causes the destabilization of the asphaltenes and intensifies their agglomeration [9,10,11]. In the components saturates, aromatics, resins and asphaltenes (SARA), these phenomena determine, in percentage, the reduction in the aromatics and the increase in the resins (which in turn generate asphaltenes), whereas saturates basically do not change, because of their poor reactivity [12]. As bitumen viscosity is strictly related to the asphaltene content, the effect of oxidation clearly reflects on the stiff and hard behavior, the low adhesive properties and the poor coating ability [13,14,15]. From an engineering point of view, two steps can be identified in the ageing process, namely the short-term ageing, which happens during the HMA production and paving, and long-term ageing, which gradually happens during pavement service life.
Temperature plays a fundamental role in bitumen ageing, as it can accelerate the chemical modifications. This is particularly important in the short-term step [16]. For this reason, during HMA manufacturing, it is fundamental to avoid bitumen overheating, which means containing the temperatures in the bitumen storage silo and inside the drum.
Moreover, both in the laboratory and in real road construction, HMA is sometimes kept at a high temperature for a long time. On site, this issue is typically associated with long hauling distances or to logistical problems during paving operations (paver running and HMA supply can be badly synchronized). In the laboratory, this happens, for example, when big HMA batches need to be heated (large volumes require a long time for the heat to reach the inner part of the material) or when many specimens have to be compacted from the same HMA batch (the material for the last specimen stays in the oven for a longer time compared to the first). If the HMA stays at a high temperature for an extended time, this can be reflected in a more severe short-term ageing [17,18]. The phenomenon is even more magnified if the HMA is left cooling and later reheated [19]. Kidd et al. [20] observed that the reheating of loose asphalt mixture results in changes to mix properties, particularly in the linear viscoelastic field (resilient and flexural modulus). Daniel [21] compared HMA specimens compacted at the plant or in the laboratory (after reheating) and noted that the latter have a significantly higher stiffness and brittleness, as a result of the double short-term ageing.
For HMA hauling, two types of truck can be used, equipped with ordinary or insulated beds [22]. In the ordinary truck, heat is transferred to the surrounding environment by convection and radiation, thus the HMA temperature decreases, particularly in correspondence with the material surface (generating a cool thin crust) and on the bed edges and corners. Conversely, insulated trucks have a protected bed that prevents heat loss and are typically used when HMA has to be delivered to far away paving locations. The most common insulating materials used for the protection of the truck bed are rock wool, plywood or wood of a different nature [22,23].
Therefore, in the case of ordinary trucks, the main concern that must be managed is represented by HMA cooling, which can interest the entire material volume in the truck bed or only some parts (the so-called temperature segregation) [24]. Several researchers demonstrated that temperature decreases determine a significant reduction in HMA compactability during paving operations [25,26,27,28]. In particular, it is essential to complete the compaction process before the temperature of HMA falls below a certain point known as cessation temperature, or a further increase in HMA density cannot be achieved despite repetitive passes of rollers [29,30]. This is reflected in a higher risk of moisture damage, raveling, rutting and cracking [24,31,32].
In the case of insulated trucks, the main issue is the extended time during which the material is kept at a high temperature, which can determine an extra short-term ageing. This can also cause a lack of HMA compactability, because of the increased bitumen viscosity, but in particular it determines high stiffness and brittleness, leading to premature fatigue and thermal cracking [33].
In light of these matters, the present research investigates the influence of the time during which HMA is kept at high temperature, both in the truck bed or in the laboratory oven, and the influence of the truck type on HMA ageing (or cooling). The aim is to help the scientific community to understand the beneficial (temperature preservation and reduction in segregation?) and detrimental (extra-ageing?) effects related to the use of insulated trucks, in comparison with the ordinary trucks and the lab-simulated conditions.
2. Objectives and Experimental Program
2.1. Research Purposes
The purposes of this research program were multiple. The first part of the experimentation was carried out in the laboratory and aimed to study the evolution of the HMA volumetric and mechanical characteristics with a growing conditioning time of the loose mixture in the oven. Four HMAs were investigated in particular, including different amounts of Reclaimed Asphalt Pavement—RAP (0%, 25% and 40%) and produced through different rejuvenating techniques (indicated with the codes R1 and R2). After mixing, the HMAs were left in the oven at 180 °C (which is the typical temperature of HMA with a polymer-modified binder when exiting from the production plant) for different times (from 30 to 180 min) before specimen compaction in order to observe the influence of conditioning time on air voids content and indirect tensile stiffness modulus. Table 1 summarizes the tested mixes.
The second part of the experimental program, including field and laboratory tests, had a two-fold objective:
- (1)
- investigating the ageing that happens during HMA hauling as a function of time and type of truck and
- (2)
- highlighting the issues related to temperature segregation of HMA during paving operations.
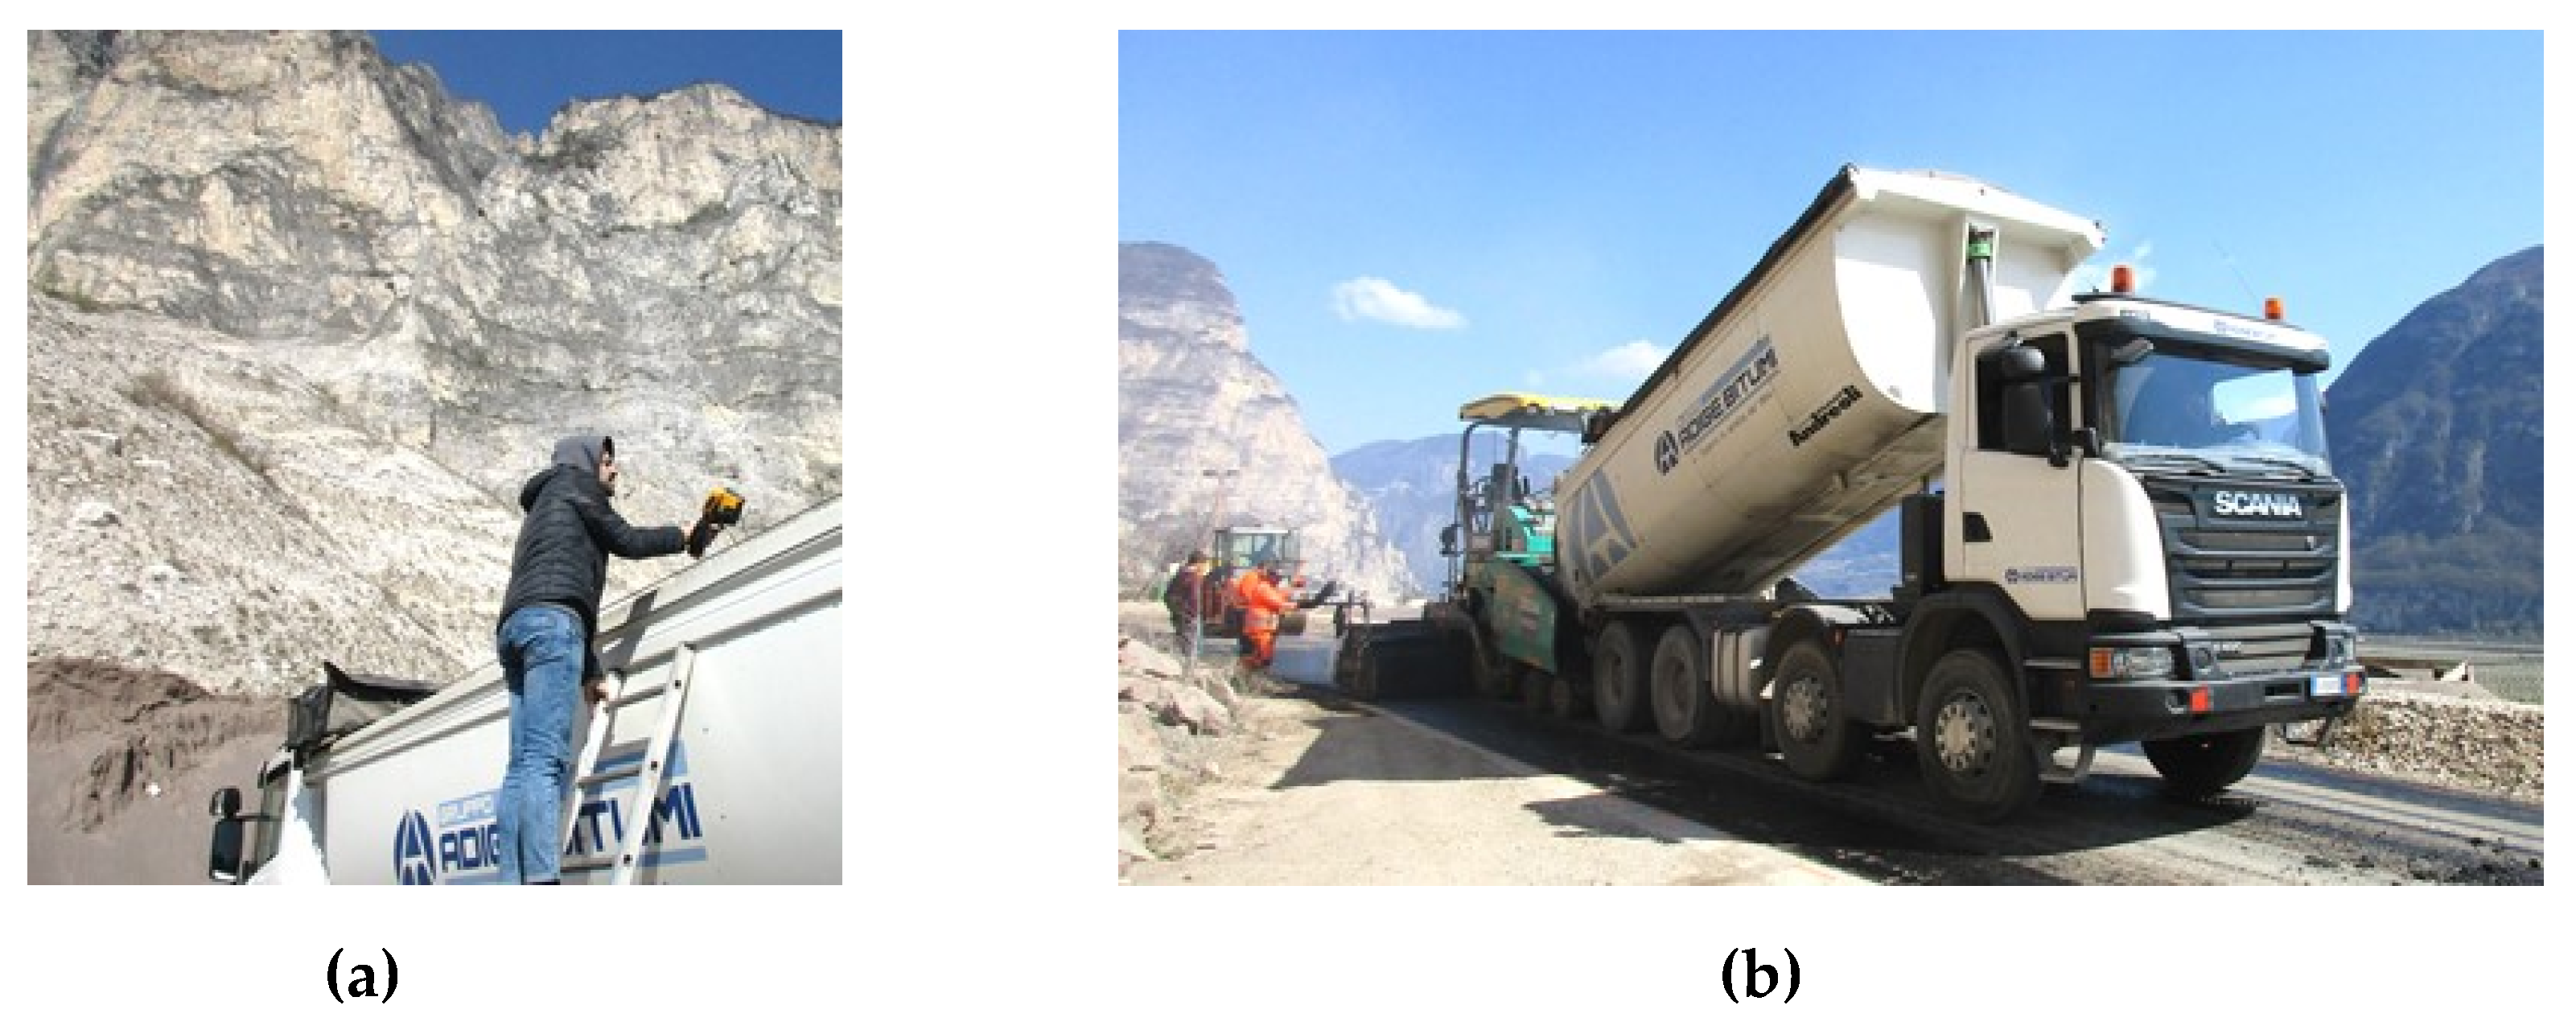
Four different batch plants (A, B, C and D) operating in the Autonomous Province of Bolzano (northern Italy) were selected to produce HMA with polymer-modified bitumen (PMB). The loose mixtures were dumped into two different kinds of trucks (normal and insulated) which had travelled around the nearby roads for 3 h, in order to simulate the hauling phase. Every 1 h, they came back to the plant and the temperature of the HMA was evaluated using probe and infrared thermometers. In addition, an infrared thermal camera was used to check the temperature segregation on the surface of the loose mixture inside the truck bed (Figure 1a). During each stop, some HMA was sampled from the truck bed at a depth of 50 cm and compacted using a shear gyratory compactor (SGC) providing a 100 mm diameter and 100 revolutions according to EN 12697-31 [34]. Finally, the HMA was laid down using a paving machine (Figure 1b). During this phase, temperatures were checked in order to evaluate any temperature segregation in the road surface. After a few days, cores were taken out from the pavement for laboratory testing. For plant A, the loose mix was also sampled during paving, left cooling, re-heated in the laboratory at 170 °C for 150 min (heating the loose mix for 60 min, separating it into 1200 g samples and further heating for 90 min) and compacted using SGC. Table 2 reports the dataset available for each batch plant. On the specimens and cores, air voids content, indirect tensile stiffness modulus, indirect tensile strength and cracking tolerance index were determined.
2.2. Test Methods
2.2.1. Volumetric Analysis
The volumetric characteristics of the HMA mixtures were evaluated in terms of air voids content according to EN 12697-8 [35]. In particular, the air voids content vm was calculated through Equation (1).
where ρm is the maximum density and ρb is the bulk density. The maximum density ρm was calculated according to the EN 12697-5—mathematic method [36], considering the real aggregate and bitumen percentage contents (measured through bitumen extraction) and assuming the densities of 2.70 mg/m3 and 1.02 mg/m3 for aggregate and bitumen, respectively. The bulk density ρb was measured according to EN 12697-6, Procedure C—sealed specimen [37], by weighting the sealed specimen in air and in water.
2.2.2. Indirect Tensile Stiffness Modulus Test
The indirect tensile stiffness modulus (ITSM) is the most popular form of non-destructive stress-strain measurement used to evaluate the elastic properties of bituminous mixtures and it is considered a very important performance parameter in pavement design [38]. European Norm EN 12697-26—Annex C [39] defines the ITSM (MPa) according to Equation (2).
where F (N) is the peak value of the applied vertical load, z (mm) is the amplitude of the horizontal deformation obtained during the load cycle, h (mm) is the mean thickness of the test specimen and v is the Poisson’s ratio, here assumed to be 0.35 [40]. The test was performed in control-horizontal displacement configuration using a servo-pneumatic device. The system adjusted the magnitude of the vertical force during the first ten conditioning pulses, such that the specified target-peak transient horizontal displacement of 3 μm was achieved. During testing, the rise time, which is the time when the applied load increases from zero to the maximum value, was set at 124 ms. The test was performed at 20 °C.
2.2.3. Temperature Monitoring
On site, the HMA temperature was determined by using both infrared and probe thermometers. The first uses the amount of infrared energy emitted by the HMA and its emissivity to evaluate, within a certain range, its actual temperature. They are sometimes called non-contact thermometers or temperature guns, to describe the device’s ability to measure temperature from a distance. The second is a thermometer that has a pointy metal stem that can be inserted into the loose mixture. The temperature probe was introduced into the loose mixture, orthogonally to the surface, to a depth of about 2 cm. This kind of measurement requires approximately 2 minutes to reach the thermal equilibrium and obtain a consistent value of the mix temperature.
In addition, a thermographic camera was used to investigate the temperature variation of the mixtures in the truck and during the paving operations. The electromagnetic spectrum encompasses radiation from gamma rays, X-rays, ultraviolet, a thin region of visible light, infrared, terahertz waves, microwaves, and radio waves. All objects emit a certain amount of black body radiation as a function of their temperature. The higher the object’s temperature, the more infrared radiation (with wavelengths approximately between 1000 nm and 14,000 nm) is emitted as black body radiation. The thermographic camera can detect this radiation in a way similar to the way in which an ordinary camera detects the visible light.
The contemporary use of multiple devices for temperature monitoring allowed the analysis of different aspects: the infrared and probe thermometers recorded the mix temperature in specific points and gave information of the local behavior, while the thermographic camera showed the temperature of the entire construction site, highlighting the dissimilarities between different areas of the truck bed and the pavement surface.
2.2.4. Indirect Tensile Strength Test
The mechanical resistance of HMA specimens and cores was determined in terms of indirect tensile strength (ITS), according to EN 12697-23 [41]. In the ITS test, cylindrical samples were subjected to a compressive load acting parallel to the vertical diametral plane using a universal hydraulic press. This type of loading produced a relatively uniform tensile stress in perpendicular direction and the sample usually failed by splitting along the loaded plane. The ITS (MPa) was calculated through the following Equation (3).
where F (N) is the peak value of the applied vertical load, L (mm) is the mean thickness of the test sample and D (mm) is the sample diameter. The test was carried out at 25 °C and adopting a constant rate of vertical displacement of 50 mm/min.
2.2.5. Determination of Cracking Tolerance Index
In order to investigate the material resistance to cracking, the Cracking Tolerance index (CTindex) was determined according to ASTM D8225-19 [42]. CTindex was calculated from the load-vs-displacement curve of ITS tests by means of Equation (4).
where l75 is the displacement (mm) when the load is 75% of the peak value after the failure, |m75| is the absolute value of the post-peak slope of the load-vs-displacement curve (N/m) when the load is 75% of the peak value after the failure and Gf is the failure energy (J/m2), i.e., the ratio between the area of the load-vs-displacement curve and the specimen section (D ∗ L). It has to be specified that |m75|, as suggested by Zhou et al. [43], was determined from Equation (5).
where (l85, F85) and (l65, F65) are the points of the load-vs-displacement curve when the load is 85% and 65% of the peak value after the failure, respectively.
3. Effect of Conditioning Time in the Oven on Lab-Mixed HMA
3.1. Materials and Specimen Preparation
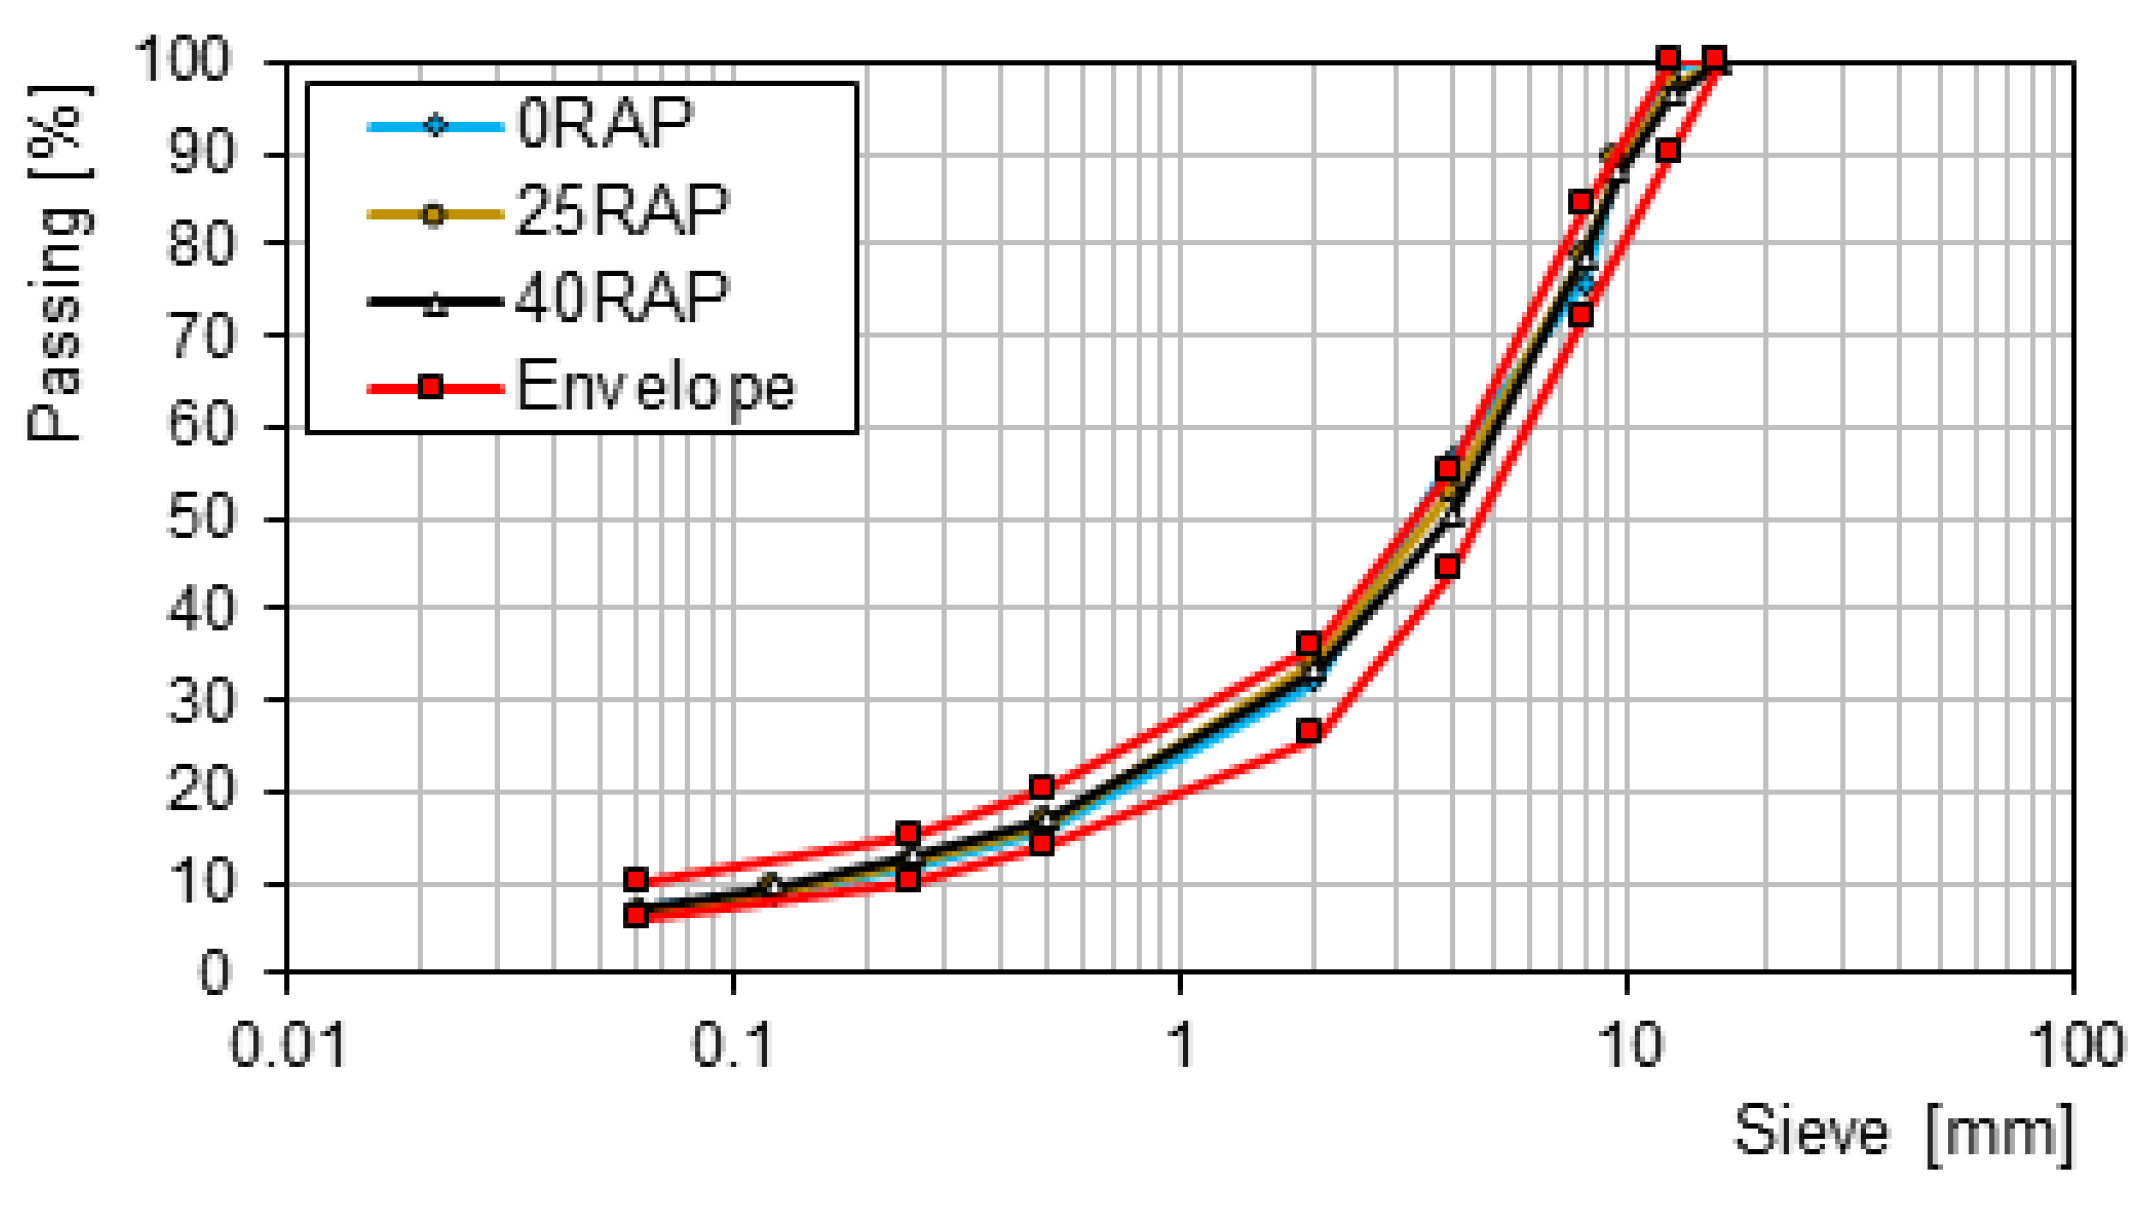
Porphyry gravel (in two fractions, with dimensions between 4 and 8 mm, respectively, and between 8 and 12 mm), coarse RAP (particles with dimensions between 8 and 16 mm), limestone sand and limestone filler were used. With the RAP content fixed, the virgin aggregate proportions were optimized to build a gradation curve for surface layers within the reference envelope [44]. For the RAP, the “white” gradation, i.e., that of the solid particles after binder extraction, was considered. The bitumen content in the RAP was 4.73% by mix weight. Figure 2 shows the gradation curves of the mixtures.
The 0RAP and 25RAP-R1 mixtures were produced using Styrene-Butadiene-Styrene (SBS) polymer modified bitumen (PMB) with penetration 50/70 (classified as PMB 45/80-70 according to EN 14023 [45]) and polymer content of 5% by weight (hard modification). The 25RAP-R1 mix included an oil-based rejuvenator, sprayed on the cold RAP before heating, with a dosage of 6% by RAP binder weight. For 25RAP-R2 and 40RAP-R2 mixtures a specific binder, engineered for hot-recycling applications (consisting of a base bitumen with penetration 70/100 modified with SBS and including rejuvenator), was used. In the mix design, a complete blending between RAP and the virgin binder was assumed. All the mixtures had a total bitumen content equal to 6% by mix weight.
According to the EN 12697-35 [46], the laboratory mixing procedure provided the heating at 180 °C of the components (aggregate, RAP and virgin bitumen) and the mixing for 30 s. The loose HMA was conditioned in the oven at 180 °C for different times, from 30 to 180 minutes. Then, cylindrical specimens with 100 mm diameter and approximately 67 mm height were compacted with 100 revolutions of SGC.
3.2. Results and Discussion from the Lab Investigation
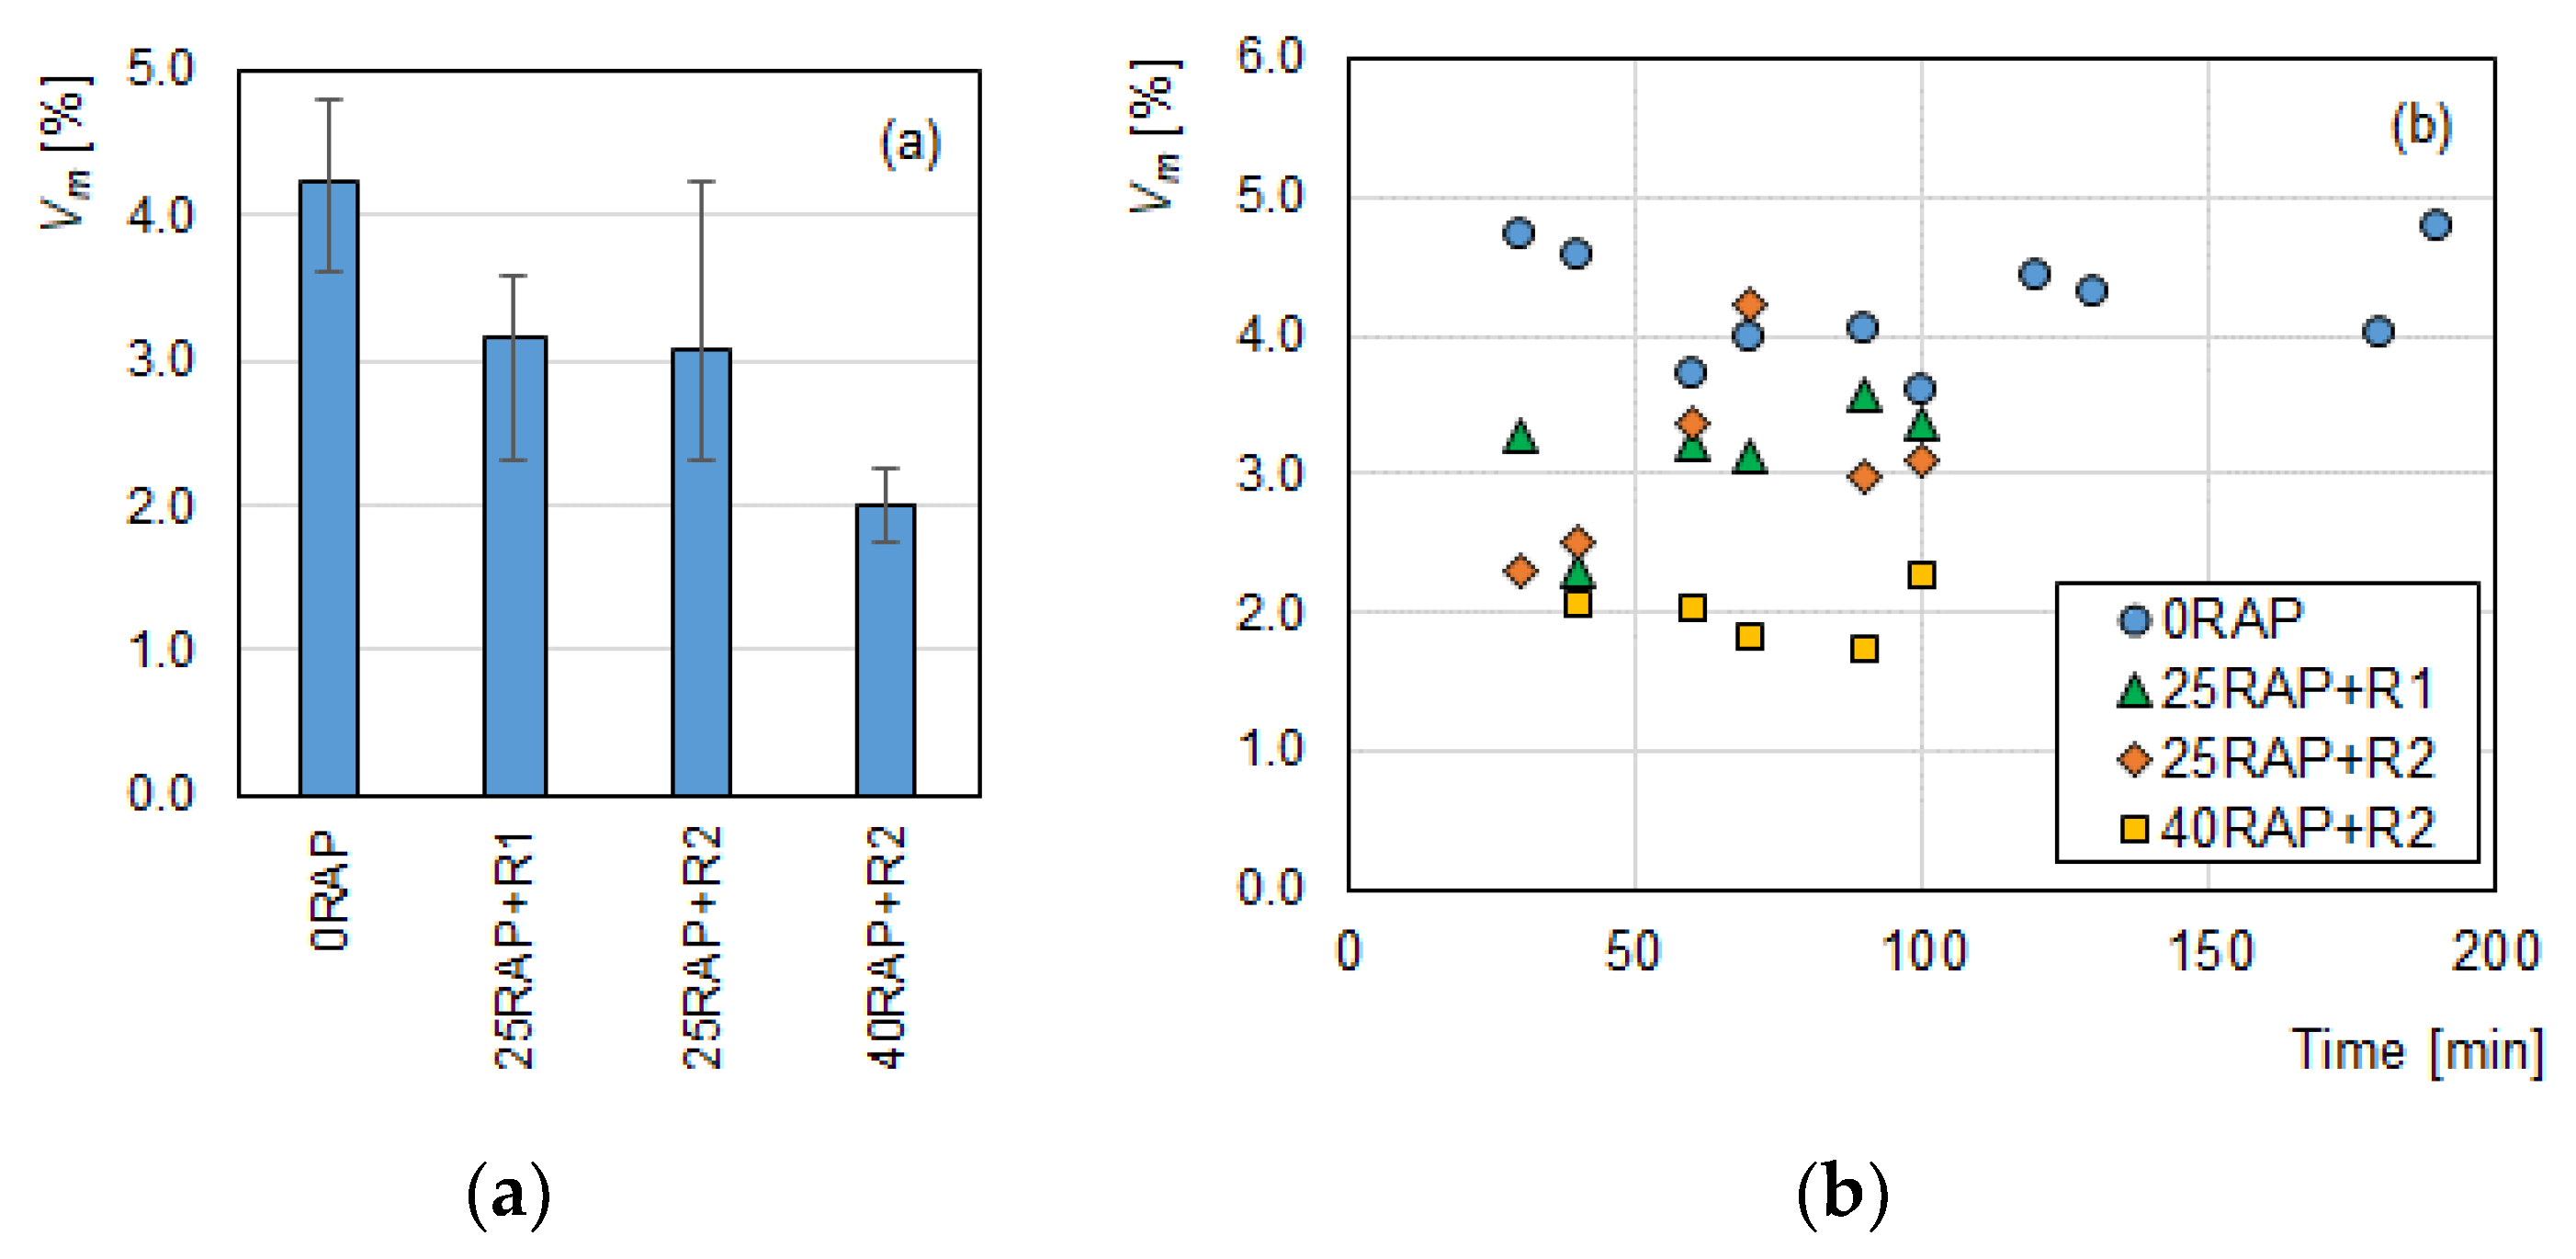
Figure 3 shows the average air voids content (Vm) of the specimens (a) and the trend of the voids content with the conditioning time in the oven (b). All the mixes were able to meet the Italian Specifications (3–6%), except for 40RAP + R2 that had an air voids content lower than the limit. The mixtures contained RAP achieved a greater density than the 0RAP, probably related to the lubricating and fluidifying effect of the rejuvenating techniques. In addition, no significant variation of the air voids content with the conditioning time was observed. This indicated that, even if the bitumen experienced a more severe ageing due to the prolonged conditioning at high temperature, this did not affect the compactability of the mixtures.
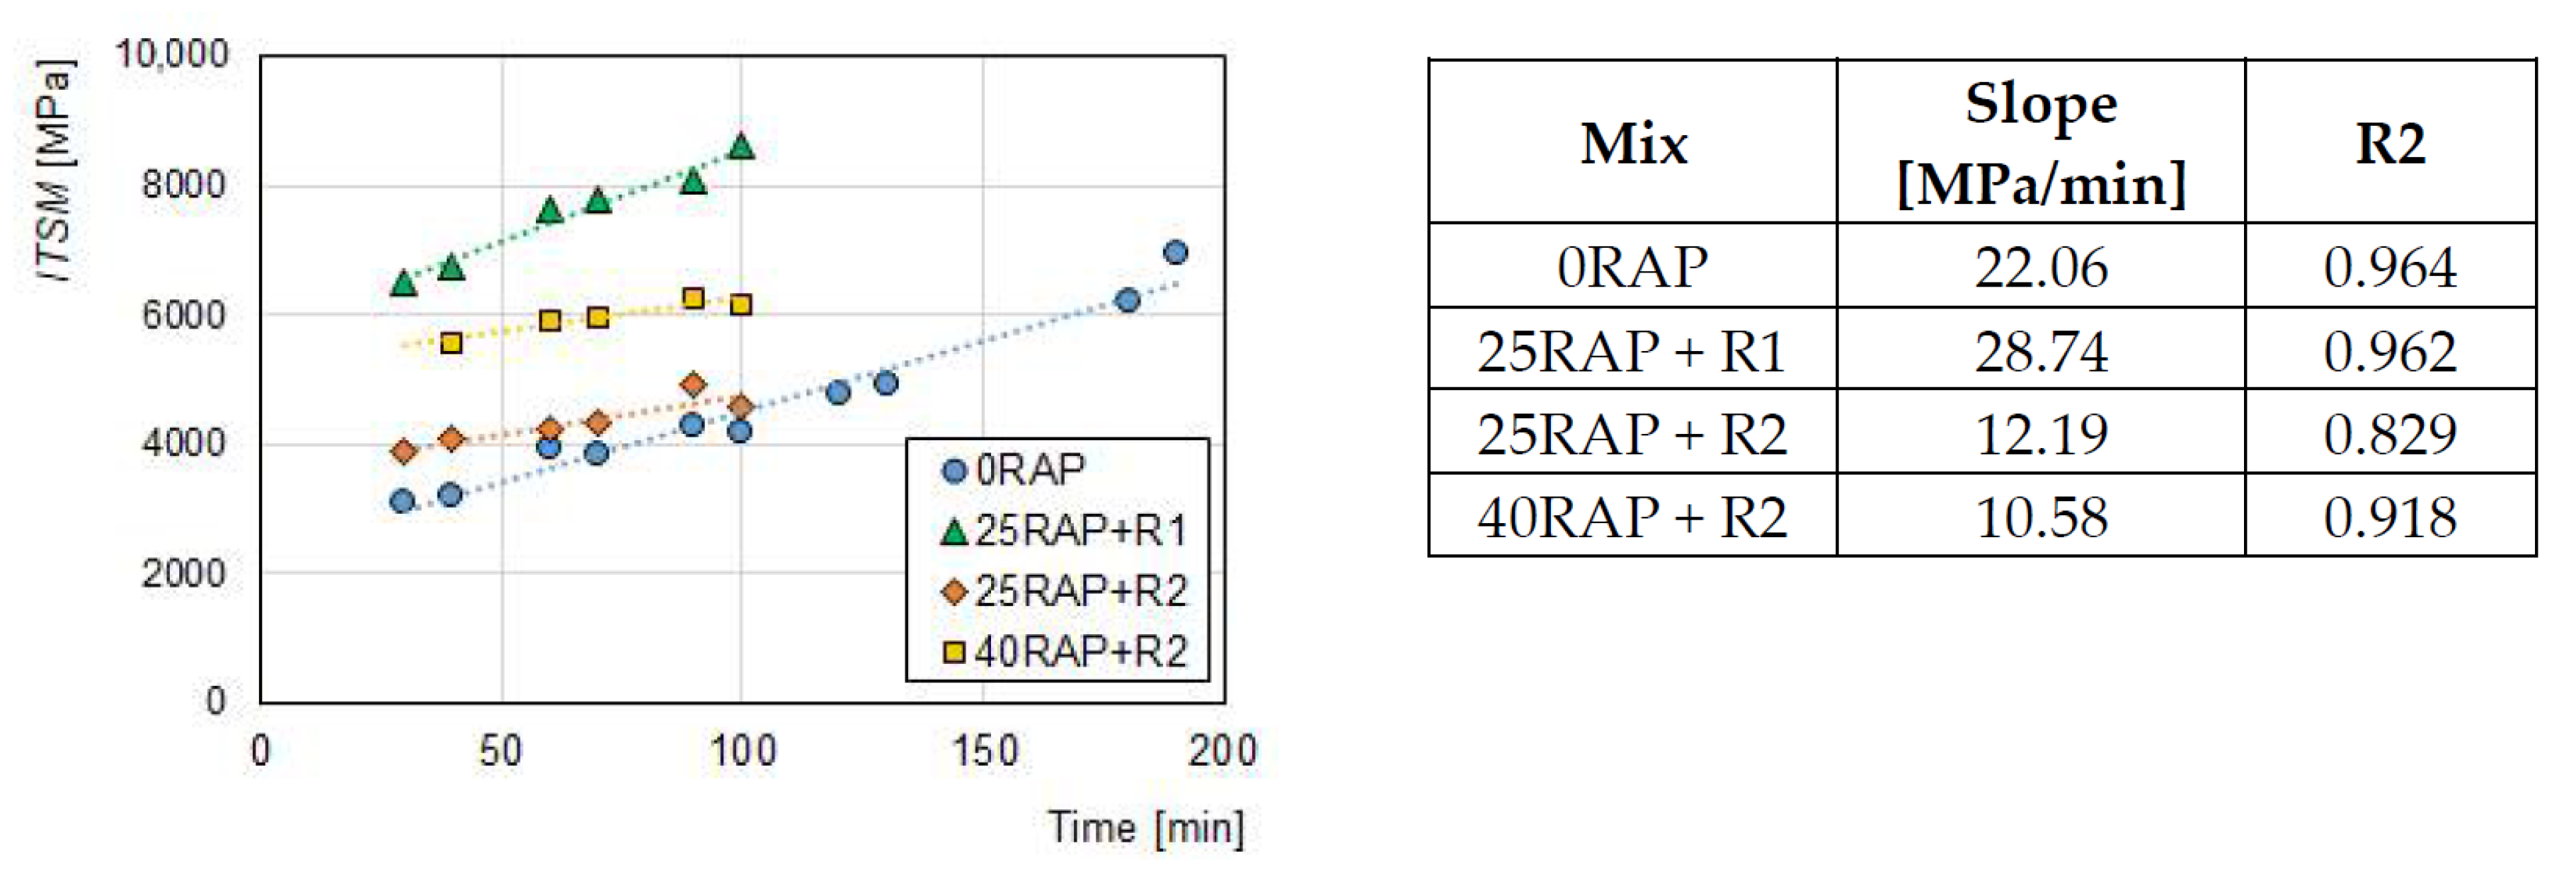
Figure 4 shows the ITSM values as a function of conditioning time in the oven, for the different mixtures. The data were interpolated with a linear trend, whose slope (reported in the table within Figure 4) represented a kind of speed of bitumen hardening: the greater the slope, the greater the sensitivity to ageing of the HMA.
It is very interesting to observe that all the mixtures tested showed a rising trend of stiffness when the conditioning time was increased. In particular, the 0RAP mix showed the lowest ITSM values for short conditioning times (3000 MPa for the conditioning time of 30 min). However, the growth rate for this mix was one of the highest, leading it to reach, after 180 min, an ITSM of 7000 MPa (+125%). The 25RAP + R1 mix resulted in the stiffest (ITSM approximately between 6500 MPa and 8500 MPa) and the most sensitive to the conditioning time in the oven. Probably, the rejuvenator had a low effectiveness in reducing the bitumen hardness, or it was subjected to evaporation during the conditioning at high temperature. The rejuvenation technique 2 (through a softer PMB including rejuvenator) was able to limit the mix stiffness. In fact, 25RAP + R2 specimens were almost as stiff as 0RAP specimens (ITSM approximately between 4000 MPa and 5000 MPa), while the ITSM of 40RAP + R2 specimens was slightly higher (approximately between 5500 MPa and 6500 MPa). In addition, the slope of the trends was significantly lower, denoting a lower tendency to ageing. This result is in agreement with other studies [21,33], according to which, the already-aged binder from RAP experiences a less severe ageing than virgin bitumen.
4. Effect of Hauling Time and Truck Type on Plant-Mixed HMA
Once the ageing and stiffening of the loose HMA conditioned in the oven were assessed, field studies were carried out in order to check if the same behavior also occurs on site during the hauling phase. At the same time, the study aimed at verifying whether any temperature segregation happens as a function of truck bed type, when the lay-down site is far from the plant.
4.1. Mix Properties
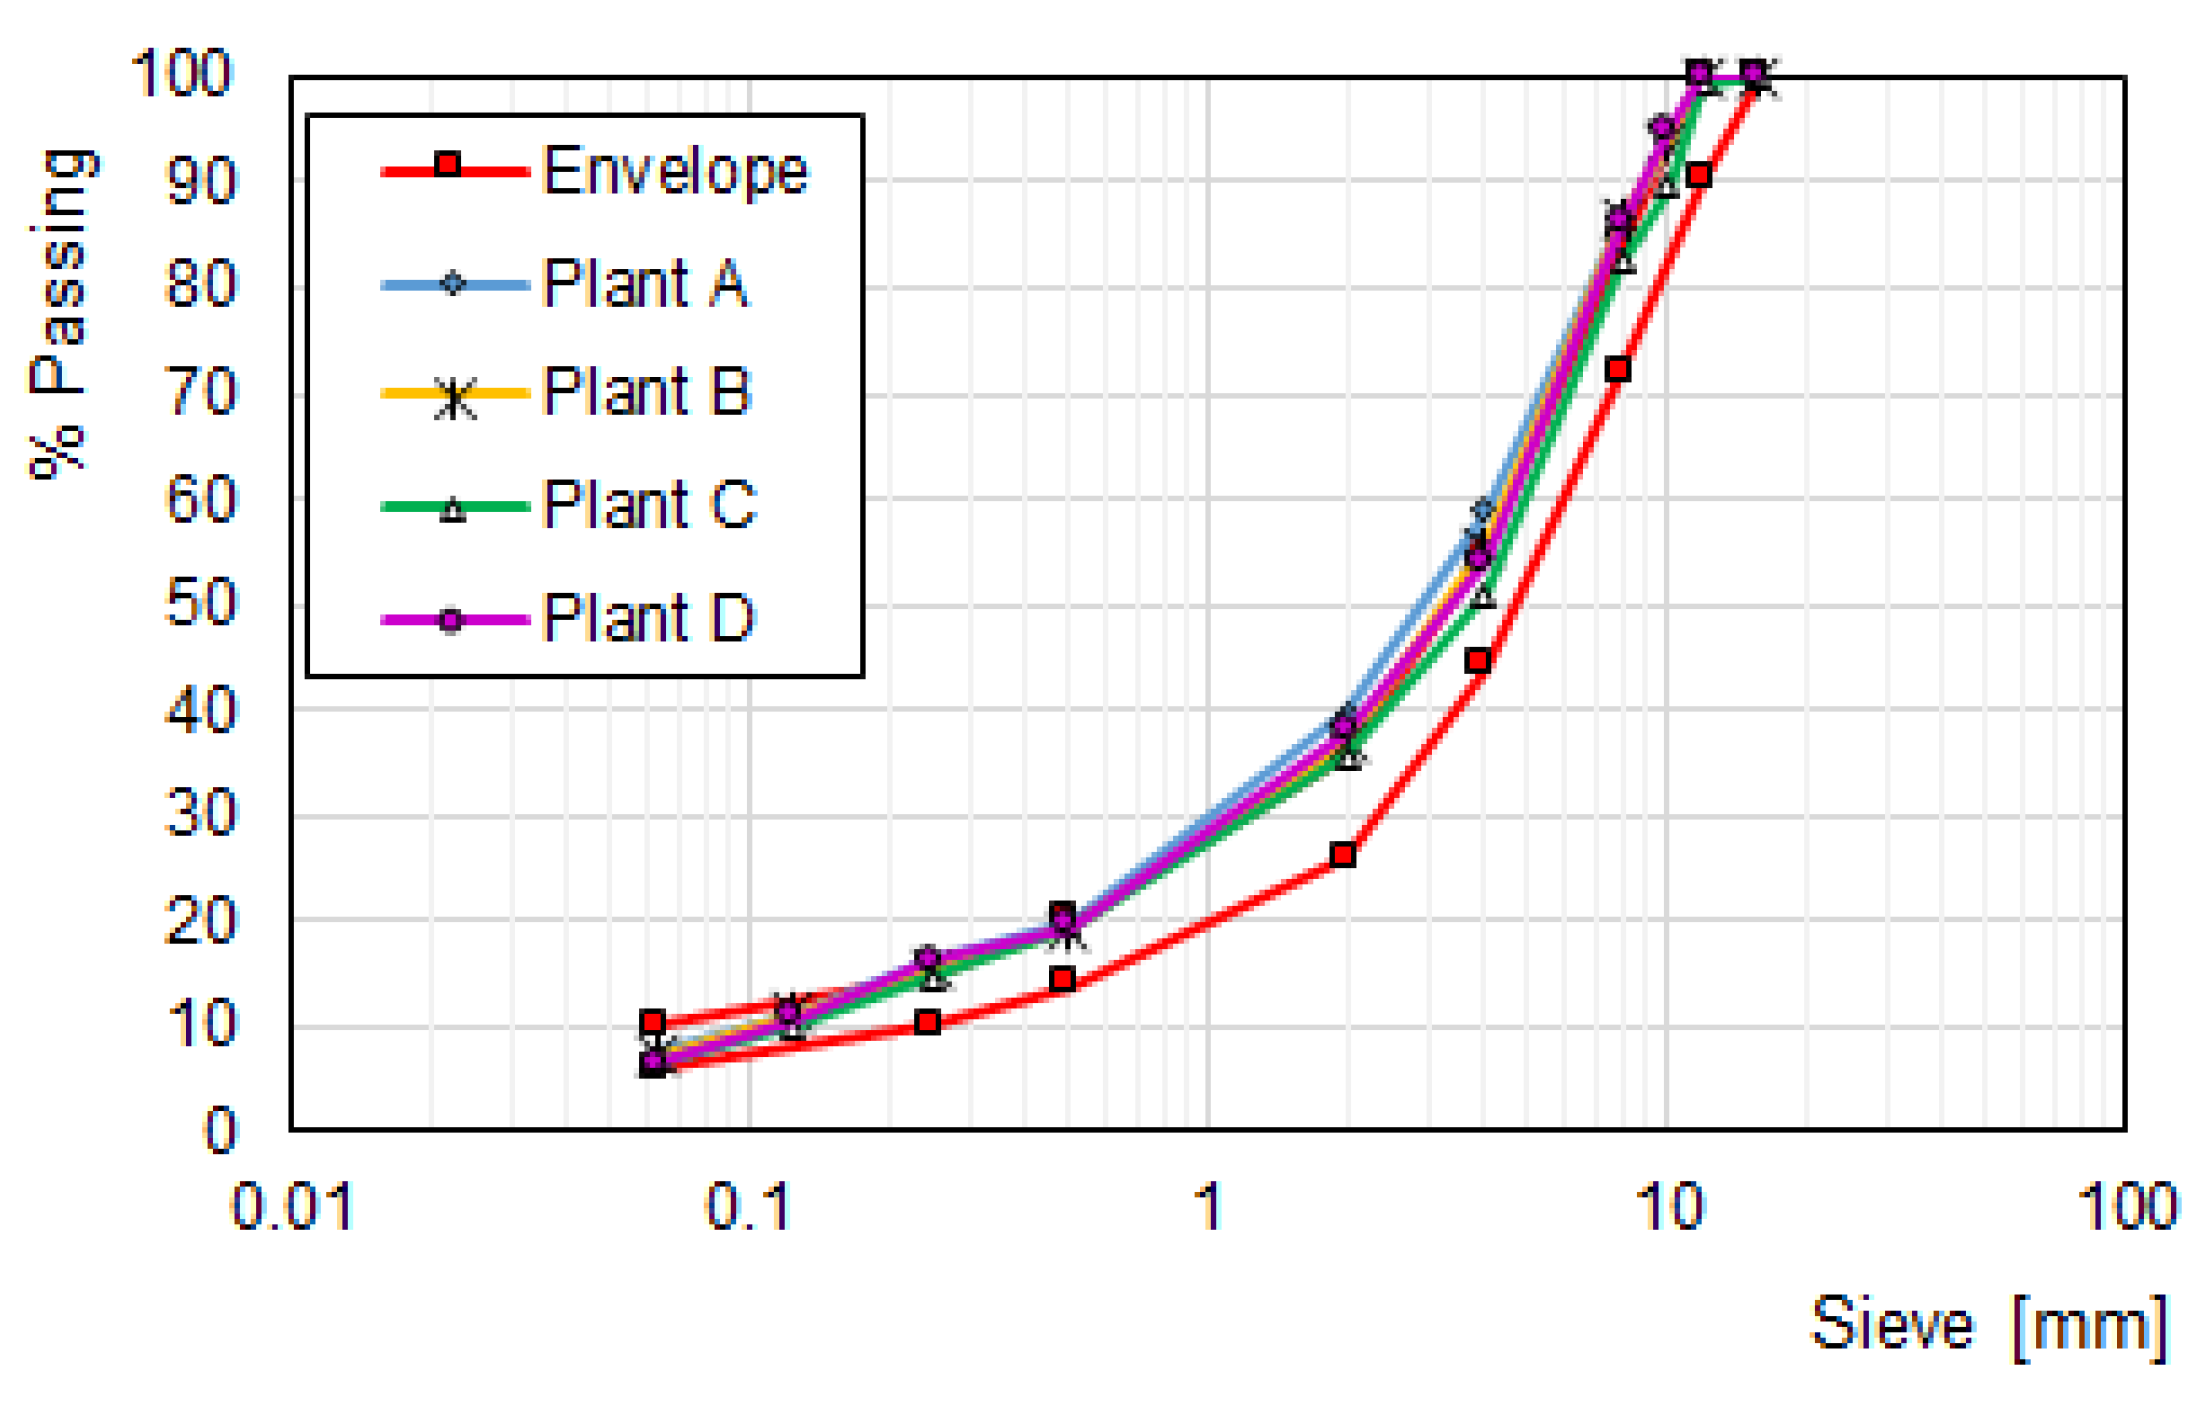
All the mixtures were produced using the same binder, classified as PMB 45/80-70 according to EN 14023 [45]. The binder content of the mixtures produced in each plant is reported in Table 3, while Figure 5 shows the aggregate distribution compared to the gradation limits for a surface layer defined by the local specifications [44].
All the gradation curves were collocated near the upper curve of the specifications; this means that every plant produced a mixture slightly finer than expected.
4.2. Result and Discussion from the Site Investigation
4.2.1. Evaluation of Temperatures during Hauling and Paving
The trials in the plants A, B, C and D were carried out between October 2018 and April 2019. In the chosen days, the average air temperature measured during the experimentation was about 15 °C and the weather was sunny.
Table 4 shows, for each system, the hours when the loose mixtures were produced and sampled from the truck bed, and the average temperatures measured on the top corner (C), inside the truck bed (B) and on the loose mixture sampled from the truck body at 50 cm depth (L). The average temperatures measured during the paving phases are shown in Table 5. Moreover, the time elapsed between the production of the mixtures and their lay-down is reported. In the table, the codes “N” and “I”, respectively, indicate the normal and the insulated trucks.
The data in Table 4 show that the cooling of the mix inside the truck bed (B) was very low (10 °C after about 3 h). Moreover, there was no significant difference between the normal and the insulated trucks. Probably, the tarpaulin which protected the top of the normal truck bed allowed the cooling on the material surface to be avoided, similar to the case of the insulated truck. Conversely, the temperatures on the top corner (C) and those measured on the loose mix (L) considerably decreased (up to 66 °C and 60 °C, respectively). For plant A, the insulated truck was proved to reduce the heat loss, particularly in the truck corner. However, for plant B, the lower precision in the measurement did not allow confirmation of this assumption.
From Table 5 it can be noted that the mix produced at plant B showed a comparable temperature in the paver if hauled with a normal or insulated truck. Some temperature differences between the different truck types were observed after the laying. As both the probe and infrared thermometers measured the temperature in localized positions of the road surface, this result was probably related to thermal segregation of the material during hauling. It was difficult to evaluate the influence of the truck type from the temperature determined on the pavement surface. However, the noticeably different temperature outside the truck bed was a sign of the insulated truck’s ability to preserve the HMA heat during the 3 h from production to paving.
4.2.2. Thermal Image Analysis
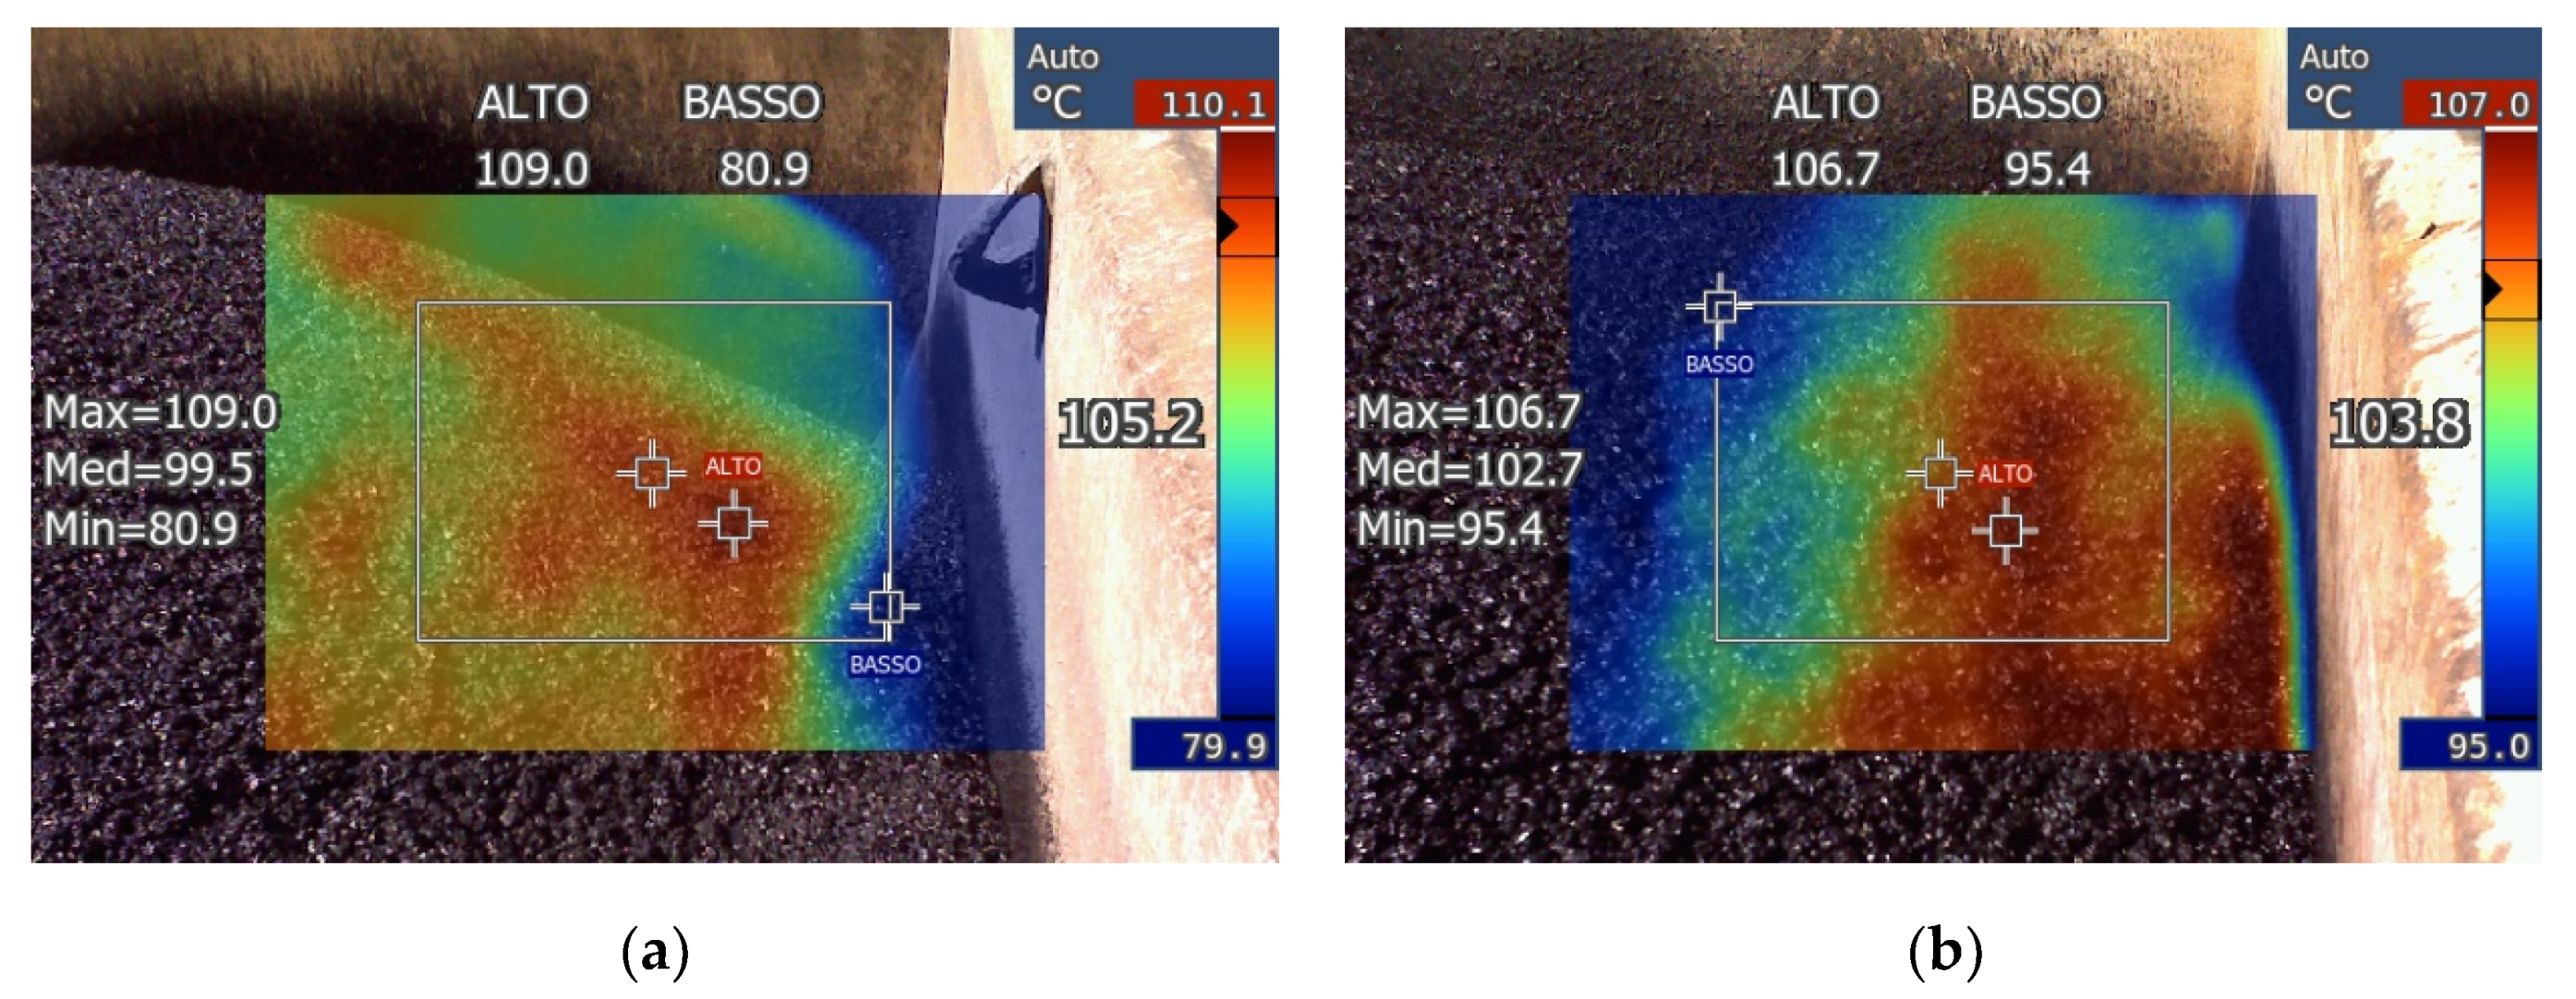
The pictures taken with the infrared camera were of considerable interest. Figure 6 and Figure 7 show the most significant images for the evaluation of HMA cooling and temperature segregation during hauling phase.
The strong external cooling compared to the almost zero cooling of the HMA batch determined a huge temperature segregation at the paving site, as evidenced by the measurements with the probe and infrared thermometers and by the photos with the thermal imaging camera. In particular, Figure 6a highlights that 3 h after mix production, near the corner of the normal truck, the loose HMA cooled rather quickly, showing a large temperature difference (approximately 30 °C) between the material in contact with the edge and that in the center of the truck bed. Conversely, in the case of insulated truck (Figure 6b), this temperature segregation was less severe (temperature variation of about 10 °C).
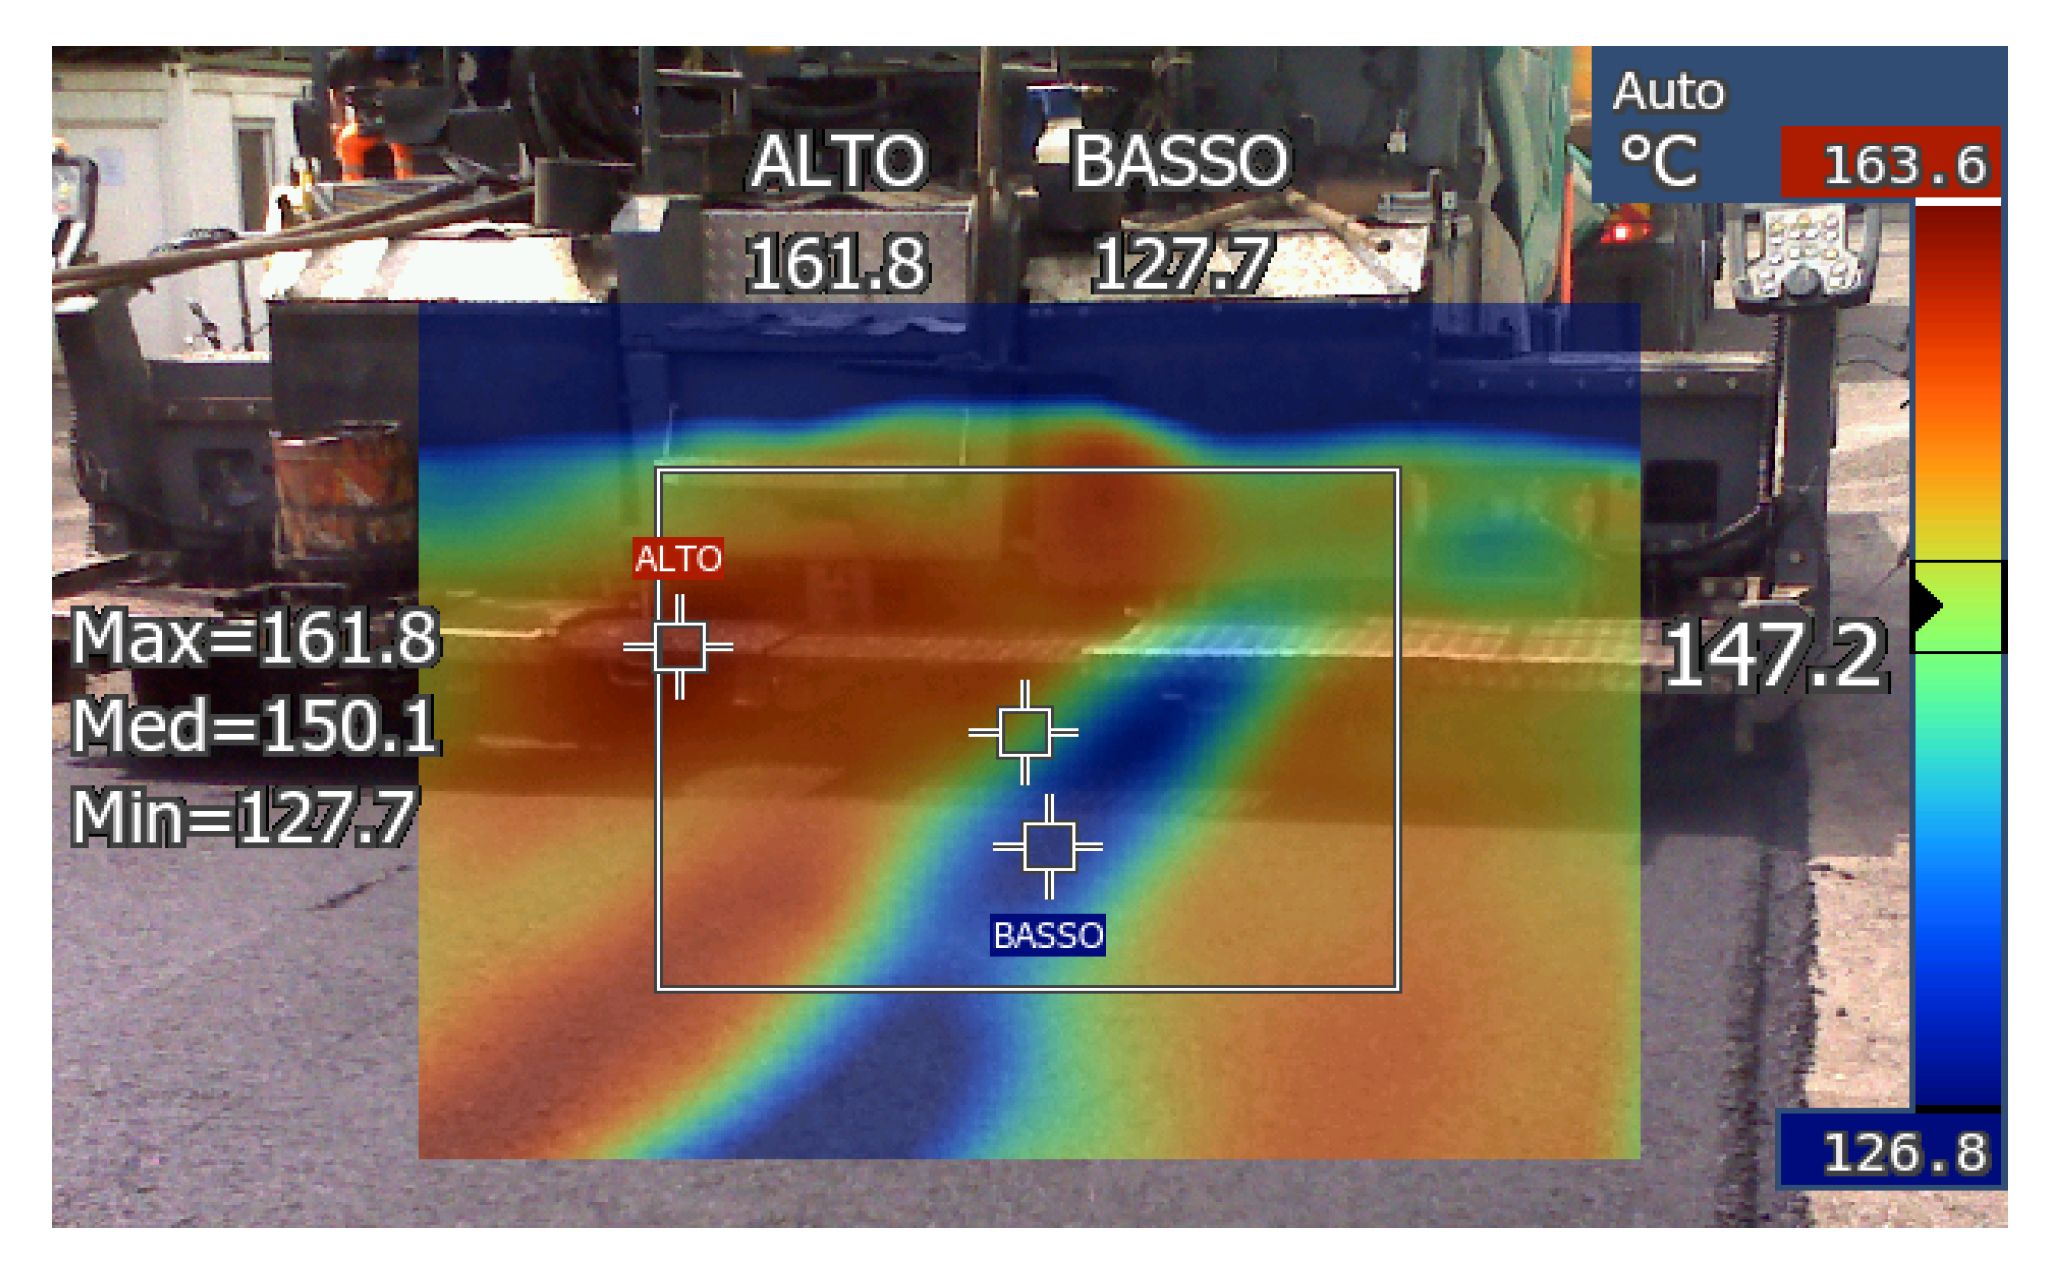
Figure 7 shows that, during the paving, there was a huge difference in the HMA temperature on the pavement surface (higher than 30 °C). This was probably due to the inability of the paving machine to re-mix the loose HMA and disperse the colder parts among the warmer mass. The temperature segregation can negatively affect the HMA compaction, especially in the construction of thin layers (i.e., surface layers) where the colder portions can hardly be heated by the surrounding material, even if much warmer. If the temperature of the colder parts drops below the minimum temperature necessary for a good compaction (typically about 130–140 °C for HMA with polymer modified bitumen), high porosity areas which are more susceptible to rapid degradation (cracking and raveling in particular), can occur.
4.2.3. Laboratory Tests
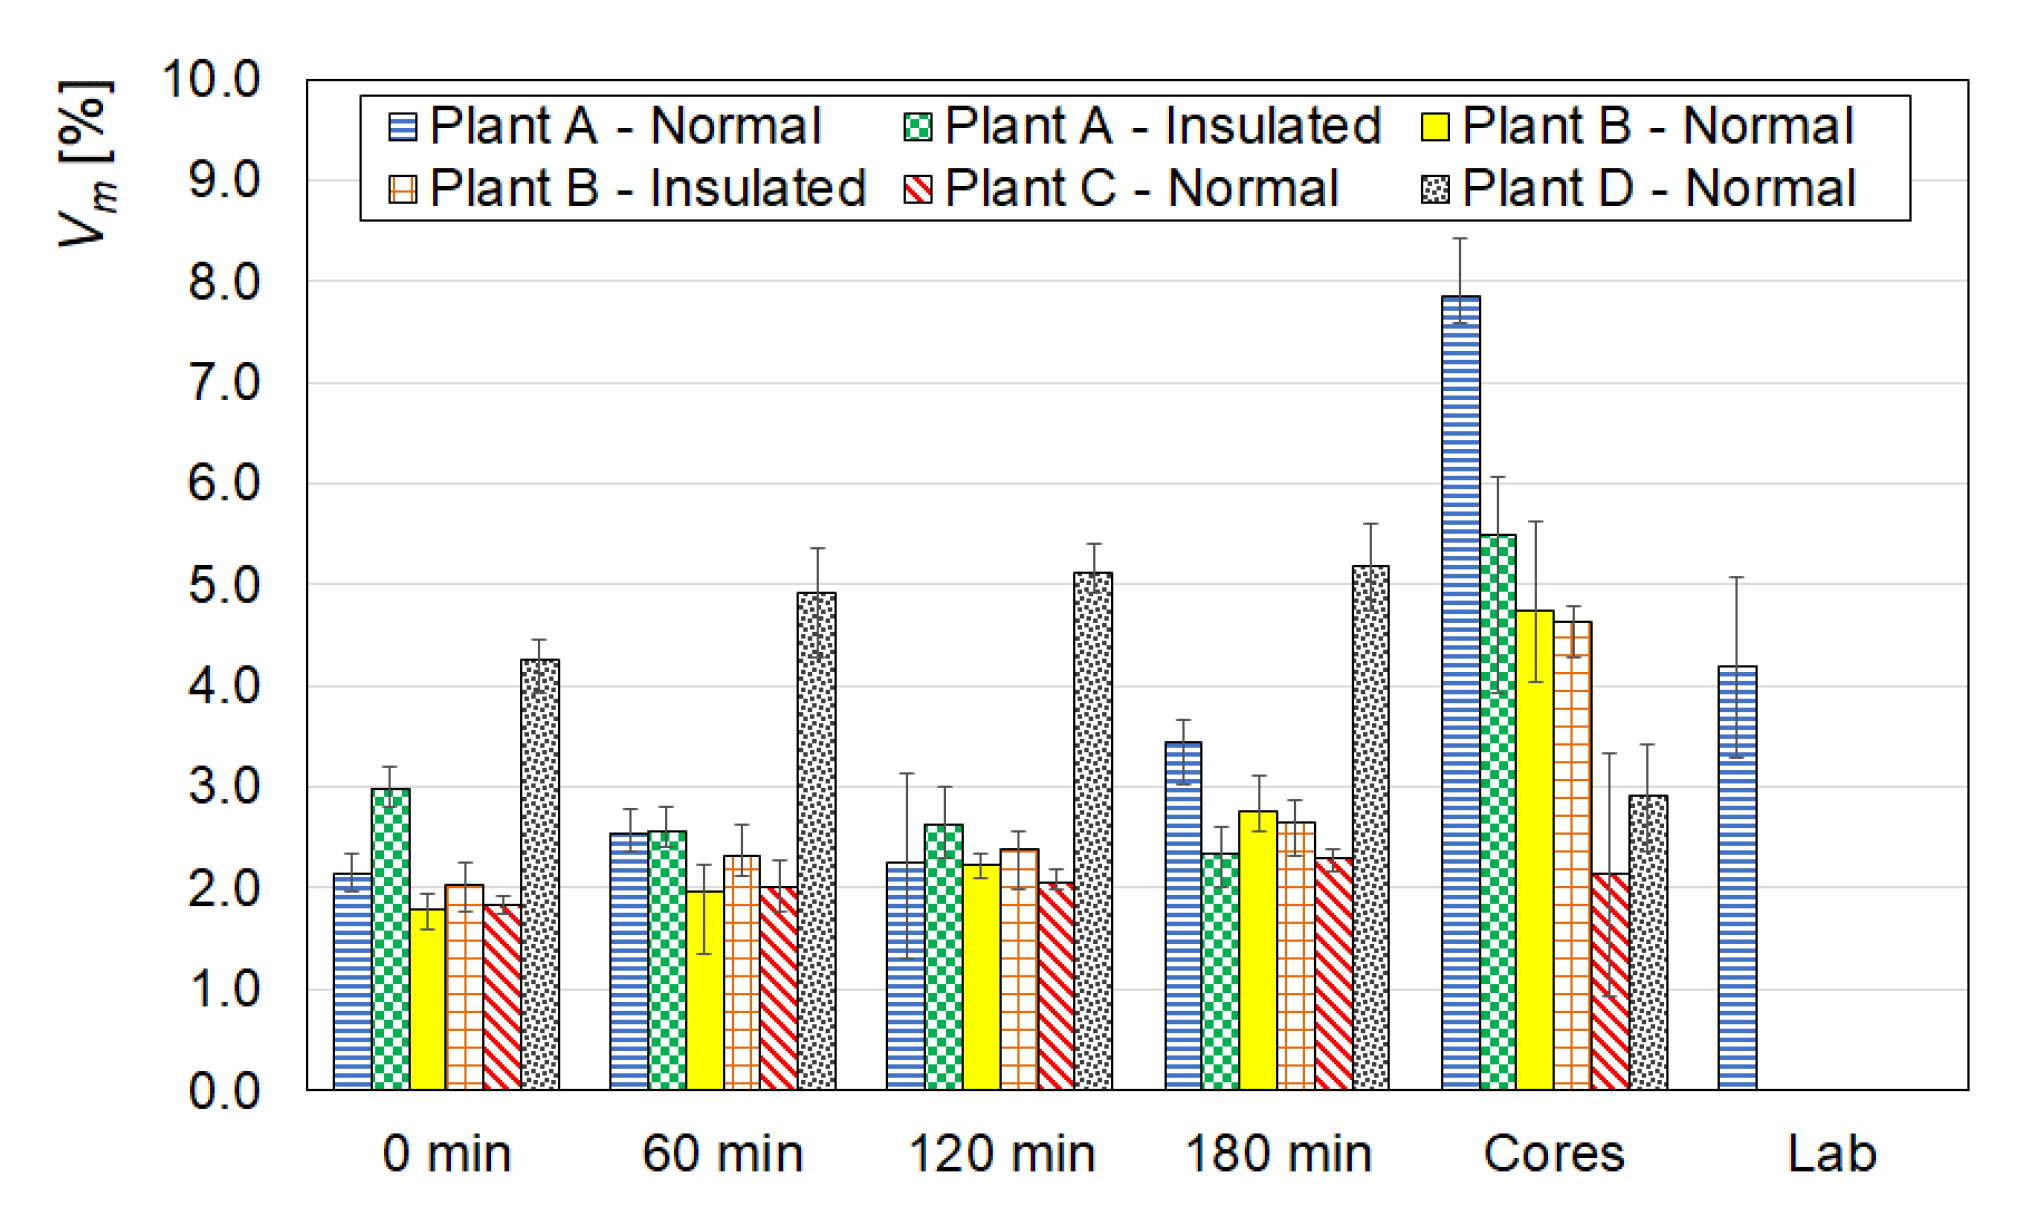
Figure 8, Figure 9, Figure 10 and Figure 11 show the average values of Vm, ITSM, ITS and CTindex measured for the specimens compacted in the plant (immediately after the sampling of the loose asphalt), in the laboratory (after re-heating) and for the cores.
The bar-chart in Figure 8 shows that there was no significant difference in the voids contents of the specimens from the HMA produced in plant A, B and C. In particular, the air voids content of these samples, compacted with SGC in the plant, was about 2–3%, independently from sampling time and truck type. Conversely, the specimens from the HMA produced in plant D showed a higher Vm, approximately 4–5%, but also in this case the influence of sampling time was not very high. This result indicates that the eventual increase in binder viscosity achieved in the truck, due to bitumen ageing or cooling, did not affect the mix compactability, as observed for the HMA produced in the laboratory (Figure 3). The specimens compacted after re-heating showed a higher air voids content (4.2% on average), indicating a certain decrease in mix workability.
The Vm values of the cores showed different trends for the plants A–D: for plants A and B the air voids content of the cores was higher than that of the specimens, for plant C it was comparable, while for plant D it was lower. Moreover, for the HMA produced in plant A there was a significant difference in Vm as a function of the truck type (8% for a normal truck, 5.5% for an insulated truck), while for the mix produced in plant B, the truck type had no influence on Vm (about 4.5%). As the voids content of each core represents the condition of the pavement in the exact place where the cores were taken, the absence of a clear trend and the higher data dispersion probably reflected the temperature segregation and localized cooling observed with the thermal camera.
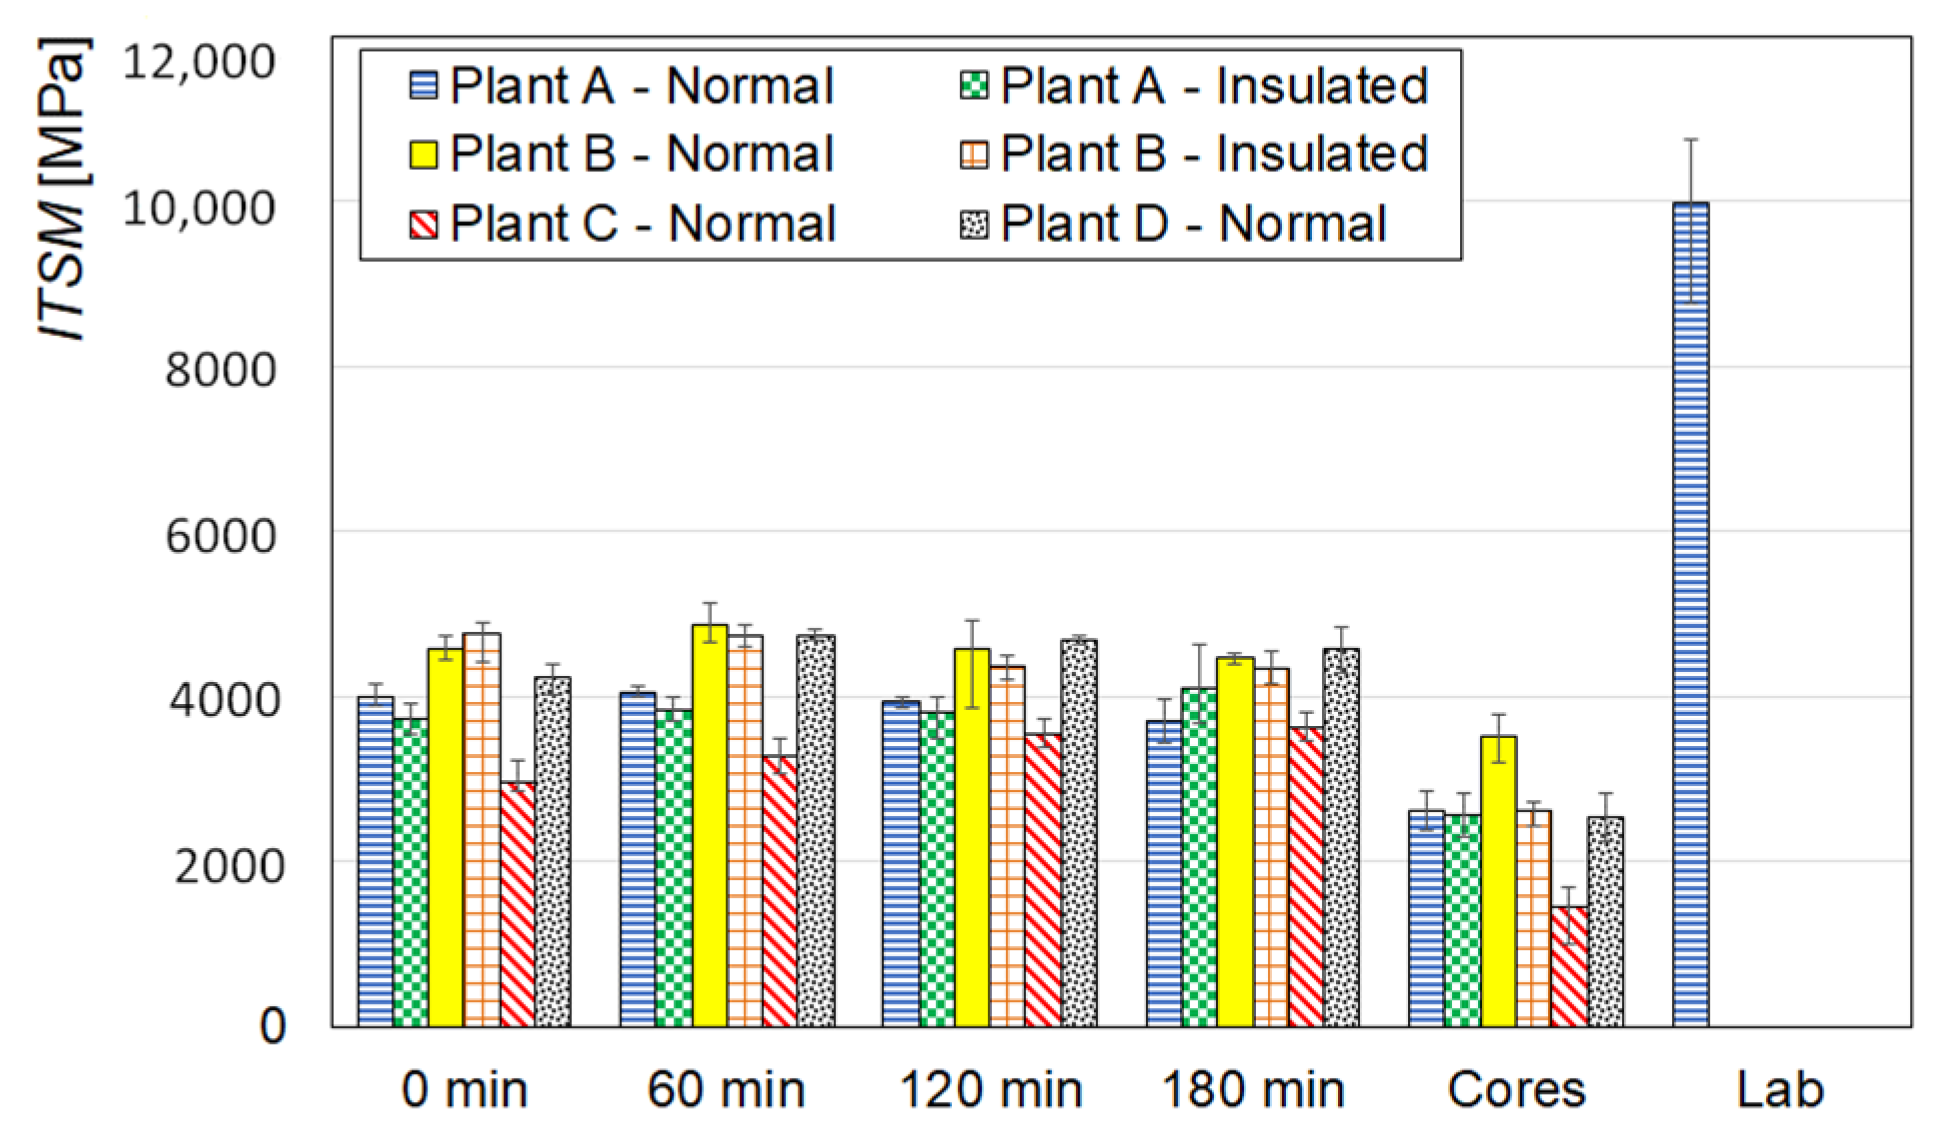
Figure 9 shows that, for all the plants, the ITSM values of the specimens compacted on site were always about 4000 MPa, independently from the truck type and time spent in the truck during the hauling phase (the only exception is represented by the specimens from plant C, whose ITSM slightly increased as a function of the sampling time). It is very interesting to note that this result was opposite to what was observed in the mix produced in the laboratory (Figure 4), where ITSM increased as a function of the conditioning time in the oven at 180 °C.
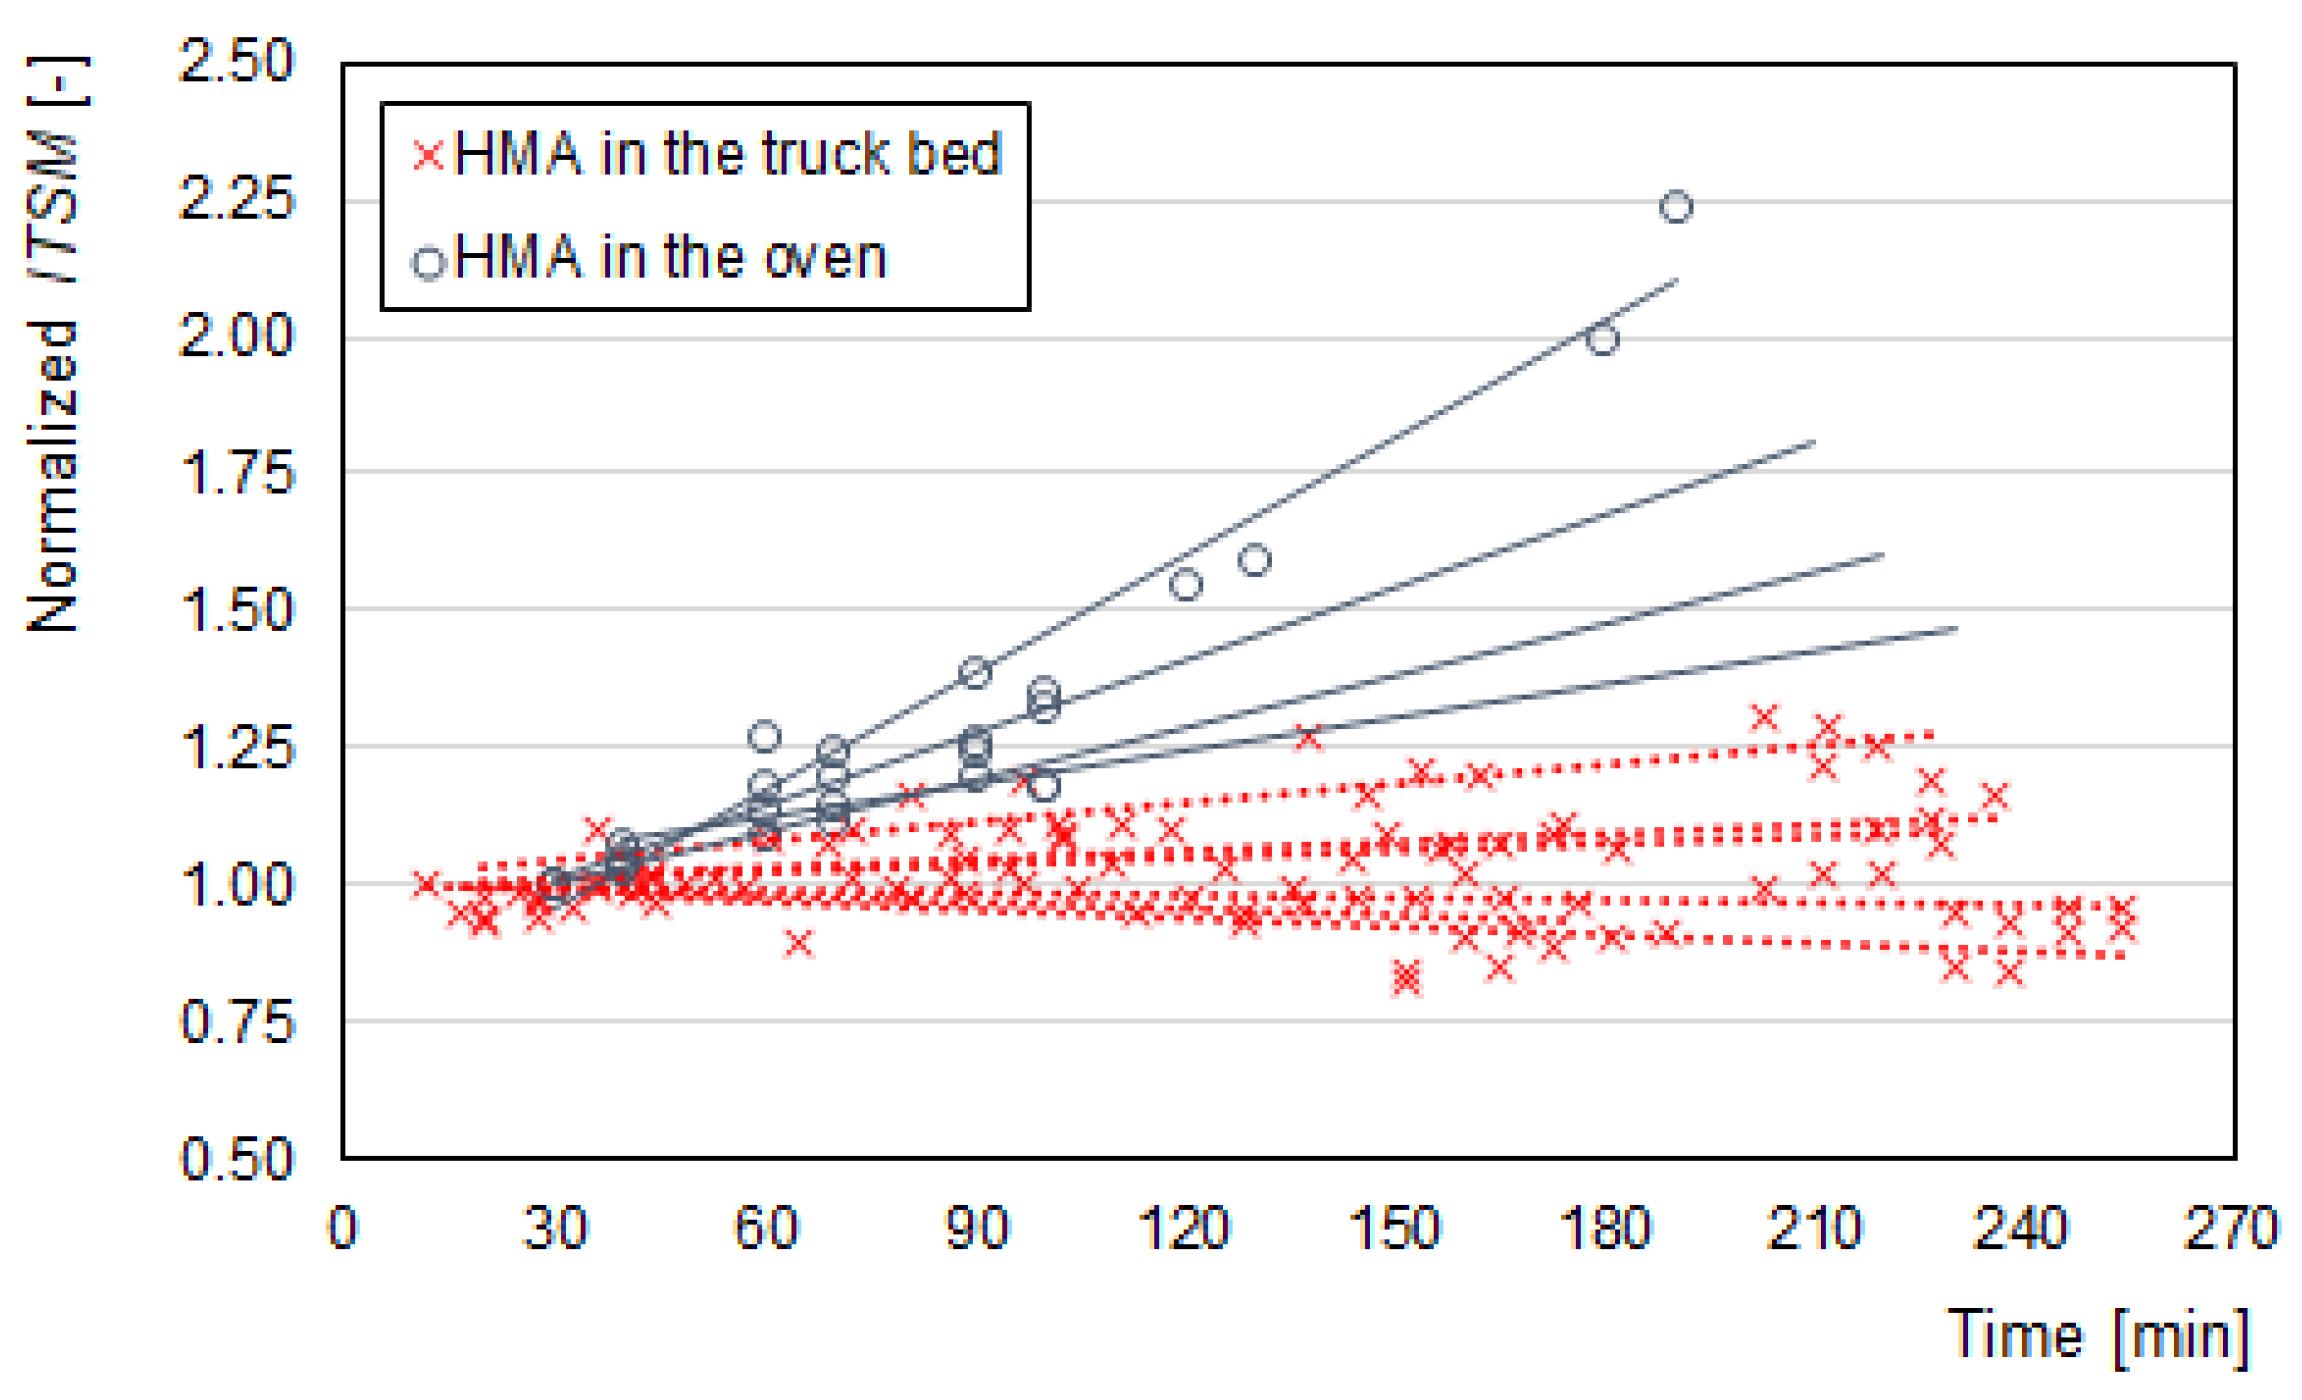
Figure 12 allows a better comparison between the mixes conditioned in the laboratory oven and the mixes kept in the truck bed. The graph shows the normalized ITSM as a function of the time between HMA mixing and compaction, where the normalized ITSM was calculated as the ratio of the ITSM measured at the different conditioning time with the ITSM measured at the lowest conditioning time for each mixture. It can be observed that the red lines, which represent the mixes produced at the plant and kept in the truck bed, always have a lower slope than the blue lines, which represent the mixes produced in the laboratory and conditioned in the oven. This clearly indicates a less marked effect of the ageing for the HMA kept in the truck bed. The reason for this is probably in the fact that, in the laboratory, the small amount of HMA in the oven (some kilograms) allowed oxygen to come into contact with most of the loose mix, favoring binder oxidation and loss of volatiles. On site, the HMA was taken out from the truck bed at 50 cm depth from the batch surface, where the temperature remained almost constant and the material was repaired by the one above. In such conditions, the batch surface was exposed to external conditions, but the core was basically isolated and neither oxidation nor loss of volatility could occur, hindering the ageing of the HMA.
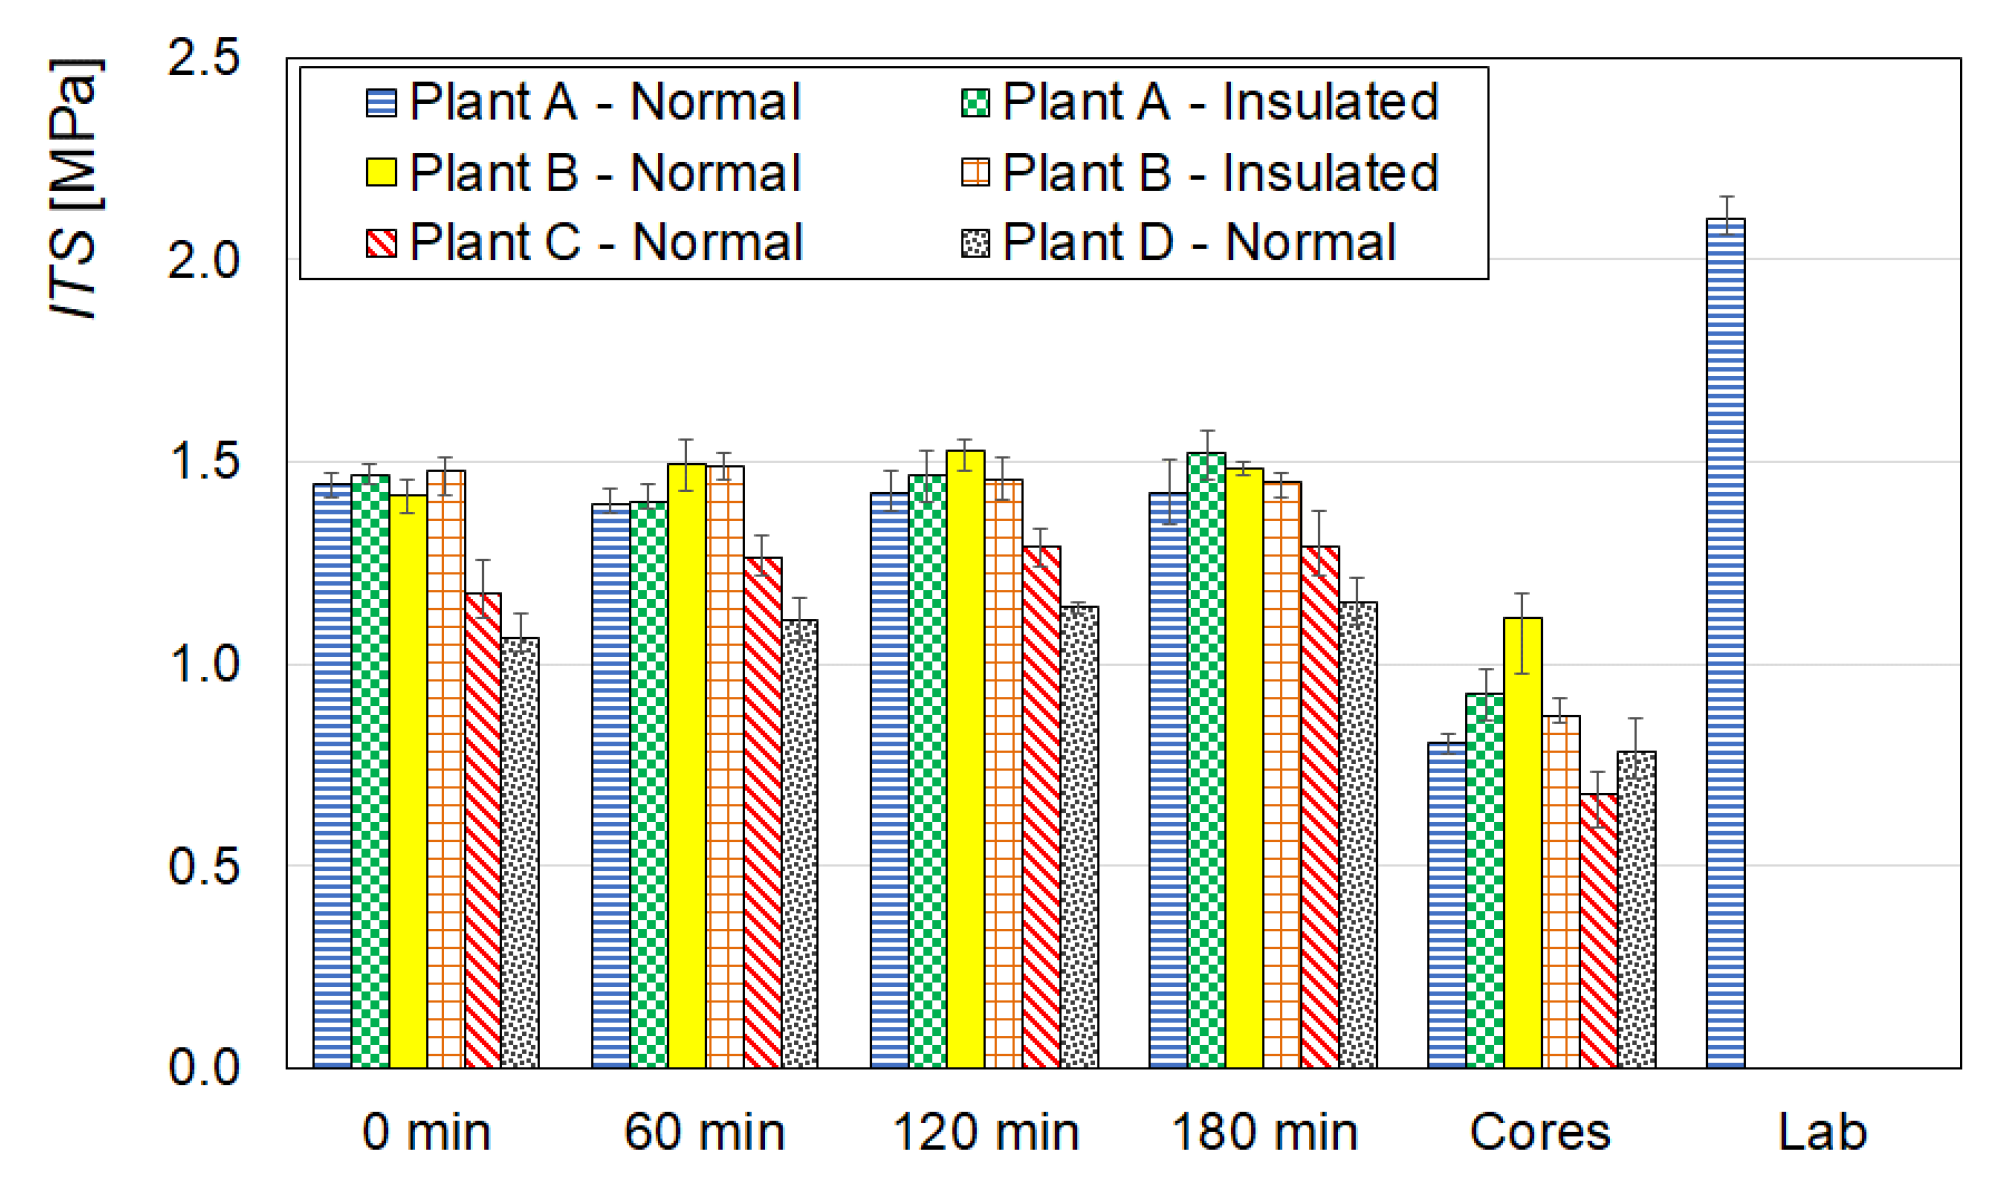
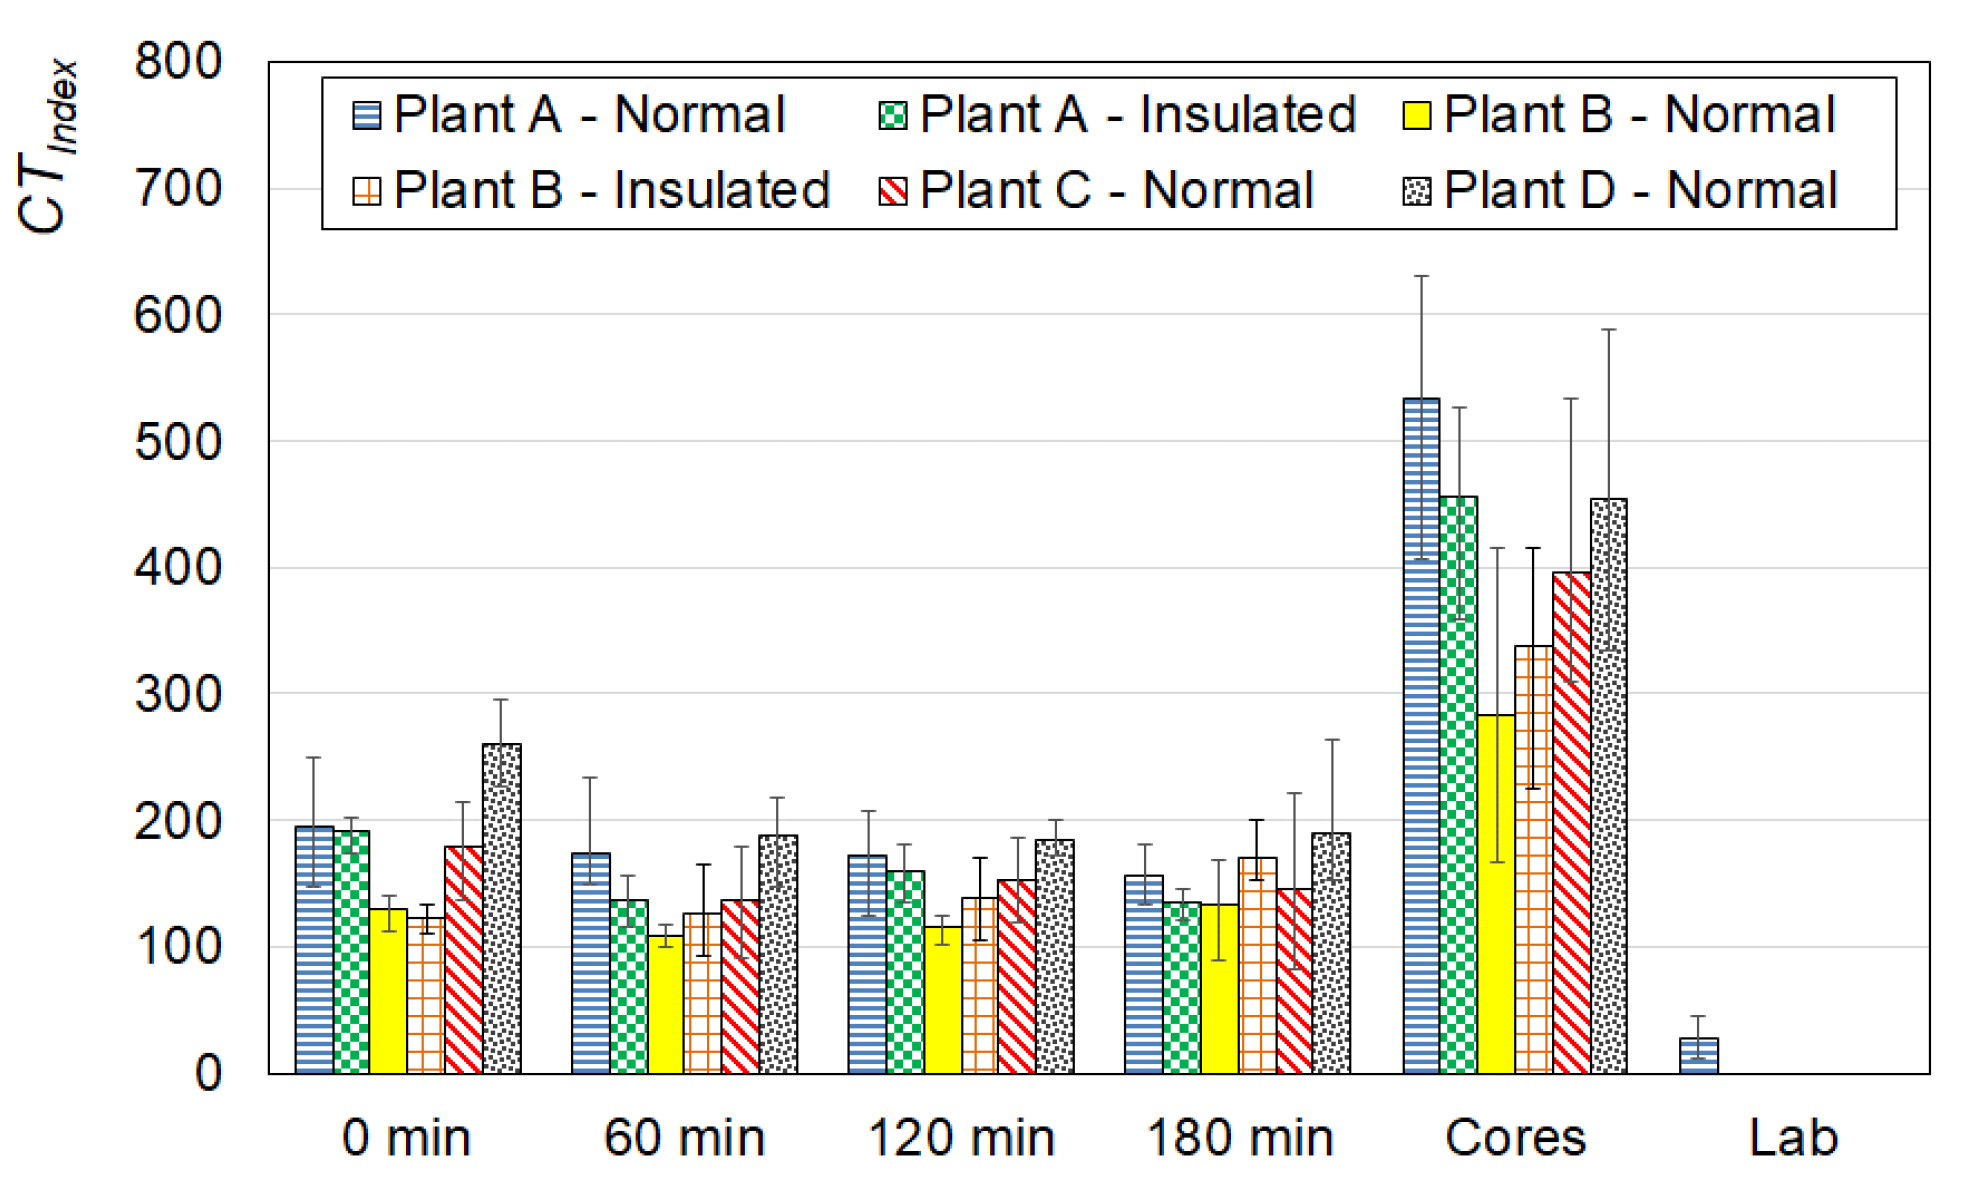
Additionally, ITS (Figure 10) and CTIndex (Figure 11) were approximately constant with sampling time, even if a slight variability between the mixes produced in the different plants was observed. In order to assess whether the groups of data were statistically comparable or different, analysis of variance (ANOVA) was carried out. Table 6 shows the significance values obtained in the comparison between the different data (Vm, ITSM, ITS or CTIndex) for each examined variable (type of truck, sampling time and HMA manufacturing plant): for values lower than 5% (in bold characters) the null hypothesis is rejected, meaning that the groups of data are statistically different. The significance values obtained through the ANOVA test showed that all the measured properties (Vm, ITSM, ITS or CTIndex) were not dependent from the truck type, i.e., the voids, stiffness, strength and cracking tolerance were comparable for the specimens from the normal and insulated truck bed. The properties Vm, ITSM and ITS were also independent from the sampling time (significance values higher than 0.05), indicating that there was not any correlation between the different quantities and the time between HMA mixing and compaction. This is also valid for CTIndex, even if the significance value was lower than 0.05, because the statistically different data groups did not set a monotonic (increasing or decreasing) trend. Finally, the very low significance values obtained for the data from the different plants indicate that the volumetric and mechanical properties of the HMA specimens varied according to the plant where they had been mixed.
From Figure 8, Figure 9, Figure 10 and Figure 11 it can be noted that the cores had lower ITSM and ITS and higher CTindex with respect to the specimens from the same plant, compacted on site, probably related to different air voids content. Instead, for the HMA compacted in the laboratory after re-heating at 170 °C, the stiffness modulus considerably increased (growth greater than 100%). At the same time, ITS noticeably increased (up to 2.1 MPa) and CTIndex fell (lower than 30). This result confirms that a severe ageing happened during the HMA re-heating in the oven.
5. Conclusions
The present research aimed at determining the influence of the conditioning time, when the loose HMA is kept in the oven at a high temperature, on the mix properties. Moreover, the ageing/cooling that happens on site during HMA hauling, as a function of time and type of truck, was investigated. Temperatures were monitored using a thermal camera and different probes, and gyratory compactor specimens were produced after sampling some HMA from the trucks every 1 h for a total of 3 h. Air voids content, ITSM, ITS and CTIndex were measured on the specimens compacted on site, on the cores taken from the pavement and on the loose HMA, re-heated and compacted in the laboratory.
In light of the results obtained, the following conclusions can be drawn:
- the compactability of the HMA was not influenced by the time during which the material is conditioned in the oven before compaction. Conversely, all the mixtures tested showed a rising trend of stiffness when the conditioning time was increased. The growing rate was higher for the mix with no RAP (22.1 MPa/min) with respect to those including RAP and a special bitumen engineered for hot recycling applications (12.2 and 10.6 MPa/min respectively for the mix with 25% RAP and 40% RAP);
- the temperature monitoring proved that the mix inside the truck bed did not significantly cool after 3 h of hauling (temperature decrease between 6 °C and 16 °C), while the temperatures on the top corner of the truck and those measured on the sampled loose mix considerably decreased (approximately 60 °C cooling);
- the thermal camera images highlighted a large temperature segregation at the paving site, with discrepancies higher than 30 °C both on the truck bed (normal truck) and on the road surface after paving. However, in the case of the insulated truck the severity of this phenomenon was reduced;
- HMA compactability, stiffness, strength and cracking tolerance did not change when hauling time increased. Inversely from the laboratory oven (where most of the HMA volume was exposed to air), the core of the HMA in the truck bed was basically isolated by the surface material and neither oxidation nor loss of volatility could occur, hindering the ageing of the HMA;
- the cores showed lower ITSM (−39% on average) and ITS (−37% on average) and higher CTindex (about 2.5 times on average) with respect to the specimens compacted on site, probably due to a higher air voids content;
- when the loose HMA was re-heated and compacted in the laboratory, ITSM and ITS (+150% and +50%, respectively) considerably increased, whereas CTIndex decreased (−84%), denoting that a severe ageing happened through this specimen preparation procedure.
The research demonstrated that HMA handling in the laboratory, during quality assurance and quality controls, is extremely important, since keeping the material in the oven for a prolonged time or re-heating it may significantly affect the test results. However, when the HMA is in the truck bed it does not experience as much severe ageing, even if it stays at a high temperature for a long time. Differently, the plant trial showed that on site cooling and temperature segregation represent a higher risk for HMA than ageing. Therefore, the use of insulated trucks (to avoid temperature segregation) and remixing material transfer vehicles is recommended in the case of long hauling distances.
Author Contributions
Conceptualization, M.B.; methodology, M.B. and E.B.; software, E.B. and E.P.; validation, M.B., E.B. and E.P.; formal analysis, E.B. and E.P.; investigation, E.B. and E.P.; resources, M.B. and V.M.; data curation, E.B. and E.P.; writing—original draft preparation, E.P.; writing—review and editing, E.B.; visualization, E.P.; supervision, M.B.; project administration, V.M. All authors have read and agreed to the published version of the manuscript.
Funding
This research received no external funding.
Conflicts of Interest
The authors declare no conflict of interest.
References
- Kök, B.V.; Yilmaz, M.; Alatas, T. Evaluation of the mechanical properties of field and laboratory Compacted hot-mix asphalt. J. Mater. Civ. Eng. 2014, 26. [Google Scholar] [CrossRef]
- Morovatdar, A.; Ashtiani, R.S.; Licon, C. Development of a mechanistic framework to predict pavement service life using axle load spectra from Texas overload corridors. In Proceedings of the International Conference on Transportation and Development 2020, Seattle, WA, USA, 26–29 May 2020. [Google Scholar]
- Lu, X.; Isacsson, U. Effect of ageing on bitumen chemistry and rheology. Constr. Build. Mater. 2002, 16, 15–22. [Google Scholar] [CrossRef]
- Miró, R.; Martínez, A.H.; Moreno-Navarro, F.; Rubio-Gámez, C. Effect of ageing and temperature on the fatigue behaviour of bitumens. Mater. Des. 2015, 86, 129–137. [Google Scholar] [CrossRef] [Green Version]
- Hung, A.M.; Fini, E.H. Absorption spectroscopy to determine the extent and mechanisms of aging in bitumen and asphaltenes. Fuel 2019, 242, 408–415. [Google Scholar] [CrossRef]
- Le Guern, M.; Chailleux, E.; Farcas, F.; Dreessen, S.; Mabille, I. Physico-chemical analysis of five hard bitumens: Identification of chemical species and molecular organization before and after artificial aging. Fuel 2010, 89, 3330–3339. [Google Scholar] [CrossRef]
- Mousavi, M.; Pahlavan, F.; Oldham, D.; Hosseinnezhad, S.; Fini, E.H. Multiscale investigation of oxidative aging in biomodified asphalt binder. J. Phys. Chem. C 2016, 120, 17224–17233. [Google Scholar] [CrossRef]
- Mirwald, J.; Werkovits, S.; Camargo, I.; Maschauer, D.; Hofko, B.; Grothe, H. Understanding bitumen ageing by investigation of its polarity fractions. Constr. Build. Mater. 2020, 250, 118809. [Google Scholar] [CrossRef]
- Siddiqui, M.N.; Ali, M.F. Studies on the aging behavior of the Arabian asphalts. Fuel 1999, 78, 1005–1015. [Google Scholar] [CrossRef]
- Lemarchand, C.A.; Schrøder, T.B.; Dyre, J.C.; Hansen, J.S. Cooee bitumen: Chemical aging. J. Chem. Phys. 2013, 139. [Google Scholar] [CrossRef] [Green Version]
- Pahlavan, F.; Samieadel, A.; Deng, S.F.E. Exploiting synergistic effects of intermolecular interactions to synthesize hybrid rejuvenators to revitalize aged asphalt. ACS Sustain. Chem. Eng. 2019, 7, 15514–15525. [Google Scholar] [CrossRef]
- Lesueur, D.; Gerard, J.-F.; Claudy, P.; Letoffe, J.-M.; Planche, J.-P.; Martin, D. Structure related model to describe asphalt linear viscoelasticity. J. Rheol. 1996, 40, 813–836. [Google Scholar] [CrossRef]
- Ongel, A.; Hugener, M. Impact of rejuvenators on aging properties of bitumen. Constr. Build. Mater. 2015, 94, 467–474. [Google Scholar] [CrossRef]
- Mazzoni, G.; Bocci, E.; Canestrari, F. Influence of rejuvenators on bitumen ageing in hot recycled asphalt mixtures. J. Traffic Transp. Eng. Engl. Ed. 2018, 5, 157–168. [Google Scholar] [CrossRef]
- Nakhaei, M.; Ziari, H.; Korayem, A.H.; Hajiloo, M. Aging evaluation of amorphous carbon-modified asphalt binders using rheological and chemical approach. J. Mater. Civ. Eng. 2020, 32. [Google Scholar] [CrossRef]
- Hofko, B.; Falchetto, A.C.; Grenfell, J.; Huber, L.; Lu, X.; Porot, L.; You, Z.; Falchetto, A.C. Effect of short-term ageing temperature on bitumen properties. Road Mater. Pavement Des. 2017, 18, 108–117. [Google Scholar] [CrossRef] [Green Version]
- Dessouky, S.; Reyes, C.; Ilias, M.; Contreras, D.; Papagiannakis, A.T. Effect of pre-heating duration and temperature conditioning on the rheological properties of bitumen. Constr. Build. Mater. 2011, 25, 2785–2792. [Google Scholar] [CrossRef]
- Lolly, R.; Zeiada, W.; Souliman, M.; Kaloush, K. Effects of short-term aging on asphalt binders and hot mix asphalt at elevated temperatures and extended Aging Time. MATEC Web Conf. 2017, 07010. [Google Scholar] [CrossRef]
- Lemke, Z.; Sadek, H.; Swiertz, D.; Reichelt, S.; Bahia, H.U. Effects of reheating procedure and oven type on performance testing results of asphalt mixtures. Transp. Res. Rec. 2018, 2672, 124–133. [Google Scholar] [CrossRef]
- Kidd, A.; Stephenson, G.; White, G. Implications of reheating of asphalt mixes on performance testing. In Proceedings of the 18th AAPA International Flexible Pavements Conference 2019, Sydney, New South Wales, Australia, 18–21 August 2019. [Google Scholar]
- Daniel, J. How mixture, fabrication, and plant production parameters affect mixture properties. Transp. Res. Circ. 2018, E-C234, 1–20. [Google Scholar]
- Roberts, F.L.; Kandhal, P.S.; Brown, E.R.; Lee, D.Y.; Kennedy, T.W. Hot Mix Asphalt Materials, Mixture Design, and Construction, 3rd ed.; National Asphalt Paving Association Education Foundation: Lanham, MD, USA, 2016. [Google Scholar]
- Muhammad, M.; Syuhada, A.; Huzni, S.; Fuadi, Z. Study on Heat loss through dump truck wall insulated by sengon wood. J. Adv. Res. Fluid Mech. Therm. Sci. 2019, 58, 126–134. [Google Scholar]
- Cho, Y.K.; Bode, T.; Song, J.; Jeong, J.-H. Thermography-driven distress prediction from hot mix asphalt road paving construction. ASCE J. Constr. Eng. Manag. 2012, 138, 206–214. [Google Scholar] [CrossRef]
- Mahoney, J.P.; Muench, S.T.; Pierce, L.M.; Read, S.A.; Jakob, H.; Moore, R. Construction-related temperature differentials in asphalt concrete pavement: Identification and assessment. Transp. Res. Rec. 2000, 1712, 93–100. [Google Scholar] [CrossRef]
- Amirkhanian, S.N.; Putman, B.J. Laboratory and Field Investigation of Temperature Differential in HMA Mixtures Using an Infrared Camera; Clemson University Department of Civil Engineering: Clemson, SC, USA, 2006. [Google Scholar]
- Brock, J.D.; Jakob, H. Temperature Segregation/Temperature Differential Damage; Technical Paper T-134; Astec Industries: Chattanooga, TN, USA, 2009. [Google Scholar]
- Kim, M.; Phaltane, P.; Mohammad, L.N.; Elseifi, M. Temperature segregation and its impact on the quality and performance of asphalt pavements. Front. Struct. Civ. Eng. 2017, 12, 536–547. [Google Scholar] [CrossRef]
- Delgadillo, R.; Bahia, H.U. Effects of temperature and pressure on hot mixed asphalt compaction: Field and laboratory study. J. Mater. Civ. Eng. 2008, 20, 440–448. [Google Scholar] [CrossRef]
- Hayat, A.; Hussain, A.; Afridi, H.F. Determination of in-field temperature variations in fresh HMA and corresponding compaction temperatures. Constr. Build. Mater. 2019, 216, 84–92. [Google Scholar] [CrossRef]
- Khan, R.; Grenfell, J.; Collop, A.; Airey, G.; Gregory, H. Moisture damage in asphalt mixtures using the modified SATS test and image analysis. Constr. Build. Mater. 2013, 43, 165–173. [Google Scholar] [CrossRef]
- Plati, C.; Georgiou, P.; Loizos, A. Use of infrared thermography for assessing HMA paving and compaction. Transp. Res. Part C Emerg. Technol. 2014, 46, 192–208. [Google Scholar] [CrossRef]
- Bocci, E.; Mazzoni, G.; Canestrari, F. Ageing of rejuvenated bitumen in hot recycled bituminous mixtures: Influence of bitumen origin and additive type. Road Mater. Pavement Des. 2019, 20, 127–148. [Google Scholar] [CrossRef]
- Test Methods for Hot Mix Asphalt. Part 31: Specimen Preparation by Gyratory Compactor; EN 12697-31; European Committee for Standardization (CEN): Brussels, Belgium, 2019.
- Test Methods for Hot Mix Asphalt. Part 8: Determination of Void Characteristics of Bituminous Specimens; EN 12697-8; European Committee for Standardization (CEN): Brussels, Belgium, 2019.
- Test Methods for Hot Mix Asphalt. Part 5: Determination of the Maximum Density; EN 12697-5; European Committee for Standardization (CEN): Brussels, Belgium, 2019.
- Test Methods for hot Mix Asphalt. Part 6: Determination of the Bulk Density of Bituminous Specimens; EN 12697-6; European Committee for Standardization (CEN): Brussels, Belgium, 2020.
- Cerni, G.; Bocci, E.; Cardone, F.; Corradini, A. Correlation between asphalt mixture stiffness determined through static and dynamic indirect tensile tests. Arab. J. Sci. Eng. 2017, 42. [Google Scholar] [CrossRef]
- Test Methods for Hot Mix Asphalt. Part 26: Stiffness; EN 12697-26; European Committee for Standardization (CEN): Brussels, Belgium, 2018.
- Graziani, A.; Bocci, E.; Canestrari, F. Bulk and shear characterization of bituminous mixtures in the linear viscoelastic domain. Mech. Time Depend. Mater. 2014, 18, 527–554. [Google Scholar] [CrossRef]
- Test Methods for Hot Mix Asphalt. Part 23: Determination of the Indirect Tensile Strength of Bituminous Specimens; EN 12697-23; European Committee for Standardization (CEN): Brussels, Belgium, 2017.
- Standard Test Method for Determination of Cracking Tolerance Index of Asphalt Mixture Using the Indirect Tensile Cracking Test at Intermediate Temperature; ASTM D8225-19; ASTM International: West Conshohocken, PA, USA, 2019. [CrossRef]
- Zhou, F.; Im, S.; Sun, L.; Scullion, T. Development of an IDEAL cracking test for asphalt mix design and QC/QA. Road Mater. Pavement Des. 2017, 18, 405–427. [Google Scholar] [CrossRef]
- Direttive Tecniche per Pavimentazioni Bituminose; Amministrazione Provincia Bolzano: Bolzano, Italy, 2016. (In Italian)
- Framework Specification for Polymer Modified Bitumens; EN 14023; European Committee for Standardization (CEN): Brussels, Belgium, 2010.
- Test Methods for Hot Mix Asphalt. Part 35: Laboratory Mixing; EN 12697-35; European Committee for Standardization (CEN): Brussels, Belgium, 2016.
Figure 1.
Pictures from the field investigation: (a) temperature measurement; (b) HMA delivery to the paver.
Figure 1.
Pictures from the field investigation: (a) temperature measurement; (b) HMA delivery to the paver.

Figure 2.
Particle size distribution for the mixes produced in the lab.

Figure 3.
Air voids content Vm of the mixes produced in the laboratory: (a) average values; (b) Vm as a function of the conditioning time.
Figure 3.
Air voids content Vm of the mixes produced in the laboratory: (a) average values; (b) Vm as a function of the conditioning time.

Figure 4.
Indirect tensile stiffness modulus (ITSM) of the mixes produced in the laboratory as a function of the conditioning time.
Figure 4.
Indirect tensile stiffness modulus (ITSM) of the mixes produced in the laboratory as a function of the conditioning time.

Figure 5.
Particle size distribution for the mixes produced in the different HMA plants.

Figure 6.
Pictures of the bed corner taken with infrared camera 3 h after production: (a) Normal truck; (b) Insulated truck.
Figure 6.
Pictures of the bed corner taken with infrared camera 3 h after production: (a) Normal truck; (b) Insulated truck.

Figure 7.
Picture taken with infrared camera showing the paver laying the HMA from plant A hauled with a normal truck.
Figure 7.
Picture taken with infrared camera showing the paver laying the HMA from plant A hauled with a normal truck.

Figure 8.
Vm of the mixes produced at the plants: field- and lab-compacted specimens and cores.

Figure 9.
ITSM of the mixes produced at the plants: field- and lab-compacted specimens and cores.

Figure 10.
ITS of the mixes produced at the plants: field- and lab-compacted specimens and cores.

Figure 11.
Cracking Tolerance index (CTIndex) of the mixes produced at the plants: field- and lab-compacted specimens and cores.
Figure 11.
Cracking Tolerance index (CTIndex) of the mixes produced at the plants: field- and lab-compacted specimens and cores.

Figure 12.
Normalized ITSM of the mixes conditioned in the laboratory oven or in the truck bed as a function of the time between HMA mixing and compaction.
Figure 12.
Normalized ITSM of the mixes conditioned in the laboratory oven or in the truck bed as a function of the time between HMA mixing and compaction.


Table 1.
Experimental program for the evaluation of the thermal conditioning in the oven.
| Mix | RAP Content [%] | Rejuvenating Technique | Conditioning Time [min] | Conditioning Temperature [°C] |
|---|---|---|---|---|
| 0RAP | 0 | - | 30, 60, 90, 120, 180 | 180 |
| 25RAP-R1 | 25 | R1 | 30, 60, 90 | 180 |
| 25RAP-R2 | 25 | R2 | 30, 60, 90 | 180 |
| 40RAP-R2 | 40 | R2 | 30, 60, 90 | 180 |
Table 2.
Dataset available for each hot-mix asphalt (HMA) plant.
| Plant A | Plant B | Plant C | Plant D | ||
|---|---|---|---|---|---|
| Truck | Normal | X | X | X | X |
| Insulated | X | X | |||
| Specimens compacted on site | After 0 h hauling | X | X | X | X |
| After 1 h hauling | X | X | X | X | |
| After 2 h hauling | X | X | X | X | |
| After 3 h hauling | X | X | X | X | |
| Cores | X | X | X | ||
| Specimens compacted in the lab after reheating | X | ||||
Table 3.
Binder content of the mixes produced at the plant.
| Plant | A | B | C | D |
|---|---|---|---|---|
| Binder content [% by mix] | 6.10 | 6.45 | 6.60 | 5.55 |
Table 4.
Temperatures measured during production and loose mix sampling.
| Plant | Truck | Production | 1st Sampling | 2nd Sampling | 3rd Sampling | 4th Sampling | ||
|---|---|---|---|---|---|---|---|---|
| A | Normal | Hours | 9:00 | 9:12 | 10:08 | 11:04 | 11:27 | |
| T [°C] | C | - | 146 | 121 | 98 | 87 | ||
| B | - | 184 | 175 | 171 | 168 | |||
| L | - | 165 | 160 | 152 | 146 | |||
| Insulated | Hours | 9:00 | 9:40 | 10:37 | 11:33 | 12:27 | ||
| T [°C] | C | - | 143 | 124 | 105 | 101 | ||
| B | - | 178 | 182 | 170 | 165 | |||
| L | - | 165 | 160 | 163 | 154 | |||
| B | Normal | Hours | 8:45 | 8:52 | 9:59 | 10:56 | 12:30 | |
| T [°C] | C | - | 152 | 112 | 100 | 94 | ||
| B | - | 181 | 186 | 184 | 175 | |||
| L | - | 150 | 138 | 131 | 110 | |||
| Insulated | Hours | 8:45 | 9:21 | 10:25 | 11:25 | 12:30 | ||
| T [°C] | C | - | 133 | 106 | 92 | 96 | ||
| B | - | 182 | 185 | 180 | 172 | |||
| L | - | 165 | 151 | 131 | 111 | |||
| C | Normal | Hours | 9:00 | 9:15 | 10:08 | 11:13 | 12:18 | |
| T [°C] | C | - | 135 | 101 | 90 | 87 | ||
| B | - | 185 | 183 | 178 | 174 | |||
| L | - | 147 | 160 | 137 | 117 | |||
| D | Normal | Hours | 8:00 | 8:15 | 9:22 | 10:24 | 11:18 | |
| T [°C] | C | - | 151 | 109 | 97 | 85 | ||
| B | - | 188 | 188 | 186 | 182 | |||
| L | - | 169 | 130 | 129 | 109 | |||
Table 5.
Temperatures measured during paving operations.
| A | B | C | D | |||
|---|---|---|---|---|---|---|
| N | I | N | I | N | N | |
| Time elapsed between production and lay-down [min] | 210 | 242 | 203 | 230 | 242 | 196 |
| Temperature of the loose mix in the paver [°C] | - | - | 180 | 172 | 121 | 170 |
| Surface HMA temperature after lay-down (probe) [°C] | - | - | 161 | 140 | 106 | 152 |
| Surface HMA temperature after lay-down (infrared) [°C] | - | - | 146 | 181 | 142 | 171 |
| Temperature of outside of the truck bed [°C] | - | - | 62 | 155 | 55 | 62 |
| Temperature of bottom of the truck bed [°C] | - | - | 55 | - | 75 | 81 |
Table 6.
Analysis of variance (ANOVA) of the Vm, ITSM, ITS and CTIndex data: significance values.
| Variable | |||
|---|---|---|---|
| Property | Truck Type | Sampling Time | HMA Manufacturing Plant |
| Vm | 0.438 | 0.235 | 7.0 × 10⁻²⁵ |
| ITSM | 0.552 | 0.615 | 9.7 × 10⁻²² |
| ITS | 0.266 | 0.655 | 6.9 × 10⁻²⁷ |
| CTIndex | 0.967 | 0.032 | 5.0 × 10⁻⁷ |
Publisher’s Note: MDPI stays neutral with regard to jurisdictional claims in published maps and institutional affiliations. |
© 2020 by the authors. Licensee MDPI, Basel, Switzerland. This article is an open access article distributed under the terms and conditions of the Creative Commons Attribution (CC BY) license (http://creativecommons.org/licenses/by/4.0/).
Share and Cite
MDPI and ACS Style
Bocci, E.; Prosperi, E.; Mair, V.; Bocci, M. Ageing and Cooling of Hot-Mix-Asphalt during Hauling and Paving—A Laboratory and Site Study. Sustainability 2020, 12, 8612. https://doi.org/10.3390/su12208612
AMA Style
Bocci E, Prosperi E, Mair V, Bocci M. Ageing and Cooling of Hot-Mix-Asphalt during Hauling and Paving—A Laboratory and Site Study. Sustainability. 2020; 12(20):8612. https://doi.org/10.3390/su12208612
Chicago/Turabian StyleBocci, Edoardo, Emiliano Prosperi, Volkmar Mair, and Maurizio Bocci. 2020. "Ageing and Cooling of Hot-Mix-Asphalt during Hauling and Paving—A Laboratory and Site Study" Sustainability 12, no. 20: 8612. https://doi.org/10.3390/su12208612
Note that from the first issue of 2016, this journal uses article numbers instead of page numbers. See further details here.