Evaluating Cost Trade-Offs between Hydropower and Fish Passage Mitigation


1
Agricultural Production and Resource Economics, Technical University of Munich, Alte Akademie 14, 85354 Freising, Germany
2
Aquatic Systems Biology, Technical University of Munich, Mühlenweg 22, 85354 Freising, Germany
3
SINTEF Energy Research, Water Resources Group, P.O. Box 4761 Torgarden, 7465 Trondheim, Norway
*
Author to whom correspondence should be addressed.
Sustainability 2020, 12(20), 8520; https://doi.org/10.3390/su12208520
Submission received: 21 August 2020
/
Revised: 9 October 2020
/
Accepted: 9 October 2020
/
Published: 15 October 2020
(This article belongs to the Special Issue The Future of Hydropower: Sustainable Practices, Innovative Technologies and New Scientific Insights)
Abstract
:To promote the sustainable management of hydropower, decision makers require information about cost trade-offs between the restoration of fish passage and hydropower production. We provide a systematic overview of the construction, operational, monitoring, and power loss costs associated with upstream and downstream fish passage measures in the European context. When comparing the total costs of upstream measures across different electricity price scenarios, nature-like solutions (67–88 EUR/kW) tend to cost less than technical solutions (201–287 EUR/kW) on average. Furthermore, nature-like fish passes incur fewer power losses and provide habitat in addition to facilitating fish passage, which presents a strong argument for supporting their development. When evaluating different cost categories of fish passage measures across different electricity price scenarios, construction (45–87%) accounts for the largest share compared to operation (0–1.2%) and power losses (11–54%). However, under a high electricity price scenario, power losses exceed construction costs for technical fish passes. Finally, there tends to be limited information on operational, power loss, and monitoring costs associated with passage measures. Thus, we recommend that policy makers standardize monitoring and reporting of hydraulic, structural, and biological parameters as well as costs in a more detailed manner.
1. Introduction
While hydropower represents the largest renewable energy source in Europe, it also poses risks to river ecosystems, an array of animal species, and the downstream transport of sediments [1]. To ensure the sustainability of future hydropower development, ecological targets have been established. The primary political instrument is the EU Water Framework Directive (Directive 2000/60/ EC, WFD), which, among other goals, mandates an improvement in the ecological status of waters including the restoration of fish passage and river connectivity of European rivers. While many studies focus on technical advancements and ecological assessments of fish passage technologies [2,3,4,5,6,7], there has been limited research on the costs of these measures in the European context [8]. However, it is important for decision makers to understand the trade-offs between restoring fish passage and hydropower production when they establish and plan cost-effective mitigation measures.
Despite worldwide hydropower operation and mitigation programs, overviews of costs related to fish passage measures mainly come from North America [8]. However, it can be problematic to translate costs from one region to another, given differences related to legal and political frameworks, technologies, and input costs (i.e., land, labor, materials).
Across countries, there are differing degrees of environmental regulation related to hydropower. While some countries require mitigation for facilitating fish passage and ensuring flow release, others lack formal rules [1,9]. Further, a variety of incentives, including competitive tariffs, private sector investments, rural electrification programs, and simplified licensing processes, have been used to incentivize the development of small hydropower [9]. In Europe, there are established guidelines for habitat protection in rivers as well as targets for the expansion of renewable energy under the recast RED II (Directive (EU) 2018/2001) of the Renewable Energy Directive [10,11,12,13], which have led to incentives for the development of small hydropower. For example, the German Renewable Energy Act facilitated the implementation of small hydropower facilities by providing feed-in tariffs for small hydropower, which were linked to ecological improvements and the restoration of fish passage [13,14]. In contrast, Brazil and India do not require a full environmental impact assessment for licensing of small hydropower plants, while small plants (less than 10 MW) are exempt from some licensing requirements in the United States [9,15].
Another difference is related to technology. Many of Europe’s hydropower plants are often run-of-the-river (also called diversion) schemes [14], whereas the United States holds a greater share of large reservoir schemes [16]. In the literature, there are mixed findings as to whether the size and technology of hydropower affect its ecological impact and public acceptance [17,18]. However, given the financial incentives to build small hydropower plants across Europe, there is growing concern that cumulative effects can occur [1] in addition to the significant environmental impacts of individual plants.
Construction costs may also differ between the United States and Europe. According to the Power Capital Costs Index, the average cost for building a power plant between 2000 and 2013 increased by 226% in North America compared to 193% in Europe [19], which implies that trends in construction costs differ. Further, land availability has been noted as one of the key factors for determining how and where river restoration will be conducted [20]. Given the greater availability of land in the United States, it is likely that land acquisition will be more expensive in Europe [21].
For fish passage measures, there are various costs. We distinguish between financial and economic costs, which can be non-recurring and recurring. Non-recurring costs refer to costs that occur once and are not expected to be incurred again. Recurring costs refer to ongoing, regular costs incurred usually on an annual basis. Financial costs include capital (pre-construction and construction), operational (management, monitoring, maintenance), and other expenses (compensation of land and habitat, legal work). Most reports focus primarily on planning, construction, and maintenance costs [8] with no or limited consideration of monitoring, effectiveness, and power losses.
However, economic costs related to reduced power production and system flexibility may represent a significant loss for operators [22,23], and are thus likely to influence decision processes related to the construction of hydropower facilities as well as investment in mitigation measures. When measures modify water flow, they can reduce power production [4]. Depending on their design, some measures may not require flow releases, while others may redirect significant amounts of water. These power losses can be highly site-specific, dependent on the head, storage capacity, inflow, season (dry or wet periods), the type of required operation, and the power market [24]. The revenue losses associated with reductions or changes in timing of power production are highly dependent on the power market. When revenue losses are calculated based on the hourly energy prices of the day-ahead market, they can vary significantly, based on the hour, day, month, and year [22]. The timing of lost power production may also reduce overall system flexibility as dispatchable power plants (including hydropower) help to balance variability in renewable energy sources [24]. When there is greater demand for water (e.g., dry season, additional water needed for the fish passage facility), some flexibility may be lost. Further, the extent to which flexibility is reduced depends on the type of hydropower plant. As run-of-the-river hydropower plants are not typically used to cover peak demand, we will not quantify the value of lost system flexibility.
Cost-effective fish passage design must balance several objectives: overcoming the fall height and minimizing the length of the fish pass, effects on hydraulic conditions and costs [25]. There are different approaches to designing fish passage facilities. Traditionally, design is based on species-specific formulas [25], which consider fish-specific traits including the duration of migration (long/short), size (small/large), swimming ability (strong/weak), and orientation (pelagic/benthic) [26]. However, others advocate for the integration of natural variation in fish passage design [27].
Varieties of measures to facilitate fish passage across barriers in rivers exist. We distinguish between upstream and downstream fish passage measures. Upstream measures may also support downstream passage but their design (e.g., placement in the river, position of entrance) is optimized for upstream passage. Following the nomenclature of fish passes proposed by the Food and Agriculture Organization of the United Nations, we distinguish between technical, nature-like, and special designs for upstream fish passages [28].
Technical designs for upstream passage include roughened ramps with pool structures, vertical slot passes, and Denil (i.e., baffle) passes. Pool passes are the most common technical design, in which fish move upstream from pool to pool [27]. The vertical slot fish pass is another common technical design that enables passage through a vertical, top-to-bottom opening [29]. Roughened ramps with pool structures are designed similar to slot passes but with natural materials (e.g., pool transitions are formed by more or less strongly dissolved stone bars) [26]. Denil passes are suitable for low head heights and larger species (i.e., >30 cm in length).
In our case studies, nature-like fish passes include roughened bypass channels with pool structures as well as combined roughened bypass channels with pool structures and vertical slot passes (mostly built at the entrance and the outlet of the fish pass). Such nature-like fish passes use natural materials like boulders and rocks to dissipate energy, provide habitat, facilitate the natural displacement of material (e.g., sediment transport), and support structural changes (e.g., displacement of gravel banks, development of riparian vegetation, and deadwood dynamics). They include three types: rock (bottom) ramps, fish ramps, and bypass channels [25]. While rock and fish ramps are more suitable for small differences in the height of the head and tailwater, bypass channels can be built to overcome larger obstacles. However, long natural bypass channels may result in high construction and land acquisition costs [29].
Fish locks, lifts, screws, pumps, and canons are considered special solutions. As non-volitional passage structures, they transport fish upstream using mechanical means rather than voluntary swimming [29].
Compared to upstream passage, measures to support downstream passage tend to be less advanced [30]. This is in part due to downstream moving fish following the main current, the complexity of design, and the view that fish can pass downstream via the turbines [31,32]. However, passage via the turbines is likely to lead to serious injuries or death [33,34]. Downstream fish passage can be facilitated either actively (i.e., with screens, louvers, sensory or behavioral barriers, and other guidance structures) by adapting power intake solutions with special design of trash racks, or passively with water release to provide attraction flow and operation of the hydropower infrastructure [35].
Our review of downstream measures includes bypasses, fish protection screens/racks, combined screens/racks with bypass systems, and guiding walls/dams. Bypasses refer to systems that funnel fish downstream usually via pipes, gates, or open channels [29]. The type of passing fish will affect the costs of a bypass facility based on their flow preferences [36]. Additionally, maintenance costs may be incurred when drifting debris blocks the bypass and must be removed [30]. On the other hand, fish protection screens/racks directly block fish from turbine intakes using physical structures made of plastic, metal, wedge wire, or bars [30]. Combined screen/rack bypass systems use a mixture of both technologies. Guiding walls or dams are used to deflect species that tend to migrate close to the water surface [37]. The walls repel and guide fish to a nearby bypass channel. The success of these downstream measures in fish protection and facilitating the undisturbed passage of fish is controversial and generally considered to be rather low [38]. Although significant progress has been made in the past decade to improve downstream passage technology, the costs of these measures often fuel debate about their necessity.
Following the categories of fish passage measures described, our study reviews costs of 327 case studies from European hydropower plants. To our knowledge, most studies in the European context have primarily outlined individual case studies. Further, recent literature on the costs of measures to support migratory fish has mainly focused on financial costs associated with passage measures, while potentially significant economic costs were not considered. To shed light on the cost trade-offs associated with sustainable hydropower, we compare the costs of technical and nature-like fish passage measures. Given our limited data about special passes, we cannot draw conclusions about them in this comparison. We investigate the extent to which unit metrics are useful for predicting construction costs and how planning costs differ from actual costs. As they are a common reference point for many operators, we hypothesize that unit metrics can accurately predict costs. Further, we compare how different types of costs (construction, maintenance, power and income losses) contribute to lifetime mitigation costs. To estimate the costs associated with power losses, we compare power losses under low and high electricity price scenarios. We hypothesize that construction and power losses account for the largest shares. Finally, we hypothesize that technical measures for fish passage show lower construction costs than their nature-like counterparts. This is because nature-like measures may require additional land, which can be expensive to acquire [25]. Further, planners can standardize technical measures across sites, thus incurring fewer costs during the planning stages.
2. Materials and Methods
2.1. Data Acquisition
We compared the costs of building, maintaining, and monitoring fish passage measures using 327 case studies (Germany: 151, Austria: 101, Sweden: 58, France: 16, Switzerland: 1). The data were collected from available reports and through a questionnaire sent to European hydropower operators and from a search of online available data. The German data came from the Thüringen State Office for the Environment, Mining and Nature Conservation, which published reports and data on the planned costs of river connectivity measures for various rivers, including the Ilm, Saale, Unstrut, Werra, Gera, Apfelstädt, and Ohra Rivers [39,40,41,42,43]. (The data can be accessed on Thüringer State Office for the Environment, Mining and Nature Conservation (Landesamt für Umwelt, Bergbau und Naturschutz)’s website at https://tlubn.thueringen.de/wasser/fluesse-baeche/durchgaengigkeit/) The Austrian data came from the Österreichs Energie [44] reports about the National Water Management Plan 2009, which reviewed a total of 133 measures for the implementation of the Water Framework Directive. This analysis did not include all Austrian measures as some of them were related to flow and habitat improvements. The Swedish, French, and Swiss data were collected using an online questionnaire with operators (Vattenfall) and the French small hydropower association (France Hydro Electricité). While the data were not representative for all of Europe or the respective countries, they covered a variety of geographic areas (Alpine region, Scandinavia, France), plant sizes (3.5 kW to 5.88 GW), and technologies (reservoir and run-of-the-river). Table A1 in Appendix A lists the case studies used in our analysis by country, capacity, and measures type. Because the data came from different sources, it is important to note that some observations are missing variables. Thus, the number of observations is noted at each stage of our analysis.
2.2. Types of Costs
Financial and economic costs are associated with upstream and downstream passage facilities. Table 1 outlines the specific types of financial and economic costs associated with both. Notably, there were differences for maintenance, legal costs, as well as compensation for land and habitat. Certain downstream measures may not have required any or very little maintenance like passive downstream measures such as guiding walls/dams. On the other hand, downstream measures like screens/racks may have incurred recurrent maintenance costs associated with removing debris and cleaning the screen/rack, unless they were self-cleaning [30]. Further, downstream measures were unlikely to incur legal costs or require compensation for land and habitat as they normally do not require additional space.
2.3. Data Analysis
Before analysis, we deflated our cost data (1992–2017) to 2019 Euro values to adjust for changes in values over time. We first deflated the data to the base year (2019) using average yearly inflation rates based on the Consumer Price Index (CPI) in the respective countries in the year of costing [45]. We assumed that the start year of the project was the year of costing as planners tend to make decisions based on cost estimates made in the first year of construction. For the Swedish data, we then converted Swedish krona (2019) to Euros using the average 2019 exchange rate after deflating the data. The Swiss data were already reported in Euros. As we indicate which countries the costs come from, we did not correct for purchasing power parity between countries.
2.3.1. Analysis of Non-Recurring Costs
First, we discussed the capital costs (construction and planning) of different types of mitigation measures. These are non-recurring costs. In the data, capital costs refer to those associated with constructing the measure. As the data came from different sources, the exact itemization was unavailable. However, it was assumed that the capital costs included the costs of planning, engineering, materials, and labor.
During the planning process, operators often estimate the capital (construction) costs. However, planned costs may differ from actual implementation. To investigate this discrepancy, we visualized the unit costs for planned and actual upstream measures for vertical slot passes (technical) and roughened bypass channels (nature-like). We selected these measures as they tended to be the most common installations for technical and nature-like passes, respectively [25], which was also reflected by the greatest number of observations in our data. We only visualized the data from Austria and Germany. As many companies in Austria and Germany plan and build fish passes in both countries, the price difference for planning and construction between Austria and Germany is likely negligent. Furthermore, many regions in Austria (northern Alps) are logical comparison units to the southern part of Germany (Bavarian Alps) from a landscape perspective.
To understand how plant and passage facility characteristics affect the capital costs for upstream passes, we estimated a linear mixed model fit by restricted maximum likelihood (REML). Observations were limited to those with complete information for the variables (n = 127). We estimated three models. The first model controlled for the specific type of measures:
is the total capital (construction) cost associated with upstream fish passes. and are the height of the obstacle to be passed and length of the pass, both in meters. is the capacity of the plant in kW, which controls for the size of the plant. By including the logarithmic transformation of cost, we assumed that capital costs would increase exponentially, which we confirmed through visual inspection of the data. We also included measure type () controls as we expected differences across types of measures. Random effects for the country () are included and is the error term.
We then estimated a second version of the model, which included a binary variable () for whether the costs are based on a planned or implemented project. This tested whether there is a difference between planned and implemented costs while controlling for structural characteristics and the type of measure.
In our third model, we replaced the specific measure variables by grouping them into three categories: technical, nature-like, and combined. The technical design was the baseline and we included interaction terms to investigate how the categories relate to the height of the obstacle and length of the pass. This tested whether generalizations can be made about cost differences between technical, nature-like, and combined fish passes and their structural characteristics. Within the categories, we expected that there would not be significant differences between measure types as technical passes always use concrete and nature-like always use natural materials for construction. Thus, construction costs should be similar but the quantity that is needed might differ. However, we controlled for the quantity by including the height, length, and plant capacity. We therefore estimate the following:
Similarly, to understand how structural characteristics affect the capital costs for downstream measures, we estimated a model using generalized least squares fit by REML. We estimated the costs of downstream mitigation measures (i.e., screen and bypass) as a function of screen/rack area () and a binary variable for rack configuration () of vertical (1) or horizontal (0). is the error term. Observations were limited to those with complete information for the variables (n = 17). As all observations came from Germany, we did not include country random effects. Due to missing information, we did not include other factors, such as the angle of the screen/rack.
For the 40 case studies that reported the configuration of the screen/rack (includes both fish protection screens/racks and combined screen/rack bypass systems), we tested whether there are significant differences in costs between horizontal (n = 27) and vertical (n = 13) racks.
2.3.2. Analysis of Recurring Costs
We then presented descriptive statistics for annual maintenance and lost power for both upstream and downstream passage measures and for the monitoring of upstream measures. These are recurring costs. While maintenance and monitoring are expressed in Euros, we presented the lost power production in kWh.
2.3.3. Analysis of Lifetime Costs
Finally, we combined capital, maintenance, and lost power costs in a levelized cost of mitigation (LCOM) using the following formula:
There are a variety of methods for estimating the levelized cost of a technology [46]. In this formula, represents the investments (construction) expenditures of the mitigation measure, represents the maintenance expenditures in the year , represents the power production losses (EUR) in the year , represents the plant capacity (kW), represents the discount rate, and represents the expected lifetime of the measure. Discounting represents the time value of money by expressing the value of future currency in the present. Thus, the discount rate captures how the market and inflation rates change over time. We used a discount rate of 4% as recommended by the European Commission [47]. We assumed a lifetime of 30 years for the passage measures as most hydropower concessions in Europe cannot be granted beyond this period [48]. Although the lifetime of passage measures may be longer than 30 years, the duration of concession is more important for the calculation of levelized costs. This is because when concessions expire, additional modernization may be required, which incurs further costs.
The electricity prices will vary based on the time, country and market in which they operate. However, given that we lacked information about when the power losses occur, detailed assumptions about prices may overpromise precision. Thus, we compared two prices based on the feed-in tariffs for retrofitted (including ecological measures) German hydropower plants under the German Renewable Energy Act in 2014. The 2014 EEG tariffs are based on the size of the plant. We selected these prices as they represent low (0.055 EUR/kWh) and high (0.125 EUR/kWh) remuneration.
Our estimation is similar to the levelized cost of electricity (LCOE) proposed by the United Kingdom’s Department for Business, Innovation and Skills, which expresses the average net present cost of generation over a plant’s lifetime. Notably, the LCOE is the ratio of total discounted costs over the plant’s lifetime divided by the discounted sum of electricity generated. To levelize costs, we used capacity in place of electrical energy generation as information on the annual generation of each plant was missing. It is difficult to make assumptions about annual power generation based on the plant capacity as hydropower operation hours can vary greatly among plants and by season and location. Some power plants are built and used for peaking (with few operating hours), whereas others are built to run almost constantly.
As many of the case studies included only costs for certain categories, we removed observations that did not have information for all three categories of construction, maintenance, and power losses for the calculation of the LCOM. While the maintenance and power losses can plausibly be zero, we removed them unless this was explicitly stated. We also removed two measures with only one observation (guiding dam/wall and fish lift).
3. Results
The costs of a large variety of upstream and downstream measures are presented in Table 2. For upstream fish passage, we had most data about technical solutions (n = 160). Geographically, these measures were not evenly distributed. Of the 100 Austrian upstream case studies, the majority (71%) were technical solutions such as vertical slot passes (n = 68) and fish lifts (n = 3). Combined vertical slot and roughened bypass channels accounted for the next largest share with 20 case studies, while there were only nine nature-like measures. Similarly, of the 86 German case studies, the majority (70%) were technical solutions such as vertical slot passes (n = 55) and roughened ramps (n = 6). However, nature-like solutions such as roughened bypass channels (n = 23) accounted for the next largest share, while there were only two combined solutions. In contrast, of the 52 Swedish case studies, there was an almost equal number of technical (n = 24) and nature-like passes (n = 27), while there was only one combined measure. Seven of the eight French case studies were technical measures and the Swiss case study was a combined solution.
For downstream measures, operators most frequently reported using a combined screen/rack and bypass, followed by a fish protection screen/rack. Combined screen/rack bypass systems were reported from Germany (n = 57) and France (n = 3). Fish protection by screens/racks in front of the intake to the power plant included a Coanda effect intake screen (n = 1), horizontal rack (n = 3), horizontal rack with cleaner (n = 2), and trash racks (n = 3) and were reported from a variety of countries including France (n = 3), Germany (n = 3), Sweden (n = 2), and Switzerland (n = 1). All bypasses were reported from Germany and guiding walls/dams were from Sweden (n = 4) and Austria (n = 1).
3.1. Non-Recurring Costs of Passage Measures
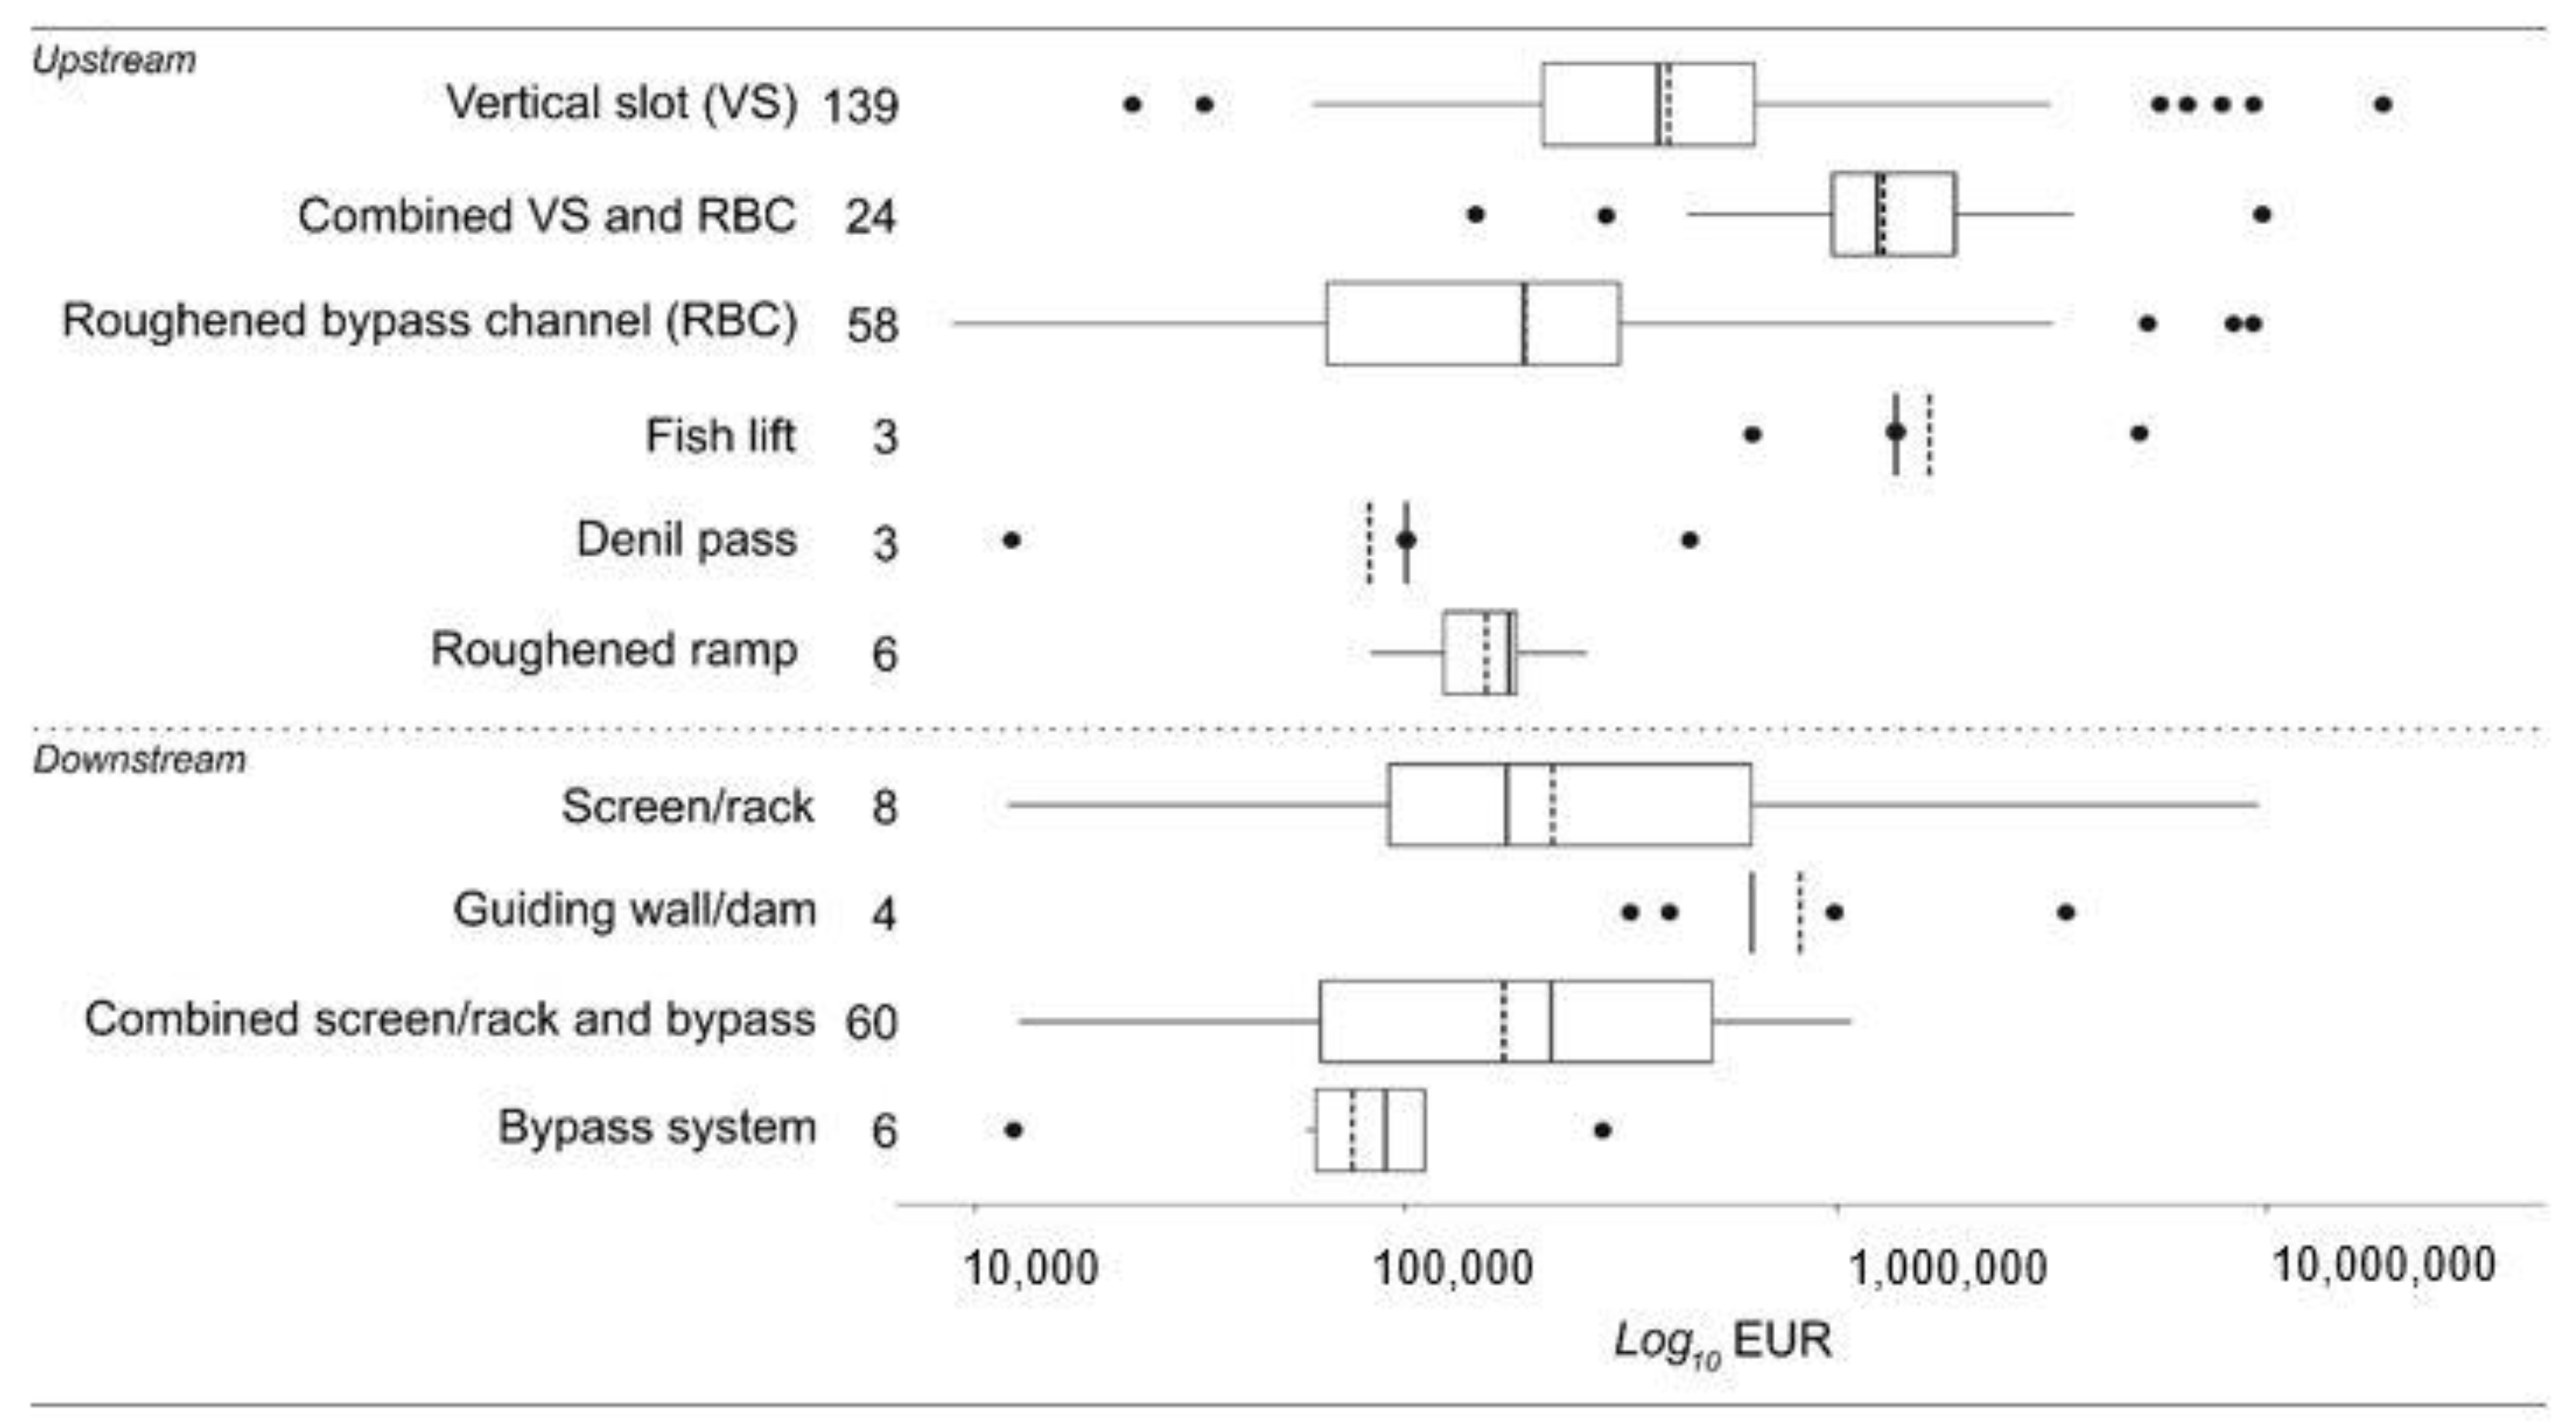
Capital (construction) costs varied across measures and there were often wide ranges within the same mitigation measure (Figure 1). Among upstream measures, fish lifts and combined vertical slot and vertical slot passes had the greatest total costs. However, between the remaining technical types (roughened ramps, Denil passes) and nature-like solutions (roughened bypass channels), there were no major differences in median costs. Notably, there were many outlier observations for vertical slot passes and roughened bypass channels.
There was less variability for downstream measures. Guiding walls/dams were the most expensive to construct whereas combined screens/racks and bypasses, fish protection screens/racks, and bypasses were relatively similar in costs.
3.1.1. Unit Costs of Upstream Passage for Implemented and Planned Measures
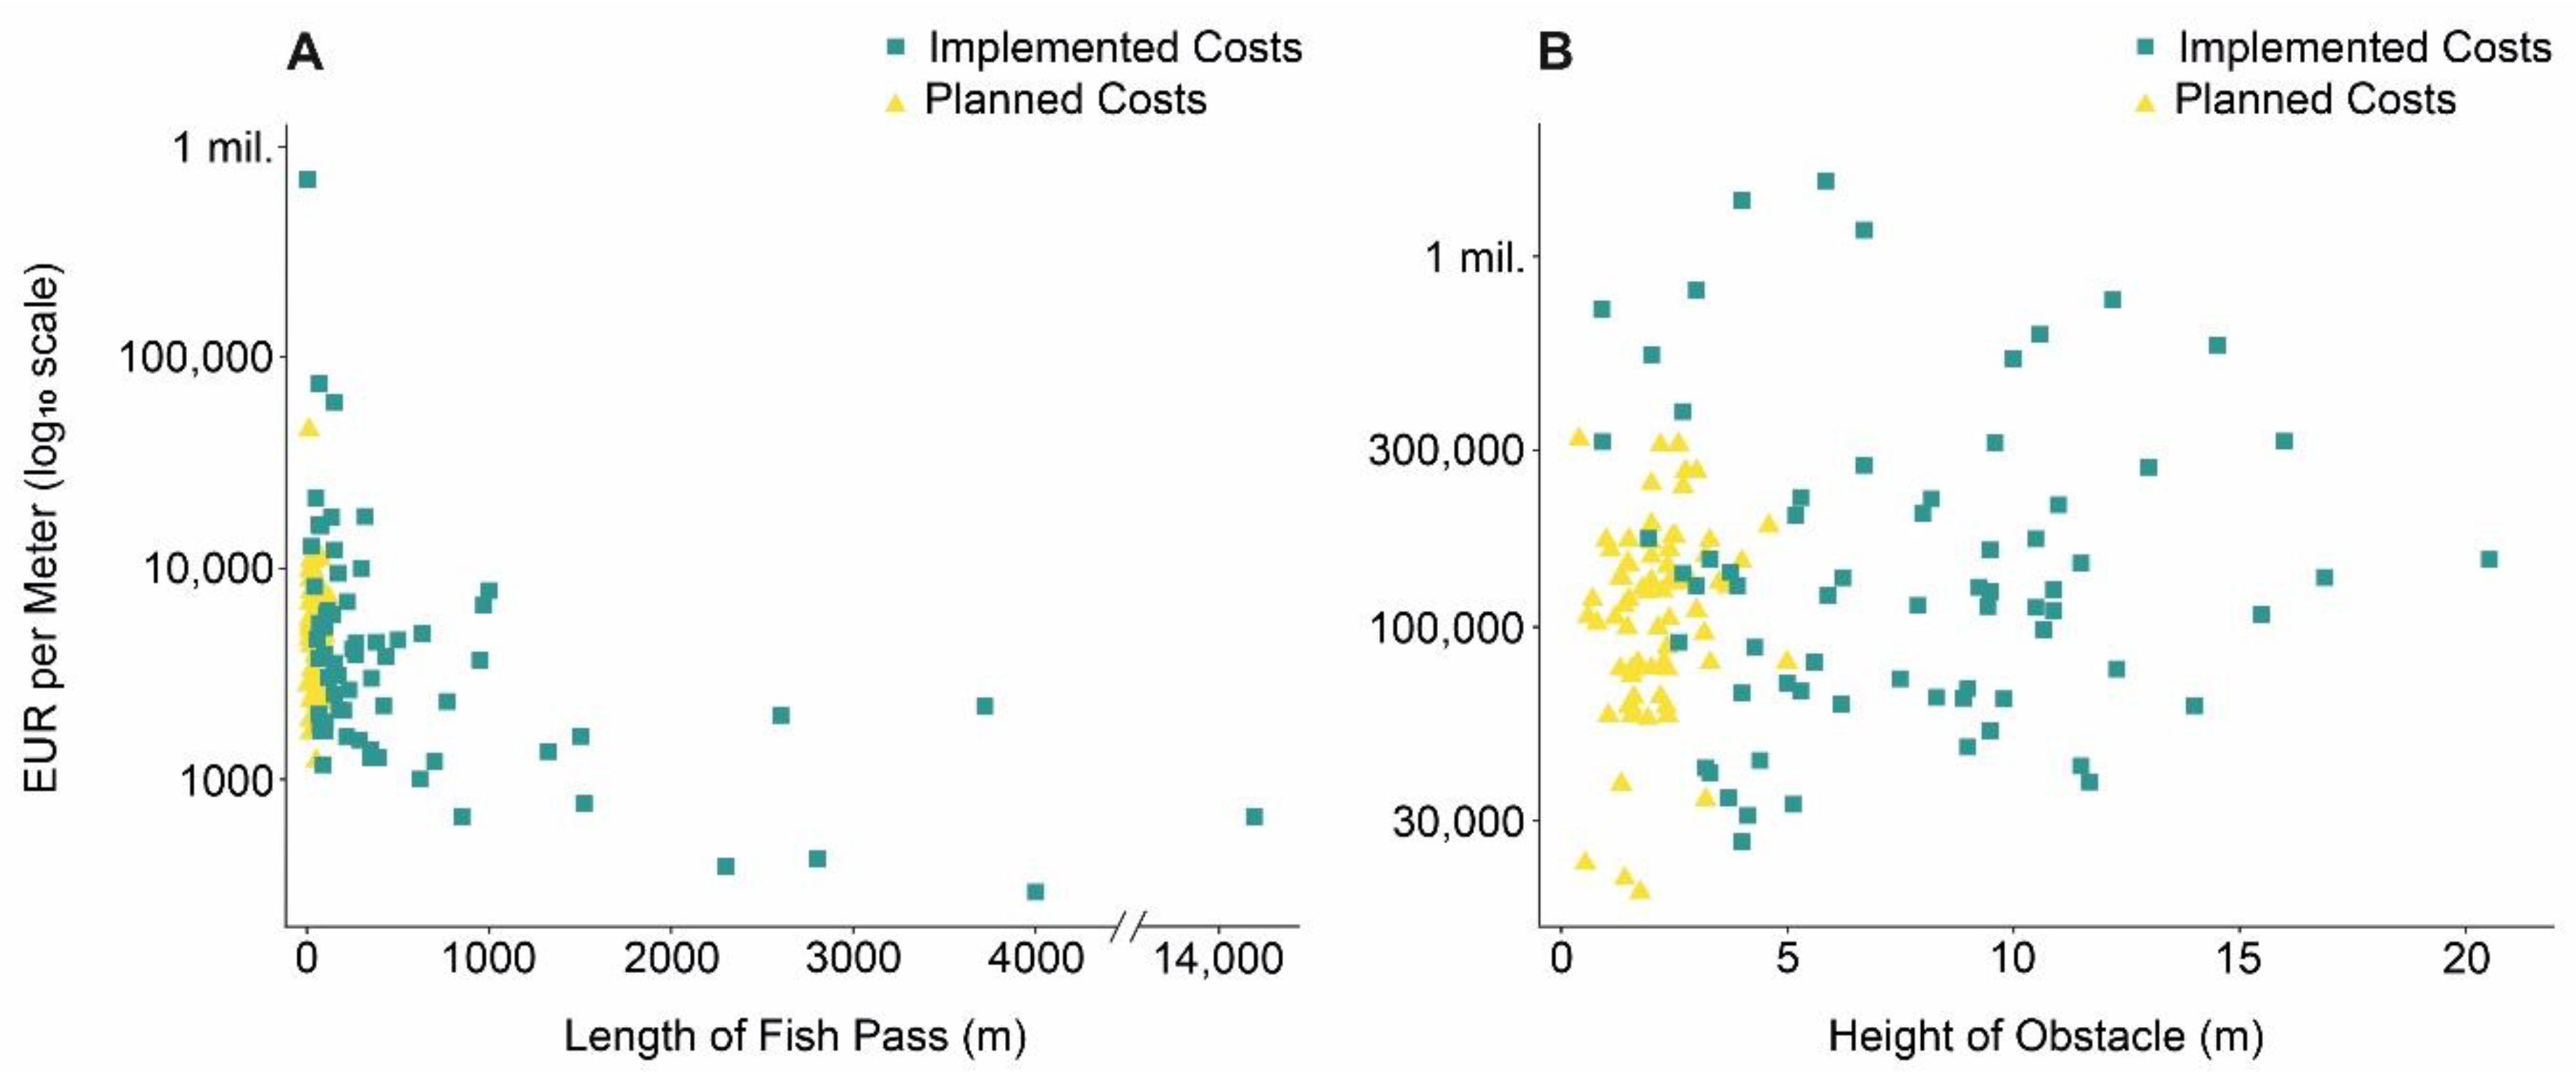
As hypothesized, there were differences between planned and implemented unit costs (Figure 2). For costs per meter height, planned costs averaged 124,608 EUR/m (SD = 65,187 EUR/m) while implemented costs were 235,408 EUR/m (SD = 310,862 EUR/m). For costs per meter length, planned costs averaged 6156 EUR/m (SD = 5179 EUR/m) while implemented costs were 16,642 EUR/m (SD = 83,352 EUR/m).
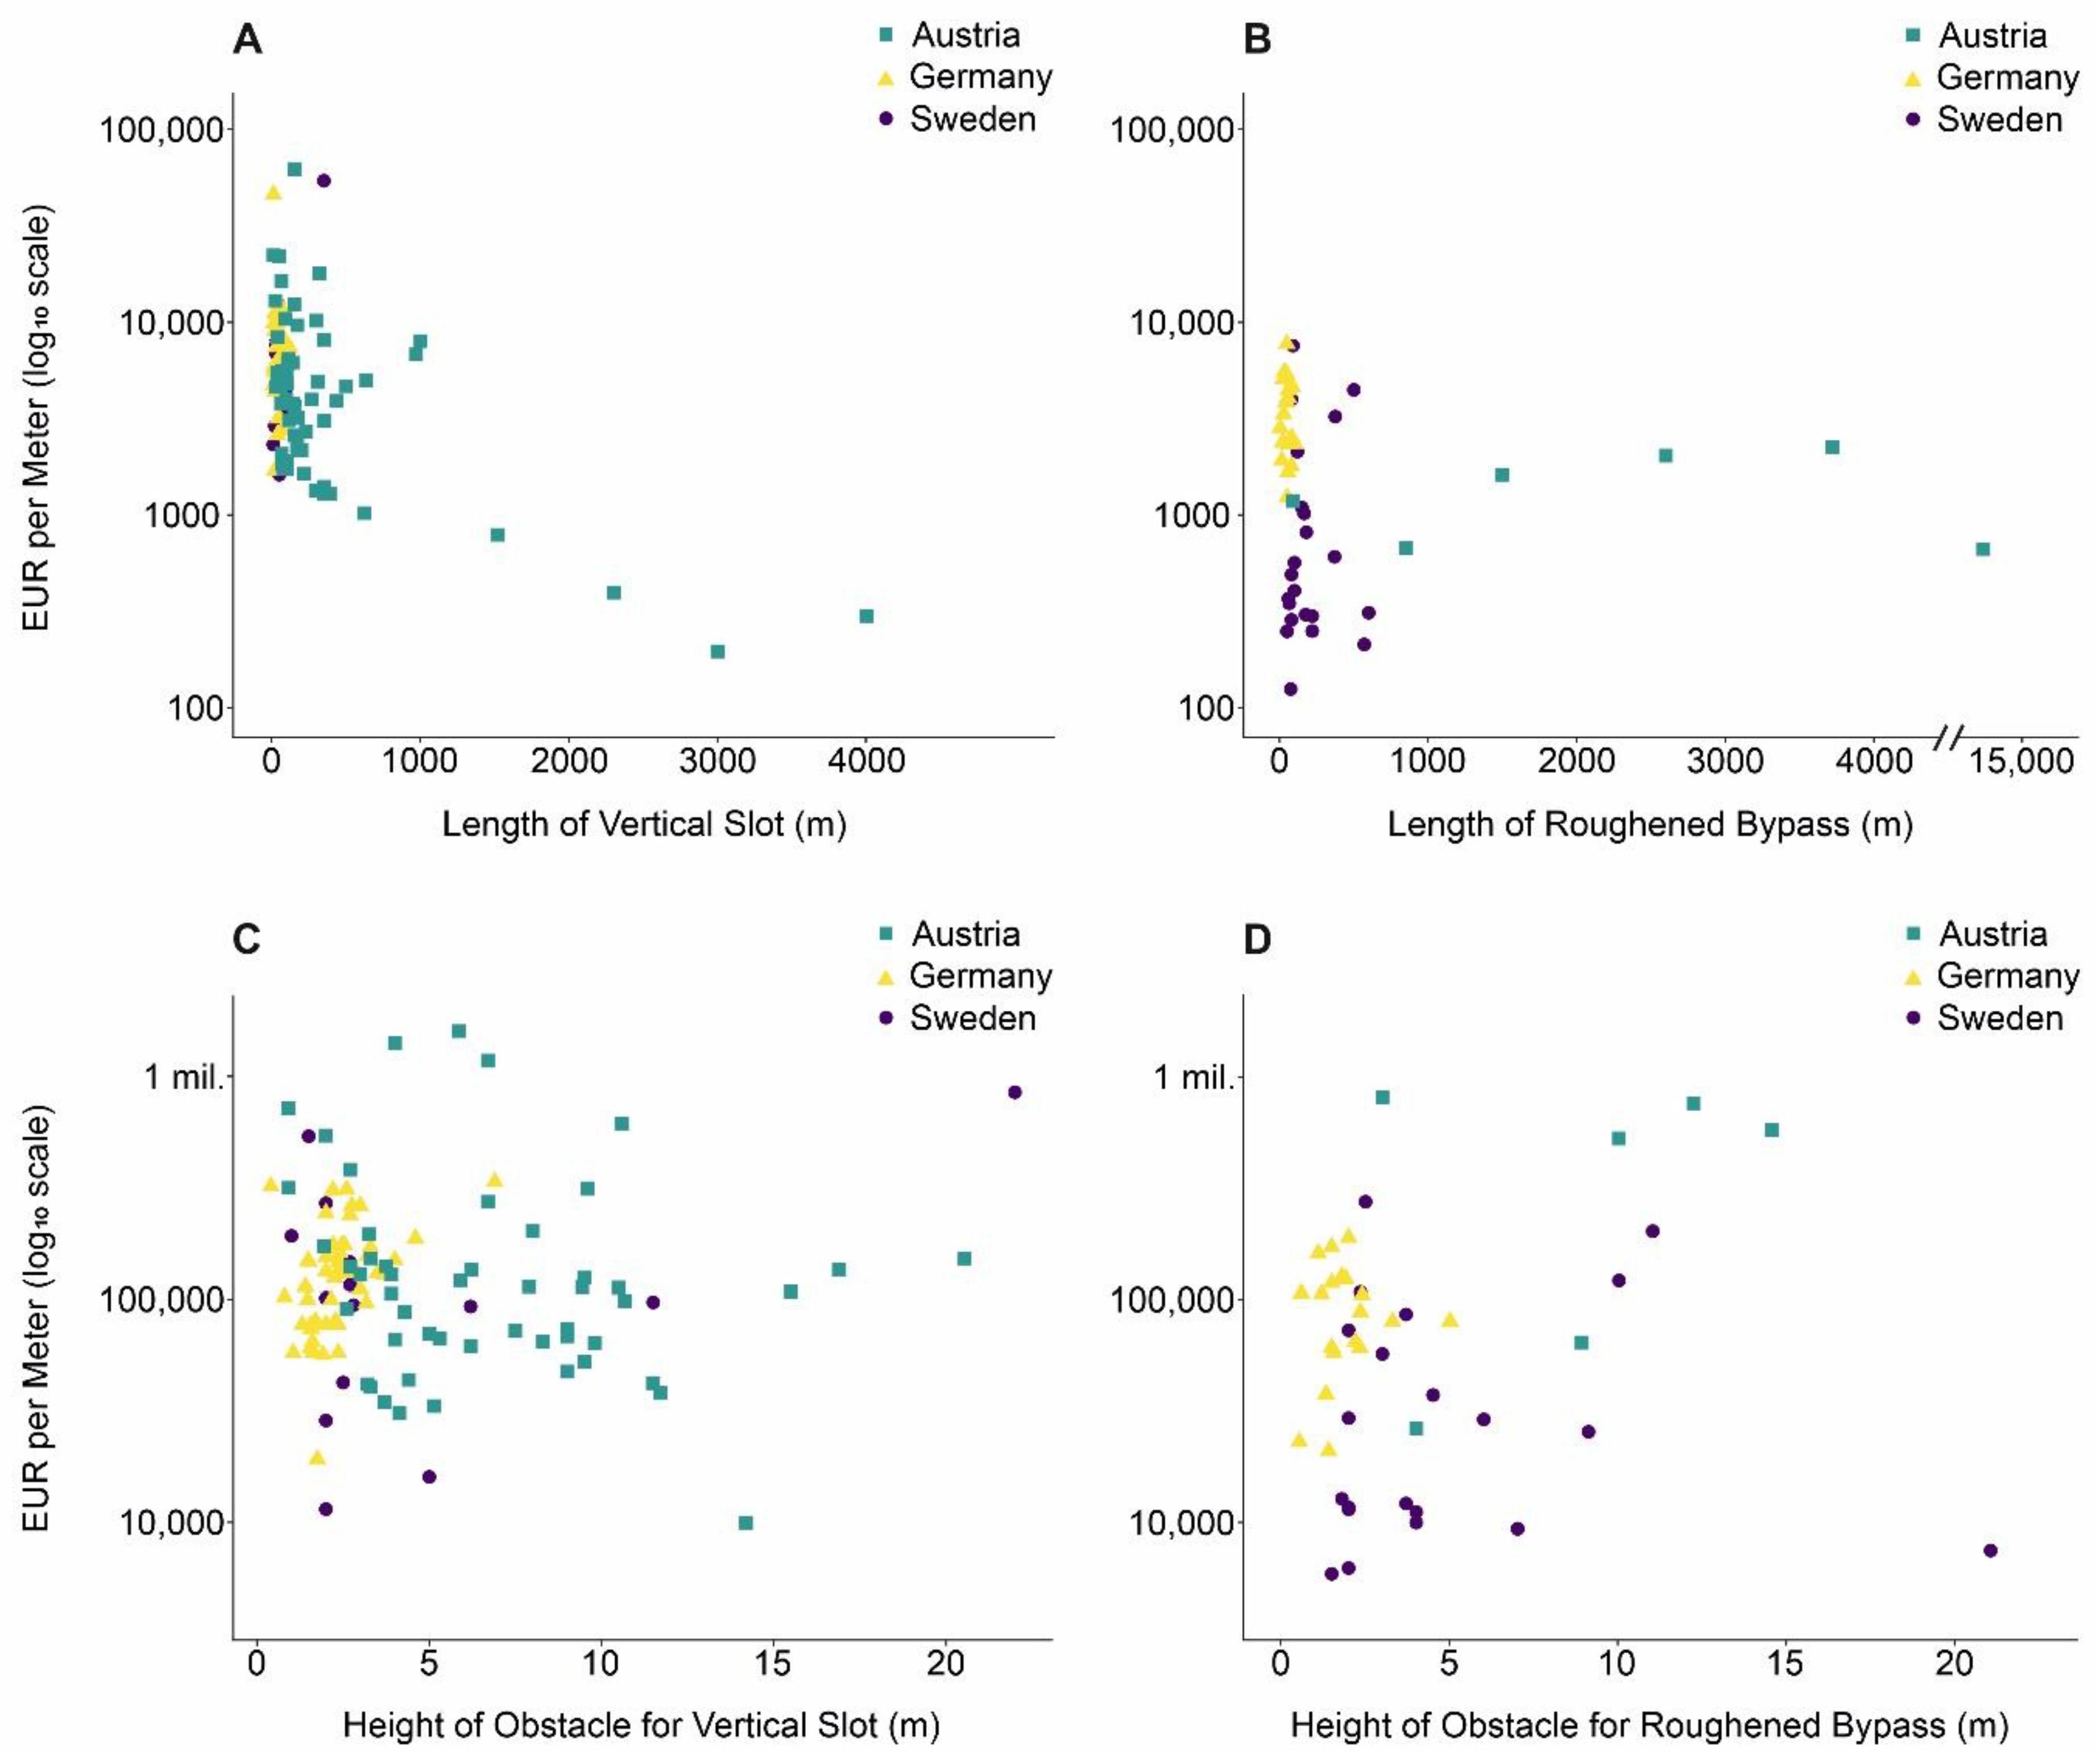
Between technical (vertical slot) and nature-like (roughened bypass channels) upstream passes, there were also differences in unit costs (Figure 3), but no clear trends related to increasing length or height of the pass. In terms of fish pass length, the majority of passes were shorter than 250 m. Costs ranged between 194 EUR/m and 61,301 EUR/m for vertical slot passes. Comparatively, roughened bypass channels had a narrower range with costs between 125 EUR/m and 7720 EUR/m. The mean cost per meter length of vertical slot passes (6914 EUR/m) and roughened bypass channels (2233 EUR/m) was statistically different (p < 0.001). In terms of height, both types of measures overcame heights of around 20 m. There was a weak positive relationship between the height of the pass and cost per meter for vertical slot passes, which implied that as the height increases, the unit cost increases. For vertical slot passes, costs ranged between 9949 EUR and 1,592,769 EUR whereas costs ranged between 5866 EUR and 807,920 EUR for roughened bypass channels. The mean unit costs of vertical slot passes (6914 EUR/m) and roughened bypass channels (2233 EUR/m) were statistically different (p < 0.001). The mean cost per meter height of vertical slot passes (177,788 EUR/m) and roughened bypass channels (122,667 EUR/m) was marginally significant (p < 0.10).
3.1.2. Factors Predicting Capital Costs
Across all three regression models for upstream passage measures, the coefficient estimates were robust (Table 3). Models 1 and 2 compared the inclusion of the implemented binary variable. Both models found positive and statistically significant relationships between length of the pass and construction costs. A 1% increase in length was associated with an increase between 0.54% and 0.55% in capital costs and a 1% increase in the height of the obstacle was associated with an increase between 0.53% and 0.54% for Models 1 and 2, respectively. Also, as expected, capital costs increased with plant capacity. For the type of measures in both models, the variables for fish lift and roughened bypass channels with pool structures were statistically significant. The parameter estimate for fish lift was positive while that of roughened bypass channels was negative, implying that costs are higher for fish lifts than for combined vertical slot and roughened bypass channels (the baseline) while costs are comparatively lower for roughened bypass channels. The variables for roughened ramps and vertical slot passes were not significant. In Model 2, a variable for whether the costs are based on an implemented measure was included. The parameter estimate was negative and significant. This finding implied that costs are lower for implemented measures than planned ones when other structural characteristics are considered. The parameter estimates for Model 3 were slightly different due to the inclusion of the nature-like and combined binary variables (rather than the specific measure types) as well as the interaction terms. Our decision to differentiate between nature-like, technical, and combined passes aligned with the findings of significant differences between measure types in Models 1 and 2. Height, length, and plant capacity were statistically significant and positive. Both binary variables, nature-like and combined, were significant. The parameter for nature-like was negative while that of combined measures was positive. For the interaction terms for nature-like measures, the length of the pass was significant and negative. For the interaction terms for combined measures, the height of the obstacle was significant and negative. The results implied that nature-like passes are less expensive than technical solutions (the baseline), but that this difference diminishes as the pass increases in length. In contrast, combined solutions tend to be more expensive than technical ones, but this difference diminishes as the height of the obstacle increases. When Models 1 and 2 were estimated with Ordinary Least Squares (OLS), the models explained 77% of the total variance observed (R-squared). Model 3 explained 78% of the total variance observed. Table A2 shows the 95% confidence intervals for the upstream models.
For downstream measures, one model was estimated with 17 observations of combined screen/rack and bypass systems from Germany (Table 4). The area of the rack was positively and significantly associated with cost. The estimate indicated that, on average, each additional percent of square meter was associated with a 1.18% increase in capital costs. The configuration of the rack (vertical or horizontal) was not significant. When the model was estimated with Ordinary Least Squares, it explained approximately 93% of the variance. When we tested for differences in costs related to the configuration of the rack with a t-test for additional case studies, the difference in mean costs of horizontal (210,671 EUR) and vertical (243,793 EUR) racks was also not statistically significant. Table A3 shows the 95% confidence intervals for the downstream model.
3.2. Recurring Costs of Passage Measures
For upstream measures, recurring costs such as annual maintenance and monitoring did not account for a large share of lifetime costs (Table 5). For all measures, the annual maintenance costs ranged from 0 EUR/year to 50,220 EUR/year with an overall average of 13,139 EUR per year. Fish lifts had the highest average maintenance costs compared to other measures, but the case study with the highest maintenance costs was a vertical slot pass. In terms of variation, there were large standard deviations across categories, particularly for the roughened bypass channel.
For downstream measures, only two case studies with a guiding dam/wall reported maintenance costs. Between these two case studies, there was large variation.
Our review of monitoring costs found high variability across case studies and notable differences between the monitoring of simple technical, complex technical, nature-like, and combined upstream measures (Table 6). Monitoring for complex technical (i.e., fish lift) and nature-like measures was most expensive as fish lifts had a mean monitoring cost of 160,456 EUR and roughened bypass channels had a mean cost of 443,503 EUR. Comparatively, vertical slot passes had a mean cost of 92,918 EUR and combined solutions cost of 71,262 EUR on average. However, these values were highly variable as indicated by the large standard deviations.
Beyond costs, additional information about the type of monitoring was limited. Only eight measures specified what kind of monitoring was conducted. This included one-time monitoring of water variables (temperature, quality, discharge, etc.) as well continuous monitoring (over a few months) of habitat availability and fish pass functionality. Fish pass functionality was monitored with fish traps, both alone or combined with video, as well as image-based scanner systems. With the exception of fish traps, the specific types of monitoring tended to be more expensive than the average reported overall. For the three cases of fish traps, the mean cost was 14,215 EUR with a standard deviation of 8740 EUR. Comparatively, monitoring with video in addition to fish traps had a mean cost of 157,223 EUR for three case studies with a standard deviation of 104,405 EUR. Finally, image-based scanner systems cost an average of 142,401 EUR for two case studies. Only five measures reported the time span of monitoring, which ranged from one to 24 months.
Annual power losses also represented a recurring cost, which differed sizably across measures (Table 7). For upstream measures, fish lifts and roughened bypass channels incurred the greatest costs on average, although these were highly variable. The majority of observations were vertical slot passes with an average of 149 GWh lost per year and combined vertical slot and bypass channels with an average of 307 GWh lost per year.
For downstream measures, fish protection screens/racks and combined screen and bypass systems reported minimal power losses. For both measures, only three case studies reported power losses, which may be unrepresentative of downstream mitigation measures.
3.3. Levelized Costs of Upstream Passage Measures
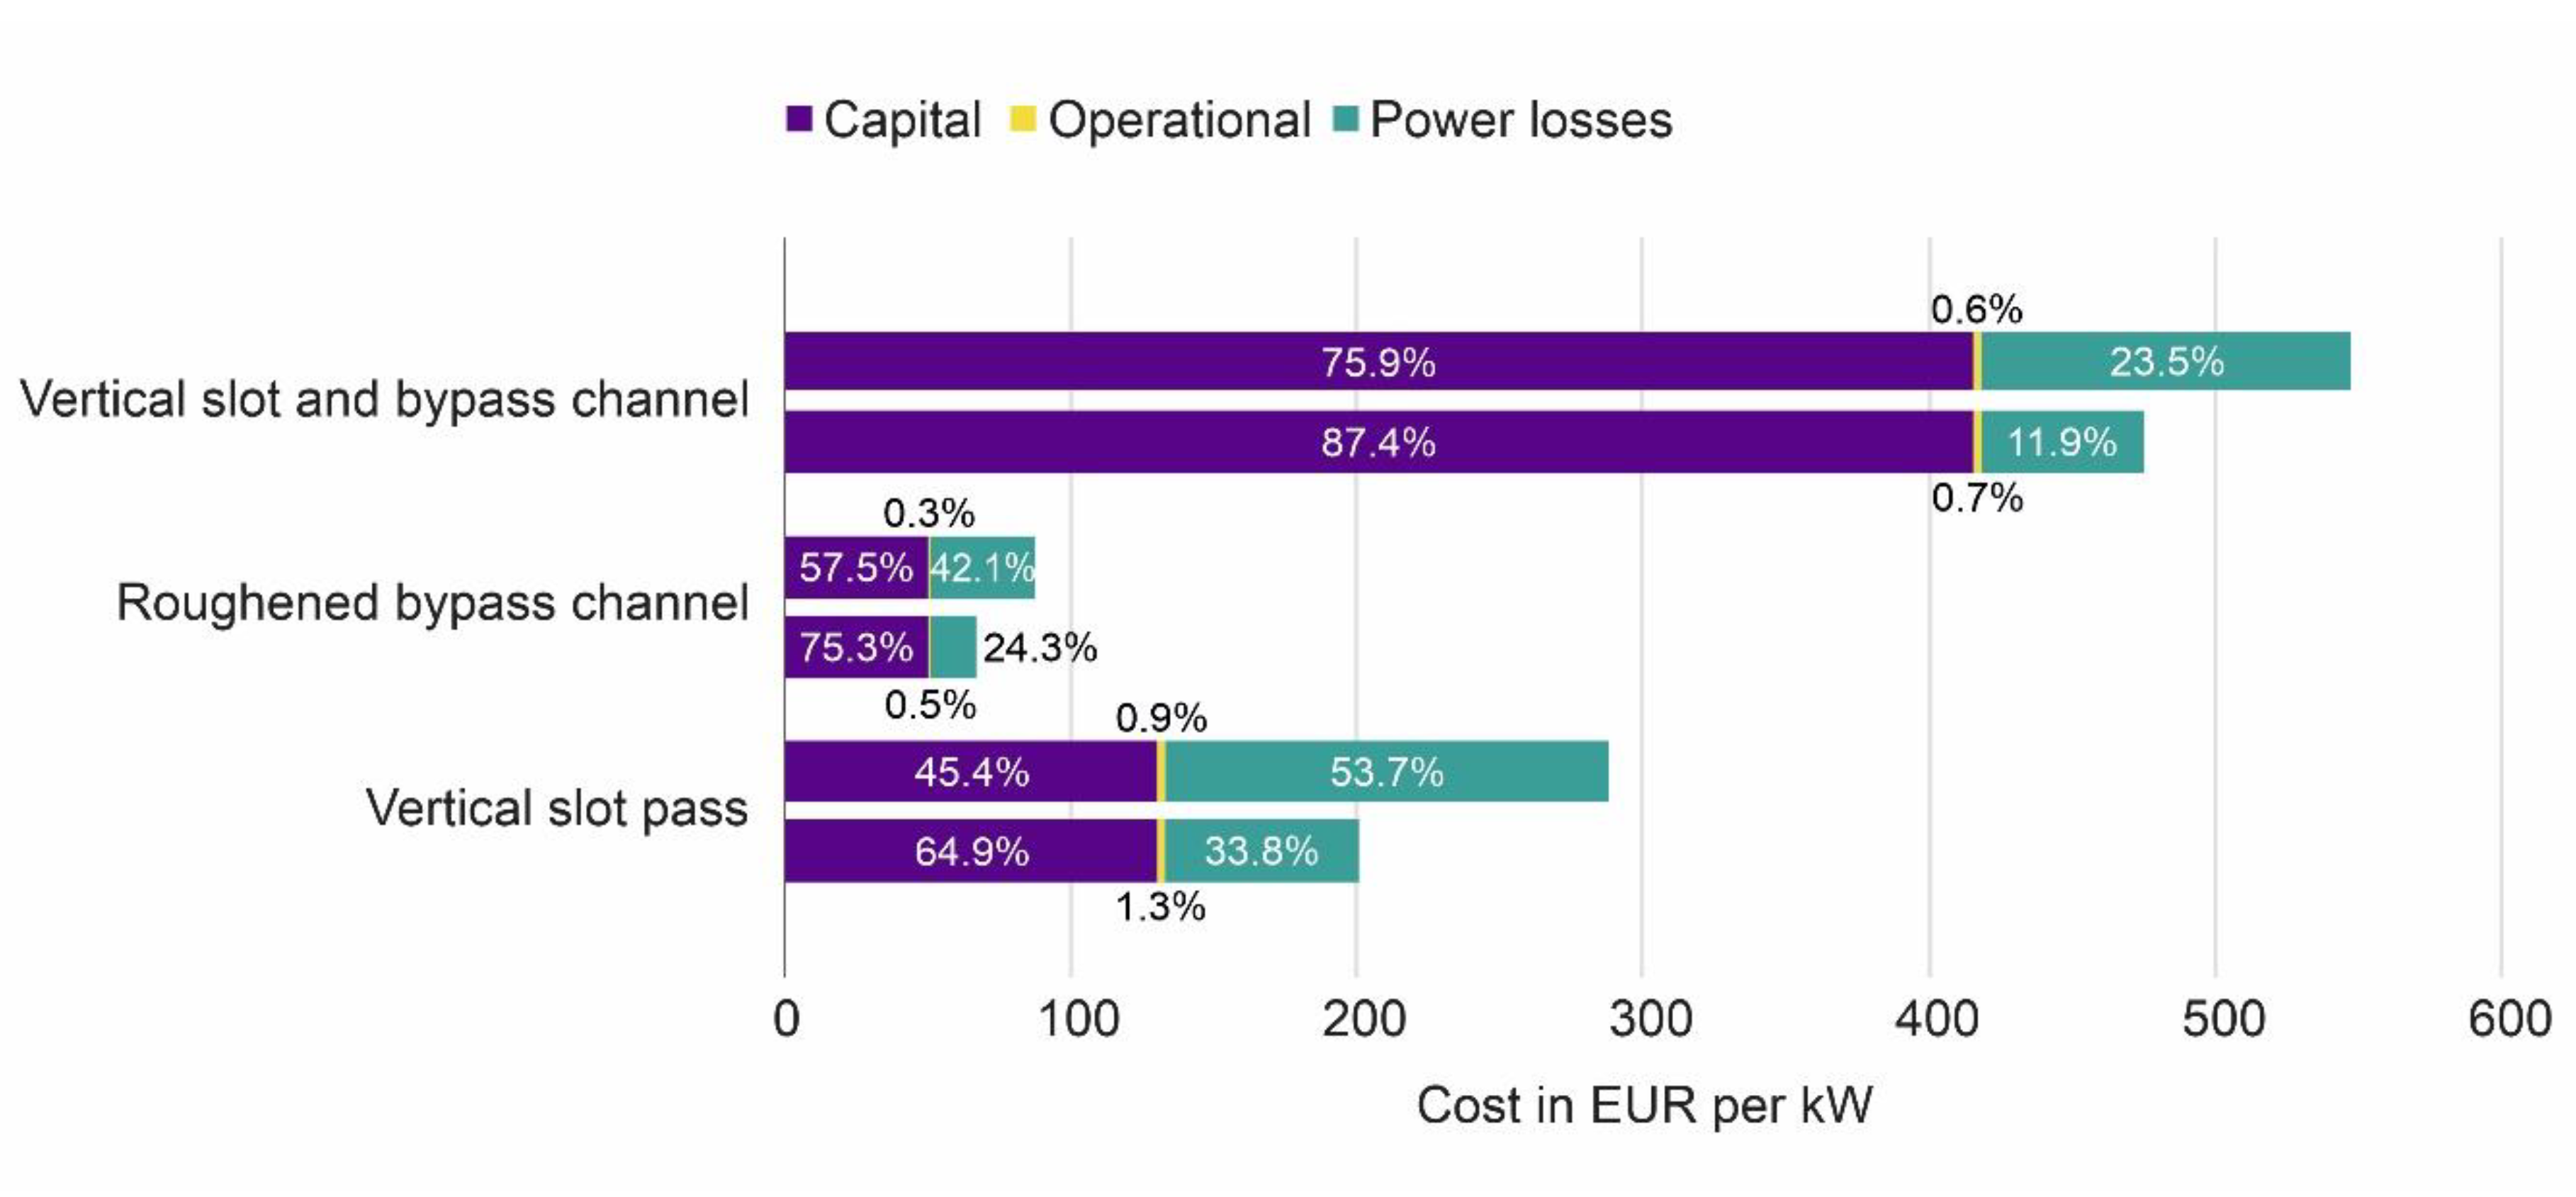
In total, 55 observations were included from Austria (52) and Germany (3). Our results demonstrated that regardless of the electricity price selected, capital (construction) costs tended to account for the largest share of lifetime costs with the exception of vertical slot passes under the high price scenario (Figure 4). Under the high price scenario for vertical slot passes, capital accounted for 45% while power losses accounted for 54% of lifetime costs. For all other scenarios, capital costs represented between 57–76% of lifetime costs compared to 64–87% under the low price scenario. On average, capital costs were highest for combined measures (415 EUR/kW) compared to technical (130 EUR/kW) or nature-like (50 EUR/kW). However, this was highly variable as combined solutions had a standard deviation of 540 EUR/kW. There was also a high variability of technical (214 EUR/kW) passes, but less variability for nature-like passes (48 EUR/kW).
Across all measures, maintenance costs accounted for a comparatively small share of levelized lifetime costs. On average, maintenance costs were greatest for combined measures (3 EUR/kW), followed by technical vertical slots (2 EUR/kW). Some missing observations may have represented zero for maintenance costs. Since missing data and zeros cannot be distinguished unless specified, this may have upwardly biased the results. Of the observations included, three reported maintenance costs of zero.
Despite our simplified representation of electricity prices, the comparison of low and high prices revealed that costs associated with power losses can vary greatly. Comparing the low (high) electricity prices, vertical slot passes had the highest mean cost of 68 EUR/kW (154 EUR/kW), compared to 56 EUR/kW (128 EUR/kW) for combined vertical slot/bypass channel and 16 EUR/kW (37 EUR/kW) for roughened bypass channels. The median, however, showed that roughened bypass channels have the greatest costs (16 EUR/kW; 36 EUR/kW) compared to combined (13 EUR/kW; 31 EUR/kW) and vertical slot (8 EUR/kW; 20 EUR/kW). Similar to maintenance costs, power losses could be zero. Since missing data and zeros cannot be distinguished, this may have upwardly biased the average power losses associated with each measure type. Of the observations included, five reported power losses of zero.
4. Discussion
To understand the cost trade-offs associated with sustainable hydropower, we established several hypotheses about the costs of fish passage mitigation. We hypothesized that planned costs and unit metrics can accurately predict costs. Further, we posited that construction and power losses account for the largest shares of lifetime mitigation costs. Finally, we hypothesized that technical measures incur lower costs than their nature-like counterparts.
However, we found that planning costs differ substantially from actual costs. This may be because planned costs often cannot account for difficulties that arise throughout the construction process (e.g., shortages and changes in the prices of materials) as well as site-specific factors (e.g., target species, difficulty of site accessibility, ground conditions, and local regulations) [25]. As many of these complications cannot be foreseen or quantified, we investigated whether other variables can improve predictions about the construction costs of fish passage mitigation.
For upstream passes, we investigated the extent to which the height, length, or type of pass predicts construction costs. Understanding whether height or length is the key driver of upstream passage costs may affect the decision-making process of operators. For example, if an operator is deciding between a fish lift and vertical slot pass, they may find it is cheaper to build the lift if length is the main driver of costs. We found a strong relationship between construction costs and the height of the obstacle and length of the fish pass. A possible exception to the usefulness of height for predicting upstream construction costs are fish lifts, as previous literature suggested that their construction costs are relatively independent of dam height [49].
For downstream passes, we investigated whether the area and configuration of the rack/screen predicts construction costs. Our analysis confirmed that the area can be useful for predicting costs. While a rack/screen is a standard installation for hydropower plants used to repel debris, some can be adapted to function as fish protection and a guiding structure. For this purpose, adaptations in bar spacing (narrowing) or angle as well as inclination are typical but may contribute to higher expenditures (purchase price, reduction in flow during operation, which reduces power production) [29]. Ideally, other variables about the presence of a cleaning device and inclination (angle) of the rack, and the cost of the bypass structure would have been relevant to potentially explain more variance. As our data did not comprehensively provide information on inclination or other specific characteristics of the racks/screens, only a comparison of the orientation was possible. However, we found no significant difference in construction costs for vertical and horizontal racks/screens.
The first step of our analysis only considered how these factors affect construction costs, but mitigation can also entail maintenance costs and power losses. Power losses can be difficult to quantify. Thus, upfront construction costs may be assumed to account for the largest share, which may lead decision makers to underestimate the total costs of fish passage mitigation if power losses represent a large share of lifetime costs.
For upstream measures, we hypothesized that capital (construction) costs and power losses account for the largest shares of lifetime costs. Under almost all price scenarios, capital costs accounted for the largest share. However, in the high price scenario for vertical slot passes, power losses accounted for a greater share. This means that when electricity prices are high, power losses may represent a significant concern for operators. However, it is difficult to generalize findings about power losses of measures as there may be significant variation in power loss among sites. Fish passage facilities may be designed to operate only during the migration season [50]. Thus, they do not necessarily operate year-round. Smart management of water release should ideally be adapted to both fish migration and power production needs. This could potentially reduce power and income loss while still maintaining fish passage. Such solutions depend on site-specific conditions, fish species composition, legal requirements, and operational constraints. Our finding is significant because previous cost reports of fish passage measures primarily focused on construction and operation [8], rather than quantifying the role of power losses. As a result of lack of data, a comparison of lifetime costs for downstream passage measures was not possible. Thus, it represents a potential avenue of future research.
Both of these analyses allow us to compare the costs of different types of upstream passage measures. We hypothesized that technical designs are often favored since less space is needed, which incurs fewer costs related to land acquisition. This can be most severe in congested urban areas of Europe. Our analysis of construction costs, however, showed that nature-like fish passes were comparatively cheaper, even when controlling for interactions between nature-like builds and the length or height of the pass. We found that nature-like passes are less expensive than technical solutions, but that this difference diminishes as the pass increases in length. In contrast, combined solutions tend to be more expensive than technical ones, but this difference diminishes as the height of the obstacle increases. This finding was consistent with the analysis of lifetime costs.
When considering lifetime costs, nature-like solutions incurred relatively fewer costs, specifically, fewer power losses compared to combined and technical solutions. When comparing combined and technical solutions, combined solutions were more expensive. This may be because combined solutions are often built when the height is too great for the available space. When compared across sites, natural materials may be cheaper for construction, particularly if autochthonous materials with fewer transportation costs are used [51]. Given that our results showed that nature-like solutions cost less to build and operate, incur fewer power losses, and provide habitat [52] in addition to facilitating fish passage, there is a strong basis for supporting their development in Europe.
Our study also yielded differences in the monitoring costs of upstream passage measures. The lack of data related to the costs and types of monitoring is evident. Approximately one-third of the case studies reported monitoring costs. However, only eight reported the type and five reported the timeline. While it is unclear whether the case studies simply did not report the costs or whether no monitoring took place, recent studies have noted the dearth of effectiveness monitoring related to fish passage measures [53]. In contrast, a study of river restoration measures showed that 80% of the projects are monitored [54]. This may stem from the belief that standardized passage design based on species-specific formulas [55] ensures success. Hence, additional monitoring is often not considered necessary and may result in additional costs if functionality is not proven after all. Recent literature argued that most design criteria are primarily based on salmonids in the Northern Hemisphere, which fails to account for the variation in individuals, populations, and species at individual sites [27].
Our data reveal that when a complex technical solution is built (e.g., fish lift), operators often invest in intensive monitoring. In turn, simpler technical measures (e.g., vertical slot pass) may require less monitoring as proven solutions do not need to be tested. In comparison to vertical slot passes, which can be standardized, nature-like solutions like roughened bypass channels tend to be adapted to local landscape conditions, which may also result in additional monitoring expenses. Nature-like passes may also be more complicated to monitor without standardized and pre-fabricated monitoring gear.
Additionally, there is an array of possible indicators for passage effectiveness. While environmental variables such as temperature, discharge, water depth, and water velocities are regularly used for evaluating passage mechanisms, they are not suitable for cross-site comparisons as they cannot imply a cause and effect [53]. However, detailed reporting of hydraulic and structural parameters may make studies more comparable across sites [53]. Given the high costs of fish passage restoration, assessing the costs and ecological benefits is important to develop evidence-based solutions in the future [55,56]. Thus, we recommend that policy makers standardize monitoring and reporting of the hydraulic, structural, and biological parameters as well as costs in a much more detailed manner.
Future analysis of upstream fish passage costs can be strengthened by clear reporting of structural characteristics. For many variables, data were missing, which reduced the observations in a complete case analysis. Further, it was often unclear how the variables were reported. For example, sometimes the reported length was the shortest distance between the entrance and exit of a fish pass, while other times it was the true length of the fish pass. In the analysis, it was not possible to account for such data inconsistencies as it was not always clear how operators reported length. Additional information about the target fish species may also help to account for the variation observed, as technical and nature-like designs may be built for different types of target species. While we did not have information about the target species for all measures, we found that there were no major differences in the target species for technical or nature-like passes (i.e., technical fish passes were not specifically built for stronger swimmers).
For downstream fish passage measures, our analysis was largely limited by missing data, especially related to maintenance and power losses. These costs can be difficult to identify as some downstream measures may be installed at hydropower plants for reasons unrelated to fish (e.g., trash rack to repel debris). However, if they are designed properly, they can serve the dual purpose of protecting fish. Thus, we recommend that future research focus on the costs of downstream passage facilities. Finally, future research can conduct cost-benefit or cost-effectiveness analyses. While we found that nature-like solutions tend to cost less, it will be important to quantify the possible additional ecological benefits (e.g., providing habitat) to assess their value relative to other types of fish passage measures.
Given the costs, the question arises of how the sustainable management of hydropower and fish passage can be financed and how effective solutions can be incentivized. Present financing instruments include support schemes, feed-in tariffs and green power labels [12]. While support schemes compensate for the modernization of existing plants through direct financing, grants, or loans, feed-in tariffs guarantee a fixed price for renewable energy fed into the public grid and green power labels set minimum standards related to electricity production [12]. Specific to passage restoration, direct financing and loans may cover construction costs, whereas feed-in tariffs may offset the recurring costs associated with power losses.
In some countries, mitigation is financed by state authorities using taxes. In Switzerland, for example, all plants built before 2011 are eligible for financing of upgrades. Ecological improvements are supported by a tax of 0.1 Rappen/kWh on all consumer electricity bills, which amounts to the “Swiss Grid Fund” with a maximum of 50 million CHF/year. To incentivize upgrades, the Swiss Grid Fund is available on a first-come-first-serve basis until the program expires in 2030. After the program’s end, operators will be fully responsible for financing, which is in line with the polluter-pays principle [57]. In contrast, Austria supports approximately 50% through national funding such as the Environmental Aid Act. However, this excludes losses stemming from electricity production [57,58]. In Sweden, green power labels are used to incentivize ecological restoration. For operators to qualify for green power labels, they must make annual contributions to environmental projects [12]. The approach of targeted financial contributions may ensure that measures are carried out at sites with the greatest need, which could maximize effectiveness.
In some cases, the amount of funding provided is assessed on a case-by-case basis, which can be time-consuming and costly. On the other hand, arguments can be made for a simpler system based on standard refunds determined by the type, length, and height of the measure or a percentage of costs. While simplification is desirable, the results here do not support a standardization of costs. Within each category, the standard deviation is often greater than the mean, which indicates a wide range of possible costs.
To offset production losses resulting from fish passage measures, feed-in tariffs may be useful. Feed-in tariffs may be conditional on improvements as in Switzerland, France, and Germany [12]. Typically, different rates apply, based on the size of the plant. The larger the plant, the lower the rate. However, given the fluctuations in time of lost power production and market rates, our analysis cannot assess whether feed-in tariff rates are sufficient to offset the losses of power production. When establishing priorities related to financing of fish passage measures for hydropower, decision makers must weigh these factors with societal and political values.
5. Conclusions
As sustainable management of hydropower must balance mitigation measures for fish with renewable energy production, decision makers require information about cost trade-offs. This systematic overview detailed non-recurring (construction) and recurring (maintenance, monitoring, power losses) costs of passage measures.
Construction tends to account for the largest share of lifetime costs and while unit metrics (height and length) can be used for estimation of upstream fish passage measures, one should be aware that planning costs often differ substantially from actual costs. In particular, factors such as the target species, site conditions, difficulty of site accessibility, and local regulations contribute to the overall costs of mitigation measures. Comparatively, maintenance accounts for a relatively small share of lifetime costs. As there is limited research on power losses related to fish passage measures, our findings provide a basis for including economic aspects in hydropower decision-making. Under the high price scenario for vertical slot passes, power losses exceed construction as a share of lifetime costs. In most markets, power prices vary significantly over the year, week, and day. Thus, balanced solutions that consider both ecological aspects such as key migration seasons of target species as well as power prices are likely to create win-win situations.
When comparing technical and nature-like upstream passage measures, nature-like measures tend to incur lower costs, even when considering power losses. Given that nature-like solutions cost less to build and operate, incur fewer power losses and provide habitat in addition to facilitating fish passage, there is a strong basis for supporting their development in Europe.
In addition to the limited information on costs, there tends to be limited monitoring of mitigation measures and reporting of their costs, which makes it difficult to explore their efficiency after implementation and enable statements about cost-effectiveness. Thus, we recommend that policy makers standardize monitoring and reporting of hydraulic, structural, and biological parameters as well as costs in a much more systematic and detailed manner.
Author Contributions
Conceptualization, T.E.V., N.S., J.P. and J.G.; methodology, T.E.V.; validation, N.S., J.P., J.G. and A.H.; formal analysis, T.E.V.; data curation, T.E.V., N.S. and A.H.; writing—original draft preparation, T.E.V.; writing—review and editing, T.E.V., N.S., J.P., A.H. and J.G.; visualization, T.E.V. and N.S. All authors have read and agreed to the published version of the manuscript.
Funding
This research was funded by the European Union’s Horizon 2020 research and innovation program under grant agreement No 727830, “Fish-friendly innovative technologies for hydropower (FIThydro)”.
Acknowledgments
We are grateful to the partners of the FIThydro project for sharing their expertise and data.
Conflicts of Interest
The authors declare no conflict of interest.
Appendix A

Table A1.
Overview of all fish passage case studies used in the analysis.
| Country | Type of Plant | Plant Capacity (kW) | Measure |
|---|---|---|---|
| Sweden | 55 | Vertical slot pass | |
| Sweden | Denil fish pass | ||
| Sweden | Run-of-the-River | 4000 | Roughened bypass channel with pool structures |
| Sweden | Denil fish pass | ||
| Sweden | Denil fish pass | ||
| Sweden | 350 | Vertical slot pass | |
| Sweden | 40,000 | Vertical slot pass | |
| Sweden | 599,400 | Vertical slot pass | |
| Sweden | 90 | Vertical slot pass | |
| Sweden | Vertical slot pass | ||
| Sweden | 5000 | Roughened bypass channel with pool structures | |
| Sweden | Vertical slot pass | ||
| Sweden | Roughened bypass channel with pool structures | ||
| Sweden | 1200 | Roughened bypass channel with pool structures | |
| Sweden | Roughened bypass channel with pool structures | ||
| Sweden | Roughened bypass channel with pool structures | ||
| Sweden | 2100 | Roughened bypass channel with pool structures | |
| Sweden | 600 | Roughened bypass channel with pool structures | |
| Sweden | Roughened bypass channel with pool structures | ||
| Sweden | 3100 | Roughened bypass channel with pool structures | |
| Sweden | Roughened bypass channel with pool structures | ||
| Sweden | Roughened bypass channel with pool structures | ||
| Sweden | 300 | Vertical slot pass | |
| Sweden | Roughened bypass channel with pool structures | ||
| Sweden | Roughened bypass channel with pool structures | ||
| Sweden | 40 | Roughened bypass channel with pool structures | |
| Sweden | Roughened bypass channel with pool structures | ||
| Sweden | Roughened bypass channel with pool structures | ||
| Sweden | Roughened bypass channel with pool structures | ||
| Sweden | Roughened bypass channel with pool structures | ||
| Sweden | Roughened bypass channel with pool structures | ||
| Sweden | Roughened bypass channel with pool structures | ||
| Sweden | Roughened bypass channel with pool structures | ||
| Sweden | Vertical slot pass | ||
| Sweden | Roughened bypass channel with pool structures | ||
| Sweden | Roughened bypass channel with pool structures | ||
| Sweden | Roughened bypass channel with pool structures | ||
| Sweden | Roughened bypass channel with pool structures | ||
| Sweden | Roughened bypass channel with pool structures | ||
| Sweden | 1800 | Guiding dam or wall | |
| Sweden | 5200 | Guiding dam or wall | |
| Sweden | 29 | Combined vertical slot and roughened bypass channel | |
| Sweden | 600 | Vertical slot pass | |
| Sweden | 235 | Vertical slot pass | |
| Sweden | 9500 | Vertical slot pass | |
| Sweden | 19 | Vertical slot pass | |
| Sweden | 300 | Vertical slot pass | |
| Sweden | 7500 | Vertical slot pass | |
| Sweden | 2500 | Vertical slot pass | |
| Sweden | 13,000 | Vertical slot pass | |
| Sweden | 3100 | Screen/rack | |
| Sweden | 3300 | Screen/rack | |
| Sweden | 40,000 | Guiding dam or wall | |
| Sweden | 5,994,000 | Guiding dam or wall | |
| Sweden | 7500 | Vertical slot pass | |
| Sweden | 2500 | Vertical slot pass | |
| Sweden | 300 | Vertical slot pass | |
| Sweden | Vertical slot pass | ||
| Germany | Run-of-the-River | 13,000 | Roughened bypass channel with pool structures |
| Germany | Run-of-the-River | 135 | Vertical slot pass |
| Germany | Run-of-the-River | 34 | Roughened bypass channel with pool structures |
| Germany | Run-of-the-River | 1800 | Combined vertical slot and roughened bypass channel |
| Germany | Run-of-the-River | 1300 | Combined vertical slot and roughened bypass channel |
| Germany | Run-of-the-River | 6000 | Vertical slot pass |
| Germany | Run-of-the-River | 20,000 | Vertical slot pass |
| Germany | Run-of-the-River | 5000 | Roughened bypass channel with pool structures |
| Germany | Roughened bypass channel with pool structures | ||
| Germany | Run-of-the-River | 34 | Combined screen/rack and bypass |
| Germany | Run-of-the-River | 34 | Vertical slot pass |
| Germany | Run-of-the-River | 30 | Roughened ramp with pool structures |
| Germany | Run-of-the-River | 30 | Combined screen/rack and bypass |
| Germany | Run-of-the-River | 20 | Roughened bypass channel with pool structures |
| Germany | Run-of-the-River | 20 | Combined screen/rack and bypass |
| Germany | Run-of-the-River | 5 | Roughened ramp with pool structures |
| Germany | Run-of-the-River | 5 | Combined screen/rack and bypass |
| Germany | Run-of-the-River | 8 | Vertical slot pass |
| Germany | Run-of-the-River | 8 | Combined screen/rack and bypass |
| Germany | Run-of-the-River | 4 | Roughened ramp with pool structures |
| Germany | Run-of-the-River | 4 | Combined screen/rack and bypass |
| Germany | Run-of-the-River | 90 | Vertical slot pass |
| Germany | Run-of-the-River | 90 | Combined screen/rack and bypass |
| Germany | Run-of-the-River | 7 | Roughened bypass channel with pool structures |
| Germany | Run-of-the-River | 7 | Combined screen/rack and bypass |
| Germany | Run-of-the-River | 30 | Roughened bypass channel with pool structures |
| Germany | Run-of-the-River | 30 | Combined screen/rack and bypass |
| Germany | Run-of-the-River | 135 | Combined screen/rack and bypass |
| Germany | Run-of-the-River | 60 | Vertical slot pass |
| Germany | Run-of-the-River | 69 | Roughened ramp with pool structures |
| Germany | Run-of-the-River | 69 | Combined screen/rack and bypass |
| Germany | Run-of-the-River | 69 | Vertical slot pass |
| Germany | Run-of-the-River | 10 | Roughened ramp with pool structures |
| Germany | Run-of-the-River | 10 | Combined screen/rack and bypass |
| Germany | Run-of-the-River | 46 | Vertical slot pass |
| Germany | Run-of-the-River | 46 | Combined screen/rack and bypass |
| Germany | Run-of-the-River | 41 | Vertical slot pass |
| Germany | Run-of-the-River | 41 | Combined screen/rack and bypass |
| Germany | Run-of-the-River | 560 | Vertical slot pass |
| Germany | Run-of-the-River | 560 | Screen/rack |
| Germany | Run-of-the-River | 560 | Vertical slot pass |
| Germany | Run-of-the-River | 560 | Combined screen/rack and bypass |
| Germany | Run-of-the-River | 800 | Vertical slot pass |
| Germany | Run-of-the-River | 800 | Combined screen/rack and bypass |
| Germany | Run-of-the-River | 600 | Vertical slot pass |
| Germany | Run-of-the-River | 600 | Combined screen/rack and bypass |
| Germany | Run-of-the-River | 540 | Vertical slot pass |
| Germany | Run-of-the-River | 496 | Vertical slot pass |
| Germany | Run-of-the-River | 496 | Combined screen/rack and bypass |
| Germany | Run-of-the-River | 554 | Vertical slot pass |
| Germany | Run-of-the-River | 554 | Combined screen/rack and bypass |
| Germany | Run-of-the-River | 1300 | Vertical slot pass |
| Germany | Run-of-the-River | 1300 | Combined screen/rack and bypass |
| Germany | Run-of-the-River | 60 | Combined screen/rack and bypass |
| Germany | Run-of-the-River | 80 | Vertical slot pass |
| Germany | Run-of-the-River | 300 | Vertical slot pass |
| Germany | Run-of-the-River | 300 | Combined screen/rack and bypass |
| Germany | Run-of-the-River | 300 | Combined screen/rack and bypass |
| Germany | Run-of-the-River | 300 | Combined screen/rack and bypass |
| Germany | Run-of-the-River | 300 | Combined screen/rack and bypass |
| Germany | Roughened bypass channel with pool structures | ||
| Germany | Run-of-the-River | 512 | Vertical slot pass |
| Germany | Run-of-the-River | 512 | Combined screen/rack and bypass |
| Germany | Run-of-the-River | 960 | Vertical slot pass |
| Germany | Run-of-the-River | 960 | Screen/rack |
| Germany | Run-of-the-River | 960 | Combined screen/rack and bypass |
| Germany | Run-of-the-River | 280 | Vertical slot pass |
| Germany | Run-of-the-River | 280 | Combined screen/rack and bypass |
| Germany | Run-of-the-River | 290 | Roughened bypass channel with pool structures |
| Germany | Run-of-the-River | 290 | Combined screen/rack and bypass |
| Germany | Run-of-the-River | 270 | Vertical slot pass |
| Germany | Run-of-the-River | 150 | Combined screen/rack and bypass |
| Germany | Run-of-the-River | 190 | Vertical slot pass |
| Germany | Run-of-the-River | 190 | Vertical slot pass |
| Germany | Run-of-the-River | 190 | Combined screen/rack and bypass |
| Germany | Run-of-the-River | 190 | Roughened bypass channel with pool structures |
| Germany | Run-of-the-River | 190 | Bypass system |
| Germany | Run-of-the-River | 30 | Vertical slot pass |
| Germany | Run-of-the-River | 29 | Vertical slot pass |
| Germany | Run-of-the-River | 80 | Combined screen/rack and bypass |
| Germany | Run-of-the-River | 55 | Vertical slot pass |
| Germany | Run-of-the-River | 55 | Bypass system |
| Germany | Run-of-the-River | 40 | Vertical slot pass |
| Germany | Run-of-the-River | 40 | Bypass system |
| Germany | Run-of-the-River | 33 | Vertical slot pass |
| Germany | Run-of-the-River | 33 | Bypass system |
| Germany | Run-of-the-River | 33 | Roughened bypass channel with pool structures |
| Germany | Run-of-the-River | 33 | Bypass system |
| Germany | Run-of-the-River | 50 | Combined screen/rack and bypass |
| Germany | Run-of-the-River | 21 | Vertical slot pass |
| Germany | Run-of-the-River | 11 | Roughened bypass channel with pool structures |
| Germany | Run-of-the-River | 11 | Bypass system |
| Germany | Run-of-the-River | 18 | Roughened bypass channel with pool structures |
| Germany | Run-of-the-River | 15 | Vertical slot pass |
| Germany | Run-of-the-River | 15 | Screen/rack |
| Germany | Run-of-the-River | 681 | Roughened bypass channel with pool structures |
| Germany | Run-of-the-River | 681 | Combined screen/rack and bypass |
| Germany | Run-of-the-River | 681 | Vertical slot pass |
| Germany | Run-of-the-River | 681 | Combined screen/rack and bypass |
| Germany | Run-of-the-River | 480 | Vertical slot pass |
| Germany | Run-of-the-River | 480 | Combined screen/rack and bypass |
| Germany | Run-of-the-River | 480 | Vertical slot pass |
| Germany | Run-of-the-River | 22 | Roughened ramp with pool structures |
| Germany | Run-of-the-River | 520 | Roughened bypass channel with pool structures |
| Germany | Run-of-the-River | 520 | Combined screen/rack and bypass |
| Germany | Run-of-the-River | 520 | Combined screen/rack and bypass |
| Germany | Run-of-the-River | 520 | Combined screen/rack and bypass |
| Germany | Run-of-the-River | 520 | Combined screen/rack and bypass |
| Germany | Run-of-the-River | 315 | Vertical slot pass |
| Germany | Run-of-the-River | 315 | Combined screen/rack and bypass |
| Germany | Run-of-the-River | 315 | Vertical slot pass |
| Germany | Run-of-the-River | 315 | Combined screen/rack and bypass |
| Germany | Run-of-the-River | 400 | Roughened bypass channel with pool structures |
| Germany | Run-of-the-River | 400 | Combined screen/rack and bypass |
| Germany | Run-of-the-River | 400 | Vertical slot pass |
| Germany | Run-of-the-River | 400 | Roughened bypass channel with pool structures |
| Germany | Run-of-the-River | 230 | Vertical slot pass |
| Germany | Run-of-the-River | 230 | Combined screen/rack and bypass |
| Germany | Run-of-the-River | 250 | Vertical slot pass |
| Germany | Run-of-the-River | 250 | Combined screen/rack and bypass |
| Germany | Run-of-the-River | 250 | Vertical slot pass |
| Germany | Run-of-the-River | 250 | Vertical slot pass |
| Germany | Run-of-the-River | 250 | Vertical slot pass |
| Germany | Run-of-the-River | 11 | Vertical slot pass |
| Germany | Run-of-the-River | 11 | Combined screen/rack and bypass |
| Germany | Run-of-the-River | 13 | Roughened bypass channel with pool structures |
| Germany | Run-of-the-River | 13 | Combined screen/rack and bypass |
| Germany | Run-of-the-River | 13 | Vertical slot pass |
| Germany | Run-of-the-River | 13 | Vertical slot pass |
| Germany | Run-of-the-River | 9 | Vertical slot pass |
| Germany | Run-of-the-River | 18 | Vertical slot pass |
| Germany | Run-of-the-River | 18 | Combined screen/rack and bypass |
| Germany | Run-of-the-River | 18 | Vertical slot pass |
| Germany | Run-of-the-River | 18 | Vertical slot pass |
| Germany | Run-of-the-River | 11 | Vertical slot pass |
| Germany | Run-of-the-River | 11 | Combined screen/rack and bypass |
| Germany | Run-of-the-River | 35 | Roughened bypass channel with pool structures |
| Germany | Run-of-the-River | 21 | Roughened bypass channel with pool structures |
| Germany | Run-of-the-River | 21 | Combined screen/rack and bypass |
| Germany | Run-of-the-River | 35 | Roughened bypass channel with pool structures |
| Germany | Run-of-the-River | 35 | Combined screen/rack and bypass |
| Germany | Run-of-the-River | 20 | Vertical slot pass |
| Germany | Run-of-the-River | Combined screen/rack and bypass | |
| Germany | Run-of-the-River | 19 | Roughened bypass channel with pool structures |
| Germany | Run-of-the-River | 19 | Combined screen/rack and bypass |
| Germany | Run-of-the-River | 35 | Combined screen/rack and bypass |
| Germany | Run-of-the-River | 40 | Roughened bypass channel with pool structures |
| Germany | Run-of-the-River | 40 | Combined screen/rack and bypass |
| Germany | Run-of-the-River | 110 | Vertical slot pass |
| Germany | Run-of-the-River | 110 | Combined screen/rack and bypass |
| Germany | Run-of-the-River | 100 | Vertical slot pass |
| Germany | Run-of-the-River | 100 | Combined screen/rack and bypass |
| France | Run-of-the-River | 380 | Vertical slot pass |
| France | Run-of-the-River | 4381 | Combined screen/rack and bypass |
| France | Run-of-the-River | 2610 | Screen/rack |
| France | Run-of-the-River | 400 | Roughened bypass channel with pool structures |
| France | Run-of-the-River | 400 | Vertical slot pass |
| France | Reservoir | 1800 | Denil fish pass |
| France | Reservoir | 1800 | Combined screen/rack and bypass |
| France | Run-of-the-River | 380 | Combined screen/rack and bypass |
| France | Run-of-the-River | 1700 | Vertical slot pass |
| France | Run-of-the-River | 1700 | Screen/rack |
| France | Run-of-the-River | 320 | Screen/rack |
| France | Run-of-the-River | 900 | Vertical slot pass |
| France | Run-of-the-River | 1600 | Vertical slot pass |
| France | Run-of-the-River | 1600 | Vertical slot pass |
| Switzerland | Run-of-the-River | 4000 | Combined vertical slot and roughened bypass channel |
| Switzerland | Run-of-the-River | 4000 | Screen/rack |
| Austria | Vertical slot pass | ||
| Austria | Combined vertical slot and roughened bypass channel | ||
| Austria | Run-of-the-River | 880 | Vertical slot pass |
| Austria | Run-of-the-River | 2360 | Combined vertical slot and roughened bypass channel |
| Austria | Run-of-the-River | 43,200 | Vertical slot pass |
| Austria | 24,800 | Combined vertical slot and roughened bypass channel | |
| Austria | 2900 | Combined vertical slot and roughened bypass channel | |
| Austria | 900 | Combined vertical slot and roughened bypass channel | |
| Austria | Run-of-the-River | 179,000 | Roughened bypass channel with pool structures |
| Austria | Run-of-the-River | 179,000 | Vertical slot pass |
| Austria | Run-of-the-River | 168,000 | Vertical slot pass |
| Austria | Vertical slot pass | ||
| Austria | 3000 | Vertical slot pass | |
| Austria | Vertical slot pass | ||
| Austria | Vertical slot pass | ||
| Austria | Run-of-the-River | 73,000 | Roughened bypass channel with pool structures |
| Austria | Run-of-the-River | 187,000 | Roughened bypass channel with pool structures |
| Austria | Run-of-the-River | 187,000 | Roughened bypass channel with pool structures |
| Austria | Roughened bypass channel with pool structures | ||
| Austria | Vertical slot pass | ||
| Austria | Run-of-the-River | 328,000 | Vertical slot pass |
| Austria | Run-of-the-River | 293,000 | Roughened bypass channel with pool structures |
| Austria | Fish lift | ||
| Austria | Vertical slot pass | ||
| Austria | Run-of-the-River | 172,000 | Vertical slot pass |
| Austria | Vertical slot pass | ||
| Austria | Vertical slot pass | ||
| Austria | Run-of-the-River | 41,000 | Guiding dam or wall |
| Austria | Run-of-the-River | 41,000 | Vertical slot pass |
| Austria | Vertical slot pass | ||
| Austria | Roughened bypass channel with pool structures | ||
| Austria | Run-of-the-River | 25,000 | Vertical slot pass |
| Austria | Run-of-the-River | 25,000 | Vertical slot pass |
| Austria | Combined vertical slot and roughened bypass channel | ||
| Austria | Vertical slot pass | ||
| Austria | Run-of-the-River | 80,000 | Vertical slot pass |
| Austria | Vertical slot pass | ||
| Austria | Vertical slot pass | ||
| Austria | Vertical slot pass | ||
| Austria | 198,000 | Vertical slot pass | |
| Austria | Run-of-the-River | 79,000 | Vertical slot pass |
| Austria | Run-of-the-River | 28,000 | Vertical slot pass |
| Austria | Run-of-the-River | 22,000 | Vertical slot pass |
| Austria | Run-of-the-River | 10,000 | Vertical slot pass |
| Austria | Roughened bypass channel with pool structures | ||
| Austria | Vertical slot pass | ||
| Austria | Vertical slot pass | ||
| Austria | Vertical slot pass | ||
| Austria | Vertical slot pass | ||
| Austria | Vertical slot pass | ||
| Austria | Vertical slot pass | ||
| Austria | Vertical slot pass | ||
| Austria | Vertical slot pass | ||
| Austria | Vertical slot pass | ||
| Austria | Vertical slot pass | ||
| Austria | Vertical slot pass | ||
| Austria | Vertical slot pass | ||
| Austria | Vertical slot pass | ||
| Austria | Vertical slot pass | ||
| Austria | Vertical slot pass | ||
| Austria | Vertical slot pass | ||
| Austria | Vertical slot pass | ||
| Austria | Run-of-the-River | 14,000 | Vertical slot pass |
| Austria | Combined vertical slot and roughened bypass channel | ||
| Austria | Run-of-the-River | 12,000 | Vertical slot pass |
| Austria | Run-of-the-River | 18,000 | Combined vertical slot and roughened bypass channel |
| Austria | Run-of-the-River | 19,000 | Combined vertical slot and roughened bypass channel |
| Austria | Fish lift | ||
| Austria | Run-of-the-River | 19,000 | Combined vertical slot and roughened bypass channel |
| Austria | Run-of-the-River | 16,000 | Vertical slot pass |
| Austria | Run-of-the-River | 15,000 | Vertical slot pass |
| Austria | Run-of-the-River | 15,000 | Combined vertical slot and roughened bypass channel |
| Austria | Run-of-the-River | 13,000 | Vertical slot pass |
| Austria | Run-of-the-River | 13,000 | Vertical slot pass |
| Austria | Run-of-the-River | 390 | Vertical slot pass |
| Austria | Vertical slot pass | ||
| Austria | Combined vertical slot and roughened bypass channel | ||
| Austria | Run-of-the-River | 13,000 | Vertical slot pass |
| Austria | Run-of-the-River | 17,000 | Combined vertical slot and roughened bypass channel |
| Austria | Run-of-the-River | 6400 | Vertical slot pass |
| Austria | Run-of-the-River | 1600 | Vertical slot pass |
| Austria | Run-of-the-River | 17,000 | Combined vertical slot and roughened bypass channel |
| Austria | Run-of-the-River | 17,000 | Vertical slot pass |
| Austria | Run-of-the-River | 16,000 | Vertical slot pass |
| Austria | Vertical slot pass | ||
| Austria | Run-of-the-River | 18,000 | Roughened bypass channel with pool structures |
| Austria | Combined vertical slot and roughened bypass channel | ||
| Austria | Run-of-the-River | 16,000 | Combined vertical slot and roughened bypass channel |
| Austria | Run-of-the-River | 8600 | Combined vertical slot and roughened bypass channel |
| Austria | Run-of-the-River | 11,700 | Vertical slot pass |
| Austria | Run-of-the-River | 2600 | Vertical slot pass |
| Austria | Run-of-the-River | 500 | Vertical slot pass |
| Austria | Combined vertical slot and roughened bypass channel | ||
| Austria | Run-of-the-River | 12,200 | Fish lift |
| Austria | Run-of-the-River | 3600 | Combined vertical slot and roughened bypass channel |
| Austria | Vertical slot pass | ||
| Austria | Vertical slot pass | ||
| Austria | Vertical slot pass | ||
| Austria | Vertical slot pass | ||
| Austria | Run-of-the-River | 45,800 | Vertical slot pass |
| Austria | Run-of-the-River | 2000 | Combined vertical slot and roughened bypass channel |
Table A2.
Confidence intervals (95%) for the three upstream models presented in Table 3.
Table A2.
Confidence intervals (95%) for the three upstream models presented in Table 3.
| Loge of Capital Costs | ||||||
|---|---|---|---|---|---|---|
| Model 1: Type of Upstream Measure | Model 2: Implemented vs. Planned Costs | Model 3: Nature-Like vs. Technical vs. Combined Passes | ||||
| 95% C.I. | 95% C.I. | 95% C.I. | ||||
| Fixed Effects | ||||||
| Intercept | 8.02 | 9.95 | 9.05 | 10.32 | 8.84 | 10.62 |
| Log of length (m) | 0.39 | 0.70 | 0.38 | 0.68 | 0.11 | 0.43 |
| Log of obstacle height (m) | 0.26 | 0.78 | 0.29 | 0.80 | 0.50 | 1.05 |
| Log of plant capacity (kW) | 0.03 | 0.18 | 0.03 | 0.17 | 0.04 | 0.19 |
| Implemented (binary) | −1.31 | −0.54 | ||||
| Nature-like (binary) | −2.59 | −0.69 | ||||
| Combined (binary) | 0.81 | 6.94 | ||||
| Nature-like *log of height | −0.85 | 0.29 | ||||
| Nature-like *log of length | 0.06 | 0.64 | ||||
| Combined *log of height | −1.74 | 0.08 | ||||
| Combined *log of length | −0.78 | 0.16 | ||||
| Fish lift | 1.31 | 4.44 | 1.23 | 4.30 | ||
| Roughened bypass channel with pool structures | −1.02 | −0.04 | −0.92 | −0.01 | ||
| Roughened ramp with pool structures | −0.65 | 0.70 | −0.62 | 0.71 | ||
| Vertical slot pass | −0.58 | 0.32 | −0.52 | 0.33 | ||
| Sig01 | 0.17 | 1.40 | 0.00 | 0.22 | 0.15 | 1.26 |
| Sigma | 0.55 | 0.70 | 0.55 | 0.70 | 0.55 | 0.70 |
Note: * is a multiplication sign.
Table A3.
Confidence Intervals (95%) for the downstream model presented in Table 4.
Table A3.
Confidence Intervals (95%) for the downstream model presented in Table 4.
| Variable | 95% Confidence Interval | |
|---|---|---|
| Intercept | 8.04 | 9.19 |
| Log of Area (m2) | 1.02 | 1.35 |
| Vertical configuration (binary) | −0.49 | 0.31 |
References
- Anderson, D.; Moggridge, H.; Warren, P.; Shucksmith, J. The impacts of ‘run-of-river’ hydropower on the physical and ecological condition of rivers. Water Environ. J. 2015, 29, 268–276. [Google Scholar] [CrossRef] [Green Version]
- Beck, C.; Albayrak, I.; Boes, R.M. Improved hydraulic performance of fish guidance structures with innovative bar design. In Proceedings of the 12th International symposium on ecohydraulics (ISE 2018), Tokyo, Japan, 19–24 August 2018. [Google Scholar]
- Person, E.; Bieri, M.; Peter, A.; Schleiss, A.J. Mitigation measures for fish habitat improvement in Alpine rivers affected by hydropower operations. Ecohydrology 2014, 7, 580–599. [Google Scholar] [CrossRef]
- Renöfält, B.; Jansson, R.; Nilsson, C. Effects of hydropower generation and opportunities for environmental flow management in Swedish riverine ecosystems. Freshw. Biol. 2010, 55, 49–67. [Google Scholar] [CrossRef]
- Schramm, M.P.; Bevelhimer, M.S.; DeRolph, C.R. A synthesis of environmental and recreational mitigation requirements at hydropower projects in the United States. Environ. Sci. Policy 2016, 61, 87–96. [Google Scholar] [CrossRef] [Green Version]
- Silva, A.T.; Lucas, M.C.; Castro-Santos, T.; Katopodis, C.; Baumgartner, L.J.; Thiem, J.D.; Aarestrup, K.; Pompeu, P.S.; O’Brien, G.C.; Braun, D.C.; et al. The future of fish passage science, engineering, and practice. Fish Fish. 2018, 19, 340–362. [Google Scholar] [CrossRef] [Green Version]
- Trussart, S.; Messier, D.; Roquet, V.; Aki, S. Hydropower projects: A review of most effective mitigation measures. Energy Policy 2002, 30, 1251–1259. [Google Scholar] [CrossRef]
- Nieminen, E.; Hyytiäinen, K.; Lindroos, M. Economic and policy considerations regarding hydropower and migratory fish. Fish Fish. 2017, 18, 54–78. [Google Scholar] [CrossRef] [Green Version]
- Couto, T.B.; Olden, J.D. Global proliferation of small hydropower plants - science and policy. Front. Ecol. Environ. 2018, 16, 91–100. [Google Scholar] [CrossRef]
- European Commission. Directive 2009/28/EC of the European Parliament and of the Council of 23 April 2009 on the Promotion of the Use of Energy from Renewable Sources and Amending and Subsequently Repealing Directives 2001/77/EC and 2003/30/EC; (Text with EEA Relevance); European Parliament: Brussels, Belgium, 2009.
- Rudberg, P.; Escobar, M.; Gantenbein, J.; Niiro, N. Mitigating the Adverse Effects of Hydropower Projects: A Comparative Review of River Restoration and Hydropower Regulation in Sweden and the United States. Georg. Int. Environ. Law Rev. 2015, 27, 251–274. [Google Scholar]
- Kampa, E.; Tarpey, J.; Rouillard, J.; Haakon Bakken, T.; Stein, U.; Godinho, F.; Nunes Eira, A.; Portela, L.; Manuela, M.; Courret, D.; et al. Review of policy requirements and financing instruments. Deliverable 5.1 of the FIThydro project funded under the European Union’s Horizon. 2017; 1–188. [Google Scholar]
- Wüstenhagen, R.; Bilharz, M. Green energy market development in Germany: Effective public policy and emerging customer demand. Energy Policy 2006, 34, 1681–1696. [Google Scholar] [CrossRef] [Green Version]
- Manzano-Agugliaro, F.; Taher, M.; Zapata-Sierra, A.; Juaidi, A.; Montoya, F.G. An overview of research and energy evolution for small hydropower in Europe. Renew. Sustain. Energy Rev. 2017, 75, 476–489. [Google Scholar] [CrossRef]
- Erlewein, A. Disappearing rivers—The limits of environmental assessment for hydropower in India. Environ. Impact Assess. Rev. 2013, 43, 135–143. [Google Scholar] [CrossRef]
- Uria-Martinez, R.; Johnson, M.; O’Connor, P.; Samu, N.M.; Witt, A.M.; Battey, H.; Wagoner, S. 2017 Hydropower Market Report; U.S. Department of Energy: Oak Ridge, TN, USA, 2018.
- Bilotta, G.S.; Burnside, N.G.; Gray, J.C.; Orr, H.G. The Effects of Run-of-River Hydroelectric Power Schemes on Fish Community Composition in Temperate Streams and Rivers. PLoS ONE 2016, 11, e0154271. [Google Scholar] [CrossRef] [Green Version]
- Venus, T.E.; Hinzmann, M.; Bakken, T.H.; Gerdes, H.; Godinho, F.N.; Hansen, B.; Pinheiro, A.; Sauer, J. The public’s perception of run-of-the-river hydropower across Europe. Energy Policy 2020, 140, 111422. [Google Scholar] [CrossRef]
- Sovacool, B.K.; Gilbert, A.; Nugent, D. An international comparative assessment of construction cost overruns for electricity infrastructure. Energy Res. Soc. Sci. 2014, 3, 152–160. [Google Scholar] [CrossRef]
- Sudduth, E.B.; Meyer, J.L.; Bernhardt, E.S. Stream restoration practices in the southeastern United States. Restor. Ecol. 2007, 15, 573–583. [Google Scholar] [CrossRef]
- Cai, X.; Zhang, X.; Wang, D. Land Availability for Biofuel Production. Environ. Sci. Technol. 2011, 45, 334–339. [Google Scholar] [CrossRef]
- Pérez-Díaz, J.I.; Wilhelmi, J.R. Assessment of the economic impact of environmental constraints on short-term hydropower plant operation. Energy Policy 2010, 38, 7960–7970. [Google Scholar] [CrossRef]
- Olivares, M.A. Optimal Hydropower Reservoir Operation with Environmental Requirements. Ph.D. Thesis, University of California, Oakland, CA, USA, 2008. [Google Scholar]
- Hirth, L. The benefits of flexibility: The value of wind energy with hydropower. Appl. Energy 2016, 181, 210–223. [Google Scholar] [CrossRef]
- DWA Deutsche Vereinigung für Wasserwirtschaft, A. und A. e. V. Fischaufstiegsanlagen und fischpassierbare Bauwerke—Gestaltung, Bemessung, Qualitätssicherung. Merkblatt DWA 509; Hennef, Germany, 2014; ISBN 978-3-942964-91-3. Available online: https://webshop.dwa.de/de/merkblatt-dwa-m-509-mai-2014.html (accessed on 1 October 2019).
- Clay, C.H. Design of Fishways and Other Fish Facilities; CRC Press: Boca Raton, FL, USA, 1995. [Google Scholar]
- Birnie-Gauvin, K.; Franklin, P.; Wilkes, M.; Aarestrup, K. Moving beyond fitting fish into equations: Progressing the fish passage debate in the Anthropocene. Aquat. Conserv. Mar. Freshw. Ecosyst. 2019, 29, 1095–1105. [Google Scholar] [CrossRef]
- FAO/DVWK. Fish Passes: Design, Dimensions and Monitoring; Food & Agriculture Organization of the UN: Rome, Italy, 2002; ISBN 3-89554-027-7. [Google Scholar]
- Linnansaari, T.; Wallace, B.; Curry, R.A.; Yamazaki, G. Fish Passage in Large Rivers: A Literature Review. 2015. Available online: https://unbscholar.lib.unb.ca/islandora/object/unbscholar%3A7995 (accessed on 1 October 2019).
- Larinier, M.; Travade, F. Downstream Migration: Problems and Facilities. Bull. Français la Pêche la Piscic. 2002, 364, 181–207. [Google Scholar] [CrossRef] [Green Version]
- Katopodis, C.; Williams, J.G. The development of fish passage research in a historical context. Ecol. Eng. 2012, 48, 8–18. [Google Scholar] [CrossRef]
- Lundström, T.S.; Hellström, J.G.I.; Lindmark, E.M. Flow design of guiding device for downstream fish migration. River Res. Appl. 2010, 26, 166–1821. [Google Scholar] [CrossRef]
- Boys, C.A.; Pflugrath, B.D.; Mueller, M.; Pander, J.; Deng, Z.D.; Geist, J. Physical and hydraulic forces experienced by fish passing through three different low-head hydropower turbines. Mar. Freshw. Res. 2018, 69, 1934. [Google Scholar] [CrossRef]
- Mueller, M.; Pander, J.; Geist, J. Evaluation of external fish injury caused by hydropower plants based on a novel field-based protocol. Fish. Manag. Ecol. 2017, 24, 240–255. [Google Scholar] [CrossRef] [Green Version]
- Williams, J.G.; Armstrong, G.; Katopodis, C.; Larinier, M.; Travade, F. Thinking like a fish: A key ingredient for development of effective fish passage facilities at river obstructions. River Res. Appl. 2012, 28, 407–417. [Google Scholar] [CrossRef] [Green Version]
- Enders, E.C.; Gessel, M.H.; Williams, J.G. Development of successful fish passage structures for downstream migrants requires knowledge of their behavioural response to accelerating flow. Can. J. Fish. Aquat. Sci. 2009, 66, 2109–2117. [Google Scholar] [CrossRef]
- Dewitte, M. A List of Solutions, Models, Tools and Devices, Their Application Range on a Regional and Overall Level, the Identified Knowledge Gaps and the Recommendations to Fill These. Fishfriendly Innovative Technologies for Hydropower. 2018. Available online: https://www.fithydro.eu/wp-content/uploads/2019/08/Deliverable_2.1._executive-summary.pdf (accessed on 1 October 2019).
- Fjeldstad, H.-P.; Pulg, U.; Forseth, T. Safe two-way migration for salmonids and eel past hydropower structures in Europe: A review and recommendations for best-practice solutions. Mar. Freshw. Res. 2018, 69, 1834. [Google Scholar] [CrossRef] [Green Version]
- Bauerfeind, C.; Ischer, S.K.; Keuneke, R.; Dumont, U. Modellhafte Erarbeitung einer Gesamtbewertung für die Herstellung der Durchgängigkeit der für Thüringen ausgewiesenen „Schwerpunktgewässer Durchgängigkeit“ am Beispiel der Ilm; Thüringer Landesanstalt für Umwelt und Geologie: Jena, Germany, 2011. [Google Scholar]
- Schmalz, W. Gesamtkonzept zur Herstellung der Durchgänigkeit der Saale; Thüringer Landesanstalt für Umwelt und Geologie: Jena, Germany, 2015. [Google Scholar]
- Anderer, P.; Bauerfeind, C.; Krischer, S.; Dumont, U. Gesamtkonzept zur Herstellung der Durchgängigkeit der Unstrut; Thüringer Landesanstalt für Umwelt und Geologie: Jena, Germany, 2013. [Google Scholar]
- Schmalz, M.; Sauerwein, J. Gesamtkonzept zur Herstellung der Durchgängigkeit der Werra; Thüringer Landesanstalt für Umwelt und Geologie: Jena, Germany, 2015. [Google Scholar]
- Reuter, M.; Schmalz, M. Gesamtkonzept zur Herstellung der Durchgängigkeit von Gera, Apfelstädt und Ohra; Thüringer Landesanstalt für Umwelt und Geologie: Jena, Germany, 2017. [Google Scholar]
- Oesterreichs Energie Der Nationale Gewässerbewirtschaftungsplan 2009: Umgesetzte Maßnahmen der österreichischen Wasserkraft. Available online: https://oesterreichsenergie.at/der-nationale-gewaesserbewirtschaftungsplan-2009-umgesetzte-massnahmen-der-oesterreichischen-wasserkraft.html (accessed on 1 October 2019).
- Turner, H.C.; Lauer, J.A.; Tran, B.X.; Teerawattananon, Y.; Jit, M. Adjusting for Inflation and Currency Changes Within Health Economic Studies. Value Heal. 2019, 22, 1026–1032. [Google Scholar] [CrossRef] [Green Version]
- Aldersey-Williams, J.; Rubert, T. Levelised cost of energy—A theoretical justification and critical assessment. Energy Policy 2019, 124, 169–179. [Google Scholar] [CrossRef]
- Sartori, D.; Catalano, G.; Genco, M.; Pancotti, C.; Sirtori, E.; Vignetti, S.; Del Bo, C. Guide to Cost-Benefit Analysis of Investment Projects -Economic Appraisal Tool for Cohesion Policy 2014–2020; European Union: Luxembourg, 2014. [Google Scholar]
- Glachant, J.M.; Saguan, M.; Rious, V.; Douguet, S. Regimes for Granting the Right to Use Hydropower in Europe; European University Institute: Fiesole, Italy, 2015. [Google Scholar]
- Larinier, M.; Marmulla, G. Fish passes: Types, principles and geographical distribution-an overview. In Proceedings of the Second International Symposium on the Management of Large Rivers for Fisheries, Phnom Penh, Cambodia, 11–14 February 2003; RAP Publication: Bangkok, Thailand, 2004; pp. 183–206. [Google Scholar]
- Romão, F.; Santos, J.; Katopodis, C.; Pinheiro, A.; Branco, P. How Does Season Affect Passage Performance and Fatigue of Potamodromous Cyprinids? An Experimental Approach in a Vertical Slot Fishway. Water 2018, 10, 395. [Google Scholar] [CrossRef] [Green Version]
- BAW/BfG Guideline Upstream Fishways on German Federal Waterways (AH FAA). Version 2. 2015. Available online: https://izw.baw.de/publikationen/merkblaetter/1/Guideline_Upstream_Fishways_Version2.pdf (accessed on 1 April 2020). [CrossRef]
- Katopodis, C.; Kells, J.A.; Acharya, M. Nature-Like and Conventional Fishways: Alternative Concepts? Can. Water Resour. J. 2001, 26, 211–232. [Google Scholar] [CrossRef] [Green Version]
- Roscoe, D.W.; Hinch, S.G. Effectiveness monitoring of fish passage facilities: Historical trends, geographic patterns and future directions. Fish Fish. 2010, 11, 12–33. [Google Scholar] [CrossRef]
- Szałkiewicz, E.; Jusik, S.; Grygoruk, M. Status of and Perspectives on River Restoration in Europe: 310,000 Euros per Hectare of Restored River. Sustainability 2018, 10, 129. [Google Scholar] [CrossRef] [Green Version]
- Pander, J.; Geist, J. Ecological indicators for stream restoration success. Ecol. Indic. 2013, 30, 106–118. [Google Scholar] [CrossRef]
- Geist, J.; Hawkins, S.J. Habitat recovery and restoration in aquatic ecosystems: Current progress and future challenges. Aquat. Conserv. Mar. Freshw. Ecosyst. 2016, 26, 942–962. [Google Scholar] [CrossRef]
- Köhler, B.; Ruud, A. How Are Environmental Measures Realized in European Hydropower? A Case-Study of Austria, Sweden and Switzerland; HydroCen Report 6; Norwegian Research Centre for Hydropower Technology: Trondheim, Norway, 2019. [Google Scholar]
- Ruud, A.; Lindström, A. Hydropower and Water Management in Austria. What Is the Current Status of Implementing the EU Water Framework Directive? NINA Prosjektnotat 65; Norwegian Institute for Nature Research: Oslo, Norway, 2018.
Figure 1.
Capital costs of upstream and downstream fish passage measures from Austria, Germany, France, Sweden, and Switzerland in Euros. Note: The box shows the interquartile range (25%, 50%, 75%). The solid line in the box represents the median while the dotted line represents the mean. The points represent outliers (defined as >1.5 times and <3 times the interquartile range on either side of the box). In cases with fewer than five observations, only points are used.

Figure 2.
Planned (Germany) vs. implemented (Austria) unit costs for upstream fish passage measures (n = 144) based on per meter length (A) and per meter height of the obstacle (B).
Figure 2.
Planned (Germany) vs. implemented (Austria) unit costs for upstream fish passage measures (n = 144) based on per meter length (A) and per meter height of the obstacle (B).

Figure 3.
Cost per meter length for vertical slot passes (A, n = 150) and roughened bypass channels (B, n = 60) compared to costs per vertical meter of the obstacle for vertical slot passes (C, n = 150) and roughened bypass channels (D, n = 60).
Figure 3.
Cost per meter length for vertical slot passes (A, n = 150) and roughened bypass channels (B, n = 60) compared to costs per vertical meter of the obstacle for vertical slot passes (C, n = 150) and roughened bypass channels (D, n = 60).

Figure 4.
Comparison of the mean levelized cost of mitigation for different upstream fish passage measures from Austria, Germany, France, and Sweden with high (0.125 EUR/kWh) and low (0.055 EUR/kWh) electricity prices.
Figure 4.
Comparison of the mean levelized cost of mitigation for different upstream fish passage measures from Austria, Germany, France, and Sweden with high (0.125 EUR/kWh) and low (0.055 EUR/kWh) electricity prices.

Table 1.
Financial and economic costs associated with upstream and downstream fish passage measures.
Table 1.
Financial and economic costs associated with upstream and downstream fish passage measures.
| Category | Sub-Category | Types of Costs | Upstream | Downstream |
|---|---|---|---|---|
| Financial | Capital | Pre-construction | 2 | 2 |
| Construction | 2 | 2 | ||
| Operational | Management | 1 | 1 | |
| Monitoring | 2 | 2 | ||
| Maintenance | 2 | 1 | ||
| Other | Legal costs | 2 | 0 | |
| Compensation for land and habitat | 2 | 0 | ||
| Economic | Lost power production | 2 | 2 | |
| Lost system flexibility | 1 | 0 |
Note: 2 indicates obligatory associated costs; 1 indicates facultative associated cost, and 0 indicates no associated costs.
Table 2.
Overview of case studies by type of fish passage measure and country of origin.
| Measure | Austria | France | Germany | Sweden | Switzerland | Total |
|---|---|---|---|---|---|---|
| Upstream | ||||||
| Technical designs | ||||||
| Vertical slot pass | 68 | 6 | 55 | 21 | 150 | |
| Roughened ramp with pool structures | 6 | 6 | ||||
| Denil pass | 1 | 3 | 4 | |||
| Nature-like designs | ||||||
| Roughened bypass channel with pool structures | 9 | 1 | 23 | 27 | 60 | |
| Combined vertical slot and roughened bypass channel with pool structures | 20 | 2 | 1 | 1 | 24 | |
| Special designs | ||||||
| Fish lift | 3 | 3 | ||||
| Downstream | ||||||
| Combined screen/rack and bypass | 3 | 57 | 60 | |||
| Fish protection screen/rack | 3 | 3 | 2 | 1 | 9 | |
| Bypass | 6 | 6 | ||||
| Guiding wall/dam | 1 | 4 | 5 | |||
| Total | 327 | |||||
Table 3.
Regression estimates for the costs of upstream fish passage measures from Austria, Germany, France, and Sweden.
Table 3.
Regression estimates for the costs of upstream fish passage measures from Austria, Germany, France, and Sweden.
| Loge of Capital Costs | ||||||
|---|---|---|---|---|---|---|
| Model 1: Type of Upstream Measure | Model 2: Implemented vs. Planned Costs | Model 3: Nature-Like vs. Technical vs. Combined Passes | ||||
| Fixed Effects | Coeff. (S.E.) | t-value | Coeff. (S.E.) | t-value | Coeff. (S.E.) | t-value |
| Intercept | 9.01 (0.50) | 17.89 | 9.65 (0.37) | 26.06 | 9.76 (0.46) | 21.00 |
| Log of length (m) | 0.55 (0.08) | 6.72 | 0.54 (0.08) | 6.71 | 0.27 (0.08) | 3.32 |
| Log of obstacle height (m) | 0.53 (0.13) | 3.94 | 0.54 (0.13) | 4.06 | 0.78 (0.14) | 5.42 |
| Log of plant capacity (kW) | 0.11 (0.04) | 2.87 | 0.11 (0.04) | 2.90 | 0.12 (0.04) | 3.07 |
| Implemented (binary) | −0.97 (0.29) | −3.39 | ||||
| Nature-like (binary) | −1.64 (0.50) | −3.27 | ||||
| Combined (binary) | 3.95 (1.60) | 2.46 | ||||
| Nature-like *log of height | −0.28 (0.30) | −0.95 | ||||
| Nature-like *log of length | 0.35 (0.15) | 2.32 | ||||
| Combined *log of height | −0.85 (0.48) | −1.80 | ||||
| Combined *log of length | −0.31 (0.25) | −1.28 | ||||
| Fish lift | 2.89 (0.81) | 3.56 | 2.84 (0.81) | 3.51 | ||
| Roughened bypass channel | −0.55 (0.25) | −2.18 | −0.52 (0.25) | −2.11 | ||
| Roughened ramp | 0.01 (0.35) | 0.02 | 0.01 (0.35) | 0.04 | ||
| Vertical slot pass | −0.15 (0.23) | −0.66 | −0.14 (0.23) | −0.61 | ||
| Random Effects | Var. (S.D.) | Var. (S.D.) | Var. (S.D.) | |||
| Intercept | 0.33 (0.58) | 0.03 (0.16) | 0.27 (0.52) | |||
| Residual | 0.40 (0.63) | 0.40 (0.63) | 0.41 (0.64) | |||
| REML Criterion | 261.10 | 256.90 | 265.20 | |||
| n | 127 | 127 | 127 | |||
Note: S.E. denotes standard error, S.D. denotes standard deviation, Var. denotes variance, REML is restricted maximum likelihood. * is a multiplication sign.
Table 4.
Regression estimates for the costs of downstream fish passage measures from Germany.
| Variable | Coeff. (S.E.) | t-Value |
|---|---|---|
| Intercept | 8.62 (0.29) | 29.49 |
| Log of Area (m2) | 1.18 (0.09) | 13.80 |
| Vertical configuration (binary) | −0.09 (0.20) | −0.43 |
| Log-Likelihood | −11.10 | |
| Degrees of freedom | 14 | |
| Residual standard error | 0.41 | |
| n | 17 | |
Table 5.
Overview of the annual maintenance costs for upstream fish passage measures from Austria, Germany, France, and Sweden in Euros.
Table 5.
Overview of the annual maintenance costs for upstream fish passage measures from Austria, Germany, France, and Sweden in Euros.
| Category | n | Median | Mean | S.D. | Min. | Max. |
|---|---|---|---|---|---|---|
| Upstream | ||||||
| Vertical slot pass | 59 | 10,762 | 12,206 | 9143 | 0 | 50,220 |
| Combined vertical slot and bypass channel | 21 | 10,944 | 12,096 | 4815 | 6622 | 32,285 |
| Roughened bypass channel | 13 | 12,946 | 16,887 | 15,199 | 0 | 39,731 |
| Fish lift | 2 | 23,806 | 23,806 | 11,991 | 15,327 | 32,285 |
| Downstream | ||||||
| Guiding dam/wall | 2 | 16,581 | 16,581 | 23,449 | 0 | 33,162 |
| Total | 97 | 10,762 | 13,139 | 9835 | 0 | 50,220 |
Table 6.
Overview of monitoring costs related to different upstream fish passage measures from Austria, Germany, France, and Sweden in Euros.
Table 6.
Overview of monitoring costs related to different upstream fish passage measures from Austria, Germany, France, and Sweden in Euros.
| Measure | n | Median | Mean | S.D. | Min. | Max. |
|---|---|---|---|---|---|---|
| Vertical slot pass | 59 a | 22,958 | 92,918 | 214,389 | 0 | 1,456,388 |
| Combined vertical slot and bypass channel | 20 b | 62,498 | 71,262 | 46,562 | 10,762 | 168,956 |
| Roughened bypass channel | 7 | 161,584 | 443,503 | 571,168 | 23,303 | 1,279,866 |
| Fish lift | 3 | 185,206 | 160,456 | 128,550 | 21,331 | 274,831 |
| Total | 89 | 39,839 | 117,902 | 250,576 | 0 | 1,456,388 |
Note: a Includes 5 fish traps and 1 image-based scanner, b Includes 1 fish trap and 1 image-based scanner.
Table 7.
Overview of power losses related to different fish passage measures from Austria, Germany, France, and Sweden in GWh per year.
Table 7.
Overview of power losses related to different fish passage measures from Austria, Germany, France, and Sweden in GWh per year.
| Category | n | Median | Mean | S.D. | Min. | Max. |
|---|---|---|---|---|---|---|
| Upstream | ||||||
| Vertical slot pass | 74 | 149 | 859 | 2481 | 0 | 17,950 |
| Denil pass | 1 | 0.438 | ||||
| Combined vertical slot and bypass channel | 22 | 308 | 534 | 768 | 0 | 3400 |
| Roughened bypass channel | 12 | 613 | 2631 | 4163 | 0 | 14,000 |
| Fish lift | 3 | 1500 | 8098 | 12,309 | 495 | 22,300 |
| Downstream | ||||||
| Combined screen/rack and bypass system | 3 | 0 | 0.002 | 0.003 | 0 | 0.006 |
| Fish protection screen/rack | 3 | 0 | 0.083 | 0.144 | 0 | 0.25 |
| Total | 118 | 1112 | 199 | 3136 | 0 | 22,300 |
Publisher’s Note: MDPI stays neutral with regard to jurisdictional claims in published maps and institutional affiliations. |
© 2020 by the authors. Licensee MDPI, Basel, Switzerland. This article is an open access article distributed under the terms and conditions of the Creative Commons Attribution (CC BY) license (http://creativecommons.org/licenses/by/4.0/).
Share and Cite
MDPI and ACS Style
Venus, T.E.; Smialek, N.; Pander, J.; Harby, A.; Geist, J. Evaluating Cost Trade-Offs between Hydropower and Fish Passage Mitigation. Sustainability 2020, 12, 8520. https://doi.org/10.3390/su12208520
AMA Style
Venus TE, Smialek N, Pander J, Harby A, Geist J. Evaluating Cost Trade-Offs between Hydropower and Fish Passage Mitigation. Sustainability. 2020; 12(20):8520. https://doi.org/10.3390/su12208520
Chicago/Turabian StyleVenus, Terese E., Nicole Smialek, Joachim Pander, Atle Harby, and Juergen Geist. 2020. "Evaluating Cost Trade-Offs between Hydropower and Fish Passage Mitigation" Sustainability 12, no. 20: 8520. https://doi.org/10.3390/su12208520
Note that from the first issue of 2016, this journal uses article numbers instead of page numbers. See further details here.