Article

Evaluation of Thermal Comfort and Energy Consumption of Water Flow Glazing as a Radiant Heating and Cooling System: A Case Study of an Office Space

by
Belen Moreno Santamaria
1,
Fernando del Ama Gonzalo
2,*,
Benito Lauret Aguirregabiria
1 and
Juan A. Hernandez Ramos
3
1
Department of Construction and Architectural Technology, Technical School of Architecture of Madrid, Technical University of Madrid (UPM), 28040 Madrid, Spain
2
Department of Sustainable Product Design and Architecture, Keene State College, Keene, NH 03435, USA
3
Department of Applied Mathematics, School of Aeronautical and Space Engineering, Technical University of Madrid (UPM), 28040 Madrid, Spain
*
Author to whom correspondence should be addressed.
Sustainability 2020, 12(18), 7596; https://doi.org/10.3390/su12187596
Submission received: 19 July 2020 / Revised: 6 September 2020 / Accepted: 11 September 2020 / Published: 15 September 2020
(This article belongs to the Special Issue Sustainable Building and Indoor Air Quality)

Abstract

:
Large glass areas, even high-performance glazing with Low-E coating, could lead to discomfort if exposed to solar radiation due to radiant asymmetry. In addition, air-to-air cooling systems affect the thermal environment indoors. Water-Flow Glazing (WFG) is a disruptive technology that enables architects and engineers to design transparent and translucent facades with new features, such as energy management. Water modifies the thermal behavior of glass envelopes, the spectral distribution of solar radiation, the non-uniform nature of radiation absorption, and the diffusion of heat by conduction across the glass pane. The main goal of this article was to assess energy consumption and comfort conditions in office spaces with a large glass area by using WFG as a radiant heating and cooling system. This article evaluates the design and operation of an energy management system coupled with WFG throughout a year in an actual office space. Temperature, relative humidity, and solar radiation sensors were connected to a control unit that actuated the different devices to keep comfortable conditions with minimum energy consumption. The results in summer conditions revealed that if the mean radiant temperature ranged from 19.3 to 23 °C, it helped reduce the operative temperature to comfortable levels when the indoor air temperature was between 25 and 27.5 °C. The Predicted Mean Vote in summer conditions was between 0 and −0.5 in working hours, within the recommended values of ASHRAE-55 standard.

1. Introduction

Obsolete equipment, design flaws, and inappropriate use can account for up to 20% of the energy that buildings use over the operation period [1]. Dwellings, offices, educational facilities, and commercial buildings show different consumption patterns. For example, commercial buildings exhibit high energy consumption associated with heating, ventilation, and air conditioning (HVAC) systems and lighting [2]. Office buildings have a high amount of energy use by computers and monitors, while educational buildings have significantly more energy consumption for lighting [3]. Office buildings are likely to have higher cooling demands due to the impact of internal gains from occupants and IT equipment [4]. The European air conditioning (AC) market is essential in raising awareness about primary energy utilization. Over the last two decades, all members of the European Union (EU) have been committed to increasing the production of renewable energy, decreasing greenhouse gas (GHG) emissions, and reducing the final energy consumption by 20% from 1990 levels by 2020. The goal of reducing the emissions of GHG by 40% by 2030 has been set. Furthermore, the EU members have committed to reducing GHG emissions by 80–95% by 2050, and the fulfillment of the Paris Conference of the Parties 21 agreement will require a further reduction of GHG emissions [5]. In this regard, some studies show that electricity demand for cooling is increasing, especially in colder European countries [6]. If the electricity demand exceeds the projected renewable capacity, the goal of reducing GHG emissions will not be met.
An energy management system (EMS) assures that the building’s energy demand is accomplished without compromising the air quality and comfort levels of its occupants [7]. The EMS can collect measurements at a specified time interval at designated measurement points. The accurate and diverse data, deployment without affecting the building operation, communication protocol, and cost influence the selection of the EMS [8]. Engineers tend to overestimate the internal heat gains in office buildings, which results in the specification of cooling systems that exceed the needed capacity. As a result, there is an energy waste over long periods of inefficient operation [9,10]. The Energy Consumption Guide (ECG) shows patterns and benchmarks for electricity consumption in office buildings [11]. Energy consumption schedules, occupants’ habits, and the diversity of electric loads have a significant impact on office building energy behavior [12,13]. An energy management system allows owners to understand building performance, improve energy efficiency, and take appropriate actions [14,15].
Power load density is used to assess expected peak power demand, taking into account internal heat gains [16,17]. The building envelope materials contribute decisively to reducing the heating and cooling loads. Windows and curtain walls play a crucial role in the energy efficiency of office buildings due to solar heat gains. Although solar radiation may help reduce heating loads in the cold season, summer heat gains have to be avoided [18,19]. In this regard, the extensive use of glass in facades in office buildings has led to an 8.7% increase in the AC market in Europe over the last decade, especially in Mediterranean countries [20,21]. Despite the growth of the market, other factors like the increasing price of electricity in the European Union (17% from 2008 to 2019) [22] and new government regulations have forced manufactures to develop energy-efficient products, such as inverter technologies and new refrigerants [23]. The energy performance of heating and AC systems is measured by the energy efficiency ratio (EER) in the cooling mode and the coefficient of performance (COP) in the heating mode. The seasonal energy efficiency ratio and the seasonal coefficient of performance (SEER, SCOP) designate the total heat supplied or removed from areas (Qheat/cold, season) divided by the total work input over the same period (Welectricity, season) [24]. By product type, split systems, coupled with air-to-air heat pumps, account for the majority of AC units per type [25]. Air-to-water and water-to-water heat pumps can be coupled with fan coil units (FCUs) and radiant panels in walls, floors, and ceilings. The EER and COP of heat pumps depend on the source and load side temperatures, so assessing the energy performance of each type requires analyzing the outdoor and indoor operating temperatures [26].
When it comes to defining thermal comfort conditions, six main factors must be taken into account: metabolic rate, clothing insulation, air temperature, radiant temperature, airspeed, and humidity [27]. Fanger’s Predicted Mean Vote (PMV) method was developed to consider the different variables that influence the comfort assessment in a working environment [28,29]. The international organization for standardization document ISO 7726 defined local thermal discomfort as the thermal dissatisfaction caused by unwanted cooling or heating of one particular part of the body. It mainly affects people developing light sedentary activities [30]. The mean radiant temperature (MRT) has a strong influence on human thermal comfort because occupant bodies transfers heat to hot or cold surfaces [31]. In office buildings with convective heating and cooling systems, such as split units, and facades with extensive glazing, users experience a lack of comfort caused by the inhomogeneity in indoor surfaces and air temperatures [32]. For example, windows with high thermal transmittance and without Low-E coatings can lead to high radiant temperature asymmetry and the local dissatisfaction of some body parts [33]. An effective way to improve the comfort conditions in these buildings would be to use temperature-controlled surfaces or radiant panels as the principal source of sensible cooling and heating in the conditioned space. Radiant panels provide a comfortable indoor environment without lowering the room air’s moisture content. Occupants in an area heated or cooled by radiant panels are comfortable at lower air temperatures in winter and higher air temperatures in summer. Indoor partitions and facades with Water-Flow Glazing (WFG) are considered active radiant panels that control their temperature by circulating water, and can be used to control the surface temperatures and provide an acceptable thermal environment [34]. In facades exposed to solar radiation, the water flows between two glass panes and captures most of the solar infrared radiation, and the visible component enters the building [35]. Since the WFG is a dynamic envelope, the solar heat transmitted through the material depends on the flow rate. When the water flows, the transmitted solar heat is low, and when the water flow stops, the solar radiation enters the building [36]. In interior partitions, WFG panels can supply the needed power at a rate of 120 W/m2 if the difference between the circulating water and the indoor air temperature is 10 °C [37].
This paper focused on assessing the performance of WFG envelopes in commercial buildings by analyzing power demand patterns through measured data obtained from a testing facility. Hence, to achieve this goal, it was essential to: (i) validate the energy management system to enhance the thermal performance of the building, (ii) estimate the final energy consumption of the office space in summer and winter conditions, and (iii) evaluate the comfort conditions and the influence of the mean radiant temperature in the Predicted Mean Vote over the office space working hours.

2. Materials and Methods

Commercial building energy simulation (BES) tools do not include Water-Flow Glazing as an option, so it is necessary to validate its behavior in real facilities. This section described the office space layout, the description of the envelope and the Water-Flow Glazing, the energy management system components, and the electronic control unit logic operation.

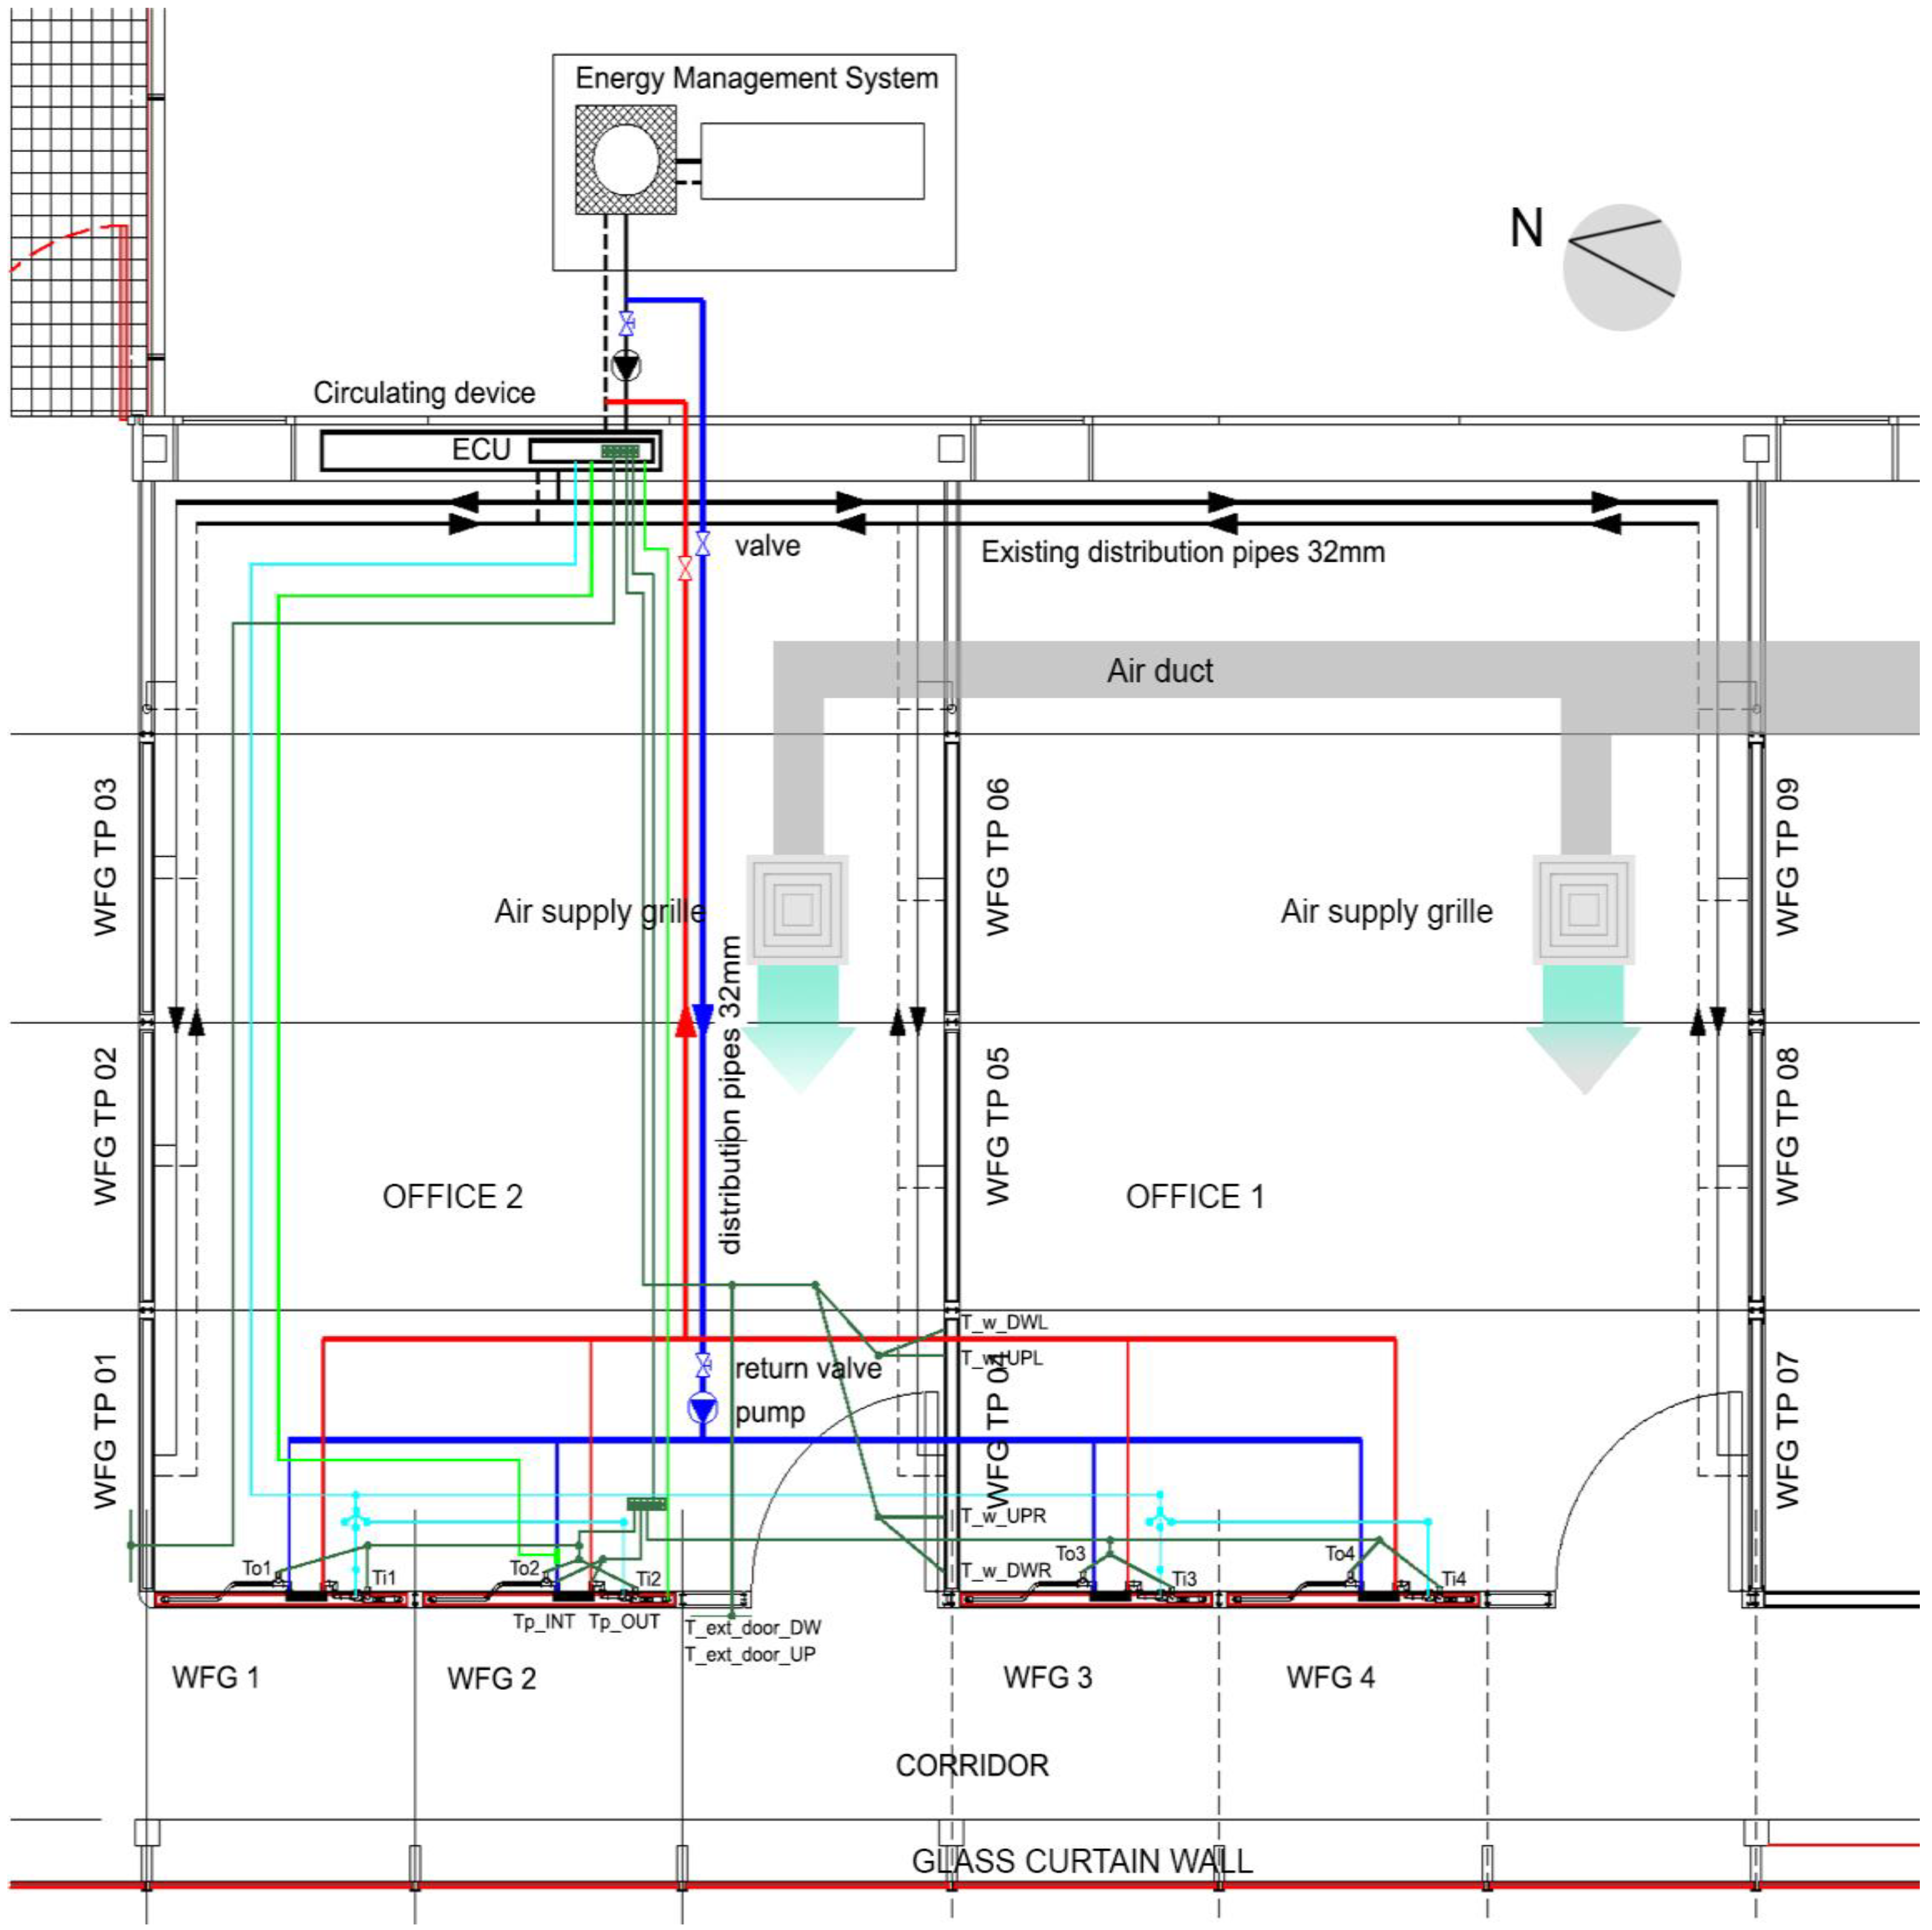
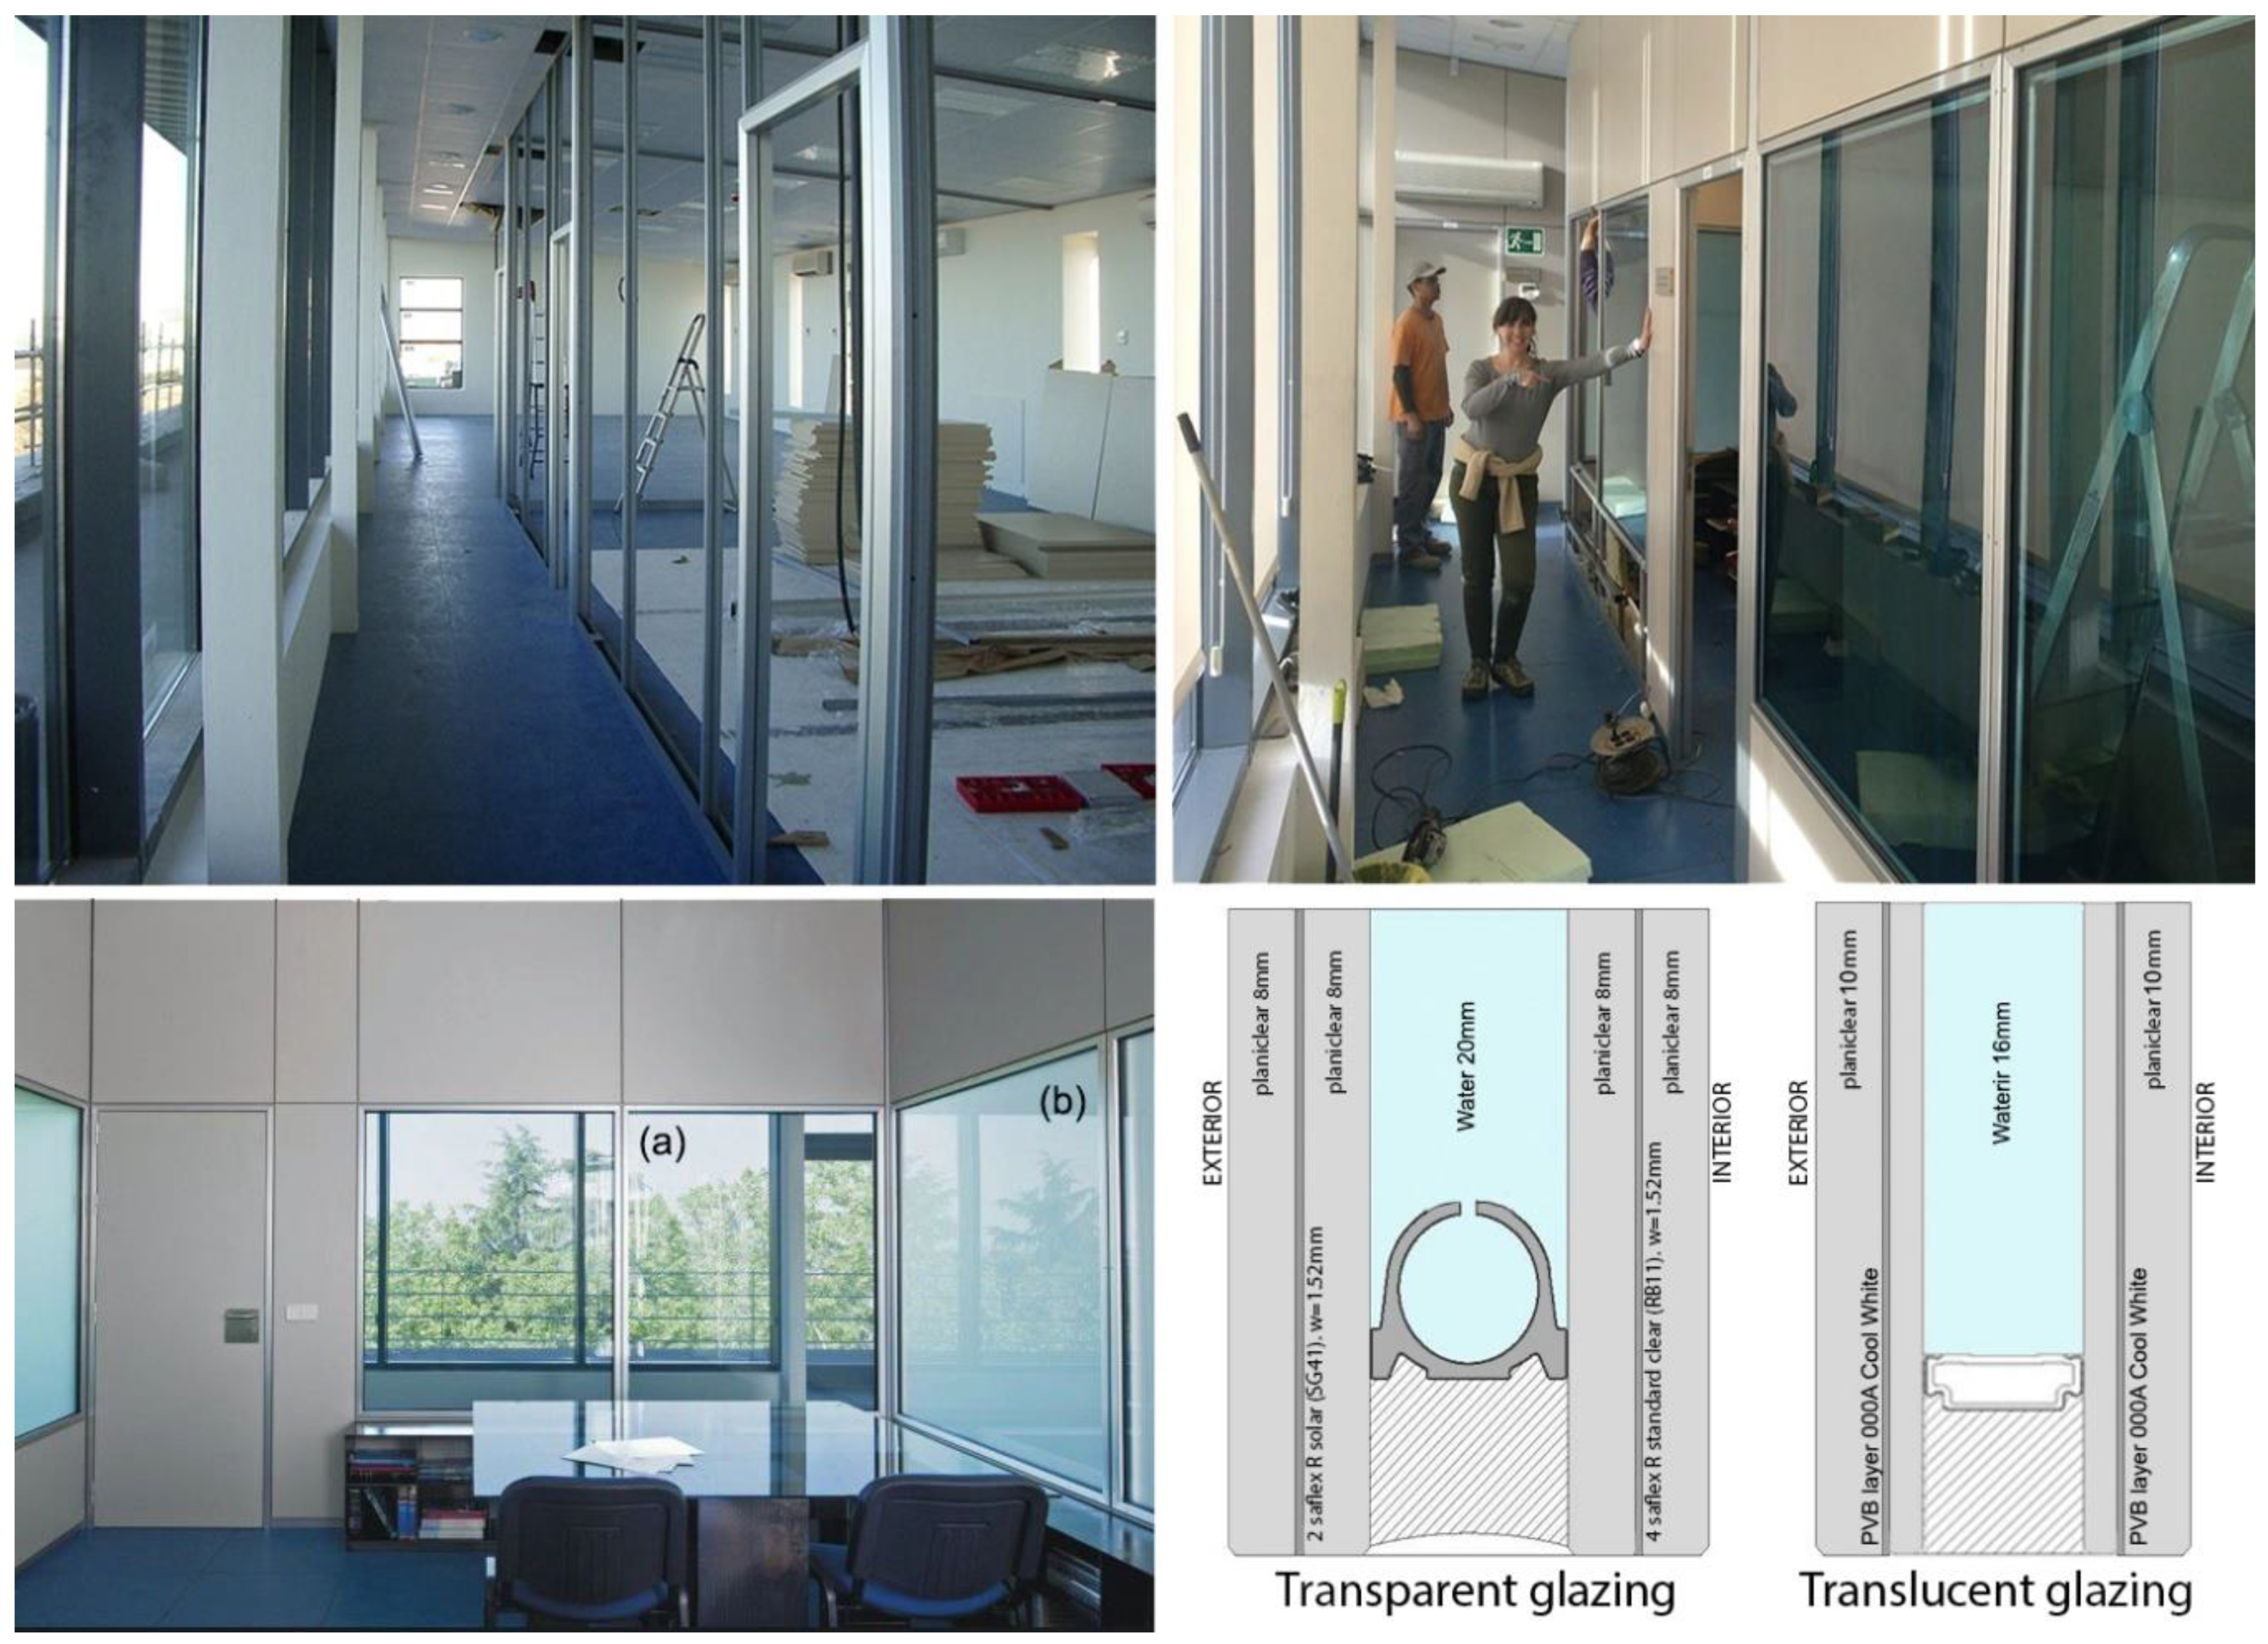
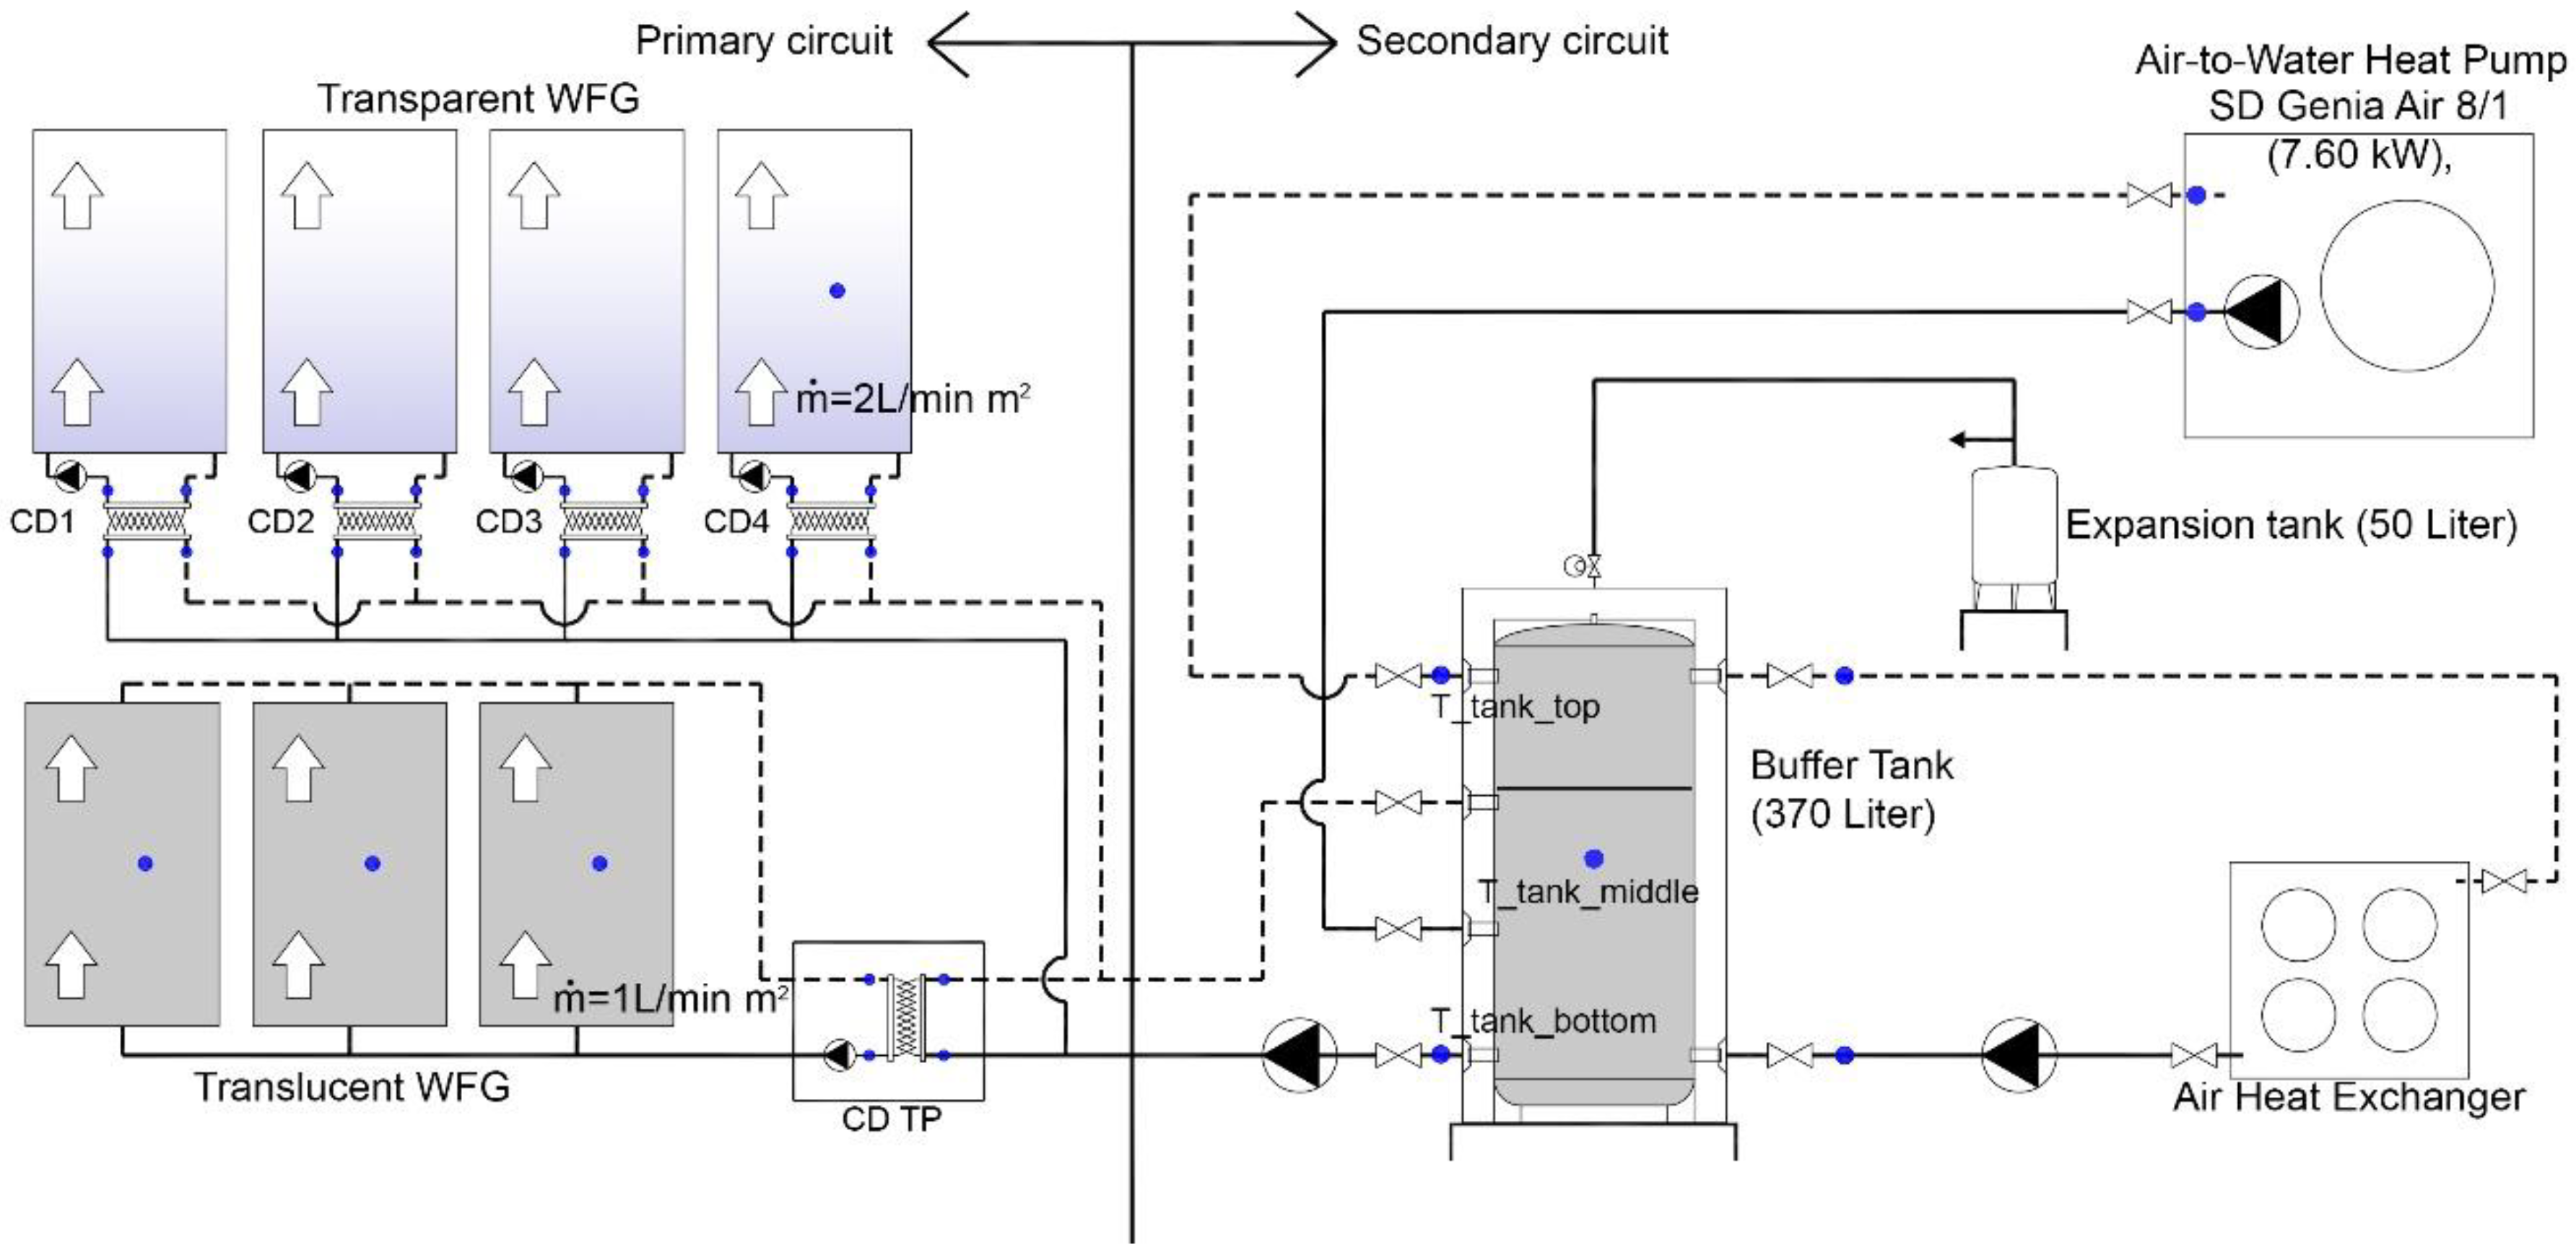
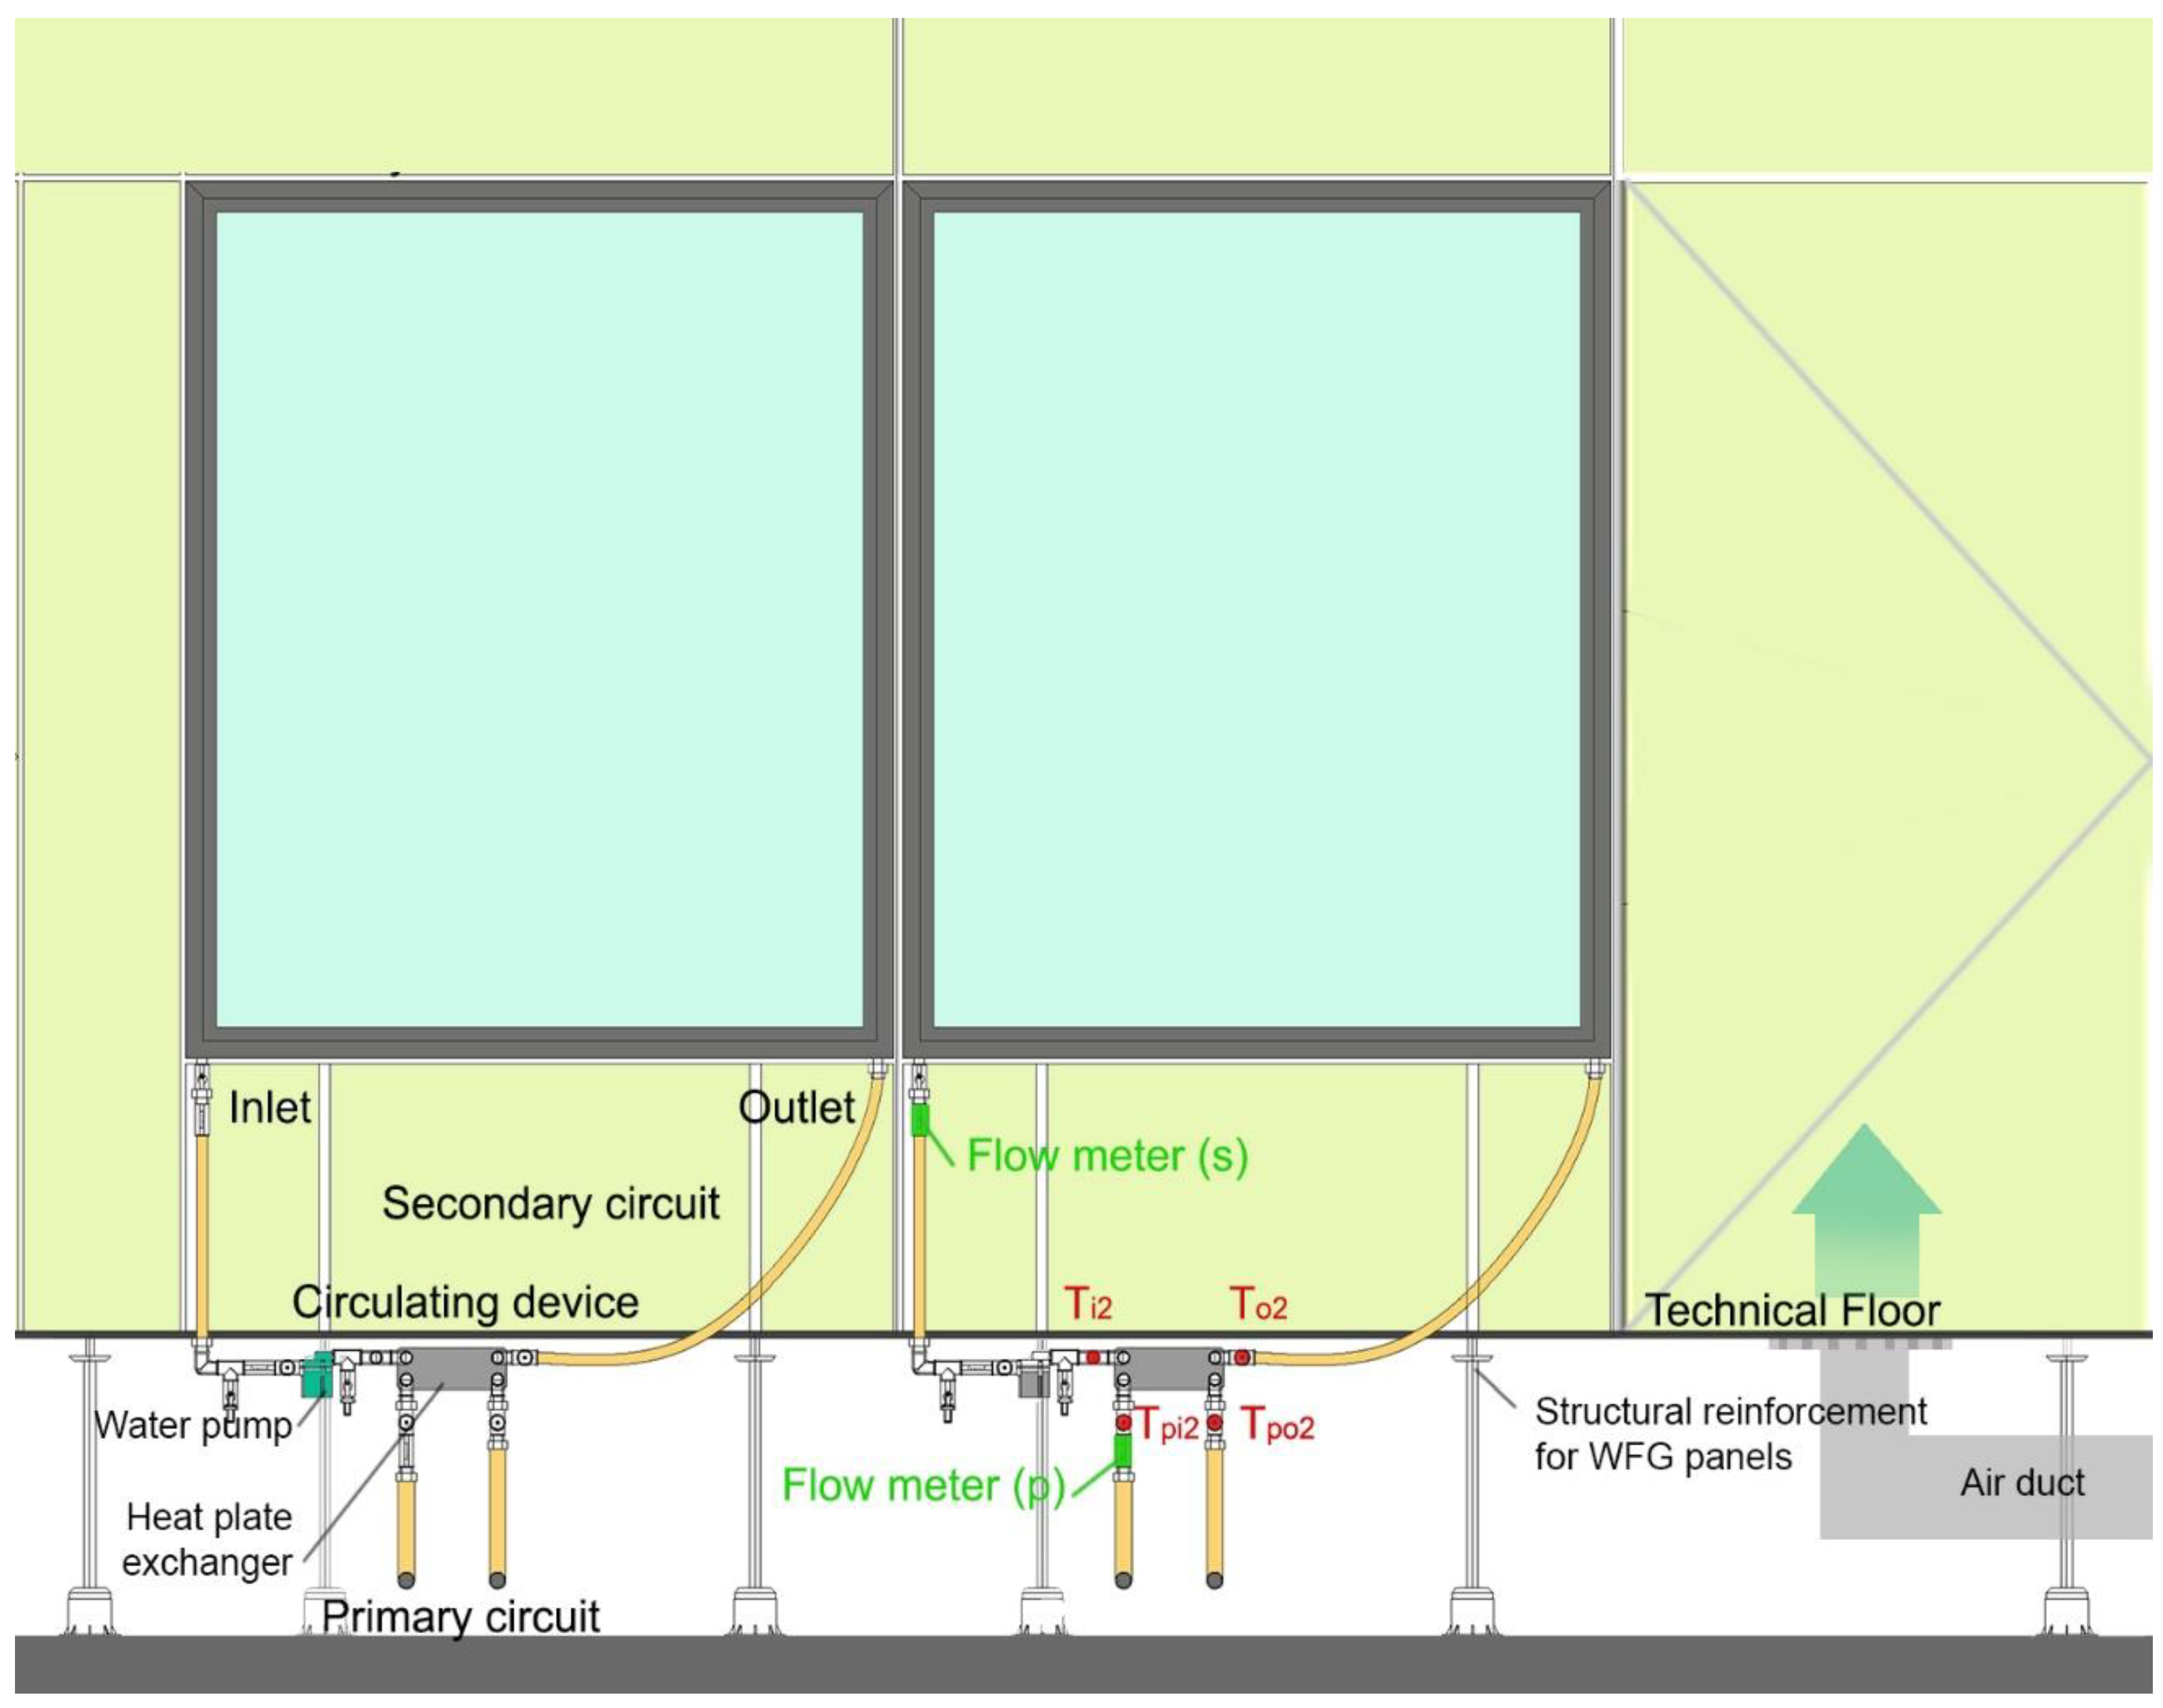
2.1. Description of the Facility

The testing facility was an office space of the Department of Applied Mathematics in the School of Aeronautics and Space Engineering in Madrid, Spain (40,44389° N, −3,7261972° E). Two faculty members occupy the room from 8:00 a.m. to 8:00 p.m., and there are meetings with students during office hours. The occupancy is limited to six people at a time. The facility validated the WFG behavior as a component of the heating and cooling system. Figure 1 illustrates the floor plan. Four transparent WFG panels (WFG1, WFG2, WFG3, and WFG4) separated the corridor from the office. The thermal and spectral properties of these transparent panels were carefully selected to absorb the maximum heat from the beam solar radiation, which entered through the main glazed facade, impinging into the WFG in the afternoon for four to five hours, depending on the season. The northeast facade was an insulated opaque wall, and the rest of the interior partitions were translucent WFG (WFG_TP01 to WFG_TP09). In all, there were thirteen WFG panels of 1500 mm height by 1300 mm width. The energy management system is placed outdoors, in the north-east facade. The electronic control unit (ECU) monitored the temperatures of the WFG and the indoor, corridor, and outdoor temperatures.
Table 1 shows the thermal transmittance and areas of the office envelope. The opaque internal partitions were modular walls with melamine panel finish (0.5 cm) and rock–wool acoustic insulation (3 cm). The northeast facade was an insulated opaque wall made up of a zinc plate external finish (1 mm), ventilated air chamber (3 cm), a brick wall (11 cm), rock–wool thermal insulation (6 cm), air chamber (5 cm), and a plaster board (12 mm). The roof was composed of a zinc plate external finish (1 mm), ventilated air chamber (3 cm), metal deck with concrete (10 cm), air chamber (10 cm), rock–wool thermal insulation (6 cm), and a plaster board (12 mm). The thermal transmittances met the requirements of the Spanish Building Code [38].
Figure 2 shows the space with transparent WFG (a) facing south-west and translucent interior partitions (b). The former was double glazed; each glass pane was composed of 8 mm planiclear, 1.54 mm saflex Rsolar SG41, 8 mm planiclear, and a 20 mm water chamber. The latter was double glazed; each glass pane was formed of 10 mm planiclear, 1 mm translucent Polyvinyl butyral (PVB) 000A CoolWhite, 3 mm planiclear, and a 16 mm water chamber. The mass flow rate through the transparent WFG was set to be 2 L/min, and through the translucent glazing, it was 1 L/min. The transparent panes were exposed to western solar radiation and had to absorb a large amount of heat. In contrast, the translucent panes were designed to deliver heat or cold in winter or summer.
Table 2 shows the estimated heating and cooling loads in the office space. Ventilation loads (Vent) and internal loads (IL) were calculated for an occupancy of six people and average office equipment [38,39]. The total glazed surface was 7.8 m2 of transparent WFG and 17.55 m2 of translucent interior partitions. The wall-to-window ratio of the wall exposed to solar radiation was 40%. The total area of WFG radiant panels was 25.35 m2, with a floor area of 40 m2. The expected power delivered by WFG was 130 W/m2 when the difference between the circulating water and the indoor air temperature was 13 °C. The dew point temperature for the indoor air temperature was at 27 °C and relative humidity at 40% was 12 °C. Therefore, keeping the WFG inlet temperature above 12 °C, the indoor air temperature at 27 °C, and the average water temperature at 14 °C, the delivered cooling power would be 130 W/m2. The total WFG surface area was 25.35 m2 and the total cooling power was 3295 W, which was above the predicted cooling loads shown in Table 2. The cost of the system depends on a few different factors, including the dimensions of the glass, thickness, and distance between the energy management system and the panels. A typical 2 m2 double glass panel costs 900 USD (around 450 USD/m2), including the piping and individual circulating devices. Installation of WFG requires a professional team, which could run 50 to 70 USD per hour.
Figure 3 shows the schematics of both circuits. The energy management circuit consisted of a 370 L buffer tank, an expansion tank, an air-to-water heat pump, and an air heat exchanger. The heat pump’s (Saunier Duval Genia Air 8/1 Power A7/W35 = Power A35/W18) nominal power was 7.60 kW in winter (at an outdoor air temperature of 7 °C and inlet water temperature of 35 °C) and summer (at an outdoor air temperature of 35 °C and inlet water temperature of 18 °C). The heat pump was selected for commercial reasons, regarding availability and budget constraints. Some malfunctions and operating issues related to the oversized cooling and heating power are addressed in the following sections. The air heat exchanger works when the outdoor air temperature is low enough to cool down water. This cooling mode can only be used when outdoor ambient air temperatures are below 12 °C. When the air heat exchanger is used for free cooling, the control system uses valves to isolate the heat pump from the rest of the loop, and the heat exchanger is used like a chiller. Once the buffer tank is heated or cooled down, the water flows to transfer heat or cold to the circulating device. Then, the secondary circuit transports the heated or cooled water to thirteen radiant WFG units. A control system with a thermostat based on the indoor temperature turned the heat pump and the flow rate ON and OFF. The secondary circuit was made up of two branches—one that transferred heat or cold to translucent partitions and another one for the transparent WFG modules. Each transparent WFG module had a circulating device (CDi). The mass flow rate through the transparent modules was set to = 2 L/min m2 when the system was ON. All the translucent WFG panels were connected to the same circulating device (CD TP), and the flow rate was = 1 L/min m2. The influence of the mass flow rate on the ability to deliver or absorb heat and the recommended values have been studied in previous articles [37]. Transparent WFG panels are exposed to solar radiation, so the mass flow rate had to be higher to absorb heat in summer and keep the water temperature within acceptable values. The electronic control unit actuated the WFG circulating devices, the heat pump, and the air heat exchanger using the basic commands of ON and OFF, with the control logic explained in Table 3. There was a mechanical ventilation system that met the requirements of the Spanish Regulation of Thermal Installations in Buildings (RITE) for ventilation of office spaces (12.5 L per second per person) [40]. The mechanical ventilation provided conditioned air and operated over the working hours (8:00 a.m. to 8:00 p.m.) at a constant air volume. However, it was not a component of the controlled energy management system. The lack of control of the ventilation device was one of the system’s uncertainties because high relative humidity can cause condensation in radiant panels when operating in cooling mode, and can affect the latent loads.
Table 3 and Table 4 show the proposed energy management strategy in the heating and cooling modes. The heat pump (HP) was set to operate during working hours, whereas the air heat exchanger (AHX) operated only in cooling mode during non-working hours. The first condition was related to the indoor air temperature (T_int) and the second condition depended on the difference between the outdoor air temperature (T_ext) and the tank temperatures (T_tank_top, T_tank_bottom).

2.2. Description of the Sensors

To measure the water heat gain of the WFG panels, flow meters and inlet and outlet digital thermometers were installed in the primary and secondary circuits. The DS18B20-PAR digital thermometer communicated over a one-wire bus with the energy control unit (ECU). They had an operating temperature range of −55 to +100 °C and an accuracy of ±0.5 °C. A pyranometer Delta Ohm LP PYRA 03, placed on the vertical south-western facade, allowed measurement of the solar irradiance. It is a second-class pyranometer according to ISO 9060 standards and the World Meteorological Organization (WMO); it had to be placed outdoors because obstacles and reflections can affect the measurements. The same monitoring equipment has been described in other articles [37]. Figure 4 shows the position of the temperature sensors in the WFG and the circulating device. The flow meter (s) measures the flow rate at the inlet of the WFG panels. The flow meter (p) measures the flow rate of the primary circuit. The temperature sensors, Ti2 and To2, measure the inlet and outlet temperatures in the WFG 2, respectively, and Tp2 and Tp2 measure the temperatures at the primary circuit.
Every WFG module had a circulator that comprised a water pump, a plate heat exchanger, and two one-wire sensors inserted into two pocket wells to measure the inlet and outlet temperatures of the glazing. In addition, one module was monitored with a digital flow meter for the primary circuit and another digital flow meter for the secondary circuit. Together with the inlet and outlet temperatures, these flow meters allowed validation of the design flow rate of the glazing as well as having precise actual values for the water heat gain of each WFG panel. The one-wire digital thermometers were inserted into the pocket wells. Each sensor had a unique 64-bit serial number etched into it, and allowed the housing of a considerable number of sensors to be used on one data bus. There were four transparent WFG modules and two thermometers per module, plus the inlet and outlet temperatures for the primary circuit, measured with the same data bus. Thermostats and timers controlled the heating and cooling system. All indoor temperatures were measured 150 cm above the floor level. The main objective of this strategy was to maintain a comfortable indoor temperature and to minimize energy consumption using solar energy harvesting and free cooling. Table 5 presents a description of the sensors and parameters that have been measured. The WFG transparent panels were located in a corridor with south-west orientation. When the solar radiation impinged on the glazing, the water absorbed the energy. After analyzing the indoor temperature, the EMS decided whether to store the heat or to distribute it through the rest of the translucent interior partitions. The energy surplus could be stored in the buffer tank. If there was no solar energy to harvest or there was not enough energy harvested in the buffer tank, the heat pump would work to satisfy the demand. Generally, an office building demands cold throughout the year due to its high internal heat load. In winter, the outdoor temperature is low enough to dissipate the internal heat load utilizing an air heat exchanger. The heat pump electricity consumption was not measured. The electricity consumption was estimated with the heat pump thermal power, the coefficient of performance, and the energy efficiency ratio provided by the manufacturer.

3. Results

This section presents monitoring temperatures and the power efficiency of WFG modules. The implementation of different energy strategies was validated. By analyzing the system’s performance, the energy strategy is improved, achieving significant energy savings. Finally, the power performance of the WFG module is obtained by measuring the inlet and outlet temperatures and flow rate of each WFG panel.

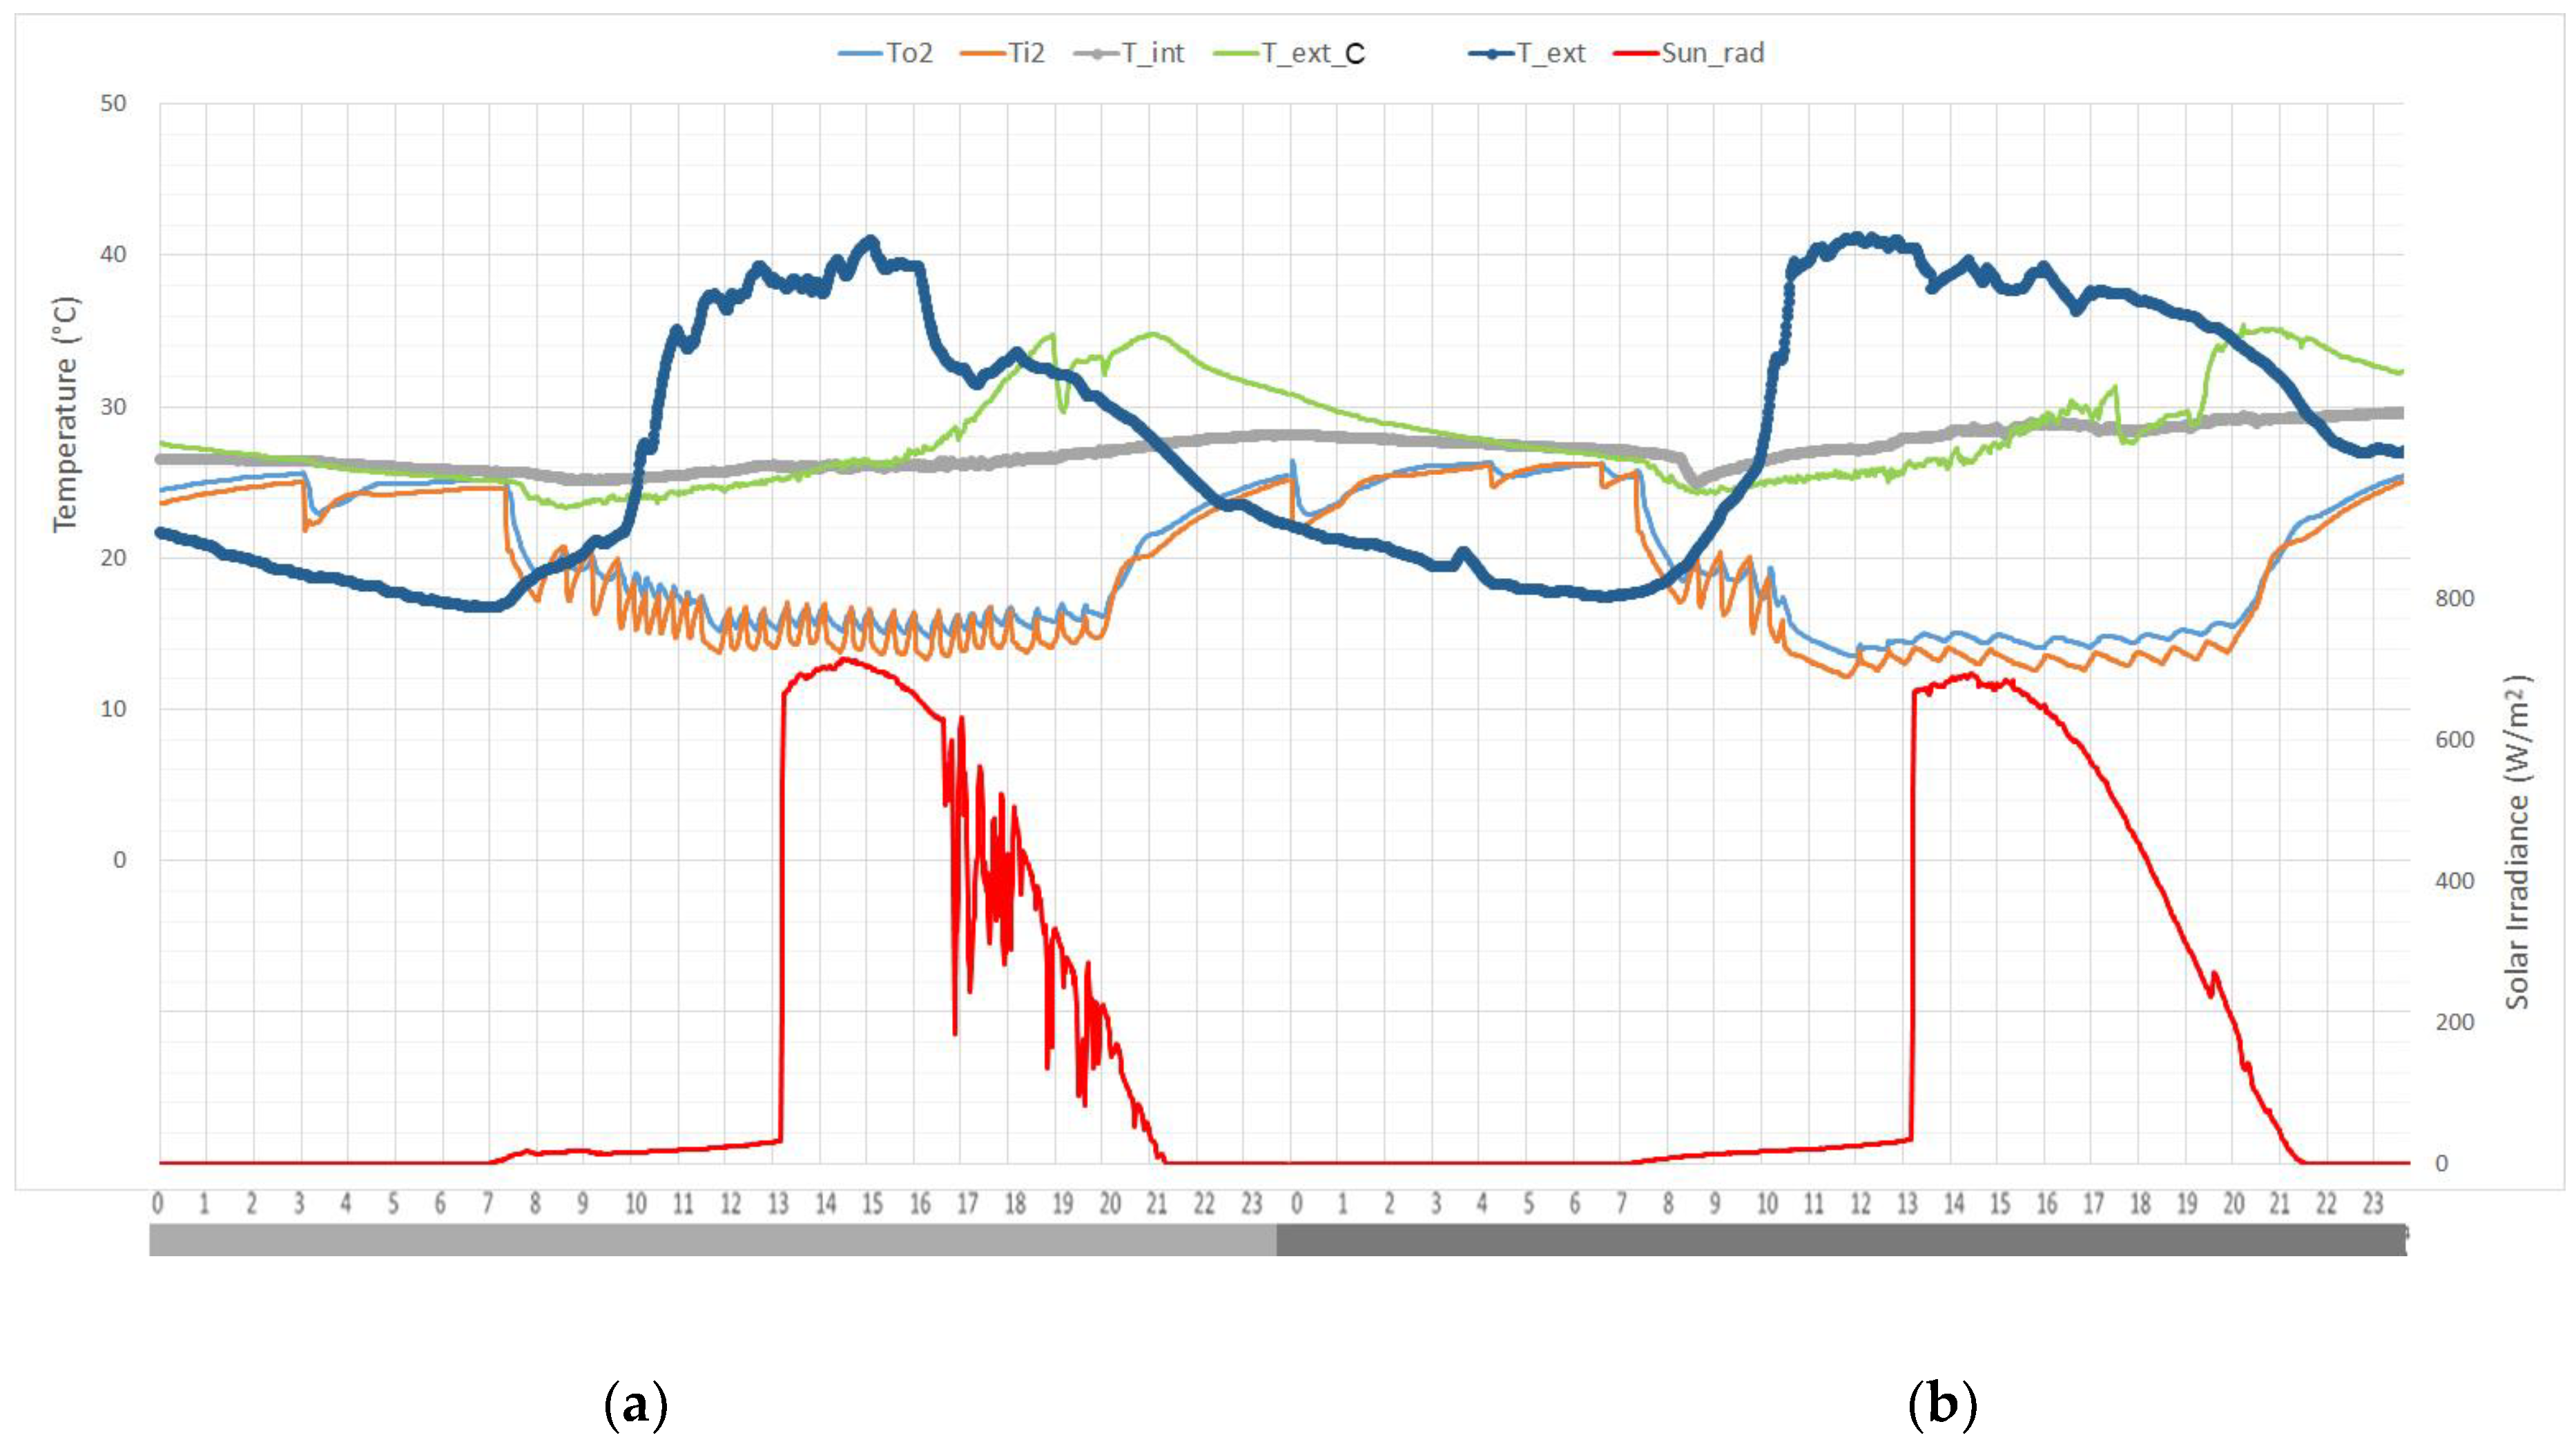
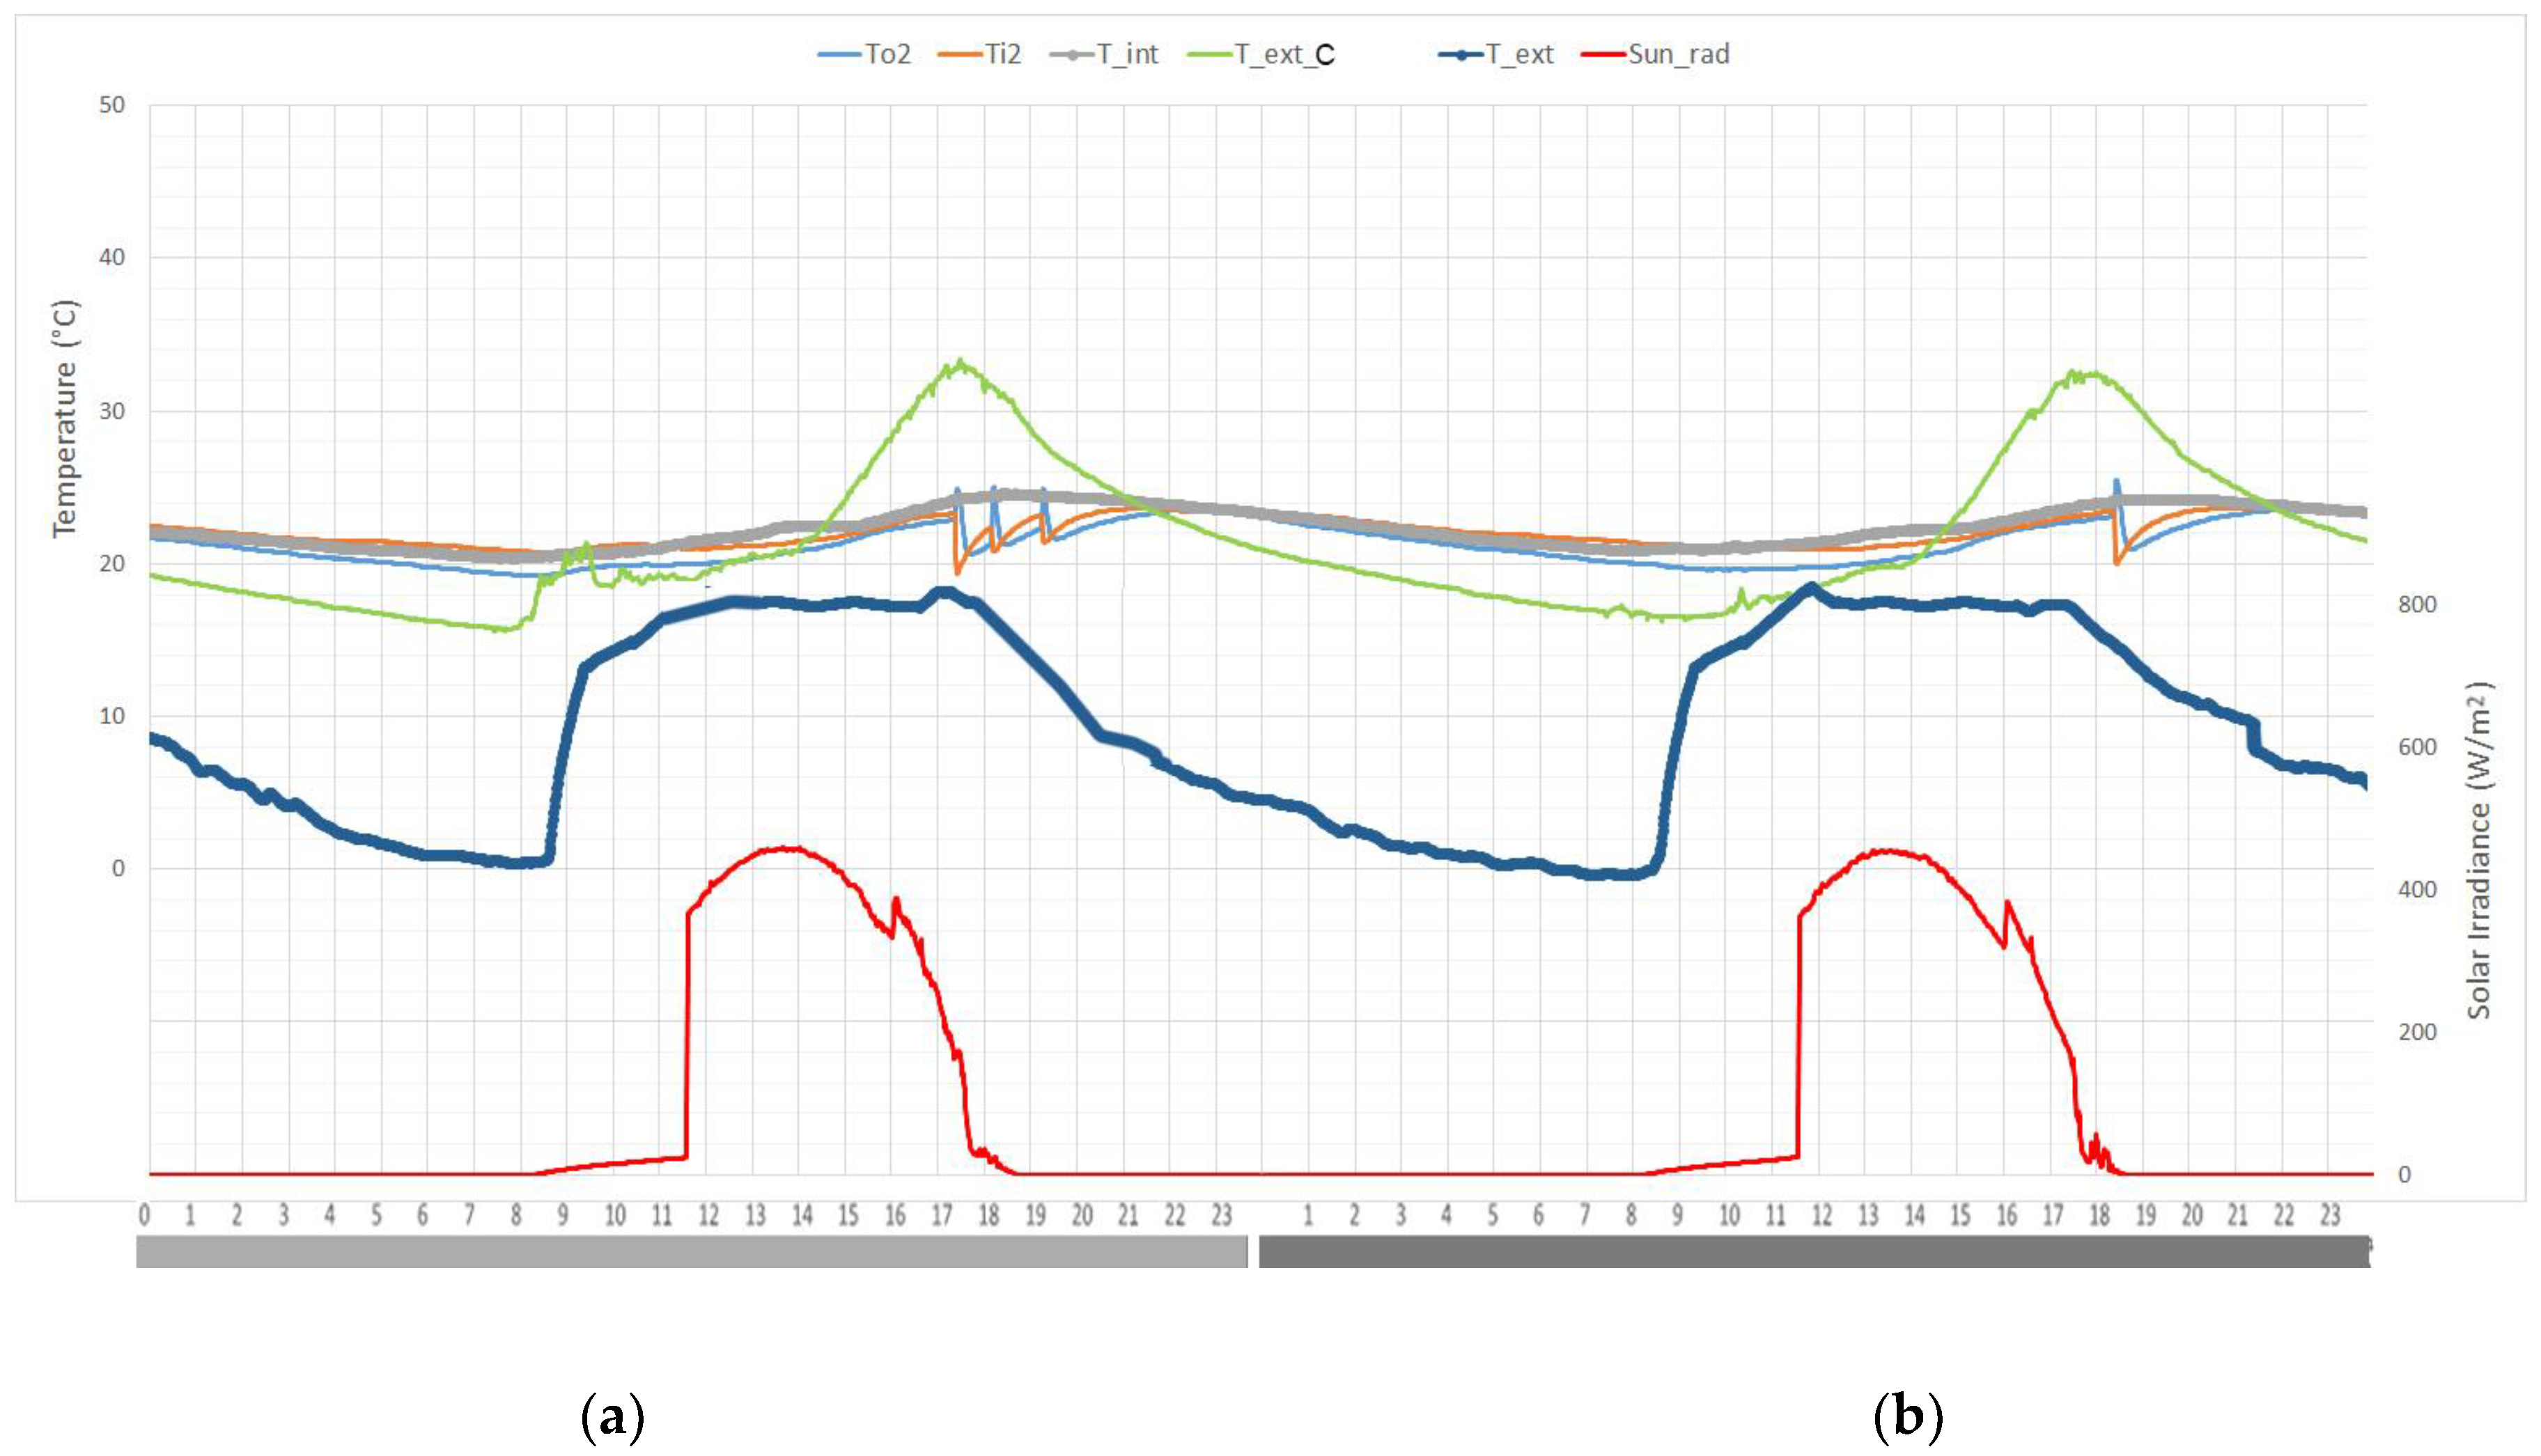
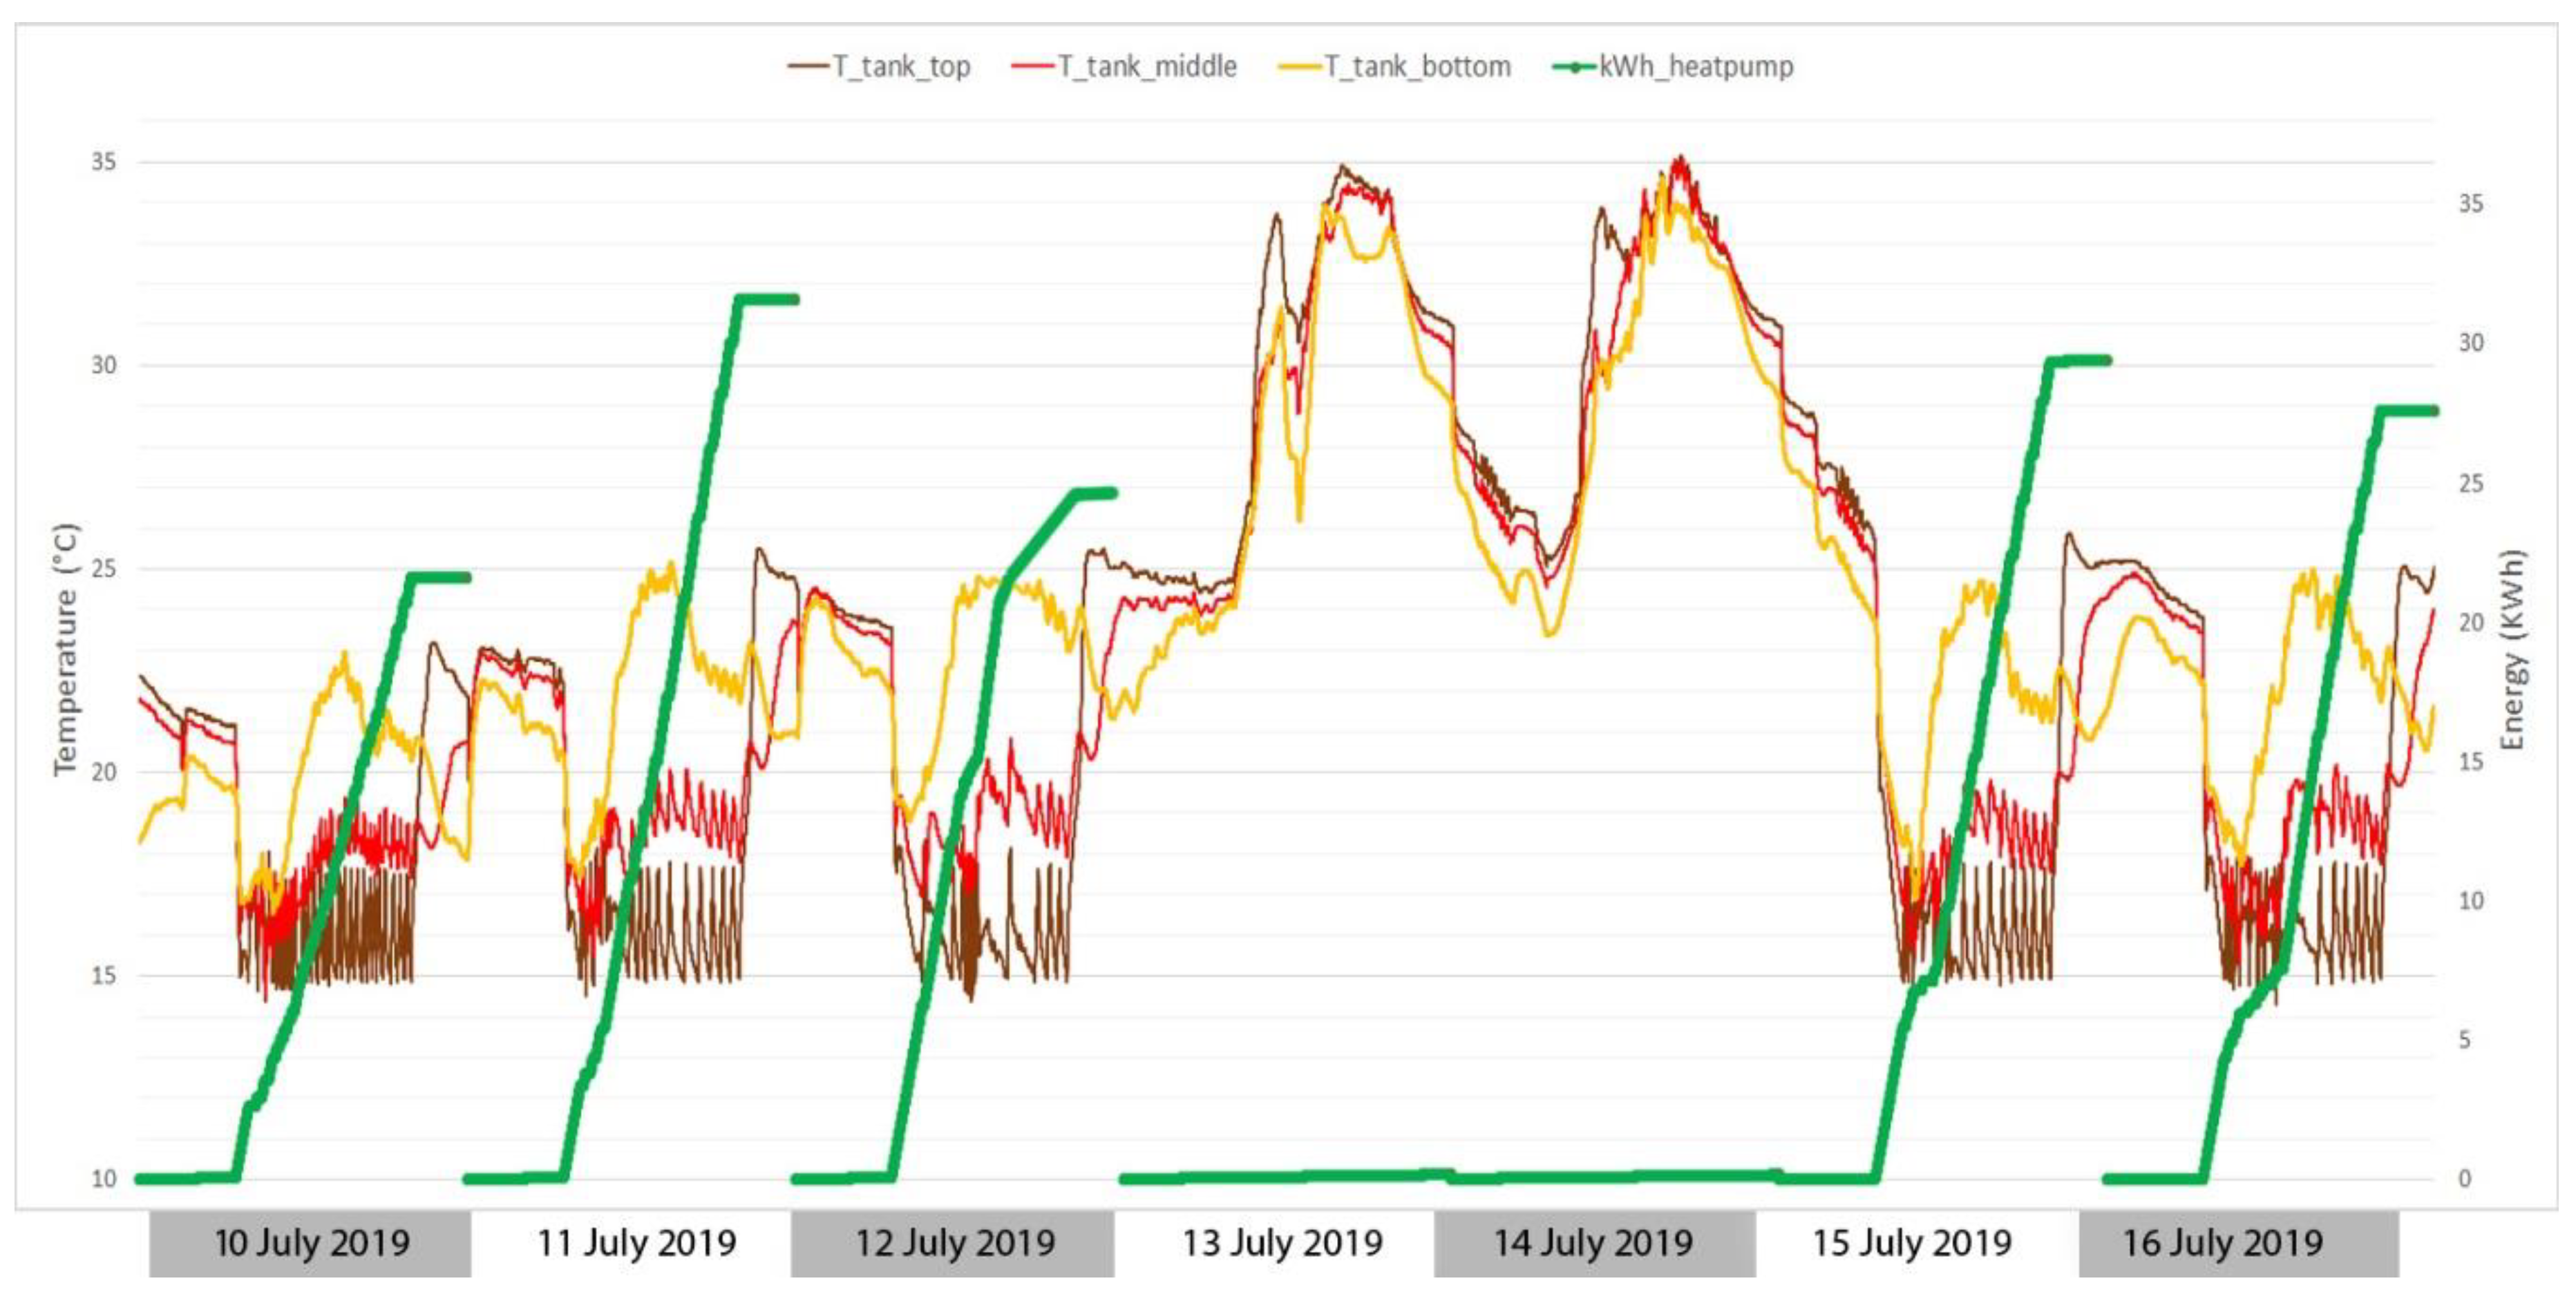
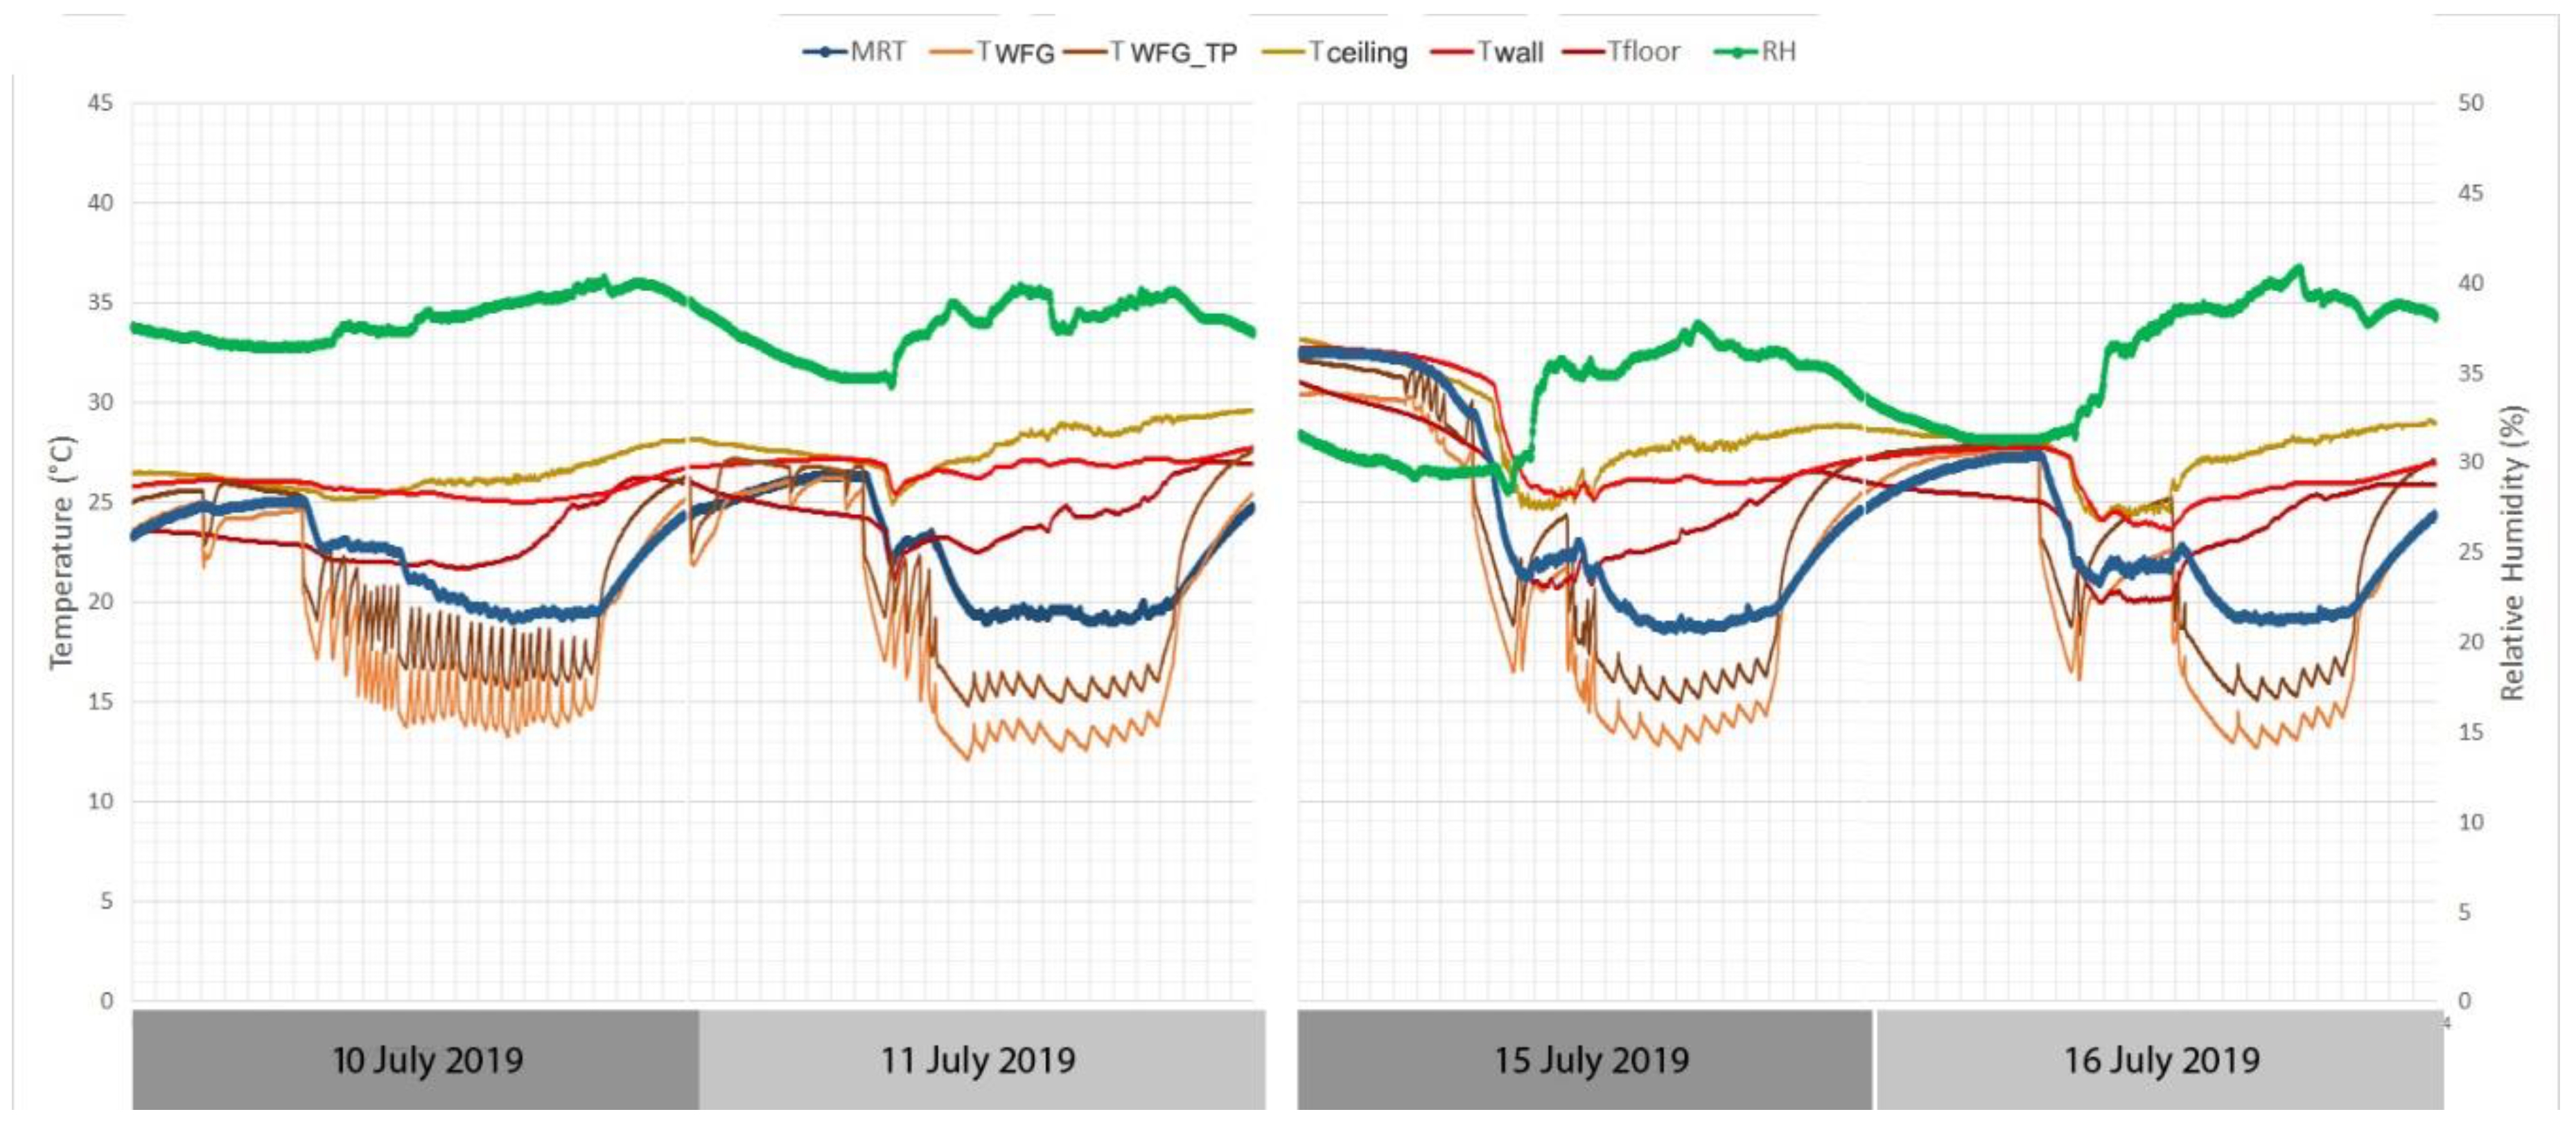
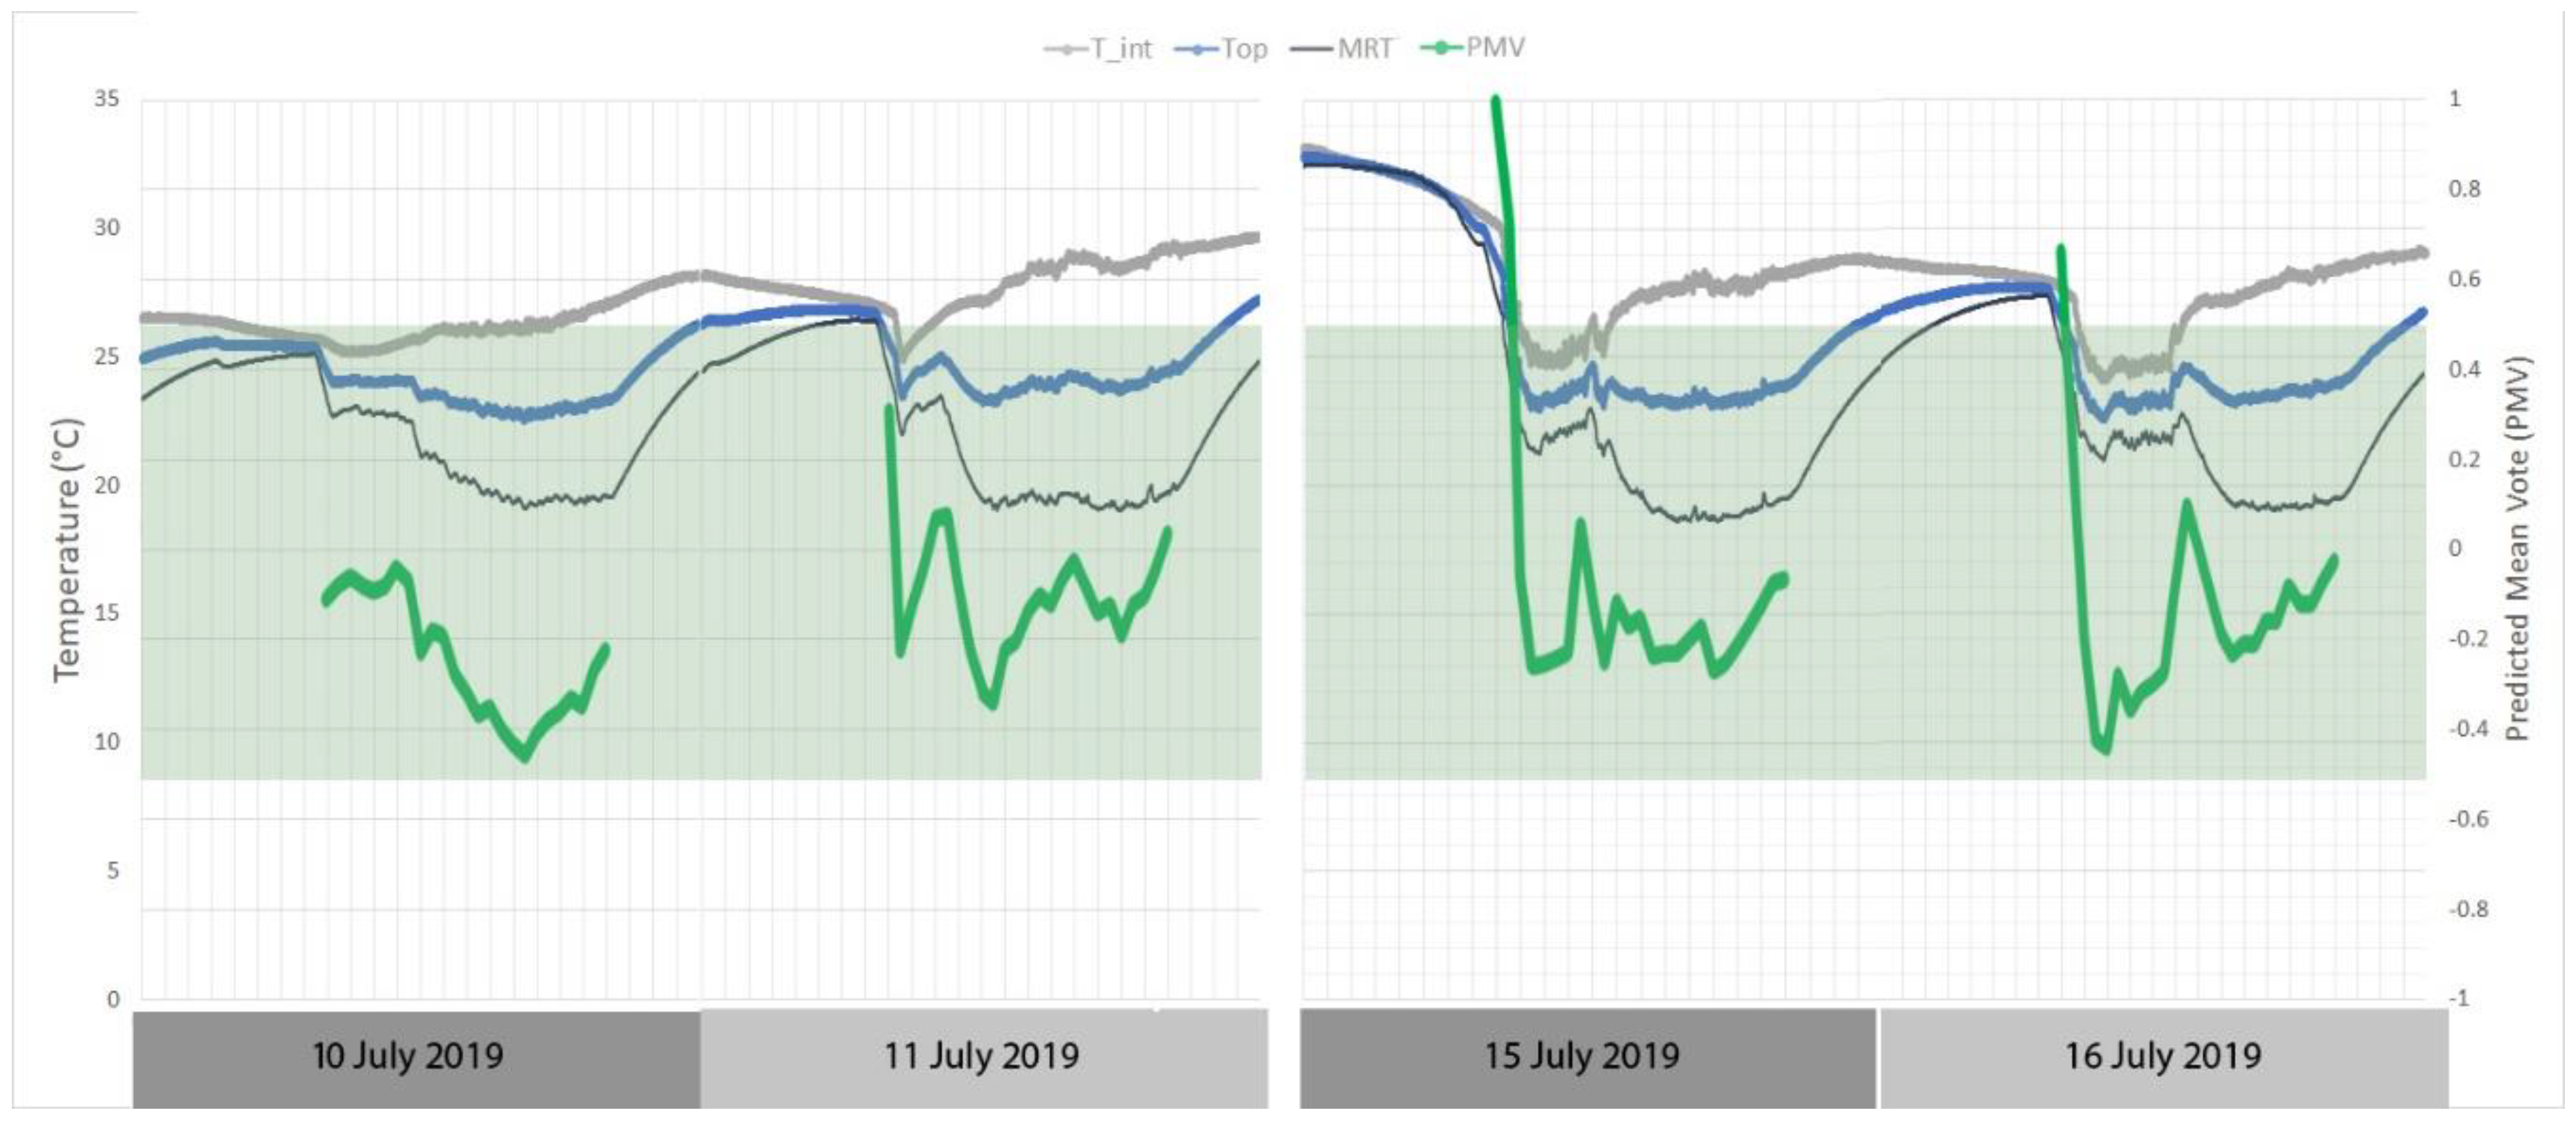
3.1. Analysis in Summer Conditions

Figure 5 shows the system temperatures and the irradiance curve of a sample summer week from 10 July 2019 to 16 July 2019. Ti2 and To2 illustrate the inlet and outlet temperatures of the WFG. T_int is the indoor temperature, and T_ext is the exterior temperature. T_ext_C corresponds to the temperature in the corridor between the office and the exterior. The first day, 10 July 2019, was clear, with some evolution clouds between 16:30 and 18:00. On clear days, direct beam radiation prevailed over diffuse radiation. The typical irradiance curve (Sun_rad) reached maximum levels above 700 W/m2. From 9:00 a.m. to 1:00 p.m., the south-west facade was shaded due to geometrical obstructions, and the irradiance was mainly diffuse, reaching values around 200 W/m2. However, in the afternoon, the facade was exposed to direct solar radiation, and the corridor temperature rose to 35 °C. On 11 July 2019, the indoor and outdoor temperatures showed a similar performance, although the oscillations of the inlet and outlet temperatures were different from those of the previous day. On 12 July 2019, the solar irradiance showed irregular values because of clouds, and it affected the temperature of the corridor, which was slightly above 30 °C. Over the weekend, on 13 July 2019 and 14 July 2019, the mass flow rate was 0 and the heat pump did not operate. Inlet and outlet temperatures of the WFG (Ti2 and To2) did not show any difference and reached peak values of 32 °C. The indoor air temperature reached a maximum of 34 °C, whereas the temperature in the corridor (T_ext_C) was 39 °C. A WFG circuit is a closed loop and there are two cases, mass flow rate = 0 or = design flow rate. Over the weekend, the mass flow rate was 0 and the heat pump was not in operation. After two weekend days, the indoor temperature rose to 32 °C, making it necessary to cool down the office temperature. Figure 5 shows that the inlet and outlet temperatures dropped on Sunday 14/07/2019 before 7:00 a.m., although the heating pump did not operate that day. The same behavior was shown on Monday, 15/07/2019, before 7:00 a.m. The reason was that the air heat exchanger operated both days for two hours when the difference between the top tank water temperature (T_tank_top) and the outdoor air temperature (T_ext) was above 10 °C.
Figure 6 shows the detailed evolution of temperatures on two consecutive days. Figure 6a shows that the irradiance curve on 10 July 2019 had some oscillations in the afternoon, and the outdoor temperature declined, which indicated the existence of clouds. The inlet and outlet temperatures (T_i2, T_o2) showed that the heat pump worked at three cycles per hour. The heat pump parameters were fixed to meet the manufacturer’s requirement for minimum cycle times. Figure 6b showed that the minimum time between starts was, at least, forty minutes. On 10 July 2019 at 7:00 p.m., there was a peak in the corridor temperature (T_ext_C), and this peak did not occur on 11 July 2019. The corridor had a cooling system that was not monitored or controlled by the studied energy management system, and its temperature was a boundary condition of the studied space. The indoor air temperature rose to 27 °C on 10 July 2019 and to 29.5 °C on 11 July 2019. Although the temperatures might seem too high, due to the effect of radiating panels and a low mean radiant temperature, there is thermal comfort in the space, as shown in the discussion section.

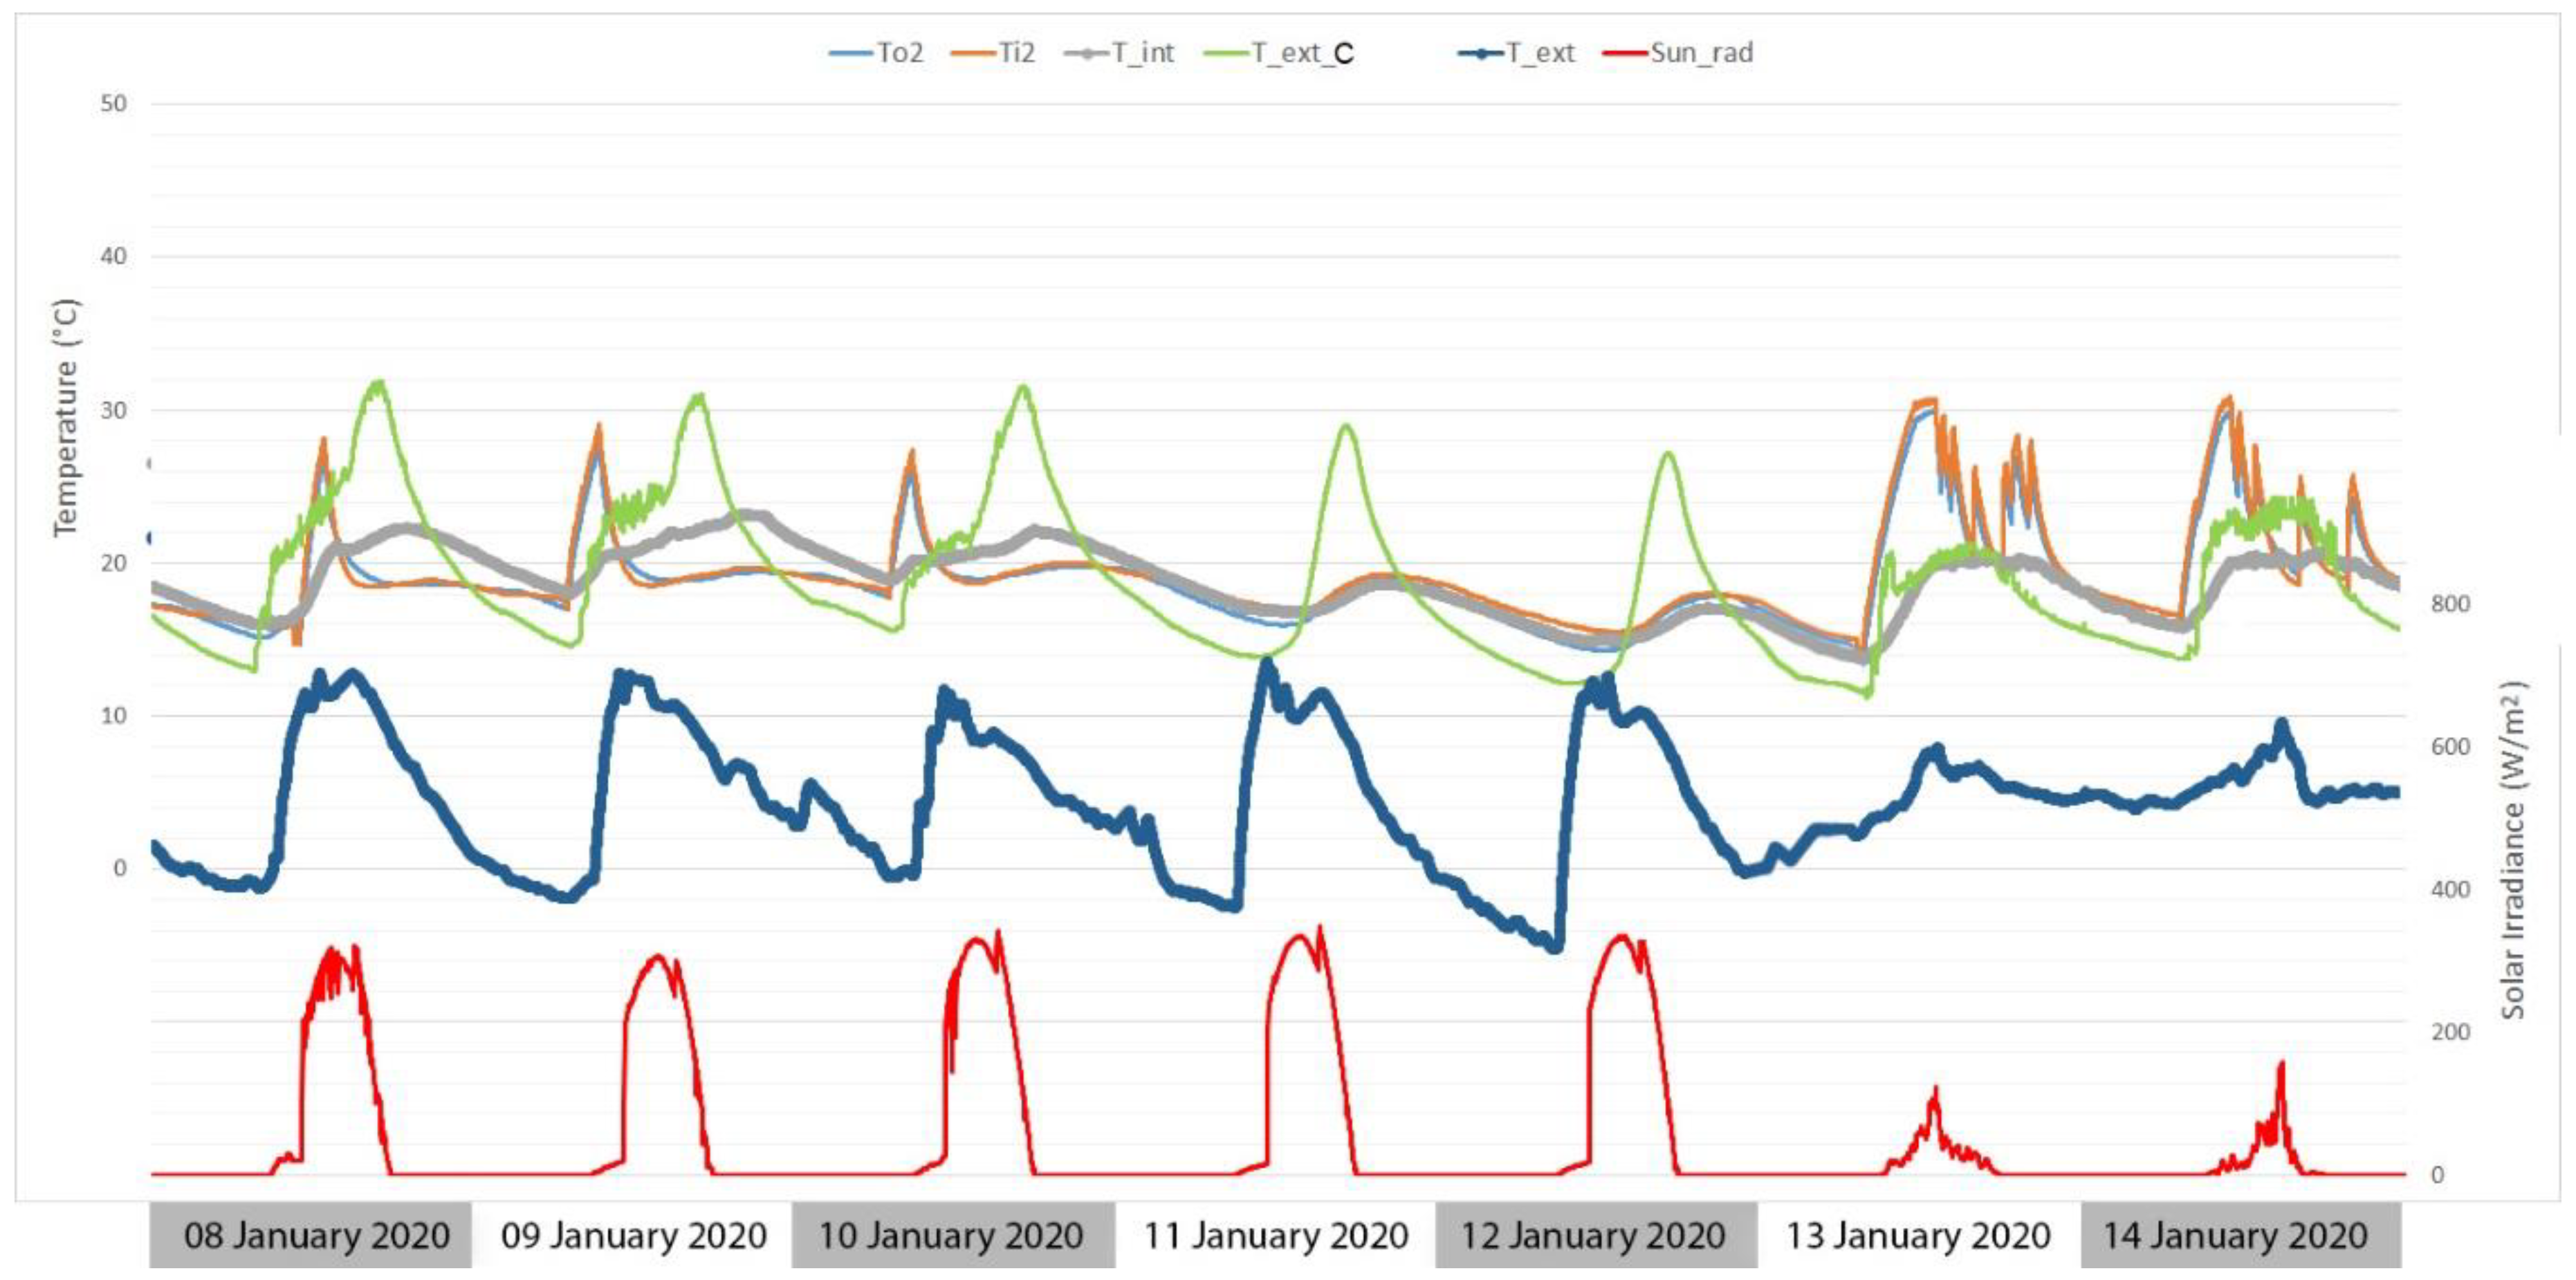
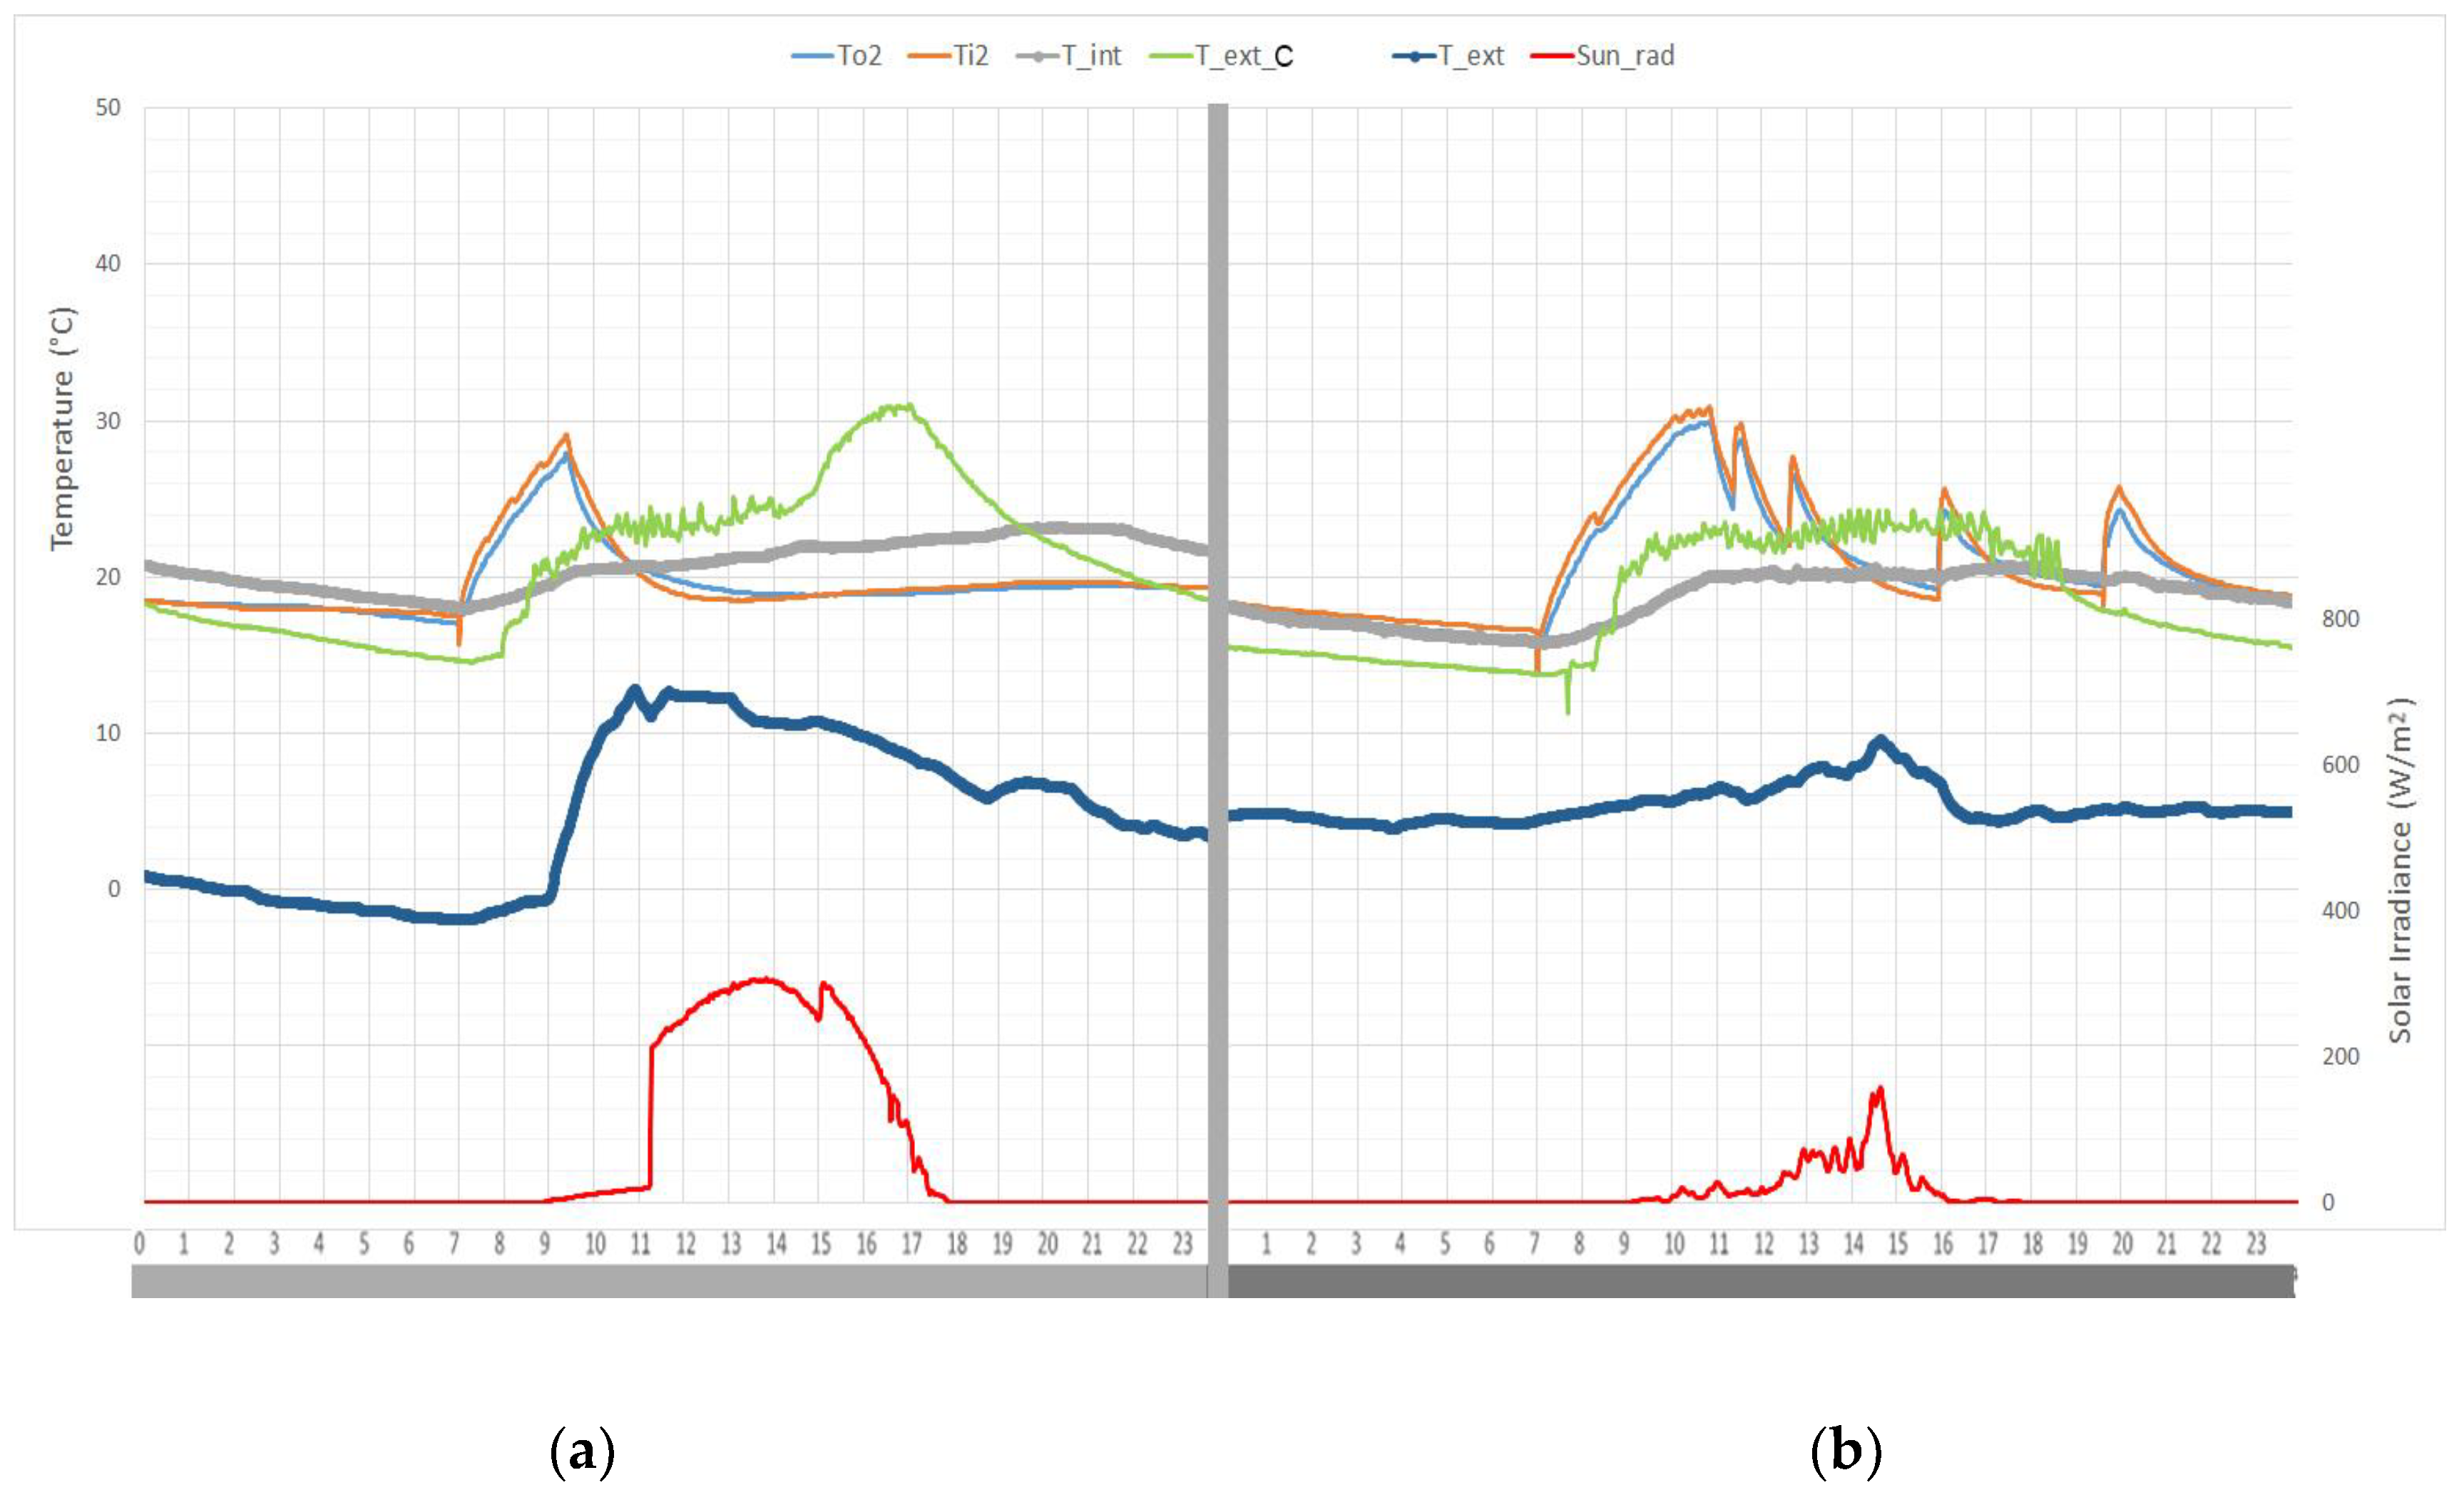
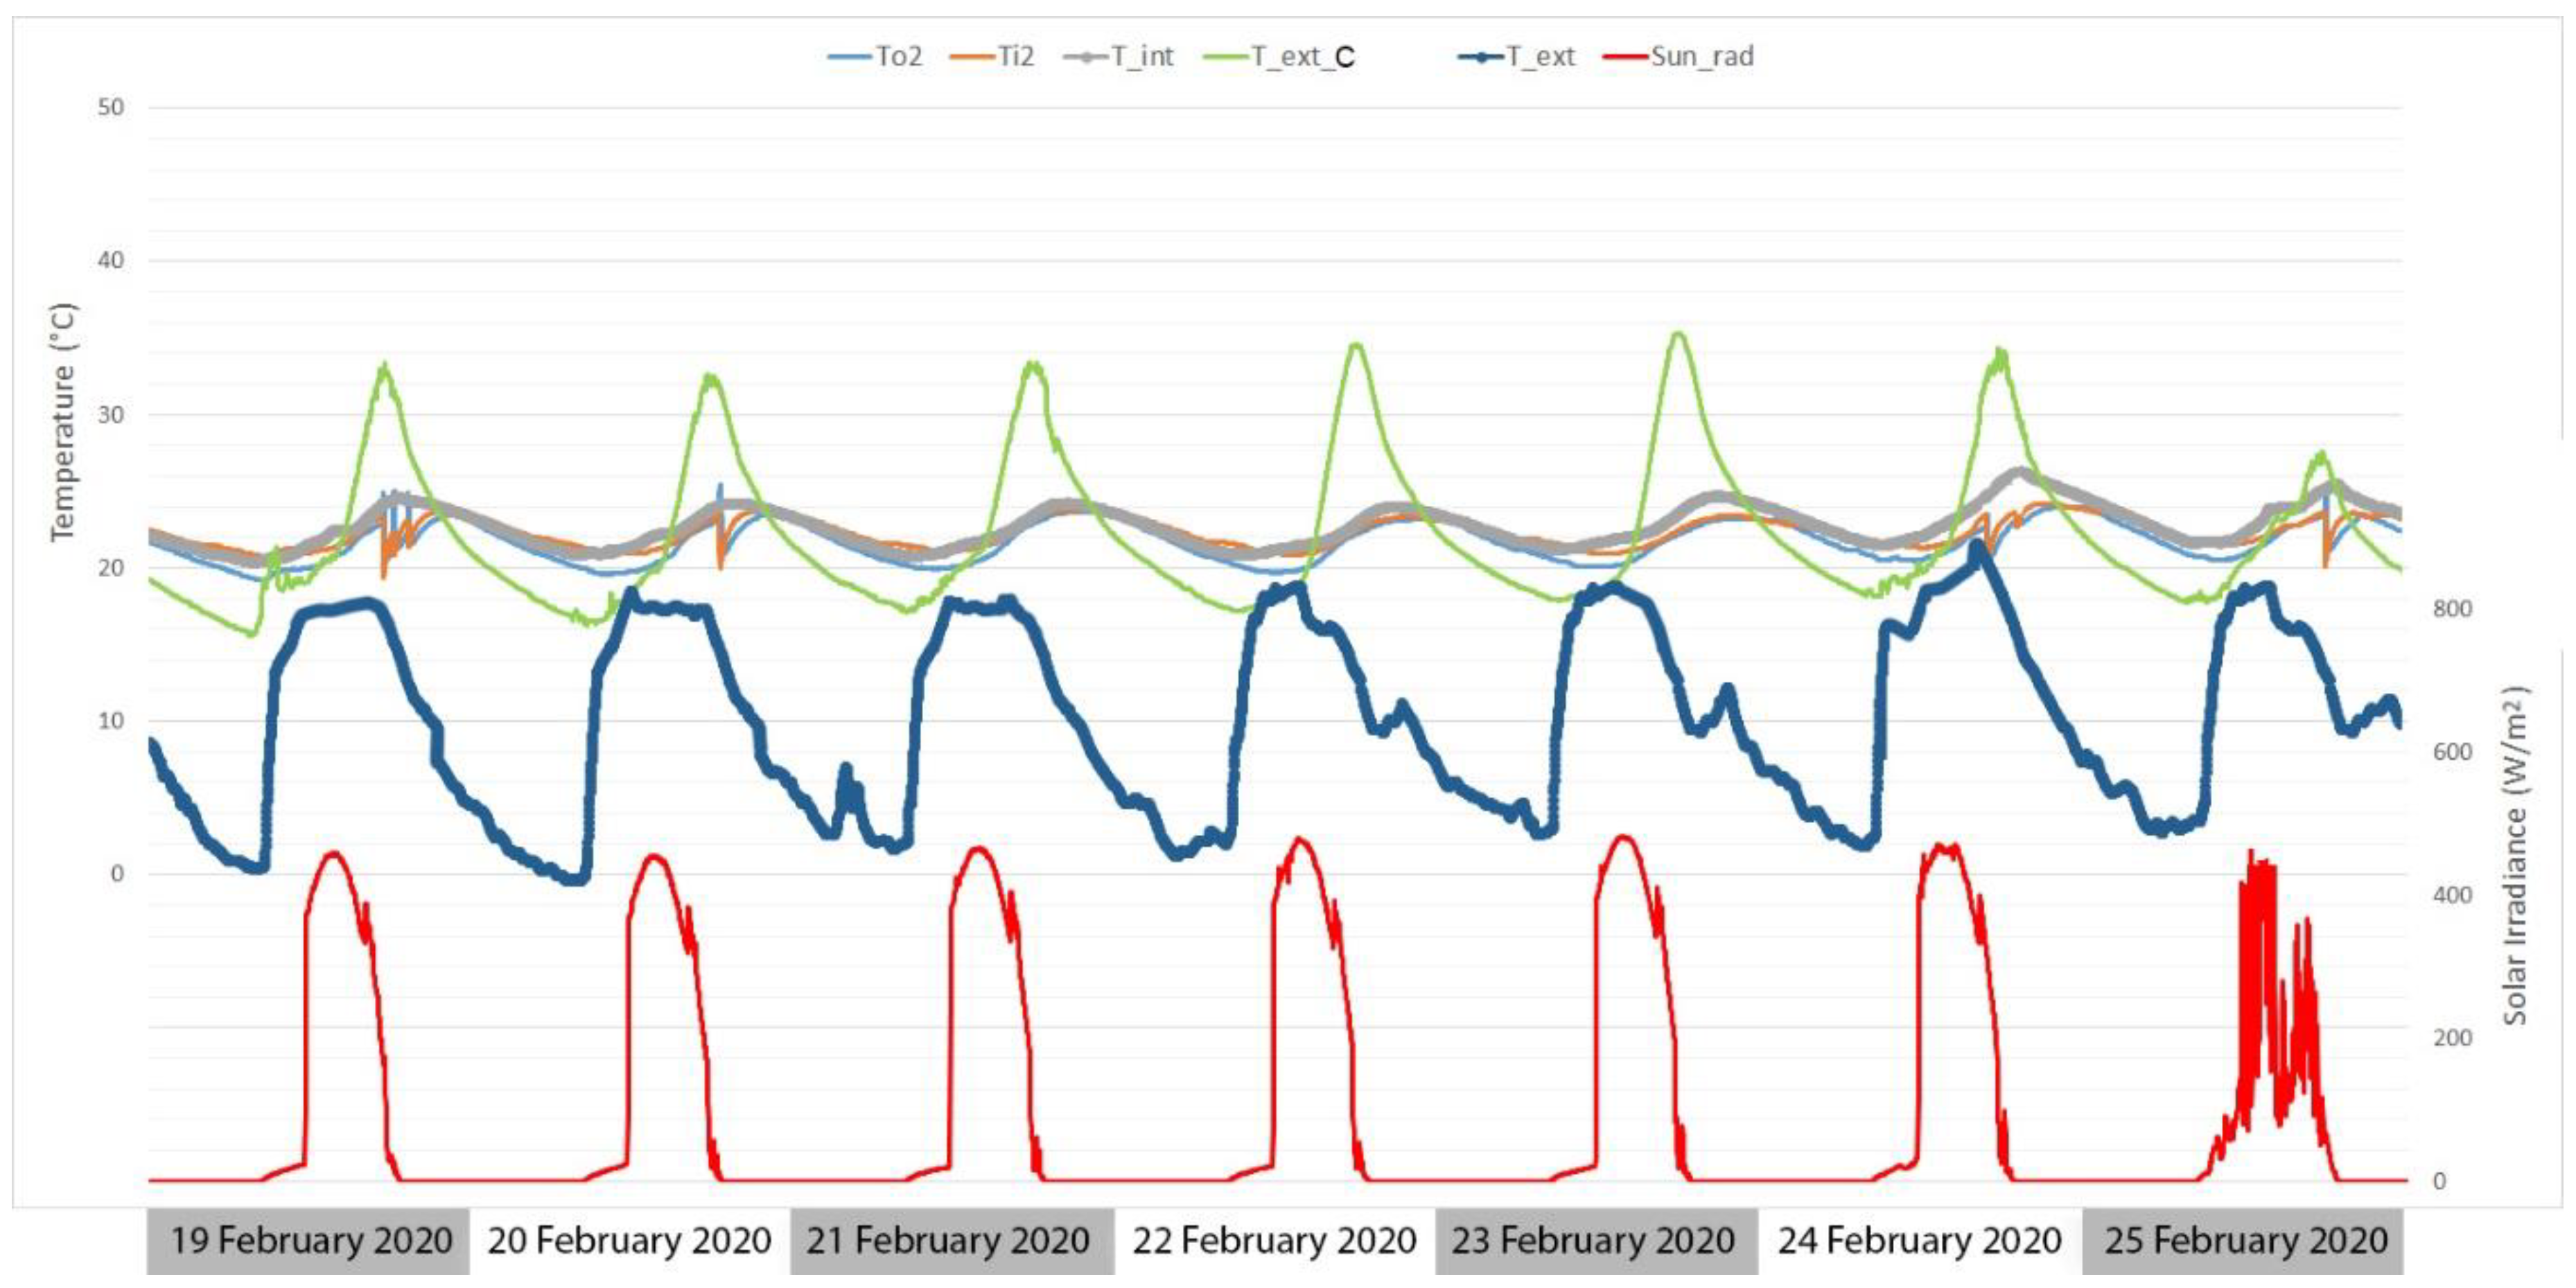
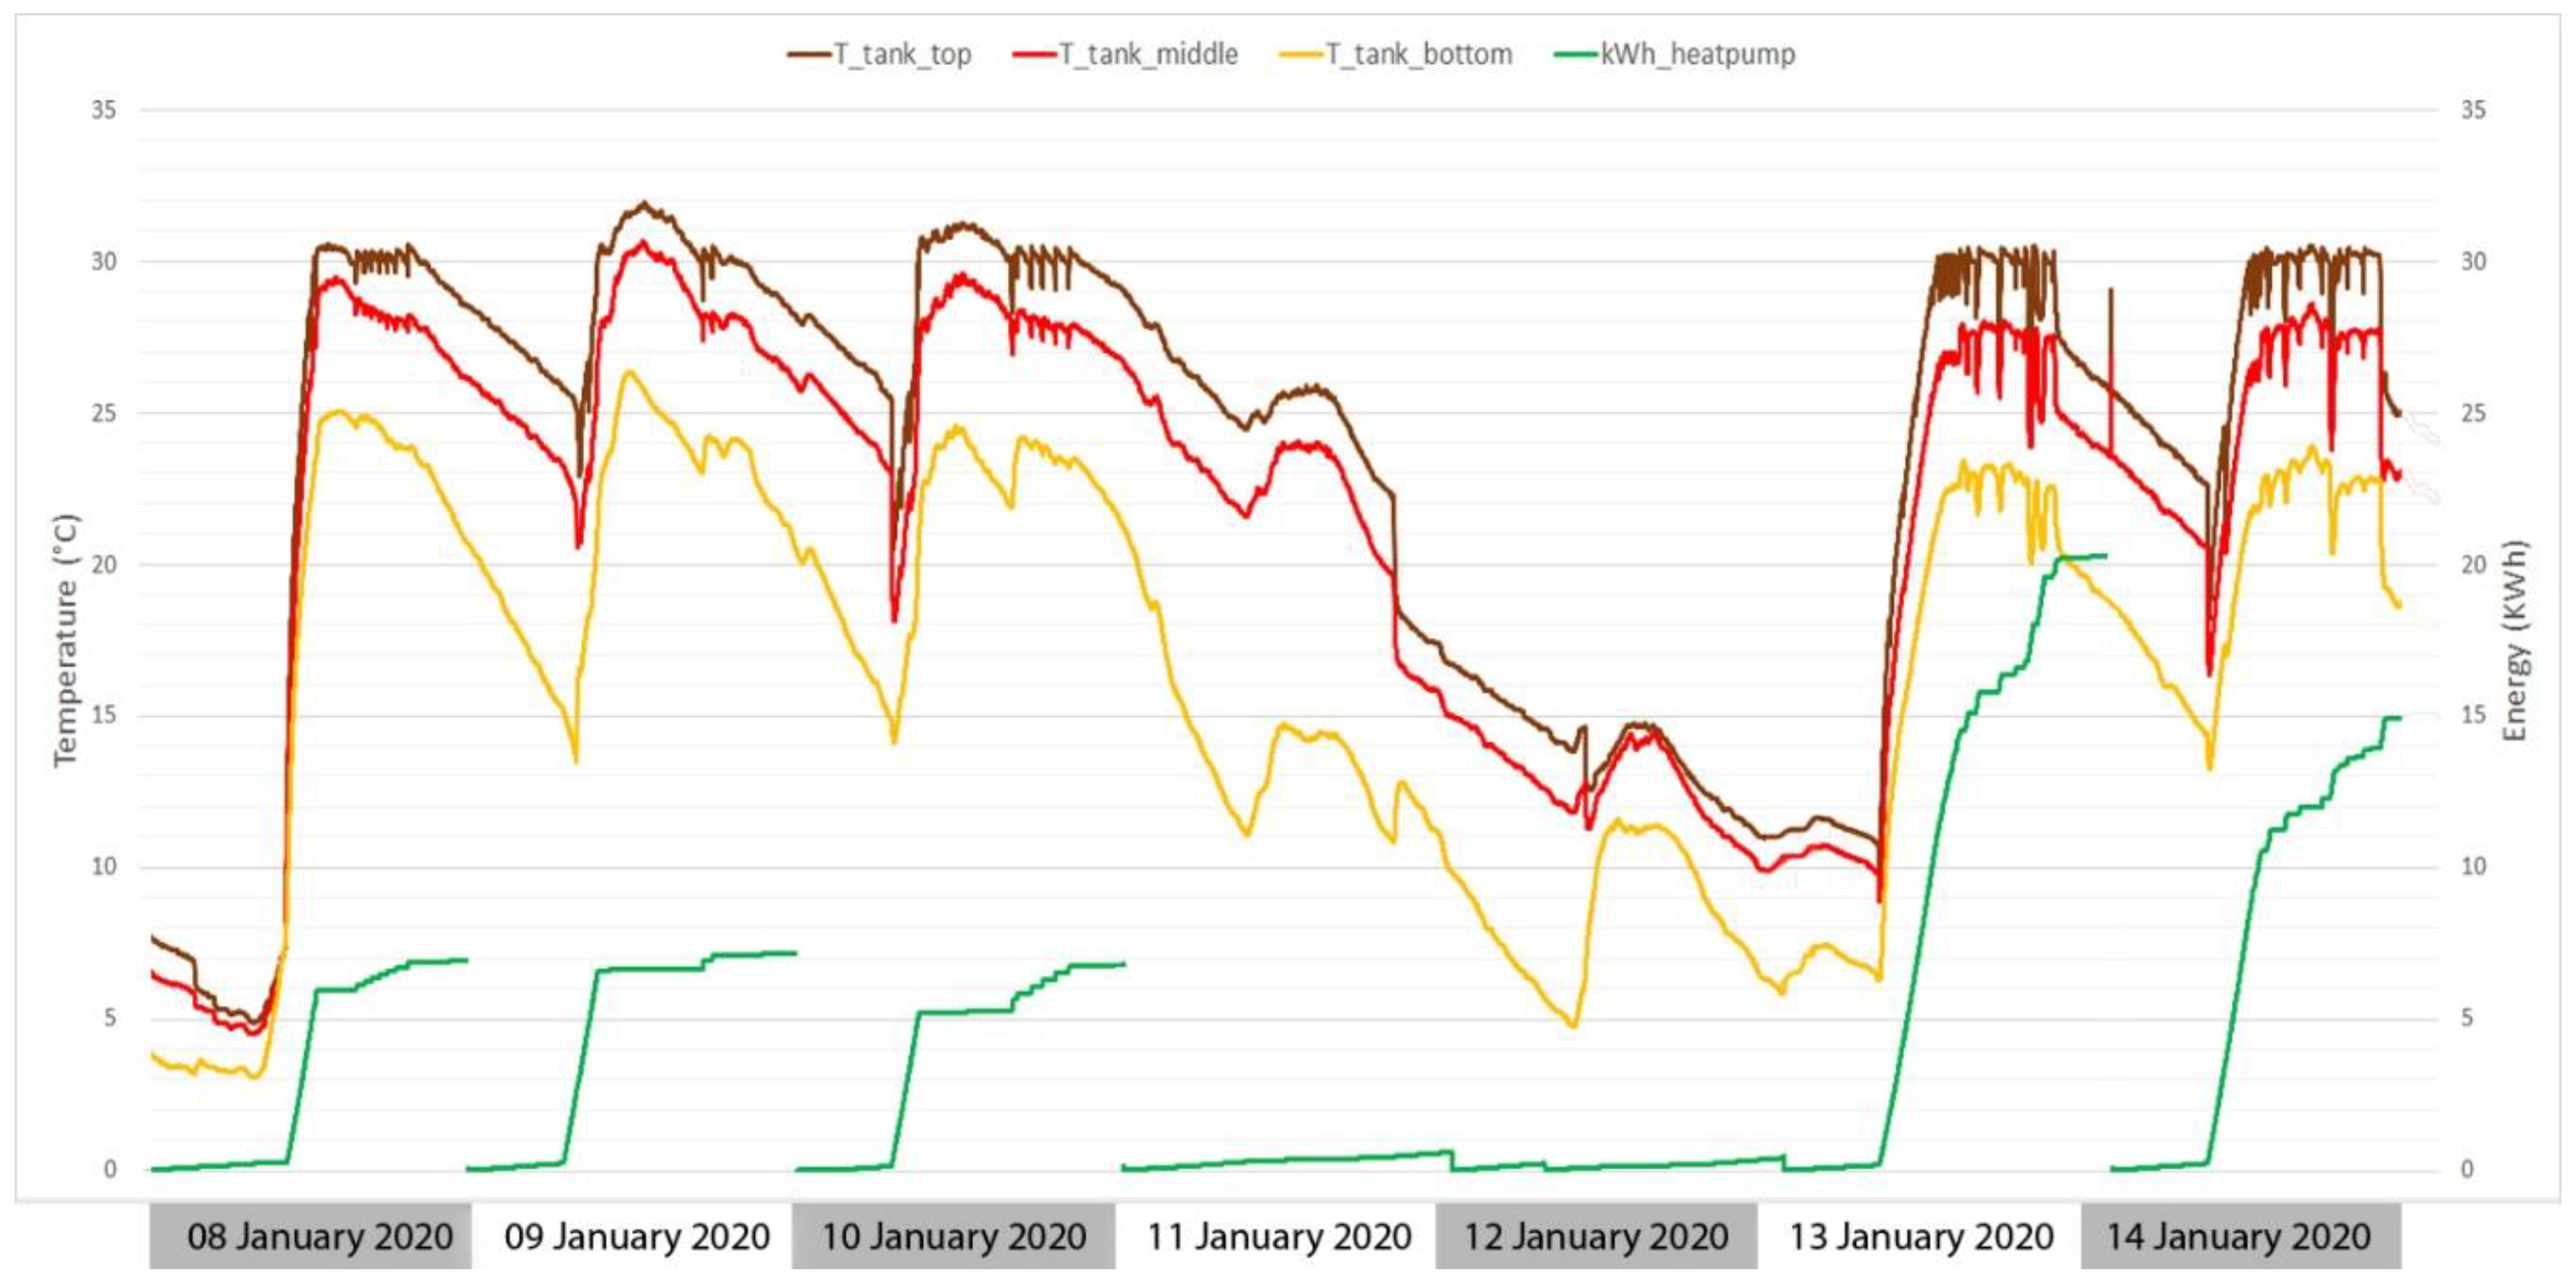
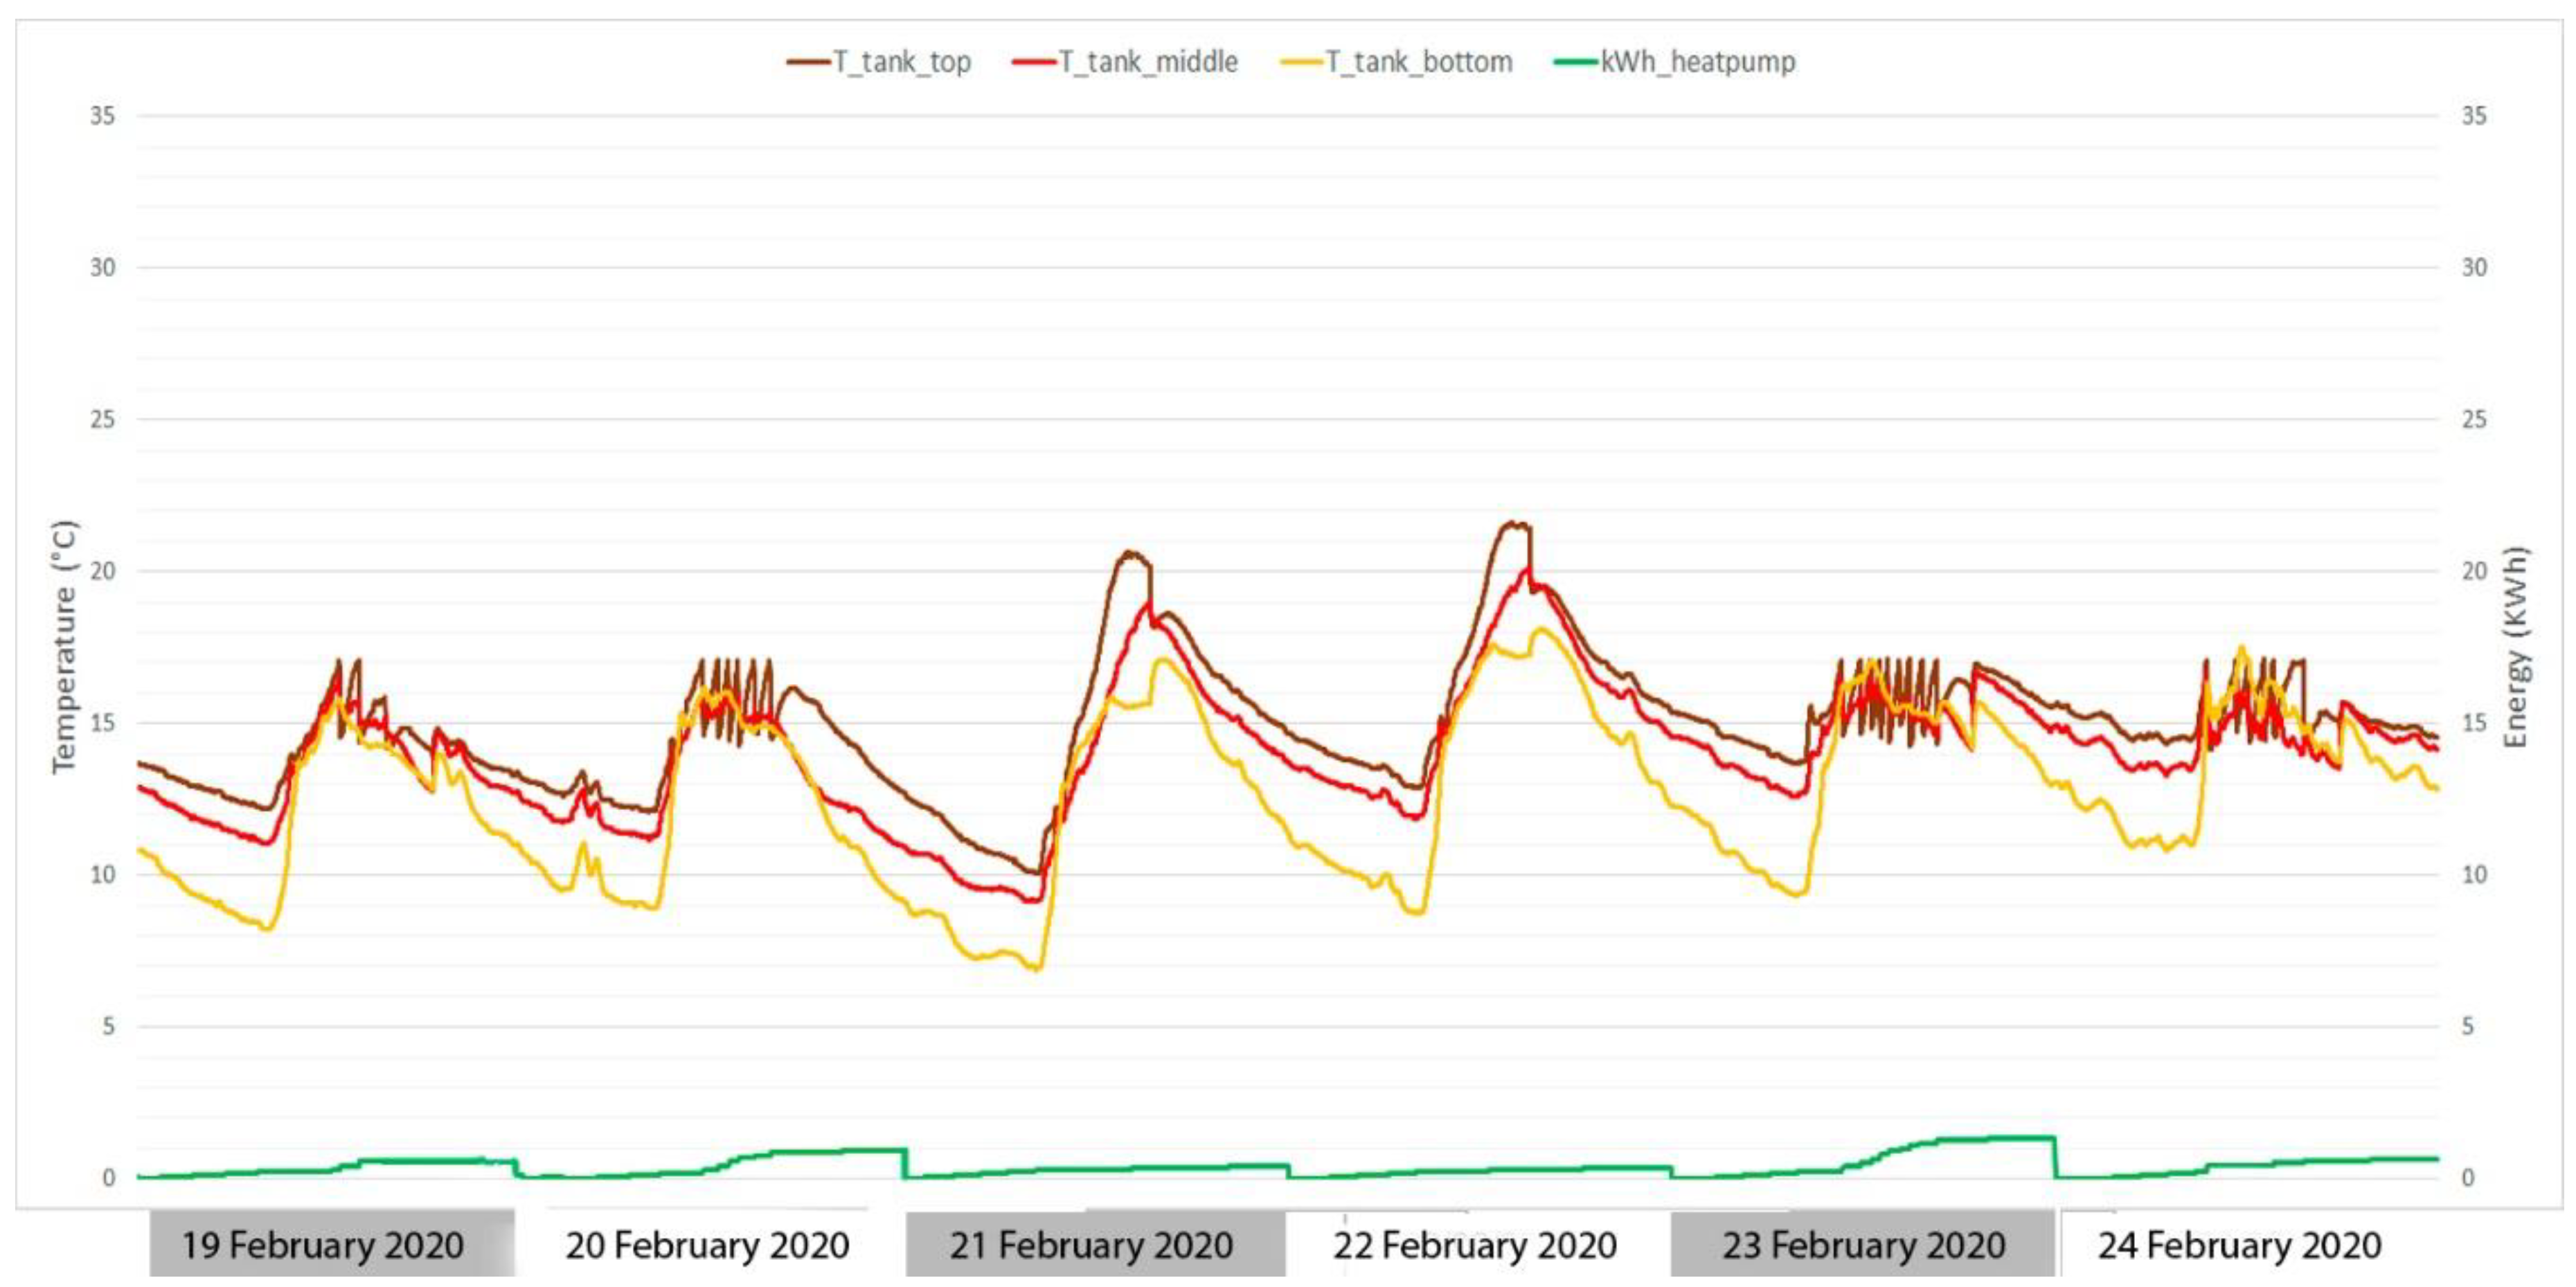
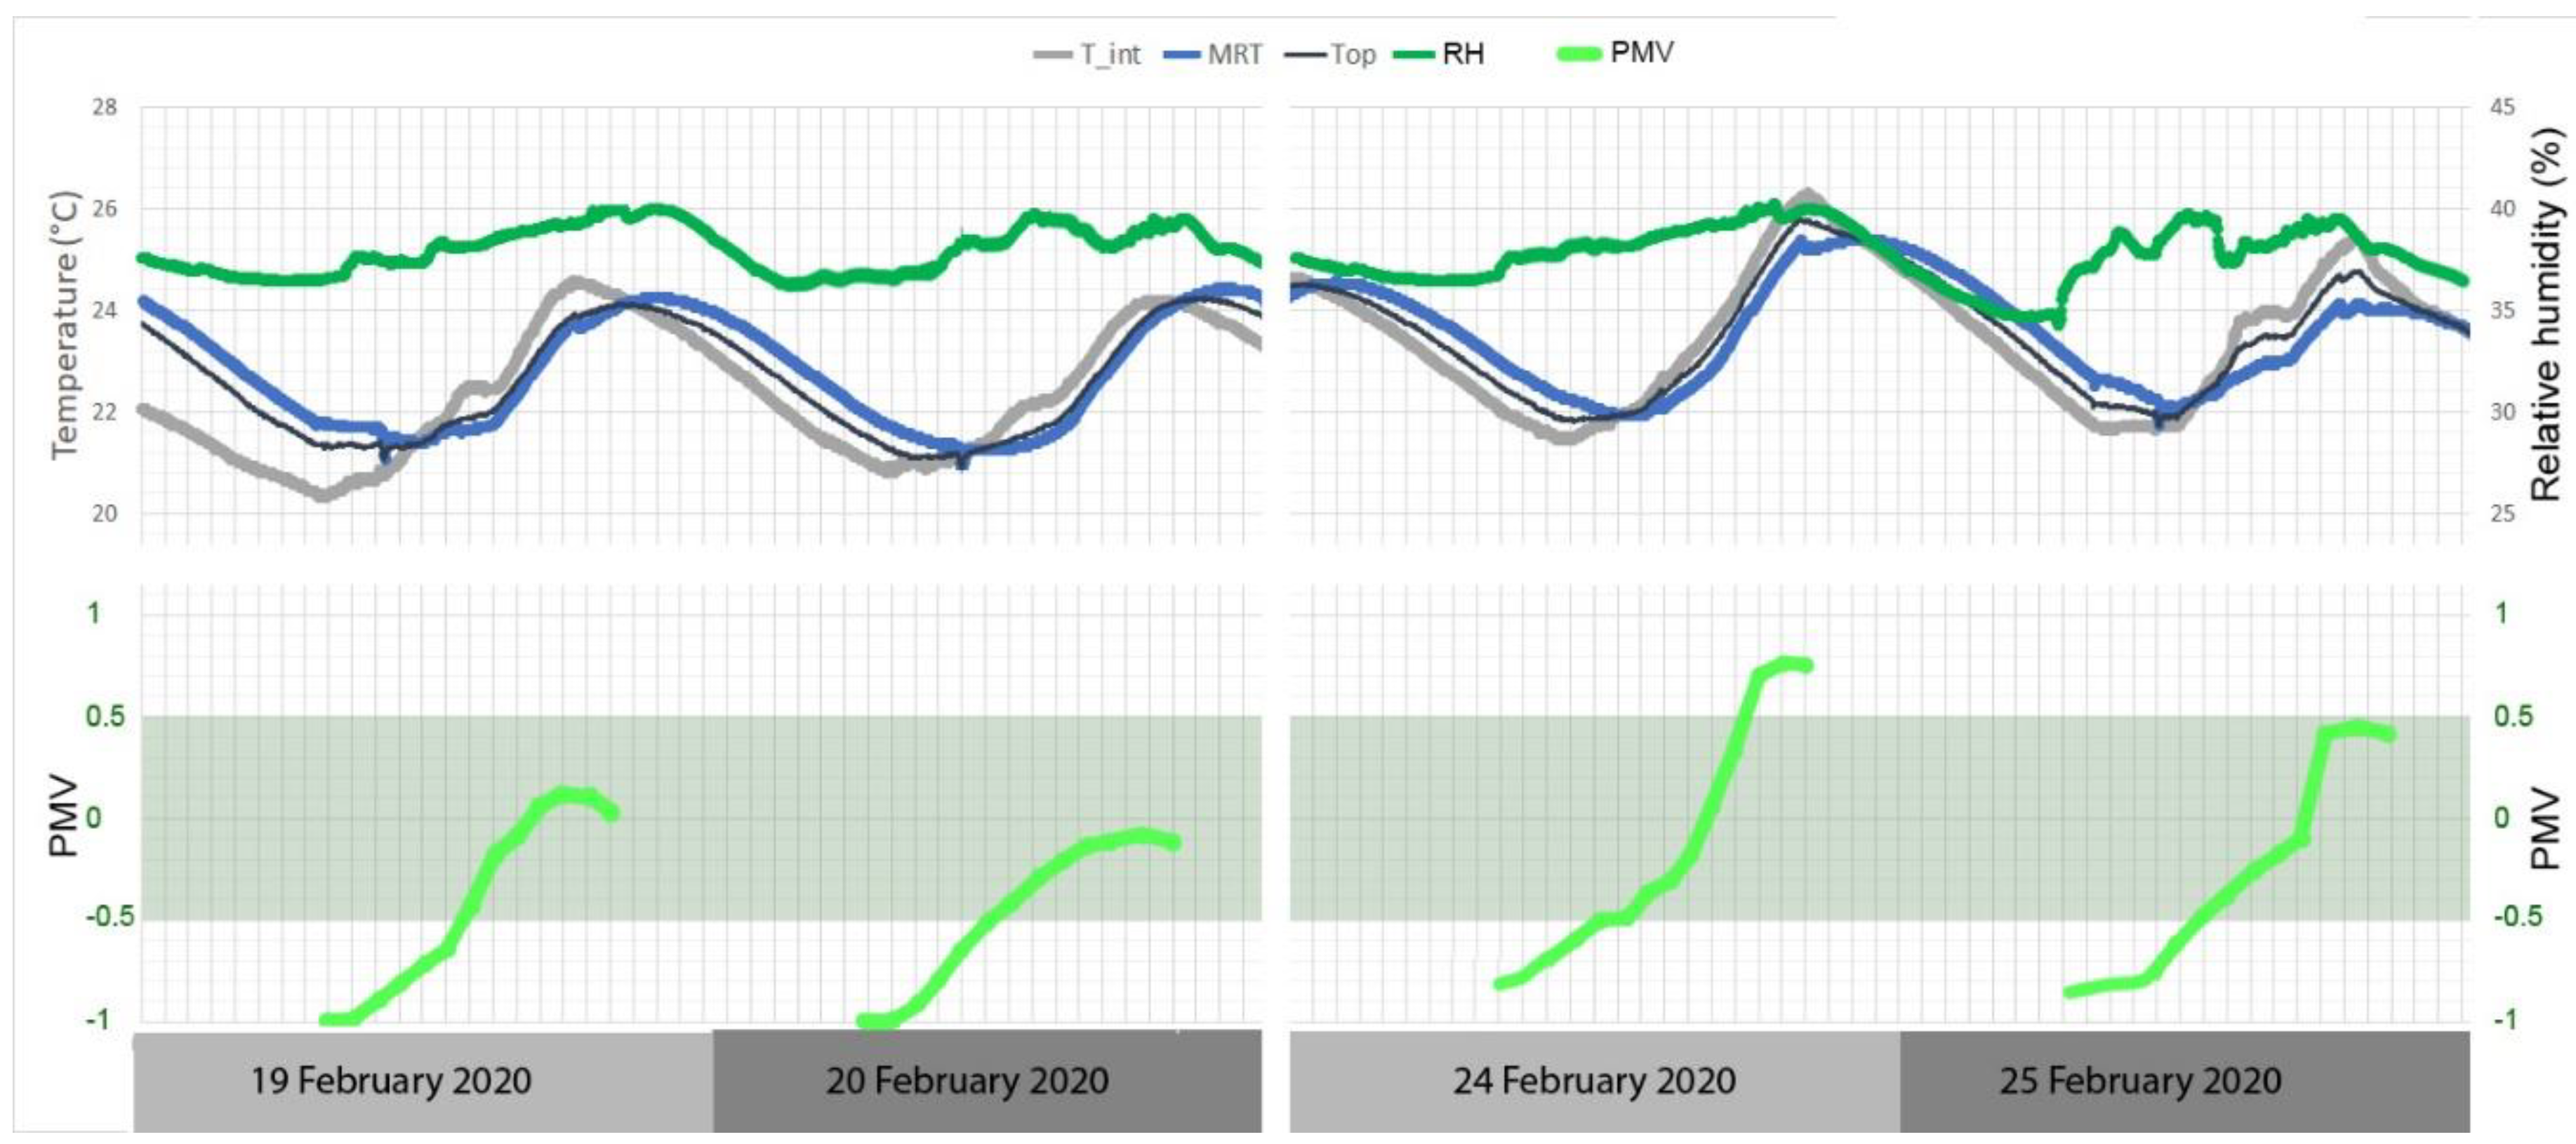
3.2. Analysis in Winter Conditions

Figure 7 shows the temperatures and the irradiance curve of a sample winter week from 08 January 2020 to 14 January 2020. On sunny working days (from 08 January 2020 to 10 January 2020), the outdoor temperature showed typical values of winter in Madrid, with a minimum temperature slightly below 0 °C and a maximum temperature between 10 and 15 °C. The solar radiation impinged on the south-west facade as of 11:00 a.m. with a peak value of 300 W/m2. The indoor air temperature (T_int) was below comfort until 7:00 p.m. because the heating system was off. In the morning, the heat pump started working, and the radiant WFG panels were delivering heat. In the afternoon, the temperature in the corridor (T_ext_C) rose to 30 °C, which helped to heat the office space air temperature (T_int) to 22 °C. The solar radiation in the afternoon made the heat delivered by the WFG unnecessary. Over the weekend (11 January 2020 and 12 January 2020), the heat pump was not operating, and the indoor air temperature declined and reached its lowest value (14 °C) on Monday 13 July 2020 at 7:00 a.m. Due to the solar radiation, the temperature in the corridor rose to 28 °C. On weekend days, the heat pump did not operate in the morning, so the indoor temperature continued to drop until the afternoon, when the solar radiation and the corridor overheating contributed to raising the indoor air temperature from 17 to 19 °C on 11 January 2020 and from 15 to 17 °C on 12 January 2020. Nevertheless, the indoor temperature on 11 January 2020 at 7:00 a.m. was 18 °C, and on 13 January 2020, it was 14 °C after two days without operating the heat pump. On working days, the indoor air temperature was above 18 °C at the beginning of the working hours. On 13 July 2020 and 14 July 2020, the solar irradiance was low, and the outdoor temperature variation over the day was only 5 °C. The heat pump operated most of the working hours, unlike on sunny days, when it operated only in the morning.
Figure 8 details the parameters on two winter days with different outdoor conditions. Figure 8a illustrates a sunny winter day when the solar irradiance reached a peak value of 300 W/m2, and the outdoor temperature ranged from −1 to 11 °C. The WFG started working in heating mode from 7:00 a.m., when the indoor air temperature was 18 °C, to 9:30 a.m., when the indoor air temperature reached 20 °C. The indoor air temperature continued to rise to 22 °C because the corridor air temperature reached a peak of 30 °C. Figure 8b shows a winter day with little solar radiation and an outdoor temperature that ranged from 4 to 10 °C. The WFG started working in heating mode at 7:00 a.m., when the indoor air temperature was 16 °C. It took the system four hours to increase the indoor air temperature to 20 °C. The heat pump was connected to the buffer tank, so the heating time seemed too long due to the thermal inertia. Starting the heat pump four hours before the working hours would be an excellent strategy to improve comfort conditions on winter days after the holidays.
Figure 9 presents a sample week of February, from 19 February 2020 to 25 February 2020. The minimum outdoor air temperature was 0 °C on 20 February 2020, and the maximum temperature was 21 °C on 24 February 2020. The indoor air temperature (T_int) in the office space maintained comfortable conditions operating in a free-floating temperature regime with zero energy consumption. The WFG circuit was never empty. During the free-floating regime, the mass flow rate was 0 and the heat pump was not in operation. Temperature in the corridor (T_ext_C) showed peak values above 32 °C in the afternoon. The solar irradiance on the west facade (Sun_rad) reached a peak of 480 W/m2.
Figure 10 illustrates the performance on two consecutive February days. Although the minimum outdoor air temperature was 0 °C on 19 February 2020 and 20 February 2020, the peak solar radiation (440 W/m2) increased the temperature inside the studied office in the afternoon. When the indoor air temperature reached 25 °C, the water inlet temperature dropped, and the outlet temperature was above the inlet. As stated in Table 3, the heat pump was set to operate in cooling mode when indoor temperature was above 25 °C. The heat pump cooled down water three times between 5:00 p.m. and 7:00 p.m. on 19 February 2020, and only once at 6:30 p.m. on 20 February 2020.
Table 6 shows a summary of the energy performance on four days in different seasons. On 10 July 2019, the system was working in cooling mode. The heat removed from the office space by the transparent WFG (kWh_WFG) and by the translucent partitions (kWh_WFG_TP) was 4.9 KWh. The transparent WFG absorbed the most significant amount of heat during the working hours because of the high mass flow rate ( = 2 L/min m2), whereas the translucent interior partitions performed better during the night. The contribution of the air heat exchanger (kWh_AXH) during the night was negligible compared with the heat pump, which operated from 7:00 a.m. to 8:00 p.m.
On 09 January 2020, the heat delivered by the translucent WFG (KWh_WFG_TP) was 18.7 kWh, whereas the total amount of energy delivered by the transparent WFG (KWh_WFG) was 3.4 kWh. In the afternoon, the transparent WFG circuit was stopped to allow solar radiation to enter the office space. The translucent WFG supplied most of the heat during the working hours. The thermal energy delivered by the heat pump (kWh_HP) was 7.12 kWh from 7:00 a.m. to 11:00 a.m. In the afternoon, the thermal inertia of the tank and the solar radiation made it unnecessary to operate the heat pump again. On 14 January 2020, the contribution of the transparent WFG was higher because there was little solar radiation in the afternoon. The heat pump operated over the working hours and released twice as much thermal energy as on 09 January 2020.
On 20 February 2020, the system was working in cooling mode. The air heat exchanger (kW_AXH) was cooling down the buffer tank during the night, and the heat pump operated during the working hours. The heat removed by the translucent WFG (kWh_WFG_TP) was 4.8 kWh. The energy delivered by the heat pump was 0.6 kWh, and the thermal inertia of the buffer tank was enough to keep indoor temperature between 20 and 26 °C. In Section 4.4, these conditions are assessed to evaluate the occupants’ comfort.

4. Discussion

Radiant WFG panels were part of the heating and cooling system. They impact the indoor air temperature and help reduce the mean radiant temperature and, therefore, the operative temperature. The thermal problem of the glazing is coupled with the thermal problem of the room, and the indoor temperatures should be measured.

4.1. Validation of Energy Management System

The power released or absorbed by the water (P) is measured in watts per square meter (W/m2), and is shown in Equation (1).
P = m ˙ c ( T O T i ) ,
where is the mass flow rate (Kg/s m2), c (J/Kg °C)is the specific heat of the water, and To and Ti are the temperatures of water leaving and entering the glazing, respectively (°C). The mass flow rate is the mass of a fluid passing by a point over time. In summer conditions, the transparent WFG was set to operate during working hours. It had to absorb most of the solar radiation impinging on the glazing. Figure 11 illustrates the buffer tank temperatures and the thermal energy provided by the heat pump in a sample summer week. The top tank temperature (T_tank_top) showed that the heat pump was set to work when T_tank_top was between 15 and 18 °C. On 10 July 2019, it worked at three cycles per hour. The following days, it was fixed to operate at a minimum time between starts of forty minutes. Over the weekend, the heat pump did not operate, and the buffer tank temperature reached 35 °C. The maximum power delivered by the heat pump (31.13 kWh) took place on 11 July 2019, when the solar irradiance reached its maximum value without any obstructions, according to Figure 5.
When the heat pump was working in the heating mode in winter conditions, the transparent WFG was set to operate in the morning. It did not operate in the afternoon because the solar radiation on the south-west partition helped reduce the heating load. Figure 12 shows the tank temperatures (T_tank_top, T_tank_middle, T_tank_bottom) and the thermal consumption of the heat pump (kWh_heatpump) measured with the water flow rate and the difference of water temperature between the inlet and outlet in the heat pump. On sunny days, the heat pump operated mainly in the morning because the solar radiation heated up the office space in the afternoon. On 09 January 2020, when the outdoor air temperature ranged from −1 to 11 °C and a peak solar radiation of 300 W/m2, the heat pump heated the buffer tank from 7:00 a.m. to 9:00 a.m. The thermal inertia of the tank and the solar radiation in the afternoon made it unnecessary to operate the heat pump again. The total energy consumption per day was 7.12 kWh. The average heat pump thermal energy was 7 kWh on 08 January 2020, 09 January 2020, and 10 January 2020, whereas on Monday 13 January 2020, a cloudy winter day after non-working days, the total energy consumption was 20.05 kWh. The warm-up response was too low, and it took four hours to raise the temperature to comfort conditions. Over the weekend, the tank temperature dropped, and this made it necessary to increase the energy supplied by the heat pump. The lack of solar radiation in the afternoon was the reason to operate the heat pump until the end of the working hours.
Figure 13 shows the tank temperatures (T_tank_top, T_tank_middle, T_tank_bottom) and the thermal consumption of the heat pump (kWh_heatpump) on six February days. The heat pump operated in cooling mode and cooled down the top tank temperature in the afternoon. On 21 February 2020 and 22 February 2020, the heat pump did not operate, and the buffer tank was in a free-floating regime. The average energy consumption per day was 1 kWh on working days. The difference between the heat pump consumption on 14 January 2020 (15 kWh) and on 20 February 2020 (1.1 kWh) can be explained because the peak solar radiation on 09 January 2020 was below 300 W/m2, and the outdoor temperature was above 10 °C for four hours. On 20 February 2020, the peak solar radiation was 450 W/m2, and the outdoor temperature was close to 18 °C for 7 h.

4.2. Estimation of Final Energy Consumption

Table 7 and Table 8 show the estimated heating (positive) and cooling (negative) loads. Ventilation loads (Vent) were calculated with the number of occupants (n) at each hour. Internal loads (IH) are calculated with the number of occupants, the metabolic rate of typical office activity, and 20 W/m2 for lighting and equipment. Solar radiation (SR) was taken from Figure 6a with a surface area of 7.8 m2 and a solar heat gain coefficient of 0.5. The same procedure was repeated to calculate the values on five sample days.
Table 9 and Table 10 compare the thermal energy consumption of the air-to-water heat pump with the calculated cooling and heating loads. The values are taken from Figure 11 and Figure 12 (kWh_heatpump) and Table 7 and Table 8 by adding the heating and cooling loads over the working hours.
Final energy (FE) consumption, non-renewable final energy (NRFE) consumption, and the CO2 emissions in kg are primary energy factors in calculating the energy performance of buildings, according to the Energy Performance of Buildings Directive (EPDB 2018) [39]. The Spanish regulation of building thermal systems (RITE) recommends a conversion factor between final energy (FE) and non-renewable final energy (NRFE) of 1.954 [40]. The factor of emitted CO2 for electricity is 0.331. The final energy consumption and CO2 emissions were calculated with two different heat pumps. Table 11 illustrates the performance of the air-to-water heat pump in cooling and heating mode. The performance depends on the outlet temperature of the WFG (To = 15 °C in summer, To = 30 °C in winter) and the source inlet temperature in the heat pump (Ts,i = 20–35 °C in summer, Ts,i = 15–20 °C in winter). The outdoor temperature, T_ext, is shown in Figure 5 and Figure 7, respectively. Ts,i values were taken from the top tank temperatures (T_tank_top) shown in Figure 11 and Figure 12. The air-to-water heat pump shows a better coefficient of performance (COP) when the water temperature is close to 35 °C and a better energy efficiency ratio (EER) when the water temperature is close to 18 °C. The top tank temperatures (T_tank_top) in Figure 11 and Figure 12 confirmed the range of optimal operating temperatures. Although the actual heat pump electrical energy consumption has not been measured, the estimated COP and EER have been taken from [41].
Air-to-air heat pumps were also analyzed using the cooling and heating loads from Table 9 and Table 10. The parameters that influence air-to-air heat pump performance are the dry bulb exterior air temperature (T_ext_db) and the dry bulb interior return air temperature (Tri_db). Table 12 shows the final energy (FE), non-renewable final energy (NRFE), and the emitted CO2 for electricity of the air-to-air heat pump.
The radiant WFG panel system coupled with a buffer tank and air-to-water heat pump showed non-renewable final energy (NRFE) consumption of 72.13 kWh in cooling mode and 24.29 kWh in heating mode, whereas the expected values of an air-to-air system were 93.56 kWh and 32.05 kWh in the studied summer and winter weeks. This resulted in a final energy savings of 23% in summer and 24% in winter. The reductions of CO2 emissions were 3.63 kg/week in summer and 1.32 kg/week in winter. As stated in Section 2.1, the ventilation device was not a component of the energy management system, and its performance was not controlled. The ventilation load was estimated by multiplying the air flow by the specific enthalpy (kJ/kg) difference between indoor and outdoor conditions. In summer, the specific enthalpy of outdoor air at 31.3 °C with 35% relative humidity was 58.8 kJ/kg. At 26 °C and 36% relative humidity, the indoor air specific enthalpy was 46.7 kJ/kg. At a ventilation air flow rate of 75 L per second, the total ventilation cooling load over 12 h was 10.8 kWh. In winter, the indoor and outdoor specific enthalpy were 37.11 kJ/kg and 16.36 kJ/kg, respectively, and the ventilation load over the working hours was 13.24 kWh. The electrical consumption of the ventilation device, including the engine and the fan, was 3.24 kWh [42].
The non-renewable energy consumption was 72 kWh in a summer week and 24 kWh in a winter week. The expected energy consumption projection throughout the year was 1700 kWh with a floor area of 40 m2. Therefore, the yearly heating and cooling energy consumption per m2 was 42.5 kWh/m2 per year. If the average energy savings compared to an air-to-air heat pump with multi-split were 23%, the total non renewable energy consumption (NREC) savings accounted for 391 kWh/year. The average price of electricity in Spain is 0.12 EUR/kWh [22], and the system overcosts compared to traditional indoor wall partitions plus the split system can be 50 EUR/m2. For 24 m2 of radiant WFG panels, the expected payback period would be 20 years. WFG technology is not competitive nowadays, so future research is needed in industrialization and standardization to bring down the initial costs.

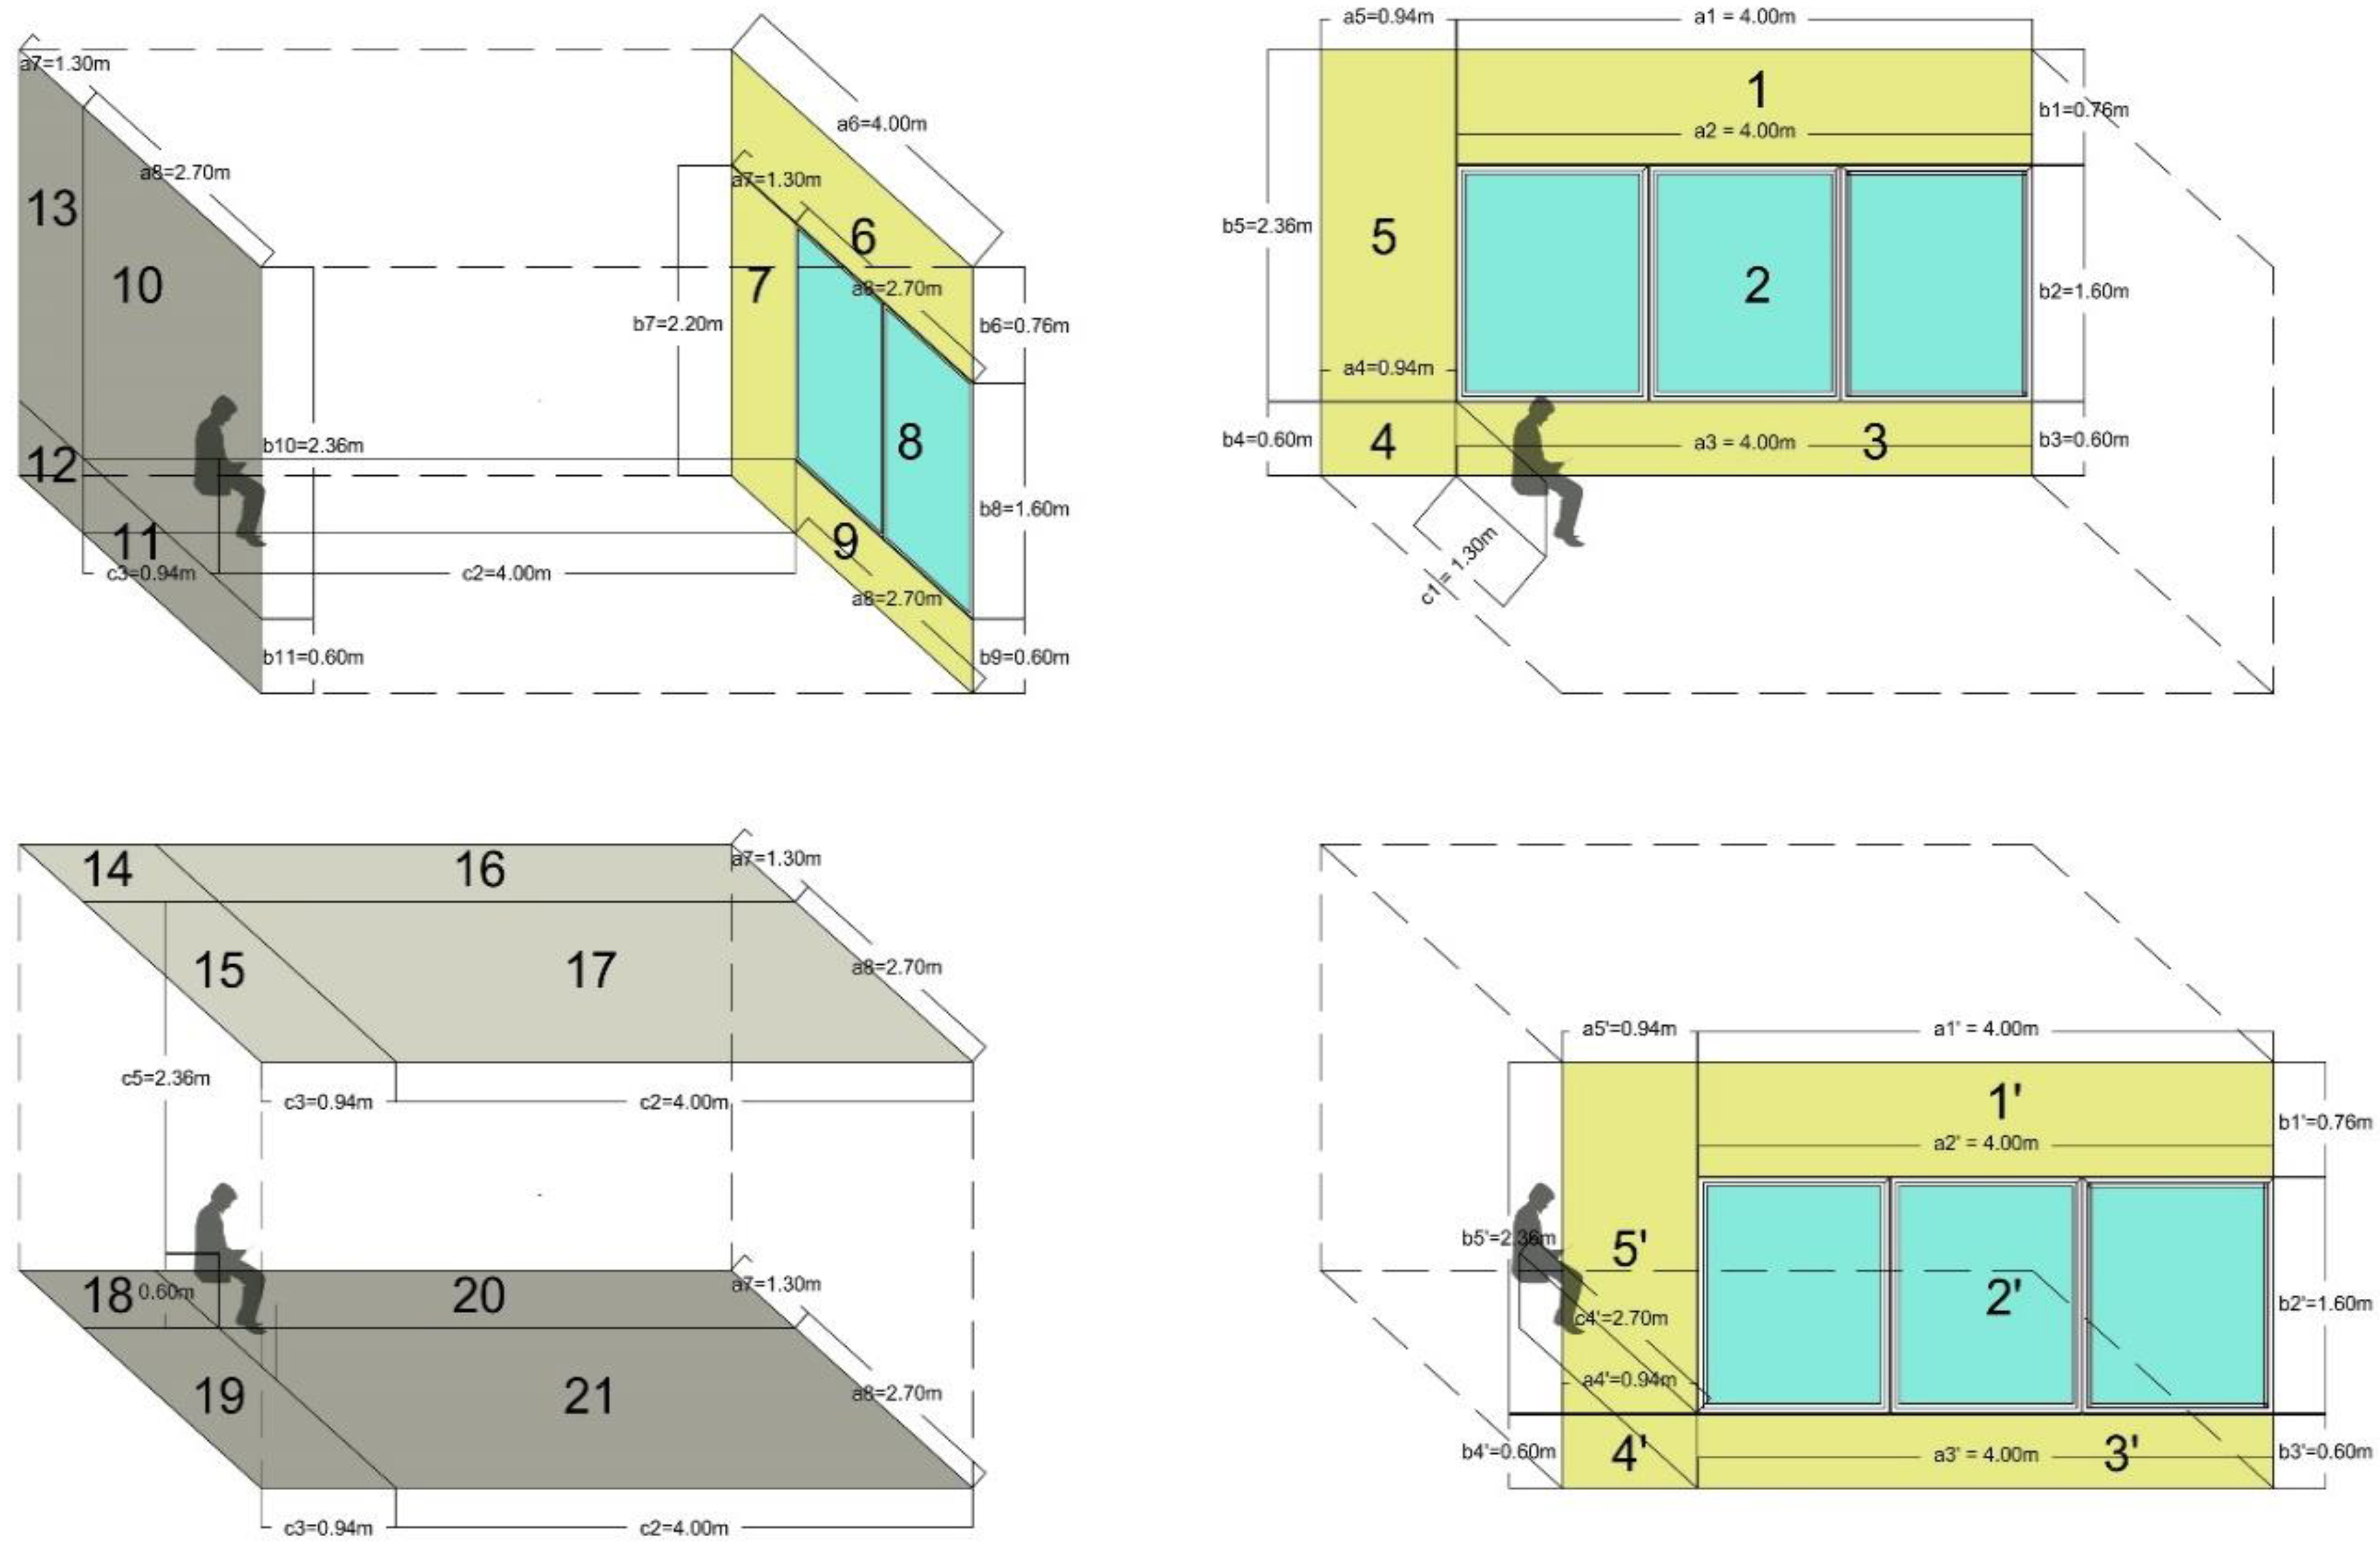
4.3. Mean Radiant and Operative Temperatures

Mean radiant temperature (MRT) expresses the influence of surface temperatures in the room on occupant comfort. The area-weighted method shown in Equation (2) is a simple way to calculate MRT, but it does not reflect the geometric position, posture, and orientation of the occupant, ceiling height, or radiant asymmetry [29]. In Equation (3), the calculation of mean radiant temperature from surrounding surfaces considers the surface temperatures of the surrounding elements and the angle factor. The angle factor is a function of shape, size, and the position concerning the occupant standing or being seated. The surfaces of the room are assumed as black, with high emissivity and no reflection. In this case, the angle factors weight the enclosing surface temperatures to the fourth power [28].
T m r = T 1 A 1 + T 2 A 2 + + T N A N A 1 + A 2 + + A N ,
T ¯ m r 4 = T 1 4 F p 1   + T 2 4 F p 2   + + T N 4 F p N   ,
where
  • Tmr = mean radiant temperature, °C,
  • TN = surface temperature of surface N, °C (calculated or measured),
  • AN = area of surface,
  • Fp-N = is the angle factor between the person and surface N.
The angle factors quantify the amount of radiation energy that leaves the human body and reaches each surface. They were calculated according to Figures B.2 to B.5 in [28]. If the difference between the indoor surface temperatures is relatively small (<10 °C), Equation (4) can be used.
T ¯ m r = T 1 F p 1   + T 2 F p 2   + + T N F p N  
The MRT is calculated as the average value of the surrounding temperatures weighted according to the angle factors. If the temperature difference between indoor surfaces is below 10 °C, then the MRT error calculated with Equation (4) will be less than 0.2 °C [28]. Equation (5) shows the formula to calculate the angle factor [43].
F p N = F m a x   ( 1 e ( a / c ) τ ) ( 1 e ( b / c ) γ ) ,
where
  • γ = A+B(a/c),
  • τ = C+D(b/c) + E(a/c).
Parameters a, b, and c, defined in Figure 14, are related to dimensions and distances between the occupant and the envelope. Table 13 shows the parameters A, B, C, and D to calculate angle factors for seated persons and walls, floors, and ceilings.
Figure 14 illustrates the dimensions and geometry of the office space and the different surfaces considered to calculate the MRT for a seated person. The facing direction was ignored for simplification. The temperature of each rectangle (1 to 21) was measured to calculate the MRT. Due to small differences, only five temperatures have been taken into account. T1 = T6 = T1′ = T14 = T15 = T16 = T17 = Tceiling; T3 = T3′ = T4 = T4′ = T9 = T11 = T12 = T18 = T19 = T20 = T21 = Tfloor; T7 = T5 = T5′ = Twall; T8 = TWFG; T2 = T2′ = TWFG_TP.
A rough approximation to obtain the operative temperature may be to use the arithmetic average of the mean radiant temperature (MRT) of the heated space and dry-bulb air temperature if air velocity is less than 0.2 m/s and MRT is less than 50 °C. In cases where the air velocity is between 0.2 and 1 m/s, or where the difference between mean radiant and air temperature is above 4 °C, the ASHRAE 55 provides a formula, shown in Equation (6), to calculate operative temperature [27].
T o p = A   T a   + ( 1 A )   T m r   ,
where
  • Top = operative temperature (°C),
  • Ta = indoor air temperature (°C), and
  • Tmr = mean radiant temperature (°C).
The value of A can be found in Table 14 as a function of the relative air speed, vr.
Figure 15 illustrates the indoor relative humidity (RH), the surface temperature of indoor surfaces, and the MRT calculated according to Equation (4). The WFG panel temperatures (TWFG, TWFG-TP) contribute to cooling the mean radiant temperature down to 20 °C when the energy management system is in operation. TWFG was lower than TWFG-TP because the mass flow rate through the transparent panels was set to = 2 L/min m2, and through the translucent interior partitions, it was = 1 L/min m2. Another reason to explain the temperature difference was that each transparent WFG has its circulating device, whereas the translucent panels share the same circulating device. The former has proven to be more effective in delivering the cold from the heat pump than the latter. Floor, opaque walls, and ceiling temperatures (Tfloor, Twall, Tceiling) are taken into account with their angle factors, which are calculated according to Equation (5).

4.4. Predicted Mean Vote (PMV)

The Predicted Mean Vote (PMV) model uses six key factors to address thermal comfort: metabolic rate, clothing insulation, air temperature, radiant temperature, airspeed, and humidity. These factors may vary with time; however, in this article, the airspeed, metabolic rate, and clothing insulation are considered steady. Compliance with the ASHRAE-55 standard is tested using the CBE Thermal Comfort Tool. This tool, developed at the University of California at Berkeley, allows designers to calculate thermal comfort according to ASHRAE Standard 55-2017. The indoor air temperature and the MRT were taken from Figure 15 during operating hours. Clothing was set as 0.8 Clo (typical office indoor clothing); the metabolic rate was set as 1 Met (sedentary activity), the relative humidity was taken from Figure 14, and air velocity was set as 0.10 m/s (mean air velocity of the day). The ASHRAE-55 Comfort Zone, shaded in gray in Figure 16, represents the recommended predicted mean vote, between −0.5 and +0.5, for buildings where the occupants have metabolic rates of between 1.0 met and 1.3 met, and clothing provides between 0.5 clo and 1.0 clo of thermal insulation. Figure 16 illustrates the variations of the predicted mean vote (PMV), mean radiant temperature (MRT), indoor air temperature (T_int), and operative temperature (Top) on four summer days. The PMV over the working hours ranged from −0.04 to −0.42 on 10/07/2019, while the MRT ranged from 23.0 to 19.3 °C, and the indoor air temperature ranged from 25.2 to 27.4 °C. During the working hours, the highest indoor temperature was on 11 July 2019 at 8:00 p.m., when the MRT was 20.1 °C and the predicted mean vote was 0.1, very close to the optimum value. Similar values are shown over the four days.
The comfort zone is defined by the combinations of the six key factors for thermal comfort. The PMV model is calculated with the air temperature and mean radiant temperature in question along with the applicable metabolic rate, clothing insulation, airspeed, and humidity. If the resulting PMV value generated by the model is within the recommended range, the conditions are within the comfort zone. Table 15 defines the PMV range for the thermal sensation scale. For 1.1% of the working hours, the PMV was above +0.4; for 6.7%, the PMV was from 0 to +0.2; for 32.3%, the PMV was from 0 to −0.2; for 54.3%, the PMV was from −0.2 to −0.4; and for 5.6% of the time, the PMV was below −0.4. Despite the high indoor air temperature, the PMV showed that occupants would describe their comfort conditions as “Slightly Cool” and always within the recommended limits specified by ASHRAE-55 (−0.5 < PMV < +0.5). The transparent WFG provided the partition exposed to solar radiation with a temperature that prevented thermal asymmetry and a lack of comfort. Hence, the results in Figure 15 indicated that the system gave consistent performance and provided comfortable conditions.
The same comfort analysis was carried out in February. Figure 17 illustrates the variations of the predicted mean vote (PMV), mean radiant temperature (MRT), indoor air temperature (T_int) and operative temperature (Top), and relative humidity (RH) on four February days. As shown in Figure 9, the conditions on sunny winter days are required to operate the heat pump in cooling mode in the afternoon. The indoor air temperature dropped to 20.5 °C on 19 February 2020 at 8:00 a.m., and reached 27 °C on 24 February 2020 at 7:00 p.m. The relative humidity ranged from 35% to 40%. The PMV over the working hours ranged from −1 on 19 February 2020 to 0.8 on 24 February 2020. Both values are out of the comfort range. In the morning, the PMV on the four days was below −0.5, so the occupants would describe their comfort conditions as “Slightly Cool” or “Cool”. The heat pump was set to operate in heating mode when the indoor temperature was below 20 °C, and that condition was not met. On 24 February 2020, the PMV was above 0.5 from 5:00 p.m. to 8:00 p.m. Even though the heat pump was operating in cooling mode, the occupants would describe their comfort conditions as “Slightly Warm” or “Warm”. For 45% of the working hours, the predicted mean vote was below −0.5, out of the shaded area representing the recommended comfort range. For 8% of the working hours, the predicted mean vote was above the comfort range when the indoor temperature surpassed 25.5 °C, and the WFG temperature was not low enough to bring down the mean radiant temperature.

5. Conclusions

This paper has studied the energy performance of innovative building envelopes (facade and internal partitions), such as water flow glazing (WFG), coupled with an energy management system, as well as the relationships with steady and transient parameters. The energy strategies varied from a free-floating temperature regime on sunny winter days to the air-to-water heat pump, air heat exchanger, and buffer tank in summer conditions. A simple logic energy management system received inputs from temperature and relative humidity sensors. It controlled the heat pump and the air heat exchanger to deliver heat or cold to the buffer tank. The results included actual indoor air and glazing temperatures, heating and cooling energy consumption, and the influence of WFG in the mean radiant temperature and comfort.
Water-Flow Glazing was evaluated as a component of a hydronic radiant heating and cooling system. It showed final energy-saving potential, provided thermal comfort, and may be considered a valid option for office retrofitting. On the hottest day of the year, when the temperature ranged from 18 to 40 °C and the peak solar radiation was above 700 W/m2, the energy system consumed 32 kWh (0.8 kWh/m2) and the WFG managed to keep the indoor air temperature between 25 and 27 °C. The contribution of the air heat exchanger was negligible over the year because it was set to work for cooling only when the difference between the tank top temperature and outdoor temperature (T_tank_topT_ext) was above 10 °C. It complicated the piping and the control logic and did not improve the energy performance.
Radiant panels improve the performance of air-to-water heat pumps. The energy efficiency ratio (EER) reached 3.62 when the water temperature was 18 °C, and the coefficient of performance (COP) was 4.5 when the water temperature was 35 °C in heating mode. Using WFG as a radiant cooling facade and indoor partitions effectively reduced the operative temperature to comfortable levels when the indoor air temperature was between 25 and 27.5 °C.
The Predicted Mean Vote (PMV) in summer conditions was between 0 and −0.5 in working hours, within the recommended values of ASHRAE-55 standard. The MRT ranged from 19.3 to 23 °C, and the indoor air temperature ranged from 25.2 to 29.1 °C. In winter conditions, the electronic control unit was set to operate in heating mode if the indoor air temperature was below 20 °C. Then, for 45% of the working hours, the predicted mean vote was below −0.5, out of the comfort range, so the occupants would describe their comfort conditions as “Slightly Cool” or “Cool”. The control unit logic should be fixed to start operating the heating mode if the indoor temperature drops below 21 °C. On mild sunny winter days, when the outdoor temperature reached 17 °C in the afternoon, the heat pump cooled down the buffer tank, but the WFG failed to deliver enough cooling power. The predicted mean vote was above 0.5, and the conditions could be described as “Warm” and out of the comfort range for more than three hours. There were two conditions to activate WFG in the cooling mode; first, indoor air temperature should be above 25 °C, and second, the difference between indoor air temperature and the bottom tank temperature should be more than 10 °C.
Water-Flow Glazing was evaluated as a component of a hydronic radiant heating and cooling system. It showed final energy-saving potential, provided thermal comfort, and may be considered a valid option for office retrofitting. The system is limited by its high initial cost and the need for an energy management system integrated with the rest of the equipment, especially the ventilation system and the heat pump. The ventilation system is an essential aspect of comfort. Controlling the relative humidity is indispensable in radiant systems to avoid condensation issues. Therefore, a more advanced ventilation device could help optimize the whole system’s performance. Including a heat recovery and variable airflow would reduce the sensible and latent thermal loads and control the dew point temperature. There were uncertainties with the air-to-water heat pump operation. Although the radiant WFG panels could improve the heat pump COP and EER, there were issues with the operating cycles that could affect its performance. The selected heat pump was oversized, and frequently started and stopped because it prematurely detected that it had reached the target temperature.
After the first year of monitoring, there are uncertainties, misfunctions, and system issues that must be addressed. Firstly, due to the complexity of the elements involved in human comfort, the control unit must integrate the ventilation device. The operation logic should be able to modify the water mass flow rate and ventilation air heat flow. Secondly, the devices must be adequately dimensioned to avoid misfunctions, especially the air-to-water heat pump. Further research must include heat pump electricity monitoring to compare the actual thermal and electricity consumption and assess energy performance more accurately. Finally, further research on the standardization of its manufacturing process and deployment is needed to bring down initial costs and payback periods. Another research line would be to integrate WFG into commercial building performance simulations.

Author Contributions

Conceptualization, B.M.S., F.d.A.G., and J.A.H.R.; methodology, B.M.S. and F.d.A.G.; software, J.A.H.R.; formal analysis, B.M.S. and F.d.A.G.; data curation, J.A.H.R.; writing—original draft preparation, J.A.H.R.; writing—review and editing, F.d.A.G. and B.L.A.; visualization, B.M.S., F.d.A.G., and B.L.A.; supervision, J.A.H.R. and B.L.A.; project administration, B.M.S.; funding acquisition, F.d.A.G. All authors have read and agreed to the published version of the manuscript.

Funding

This article has been funded by the KSC Faculty Development Grant (Keene State College, New Hamshire, USA).

Acknowledgments

This work was supported by program Horizon 2020-EU.3.3.1: Reducing energy consumption and carbon footprint by smart and sustainable use, project Ref. 680441 InDeWaG: Industrialized Development of Water Flow Glazing Systems.

Conflicts of Interest

The authors declare that they have no conflict of interest.

References

  1. Kamilaris, A.; Kalluri, B.; Kondepudi, S.; Kwok Wai, T. A literature survey on measuring energy usage for miscellaneous electric loads in offices and commercial buildings. Renew. Sustain. Energy Rev. 2014, 34, 536–550. [Google Scholar] [CrossRef]
  2. Balaras, C.A.; Droutsa, K.; Argiriou, A.A.; Asimakopoulos, D.N. Potential for energy conservation in apartment building. Energy Build. 2000, 31, 143–154. [Google Scholar] [CrossRef]
  3. Del Ama Gonzalo, F.; Ferrandiz, J.; Fonseca, D.; Hernandez, J.A. Non-intrusive electric power monitoring system in multi-purpose educational buildings. Int. J. Power Electron. Drive Syst. 2019, 9, 51–62. [Google Scholar] [CrossRef]
  4. Menezes, A.C.; Cripps, A.; Buswellb, R.A.; Wright, J.; Bouchlaghem, D. Estimating the energy consumption and power demand of small power equipment in office buildings. Energy Build. 2014, 75, 199–209. [Google Scholar] [CrossRef] [Green Version]
  5. Europe 2020 Indicators—Climate Change and Energy. Available online: http://ec.europa.eu/ (accessed on 15 June 2020).
  6. Andreou, A.; Barrett, J.; Taylor, P.G.; Brockway, P.E.; Wadud, Z. Decomposing the drivers of residential space cooling energy consumption in EU-28 countries using a panel data approach. Energy Built Environ. 2020, 1, 432–442. [Google Scholar] [CrossRef]
  7. Bae, W.-B.; Mun, S.-H.; Huh, J.-H. Real-Time Occupant Based Plug-in Device Control Using ICT in Office Buildings. Energies 2016, 9, 143. [Google Scholar] [CrossRef] [Green Version]
  8. Masoso, O.T.; Grobler, L.J. The dark side of occupants’ behaviour on building energy use. Energy Build. 2010, 42, 173–177. [Google Scholar] [CrossRef]
  9. Muhammad, W.; Monjur, M.; David, M.; Mario, S.; Yacine, R. Building energy metering and environmental monitoring. A state-of-the-art review and directions for future research. Energy Build. 2016, 120, 85–102. [Google Scholar] [CrossRef] [Green Version]
  10. Komor, P. Space cooling demands from office plug loads. Ashrae J. 1997, 39, 41–44. [Google Scholar]
  11. BRECSU. Energy Consumption Guide 19: Energy Use in Offices; Building Research Energy Conservation Support Unit: Watford, UK, 2000. [Google Scholar]
  12. Dunn, G.; Knight, I. Small power equipment loads in UK office environments. Energy Build. 2005, 37, 87–91. [Google Scholar] [CrossRef]
  13. Izquierdo, M.; Moreno-Rodríguez, A.; González-Gil, A.; García-Hernando, N. Air conditioning in the region of Madrid, Spain: An approach to electricity consumption, economics and CO2 emissions. Energy 2011, 36, 1630–1639. [Google Scholar] [CrossRef] [Green Version]
  14. Menezes, A.C.; Cripps ABuswell, R.A.; Bouchlaghem, D. Benchmarking small power energy consumption in office buildings in the United Kingdom: A review of data published in CIBSE Guide F. Build. Serv. Eng. Res. Technol. 2013, 34, 73–86. [Google Scholar] [CrossRef] [Green Version]
  15. Pezzutto, S.; Fazeli, R.; De Felice, M.; Sparber, W. Future development of the air-conditioning market in Europe: An outlook until 2020. Wiley Interdiscip. Rev. Energy Environ. 2016, 5, 649–669. [Google Scholar] [CrossRef]
  16. Lanzisera, S.; Dawson-Haggertym, S.; Cheung, H.; Taneja, J.; Culler, D.; Brown, R. Methods for detailed energy data collection of miscellaneous and electronic loads in a commercial office building. Build. Environ. 2013, 65, 170–177. [Google Scholar] [CrossRef]
  17. Pezzutto, S.; De Felice, M.; Fazeli, R.; Kranzl, L.; Zambotti, S. Status quo of the air-conditioning market in Europe: Assessment of the building stock. Energies 2017, 10, 1253. [Google Scholar] [CrossRef] [Green Version]
  18. Li, D.H.W.; Wong, S.L.; Tsang CLCheung, G.H.W. A study of the daylighting performance and energy use in heavily obstructed residential buildings via computer simulation techniques. Energy Build. 2006, 38, 1343–1348. [Google Scholar] [CrossRef]
  19. Hermanns, M.; del Ama, F.; Hernández, J.A. Analytical solution to the one-dimensional non-uniform absorption of solar radiation in uncoated and coated single glass panes. Energy Build. 2012, 47, 561–571. [Google Scholar] [CrossRef] [Green Version]
  20. Taleghani, M.; Kleerekoper, L.; Tenpierik, M.; van den Dobbelsteen, A. Outdoor thermal comfort within five different urban forms in the Netherlans. Build. Environ. 2015, 83, 65–78. [Google Scholar] [CrossRef]
  21. Tullie Circle, N.E. (Ed.) Ashrae Handbook-Heating, Ventilating, and Air-Conditioning Systems and Equipment; ASHRAE: Atlanta, GA, USA, 2012; Available online: https://app.knovel.com/web/toc.v/cid:kpASHRAEA2/viewerType:toc/ (accessed on 15 June 2020).
  22. Europe 2020 Indicators—Electricity Price Statistics. Available online: https://ec.europa.eu/eurostat/statistics-explained/index.php?title=Electricity_price_statistics (accessed on 15 August 2020).
  23. Mikulik, J. Energy Demand Patterns in an Office Building: A Case Study in Kraków (Southern Poland). Sustainability 2018, 10, 2901. [Google Scholar] [CrossRef] [Green Version]
  24. Lee, S.H.; Jeon, Y.; Chung, H.J.; Cho, W.; Kim, Y. Simulation-based optimization of heating and cooling seasonal performances of an air-to-air heat pump considering operating and design parameters using genetic algorithm. Appl. Therm. Eng. 2018, 144, 362–370. [Google Scholar] [CrossRef]
  25. Priarone, A.; Silenzi, F.; Fossa, M. Modelling Heat Pumps with Variable EER and COP in EnergyPlus: A Case Study Applied to Ground Source and Heat Recovery Heat Pump Systems. Energies 2020, 13, 794. [Google Scholar] [CrossRef] [Green Version]
  26. Fanger, P.O. Thermal Comfort, Analysis and Application in Environmental Engineering; Danish Technical Press: Copenhagen, Denmark, 1970. [Google Scholar]
  27. ASHRAE-55. ANSI/ASHRAE Standard 55-2017: Thermal Environmental Conditions for Human Occupancy; ASHRAE: Atlanta, GA, USA, 2017. [Google Scholar]
  28. ISO 7730:2005. Ergonomics of the Thermal Environment-Analytical Determination and Interpretation of Thermal Comfort Using Calculation of the PMV and PPD Indices and Local Thermal Comfort Criteria; International Organization for Standardization (ISO): Geneva, Switzerland, 2005. [Google Scholar]
  29. Marino, C.; Nucara, A.; Pietrafesa, M. Mapping of the indoor comfort conditions considering the effect of solar radiation. Sol. Energy 2015, 113, 63–77. [Google Scholar] [CrossRef]
  30. Godbole, S. Investigating the relationship between Mean Radiant Temperature (MRT) and Predicted Mean Vote (PMV); A case study in a university building; School of Architecture and the Built Environment: Stockholm, Sweden, 2018. [Google Scholar]
  31. Chow, T.; Chunying, L.; Zhang, L. Thermal characteristics of water-flow double-pane window. Int. J. Therm. Sci. 2011, 50, 140–148. [Google Scholar] [CrossRef]
  32. Gueymard, C.; duPont, W. Spectral effects on the transmittance, solar heat gain, and performance rating of glazing systems. Sol. Energy 2009, 83, 940–953. [Google Scholar] [CrossRef]
  33. Chow, T.T.; Li, C. Liquid-filled solar glazing design for buoyant water-flow. Build. Environ. 2013, 60, 45–55. [Google Scholar] [CrossRef]
  34. Gil-Lopez, T.; Gimenez-Molina, C. Environmental, economic and energy analysis of double glazing with a circulating water chamber in residential buildings. Appl. Energy 2013, 101, 572–581. [Google Scholar] [CrossRef]
  35. Gutai, M.; Kheybari, A.G. Energy consumption of water-filled glass (WFG) hybrid building envelope. Energy Build. 2020, 218, 110050. [Google Scholar] [CrossRef]
  36. Moreno Santamaria, B.; del Ama Gonzalo, F.; Pinette, D.; Gonzalez-Lezcano, R.-A.; Lauret Aguirregabiria, B.; Hernandez Ramos, J.A. Application and Validation of a Dynamic Energy Simulation Tool: A Case Study with Water Flow Glazing Envelope. Energies 2020, 13, 3203. [Google Scholar] [CrossRef]
  37. Moreno Santamaria, B.; del Ama Gonzalo, F.; Lauret Aguirregabiria, B.; Hernandez Ramos, J.A. Experimental Validation of Water Flow Glazing: Transient Response in Real Test Rooms. Sustainability 2020, 12, 5734. [Google Scholar] [CrossRef]
  38. Spanish Ministry of Development. BasicDocument on Energy Saving of the Technical Building Code (Documento Básico de Ahorro de Energía del Código Técnico de la Edificación, CTE-DB-HE). 2019. Available online: https://www.codigotecnico.org/images/stories/pdf/ahorroEnergia/DBHE.pdf (accessed on 16 August 2020).
  39. European Union. Directive (EU) 2018/844 of the European Parliament and of the Council of 30 May 2018. Amending Directive 2010/31/EU on the Energy Performance of Buildings and Directive 2012/27/EU on Energy Efficiency. 2018. Available online: https://eur-lex.europa.eu/legal-content/EN/TXT/PDF/?uri=CELEX:32018L0844&from=EN (accessed on 16 August 2020).
  40. Spanish Regulation of Thermal Installations in Buildings (RITE). Factores de Emisión de CO2 y Coeficientes de Paso a Energía Primaria de Diferentes Fuentes de Energía Final Consumidas en el Sector de Edificios en España. Agencia Estatal Boletín Oficial del Estado: Madrid, Spain. 2016. Available online: https://energia.gob.es/desarrollo/EficienciaEnergetica/RITE/Reconocidos/Reconocidos/Otros%20documentos/Factores_emision_CO2.pdf (accessed on 16 August 2020).
  41. Saunier Duval. Manuel d’installation. Available online: https://www.saunierduval.fr/france/download/genia-air-1/genia-air-2/saunier-duval-genia-air-6-8-12-15-unite-exterieure-notice-installation-0020117808-03-12-2012-291831.pdf (accessed on 16 August 2020).
  42. Ventilación Técnica Para la Edificación. Available online: https://www.casals.com/es/productos-casals/ventilacion-tecnica-para-la-edificacion/ventiladores-in-line-y-en-caja-insonorizada/box-bd-plus// (accessed on 4 September 2020).
  43. Cannistmro, G.; Franzitta, G.; Giaconia, C.; Rizzo, G. Algorithms for the calculation of the view factors between human body and rectangular surfaces in parallelepiped environments. Energy Build. 1992, 19, 51–60. [Google Scholar] [CrossRef]
Figure 1. Plan view of the office spaces. The transparent Water-Flow Glazing (WFG) was connected directly to the primary circuit. The translucent interior partitions were connected in parallel to the circulating device.
Sustainability 12 07596 g001
Figure 2. Top: View from the access corridor during the construction process. Bottom: Glass configuration of the office space. (a) Transparent Water-Flow Glazing (corridor), (b) translucent Water-Flow Glazing (interior partitions).
Sustainability 12 07596 g002
Figure 3. Schematics of the testing facility. The primary circuit connects the energy management devices (heat pump, air heat exchanger, and buffer tank). The secondary circuit goes from the buffer tank to the WFG.
Sustainability 12 07596 g003
Figure 4. Front view of the transparent WFG in the corridor facing south-west. Location of the circulating device underneath the technical floor. Location of inlet and outlet temperature probes and flow meters for the primary and secondary circuits of the WFG.
Sustainability 12 07596 g004
Figure 5. Solar irradiance and indoor and outdoor temperatures—sample summer week of 10 July 2019 to 16 July 2019.
Sustainability 12 07596 g005
Figure 6. Solar irradiance and indoor and outdoor temperatures—summer sample days (a) 10 July 2019 and (b) 11 July 2019.
Sustainability 12 07596 g006
Figure 7. Solar irradiance and indoor and outdoor temperatures—sample winter week of 08 January 2020 to 14 January 2020.
Sustainability 12 07596 g007
Figure 8. Solar irradiance and indoor and outdoor temperatures—sample winter days (a) 09 January 2020 and (b) 14 January 2020.
Sustainability 12 07596 g008
Figure 9. Solar irradiance and indoor and outdoor temperatures—sample week in February from 19 February 2020 to 25 February 2020.
Sustainability 12 07596 g009
Figure 10. Solar irradiance and indoor and outdoor temperatures—sample February days (a) 19 February 2020 and (b) 20 February 2020.
Sustainability 12 07596 g010
Figure 11. Tank temperatures and heat pump thermal power—sample summer week from 1 July 2019 to 16 July 2019.
Sustainability 12 07596 g011
Figure 12. Tank temperatures and heat pump thermal power—sample winter week from 08 January 2020 to 14 January 2020.
Sustainability 12 07596 g012
Figure 13. Tank temperatures and heat pump thermal power—ample February week from 19 February 2020 to 25 February 2020.
Sustainability 12 07596 g013
Figure 14. Geometry of the office space and occupant’s position and dimensions to calculate the angle factor.
Sustainability 12 07596 g014
Figure 15. Surface temperatures of indoor surfaces, mean radiant temperature (MRT), and indoor relative humidity (RH)—sample days 10 July 2019 to 11 July 2019 and 15 July 2019 to 16 July 2019.
Sustainability 12 07596 g015
Figure 16. Operative temperature (Top) and Predicted Mean Vote (PMV) in summer—sample days 10 July 2019 to 11 July 2019 and 15 July 2019 to 16 July 2019.
Sustainability 12 07596 g016
Figure 17. Operative temperature (Top), Predicted Mean Vote (PMV), and indoor relative humidity (RH) in winter—sample days 19 February 2020 to 20 February 2020 and 24 February 2020 to 25 February 2020.
Sustainability 12 07596 g017
Table 1. Parameters of the office envelope.
Thermal and Geometric ParametersRoofN-E WallN-E WindowInt WallInt GlassFloor
U (W/m2K) 10.30.32.90.75.20.6
A (m2)4022.52.219.67.840
∑UA (W/K)126.756.3813.7240.5624
1 Values meet the Spanish Building Code (CTE DB HE1) requirements [38].
Table 2. Estimation of heating and cooling loads in the offices.
Operating
Condition
T_int
(°C)
T_ext
(°C) 1
T_ext_C
(°C)
n∑UA(T_int-T_ext)
(W)
∑UA(T_int-T_ext_C)
(W)
Vent
(W)
IL
(W)
SR
(W)
Total
(W)
Heating224222452.34-1620--2018.16
Cooling2335306301.56379.261080140082.53243.42
1 Values are taken from CTE DB HE1 [38].
Table 3. Energy management system in cooling mode.
DeviceHPAHXWFGWFG_HP
Condition 1T_int > 25 °C-T_int > 25 °C
Condition 2(T_tank_top − T_ext) < 10 °C(T_tank_top − T_ext) > 10 °C(T_int − T_tank_bottom) > 10 °C
8:00 p.m.–7:00 a.m.-ONONON
7:00 a.m.–8:00 p.m.ON-ONON
Table 4. Energy management system in heating mode.
DeviceHPAHXWFGWFG_HP
Condition 1T_int < 20 °CT_int < 20 °C
Condition 2-(T_tank_bottom − T_int) > 10 °C
8:00 p.m.–7:00 a.m.--ONON
7:00 a.m.–8:00 p.m.ON-ONON
Table 5. Nomenclature and description of sensors.
SensorDescription
TikInlet temperature of the transparent WFG 1 (°C)
TokOutlet temperature of the transparent WFG 1 (°C)
Ts_INInlet temperature of the translucent WFG partitions (°C)
Ts_OUTOutlet temperature of the translucent WFG partitions (°C)
T_extOutside temperature (°C)
T_intIndoor air temperature (°C)
T_tank_bottomTemperature at the bottom of the buffer tank (°C)
T_tank_middleTemperature in the middle of the buffer tank (°C)
T_tank_topTemperature at the top of the buffer tank (°C)
T _ext_CTemperature of the corridor right outside the door (°C)
TfloorSurface temperature of the floor (°C)
TwallSurface temperature of opaque walls (°C)
TceilingSurface temperature of the ceiling (°C)
TWFGSurface temperature of transparent WFG (°C)
TWFG_TPSurface temperature of WFG translucent partitions (°C)
Sun_radSolar irradiance on vertical surface (W/m2)
kWh_HPThermal heating/cooling energy by the heat pump (kWh)
kWh_AXHThermal cooling energy by the air heat exchanger (kWh)
kWh_WFGHeating/cooling energy delivered by transparent WFG (kWh)
kWh_WFG_TPHeating/cooling energy delivered by WFG translucent partitions (kWh)
RHIndoor Relative Humidity (%)
1 k is the module number from 1 to 4.
Table 6. Thermal energy summary on four sample days.
Date10 July 201909 January 202014 January 202020 February 2020
hour0–77–2020–240–77–2020–240–77–2020–240–77–2020–24
kWh_WFG 1−0.3−4.3−0.33.4---8.6--−2.3-
kWhWFGTP 1−1.6−2.0−1.33.211.34.11.717.45.6−2.5−1.1−1.2
kWh_HP 1-−21--7.12--15.0--−0.6-
kWh_AXH 1−0.7--------−0.1-−0.3
1 Energy values in kWh.
Table 7. Summer cooling loads on 10 July 2019.
HourT_int
(C)
T_ext
(C) 1
T_ext_C
(C) 1
n∑UA(T_int-T_ext)
(Wh)
∑UA(T_int-T_ext_C)
(Wh)
Vent
(Wh)
IL
(Wh)
SR
(Wh)
Total
(Wh)
7–82318240−125.6554.1808000728.53
8–9232023.82−75.3943.34−9010000877.95
9–102321.523.72−37.6937.92−4510000955.23
10–11232823.92125.6548.76150100001324.41
11–122336246326.6954.181170140002950.87
12–13233824.26376.9565.011350140003191.96
13–142338.5262389.51162.5446510005102527.05
14–152339.7282419.67270.95011000521.22712.82
15–162339.8302422.18379.2650410005102815.44
16–172335346301.56595.98108014003903767.54
17–182332336226.17541.88101400281.23259.22
18–192331342201.04595.982401000202.52239.52
19–202329.5322163.34487.62195100082.51928.45
1 Values are taken from Figure 6.
Table 8. Winter heating loads on 14 January 2020.
HourT_int
(C)
T_ext
(C) 1
T_ext_C
(C) 1
n∑UA(T_int-T_ext)
(Wh)
∑UA(T_int-T_ext_C)
(Wh)
Vent
(Wh)
Total
(Wh)
7–8 h224140452.34433.440885.78
8–9 h225202427.21108.365101045.57
9–10 h226222402.080480882.08
10–11 h227232376.95−54.18450772.77
11–12 h227236376.95−54.1813501672.77
12–13 h228246351.82−54.1812601557.64
13–14 h229242326.69−54.18390662.51
14–15 h2210242301.56−54.18360607.38
15–16 h228242351.82−54.18420717.64
16–17 h224246452.34−54.1816202018.16
17–18 h224236452.34−54.1816202018.16
18–19 h225212427.2154.18510991.39
19–20 h225182427.21216.725101153.93
1 Values are taken from Figure 8.
Table 9. Sample summer week energy consumption (kWh).
Date10 July (kWh)11 July (kWh)12 July (kWh)15 July (kWh)16 July (kWh)Total (kWh)
Cooling loads
(WFG) 1
21.6031.1323.9029.4027.6133.63
Cooling loads
(Aid-to-Air)
27.2035.7528.3832.7231.56155.61
1 Values are taken from Figure 11.
Table 10. Sample winter week energy consumption (kWh).
Date08 January (kWh)09 January (kWh)10 January (kWh)13 January (kWh)14 January (kWh)Total (kWh)
Heating loads (WFG) 16.937.156.7920.0515.0155.93
Heating loads
(Ait-to-Air)
8.729.118.3918.2716.5361.02
1 Values are taken from Figure 12.
Table 11. Final energy analysis. Air-to-water heat pump.
Air-to-Water Heat Pump
T_ext_db (°C)Cooling 35 °CHeating 7 °C
Ts,i (°C)7 °C18 °C35 °C45 °C
Energy consumption (kWh)133.63133.6355.9355.93
EER 1/COP 22.90 13.62 14.50 23.50 2
FE consumption (kWh)46.0836.9112.4315.98
NRFE consumption (kWh)90.0472.1324.2931.22
CO2 emissions (KgCO2)15.2512.224.115.29
1 Energy efficiency ratio (EER)/2 coefficient of performance (COP) values are taken from [41].
Table 12. Final energy analysis—air-to-air heat pump.
Air-to-Air Heat Pump
Tri_db (°C)Cooling 23 °CHeating 22 °C
T_ext_db (°C)35 °C7 °C
Energy consumption (kWh)155.6161.02
EER 1/COP 23.25 13.72 2
FE consumption (kWh)47.8816.40
NRFE consumption (kWh)93.5632.05
CO2 emissions (KgCO2)15.855.43
1, 2 EER/COP values are taken from [41].
Table 13. Parameters for calculating angle factors 1.
FmaxABCDE
Seated person
(Wall/window facing person)
0.1181.2160.1690.7170.0870.052
Seated person
(Floor/ceiling facing person)
0.1161.3960.1300.9510.0800.055
1 Values are taken from [28].
Table 14. Parameters of WFG.
vr<0.2 m/s0.2 to 0.6 m/s>0.6 m/s
A0.50.60.7
Table 15. ASHRAE thermal comfort scale 1.
ColdCoolSlightly CoolNeutralSlightly WarmWarmHot
−3−2−10+1+2+3
1 Values are taken from [27].

