Overheating in Schools: Factors Determining Children’s Perceptions of Overall Comfort Indoors

 ,
,  ,
,
Abstract
:1. Introduction
2. Materials and Methods
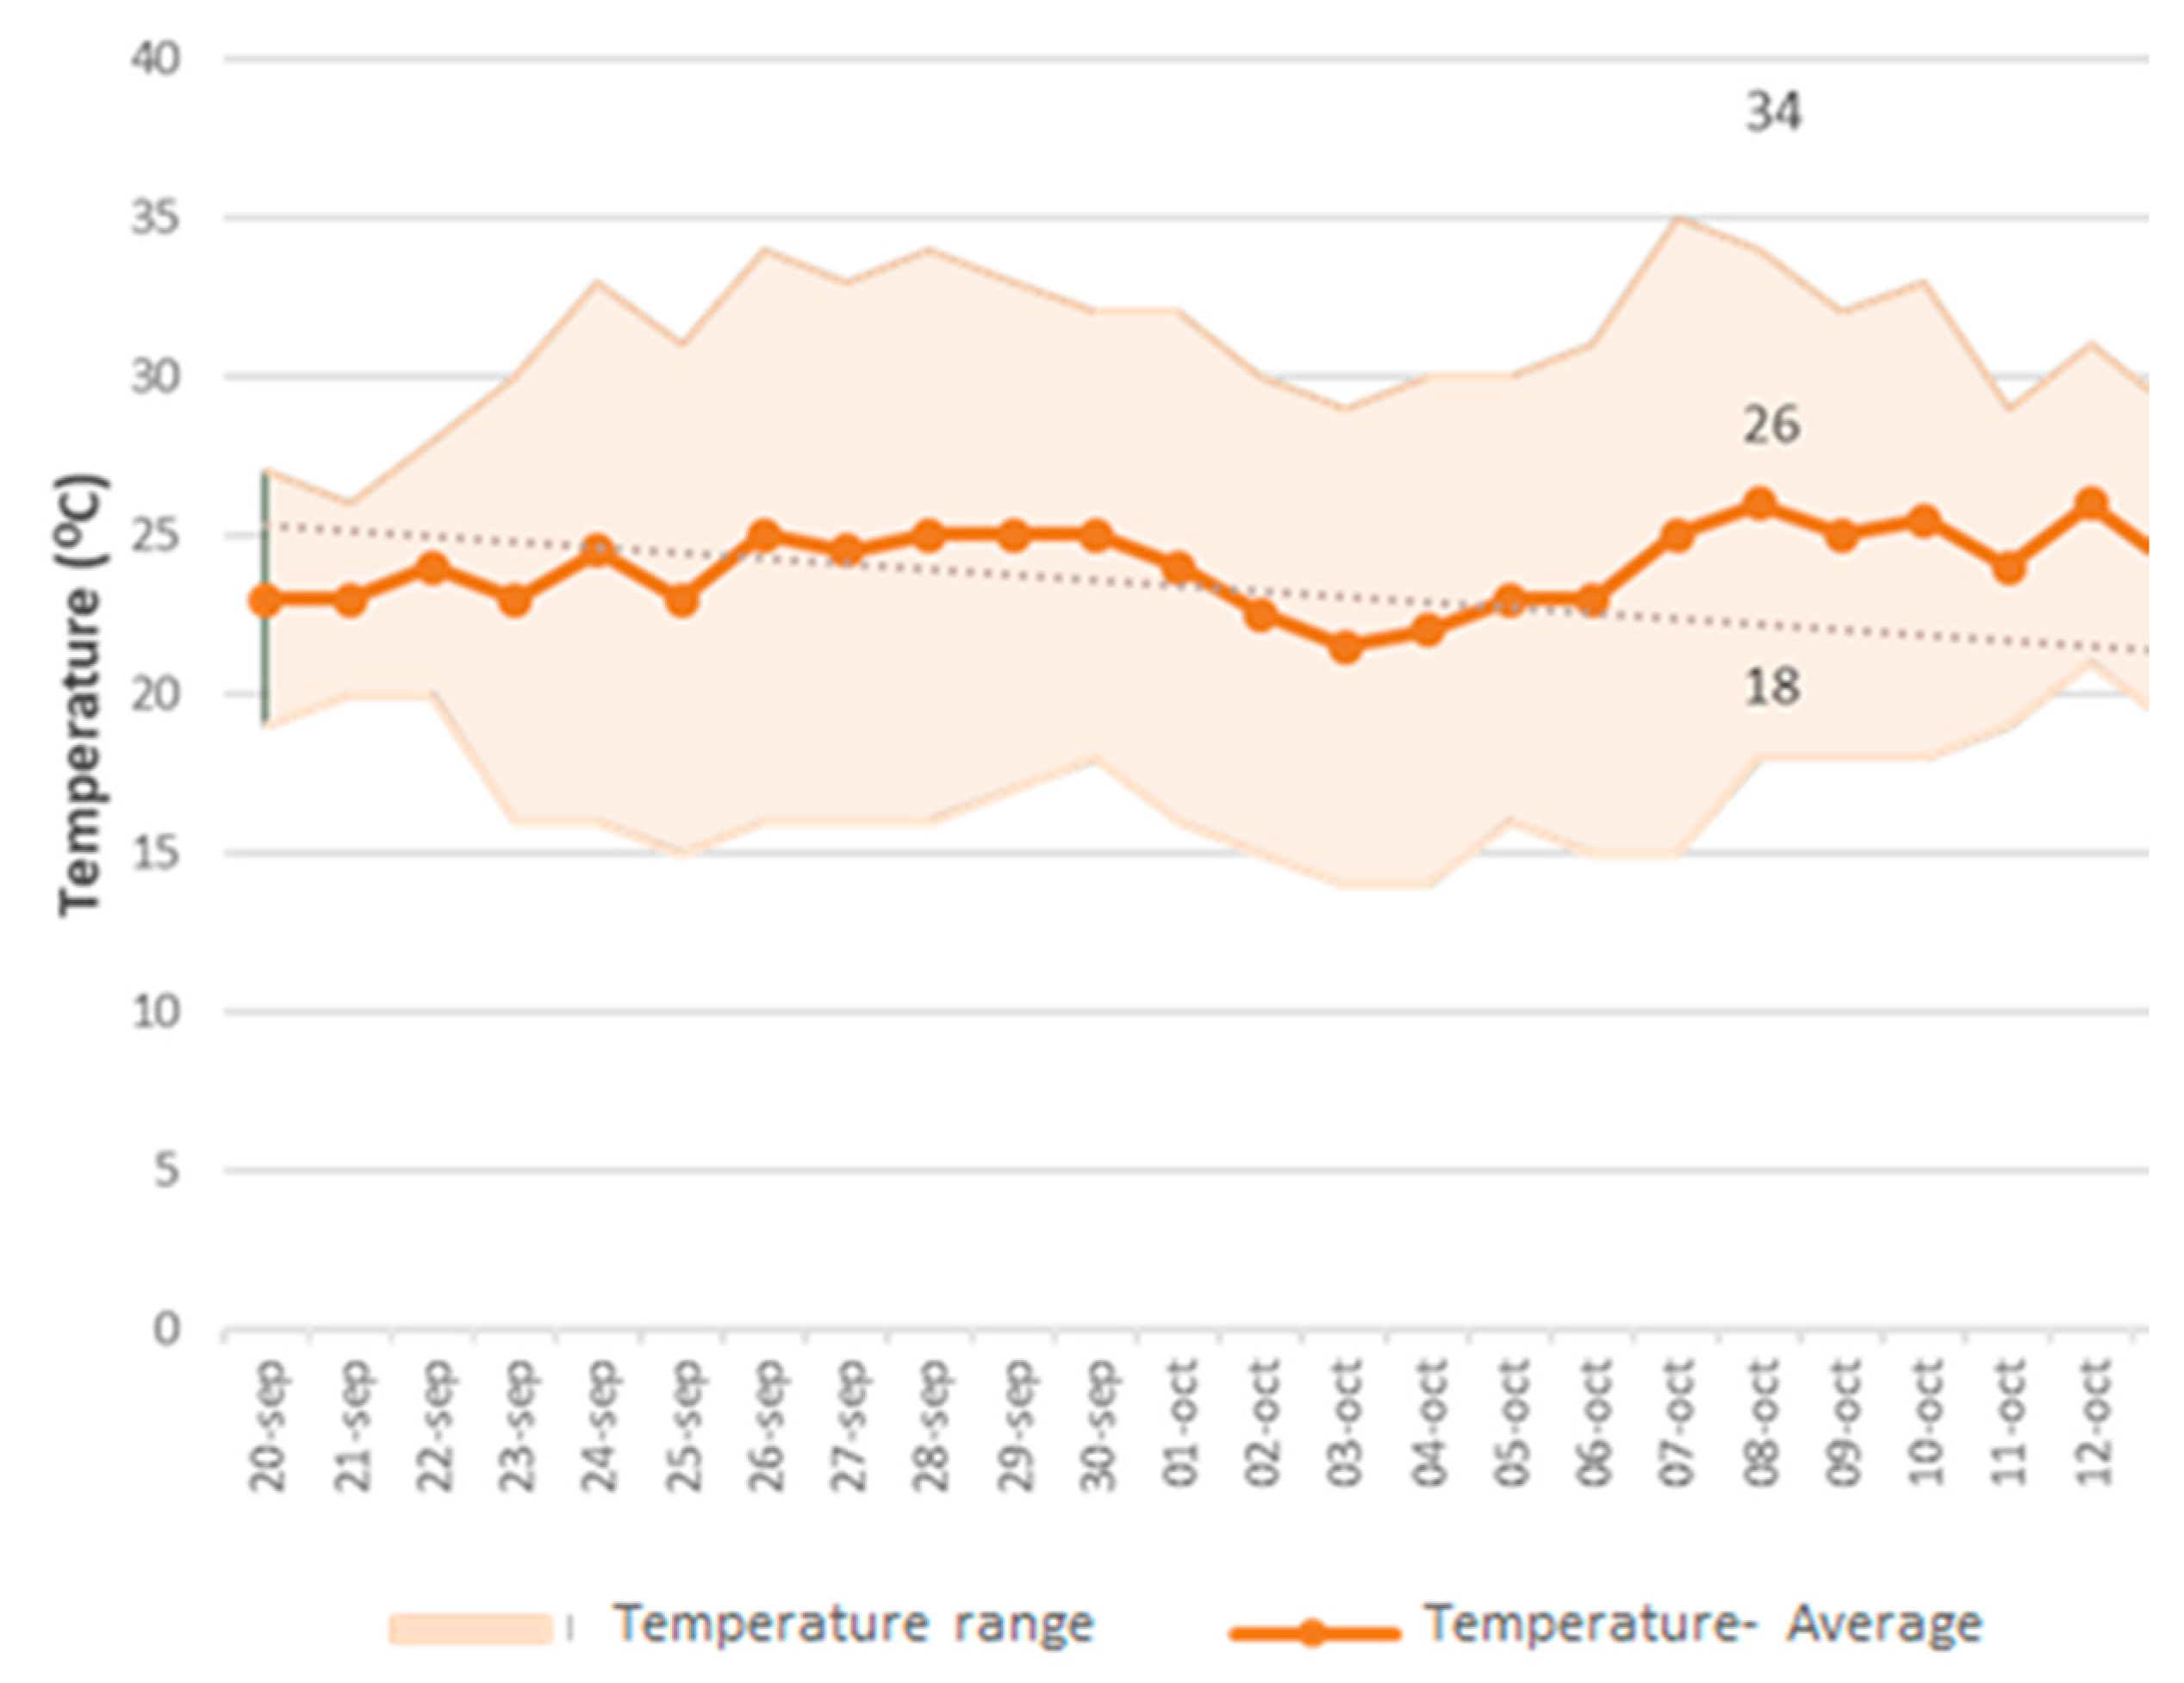
2.1. Location and Climate
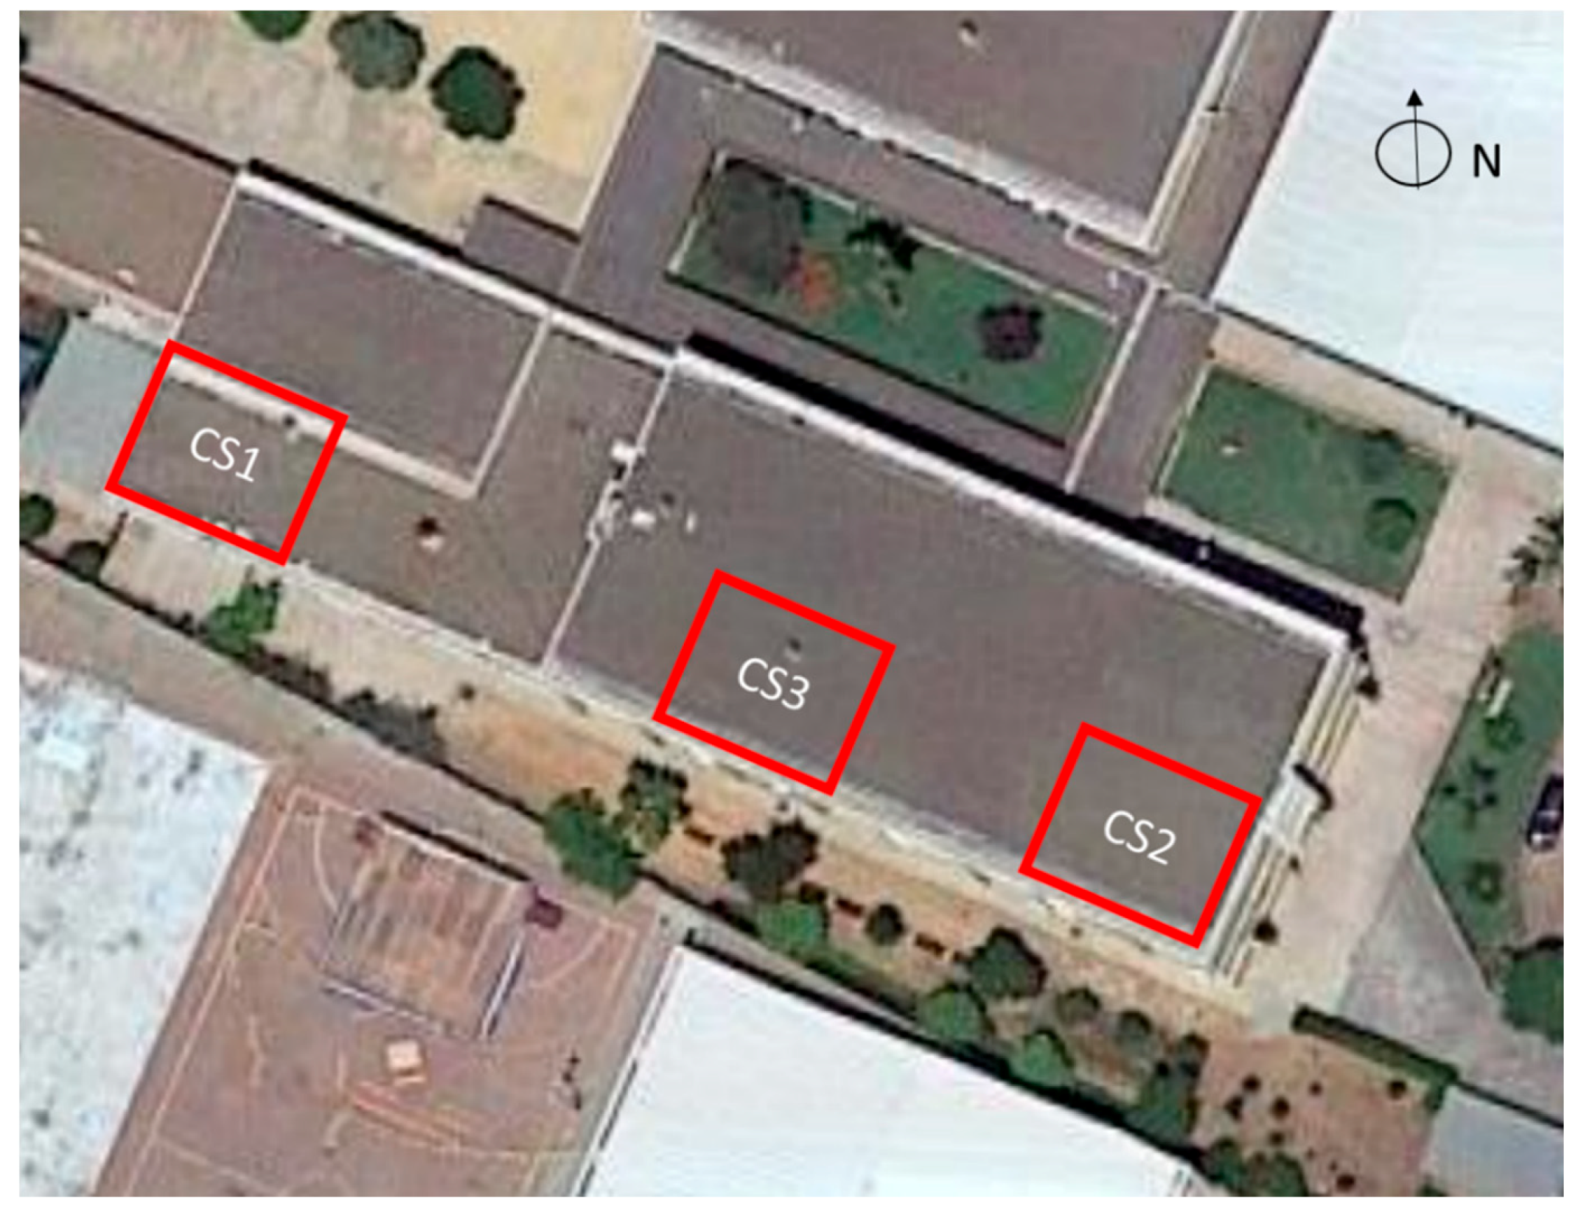
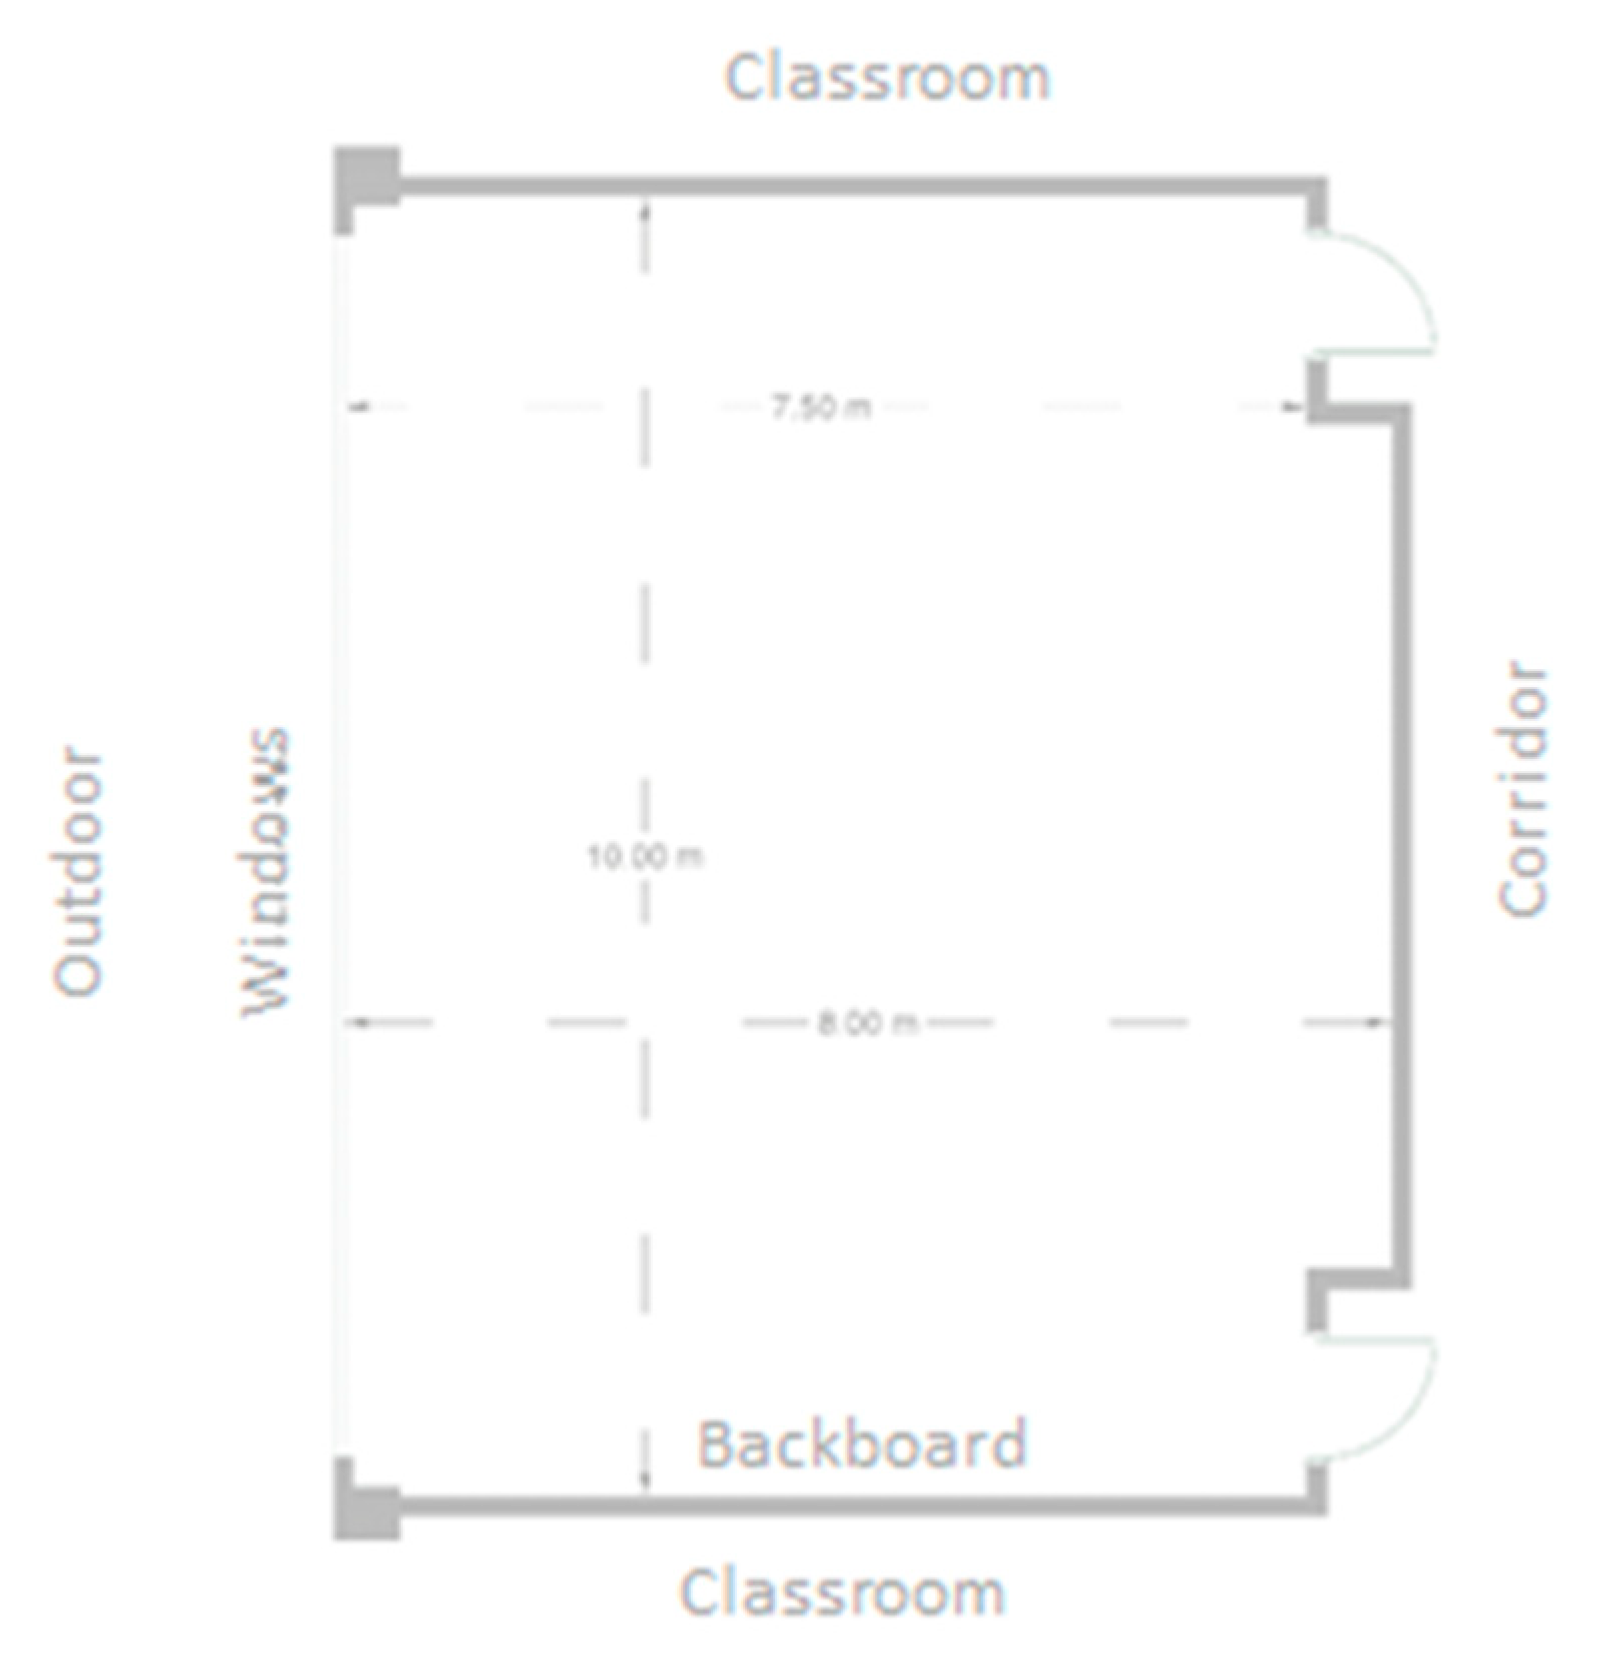
2.2. Case Study
- Shallow presentation of the activity, emotional drawing by the students, coding of the drawings;
- First group debate after drawing selection by the facilitator;
- Keywords categorization, jotted down by the facilitator from the students’ consensus and questionnaires;
- Thinking about possible solutions to settle what they considered negative for comfort.
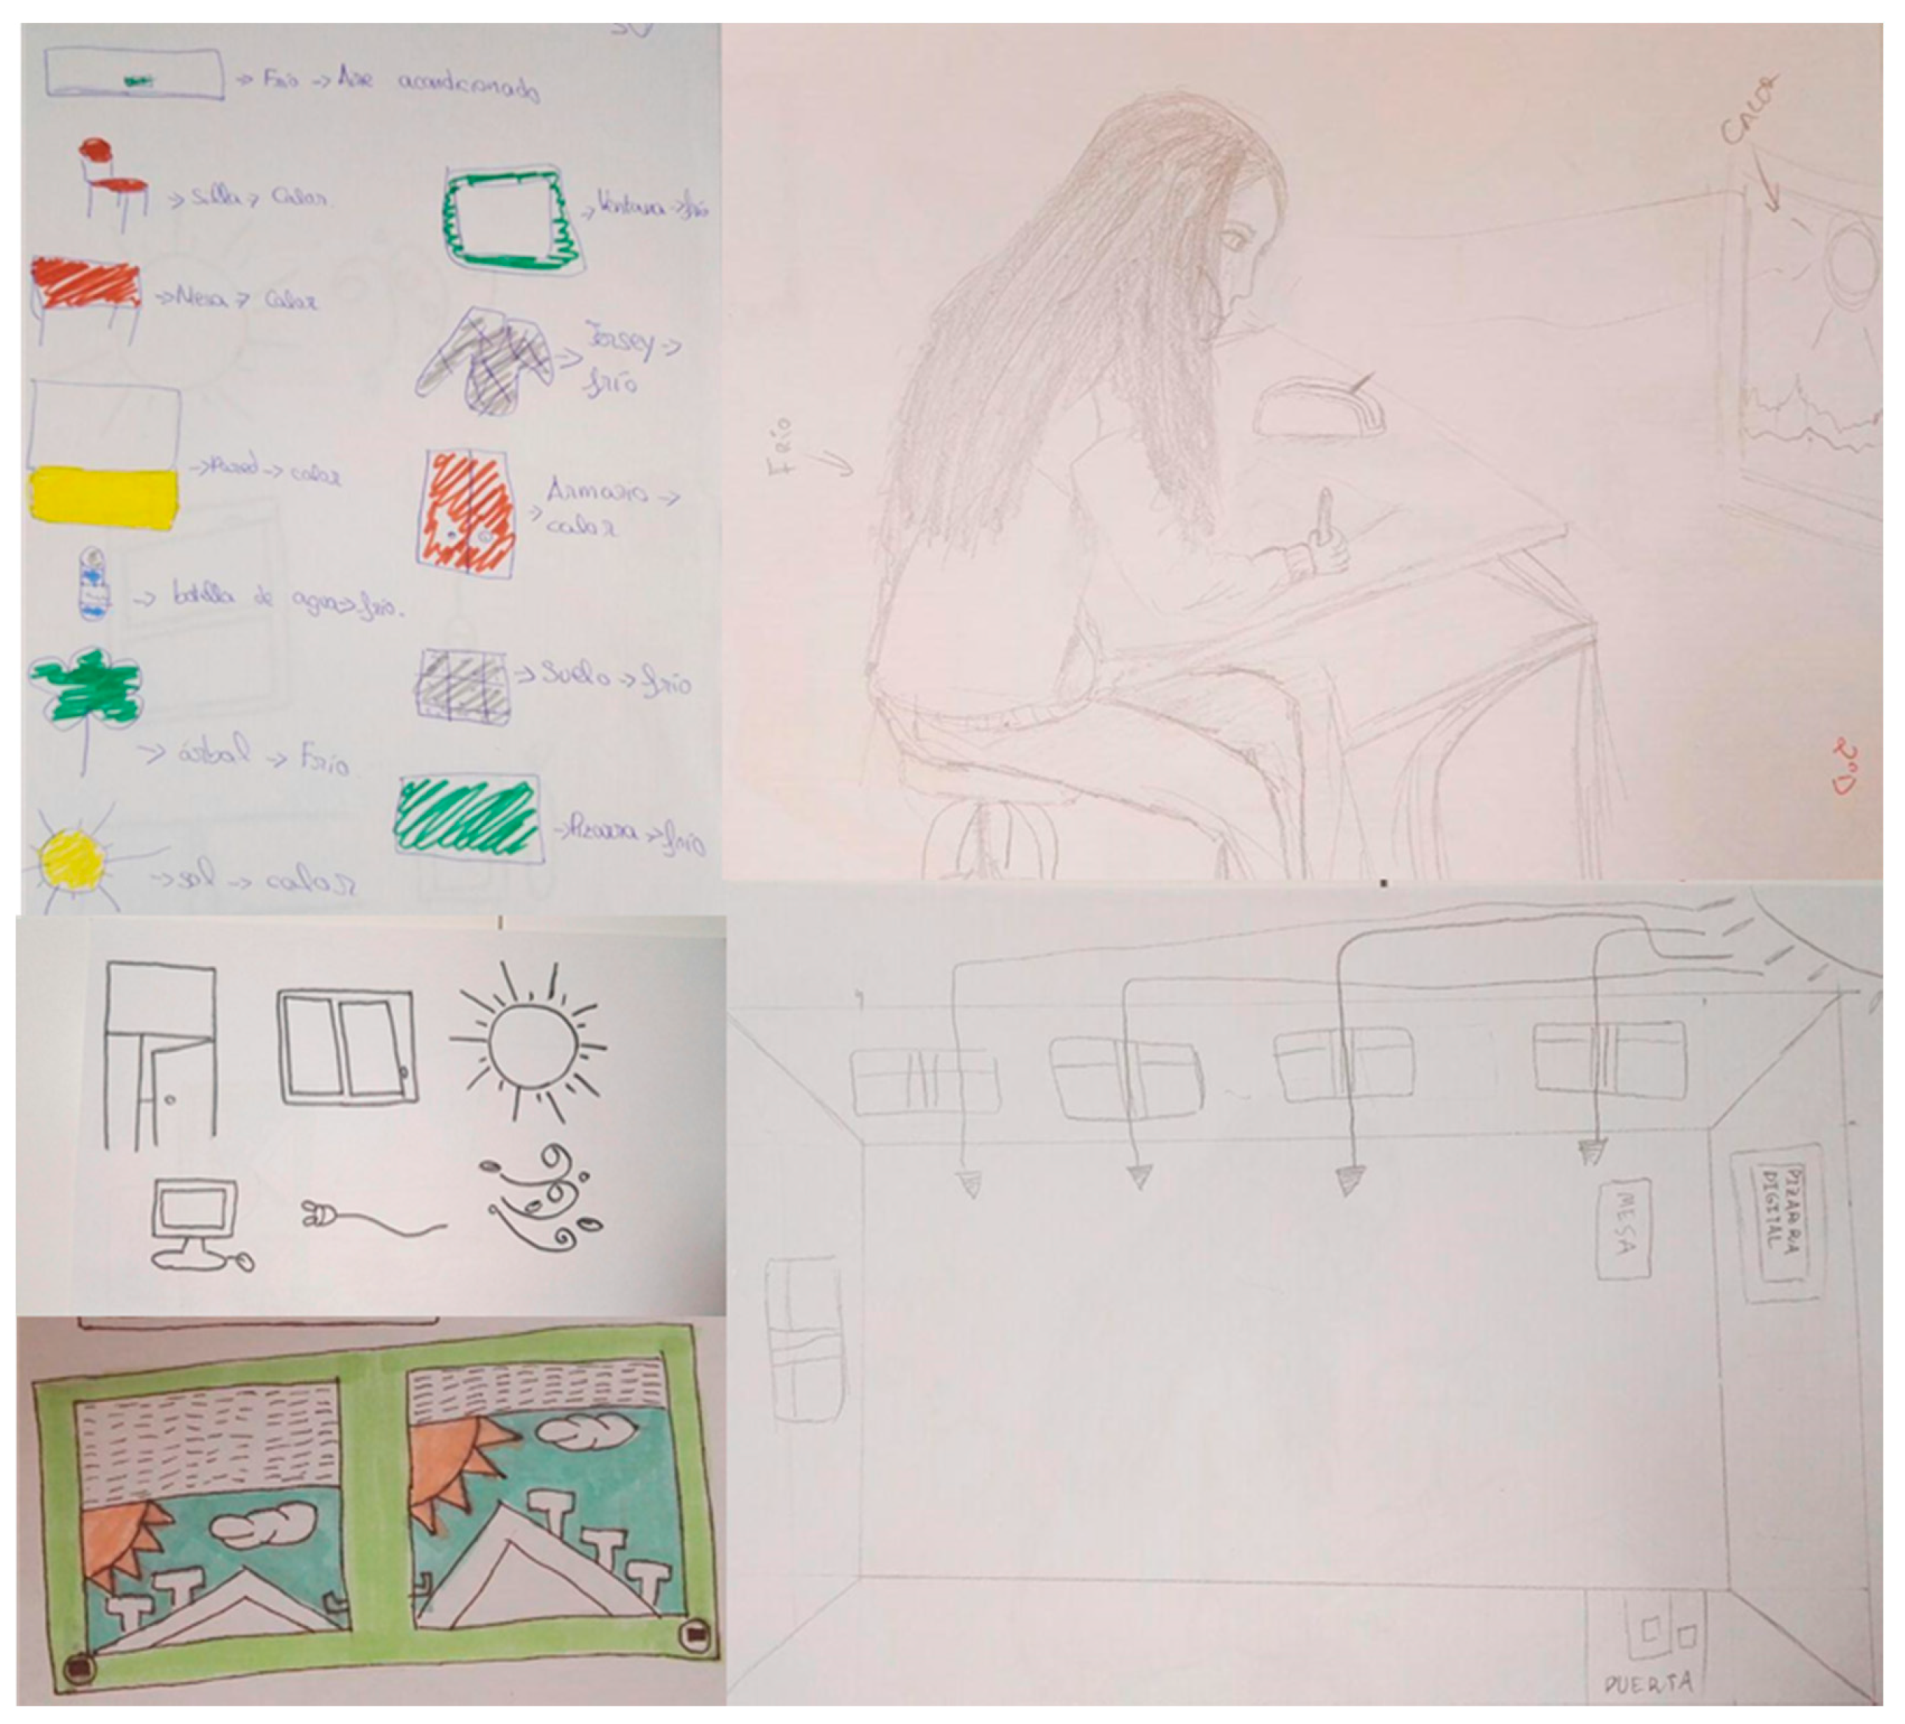
2.3. Qualitative Technique: Drawings
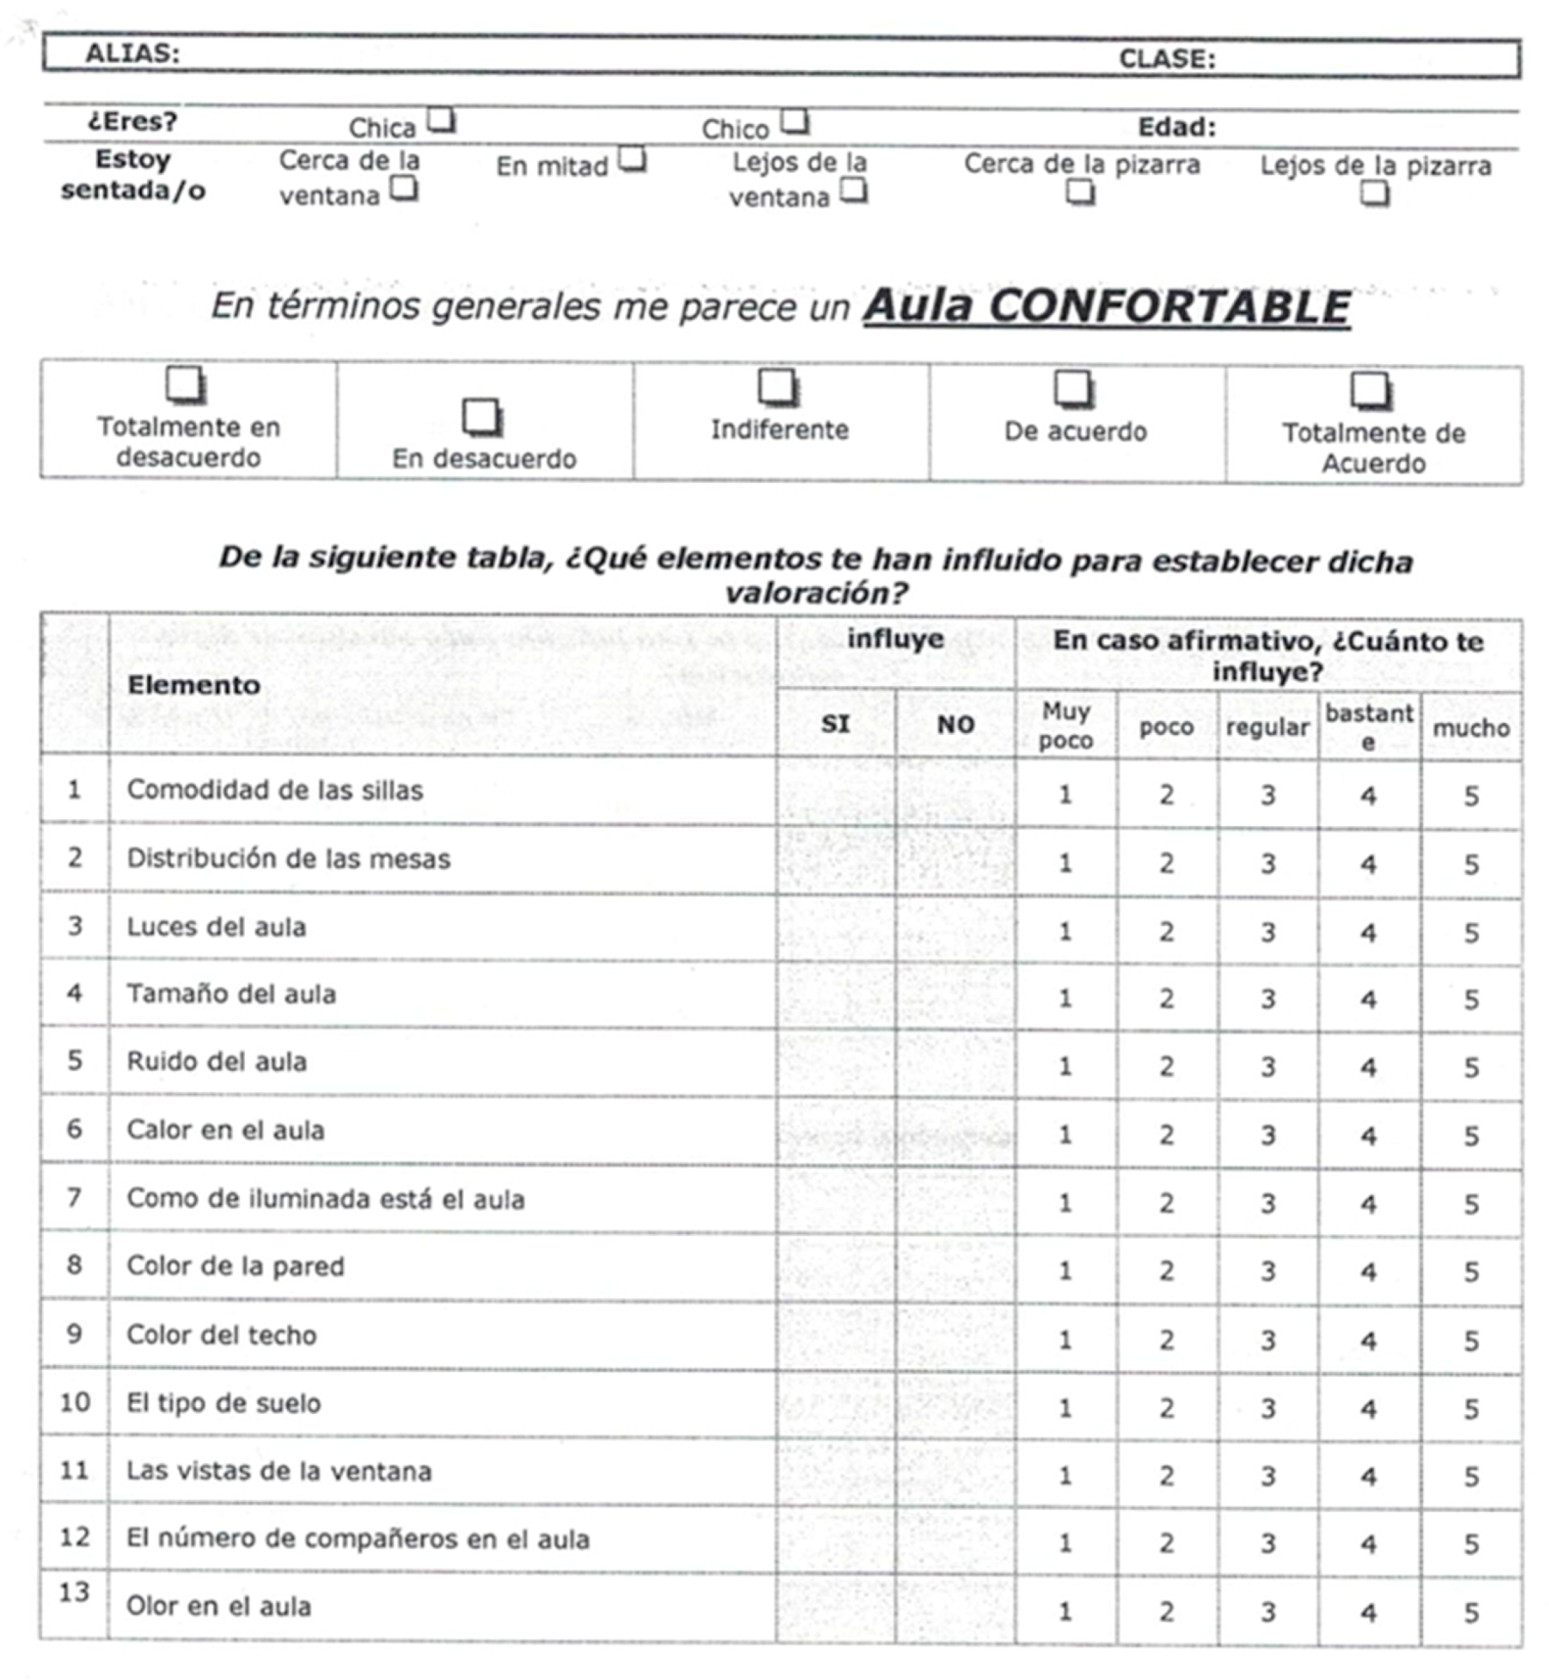
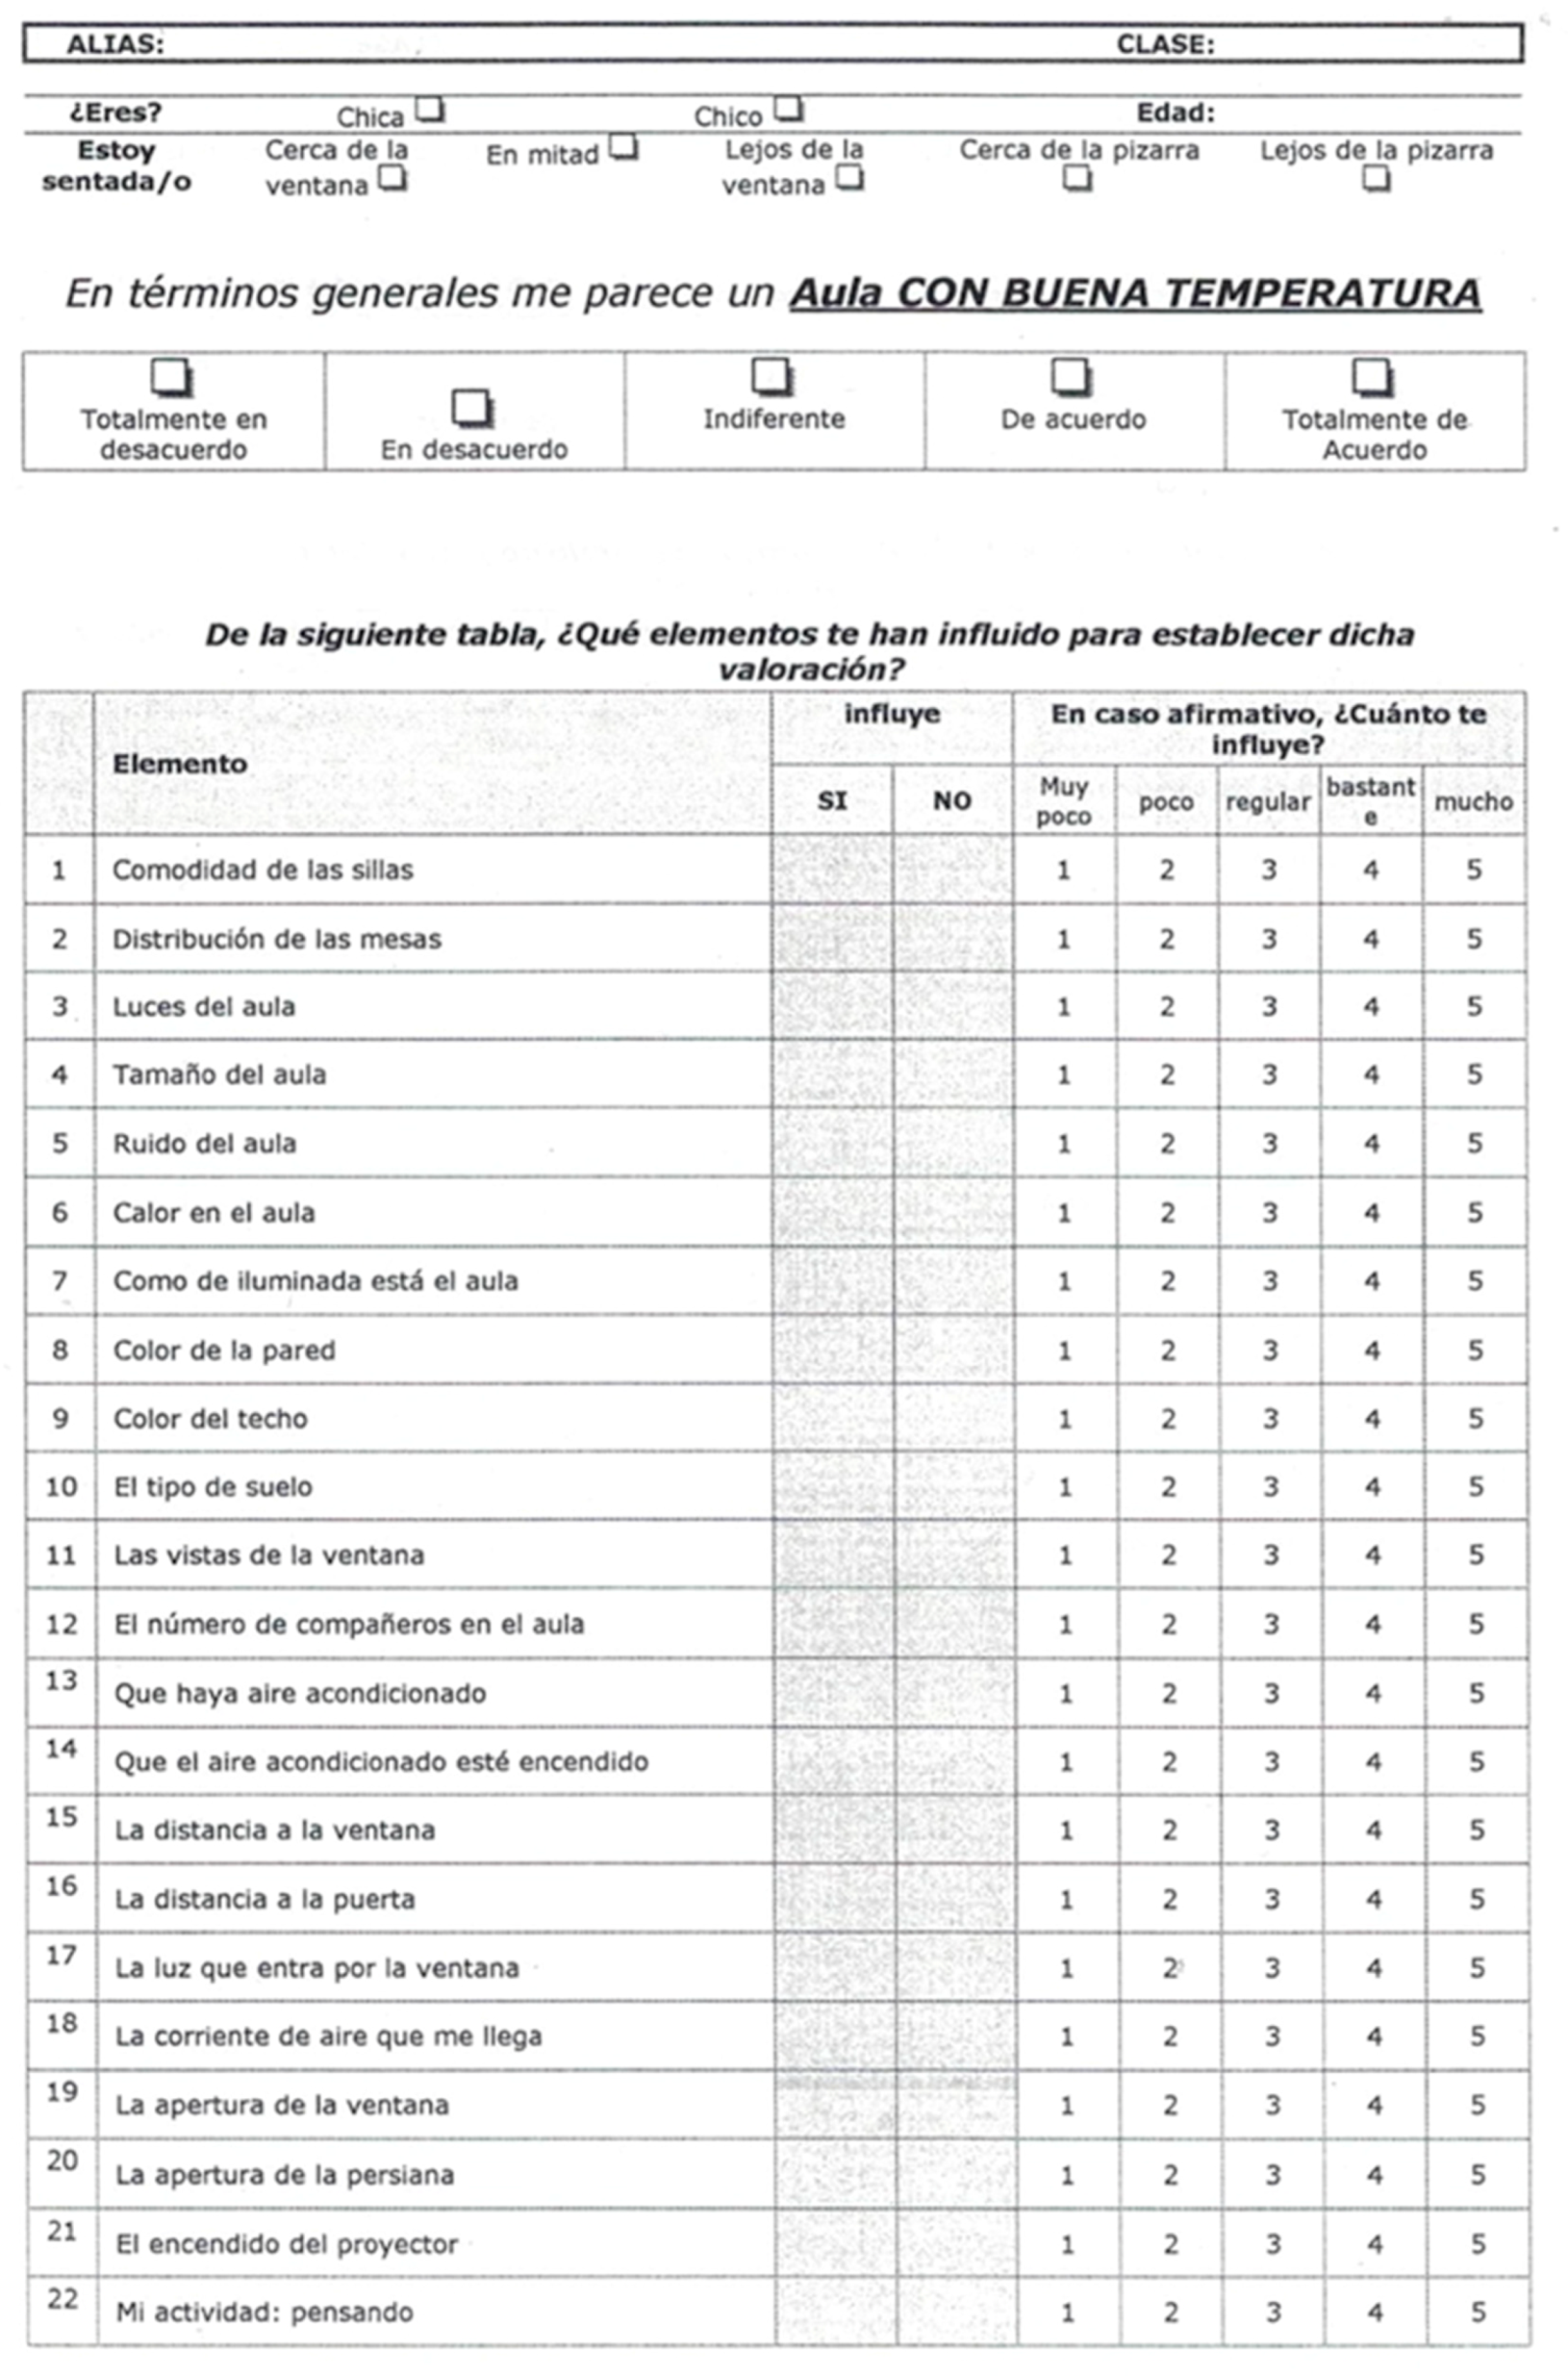
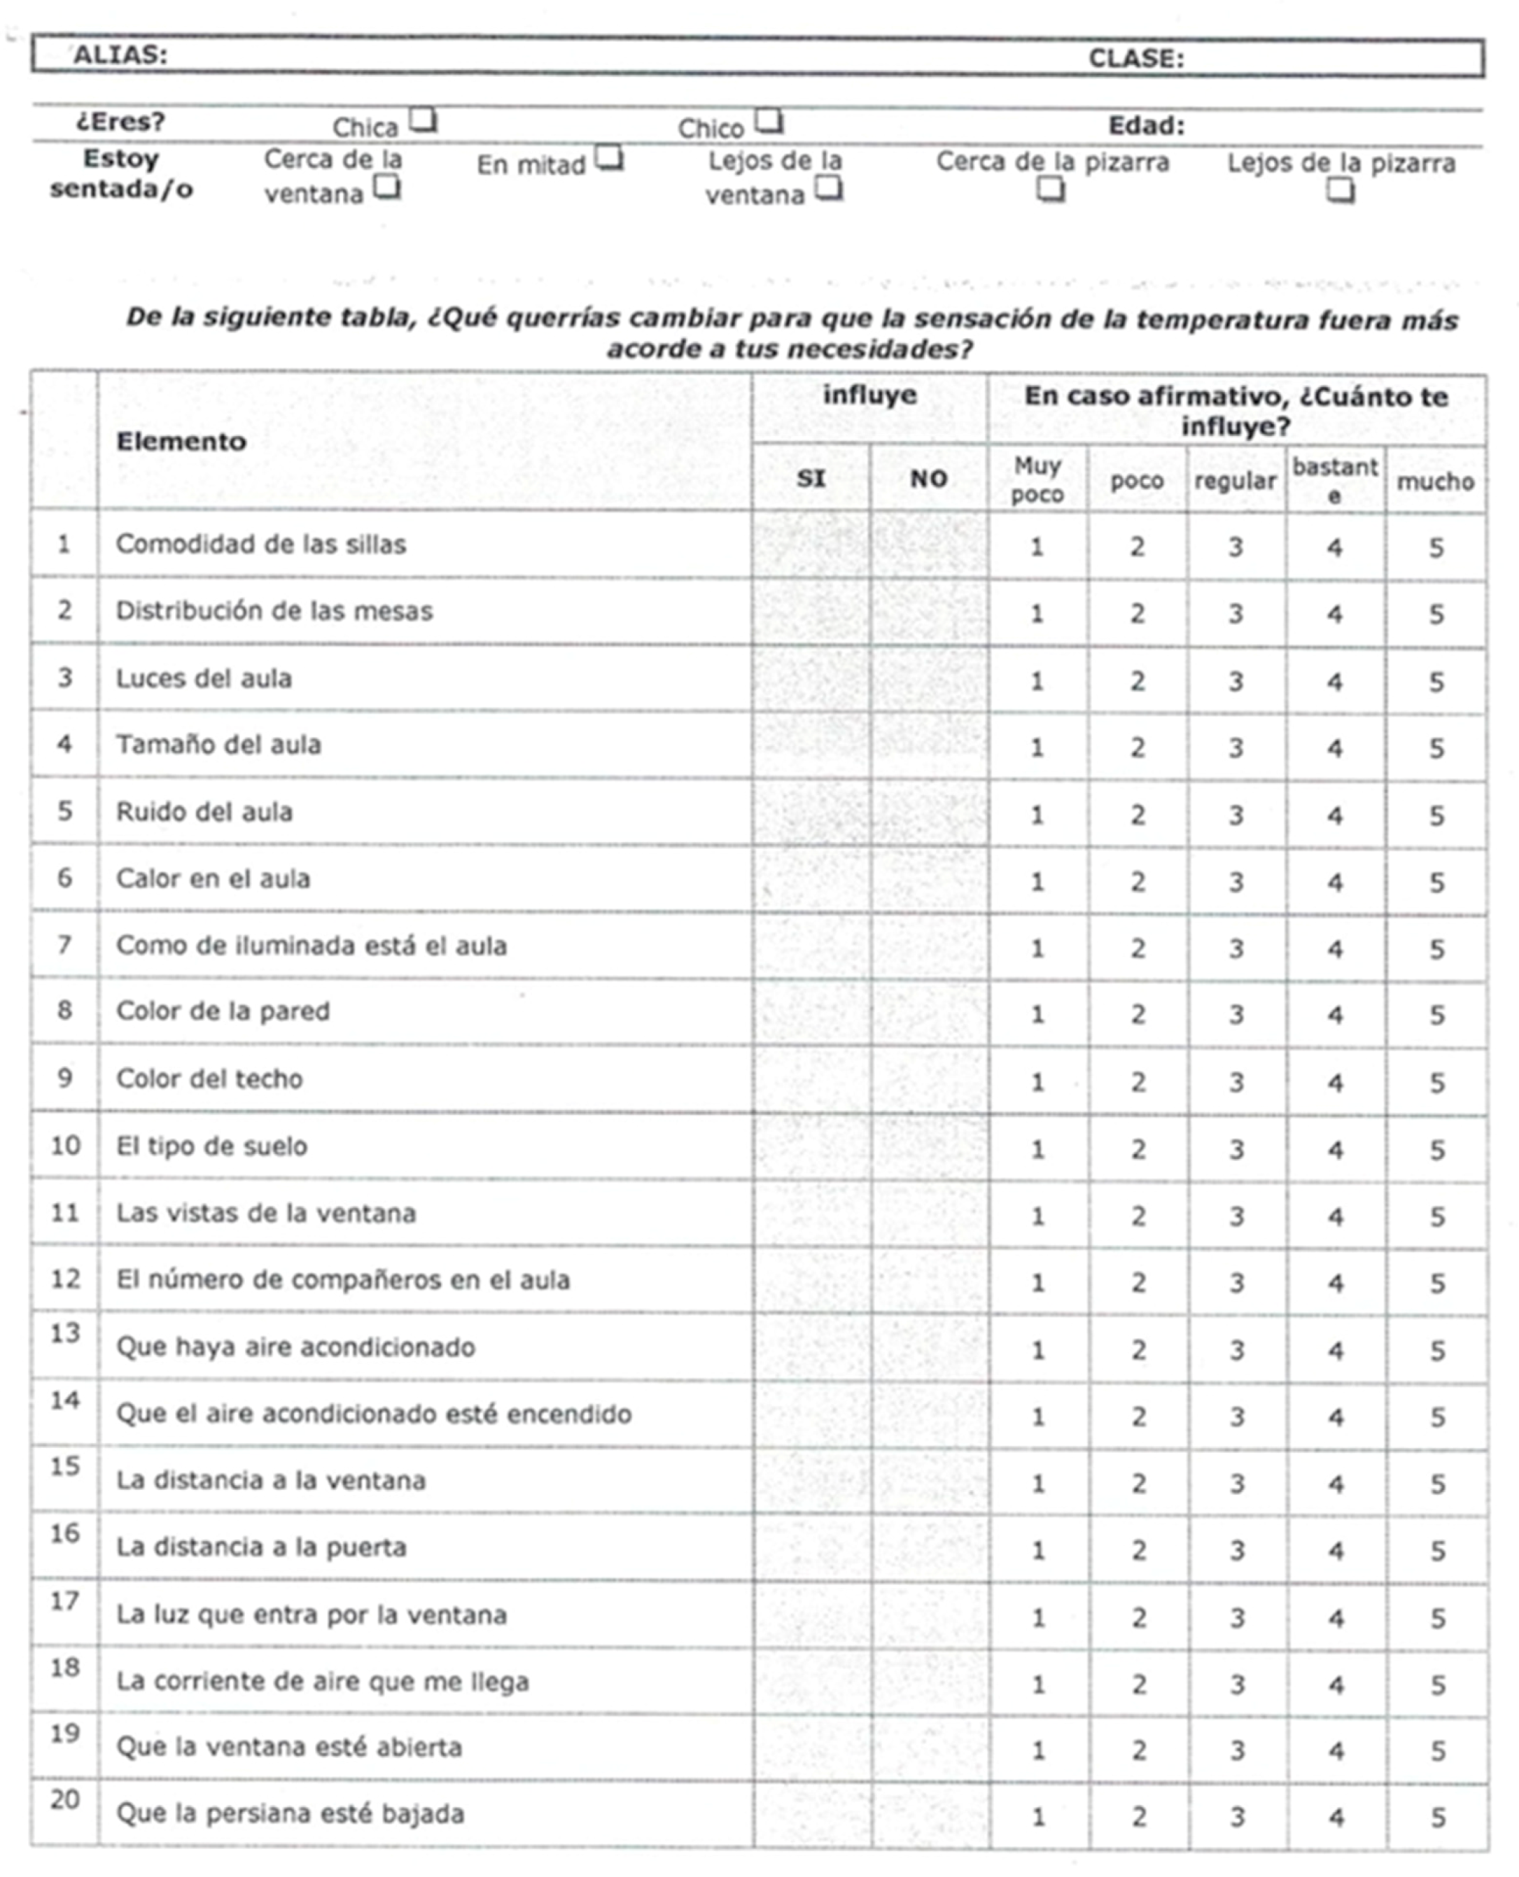
2.4. Questionnaires
2.5. Group Debate
- What do you see here?
- What is really happening here?
- How does this relate to our lives?
- Why does this concern, situation or strength exist?
- How can we become empowered through our new understanding?
- What can we do?
3. Results
- The overcrowding of classrooms (there are 34 students in each class);
- The distribution of the students in the classrooms;
- The students’ activity, it is not the same when coming from physical education or technology classes as coming from theoretical classes;
- Classrooms’ orientation, three case studies have a south orientation.
3.1. Boundary Conditions
3.2. Drawings
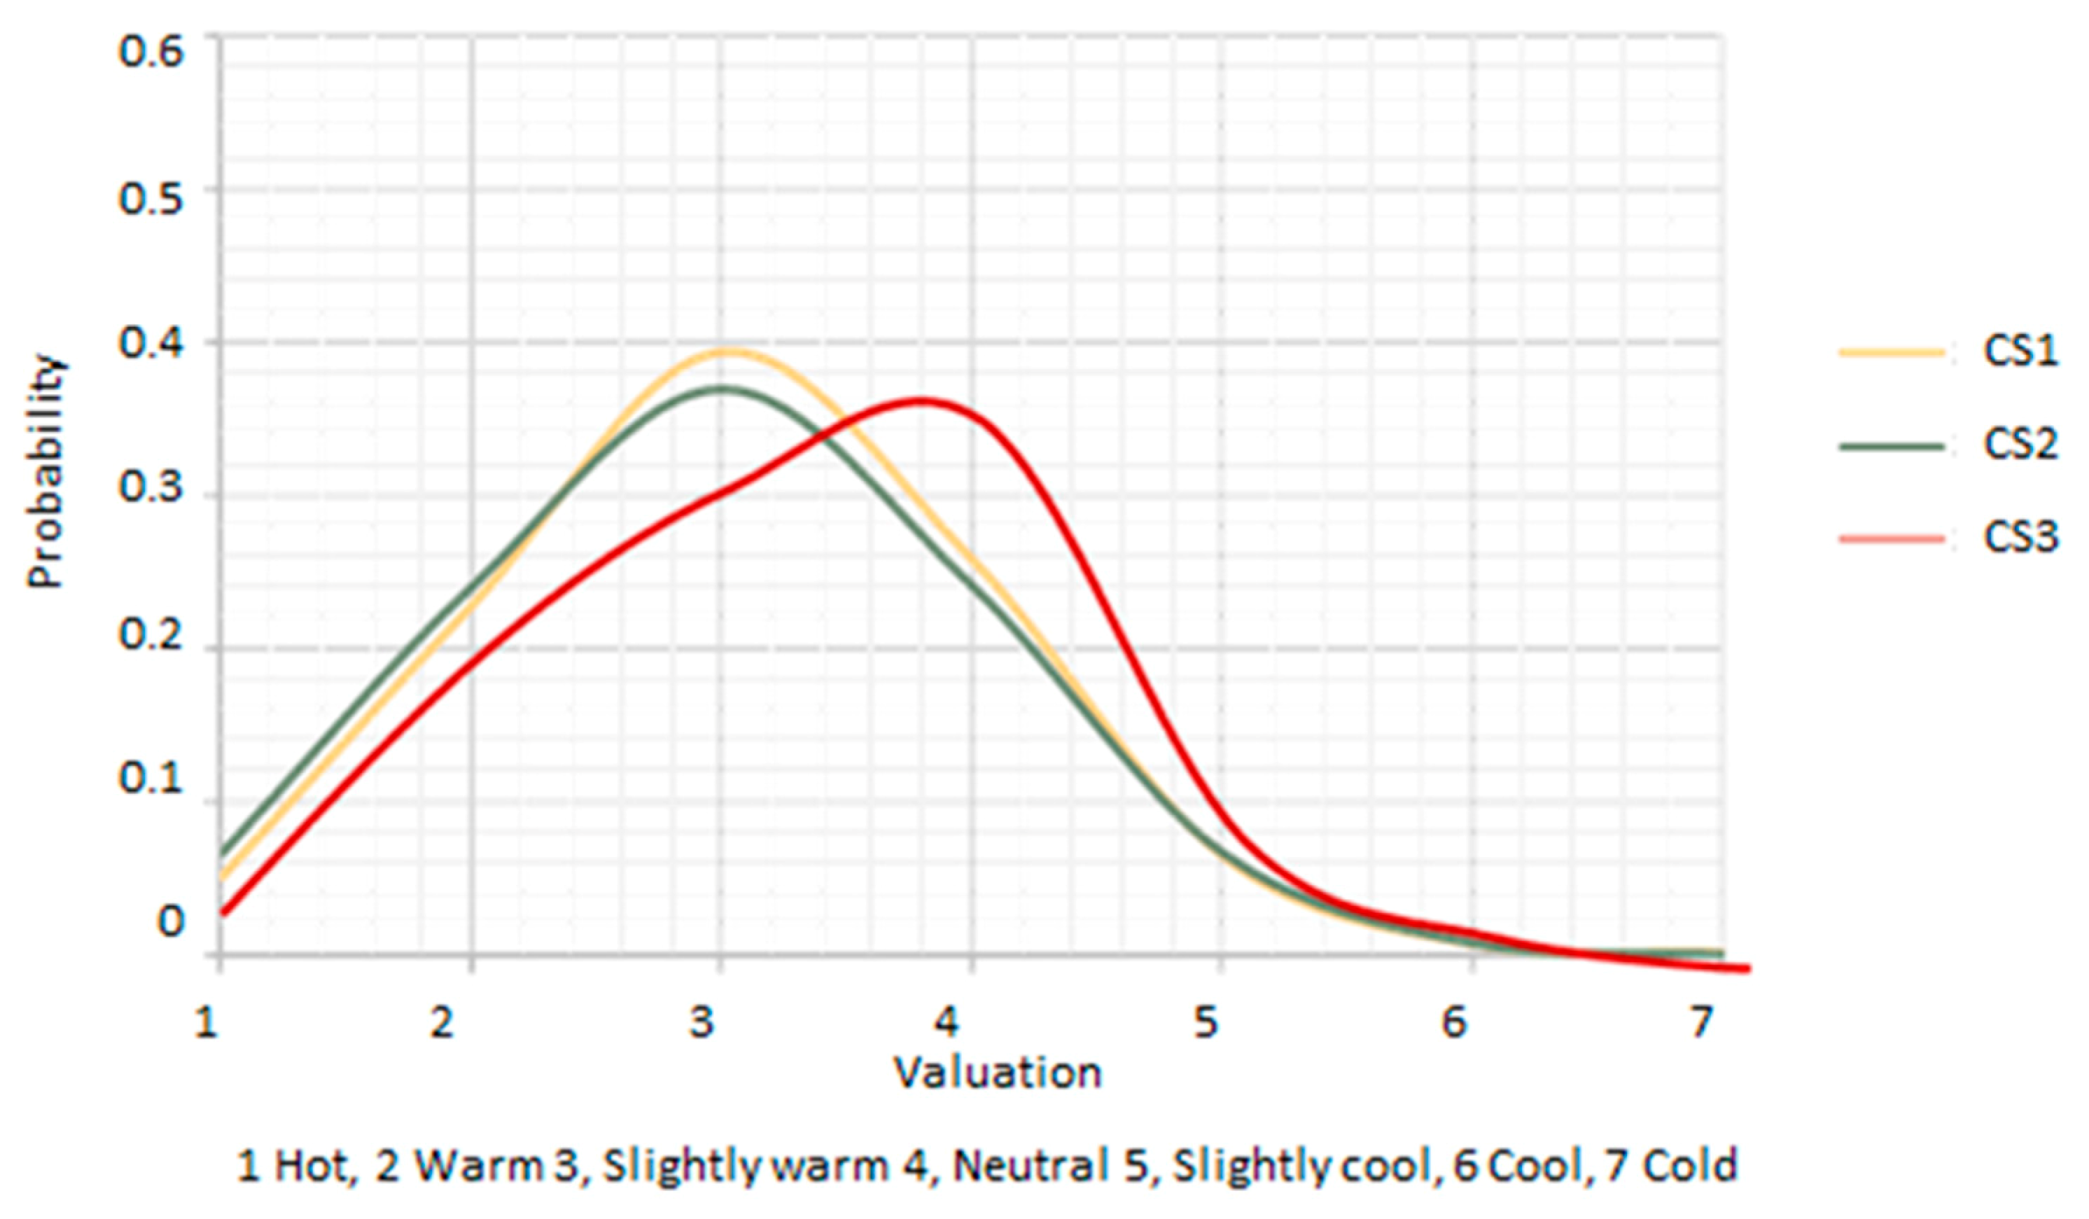
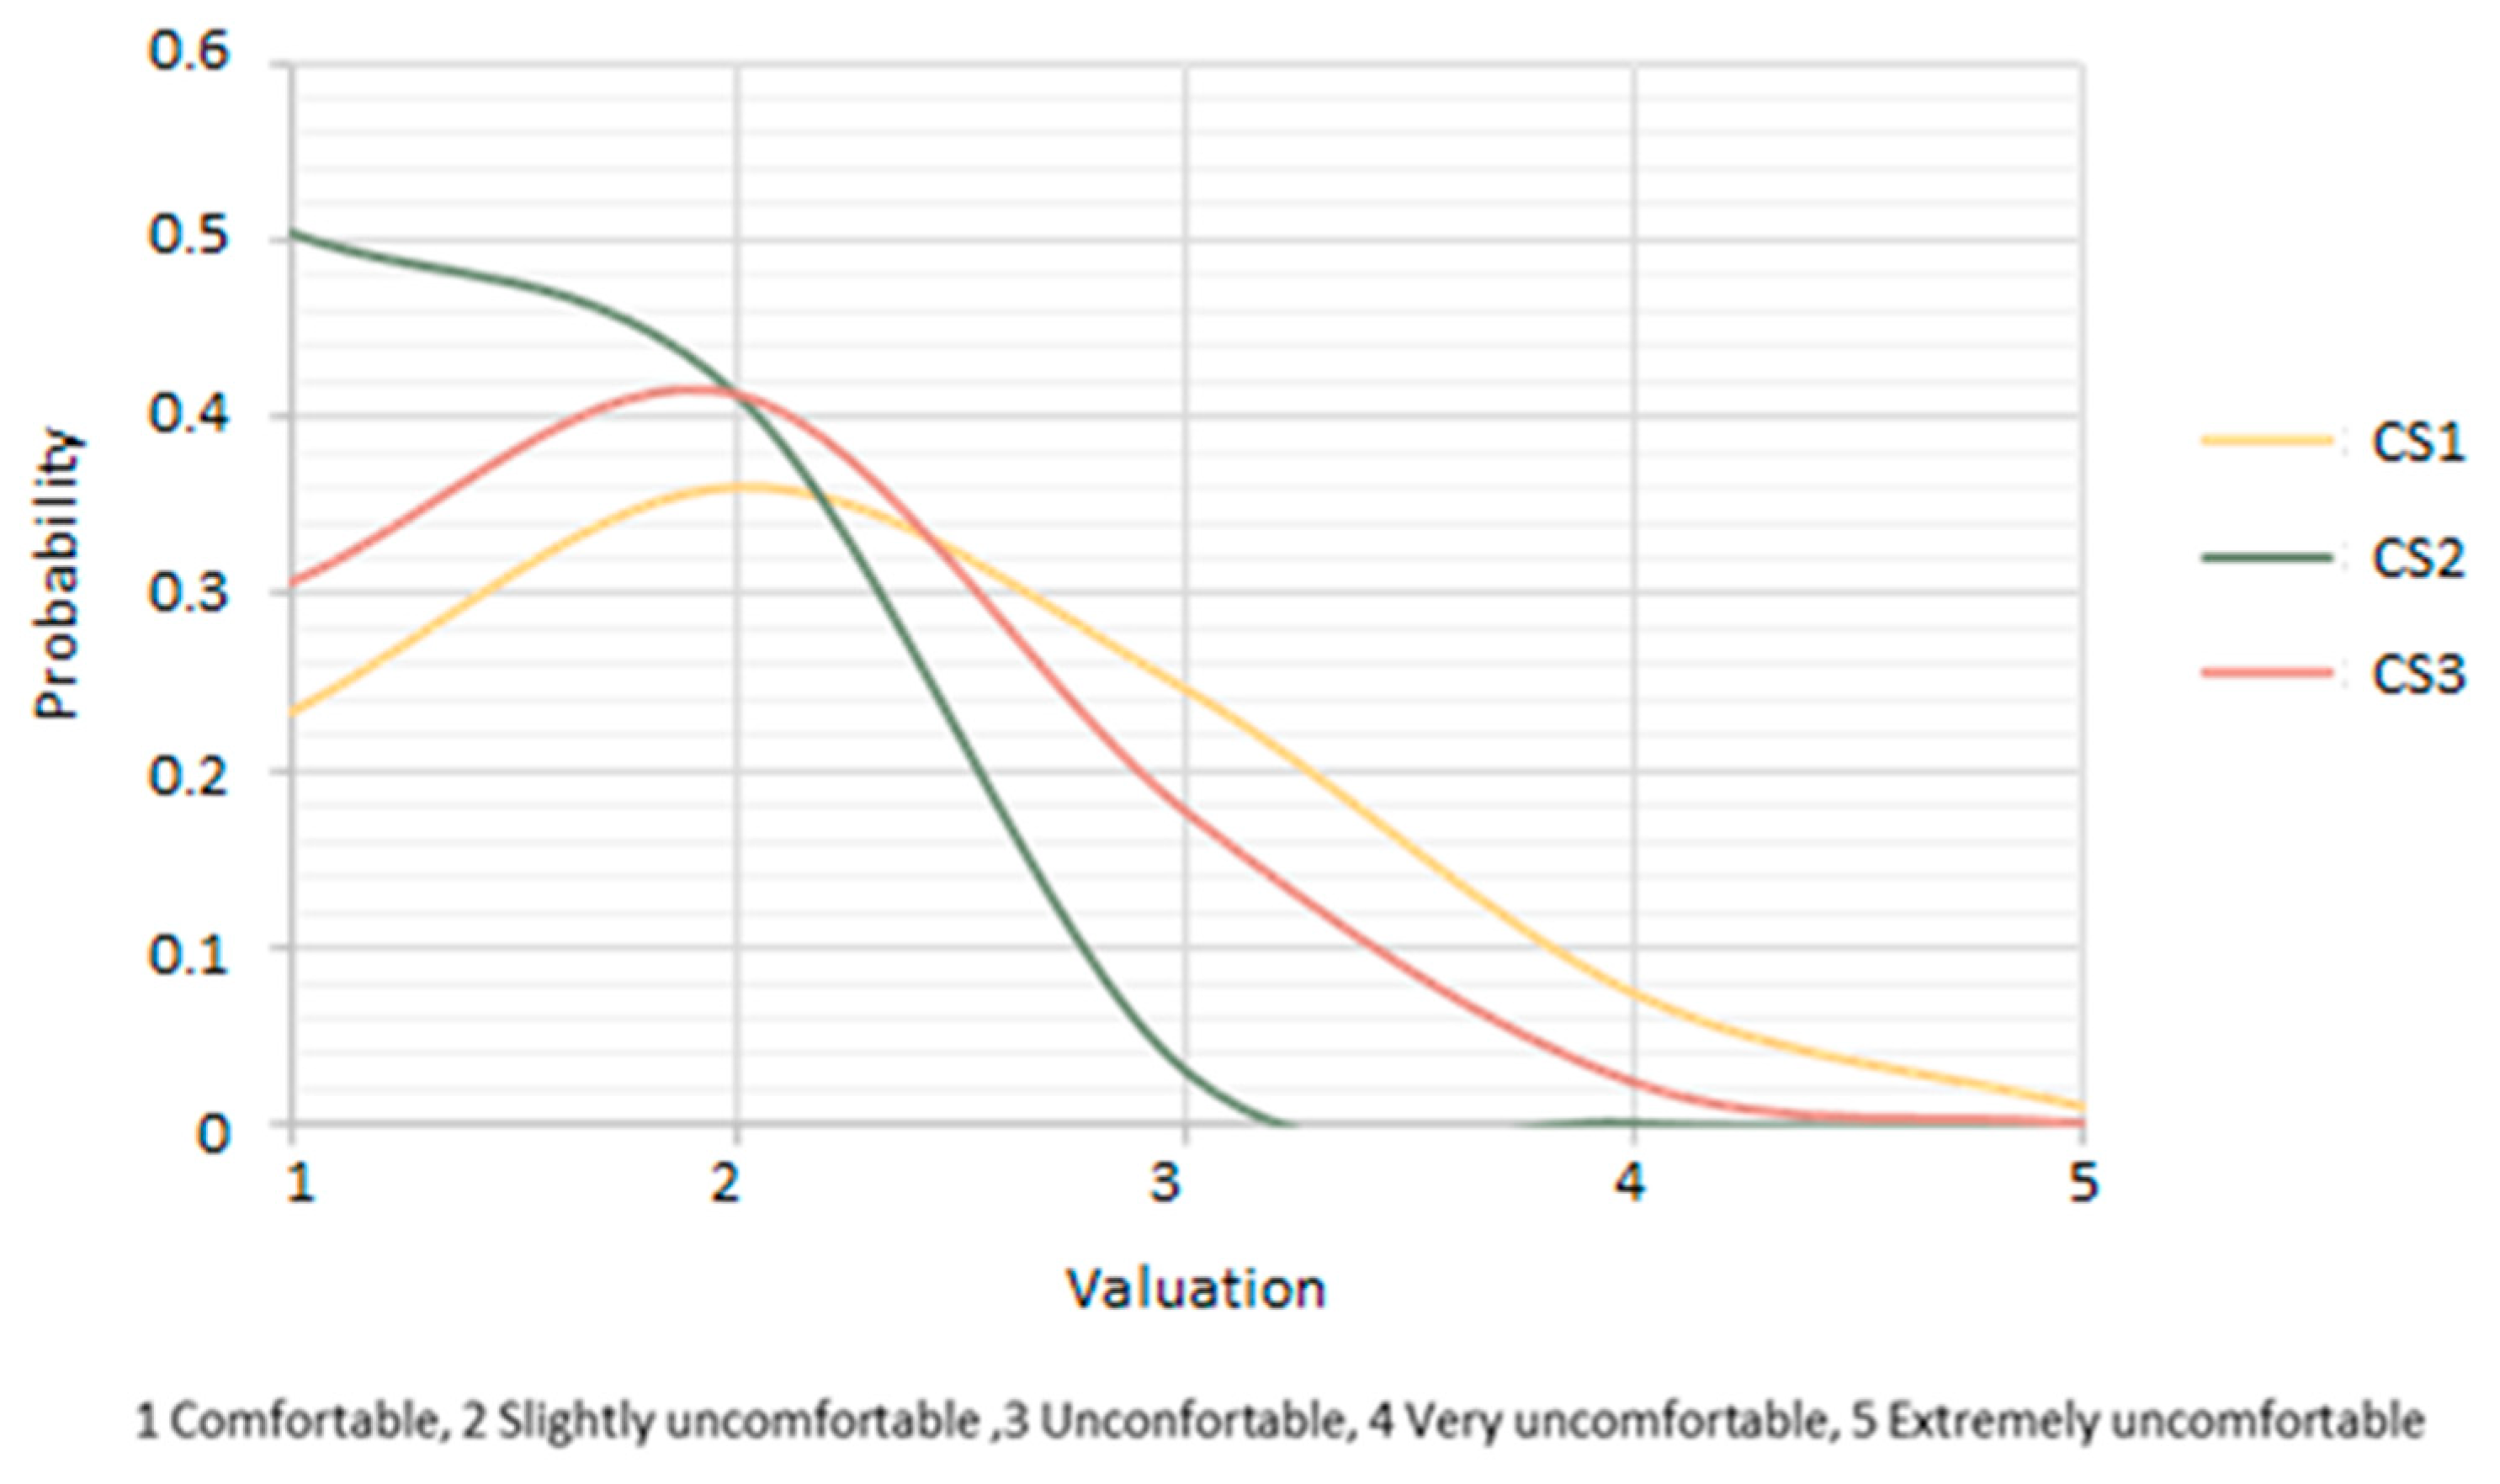
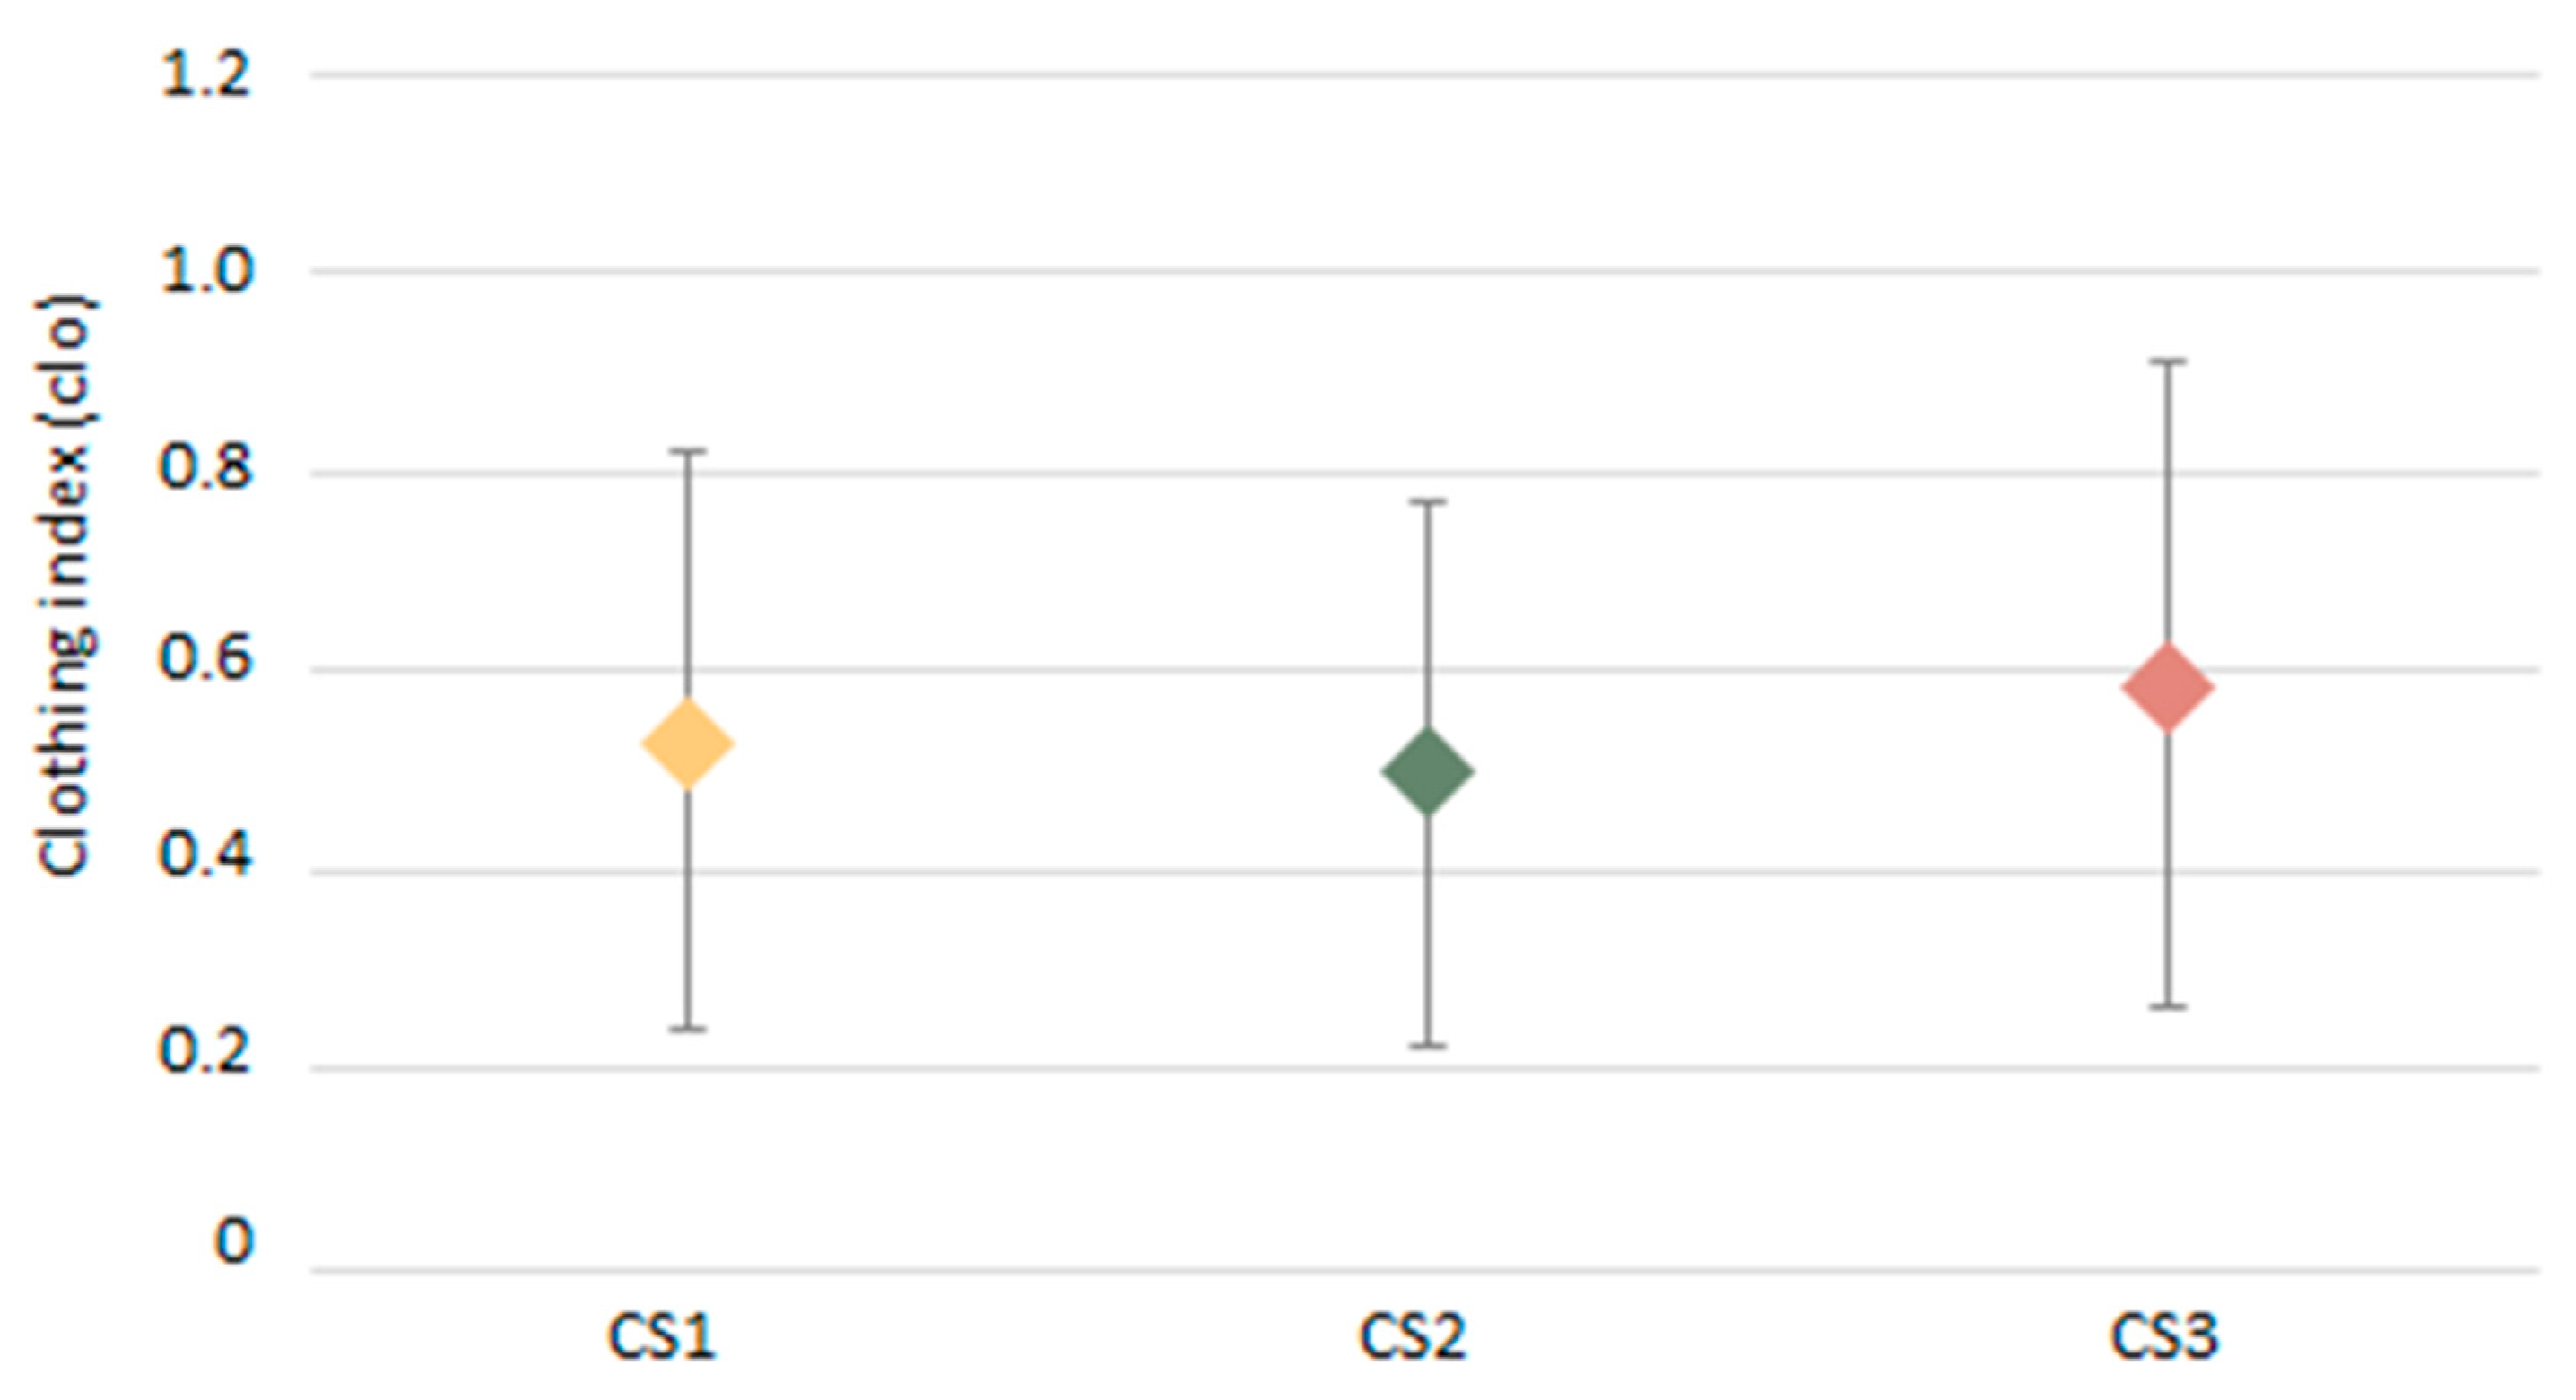
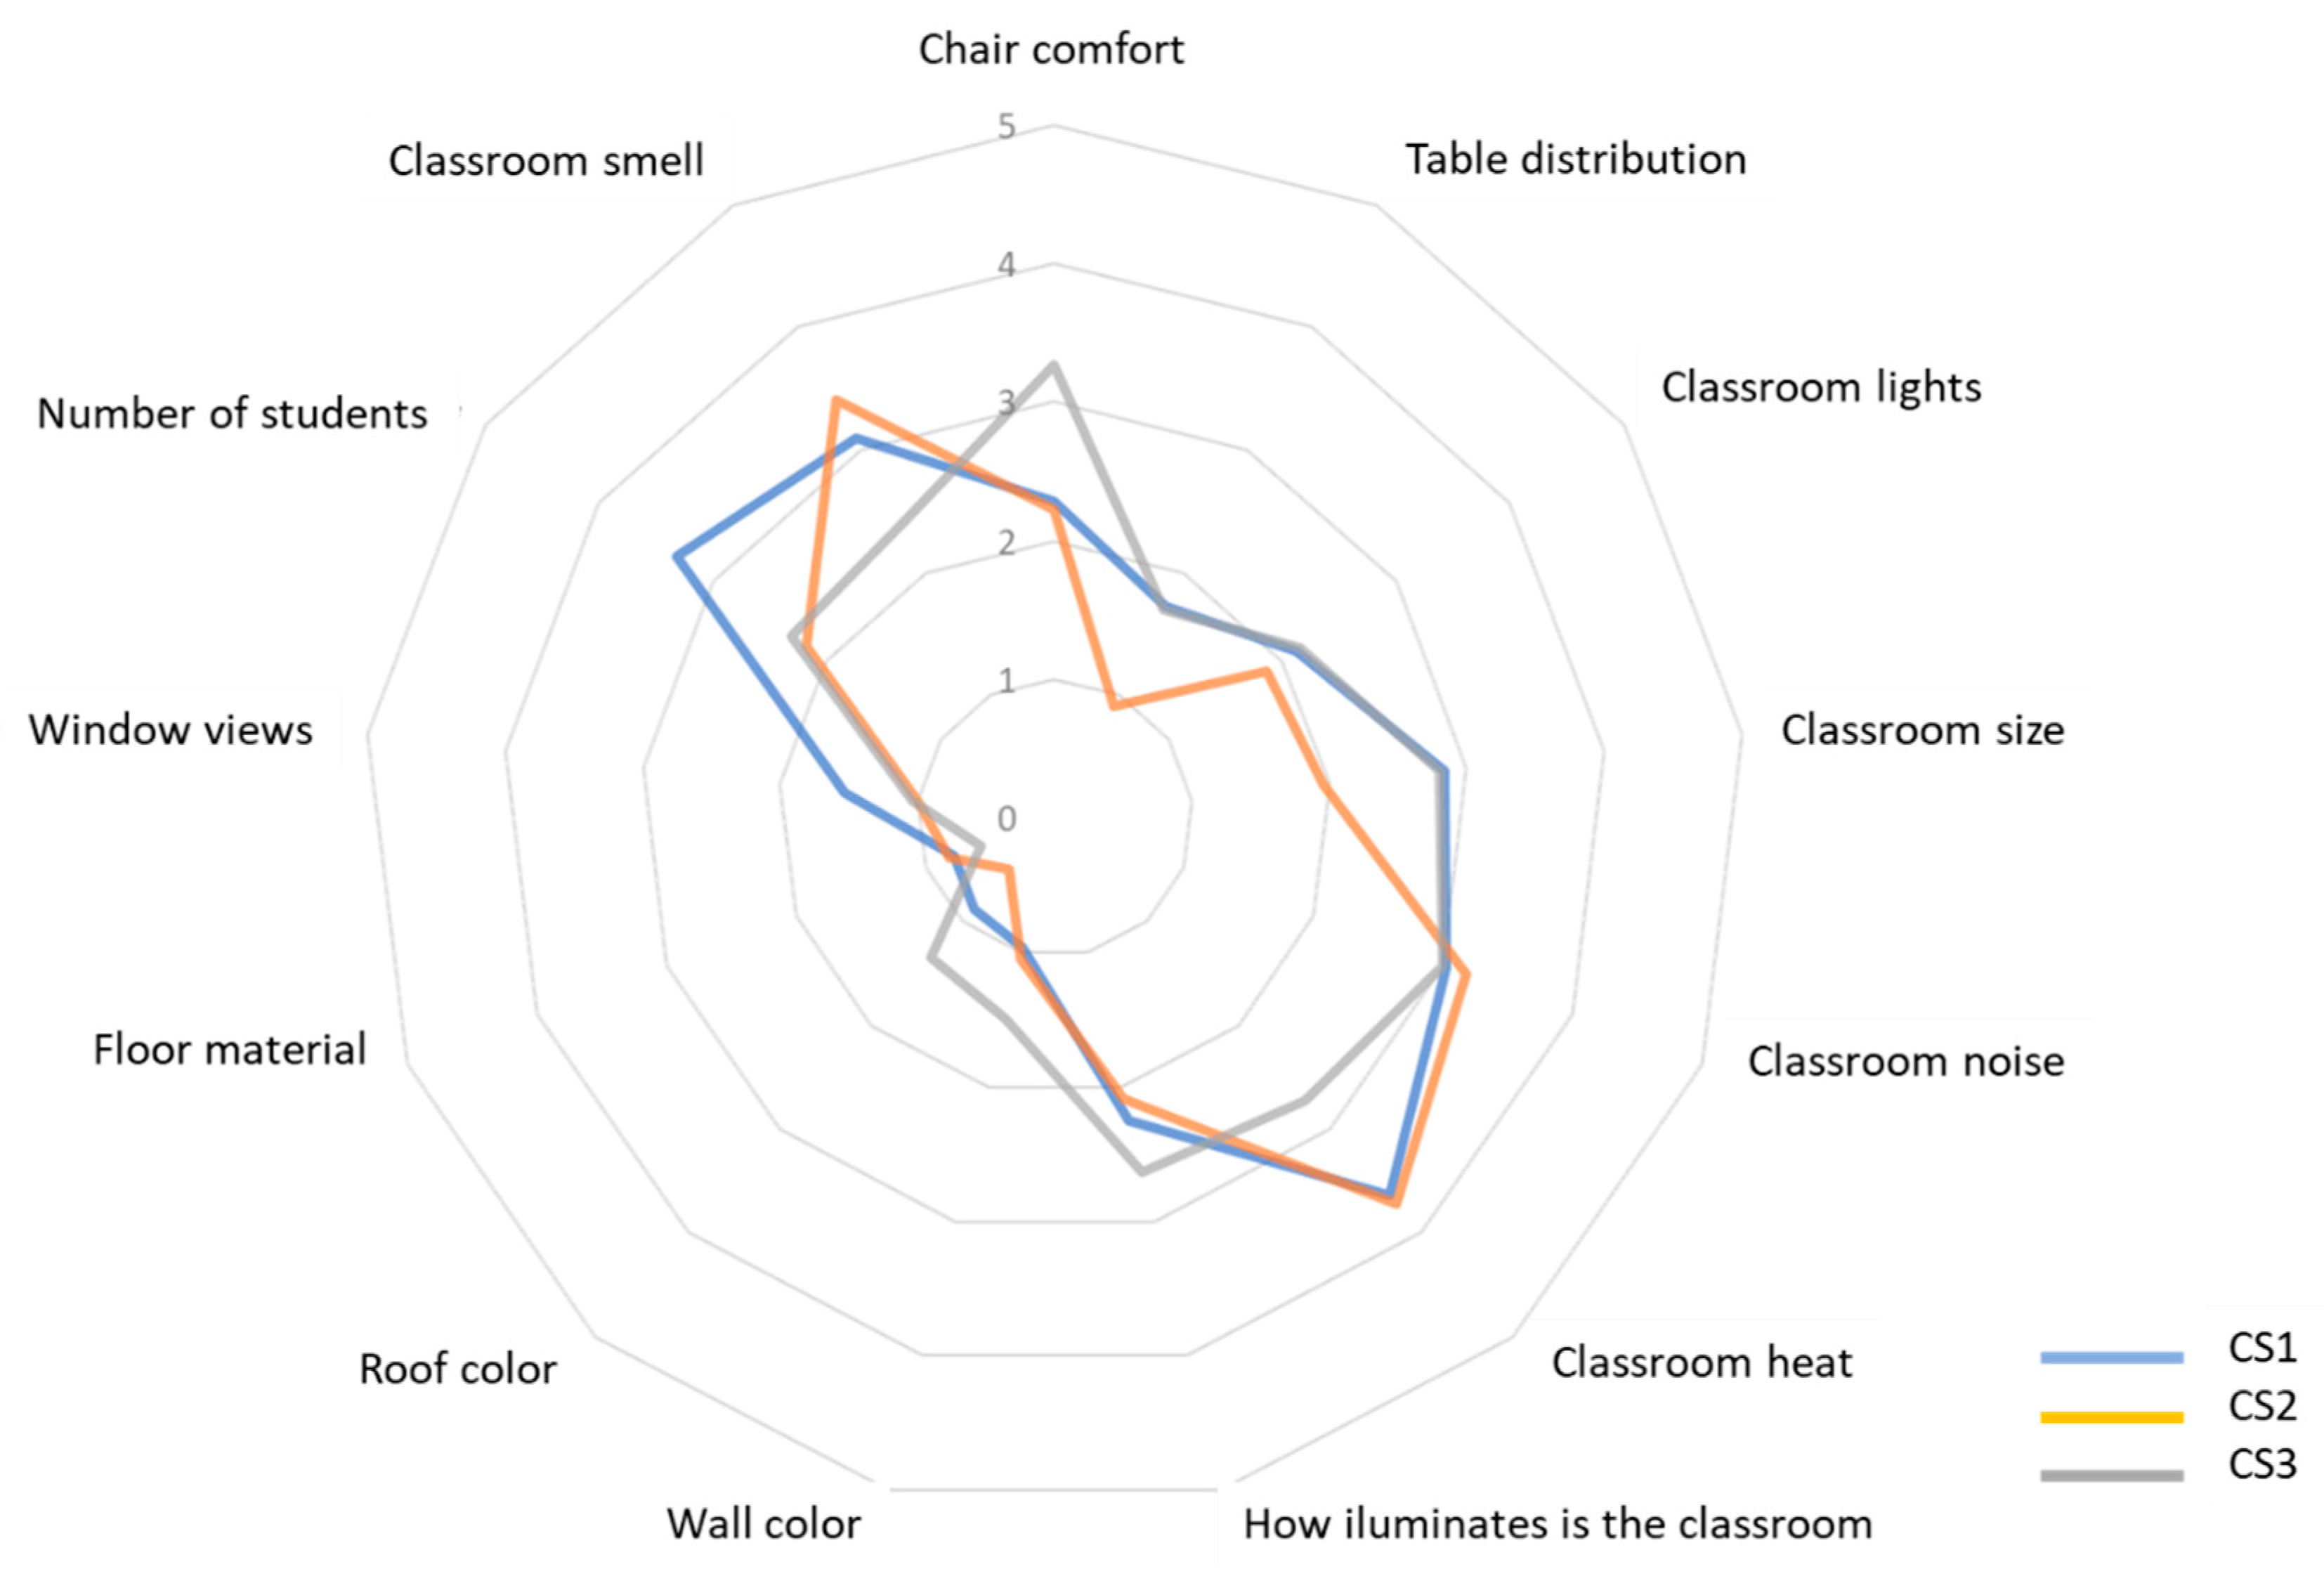
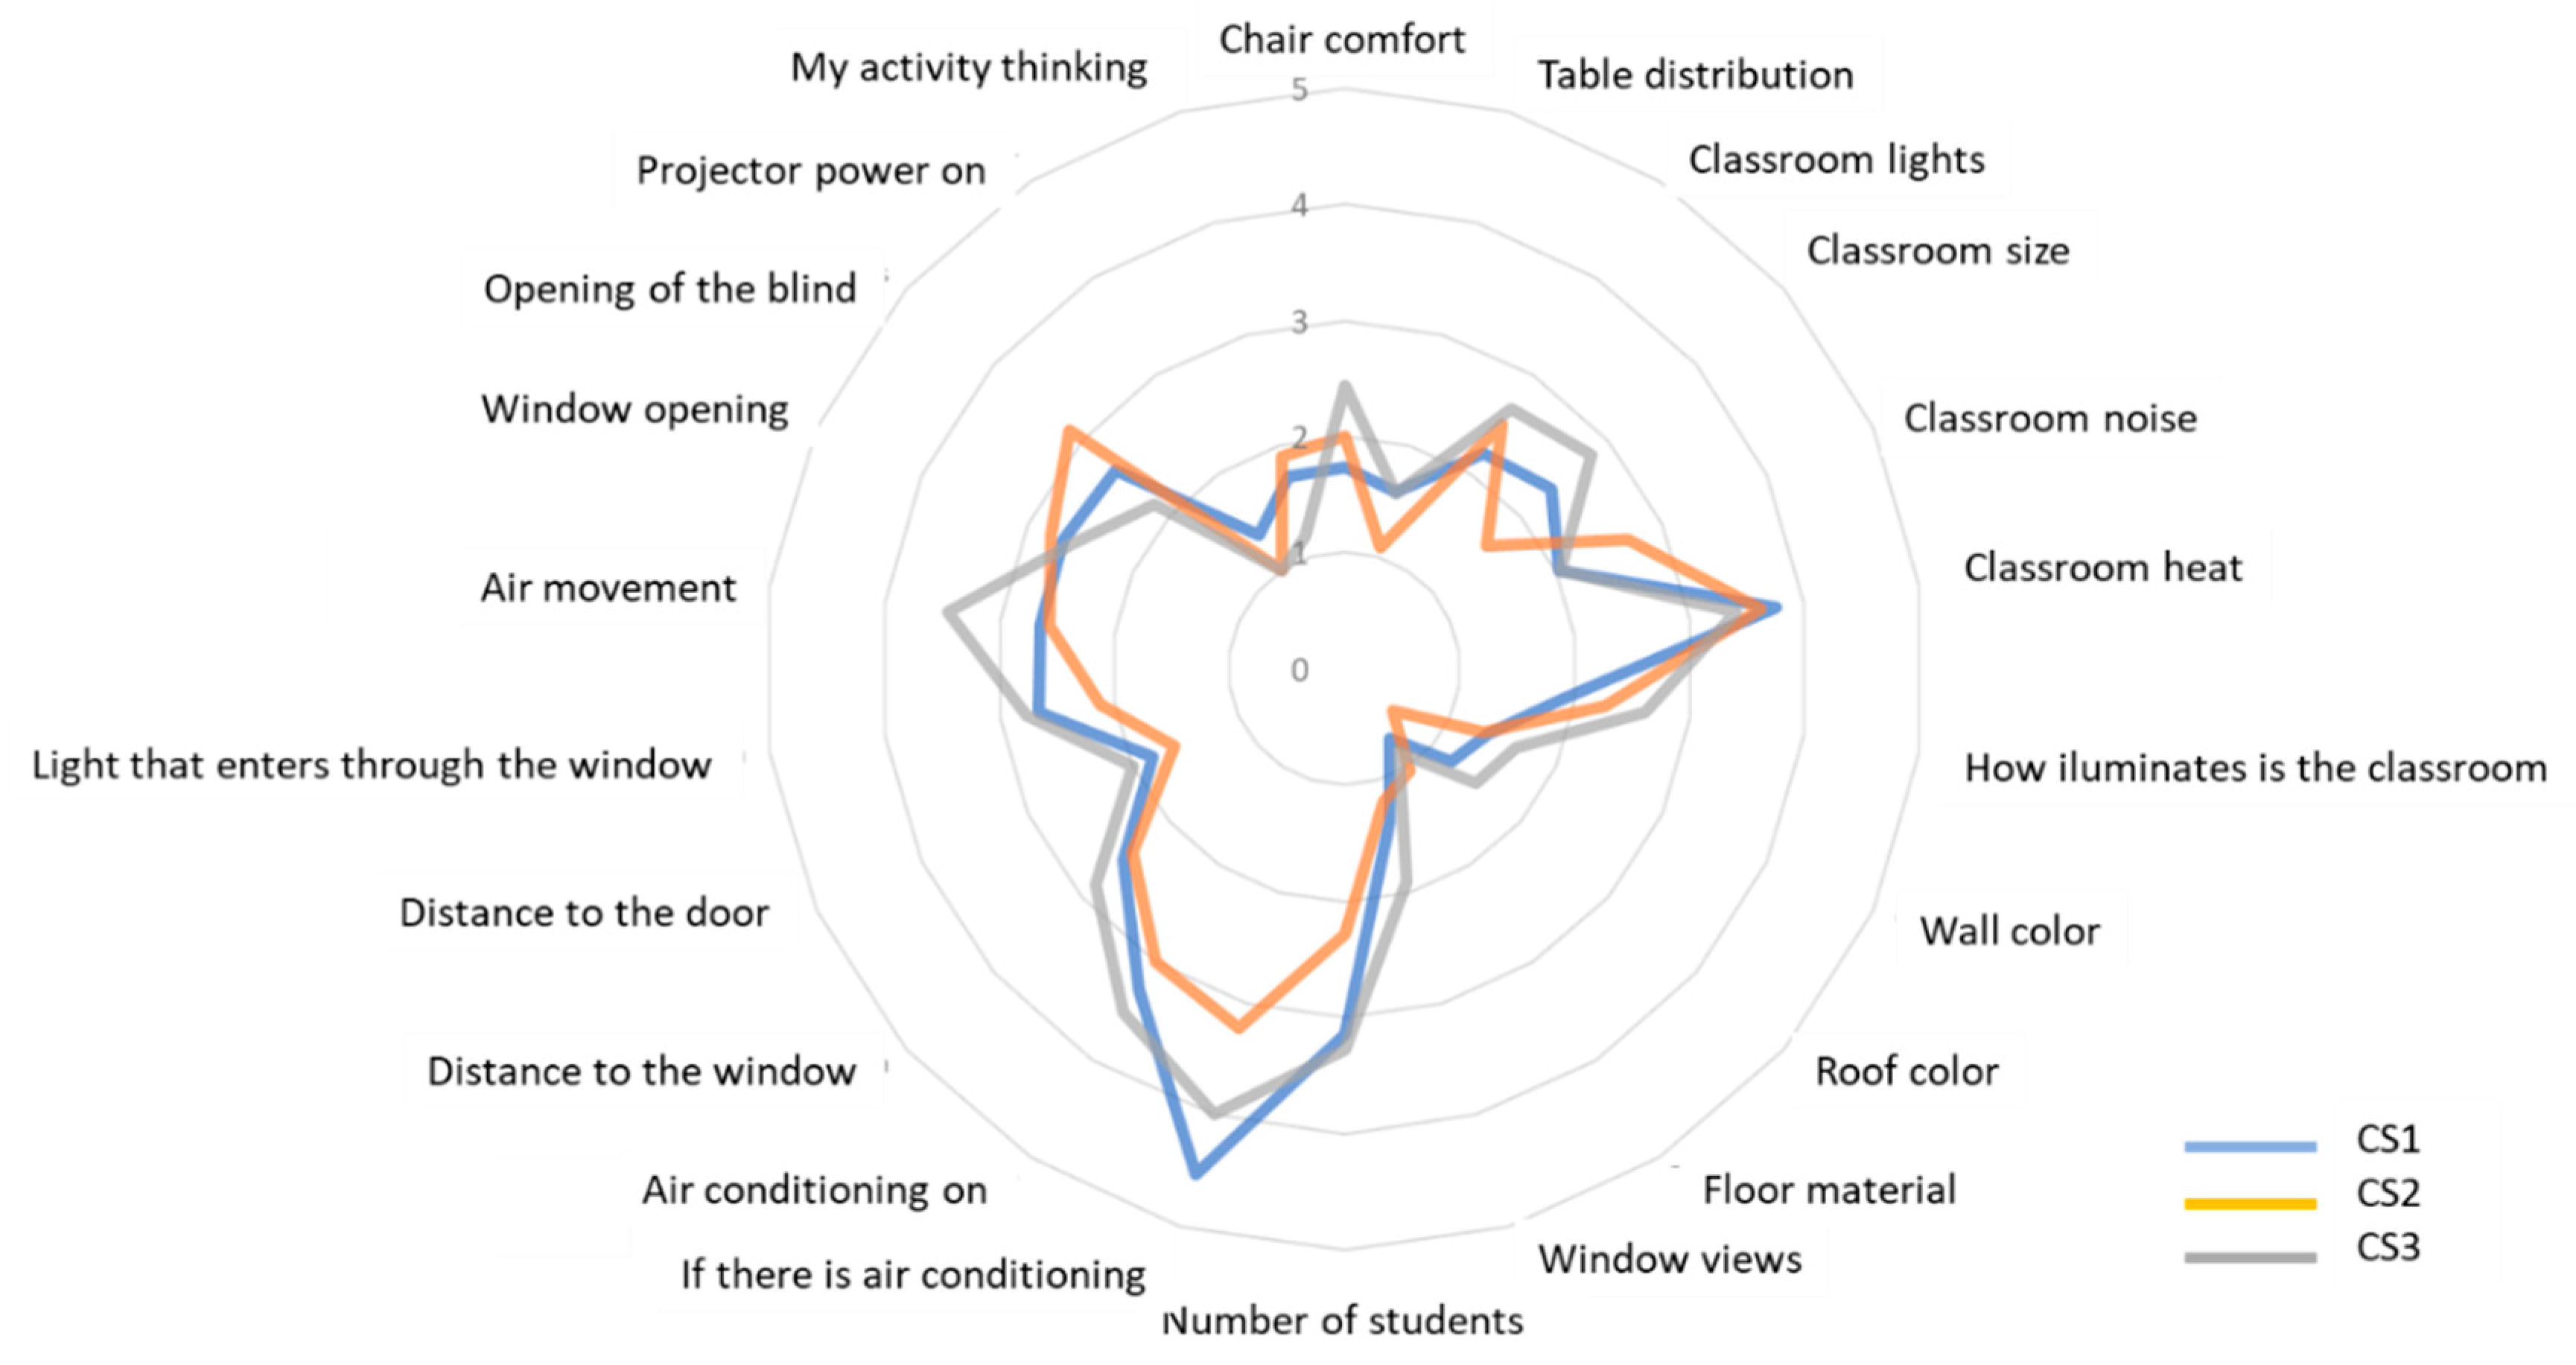
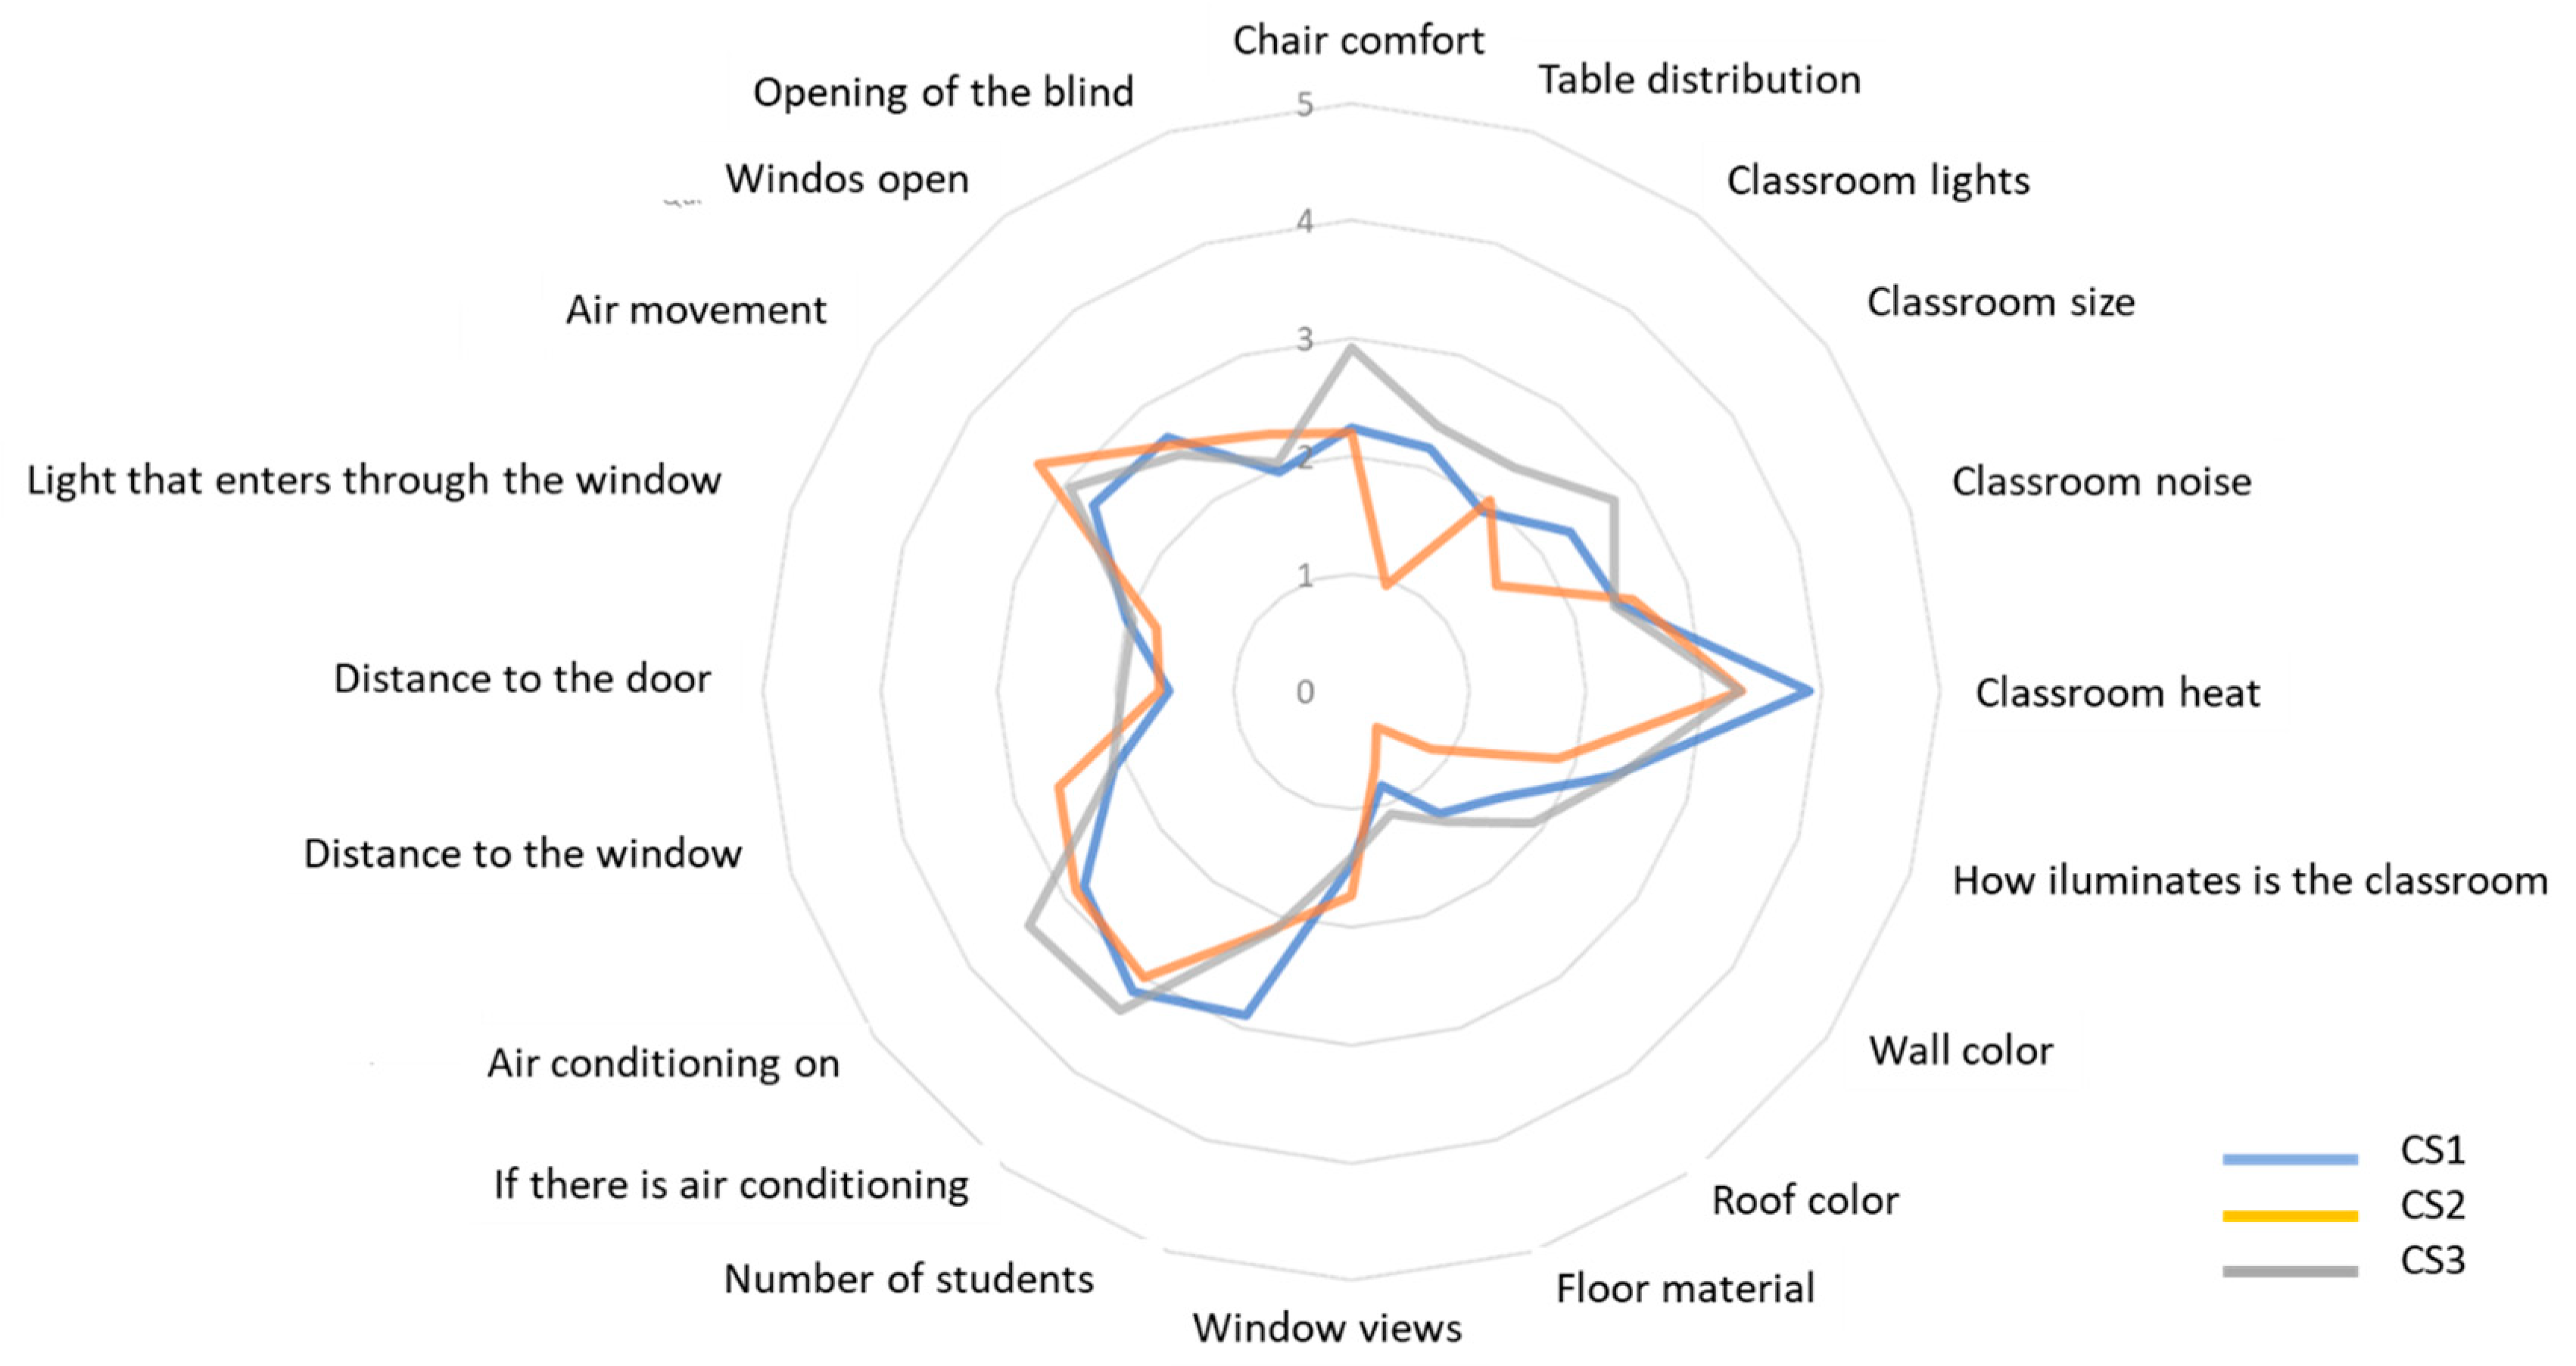
3.3. Questionnaires
3.4. Group Debate
4. Discussion
5. Conclusions
Author Contributions
Funding
Conflicts of Interest
Appendix A


References
- Lusinga, S.; de Groot, J. Energy consumption behaviours of children in low-income communities: A case study of Khayelitsha, South Africa. Energy Res. Soc. Sci. 2019, 54, 199–210. [Google Scholar] [CrossRef]
- Sanchez-Guevara, C.; Peiró, M.N.; Taylor, J.; Mavrogianni, A.; González, J.N. Assessing population vulnerability towards summer energy poverty: Case studies of Madrid and London. Energy Build. 2019, 190, 132–143. [Google Scholar] [CrossRef] [Green Version]
- Ballester, F.; Díaz, J.; Moreno, J.M. Cambio climático y salud pública: Escenarios después de la entrada en vigor del Protocolo de Kioto. Gac. Sanit. 2006, 20, 160–174. [Google Scholar] [CrossRef] [Green Version]
- Linares, C.; Jiménez, J.D. Impact of heat waves on daily mortality in distinct age groups. Gac. Sanit. 2008, 22, 115–119. [Google Scholar] [CrossRef] [PubMed] [Green Version]
- Ortiz, C.; Linares, C.; Carmona, R.; Díaz, J. Evaluation of short-term mortality attributable to particulate matter pollution in Spain. Environ. Pollut. 2017, 224, 541–551. [Google Scholar] [CrossRef] [PubMed]
- Jimenez, E.; Linares, C.; Martinez, D.; Diaz, J. Particulate air pollution and short-term mortality due to specific causes among the elderly in Madrid (Spain): Seasonal differences. Int. J. Environ. Health Res. 2011, 21, 372–390. [Google Scholar] [CrossRef] [PubMed]
- Williams, A.; Spengler, J.D.; Catano, P.; Allen, J.; Laurent, J.C.C. Building Vulnerability a Chamging Climate: Indoor Temperature Exposures and Health Outcomes in Older Adults Living in Pubic Housing during an Extreme Heat Event in Cambridge, MA. Int. J. Environ. Res. Public Health 2019, 16, 2373. [Google Scholar] [CrossRef] [Green Version]
- Linares, C.; Díaz, J. Efecto de las partículas de diámetro inferior a 2,5 micras (PM2,5) sobre los ingresos hospitalarios en niños menores de 10 años en Madrid. Gac. Sanit. 2009, 23, 192–197. [Google Scholar] [CrossRef]
- Arroyo, V.; Díaz, J.; Carmona, R.; Ortiz, C.; Linares, C. Impact of air pollution and temperature on adverse birth outcomes: Madrid, 2001–2009. Environ. Pollut. 2016, 218, 1154–1161. [Google Scholar] [CrossRef]
- Díaz, J.; Linares, C.; Tobías, A. Impact of extreme temperatures on daily mortality in Madrid (Spain) among the 45-64 age-group. Int. J. Biometeorol. 2006, 50, 342–348. [Google Scholar] [CrossRef]
- Laurent, J.C.C.; Williams, A.; Oulhlote, Y.; Zanobetti, A.; Allen, J.; Spengler, J.D. Reduced cognitive function during a heat weave among residents of non-air-conditioned buildings: An observational study of young adults in the summer of 2016. PLoS Med. 2018, 15, 1–20. [Google Scholar]
- UNICEF. Progress for Every Child in the SDG Era; UNICEF: New York, NY, USA, 2019. [Google Scholar]
- Singh, M.K.; Ooka, R.; Rijal, H.B.; Kumar, S.; Kumar, A.; Mahapatra, S. Progress in thermal comfort studies in classrooms over last 50 years and way forward. Energy Build. 2019, 188, 149–174. [Google Scholar] [CrossRef]
- Campano, M.Á.; Domínguez-Amarillo, S.; Fernández-Agüera, J.; Sendra, J.J. Thermal perception in mild climate: Adaptive thermal models for schools. Sustainability 2019, 11, 3948. [Google Scholar] [CrossRef] [Green Version]
- Fernández-Agüera, J.; Campano, M.Á.; Domínguez-Amarillo, S.; Acosta, I.; Sendra, J.J. CO2 Concentration and Occupants’ Symptoms in Naturally Ventilated Schools in Mediterranean Climate. Buildings 2019, 9, 197. [Google Scholar] [CrossRef] [Green Version]
- Schweiker, M.; André, M.; Al-Atrash, F.; Al-Khatri, H.; Alprianti, R.R.; Alsaad, H.; Amin, R.; Ampatzi, E.; Arsano, A.Y.; Azar, E.; et al. Evaluating assumptions of scales for subjective assessment of thermal environments—Do laypersons perceive them the way, we researchers believe? Energy Build. 2020, 211, 109761. [Google Scholar] [CrossRef]
- López-Chao, V.; Lorenzo, A.A.; Saorín, J.L.; de la Torre-Cantero, J.; Melián-Díaz, D. Classroom Indoor Environment Assessment through Architectural Analysis for the Design of Efficient Schools. Sustainability 2020, 12, 2020. [Google Scholar] [CrossRef] [Green Version]
- Ebersbach, M.; Brandenburger, I. Reading a short story changes children’s sustainable behavior in a resource dilemma. J. Exp. Child. Psychol. 2020, 191, 104743. [Google Scholar] [CrossRef]
- Konis, K.; Blessenohl, S.; Kedia, N.; Rahane, V. TrojanSense, a participatory sensing framework for occupant-aware management of thermal comfort in campus buildings. Build. Environ. 2020, 169, 106588. [Google Scholar] [CrossRef]
- Martinez-Molina, A.; Boarin, P.; Tort-Ausina, I.; Vivancos, J.L. Post-occupancy evaluation of a historic primary school in Spain: Comparing PMV, TSV and PD for teachers’ and pupils’ thermal comfort. Build. Environ. 2017, 117, 248–259. [Google Scholar] [CrossRef]
- Merabtine, A.; Maalouf, C.; Hawila, A.A.; Martaj, N.; Polidori, G. Building energy audit, thermal comfort, and IAQ assessment of a school building: A case study. Build. Environ. 2018, 145, 62–76. [Google Scholar] [CrossRef]
- Rodriguez, C.M.; Coronado, M.C.; Medina, J.M. Classroom-comfort-data: A method to collect comprehensive information on thermal comfort in school classrooms. MethodsX 2019, 6, 2698–2719. [Google Scholar] [CrossRef] [PubMed]
- Nakanishi, H. Children’s travel behavior and implication to transport energy consumption of household: A case study of three Australian cities. In Transport and Energy Research; Elsevier: Amsterdam, The Netherlands, 2020; pp. 129–154. [Google Scholar]
- Wang, Z.; Wang, J.; He, Y.; Liu, Y.; Lin, B.; Hong, T. Dimension analysis of subjective thermal comfort metrics based on ASHRAE Global Thermal Comfort Database using machine learning. J. Build. Eng. 2019, 29, 101120. [Google Scholar] [CrossRef] [Green Version]
- Moyano, D.B.; Fernández, M.S.J.; Lezcano, R.A.G. Towards a Sustainable Indoor Lighting Design: Effects of Artificial Light on the Emotional State of Adolescents in the Classroom. Sustainability 2020, 12, 4263. [Google Scholar] [CrossRef]
- Villaplana, A.; Yamanaka, T. Effect of smell in Space Perception. Int. J. Affect. Eng. 2015, 14, 175–182. [Google Scholar] [CrossRef] [Green Version]
- Cuerdo Vilches, M.T. User Participation in Energy Management of Buildings: Application of Photovoice Method in Workplaces (Spanish); University of Seville: Seville, Spain, 2017. [Google Scholar]
- Papazoglou, E.; Moustris, K.P.; Nikas, K.S.P.; Nastos, P.T.; Statharas, J.C. Assessment of human thermal comfort perception in a non-air-conditioned school building in Athens, Greece. Energy Procedia 2019, 157, 1343–1352. [Google Scholar] [CrossRef]
- Shahzad, S.; Calautit, J.K.; Hughes, B.R.; Satish, B.K.; Rijal, H.B. Visual thermal landscaping (VTL) model: A qualitative thermal comfort approach based on the context to balance energy and comfort. Energy Procedia 2019, 158, 3119–3124. [Google Scholar] [CrossRef]
- ASHRAE 55. Thermal Environmental Conditions for Human Occupancy; ANSI/ASHRAE Standard 55-2017; American National Standards Institute: Washington, DC, USA, 2017. [Google Scholar]
- ISO 7730:2005. Ergonomics of the Thermal Environment—Analytical Determination and Interpretation of Thermal Comfort Using Calculation of the PMV and PPD Indices and Local Thermal Comfort Criteria; ISO: Geneva, Switzerland, 2005. [Google Scholar]
- Yang, B.; Li, X.; Hou, Y.; Meier, A.; Cheng, X.; Choi, J.-H.; Wang, F.; Wagner, A.; Yan, D.; Li, A.; et al. Non-invasive (noncontact) measurements of human thermalphysiology signals and thermal comfort/discomfort poses—A review. Energy Build. 2020, 224, 110261. [Google Scholar] [CrossRef]
- Díaz, E.; Siegel, J. Indoor envorinmental quality in social housing: A literature review. Energy Procedia 2018, 131, 231–241. [Google Scholar]
- Singh, M.; Ooka, R.; Rijal, H. Thermal comfort in Classrooms: A critical review. In Proceedings of the 10th Windsor Conference, Windsor, UK, 12–15 April 2018; pp. 649–668. [Google Scholar]
- Campano-Laborda, M.Á.; Domínguez-Amarillo, S.; Fernández-Agüera, J.; Acosta, I. Indoor Comfort and Symptomatology in Non-University Educational Buildings: Occupants’ Perception. Atmosphere 2020, 11, 357. [Google Scholar] [CrossRef] [Green Version]
- Krüger, E.; Zannin, P. Acoustic, thermal and luminous comfort in classrooms. Build. Environ. 2004, 39, 1055–1063. [Google Scholar] [CrossRef]
- Fusco, C.; Moola, F.; Faulkner, G.; Buliung, R.; Richichi, V. Toward an understanding of children’s perceptions of their transport geographies: (Non)active school travel and visual representations of the built environment. J. Transp. Geogr. 2012, 20, 62–70. [Google Scholar] [CrossRef]
- De Guili, V.; da Pos, O.; de Carli, M. Indor environmental quality and pupil perception in italian primary schools. Build. Eviron. 2012, 49, 129–140. [Google Scholar]
- Jindal, A. Investigation and analysis of thermal comfort in naturally ventiladed secondary schools classrooms in the composite climate of India. Archit. Sci. Rev. 2019, 62, 466–484. [Google Scholar] [CrossRef]
- Tucker, R.; Izadpanahi, P. Live green, think green: Sustainable school architecture and children’s environmental attitudes and behaviors. J. Environ. Psychol. 2017, 51, 209–216. [Google Scholar] [CrossRef]
- Zhang, D.; Bluyssen, P. Actions of primary school teachers to improve the indoor environmental quality of classrooms in the Netherlands. Intell. Build. Int. 2019, 1–14. [Google Scholar] [CrossRef] [Green Version]
- Zhang, D.; Ortiz, M.; Bluyssen, P. Clustering of Dutch school children based on their preferences and needs of the IEQ in classrooms. Build. Environ. 2019, 147, 258–266. [Google Scholar] [CrossRef]
- Bluyssen, P.M.; Kim, D.H.; Eijkelenboom, A.; Ortiz-Sanchez, M. Workshop with 335 primary school children in The Netherlands: What is needed to improve the IEQ in their classrooms? Build. Environ. 2020, 168, 106486. [Google Scholar] [CrossRef]
- Bluyssen, P.M.; Zhang, D.; Kurvers, S.; Overtoom, M.; Ortiz-Sanchez, M. Self-reported health and comfort of school children in 54 classrooms of 21 Dutch school buildings. Build. Environ. 2018, 138, 106–123. [Google Scholar] [CrossRef]
- Kottek, M.; Grieser, J.; Beck, C.; Rudolf, B.; Rubet, F. World map of the Köpen-Geiger climate classification updete. Meteorologische Zeischrift 2006, 15, 259–263. [Google Scholar] [CrossRef]
- Chollat, C.; Joly, A.; Houivet, E.; Bénichou, J.; Marret, S. School-age human figure drawings by very preterm infants: Validity of the Draw-a-Man test to detect behavioral and cognitive disorders. Arch. Pediatr. 2019, 26, 220–225. [Google Scholar] [CrossRef]
- Galli, M.; Cimolin, V.; Stella, G.; de Pandis, M.F.; Ancillao, A.; Condoluci, C. Quantitative assessment of drawing tests in children with dyslexia and dysgraphia. Hum. Mov. Sci. 2019, 65, 51–59. [Google Scholar] [CrossRef] [PubMed]
- Pace, C.S.; Guerriero, V.; Zavattini, G.C. Children’s attachment representations: A pilot study comparing family drawing with narrative and behavioral assessments in adopted and community children. Arts Psychother. 2020, 67, 101612. [Google Scholar] [CrossRef]
- Kim, J.K.; Suh, J.H. Children’s kinetic family drawings and their internalizing problem behaviors. Arts Psychother. 2013, 40, 206–215. [Google Scholar] [CrossRef]
- Zaidman-Zait, A.; Yechezkiely, M.; Regev, D. The quality of the relationship between typically developing children and their siblings with and without intellectual disability: Insights from children’s drawings. Res. Dev. Disabil. 2020, 96, 103537. [Google Scholar] [CrossRef]
- Altay, N.; Kilicarslan-Toruner, E.; Sari, Ç. The effect of drawing and writing technique on the anxiety level of children undergoing cancer treatment. Eur. J. Oncol. Nurs. 2017, 28, 1–6. [Google Scholar] [CrossRef]
- Lourenço, P.; Pinheiro, M.D.; Heitor, T. Light use patterns in Portuguese school buildings: User comfort perception, behaviour and impacts on energy consumption. J. Clean. Prod. 2019, 228, 990–1010. [Google Scholar] [CrossRef]
- Schweiker, M.; Abdul-Zahra, A.; André, M.; Farah, A.; Alkhatri, H.; Alprianti, R.R.; Alsaad, H.; Amin, R.; Ampatzi, E.; Arsano, A.Y.; et al. The Scales Project: A cross-national dataset on the interpretation of thermal perception scales. Sci. Data 2019, 6, 1–10. [Google Scholar] [CrossRef]
- Amasuomo, T.; Amasuomo, J. Perceived Thermal Discomfort and Stress Behaviors Affecting Students’ Learning in Lecture Theathers in Humid Tropics. Buildings 2016, 6, 18. [Google Scholar] [CrossRef] [Green Version]
- Katafygiotou, M.; Serghides, D. Thermal comfort of a typical secundary school buiding in Cyprus. Build. Eviron. 2014, 13, 303–312. [Google Scholar]
- Geng, Y.; Ji, W.; Lin, B.; Zhu, Y. The impact of thermal environment on occupant IEQ perception and productivity. Build. Eviron. 2017, 121, 158–167. [Google Scholar] [CrossRef]


| Letter | Question | Concept More Repeated | Number |
|---|---|---|---|
| S | What do you See here?  | Sun | 60 |
| Window | 56 | ||
| Wall | 38 | ||
| People | 29 | ||
| Light | 25 | ||
| Digital Blackboard | 16 | ||
| H | What is really Happening here?  | Classroom | 40 |
| Heat | 40 | ||
| Students | 35 | ||
| Air | 28 | ||
| Window | 26 | ||
| Enter | 24 | ||
| Humidity | 8 | ||
| Odour | 7 | ||
| Movement | 6 | ||
| O | How does it relate to Our lives?  | Temperature | 52 |
| Study | 30 | ||
| Mandatory | 25 | ||
| School | 25 | ||
| Summer | 18 | ||
| Spring | 17 | ||
| Parents | 12 | ||
| W | Why does this concern exist?  | No Cooling | 35 |
| Temperature | 30 | ||
| Sevilla | 20 | ||
| Spain | 10 | ||
| Summer | 10 | ||
| Climate change | 8 | ||
| Long | 7 | ||
| E | How can we become Empowered through our new understanding?  | Air conditioning | 28 |
| Trouble | 25 | ||
| Water | 20 | ||
| Clothes | 20 | ||
| White | 15 | ||
| Hairstyle | 14 | ||
| Shutters | 12 | ||
| Blind | 10 | ||
| No assist | 8 | ||
| Report authority | 3 | ||
| Monitoring | 2 | ||
| D | What can we Do?  | Air conditioning | 38 |
| Clothes | 25 | ||
| Fan | 25 | ||
| Drink | 17 | ||
| White | 16 | ||
| Ventilation | 16 | ||
| Short | 12 | ||
| Hand fan | 10 | ||
| Improve | 8 | ||
| Open Windows | 7 | ||
| Water | 8 | ||
| Hairstyle | 7 | ||
| Timetable | 5 | ||
| Trees | 5 | ||
| Paint | 5 |
© 2020 by the authors. Licensee MDPI, Basel, Switzerland. This article is an open access article distributed under the terms and conditions of the Creative Commons Attribution (CC BY) license (http://creativecommons.org/licenses/by/4.0/).
Share and Cite
Domínguez-Amarillo, S.; Fernández-Agüera, J.; González, M.M.; Cuerdo-Vilches, T. Overheating in Schools: Factors Determining Children’s Perceptions of Overall Comfort Indoors. Sustainability 2020, 12, 5772. https://doi.org/10.3390/su12145772
Domínguez-Amarillo S, Fernández-Agüera J, González MM, Cuerdo-Vilches T. Overheating in Schools: Factors Determining Children’s Perceptions of Overall Comfort Indoors. Sustainability. 2020; 12(14):5772. https://doi.org/10.3390/su12145772
Chicago/Turabian StyleDomínguez-Amarillo, Samuel, Jesica Fernández-Agüera, Maella Minaksi González, and Teresa Cuerdo-Vilches. 2020. "Overheating in Schools: Factors Determining Children’s Perceptions of Overall Comfort Indoors" Sustainability 12, no. 14: 5772. https://doi.org/10.3390/su12145772